
Chapter 2 Patterns of Tobacco Use Among Four Racial/Ethnic Minority Groups
Introduction 21
Long-Term Tobacco-Use Trends and Behavior Among Racial/Ethnic Minority Groups 22
African Americans 22 Prevalence of Cigarette Smoking 22 Number of Cigarettes Smoked Daily 23 Quitting Behavior 25 Women of Reproductive Age 26 Young People 28
American Indians and Alaska Natives 44 Prevalence of Cigarette Smoking 44 Number of Cigarettes Smoked Daily 45 Quitting Behavior 46 Women of Reproductive Age 48 Young People 49 Regional and Tribal Tobacco Use 50
Asian Americans and Pacific Islanders 56 Prevalence of Cigarette Smoking 56 Number of Cigarettes Smoked Daily 56 Quitting Behavior 57 Women of Reproductive Age 57 Young People 59 State and Local Smoking Estimates 60 Cigarette Smoking in Asian Countries 65
Hispanics 66 Prevalence of Cigarette Smoking 66 Number of Cigarettes Smoked Daily 69 Quitting Behavior 70 Women of Reproductive Age 71 Young People 72
Retrospective Analyses of Smoking Prevalence Among African Americans and Hispanics 74
Prevalence of Cigarette Smoking Among Successive Birth Cohorts 74 African Americans 74 Hispanics 75
Long-Term Trends in Cigarette-Smoking Initiation 78 African Americans 78 Hispanics 78
Cigarette Brand Preferences 79
20 Chapter 2
Surgeon General's Report
Effects of Education and Race/Ethnicity on Cigarette-Smoking Behavior 83
Current Smoking 85 Smoking Cessation 85 Heavy Smoking 85 Ever Smoking 85 Occasional Smoking 86
Exposure to Environmental Tobacco Smoke 86
Comparisons Between Racial/Ethnic Minority Groups in Current Tobacco Use 87
Cigarette Smoking 87 Pipe and Cigar Use 91 Use of Smokeless Tobacco 94
Conclusions 94
Appendix 1. Sources of Data 95
National Health Interview Survey (NHIS) 95 Hispanic Health and Nutrition Examination Survey (HHANES) 95 Behavioral Risk Factor Surveillance System (BRFSS) 95 Adult Use of Tobacco Survey (AUTS) 96 Monitoring the Future (MTF) Surveys 96 Youth Risk Behavior Survey (YRBS) 96 Teenage Attitudes and Practices Survey (TAPS) 96
Appendix 2. Measures of Tobacco Use 97
Cigarette Smoking and Cessation 97 Number of Cigarettes Smoked Daily 97 Use of Cigars, Pipes, and Smokeless Tobacco 97
Appendix 3. Patterns of Cigarette Use Among Whites 98
Appendix 4. Patterns of Cigarette Use Among African Americans 112
Appendix 5. Validation of the Retrospective Assessment of Smoking Prevalence 122
References 125

Tobacco Use Among U.S. Racial/Ethnic Minority Groups
Introduction
Over the past 15 years, the prevalence of cigarette smoking has generally declined among adult African Americans, Asian Americans and Pacific Islanders, and Hispanics. Nevertheless, rates of cigarette smoking and other tobacco use are still high among certain racial/ethnic minority groups compared with among the overall population, particularly American Indians and Alaska Natives. Designing more successful public health efforts to reduce tobacco-related diseases and deaths in racial/ethnic populations requires greater understanding of these racial/ ethnic patterns of tobacco use. This chapter summarizes how smoking behaviors such as current tobacco use, cigarette consumption, and quitting behavior among adults vary within and among racial/ethnic groups. In addition, for all racial/ethnic groups, the prevalence of cigarette smoking is examined for two groups of special interest, women of reproductive age and adolescents.
The purpose of this chapter is to summarize in one source the reported trends and patterns of tobacco use among members of the four racial/ethnic minority groups, by gender, age, and level of education. In addition, newly compiled information is presented on smoking patterns by birth cohort (based on year of birth) for African Americans and Hispanics. The relationship between racial/ethnic group and education as predictors of cigarette smoking is explored, and data on cigarette brand preference and exposure to environmental tobacco smoke are presented. The influence of acculturation on smoking behavior is examined among the two fastest growing immigrant groups to the United States—Asian Americans and Pacific Islanders and Hispanics. Although reports of the effects of acculturation vary widely in the literature, it is an important correlate of behavior despite limitations in conceptualization, operationalization, and measurement.
The analyses presented in this chapter incorporate data from national and state-specific population-based surveys of adults, national population-based
surveys of adolescents, and local and international surveys of various adult and adolescent populations. The national studies cited in this chapter include the National Health Interview Survey (NHIS) (1978–1995), which garners yearly data on cigarette smoking; the Behavioral Risk Factor Surveillance System (BRFSS) (1987–1992), which collects information on behavioral risks among adults in the United States; the Adult Use of Tobacco Survey, which has been conducted periodically since 1964; the Hispanic Health and Nutrition Examination Survey (HHANES), which gathered demographic and cigarette-smoking information from Hispanics between 1982 and 1984; the Monitoring the Future (MTF) surveys, which have been conducted in high schools annually since 1975; and the Teenage Attitudes and Practices Survey (TAPS), conducted in 1989 and 1993. Appendix 1 describes these major data sources, and Appendix 2 details the various measures of tobacco use. Appendix 3 presents data on patterns of cigarette use among whites that can be compared with the racial/ethnic group data presented in the chapter. Appendix 4 presents supplementary data on patterns of tobacco use among African Americans, and Appendix 5 describes how the authors validated one of the analytic techniques used to retrospectively estimate smoking prevalence.
The analyses in this chapter update and expand on previous Surgeon General’s reports that describe tobacco use among racial/ethnic groups; most of these previous reports have focused on cigarette smoking only among African Americans (U.S. Department of Health, Education, and Welfare [USDHEW] 1979; U.S. Department of Health and Human Services [USDHHS] 1983, 1988, 1989, 1990a). For some analyses reported here, small sample sizes limit the precision of the estimates. The patterns described in the text generally use point estimates, but confidence intervals presented in most tables can be referred to when the precision of the estimates needs to be defined.
Patterns of Tobacco Use 21
Surgeon General's Report
Long-Term Tobacco-Use Trends and Behavior Among Racial/Ethnic Minority Groups
African Americans Prevalence of Cigarette Smoking
African American women fell from 31.4 to 22.7 percent. Although the prevalence of smoking among African American men remained consistently higher
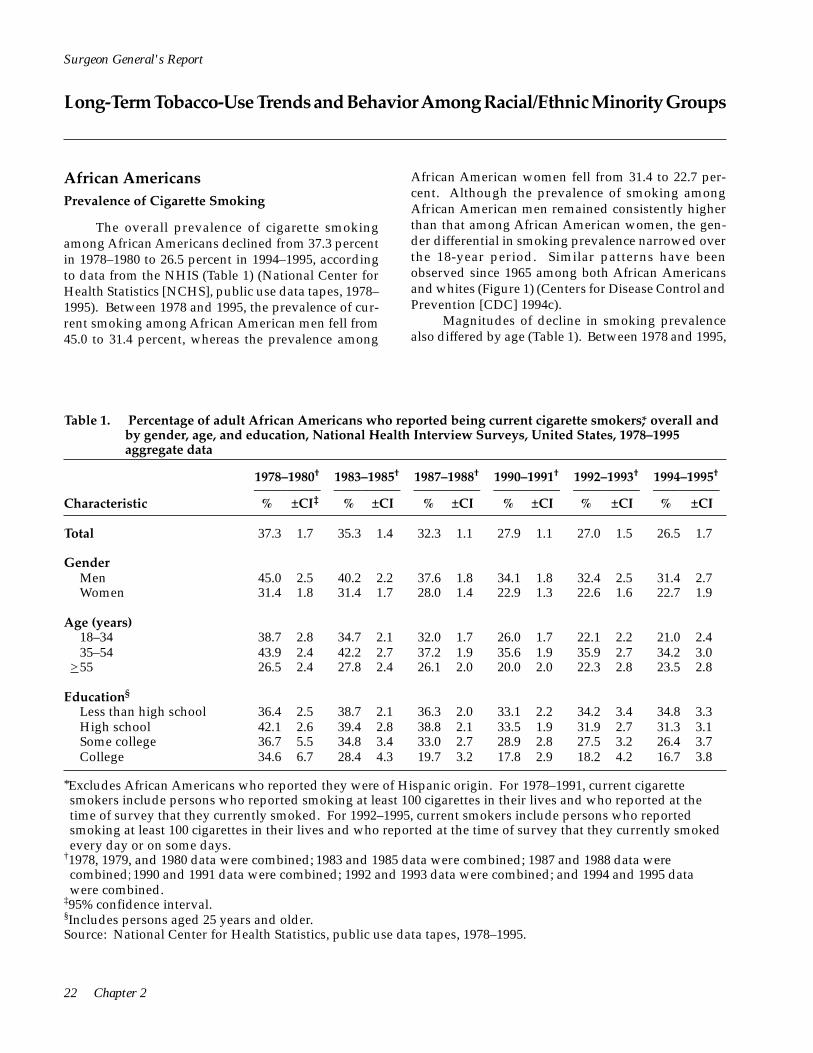
The overall prevalence of cigarette smoking than that among African American women, the genamong African Americans declined from 37.3 percent der differential in smoking prevalence narrowed over in 1978–1980 to 26.5 percent in 1994–1995, according the 18-year period. Similar patterns have been to data from the NHIS (Table 1) (National Center for observed since 1965 among both African Americans Health Statistics [NCHS], public use data tapes, 1978– and whites (Figure 1) (Centers for Disease Control and 1995). Between 1978 and 1995, the prevalence of cur Prevention [CDC] 1994c). rent smoking among African American men fell from 45.0 to 31.4 percent, whereas the prevalence among
Magnitudes of decline in smoking prevalence also differed by age (Table 1). Between 1978 and 1995,
Table 1. Percentage of adult African Americans who reported being current cigarette smokers,* overall and by gender, age, and education, National Health Interview Surveys, United States, 1978–1995 aggregate data
1978–1980† 1983–1985† 1987–1988† 1990–1991† 1992–1993† 1994–1995†
–––––––––– –––––––––– –––––––––– –––––––––– –––––––––– –––––––––– Characteristic % ±CI‡ % ±CI % ±CI % ±CI % ±CI % ±CI
Total 37.3 1.7 35.3 1.4 32.3 1.1 27.9 1.1 27.0 1.5 26.5 1.7
Gender Men 45.0 2.5 40.2 2.2 37.6 1.8 34.1 1.8 32.4 2.5 31.4 2.7 Women 31.4 1.8 31.4 1.7 28.0 1.4 22.9 1.3 22.6 1.6 22.7 1.9
Age (years) 18–34 38.7 2.8 34.7 2.1 32.0 1.7 26.0 1.7 22.1 2.2 21.0 2.4 35–54 43.9 2.4 42.2 2.7 37.2 1.9 35.6 1.9 35.9 2.7 34.2 3.0
>55 26.5 2.4 27.8 2.4 26.1 2.0 20.0 2.0 22.3 2.8 23.5 2.8
Education§
Less than high school 36.4 2.5 38.7 2.1 36.3 2.0 33.1 2.2 34.2 3.4 34.8 3.3 High school 42.1 2.6 39.4 2.8 38.8 2.1 33.5 1.9 31.9 2.7 31.3 3.1 Some college 36.7 5.5 34.8 3.4 33.0 2.7 28.9 2.8 27.5 3.2 26.4 3.7 College 34.6 6.7 28.4 4.3 19.7 3.2 17.8 2.9 18.2 4.2 16.7 3.8
*Excludes African Americans who reported they were of Hispanic origin. For 1978–1991, current cigarette smokers include persons who reported smoking at least 100 cigarettes in their lives and who reported at the time of survey that they currently smoked. For 1992–1995, current smokers include persons who reported smoking at least 100 cigarettes in their lives and who reported at the time of survey that they currently smoked every day or on some days.
†1978, 1979, and 1980 data were combined; 1983 and 1985 data were combined; 1987 and 1988 data were combined; 1990 and 1991 data were combined; 1992 and 1993 data were combined; and 1994 and 1995 data were combined.
‡95% confidence interval. §Includes persons aged 25 years and older. Source: National Center for Health Statistics, public use data tapes, 1978–1995.
22 Chapter 2

AfricanAmerican men
AfricanAmerican women
Whitemen
Whitewomen
men
women
70
60
50
40
30
20
10
0 1965 1970 1975 1980 1985 1990 1995
Year
African American men
African American women
White men
White women
Perc
enta
ge
Tobacco Use Among U.S. Racial/Ethnic Minority Groups
African Americans 18–34 years of age experienced the largest decline in smoking prevalence, from 38.7 to 21.0 percent, whereas African Americans aged 55 years and older experienced the smallest decline, from 26.5 to 23.5 percent. In the years 1978–1980, persons 18–34 years of age were nearly 1.5 times more likely to smoke than those 55 years of age or older. By 1994 and 1995, however, because of the differential decline in smoking prevalence, the prevalence of smoking among younger adults was as low as that among their older counterparts.
The prevalence of cigarette smoking among African Americans decreased most among college graduates (Table 1)—a pattern that has been found in the nation as a whole (Pierce et al. 1989). Among African American college graduates, the smoking prevalence fell from 34.6 percent in 1978–1980 to 16.7 percent in 1994–1995. In comparison, smoking prevalence among African Americans with less than 12 years of education was 36.4 percent in 1978–1980 and 34.8 percent in 1994–1995. In the years 1978–1980, the prevalence of
smoking varied little by level of education. However, by 1994 and 1995, an inverse relationship had emerged. As the level of education increased, the prevalence of cigarette smoking decreased.
Number of Cigarettes Smoked Daily
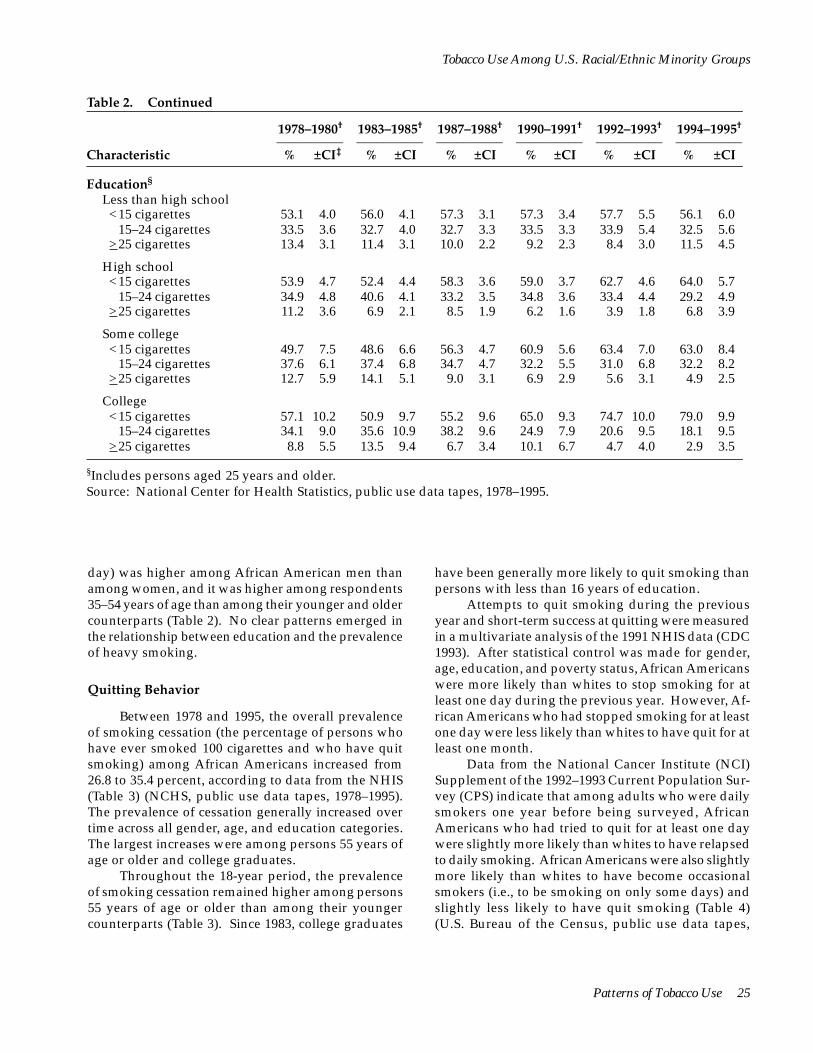
The percentage of African American smokers who reported that they were light smokers (smoking fewer than 15 cigarettes per day) increased from 56.0 percent in 1978–1980 to 63.9 percent in 1994–1995, according to the NHIS data (Table 2) (NCHS, public use data tapes, 1978–1993). This upward trend was found across all sociodemographic groups, with men, persons less than 55 years of age, and college graduates experiencing the largest increases in light smoking.
Throughout the 18-year period, African American women who smoked were consistently more likely than their male counterparts to smoke fewer than 15 cigarettes per day (Table 2). African American smokers 18–34 years of age were slightly more likely than
Figure 1. Trends in the prevalence of cigarette smoking among African American and white men and women, National Health Interview Surveys, United States, 1965–1995
Source: National Center for Health Statistics, public use data tapes, 1965, 1966, 1970, 1974, 1976, 1977, 1978, 1979, 1980, 1983, 1985, 1987, 1988, 1990, 1991, 1992, 1993, 1994, and 1995.
Patterns of Tobacco Use 23

>25 cigarettes 10.4 1.7 9.4 1.6 8.4 1.2 7.5 1.2 5.6 1.3 7.6 2.1
>25 cigarettes 12.5 2.3 11.4 2.6 9.8 1.7 9.2 1.9 6.3 2.0 10.3 3.7
>25 cigarettes 8.1 2.3 7.3 1.5 6.8 1.3 5.4 1.3 4.7 1.5 4.6 1.7
>25 cigarettes 8.5 2.3 8.7 2.3 7.4 1.7 6.2 1.8 5.1 2.1 6.7 2.7
>25 cigarettes 13.2 2.7 11.3 2.5 10.2 1.7 8.5 1.9 6.3 2.1 8.9 3.6
>25 cigarettes 9.9 4.8 7.4 3.1 7.3 2.5 7.7 2.7 4.7 2.7 6.0 3.8
Surgeon General's Report
Table 2. Percentage of adult African American smokers* who reported smoking <15, 15–24, or >25 cigarettes per day, overall and by gender, age, and education, National Health Interview Surveys, United States, 1978–1995 aggregate data
1978–1980† 1983–1985† 1987–1988† 1990–1991† 1992–1993† 1994–1995†
–––––––––– –––––––––– –––––––––– –––––––––– –––––––––– –––––––––– Characteristic % ±CI‡ % ±CI % ±CI % ±CI % ±CI % ±CI
Total <15 cigarettes 56.0 2.2 55.4 2.5 58.8 2.0 60.6 2.2 63.3 3.0 63.9 3.5
15–24 cigarettes 33.6 2.2 35.2 2.4 32.8 1.9 31.9 2.1 31.1 2.8 28.4 3.2
Gender Men <15 cigarettes 50.4 3.2 52.3 3.8 53.2 3.1 55.2 3.1 59.3 4.5 61.1 5.1
15–24 cigarettes 37.1 3.6 36.3 3.4 37.0 3.1 35.6 3.1 34.4 4.2 28.6 4.7
Women <15 cigarettes 62.2 3.2 58.6 3.1 65.0 2.7 67.1 2.6 67.9 3.8 67.1 4.2
15–24 cigarettes 29.8 2.8 34.1 2.8 28.2 2.4 27.5 2.5 27.4 3.6 28.3 4.0
Age (years) 18–34 <15 cigarettes 59.8 3.6 56.9 3.7 64.1 2.9 67.2 3.4 69.5 5.1 70.0 5.5
15–24 cigarettes 31.7 3.3 34.4 3.3 28.5 2.7 26.6 3.2 25.5 4.8 23.3 5.3
35–54 <15 cigarettes 51.2 3.4 51.0 4.1 52.1 3.1 54.6 3.4 60.4 4.3 58.9 5.2
15–24 cigarettes 35.6 3.7 37.7 3.9 37.7 3.1 36.9 3.2 33.2 4.1 32.2 4.8
> 55 <15 cigarettes 55.3 5.4 60.4 5.6 59.1 5.2 60.4 4.8 59.0 6.5 66.7 6.6
15–24 cigarettes 34.8 5.6 32.3 5.9 33.6 5.0 31.9 4.7 36.3 6.4 27.3 6.0
*Excludes African Americans who reported they were of Hispanic origin. For 1978–1991, current cigarette smokers include persons who reported smoking at least 100 cigarettes in their lives and who reported at the time of survey that they currently smoked. For 1992–1995, current smokers include persons who reported smoking at least 100 cigarettes in their lives and who reported at the time of survey that they currently smoked every day or on some days.
†1978, 1979, and 1980 data were combined; 1983 and 1985 data were combined; 1987 and 1988 data were combined; 1990 and 1991 data were combined; 1992 and 1993 data were combined; and 1994 and 1995 data were combined.
‡95% confidence interval.
their older counterparts to be light smokers (except smokers who smoked fewer than 15 cigarettes per day. for the years 1983–1985). An association between edu- As the level of education increased, the proportion cation and light smoking became apparent smoking lightly also increased. in 1990–1991. In 1990 and beyond, among smokers, Throughout the 18-year period, the prevalence education was directly related to the proportion of of heavy smoking (smoking 25 or more cigarettes per
24 Chapter 2
Tobacco Use Among U.S. Racial/Ethnic Minority Groups
Table 2. Continued
1978–1980† 1983–1985† 1987–1988† 1990–1991† 1992–1993† 1994–1995†
–––––––––– –––––––––– –––––––––– –––––––––– –––––––––– –––––––––– Characteristic % ±CI‡ % ±CI % ±CI % ±CI % ±CI % ±CI
Education§
Less than high school <15 cigarettes 53.1 4.0 56.0 4.1 57.3 3.1 57.3 3.4 57.7 5.5 56.1 6.0
15–24 cigarettes 33.5 3.6 32.7 4.0 32.7 3.3 33.5 3.3 33.9 5.4 32.5 5.6 >25 cigarettes 13.4 3.1 11.4 3.1 10.0 2.2 9.2 2.3 8.4 3.0 11.5 4.5
High school <15 cigarettes 53.9 4.7 52.4 4.4 58.3 3.6 59.0 3.7 62.7 4.6 64.0 5.7
15–24 cigarettes 34.9 4.8 40.6 4.1 33.2 3.5 34.8 3.6 33.4 4.4 29.2 4.9 >25 cigarettes 11.2 3.6 6.9 2.1 8.5 1.9 6.2 1.6 3.9 1.8 6.8 3.9
Some college <15 cigarettes 49.7 7.5 48.6 6.6 56.3 4.7 60.9 5.6 63.4 7.0 63.0 8.4
15–24 cigarettes 37.6 6.1 37.4 6.8 34.7 4.7 32.2 5.5 31.0 6.8 32.2 8.2 >25 cigarettes 12.7 5.9 14.1 5.1 9.0 3.1 6.9 2.9 5.6 3.1 4.9 2.5
College <15 cigarettes 57.1 10.2 50.9 9.7 55.2 9.6 65.0 9.3 74.7 10.0 79.0 9.9
15–24 cigarettes 34.1 9.0 35.6 10.9 38.2 9.6 24.9 7.9 20.6 9.5 18.1 9.5 >25 cigarettes 8.8 5.5 13.5 9.4 6.7 3.4 10.1 6.7 4.7 4.0 2.9 3.5
§Includes persons aged 25 years and older. Source: National Center for Health Statistics, public use data tapes, 1978–1995.
day) was higher among African American men than among women, and it was higher among respondents 35–54 years of age than among their younger and older counterparts (Table 2). No clear patterns emerged in the relationship between education and the prevalence of heavy smoking.
Quitting Behavior
Between 1978 and 1995, the overall prevalence of smoking cessation (the percentage of persons who have ever smoked 100 cigarettes and who have quit smoking) among African Americans increased from 26.8 to 35.4 percent, according to data from the NHIS (Table 3) (NCHS, public use data tapes, 1978–1995). The prevalence of cessation generally increased over time across all gender, age, and education categories. The largest increases were among persons 55 years of age or older and college graduates.
have been generally more likely to quit smoking than persons with less than 16 years of education.
Throughout the 18-year period, the prevalence of smoking cessation remained higher among persons 55 years of age or older than among their younger counterparts (Table 3). Since 1983, college graduates
Attempts to quit smoking during the previous year and short-term success at quitting were measured in a multivariate analysis of the 1991 NHIS data (CDC 1993). After statistical control was made for gender, age, education, and poverty status, African Americans were more likely than whites to stop smoking for at least one day during the previous year. However, African Americans who had stopped smoking for at least one day were less likely than whites to have quit for at least one month.
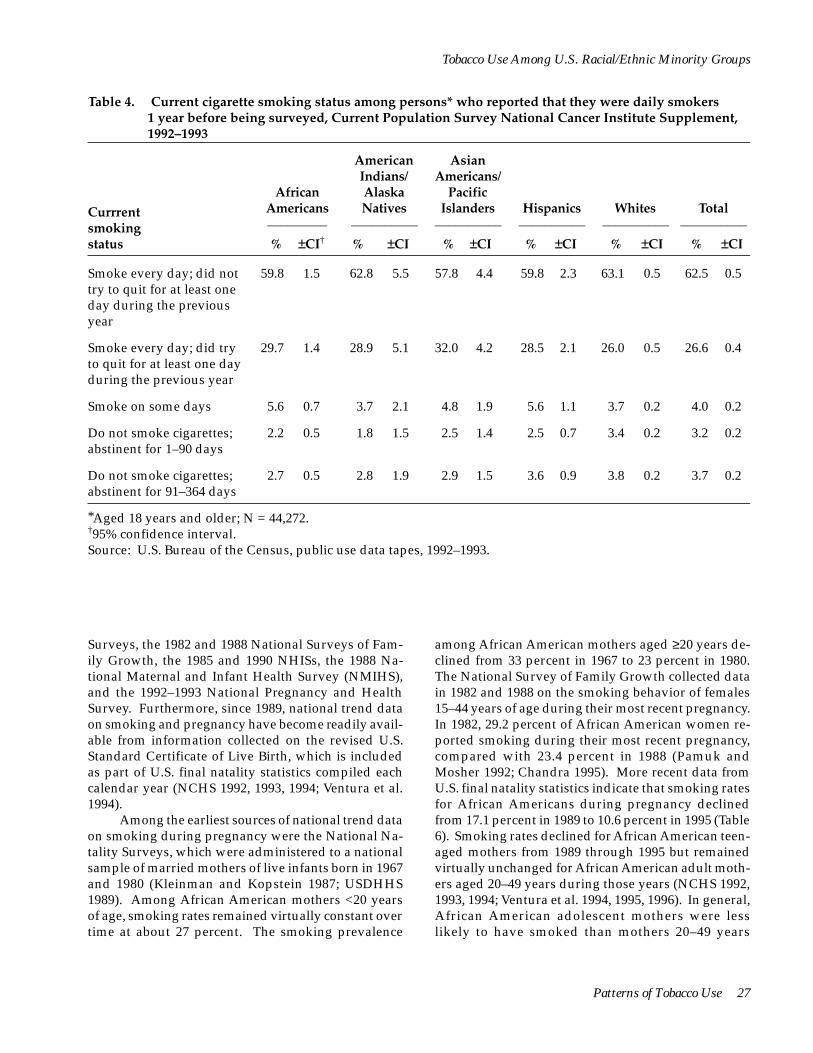
Data from the National Cancer Institute (NCI) Supplement of the 1992–1993 Current Population Survey (CPS) indicate that among adults who were daily smokers one year before being surveyed, African Americans who had tried to quit for at least one day were slightly more likely than whites to have relapsed to daily smoking. African Americans were also slightly more likely than whites to have become occasional smokers (i.e., to be smoking on only some days) and slightly less likely to have quit smoking (Table 4) (U.S. Bureau of the Census, public use data tapes,
Patterns of Tobacco Use 25

Surgeon General's Report
Table 3. Percentage of adult African American ever smokers who have quit,* overall and by gender, age, and education, National Health Interview Surveys, United States, 1978–1995 aggregate data
1978–1980† 1983–1985† 1987–1988† 1990–1991† 1992–1993† 1994–1995†
–––––––––– –––––––––– –––––––––– –––––––––– –––––––––– –––––––––– Characteristic % ±CI‡ % ±CI % ±CI % ±CI % ±CI % ±CI
Total 26.8 1.7 30.0 1.8 31.8 1.6 36.1 1.8 37.0 2.4 35.4 2.6
Gender Men 28.7 2.0 33.5 2.6 33.9 2.3 36.8 2.5 39.1 3.5 34.9 3.7 Women 24.5 2.5 26.2 2.5 29.4 2.1 35.2 2.4 34.5 3.1 35.9 3.4
Age (years) 18–34 17.9 2.8 20.2 2.8 18.8 2.3 21.0 2.6 23.7 4.6 19.6 4.1 35–54 27.7 2.6 29.5 2.9 33.1 2.6 35.2 2.6 33.2 3.4 33.1 4.0
>55 42.3 4.0 47.0 3.6 49.2 3.0 57.3 3.6 56.8 4.4 54.7 4.4
Education§
Less than high school 32.6 2.7 32.7 2.5 35.0 2.5 38.0 3.3 40.0 4.2 36.8 4.0 High school 24.4 3.4 28.8 3.6 27.3 2.7 32.4 2.6 33.4 3.8 31.6 4.3 Some college 32.4 5.9 35.0 4.7 36.6 4.0 38.1 4.4 39.0 5.3 37.3 6.3 College 29.8 8.6 37.0 6.9 50.2 6.1 51.3 6.1 48.7 8.7 51.1 8.5
*Excludes African Americans who reported they were of Hispanic origin. The prevalence of cessation is the percentage of ever smokers who are former smokers. Former smokers are persons who reported smoking at least 100 cigarettes in their lives and who reported at the time of survey that they were not smoking, and ever smokers include current and former smokers.
†1978, 1979, and 1980 data were combined; 1983 and 1985 data were combined; 1987 and 1988 data were combined; 1990 and 1991 data were combined; 1992 and 1993 data were combined; and 1994 and 1995 data were combined.
‡95% confidence interval. §Includes persons aged 25 years and older. Source: National Center for Health Statistics, public use data tapes, 1978–1995.
1992–1993). Some data suggest that African Ameri-cans may be more likely than whites to be dependent on nicotine (see Chapter 3, Table 18, in the section Racial/Ethnic Differences in Self-Reported Nicotine Dependence; Royce et al. 1993), although a report by Andreski and Breslau (1993) suggests the opposite. African Americans appear to have comparatively lim-ited access to preventive health services, including smoking cessation services (USDHHS 1988; Hymowitz et al. 1991).
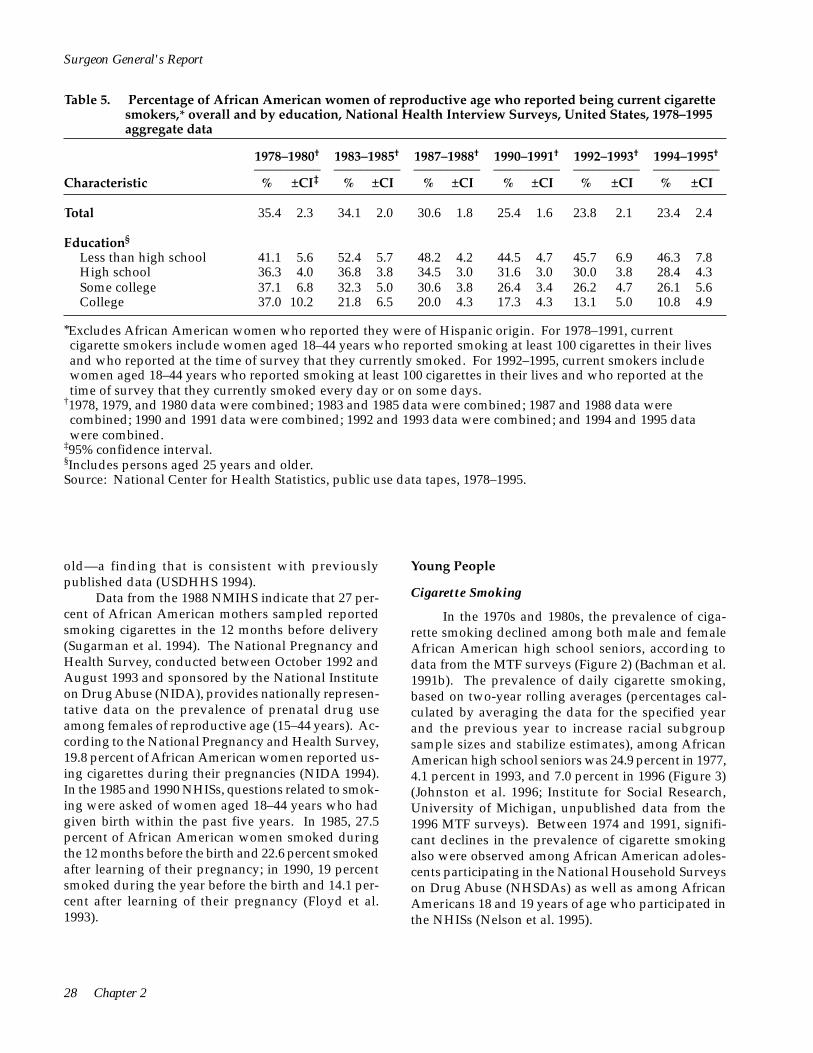
(NCHS, public use data tapes, 1978–1995). Women who were college graduates experienced an over-whelming decline in smoking prevalence, from 37.0 to 10.8 percent, whereas women with less than a high school education (<12 years) experienced a slight in-crease in the prevalence of current smoking, from 41.1 to 46.3 percent.
In the years 1978–1980, the prevalence of smoking varied little by level of education. However, by 1994 and 1995, a marked inverse relationship between smoking and educational level had emerged. As the level of education increased, the prevalence of smok-ing decreased. This inverse relationship has also been found in other studies of women of reproductive age (CDC 1991a, 1994b).
Women of Reproductive Age
Between 1978 and 1995, the prevalence of cur-rent smoking among African American women of re-productive age (18–44 years) declined from 35.4 to 23.4 percent, according to data from the NHIS (Table 5)
National data on tobacco use and pregnancy are available from the 1967 and 1980 National Natality
26 Chapter 2
Tobacco Use Among U.S. Racial/Ethnic Minority Groups
Table 4. Current cigarette smoking status among persons* who reported that they were daily smokers 1 year before being surveyed, Current Population Survey National Cancer Institute Supplement, 1992–1993
Currrent smoking status
African Americans ––––––––– % ±CI†
American Indians/ Alaska Natives
–––––––––– % ±CI
Asian Americans/
Pacific Islanders
–––––––––– % ±CI
Hispanics ––––––––––
% ±CI
Whites ––––––––––
% ±CI
Total ––––––––––
% ±CI
Smoke every day; did not try to quit for at least one day during the previous year
59.8 1.5 62.8 5.5 57.8 4.4 59.8 2.3 63.1 0.5 62.5 0.5
Smoke every day; did try to quit for at least one day during the previous year
29.7 1.4 28.9 5.1 32.0 4.2 28.5 2.1 26.0 0.5 26.6 0.4
Smoke on some days 5.6 0.7 3.7 2.1 4.8 1.9 5.6 1.1 3.7 0.2 4.0 0.2
Do not smoke cigarettes; abstinent for 1–90 days
2.2 0.5 1.8 1.5 2.5 1.4 2.5 0.7 3.4 0.2 3.2 0.2
Do not smoke cigarettes; abstinent for 91–364 days
2.7 0.5 2.8 1.9 2.9 1.5 3.6 0.9 3.8 0.2 3.7 0.2
*Aged 18 years and older; N = 44,272. †95% confidence interval. Source: U.S. Bureau of the Census, public use data tapes, 1992–1993.
–
Surveys, the 1982 and 1988 National Surveys of Family Growth, the 1985 and 1990 NHISs, the 1988 National Maternal and Infant Health Survey (NMIHS), and the 1992–1993 National Pregnancy and Health Survey. Furthermore, since 1989, national trend data on smoking and pregnancy have become readily available from information collected on the revised U.S. Standard Certificate of Live Birth, which is included as part of U.S. final natality statistics compiled each calendar year (NCHS 1992, 1993, 1994; Ventura et al. 1994).
among African American mothers aged ≥20 years declined from 33 percent in 1967 to 23 percent in 1980. The National Survey of Family Growth collected data in 1982 and 1988 on the smoking behavior of females 15–44 years of age during their most recent pregnancy. In 1982, 29.2 percent of African American women reported smoking during their most recent pregnancy, compared with 23.4 percent in 1988 (Pamuk and Mosher 1992; Chandra 1995). More recent data from U.S. final natality statistics indicate that smoking rates for African Americans during pregnancy declined
Among the earliest sources of national trend data from 17.1 percent in 1989 to 10.6 percent in 1995 (Table on smoking during pregnancy were the National Na 6). Smoking rates declined for African American teentality Surveys, which were administered to a national aged mothers from 1989 through 1995 but remained sample of married mothers of live infants born in 1967 virtually unchanged for African American adult mothand 1980 (Kleinman and Kopstein 1987; USDHHS ers aged 20–49 years during those years (NCHS 1992, 1989). Among African American mothers <20 years 1993, 1994; Ventura et al. 1994, 1995, 1996). In general, of age, smoking rates remained virtually constant over African American adolescent mothers were less time at about 27 percent. The smoking prevalence likely to have smoked than mothers 20–49 years
Patterns of Tobacco Use 27
Surgeon General's Report
Table 5. Percentage of African American women of reproductive age who reported being current cigarette smokers,* overall and by education, National Health Interview Surveys, United States, 1978–1995 aggregate data
1978–1980† 1983–1985† 1987–1988† 1990–1991† 1992–1993† 1994–1995†
–––––––––– –––––––––– –––––––––– –––––––––– –––––––––– –––––––––– Characteristic % ±CI‡ % ±CI % ±CI % ±CI % ±CI % ±CI
Total 35.4 2.3 34.1 2.0 30.6 1.8 25.4 1.6 23.8 2.1 23.4 2.4
Education§
Less than high school 41.1 5.6 52.4 5.7 48.2 4.2 44.5 4.7 45.7 6.9 46.3 7.8 High school 36.3 4.0 36.8 3.8 34.5 3.0 31.6 3.0 30.0 3.8 28.4 4.3 Some college 37.1 6.8 32.3 5.0 30.6 3.8 26.4 3.4 26.2 4.7 26.1 5.6 College 37.0 10.2 21.8 6.5 20.0 4.3 17.3 4.3 13.1 5.0 10.8 4.9
*Excludes African American women who reported they were of Hispanic origin. For 1978–1991, current cigarette smokers include women aged 18–44 years who reported smoking at least 100 cigarettes in their lives and who reported at the time of survey that they currently smoked. For 1992–1995, current smokers include women aged 18–44 years who reported smoking at least 100 cigarettes in their lives and who reported at the time of survey that they currently smoked every day or on some days.
†1978, 1979, and 1980 data were combined; 1983 and 1985 data were combined; 1987 and 1988 data were combined; 1990 and 1991 data were combined; 1992 and 1993 data were combined; and 1994 and 1995 data were combined.
‡95% confidence interval. §Includes persons aged 25 years and older. Source: National Center for Health Statistics, public use data tapes, 1978–1995.
old—a finding that is consistent with previously published data (USDHHS 1994).
Data from the 1988 NMIHS indicate that 27 percent of African American mothers sampled reported smoking cigarettes in the 12 months before delivery (Sugarman et al. 1994). The National Pregnancy and Health Survey, conducted between October 1992 and August 1993 and sponsored by the National Institute on Drug Abuse (NIDA), provides nationally representative data on the prevalence of prenatal drug use among females of reproductive age (15–44 years). According to the National Pregnancy and Health Survey, 19.8 percent of African American women reported using cigarettes during their pregnancies (NIDA 1994). In the 1985 and 1990 NHISs, questions related to smoking were asked of women aged 18–44 years who had given birth within the past five years. In 1985, 27.5 percent of African American women smoked during the 12 months before the birth and 22.6 percent smoked after learning of their pregnancy; in 1990, 19 percent smoked during the year before the birth and 14.1 percent after learning of their pregnancy (Floyd et al. 1993).
Young People
Cigarette Smoking
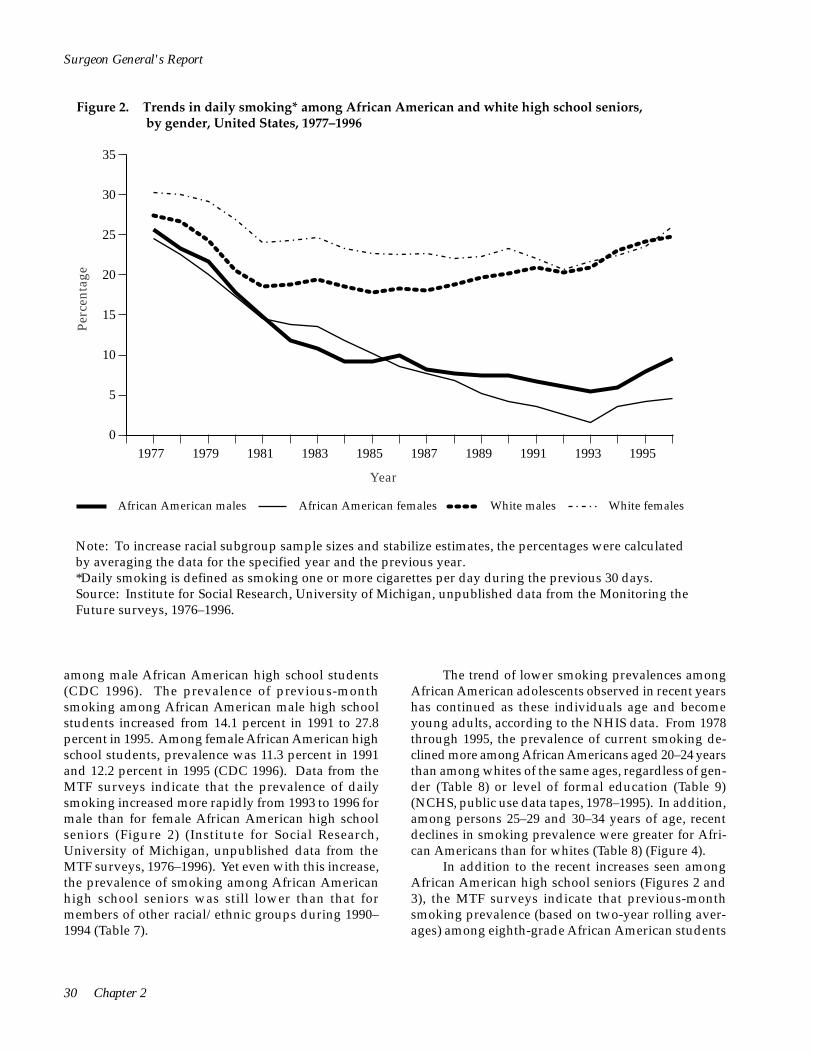
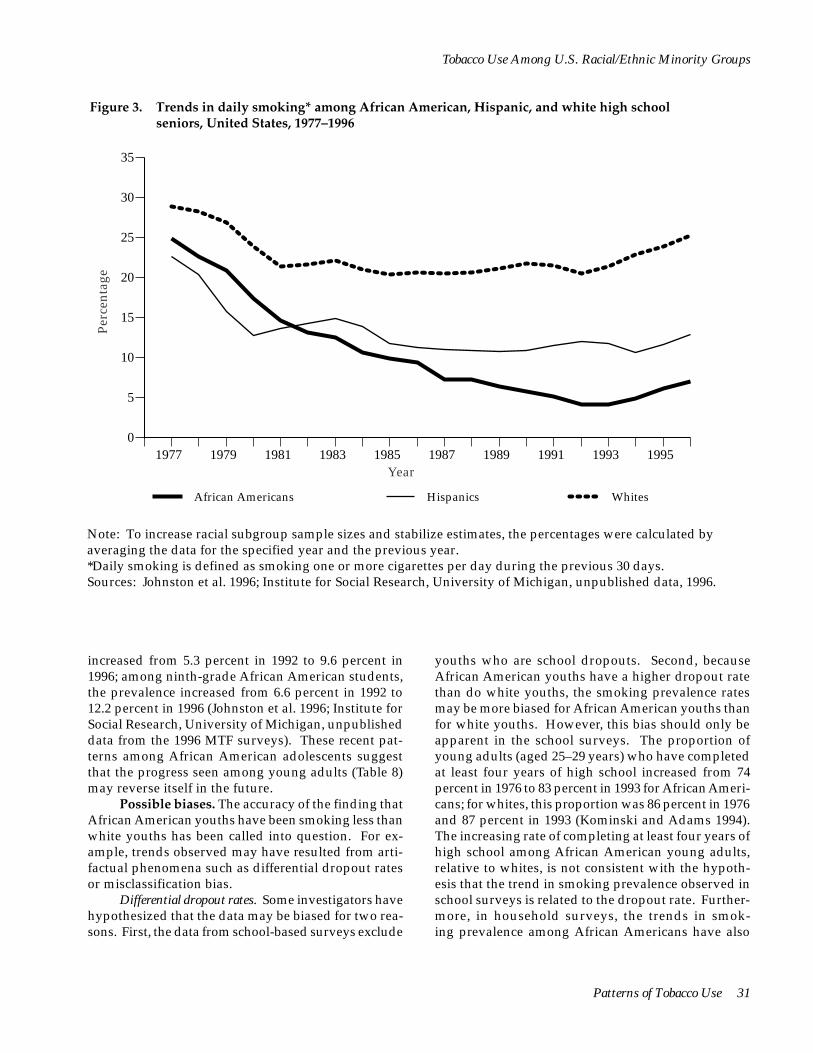
In the 1970s and 1980s, the prevalence of cigarette smoking declined among both male and female African American high school seniors, according to data from the MTF surveys (Figure 2) (Bachman et al. 1991b). The prevalence of daily cigarette smoking, based on two-year rolling averages (percentages calculated by averaging the data for the specified year and the previous year to increase racial subgroup sample sizes and stabilize estimates), among African American high school seniors was 24.9 percent in 1977, 4.1 percent in 1993, and 7.0 percent in 1996 (Figure 3) (Johnston et al. 1996; Institute for Social Research, University of Michigan, unpublished data from the 1996 MTF surveys). Between 1974 and 1991, significant declines in the prevalence of cigarette smoking also were observed among African American adolescents participating in the National Household Surveys on Drug Abuse (NHSDAs) as well as among African Americans 18 and 19 years of age who participated in the NHISs (Nelson et al. 1995).
28 Chapter 2

Tobacco Use Among U.S. Racial/Ethnic Minority Groups
Table 6. Percentage of live-born infants’ mothers who reported smoking during pregnancy, by year and race/ ethnicity, U.S. final natality statistics, 1989–1995
1989 1990 1991 1992 1993 1994 1995
Race of mother* African American 17.1 15.9 14.6 13.8 12.7 11.4 10.6 American Indian and Alaska Native 23.0 22.4 22.6 22.5 21.6 21.0 20.9 Asian American and Pacific Islander† 5.7 5.5 5.2 4.8 4.3 3.6 3.4
Chinese 2.7 2.0 1.9 1.7 1.1 0.9 0.8 Filipino 5.1 5.3 5.3 4.8 4.3 3.7 3.4 Hawaiian and part Hawaiian 19.3 21.0 19.4 18.5 17.2 16.0 15.9 Japanese 8.2 8.0 7.5 6.6 6.7 5.4 5.2 Other Asian American or 4.2 3.8 3.8 3.6 3.2 2.9 2.9 Pacific Islander
White 20.4 19.4 18.8 17.9 16.8 15.6 15.0
Hispanic origin of mother‡
Hispanic origin 8.0 6.7 6.3 5.8 5.0 4.6 4.3 Cuban 6.9 6.4 6.2 5.9 5.0 4.8 4.1 Central and South American 3.6 3.0 2.8 2.6 2.3 1.8 1.8 Mexican American 6.3 5.3 4.8 4.3 3.7 3.4 3.1 Other and unknown Hispanic 12.1 10.8 10.7 10.1 9.3 8.1 8.2 Puerto Rican 14.5 13.6 13.2 12.7 11.2 10.9 10.4
African American, non-Hispanic 17.2 15.9 14.6 13.8 12.7 11.5 10.6 White, non-Hispanic 21.7 21.0 20.5 19.7 18.6 17.7 17.1
Total 19.5 18.4 17.8 16.9 15.8 14.6 13.9
*Includes data for 43 states and the District of Columbia (DC) in 1989, 45 states and DC in 1990, and 46 states and DC in 1991–1995. Excludes data for California, Indiana, New York (but includes New York City), and South Dakota in 1994 and 1995; Oklahoma in 1989–1990; and Louisiana and Nebraska in 1989, which did not require the reporting of mother’s tobacco use during pregnancy on the birth certificate. White and African American racial groups include persons of Hispanic and non-Hispanic origin.
†Maternal tobacco use during pregnancy was not reported on the birth certificates in California and New York, which together accounted for 43–66 percent of the births in each Asian subgroup (except Hawaiian) during 1989–1991.
‡Includes data for 42 states and DC in 1989, 44 states and DC in 1990, 45 states and DC in 1991–1992, and 46 states and DC in 1993–1995. Excludes data for California, Indiana, New York (but includes New York City), and South Dakota in 1994 and 1995; Oklahoma in 1989–1990; and Louisiana and Nebraska in 1989, which did not require the reporting of either Hispanic origin of mother or tobacco use during pregnancy on the birth certificate. Persons of Hispanic origin may be of any race.
Sources: National Center for Health Statistics 1996; Ventura et al. 1996, 1997.
The prevalence of cigarette smoking among Af-rican American adolescents has been substantially lower than the prevalence among white and Hispanic adolescents (Figures 2 and 3) (Bachman et al. 1991b; USDHHS 1994; CDC 1996; Johnston et al. 1996). Lo-cal, more limited surveys have also shown similar differences in cigarette smoking prevalence between
African American and white youths (for example, Sheridan et al. 1993; Greenlund et al. 1996).
In addition to the slight increases in the 1990s in smoking prevalence among African American high school seniors (Figures 2 and 3), CDC’s Youth Risk Behavior Survey (YRBS) detected an increase in the prevalence of cigarette smoking from 1991 to 1995
Patterns of Tobacco Use 29
Perc
enta
ge
35
30
25
20
15
10
5
0 1977 1979 1981 1983 1985 1987 1989 1991 1993 1995
Year
African American males African American females White males White females
Surgeon General's Report
Figure 2. Trends in daily smoking* among African American and white high school seniors, by gender, United States, 1977–1996
Note: To increase racial subgroup sample sizes and stabilize estimates, the percentages were calculated by averaging the data for the specified year and the previous year. *Daily smoking is defined as smoking one or more cigarettes per day during the previous 30 days. Source: Institute for Social Research, University of Michigan, unpublished data from the Monitoring the Future surveys, 1976–1996.
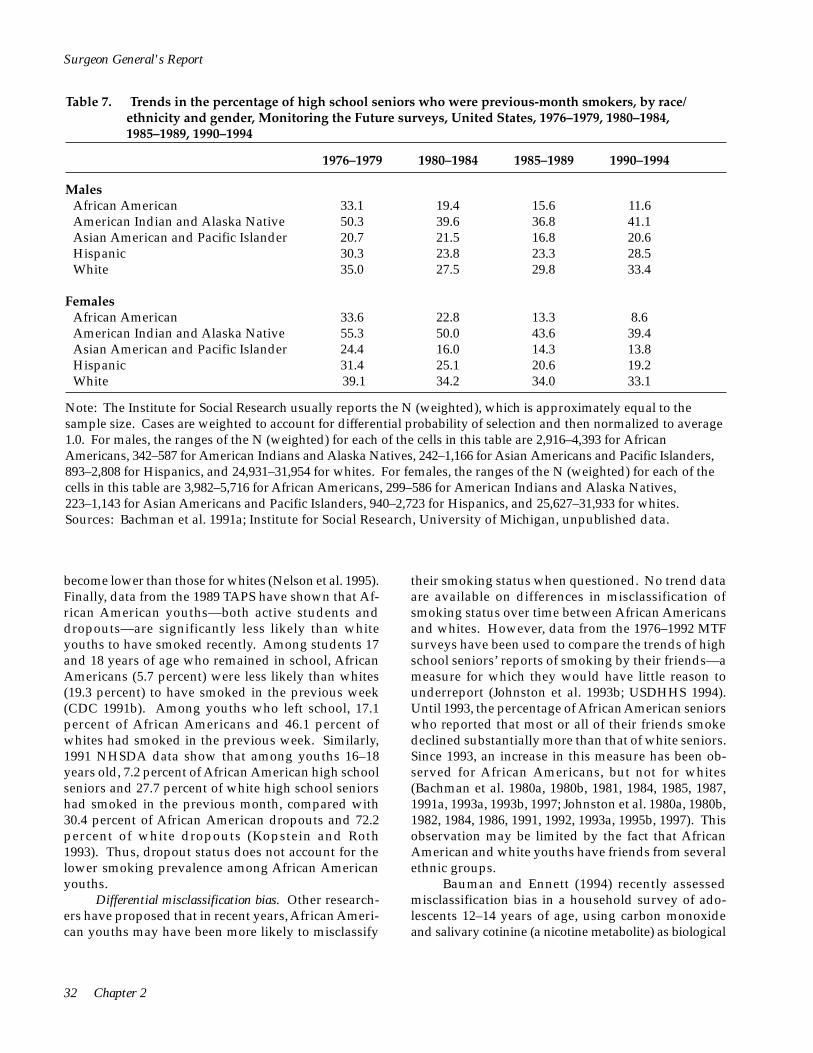
among male African American high school students (CDC 1996). The prevalence of previous-month smoking among African American male high school students increased from 14.1 percent in 1991 to 27.8 percent in 1995. Among female African American high school students, prevalence was 11.3 percent in 1991 and 12.2 percent in 1995 (CDC 1996). Data from the MTF surveys indicate that the prevalence of daily smoking increased more rapidly from 1993 to 1996 for male than for female African American high school seniors (Figure 2) (Institute for Social Research, University of Michigan, unpublished data from the MTF surveys, 1976–1996). Yet even with this increase, the prevalence of smoking among African American high school seniors was still lower than that for members of other racial/ethnic groups during 1990– 1994 (Table 7).
The trend of lower smoking prevalences among African American adolescents observed in recent years has continued as these individuals age and become young adults, according to the NHIS data. From 1978 through 1995, the prevalence of current smoking declined more among African Americans aged 20–24 years than among whites of the same ages, regardless of gender (Table 8) or level of formal education (Table 9) (NCHS, public use data tapes, 1978–1995). In addition, among persons 25–29 and 30–34 years of age, recent declines in smoking prevalence were greater for African Americans than for whites (Table 8) (Figure 4).
In addition to the recent increases seen among African American high school seniors (Figures 2 and 3), the MTF surveys indicate that previous-month smoking prevalence (based on two-year rolling averages) among eighth-grade African American students
30 Chapter 2
Perc
enta
ge
35
30
25
20
15
10
5
0 1977 1979 1981 1983 1985 1987 1989 1991 1993 1995
Year
African Americans Hispanics Whites
Tobacco Use Among U.S. Racial/Ethnic Minority Groups
Figure 3. Trends in daily smoking* among African American, Hispanic, and white high school seniors, United States, 1977–1996
Note: To increase racial subgroup sample sizes and stabilize estimates, the percentages were calculated by averaging the data for the specified year and the previous year. *Daily smoking is defined as smoking one or more cigarettes per day during the previous 30 days. Sources: Johnston et al. 1996; Institute for Social Research, University of Michigan, unpublished data, 1996.
increased from 5.3 percent in 1992 to 9.6 percent in 1996; among ninth-grade African American students, the prevalence increased from 6.6 percent in 1992 to 12.2 percent in 1996 (Johnston et al. 1996; Institute for Social Research, University of Michigan, unpublished data from the 1996 MTF surveys). These recent patterns among African American adolescents suggest that the progress seen among young adults (Table 8) may reverse itself in the future.
Possible biases. The accuracy of the finding that African American youths have been smoking less than white youths has been called into question. For example, trends observed may have resulted from artifactual phenomena such as differential dropout rates or misclassification bias.
Differential dropout rates. Some investigators have hypothesized that the data may be biased for two reasons. First, the data from school-based surveys exclude
youths who are school dropouts. Second, because African American youths have a higher dropout rate than do white youths, the smoking prevalence rates may be more biased for African American youths than for white youths. However, this bias should only be apparent in the school surveys. The proportion of young adults (aged 25–29 years) who have completed at least four years of high school increased from 74 percent in 1976 to 83 percent in 1993 for African Americans; for whites, this proportion was 86 percent in 1976 and 87 percent in 1993 (Kominski and Adams 1994). The increasing rate of completing at least four years of high school among African American young adults, relative to whites, is not consistent with the hypothesis that the trend in smoking prevalence observed in school surveys is related to the dropout rate. Furthermore, in household surveys, the trends in smoking prevalence among African Americans have also
Patterns of Tobacco Use 31
Surgeon General's Report
Table 7. Trends in the percentage of high school seniors who were previous-month smokers, by race/ ethnicity and gender, Monitoring the Future surveys, United States, 1976–1979, 1980–1984, 1985–1989, 1990–1994
1976–1979 1980–1984 1985–1989 1990–1994
Males African American 33.1 19.4 15.6 11.6 American Indian and Alaska Native 50.3 39.6 36.8 41.1 Asian American and Pacific Islander 20.7 21.5 16.8 20.6 Hispanic 30.3 23.8 23.3 28.5 White 35.0 27.5 29.8 33.4
Females African American 33.6 22.8 13.3 8.6 American Indian and Alaska Native 55.3 50.0 43.6 39.4 Asian American and Pacific Islander 24.4 16.0 14.3 13.8 Hispanic 31.4 25.1 20.6 19.2 White 39.1 34.2 34.0 33.1
Note: The Institute for Social Research usually reports the N (weighted), which is approximately equal to the sample size. Cases are weighted to account for differential probability of selection and then normalized to average 1.0. For males, the ranges of the N (weighted) for each of the cells in this table are 2,916–4,393 for African Americans, 342–587 for American Indians and Alaska Natives, 242–1,166 for Asian Americans and Pacific Islanders, 893–2,808 for Hispanics, and 24,931–31,954 for whites. For females, the ranges of the N (weighted) for each of the cells in this table are 3,982–5,716 for African Americans, 299–586 for American Indians and Alaska Natives, 223–1,143 for Asian Americans and Pacific Islanders, 940–2,723 for Hispanics, and 25,627–31,933 for whites. Sources: Bachman et al. 1991a; Institute for Social Research, University of Michigan, unpublished data.
become lower than those for whites (Nelson et al. 1995). Finally, data from the 1989 TAPS have shown that African American youths—both active students and dropouts—are significantly less likely than white youths to have smoked recently. Among students 17 and 18 years of age who remained in school, African Americans (5.7 percent) were less likely than whites (19.3 percent) to have smoked in the previous week (CDC 1991b). Among youths who left school, 17.1 percent of African Americans and 46.1 percent of whites had smoked in the previous week. Similarly, 1991 NHSDA data show that among youths 16–18 years old, 7.2 percent of African American high school seniors and 27.7 percent of white high school seniors had smoked in the previous month, compared with 30.4 percent of African American dropouts and 72.2 percent of white dropouts (Kopstein and Roth 1993). Thus, dropout status does not account for the lower smoking prevalence among African American youths.
Differential misclassification bias. Other researchers have proposed that in recent years, African American youths may have been more likely to misclassify
their smoking status when questioned. No trend data are available on differences in misclassification of smoking status over time between African Americans and whites. However, data from the 1976–1992 MTF surveys have been used to compare the trends of high school seniors’ reports of smoking by their friends—a measure for which they would have little reason to underreport (Johnston et al. 1993b; USDHHS 1994). Until 1993, the percentage of African American seniors who reported that most or all of their friends smoke declined substantially more than that of white seniors. Since 1993, an increase in this measure has been observed for African Americans, but not for whites (Bachman et al. 1980a, 1980b, 1981, 1984, 1985, 1987, 1991a, 1993a, 1993b, 1997; Johnston et al. 1980a, 1980b, 1982, 1984, 1986, 1991, 1992, 1993a, 1995b, 1997). This observation may be limited by the fact that African American and white youths have friends from several ethnic groups.
Bauman and Ennett (1994) recently assessed misclassification bias in a household survey of adolescents 12–14 years of age, using carbon monoxide and salivary cotinine (a nicotine metabolite) as biological
32 Chapter 2

Tobacco Use Among U.S. Racial/Ethnic Minority Groups
Table 8. Percentage of African Americans and whites 20–34 years of age who reported being current cigarette smokers,* by age group and gender, National Health Interview Surveys, United States, 1978–1995 aggregate data
Characteristic
1978–1980†
–––––––––– % ±CI‡
1983–1985†
–––––––––– % ±CI
1987–1988†
–––––––––– % ±CI
1990–1991†
–––––––––– % ±CI
1992–1993†
–––––––––– % ±CI
1994–1995†
–––––––––– % ±CI
Aged 20–24 years African Americans
Total 37.3 4.3 32.0 3.6 24.7 2.9 16.8 2.7 15.0 4.1 13.7 3.9 Men 44.8 6.8 31.6 6.2 25.4 5.0 21.3 4.8 20.3 7.6 19.6 7.3 Women 31.8 4.4 32.3 3.8 24.1 3.3 13.1 2.5 10.7 3.4 8.9 3.3
Whites Total 35.6 1.6 35.5 1.6 30.4 1.5 28.4 1.5 32.0 2.3 33.3 2.5 Men 37.2 2.2 34.1 2.3 30.5 2.3 28.0 2.3 32.2 3.1 34.9 3.6 Women 34.0 2.0 36.8 2.2 30.3 1.8 28.8 2.0 32.4 3.1 31.6 3.3
Aged 25–29 years African Americans
Total 41.5 3.9 39.0 3.9 38.3 3.4 30.5 3.3 21.7 3.6 21.0 4.3 Men 47.6 4.9 41.6 6.2 43.1 5.5 35.9 5.7 21.3 5.9 22.6 7.6 Women 36.5 5.8 36.8 4.6 34.3 3.7 26.1 3.6 22.1 4.5 19.6 5.3
Whites Total 38.4 1.4 36.2 1.5 34.7 1.3 30.8 1.3 31.2 1.9 32.2 2.1 Men 42.3 2.0 38.3 2.2 34.5 1.8 31.2 1.9 31.9 2.7 32.6 3.1 Women 34.7 2.0 34.1 1.9 35.0 1.7 30.5 1.7 30.6 2.5 31.9 2.8
Aged 30–34 years African Americans
Total 43.0 5.1 40.8 4.5 41.0 3.1 36.5 3.0 34.2 4.2 31.9 4.3 Men 50.2 8.2 45.5 7.1 43.6 5.1 38.9 4.8 38.3 6.9 31.2 6.8 Women 37.5 6.0 37.1 4.6 38.9 3.6 34.5 3.6 30.8 4.9 32.5 5.7
Whites Total 38.6 1.8 34.4 1.5 33.1 1.3 31.1 1.2 32.9 1.7 30.7 1.8 Men 43.1 2.5 37.3 2.2 35.9 1.8 32.7 1.7 33.1 2.4 31.3 2.6 Women 34.2 2.3 31.5 1.9 30.4 1.6 29.6 1.5 32.7 2.2 30.2 2.6
*For 1978–1991, current cigarette smokers include persons who reported smoking at least 100 cigarettes in their lives and who reported at the time of survey that they currently smoked. For 1992–1995, current smokers include persons who reported smoking at least 100 cigarettes in their lives and who reported at the time of survey that they currently smoked every day or on some days.
†1978, 1979, and 1980 data were combined; 1983 and 1985 data were combined; 1987 and 1988 data were combined; 1990 and 1991 data were combined; 1992 and 1993 data were combined; and 1994 and 1995 data were combined.
‡95% confidence interval. Source: National Center for Health Statistics, public use data tapes, 1978–1995.
markers for tobacco use. Among adolescents who re-ported that they did not smoke, African Americans were more likely than whites to test positive for car-bon monoxide and for cotinine. Overall, however,
white adolescents were three times more likely than African American adolescents to test positive for car-bon monoxide, suggesting that whites in this study were substantially more likely to smoke, regardless of
Patterns of Tobacco Use 33

Surgeon General's Report
Table 9. Percentage of African Americans and whites 20–24 years of age who reported being current cigarette smokers,* by education and gender, National Health Interview Surveys, United States, 1978–1995 aggregate data
1978–1980† 1983–1985† 1987–1988† 1990–1991† 1992–1993† 1994–1995†
–––––––––– –––––––––– –––––––––– –––––––––– –––––––––– ––––––––––
Characteristic % ±CI‡ % ±CI % ±CI % ±CI % ±CI % ±CI
>12 years’ education African Americans
Total 41.9 5.2 38.6 4.5 30.4 3.7 22.8 3.9 18.5 5.4 16.7 5.4 Men 49.1 7.9 38.2 7.7 29.6 6.3 28.9 6.9 21.9 9.4 22.2 10.1 Women 35.9 6.3 38.9 4.9 31.0 4.5 17.8 3.5 15.2 5.1 12.5 5.0
Whites Total 45.2 1.8 48.3 2.3 44.2 2.1 40.5 2.4 46.9 3.2 45.4 4.2 Men 47.8 2.8 47.8 3.5 46.2 3.2 40.5 3.4 47.5 4.8 47.1 5.8 Women 42.7 2.6 48.7 2.9 42.3 2.8 40.5 3.1 46.4 4.5 43.6 5.6
>13 years’ education African Americans
Total 26.4 6.4 17.3 4.4 12.4 3.7 7.2 2.9 9.0 5.3 9.3 5.6 Men 32.0 11.3 15.6 7.9 13.3 7.0 9.2 5.3 16.6 12.4 15.9 10.6 Women 23.5 6.7 18.5 6.6 11.9 4.0 5.5 3.0 4.6 4.0 3.1 3.0
Whites Total 21.6 2.0 18.2 1.8 15.4 1.5 16.0 1.5 19.0 2.6 23.6 2.8 Men 22.0 2.5 15.8 2.4 14.0 2.0 14.5 2.4 17.6 3.5 24.6 4.2 Women 21.2 2.5 20.5 2.6 16.7 2.1 17.3 2.1 20.3 3.5 22.7 3.8
*For 1978–1991, current cigarette smokers include persons who reported smoking at least 100 cigarettes in their lives and who reported at the time of survey that they currently smoked. For 1992–1995, current smokers include persons who reported smoking at least 100 cigarettes in their lives and who reported at the time of survey that they currently smoked every day or on some days.
†1978, 1979, and 1980 data were combined; 1983 and 1985 data were combined; 1987 and 1988 data were combined; 1990 and 1991 data were combined; 1992 and 1993 data were combined; and 1994 and 1995 data were combined.
‡95% confidence interval. Source: National Center for Health Statistics, public use data tapes, 1978–1995.
differential misclassification. In a study of young adults 18–30 years old, Wagenknecht and colleagues (1992) also found differential misclassification, with African Americans (5.7 percent) more likely than whites (2.8 percent) to misclassify themselves as non-smokers. However, these researchers suggested that their results may have been influenced by differential exposure to environmental tobacco smoke and by dif-ferences in nicotine metabolism. Using a sample of seventh- through tenth-grade New York State public school students, Wills and Cleary (1997) compared self-
reports of cigarette smoking with measured carbon monoxide from expired air. The investigators found that the sensitivity for self-reports was slightly lower for African Americans than for whites, but the magnitude of the effect was small. When self-reported smoking rates were adjusted for carbon monoxide values, at every grade level African American students had significantly lower smoking prevalences than whites. Although the phenomenon of differential misclassification may need further investigation, no evidence indicates that misclassification bias explains the
34 Chapter 2

African Americans
0
10
20
30
40
50
Perc
enta
ge
1978–80 1983–85 1987–88 1990–91 1992–93 1994–95 Year
Whites
0
10
20
30
40
50
Perc
enta
ge
1978–80 1983–85 1987–88 1990–91 1992–93 1994–95 Year
Aged 20–24 Aged 25–29 Aged 30–34
Tobacco Use Among U.S. Racial/Ethnic Minority Groups
Figure 4. Trends in smoking* among African Americans and whites aged 20–34 years, United States, 1978–1995
*For 1978–1991, current cigarette smokers include persons who reported smoking at least 100 cigarettes in their lives and who reported at the time of survey that they currently smoked. For 1992–1995, current smokers include persons who reported smoking at least 100 cigarettes in their lives and who reported at the time of survey that they currently smoked every day or on some days.
Source: National Health Interview Surveys, National Center for Health Statistics, public use data tapes, 1978–1995; see Table 8 for corresponding data.
Patterns of Tobacco Use 35
Surgeon General's Report
substantial decline in smoking prevalence reported by African American youths.
Possible behavioral, sociodemographic, and attitudinal explanations. Exploring possible interactions between the use of alcohol or other drugs and changes in cigarette smoking among African American and white adolescents may yield important scientific data. Understanding the trends of smoking behavior in the context of factors such as the age when youths start smoking, background and lifestyle factors, and attitudes about smoking may help program developers design better smoking prevention and control interventions for these and other population subgroups.
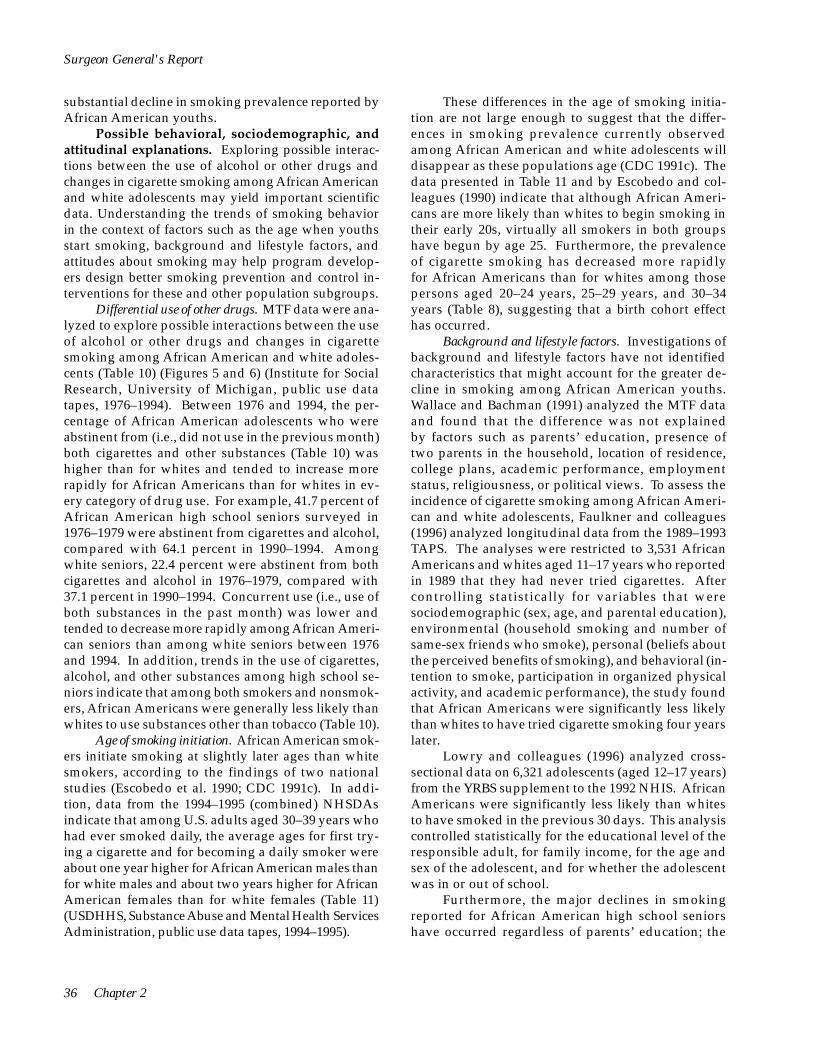
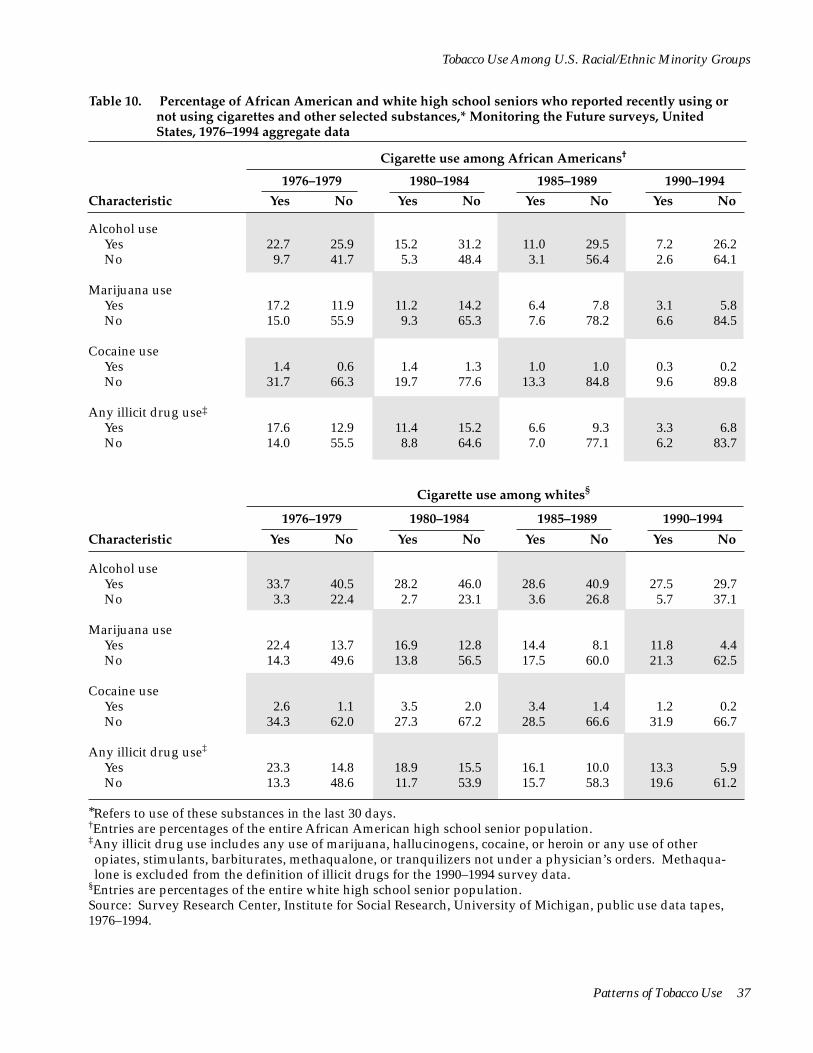
Differential use of other drugs. MTF data were analyzed to explore possible interactions between the use of alcohol or other drugs and changes in cigarette smoking among African American and white adolescents (Table 10) (Figures 5 and 6) (Institute for Social Research, University of Michigan, public use data tapes, 1976–1994). Between 1976 and 1994, the percentage of African American adolescents who were abstinent from (i.e., did not use in the previous month) both cigarettes and other substances (Table 10) was higher than for whites and tended to increase more rapidly for African Americans than for whites in every category of drug use. For example, 41.7 percent of African American high school seniors surveyed in 1976–1979 were abstinent from cigarettes and alcohol, compared with 64.1 percent in 1990–1994. Among white seniors, 22.4 percent were abstinent from both cigarettes and alcohol in 1976–1979, compared with 37.1 percent in 1990–1994. Concurrent use (i.e., use of both substances in the past month) was lower and tended to decrease more rapidly among African American seniors than among white seniors between 1976 and 1994. In addition, trends in the use of cigarettes, alcohol, and other substances among high school seniors indicate that among both smokers and nonsmokers, African Americans were generally less likely than whites to use substances other than tobacco (Table 10).
Age of smoking initiation. African American smokers initiate smoking at slightly later ages than white smokers, according to the findings of two national studies (Escobedo et al. 1990; CDC 1991c). In addition, data from the 1994–1995 (combined) NHSDAs indicate that among U.S. adults aged 30–39 years who had ever smoked daily, the average ages for first trying a cigarette and for becoming a daily smoker were about one year higher for African American males than for white males and about two years higher for African American females than for white females (Table 11) (USDHHS, Substance Abuse and Mental Health Services Administration, public use data tapes, 1994–1995).
These differences in the age of smoking initiation are not large enough to suggest that the differences in smoking prevalence currently observed among African American and white adolescents will disappear as these populations age (CDC 1991c). The data presented in Table 11 and by Escobedo and colleagues (1990) indicate that although African Americans are more likely than whites to begin smoking in their early 20s, virtually all smokers in both groups have begun by age 25. Furthermore, the prevalence of cigarette smoking has decreased more rapidly for African Americans than for whites among those persons aged 20–24 years, 25–29 years, and 30–34 years (Table 8), suggesting that a birth cohort effect has occurred.
Background and lifestyle factors. Investigations of background and lifestyle factors have not identified characteristics that might account for the greater decline in smoking among African American youths. Wallace and Bachman (1991) analyzed the MTF data and found that the difference was not explained by factors such as parents’ education, presence of two parents in the household, location of residence, college plans, academic performance, employment status, religiousness, or political views. To assess the incidence of cigarette smoking among African American and white adolescents, Faulkner and colleagues (1996) analyzed longitudinal data from the 1989–1993 TAPS. The analyses were restricted to 3,531 African Americans and whites aged 11–17 years who reported in 1989 that they had never tried cigarettes. After controlling statistically for variables that were sociodemographic (sex, age, and parental education), environmental (household smoking and number of same-sex friends who smoke), personal (beliefs about the perceived benefits of smoking), and behavioral (intention to smoke, participation in organized physical activity, and academic performance), the study found that African Americans were significantly less likely than whites to have tried cigarette smoking four years later.
Lowry and colleagues (1996) analyzed cross-sectional data on 6,321 adolescents (aged 12–17 years) from the YRBS supplement to the 1992 NHIS. African Americans were significantly less likely than whites to have smoked in the previous 30 days. This analysis controlled statistically for the educational level of the responsible adult, for family income, for the age and sex of the adolescent, and for whether the adolescent was in or out of school.
Furthermore, the major declines in smoking reported for African American high school seniors have occurred regardless of parents’ education; the
36 Chapter 2
Tobacco Use Among U.S. Racial/Ethnic Minority Groups
Table 10. Percentage of African American and white high school seniors who reported recently using or not using cigarettes and other selected substances,* Monitoring the Future surveys, United States, 1976–1994 aggregate data
Characteristic
1976–1979
Yes No
Cigarette use among African Americans†
1980–1984
Yes No
1985–1989
Yes No
1990–1994
Yes No
Alcohol use Yes 22.7 25.9 15.2 31.2 11.0 29.5 7.2 26.2 No 9.7 41.7 5.3 48.4 3.1 56.4 2.6 64.1
Marijuana use Yes 17.2 11.9 11.2 14.2 6.4 7.8 3.1 5.8 No 15.0 55.9 9.3 65.3 7.6 78.2 6.6 84.5
Cocaine use Yes 1.4 0.6 1.4 1.3 1.0 1.0 0.3 0.2 No 31.7 66.3 19.7 77.6 13.3 84.8 9.6 89.8
Any illicit drug use‡
Yes 17.6 12.9 11.4 15.2 6.6 9.3 3.3 6.8 No 14.0 55.5 8.8 64.6 7.0 77.1 6.2 83.7
Cigarette use among whites§
1976–1979
Yes No
1980–1984
Yes No
1985–1989
Yes No
1990–1994
Yes No Characteristic
Alcohol use Yes 33.7 40.5 28.2 46.0 28.6 40.9 27.5 29.7 No 3.3 22.4 2.7 23.1 3.6 26.8 5.7 37.1
Marijuana use Yes 22.4 13.7 16.9 12.8 14.4 8.1 11.8 4.4 No 14.3 49.6 13.8 56.5 17.5 60.0 21.3 62.5
Cocaine use Yes 2.6 1.1 3.5 2.0 3.4 1.4 1.2 0.2 No 34.3 62.0 27.3 67.2 28.5 66.6 31.9 66.7
Any illicit drug use‡
Yes 23.3 14.8 18.9 15.5 16.1 10.0 13.3 5.9 No 13.3 48.6 11.7 53.9 15.7 58.3 19.6 61.2
*Refers to use of these substances in the last 30 days.†Entries are percentages of the entire African American high school senior population.‡Any illicit drug use includes any use of marijuana, hallucinogens, cocaine, or heroin or any use of other opiates, stimulants, barbiturates, methaqualone, or tranquilizers not under a physician’s orders. Methaqualone is excluded from the definition of illicit drugs for the 1990–1994 survey data.
§Entries are percentages of the entire white high school senior population. Source: Survey Research Center, Institute for Social Research, University of Michigan, public use data tapes, 1976–1994.
Patterns of Tobacco Use 37
Surgeon General's Report
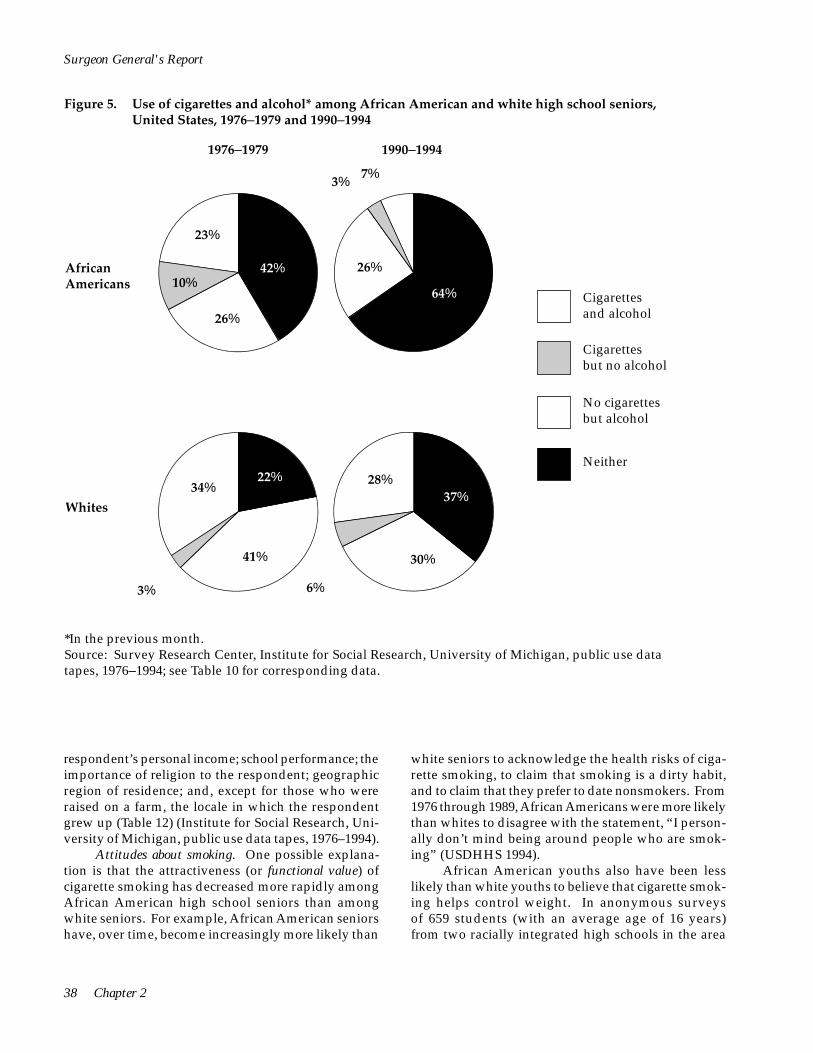
Figure 5. Use of cigarettes and alcohol* among African American and white high school seniors, United States, 1976–1979 and 1990–1994
African Americans
Whites
6%3%
41%
1976–1979 1990–1994
7%3%
26%
23%
10% 42%
34% 22%
64%
26%
Cigarettes and alcohol
Cigarettes but no alcohol
No cigarettes but alcohol
37% 28%
Neither
30%
*In the previous month. Source: Survey Research Center, Institute for Social Research, University of Michigan, public use data tapes, 1976–1994; see Table 10 for corresponding data.
respondent’s personal income; school performance; the importance of religion to the respondent; geographic region of residence; and, except for those who were raised on a farm, the locale in which the respondent grew up (Table 12) (Institute for Social Research, University of Michigan, public use data tapes, 1976–1994).
Attitudes about smoking. One possible explanation is that the attractiveness (or functional value) of cigarette smoking has decreased more rapidly among African American high school seniors than among white seniors. For example, African American seniors have, over time, become increasingly more likely than
white seniors to acknowledge the health risks of cigarette smoking, to claim that smoking is a dirty habit, and to claim that they prefer to date nonsmokers. From 1976 through 1989, African Americans were more likely than whites to disagree with the statement, “I personally don’t mind being around people who are smoking” (USDHHS 1994).
African American youths also have been less likely than white youths to believe that cigarette smoking helps control weight. In anonymous surveys of 659 students (with an average age of 16 years) from two racially integrated high schools in the area
38 Chapter 2

1976–1979 1990–1994
Cigarettes and illicit drugs
Cigarettes but
African Americans
13%
56%
84%
18%
14%
6% 3%
7%
no illicit drugs
No cigarettes but illicit drugs
Neither
Whites
61%
15%
49%
23%
20%
13%
6%
13%
Tobacco Use Among U.S. Racial/Ethnic Minority Groups
Figure 6. Use of cigarettes and illicit drugs* among African American and white high school seniors, United States, 1976–1979 and 1990–1994
*In the previous month. Source: Survey Research Center, Institute for Social Research, University of Michigan, public use data tapes, 1976–1994; see Table 10 for corresponding data.
of Memphis, Tennessee, 46 percent of white females, 30 percent of white males, 10 percent of African American females, and 14 percent of African American males endorsed the statement, “Smoking cigarettes can help you control your weight/appetite” (Camp et al. 1993). When respondents who smoked at least once a week were asked whether they had smoked to control their weight, 61 percent of the white girls and 16 percent of the white boys said that they had smoked to control their weight, whereas none of the African American smokers reported that they smoked to control their weight. Further research is needed to delineate the
role of weight control concerns in patterns of cigarette smoking initiation among adolescents of ethnic groups. One recent study suggests that African American adolescent females prefer a significantly heavier ideal body size than white adolescent females (Parnell et al. 1996), a finding consistent with the notion that the potential weight-controlling effects of cigarettes have less functional utility among young African American females than among white females.
A previous Surgeon General’s report indicated that parental concern about whether an adolescent smoked appeared to decrease the risk of that
Patterns of Tobacco Use 39
Surgeon General's Report
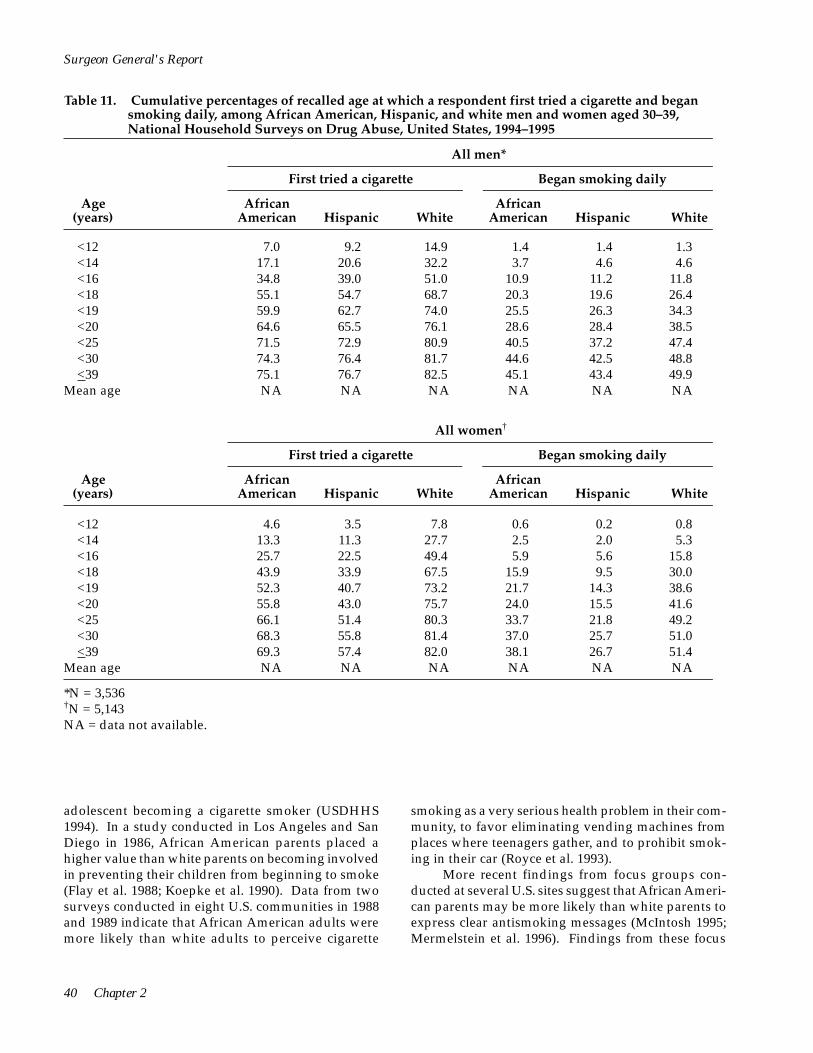
Table 11. Cumulative percentages of recalled age at which a respondent first tried a cigarette and began smoking daily, among African American, Hispanic, and white men and women aged 30–39, National Household Surveys on Drug Abuse, United States, 1994–1995
All men*
Age (years)
First tried a cigarette Began smoking daily
African American
African American Hispanic White Hispanic White
<12 7.0 9.2 14.9 1.4 1.4 1.3 <14 17.1 20.6 32.2 3.7 4.6 4.6 <16 34.8 39.0 51.0 10.9 11.2 11.8 <18 55.1 54.7 68.7 20.3 19.6 26.4 <19 59.9 62.7 74.0 25.5 26.3 34.3 <20 64.6 65.5 76.1 28.6 28.4 38.5 <25 71.5 72.9 80.9 40.5 37.2 47.4 <30 74.3 76.4 81.7 44.6 42.5 48.8 <39 75.1 76.7 82.5 45.1 43.4 49.9
Mean age NA NA NA NA NA NA
All women†
Age (years)
First tried a cigarette Began smoking daily
African American
African American Hispanic White Hispanic White
<12 4.6 3.5 7.8 0.6 0.2 0.8 <14 13.3 11.3 27.7 2.5 2.0 5.3 <16 25.7 22.5 49.4 5.9 5.6 15.8 <18 43.9 33.9 67.5 15.9 9.5 30.0 <19 52.3 40.7 73.2 21.7 14.3 38.6 <20 55.8 43.0 75.7 24.0 15.5 41.6 <25 66.1 51.4 80.3 33.7 21.8 49.2 <30 68.3 55.8 81.4 37.0 25.7 51.0 <39 69.3 57.4 82.0 38.1 26.7 51.4
Mean age NA NA NA NA NA NA
*N = 3,536 †N = 5,143 NA = data not available.
adolescent becoming a cigarette smoker (USDHHS 1994). In a study conducted in Los Angeles and San Diego in 1986, African American parents placed a higher value than white parents on becoming involved in preventing their children from beginning to smoke (Flay et al. 1988; Koepke et al. 1990). Data from two surveys conducted in eight U.S. communities in 1988 and 1989 indicate that African American adults were more likely than white adults to perceive cigarette
smoking as a very serious health problem in their community, to favor eliminating vending machines from places where teenagers gather, and to prohibit smoking in their car (Royce et al. 1993).
More recent findings from focus groups conducted at several U.S. sites suggest that African American parents may be more likely than white parents to express clear antismoking messages (McIntosh 1995; Mermelstein et al. 1996). Findings from these focus
40 Chapter 2

Tobacco Use Among U.S. Racial/Ethnic Minority Groups
Men who had ever smoked daily
First tried a cigarette Began smoking daily
African American Hispanic White
African American Hispanic White
8.9 22.7 45.7 73.7 81.1 87.0 96.1 99.9
100.0 15.9
13.6 29.7 55.4 74.1 83.4 86.9 97.0 99.6
100.0 15.3
15.7 36.7 61.0 83.9 90.5 93.0 98.4 98.9
100.0 14.6
3.0 8.3
24.2 45.0 56.4 63.5 89.7 98.9
100.0 18.4
3.2 10.6 25.7 45.1 60.7 65.4 85.7 97.9
100.0 18.6
Women who had ever smoked daily
2.7 9.2
23.7 52.9 68.8 77.1 95.1 97.7
100.0 17.6
First tried a cigarette Began smoking daily
African American Hispanic White
African American Hispanic White
5.9 20.1 38.6 66.8 77.2 81.4 96.0 99.6
100.0 16.6
6.9 25.4 48.7 68.6 78.2 80.8 94.5 99.2
100.0 16.2
8.9 37.8 66.1 85.9 92.0 94.4 99.2 99.9
100.0 14.6
1.6 6.7
15.5 41.8 57.0 62.9 88.4 97.2
100.0 18.9
0.7 7.6
21.1 35.4 53.4 58.0 81.8 96.4
100.0 19.5
1.6 10.3 30.7 58.3 75.0 80.8 95.6 99.2
100.0 17.1
Source: Substance Abuse and Mental Health Services Administration, public use data tapes, 1994–1995.
groups also suggest that smoking by African American adolescents may be a sign of disrespect toward parents (USDHHS 1994). Additionally, African American adolescent females appear to perceive that abstinence from smoking enhances their image, whereas white girls are more likely to perceive that smoking empowers them (perhaps because of themes expressed in cigarette advertising) (Mermelstein et al. 1996). The responses of African American community leaders,
including that of former USDHHS Secretary Louis Sullivan, against cigarette marketing campaigns that appear to target African Americans may have influenced young people’s attitudes and behaviors about smoking (McIntosh 1995).
Further research is needed to better understand the large decreases in smoking prevalence that occurred among African American youth in the 1970s and 1980s. Research is also needed to better
Patterns of Tobacco Use 41
42 Chapter 2
Surgeon General's Report
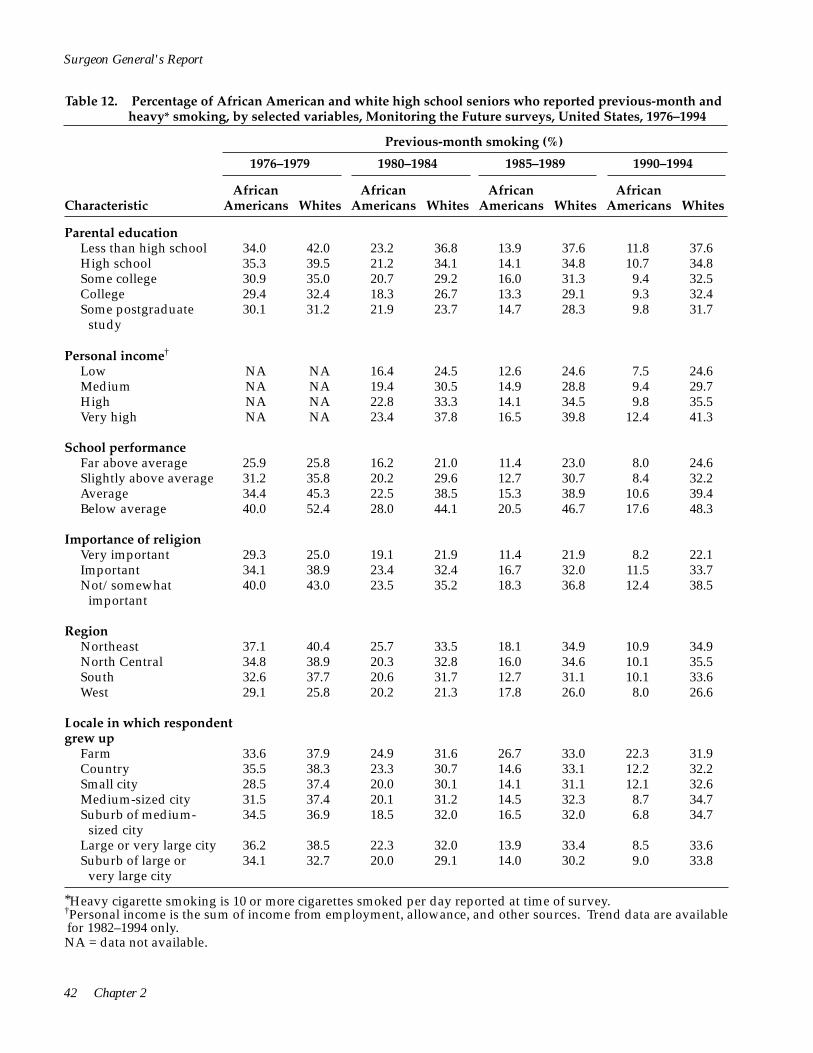
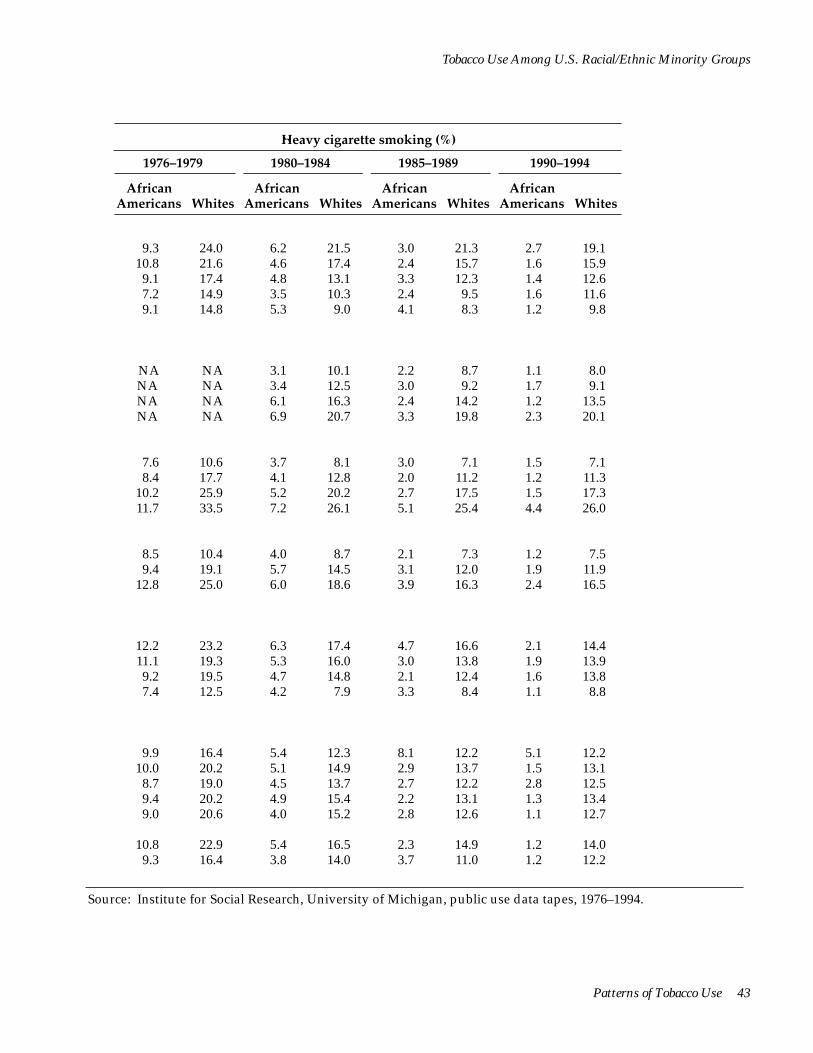
Table 12. Percentage of African American and white high school seniors who reported previous-month and heavy* smoking, by selected variables, Monitoring the Future surveys, United States, 1976–1994
Previous-month smoking (%)
1976–1979 1980–1984 1985–1989 1990–1994
Characteristic African
Americans Whites African
Americans Whites African
Americans Whites African
Americans Whites
Parental education Less than high school 34.0 42.0 23.2 36.8 13.9 37.6 11.8 37.6 High school 35.3 39.5 21.2 34.1 14.1 34.8 10.7 34.8 Some college 30.9 35.0 20.7 29.2 16.0 31.3 9.4 32.5 College 29.4 32.4 18.3 26.7 13.3 29.1 9.3 32.4 Some postgraduate 30.1 31.2 21.9 23.7 14.7 28.3 9.8 31.7
study
Personal income†
Low NA NA 16.4 24.5 12.6 24.6 7.5 24.6 Medium NA NA 19.4 30.5 14.9 28.8 9.4 29.7 High NA NA 22.8 33.3 14.1 34.5 9.8 35.5 Very high NA NA 23.4 37.8 16.5 39.8 12.4 41.3
School performance Far above average 25.9 25.8 16.2 21.0 11.4 23.0 8.0 24.6 Slightly above average 31.2 35.8 20.2 29.6 12.7 30.7 8.4 32.2 Average 34.4 45.3 22.5 38.5 15.3 38.9 10.6 39.4 Below average 40.0 52.4 28.0 44.1 20.5 46.7 17.6 48.3
Importance of religion Very important 29.3 25.0 19.1 21.9 11.4 21.9 8.2 22.1 Important 34.1 38.9 23.4 32.4 16.7 32.0 11.5 33.7 Not/somewhat 40.0 43.0 23.5 35.2 18.3 36.8 12.4 38.5
important
Region Northeast 37.1 40.4 25.7 33.5 18.1 34.9 10.9 34.9 North Central 34.8 38.9 20.3 32.8 16.0 34.6 10.1 35.5 South 32.6 37.7 20.6 31.7 12.7 31.1 10.1 33.6 West 29.1 25.8 20.2 21.3 17.8 26.0 8.0 26.6
Locale in which respondent grew up
Farm 33.6 37.9 24.9 31.6 26.7 33.0 22.3 31.9 Country 35.5 38.3 23.3 30.7 14.6 33.1 12.2 32.2 Small city 28.5 37.4 20.0 30.1 14.1 31.1 12.1 32.6 Medium-sized city 31.5 37.4 20.1 31.2 14.5 32.3 8.7 34.7 Suburb of medium- 34.5 36.9 18.5 32.0 16.5 32.0 6.8 34.7
sized city Large or very large city 36.2 38.5 22.3 32.0 13.9 33.4 8.5 33.6 Suburb of large or 34.1 32.7 20.0 29.1 14.0 30.2 9.0 33.8
very large city
*Heavy cigarette smoking is 10 or more cigarettes smoked per day reported at time of survey. †Personal income is the sum of income from employment, allowance, and other sources. Trend data are available for 1982–1994 only. NA = data not available.
Tobacco Use Among U.S. Racial/Ethnic Minority Groups
Heavy cigarette smoking (%)
1976–1979 1980–1984 1985–1989 1990–1994
African Americans
African Americans
African Americans
African Americans Whites Whites Whites Whites
9.3 24.0 6.2 21.5 3.0 21.3 2.7 19.1 10.8 21.6 4.6 17.4 2.4 15.7 1.6 15.9 9.1 17.4 4.8 13.1 3.3 12.3 1.4 12.6 7.2 14.9 3.5 10.3 2.4 9.5 1.6 11.6 9.1 14.8 5.3 9.0 4.1 8.3 1.2 9.8
NA NA 3.1 10.1 2.2 8.7 1.1 8.0 NA NA 3.4 12.5 3.0 9.2 1.7 9.1 NA NA 6.1 16.3 2.4 14.2 1.2 13.5 NA NA 6.9 20.7 3.3 19.8 2.3 20.1
7.6 10.6 3.7 8.1 3.0 7.1 1.5 7.1 8.4 17.7 4.1 12.8 2.0 11.2 1.2 11.3
10.2 25.9 5.2 20.2 2.7 17.5 1.5 17.3 11.7 33.5 7.2 26.1 5.1 25.4 4.4 26.0
8.5 10.4 4.0 8.7 2.1 7.3 1.2 7.5 9.4 19.1 5.7 14.5 3.1 12.0 1.9 11.9
12.8 25.0 6.0 18.6 3.9 16.3 2.4 16.5
12.2 23.2 6.3 17.4 4.7 16.6 2.1 14.4 11.1 19.3 5.3 16.0 3.0 13.8 1.9 13.9 9.2 19.5 4.7 14.8 2.1 12.4 1.6 13.8 7.4 12.5 4.2 7.9 3.3 8.4 1.1 8.8
9.9 16.4 5.4 12.3 8.1 12.2 5.1 12.2 10.0 20.2 5.1 14.9 2.9 13.7 1.5 13.1 8.7 19.0 4.5 13.7 2.7 12.2 2.8 12.5 9.4 20.2 4.9 15.4 2.2 13.1 1.3 13.4 9.0 20.6 4.0 15.2 2.8 12.6 1.1 12.7
10.8 22.9 5.4 16.5 2.3 14.9 1.2 14.0 9.3 16.4 3.8 14.0 3.7 11.0 1.2 12.2
Source: Institute for Social Research, University of Michigan, public use data tapes, 1976–1994.
Patterns of Tobacco Use 43

Surgeon General's Report
understand the reasons for the increase in prevalence that occurred in the early 1990s (Figures 2 and 3) (CDC 1996).
Other risk behaviors. The Surgeon General’s report Preventing Tobacco Use Among Young People (USDHHS 1994) has concluded that “Tobacco use in adolescence is associated with a range of health-compromising behaviors, including being involved in fights, carrying weapons, engaging in higher-risk sexual behavior, and using alcohol and other drugs” (p. 9). Escobedo and colleagues (1997) have observed these associations for African American adolescent males and females. Using data from the YRBS supplement of the 1992 NHIS, the researchers found that after their analysis controlled statistically for age, ethnicity, sex, parental educational level, region of the country, and other risk behaviors, marijuana use, binge drinking, and physical fighting were significantly associated with cigarette smoking among African American adolescent males and females. Focus group data suggest that African American youths are more likely than white youths to pair cigarette smoking with marijuana use as a way to maintain and enhance the drug effects of each (Mermelstein et al. 1996).
Smokeless Tobacco Use
The prevalence of smokeless tobacco use among African American adolescents has remained fairly constant in recent years. According to the MTF surveys, previous-month smokeless tobacco use (based on two-year rolling averages) was reported by 1.8 percent of eighth-grade African American students in 1992 and 2.2 percent in 1996; among tenth-grade students, the prevalence was 2.9 percent in 1992 and 2.5 percent in 1996; and among high school seniors, the prevalence was 2.1 percent in 1987 and 2.7 percent in 1996 (Johnston et al. 1996; Institute for Social Research, University of Michigan, unpublished data from the 1996 MTF surveys). Similarly, the YRBS data indicate that 2.1 percent of African American high school students were current smokeless tobacco users in 1991 (USDHHS 1994), and 2.2 percent were so in 1995 (CDC 1996).
African American adolescent males are substantially less likely than white adolescent males to use smokeless tobacco. Among male high school students participating in the 1995 YRBS, for example, 3.5 percent of African Americans and 25.1 percent of whites reported that they had used smokeless tobacco in the previous month (CDC 1996). Among females, 1.1 percent of African Americans and 2.5 percent of whites reported they had used smokeless tobacco in the previous month.
American Indians and Alaska Natives
Data assessing long-term trends in tobacco use among American Indians and Alaska Natives have been unavailable, for the most part, because national surveys and databases have only recently begun to identify persons of American Indian or Alaska Native ancestry. Studies using data from regional surveys or data on specific American Indian tribes have, however, provided useful information about tobacco use among members of these groups. Because the geographic location of American Indian and Alaska Native people reflects unique cultural and historical experiences, researchers should consider these differences when interpreting region-specific data about smoking prevalence. Data from regional studies also may provide information that is useful in developing culturally appropriate tobacco control efforts.
National surveys provide limited capability to assess the level of tobacco use and the effectiveness of tobacco control efforts among American Indians and Alaska Natives. The NHIS, for example, did not begin identifying American Indian and Alaska Native respondents until 1978. Because American Indians and Alaska Natives make up a small proportion of the U.S. population, data must be aggregated from several years to provide meaningful estimates.
Also noteworthy is that the data on tobacco use among American Indians and Alaska Natives include some ceremonial use (e.g., in pipes) in addition to daily addictive behavior (see Chapter 4). Anecdotal information also suggests that standard definitions and classifications of smoking may not accurately reflect smoking habits among American Indians, some of whom may smoke no more than one or two cigarettes per day (Nathaniel Cobb, personal communication, 1994; Roscoe et al. 1995). Yet American Indians who smoke a few cigarettes every day are classified in the <15-cigarettes-per-day category, which may imply a higher overall consumption than actually exists. Such differences in amounts of daily smoking may have important implications for the design of culturally appropriate smoking cessation interventions targeting American Indians.
Prevalence of Cigarette Smoking
Among American Indian and Alaska Native men and women, rates of smoking have been substantially higher than smoking rates in any other U.S. subgroup. In the 1987 Survey of American Indians and Alaska Natives (SAIAN) of the National Medical Expenditure Survey, 32.8 percent of respondents reported being
44 Chapter 2
Tobacco Use Among U.S. Racial/Ethnic Minority Groups
current smokers (Lefkowitz and Underwood 1991). This survey—the only nationally representative sample designed to assess the health practices of people of American Indian and Alaska Native ancestry—targets people who live on or near reservations and who are eligible for services provided by the Indian Health Service (IHS). The NHIS rate of smoking among American Indians and Alaska Natives for 1987 and 1988 (39.2 percent) was greater than the SAIAN estimate, perhaps because of different modes of administration and sampling (tribally enrolled beneficiaries in the SAIAN and the general population of American Indians and Alaska Natives in the NHIS).
In a more recent survey—conducted on reservations between 1989 and 1992 and involving 4,549 American Indians 45–74 years old in 13 tribes in Arizona, North Dakota, South Dakota, and southeastern Oklahoma—the prevalence of cigarette smoking was higher in nearly all American Indian groups (40.5 percent for men and 29.3 percent for women) than in the general U.S. population, but wide variation was notable (Welty et al. 1995). In this study, known as the Strong Heart Study, the smoking prevalence was highest in North Dakota and South Dakota (53.1 percent for men and 45.3 percent for women) and lowest in Arizona (29.7 percent for men and 12.9 percent for women).
According to the NHIS data, the overall prevalence of cigarette smoking among American Indians and Alaska Natives was 48.2 percent in 1978–1980 and 39.2 percent in 1994–1995. Although the data are imprecise, they suggest a substantial drop in prevalence for men from 1978–1980 to 1983–1985 (Table 13) (NCHS, public use data tapes, 1978–1995). However, no progress for men was observed from 1983–1985 to 1994–1995 and, for women, no progress was observed from 1978–1980 to 1994–1995.
Another major source of data on smoking patterns among American Indians and Alaska Natives is the BRFSS, which, for these analyses, included data collected in 47 states and the District of Columbia (CDC 1992a). The BRFSS data for 1987–1991 show that among American Indians and Alaska Natives, 33.4 percent of men and 26.6 percent of women reported that they were current smokers. The 95 percent confidence intervals associated with smoking rates overlap between American Indian and Alaska Native women and men in both surveys. Even though data were aggregated for several years, the small sample sizes of American Indians and Alaska Natives in both surveys produced imprecise estimates that make it impossible to determine whether the prevalence of smoking actually differed between men and women.
percent in 1987–1988 and 37.2 percent in 1990–1991) differed substantially from the prevalence found in the 1987–1991 BRFSS (26.6 percent). Similarly, the prevalence of smoking among American Indian and Alaska Native men in the NHIS (43.5 percent in 1987–1988 and 32.9 percent in 1990–1991) differed appreciably from the prevalence found for men in the 1987–1991 BRFSS (33.4 percent). Methodological differences between the surveys may explain these differences. Household, face-to-face interviews were conducted for the NHIS, whereas telephone interviews were performed for the BRFSS (Goldberg et al. 1991; Sugarman et al. 1992; Leonard et al. 1993). Because telephone coverage in the areas where American Indians and Alaska Natives live tends to be lower than in areas where other ethnic groups live (Goldberg et al. 1991; Sugarman et al. 1992), sometimes as low as 60.4 percent of households (U.S. Bureau of the Census 1994), American Indians and Alaska Natives probably were less likely than others to have been included in the BRFSS surveys. Moreover, because telephone service requires financial ability to pay, persons of higher socioeconomic status may have been more likely than other persons to be included in the BRFSS surveys (Thornberry and Massey 1988). Thus, the BRFSS may have yielded lower smoking rates than the NHIS because the BRFSS surveys selected more affluent respondents, who were less likely than others to smoke.
The prevalence of smoking among American Indian and Alaska Native women in the NHIS (35.2
Estimated rates and trends in cigarette smoking were not significantly related to educational attainment, according to NHIS (Table 13) and SAIAN data. However, both surveys suffered from imprecision because of small sample sizes.
Number of Cigarettes Smoked Daily
NHIS data for 1978–1995 show few variations over time in the number of cigarettes smoked per day among American Indian and Alaska Native smokers (Table 14) (NCHS, public use data tapes, 1978–1995). In the years 1978–1980, 39.9 percent of American Indian and Alaska Native smokers reported smoking fewer than 15 cigarettes per day, and 25.2 percent reported smoking 25 or more cigarettes per day. By 1994– 1995, the proportion of American Indian and Alaska Native smokers who smoked fewer than 15 cigarettes per day was 49.9 percent, whereas the proportion who smoked 25 or more cigarettes per day was 17.0 percent. Data from the Strong Heart Study showed that American Indian smokers reported smoking fewer cigarettes per day (range of 6.1 among women in Arizona to 15.0 among men in North Dakota and South Dakota) than the national average (Welty et al. 1995).
Patterns of Tobacco Use 45

Surgeon General's Report
Table 13. Percentage of American Indian and Alaska Native adults who reported being current cigarette smokers,* overall and by gender, age, and education, National Health Interview Surveys, United States, 1978–1995 aggregate data
1978–1980†
–––––––––– % ±CI‡
1983–1985†
–––––––––– % ±CI
1987–1988†
–––––––––– % ±CI
1990–1991†
–––––––––– % ±CI
1992–1993†
–––––––––– % ±CI
1994–1995†
–––––––––– % ±CI Characteristic
Total 48.2 5.8 35.6 8.0 39.2 5.9 35.0 6.9 39.1 5.1 39.2 7.3
Gender Men 63.0 11.0 41.4 12.9 43.5 9.3 32.9 7.1 37.5 9.3 45.4 13.1 Women 34.1 10.1 32.3 8.8 35.2 6.2 37.2 9.1 40.3 8.6 34.2 8.7
Age (years) 18–34 53.3 9.2 39.9 13.6 38.1 7.1 36.1 9.3 41.3 8.7 48.0 11.1 35–54 53.5 11.0 36.7 12.1 47.4 8.0 40.2 7.0 45.1 8.4 42.9 11.3
>55 33.4 15.1 24.7 11.3 29.2 10.7 23.4 14.9 22.3 9.3 10.5 8.9
Education§
Less than high school 49.9 8.8 28.7 11.3 42.5 8.3 33.4 8.9 42.6 12.3 44.1 14.2 High school graduate/ any college
35.0 11.5 36.7 10.2 35.7 6.7 35.4 7.9 37.9 7.4 33.5 7.8
*Excludes American Indians and Alaska Natives who indicated they were of Hispanic origin. For 1978–1991, current cigarette smokers include persons who reported smoking at least 100 cigarettes in their lives and who reported at the time of survey that they currently smoked. For 1992–1995, current smokers include persons who reported smoking at least 100 cigarettes in their lives and who reported at the time of survey that they currently smoked every day or on some days.
†1978, 1979, and 1980 data were combined; 1983 and 1985 data were combined; 1987 and 1988 data were combined; 1990 and 1991 data were combined; 1992 and 1993 data were combined; and 1994 and 1995 data were combined.
‡95% confidence interval. §Includes persons aged 25 years and older. Source: National Center for Health Statistics, public use data tapes, 1978–1995.
In the years 1978–1980, American Indian and Alaska Native men were more likely than women to smoke 25 or more cigarettes per day (Table 14). Since 1980, however, the proportion of men smoking 25 or more cigarettes per day has declined.
Cigarette consumption data from the BRFSS and the NHIS cannot be compared directly because the BRFSS data are for the mean number of cigarettes smoked daily (CDC 1992a). However, both sources of data indicate that the number of cigarettes smoked is slightly greater among older than among younger American Indians and Alaska Natives.
Quitting Behavior
State and regional surveys also indicate that the prevalence of smoking cessation remains relatively low among American Indian and Alaska Native smokers compared with smokers in other racial/ethnic groups
(Goldberg et al. 1991; Lando et al. 1992). In the past 17 years, the percentage of American Indians and Alaska Natives who have ever smoked 100 cigarettes and have quit smoking has changed only slightly overall; NHIS data indicate that the prevalence of cessation was 31.6 percent in 1978–1980 and 32.9 percent in 1994–1995 (Table 15) (NCHS, public use data tapes, 1978–1993). During this period, the prevalence of smoking cessation fluctuated substantially for both genders, with similar estimates reported for 1978–1980 and 1994– 1995. The prevalence of smoking cessation among American Indians and Alaska Natives has increased with increasing age: those aged 18–34 years have had the lowest prevalence of cessation, those aged 35–54 years have had intermediate proportions, and those aged 55 years and older have had the highest prevalence of cessation. The prevalence of cessation increased among older American Indians and Alaska Natives; however, no progress occurred among those
46 Chapter 2
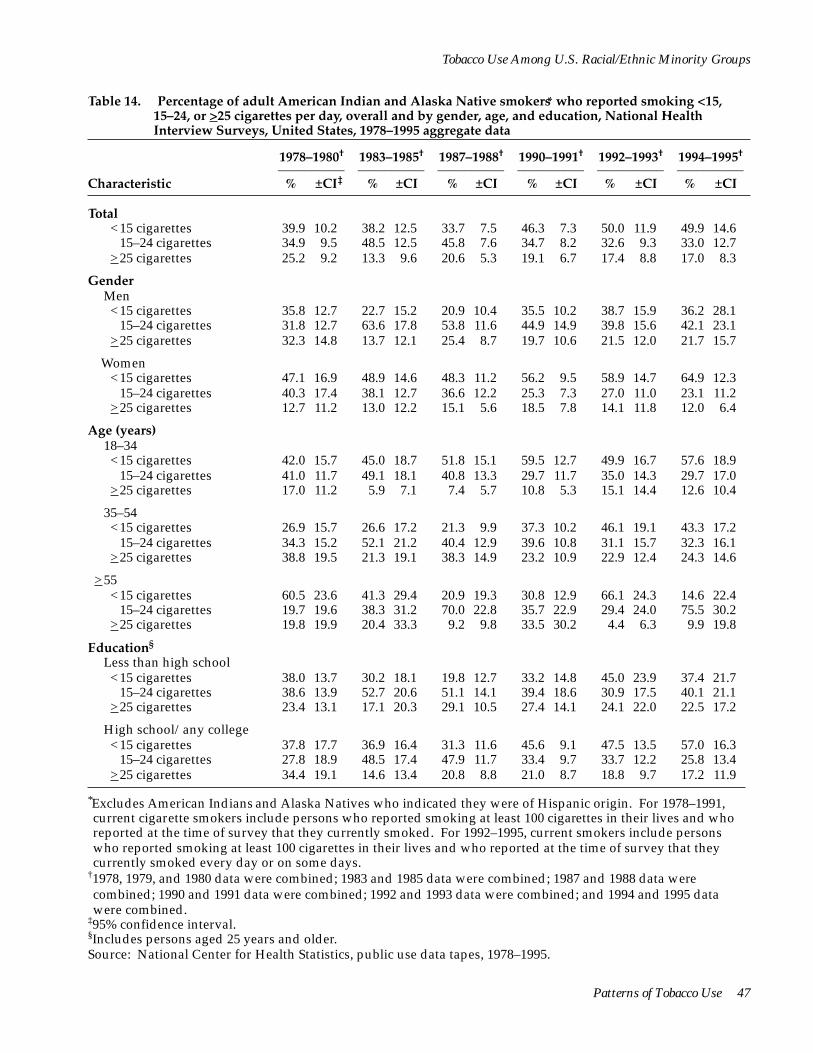
Tobacco Use Among U.S. Racial/Ethnic Minority Groups
Table 14. Percentage of adult American Indian and Alaska Native smokers* who reported smoking <15, 15–24, or >25 cigarettes per day, overall and by gender, age, and education, National Health Interview Surveys, United States, 1978–1995 aggregate data
1978–1980†
–––––––––– % ±CI‡
1983–1985†
–––––––––– % ±CI
1987–1988†
–––––––––– % ±CI
1990–1991†
–––––––––– % ±CI
1992–1993†
–––––––––– % ±CI
1994–1995†
–––––––––– % ±CI Characteristic
Total <15 cigarettes 39.9 10.2 38.2 12.5 33.7 7.5 46.3 7.3 50.0 11.9 49.9 14.6
15–24 cigarettes 34.9 9.5 48.5 12.5 45.8 7.6 34.7 8.2 32.6 9.3 33.0 12.7 >25 cigarettes 25.2 9.2 13.3 9.6 20.6 5.3 19.1 6.7 17.4 8.8 17.0 8.3
Gender Men <15 cigarettes 35.8 12.7 22.7 15.2 20.9 10.4 35.5 10.2 38.7 15.9 36.2 28.1
15–24 cigarettes 31.8 12.7 63.6 17.8 53.8 11.6 44.9 14.9 39.8 15.6 42.1 23.1 >25 cigarettes 32.3 14.8 13.7 12.1 25.4 8.7 19.7 10.6 21.5 12.0 21.7 15.7
Women <15 cigarettes 47.1 16.9 48.9 14.6 48.3 11.2 56.2 9.5 58.9 14.7 64.9 12.3
15–24 cigarettes 40.3 17.4 38.1 12.7 36.6 12.2 25.3 7.3 27.0 11.0 23.1 11.2 >25 cigarettes 12.7 11.2 13.0 12.2 15.1 5.6 18.5 7.8 14.1 11.8 12.0 6.4
Age (years) 18–34 <15 cigarettes 42.0 15.7 45.0 18.7 51.8 15.1 59.5 12.7 49.9 16.7 57.6 18.9
15–24 cigarettes 41.0 11.7 49.1 18.1 40.8 13.3 29.7 11.7 35.0 14.3 29.7 17.0 >25 cigarettes 17.0 11.2 5.9 7.1 7.4 5.7 10.8 5.3 15.1 14.4 12.6 10.4
35–54 <15 cigarettes 26.9 15.7 26.6 17.2 21.3 9.9 37.3 10.2 46.1 19.1 43.3 17.2
15–24 cigarettes 34.3 15.2 52.1 21.2 40.4 12.9 39.6 10.8 31.1 15.7 32.3 16.1 >25 cigarettes 38.8 19.5 21.3 19.1 38.3 14.9 23.2 10.9 22.9 12.4 24.3 14.6
>55 <15 cigarettes 60.5 23.6 41.3 29.4 20.9 19.3 30.8 12.9 66.1 24.3 14.6 22.4
15–24 cigarettes 19.7 19.6 38.3 31.2 70.0 22.8 35.7 22.9 29.4 24.0 75.5 30.2 >25 cigarettes 19.8 19.9 20.4 33.3 9.2 9.8 33.5 30.2 4.4 6.3 9.9 19.8
Education§
Less than high school <15 cigarettes 38.0 13.7 30.2 18.1 19.8 12.7 33.2 14.8 45.0 23.9 37.4 21.7
15–24 cigarettes 38.6 13.9 52.7 20.6 51.1 14.1 39.4 18.6 30.9 17.5 40.1 21.1 >25 cigarettes 23.4 13.1 17.1 20.3 29.1 10.5 27.4 14.1 24.1 22.0 22.5 17.2
High school/any college <15 cigarettes 37.8 17.7 36.9 16.4 31.3 11.6 45.6 9.1 47.5 13.5 57.0 16.3
15–24 cigarettes 27.8 18.9 48.5 17.4 47.9 11.7 33.4 9.7 33.7 12.2 25.8 13.4 >25 cigarettes 34.4 19.1 14.6 13.4 20.8 8.8 21.0 8.7 18.8 9.7 17.2 11.9
*Excludes American Indians and Alaska Natives who indicated they were of Hispanic origin. For 1978–1991, current cigarette smokers include persons who reported smoking at least 100 cigarettes in their lives and who reported at the time of survey that they currently smoked. For 1992–1995, current smokers include persons who reported smoking at least 100 cigarettes in their lives and who reported at the time of survey that they currently smoked every day or on some days.
†1978, 1979, and 1980 data were combined; 1983 and 1985 data were combined; 1987 and 1988 data were combined; 1990 and 1991 data were combined; 1992 and 1993 data were combined; and 1994 and 1995 data were combined.
‡95% confidence interval. §Includes persons aged 25 years and older. Source: National Center for Health Statistics, public use data tapes, 1978–1995.
Patterns of Tobacco Use 47
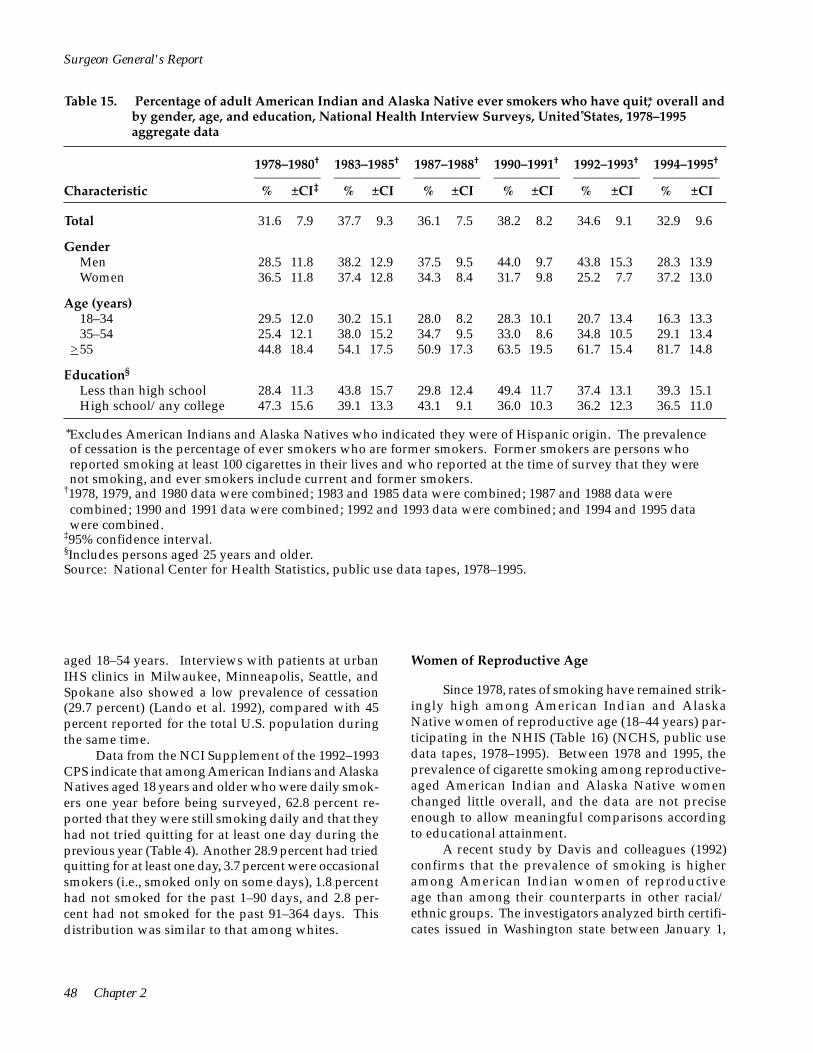
Surgeon General's Report
Table 15. Percentage of adult American Indian and Alaska Native ever smokers who have quit,* overall and by gender, age, and education, National Health Interview Surveys, United States, 1978–1995 aggregate data
1978–1980†
–––––––––– % ±CI‡
1983–1985†
–––––––––– % ±CI
1987–1988†
–––––––––– % ±CI
1990–1991†
–––––––––– % ±CI
1992–1993†
–––––––––– % ±CI
1994–1995†
–––––––––– % ±CI Characteristic
Total 31.6 7.9 37.7 9.3 36.1 7.5 38.2 8.2 34.6 9.1 32.9 9.6
Gender Men 28.5 11.8 38.2 12.9 37.5 9.5 44.0 9.7 43.8 15.3 28.3 13.9 Women 36.5 11.8 37.4 12.8 34.3 8.4 31.7 9.8 25.2 7.7 37.2 13.0
Age (years) 18–34 29.5 12.0 30.2 15.1 28.0 8.2 28.3 10.1 20.7 13.4 16.3 13.3 35–54 25.4 12.1 38.0 15.2 34.7 9.5 33.0 8.6 34.8 10.5 29.1 13.4
>55 44.8 18.4 54.1 17.5 50.9 17.3 63.5 19.5 61.7 15.4 81.7 14.8
Education§
Less than high school 28.4 11.3 43.8 15.7 29.8 12.4 49.4 11.7 37.4 13.1 39.3 15.1 High school/any college 47.3 15.6 39.1 13.3 43.1 9.1 36.0 10.3 36.2 12.3 36.5 11.0
*Excludes American Indians and Alaska Natives who indicated they were of Hispanic origin. The prevalence of cessation is the percentage of ever smokers who are former smokers. Former smokers are persons who reported smoking at least 100 cigarettes in their lives and who reported at the time of survey that they were not smoking, and ever smokers include current and former smokers.
†1978, 1979, and 1980 data were combined; 1983 and 1985 data were combined; 1987 and 1988 data were combined; 1990 and 1991 data were combined; 1992 and 1993 data were combined; and 1994 and 1995 data were combined.
‡95% confidence interval. §Includes persons aged 25 years and older. Source: National Center for Health Statistics, public use data tapes, 1978–1995.
aged 18–54 years. Interviews with patients at urban IHS clinics in Milwaukee, Minneapolis, Seattle, and Spokane also showed a low prevalence of cessation (29.7 percent) (Lando et al. 1992), compared with 45 percent reported for the total U.S. population during the same time.
Data from the NCI Supplement of the 1992–1993 CPS indicate that among American Indians and Alaska Natives aged 18 years and older who were daily smokers one year before being surveyed, 62.8 percent reported that they were still smoking daily and that they had not tried quitting for at least one day during the previous year (Table 4). Another 28.9 percent had tried quitting for at least one day, 3.7 percent were occasional smokers (i.e., smoked only on some days), 1.8 percent had not smoked for the past 1–90 days, and 2.8 percent had not smoked for the past 91–364 days. This distribution was similar to that among whites.
Women of Reproductive Age
Since 1978, rates of smoking have remained strikingly high among American Indian and Alaska Native women of reproductive age (18–44 years) participating in the NHIS (Table 16) (NCHS, public use data tapes, 1978–1995). Between 1978 and 1995, the prevalence of cigarette smoking among reproductive-aged American Indian and Alaska Native women changed little overall, and the data are not precise enough to allow meaningful comparisons according to educational attainment.
A recent study by Davis and colleagues (1992) confirms that the prevalence of smoking is higher among American Indian women of reproductive age than among their counterparts in other racial/ ethnic groups. The investigators analyzed birth certificates issued in Washington state between January 1,
48 Chapter 2

Tobacco Use Among U.S. Racial/Ethnic Minority Groups
Table 16. Percentage of American Indian and Alaska Native women of reproductive age who reported being current cigarette smokers,* overall and by education, National Health Interview Surveys, United States, 1978–1995 aggregate data
1978–1980†
–––––––––– % ±CI‡
1983–1985†
–––––––––– % ±CI
1987–1988†
–––––––––– % ±CI
1990–1991†
–––––––––– % ±CI
1992–1993†
–––––––––– % ±CI
1994–1995†
–––––––––– % ±CI Characteristic
Total 40.2 12.8 35.9 11.3 39.2 8.9 43.3 11.1 39.7 9.4 44.3 12.0
Education§
Less than high school 60.4 23.7 47.6 24.9 53.1 18.9 61.3 14.5 82.1 18.6 62.4 30.0 High school/any college 17.2 13.1 27.6 11.7 30.5 9.3 42.9 14.4 32.7 11.2 45.6 14.4
*Excludes American Indians and Alaska Natives who indicated they were of Hispanic origin. For 1978–1991, current cigarette smokers include women aged 18–44 years who reported smoking at least 100 cigarettes in their lives and who reported at the time of survey that they currently smoked. For 1992–1995, current smokers include women aged 18–44 years who reported smoking at least 100 cigarettes in their lives and who reported at the time of survey that they currently smoked every day or on some days.
†1978, 1979, and 1980 data were combined; 1983 and 1985 data were combined; 1987 and 1988 data were combined; 1990 and 1991 data were combined; 1992 and 1993 data were combined; and 1994 and 1995 data were combined.
‡95% confidence interval. §Includes persons aged 25 years and older. Source: National Center for Health Statistics, public use data tapes, 1978–1995.
1984, and December 31, 1988, and found that the prevalence of smoking among American Indian mothers, adjusted for maternal age and marital status, was 1.3 times higher than the prevalence among white mothers.
Data from the 1988 NMIHS indicate that 35 percent of American Indian mothers sampled reported smoking cigarettes in the 12 months before delivery (Sugarman et al. 1994). Recent birth certificate data from U.S. final natality statistics show that 20.9 percent of American Indian and Alaska Native mothers smoked during pregnancy (Ventura et al. 1997), a slight decline from 23.0 percent in 1989 (Table 6). The prevalence of smoking among American Indian mothers was higher than all groups in 1989–1995 (Table 6).
Young People
Cigarette Smoking
One of the few studies focusing on tobacco use among American Indian and Alaska Native youths is the MTF, which includes a series of surveys of high school seniors. Between 1976 and 1994, American Indian and Alaska Native high school seniors had higher rates of cigarette smoking than all of their counterparts, although the rate of decline was more rapid than for
whites (Table 7). The prevalence of previous-month cigarette smoking during 1990–1994 was 39.4 percent among American Indian and Alaska Native females and 41.1 percent among males. During 1985–1989, rates of daily smoking and of smoking one-half pack or more per day were higher among American Indian and Alaska Native youths than among youths of other racial/ethnic groups (Bachman et al. 1991a).
Data from a revised version of the Adolescent Health Survey showed that for every grade level after the seventh, American Indian and Alaska Native females were somewhat more likely to be daily cigarette smokers than were American Indian males. The prevalence of daily cigarette smoking among females increased from 8.9 percent in junior high school to 17.8 percent in high school, whereas among males the prevalence of daily cigarette smoking increased from 8.1 percent in junior high school to 15.0 percent in high school (Blum et al. 1992).
Smokeless Tobacco Use
The use of smokeless tobacco is also high among American Indian and Alaska Native youths. Bruerd (1990) reviewed nine studies of schoolchildren’s use of smokeless tobacco in South Dakota, Montana,
Patterns of Tobacco Use 49
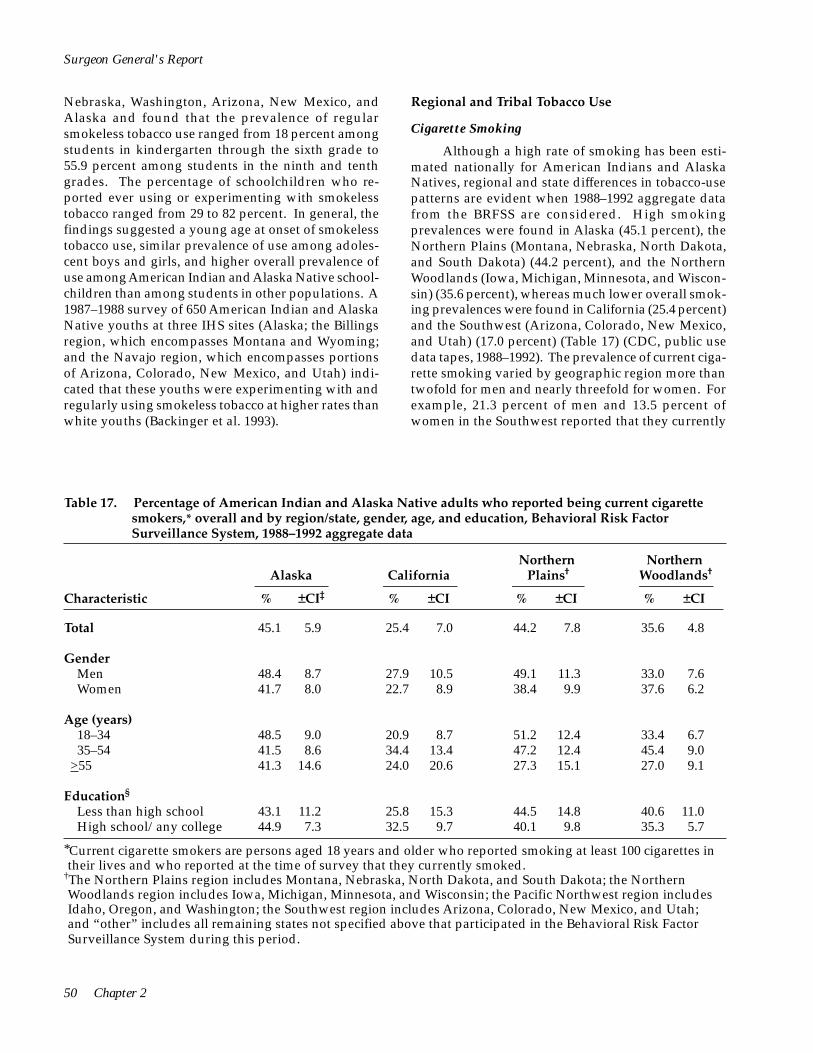
50 Chapter 2
Surgeon General's Report
Nebraska, Washington, Arizona, New Mexico, and Alaska and found that the prevalence of regular smokeless tobacco use ranged from 18 percent among students in kindergarten through the sixth grade to 55.9 percent among students in the ninth and tenth grades. The percentage of schoolchildren who reported ever using or experimenting with smokeless tobacco ranged from 29 to 82 percent. In general, the findings suggested a young age at onset of smokeless tobacco use, similar prevalence of use among adolescent boys and girls, and higher overall prevalence of use among American Indian and Alaska Native schoolchildren than among students in other populations. A 1987–1988 survey of 650 American Indian and Alaska Native youths at three IHS sites (Alaska; the Billings region, which encompasses Montana and Wyoming; and the Navajo region, which encompasses portions of Arizona, Colorado, New Mexico, and Utah) indicated that these youths were experimenting with and regularly using smokeless tobacco at higher rates than white youths (Backinger et al. 1993).
Regional and Tribal Tobacco Use
Cigarette Smoking
Although a high rate of smoking has been estimated nationally for American Indians and Alaska Natives, regional and state differences in tobacco-use patterns are evident when 1988–1992 aggregate data from the BRFSS are considered. High smoking prevalences were found in Alaska (45.1 percent), the Northern Plains (Montana, Nebraska, North Dakota, and South Dakota) (44.2 percent), and the Northern Woodlands (Iowa, Michigan, Minnesota, and Wisconsin) (35.6 percent), whereas much lower overall smoking prevalences were found in California (25.4 percent) and the Southwest (Arizona, Colorado, New Mexico, and Utah) (17.0 percent) (Table 17) (CDC, public use data tapes, 1988–1992). The prevalence of current cigarette smoking varied by geographic region more than twofold for men and nearly threefold for women. For example, 21.3 percent of men and 13.5 percent of women in the Southwest reported that they currently
Table 17. Percentage of American Indian and Alaska Native adults who reported being current cigarette smokers,* overall and by region/state, gender, age, and education, Behavioral Risk Factor Surveillance System, 1988–1992 aggregate data
Northern Plains†
% ±CI
Northern Woodlands†
% ±CI
Alaska
% ±CI‡
California
% ±CICharacteristic
Total 45.1 5.9 25.4 7.0 44.2 7.8 35.6 4.8
Gender Men 48.4 8.7 27.9 10.5 49.1 11.3 33.0 7.6 Women 41.7 8.0 22.7 8.9 38.4 9.9 37.6 6.2
Age (years) 18–34 48.5 9.0 20.9 8.7 51.2 12.4 33.4 6.7 35–54 41.5 8.6 34.4 13.4 47.2 12.4 45.4 9.0
>55 41.3 14.6 24.0 20.6 27.3 15.1 27.0 9.1
Education§
Less than high school 43.1 11.2 25.8 15.3 44.5 14.8 40.6 11.0 High school/any college 44.9 7.3 32.5 9.7 40.1 9.8 35.3 5.7
*Current cigarette smokers are persons aged 18 years and older who reported smoking at least 100 cigarettes in their lives and who reported at the time of survey that they currently smoked.
†The Northern Plains region includes Montana, Nebraska, North Dakota, and South Dakota; the Northern Woodlands region includes Iowa, Michigan, Minnesota, and Wisconsin; the Pacific Northwest region includes Idaho, Oregon, and Washington; the Southwest region includes Arizona, Colorado, New Mexico, and Utah; and “other” includes all remaining states not specified above that participated in the Behavioral Risk Factor Surveillance System during this period.

Patterns of Tobacco Use 51
Tobacco Use Among U.S. Racial/Ethnic Minority Groups
smoked, compared with 49.1 percent of men and 38.4 percent of women in the Northern Plains (Table 17).
The majority of American Indians and Alaska Natives (83.3 percent) responding to the BRFSS smoked 15 or fewer cigarettes per day; this finding was consistent across all states and regions (Table 18) (CDC, public use data tapes, 1988–1992). Overall, female American Indians and Alaska Natives smoked fewer cigarettes than their male counterparts—a finding that was consistent across all states and regions. American Indian smokers in the Northern Plains (13.5 percent) were the most likely to smoke 25 or more cigarettes per day. American Indian smokers in the Southwest (51.2 percent) and the Pacific Northwest (46.8 percent) had the highest prevalence of cessation, whereas American Indians in the Northern Plains (31.8 percent) and Alaska Natives (37.0 percent) had the lowest prevalence of cessation (Table 19) (CDC, public use data tapes, 1988–1992).
In similar analyses of the BRFSS data aggregated for 1985–1988, the prevalence of smoking
varied markedly by gender and geographic region (Sugarman et al. 1992). For American Indian men, the prevalence of smoking was highest among those living in the Plains region (Iowa, Minnesota, Montana, Nebraska, North Dakota, South Dakota, and Wisconsin) (48.4 percent), followed by those in the West Coast region (California, Idaho, and Washington) (25.2 percent) and the Southwest (Arizona, New Mexico, and Utah) (18.1 percent). Similarly, for American Indian women, the prevalence of smoking was highest among those living in the Plains region (57.3 percent), followed by those in the West Coast region (31.6 percent) and the Southwest (14.7 percent).
Regional and tribal data on cigarette smoking are also available from a probability sample of American Indians living on or near the northern Montana Blackfeet Reservation and those served by the Native American Center in Great Falls, Montana, in 1987 (Goldberg et al. 1991). Among Blackfeet Indians, 34 percent of men and 50 percent of women reported that they smoked cigarettes. Among American Indians in
Pacific Northwest†
% ±CI
Oklahoma
% ±CI
Southwest†
% ±CI
Other†
% ±CI
Total
% ±CI
30.4 7.3 33.1 6.0 17.0 4.6 28.9 4.2 29.2 2.5
36.2 12.7 35.4 9.2 21.3 8.2 36.5 6.4 34.4 4.0 26.0 8.9 31.2 7.9 13.5 5.0 21.3 5.2 24.2 3.1
33.5 12.6 37.6 9.6 13.3 5.6 30.2 6.8 28.9 3.8 35.0 12.8 30.3 8.4 18.9 8.8 33.6 7.1 33.8 4.4 21.7 10.6 26.2 14.7 29.8 14.2 18.6 6.6 22.5 5.3
25.1 14.4 42.5 15.4 29.7 12.3 34.0 9.4 33.4 5.6 31.2 8.7 33.9 7.3 15.1 5.9 29.4 5.0 30.5 3.2
‡95% confidence interval. §Includes persons aged 25 years and older. Source: Centers for Disease Control, public use data tapes, 1988–1992.

Surgeon General's Report
Table 18. Percentage of adult American Indian and Alaska Native smokers* who reported smoking <15, 15–24, or ≥25 cigarettes per day, overall and by region/state, gender, age, and education, Behavioral Risk Factor Surveillance System, 1988–1992 aggregate data
Northern Plains†
% ±CI
Northern Woodlands†
% ±CI
Alaska
% ±CI‡
California
% ±CICharacteristic
Total <15 cigarettes 83.7 4.1 88.0 5.0 70.9 7.5 84.6 3.6
15–24 cigarettes 12.2 3.7 8.5 4.4 15.7 5.5 12.3 3.3 ≥ 25 cigarettes 4.1 2.2 3.5 2.7 13.5 6.5 3.1 1.6
Gender Men
<15 cigarettes 79.3 7.0 87.7 7.4 66.8 11.4 83.9 5.5 15–24 cigarettes 15.2 6.1 8.3 6.4 14.3 7.8 11.7 5.0
≥ 25 cigarettes 5.5 4.0 4.0 4.1 19.0 10.4 4.4 2.6
Women <15 cigarettes 88.2 4.2 88.2 6.8 75.8 8.8 85.2 4.6
15–24 cigarettes 9.0 3.9 8.8 5.9 17.3 7.7 12.7 4.3 ≥ 25 cigarettes 2.7 1.9 3.0 3.5 6.9 5.4 2.1 2.0
Age (years) 18–34
<15 cigarettes 87.7 5.1 90.8 5.8 68.1 12.4 87.4 4.5 15–24 cigarettes 8.7 3.8 5.4 4.4 18.8 9.5 10.9 4.2
≥ 25 cigarettes 3.6 3.7 3.8 4.0 13.0 10.6 1.7 1.6
35–54 <15 cigarettes 78.5 7.4 82.1 11.0 65.6 12.0 79.5 7.4
15–24 cigarettes 15.6 6.9 16.2 10.8 16.3 8.7 14.9 6.7 ≥ 25 cigarettes 6.0 3.5 1.7 2.5 18.1 10.6 5.6 4.0
≥55 <15 cigarettes 80.7 12.3 89.1 12.8 83.5 13.7 84.9 7.4
15–24 cigarettes 16.8 12.2 5.1 9.9 8.9 9.8 12.1 6.8 ≥ 25 cigarettes 2.6 2.1 5.8 8.4 7.6 10.9 3.0 3.1
Education§
Less than high school <15 cigarettes 85.0 7.7 90.6 9.9 66.3 14.8 81.7 7.3
15–24 cigarettes 12.0 7.6 5.1 5.8 13.3 10.5 14.9 6.7 ≥ 25 cigarettes 3.0 2.0 4.4 8.3 20.4 13.5 3.4 3.1
High school/any college <15 cigarettes 78.2 6.2 83.1 7.7 74.1 8.9 84.2 4.6
15–24 cigarettes 15.8 5.3 13.2 7.2 16.3 7.4 12.0 4.1 ≥ 25 cigarettes 6.1 4.0 3.7 3.2 9.6 6.3 3.9 2.4
*Current cigarette smokers are persons aged 18 years and older who reported smoking at least 100 cigarettes in their lives and who reported at the time of survey that they currently smoked.
†The Northern Plains region includes Montana, Nebraska, North Dakota, and South Dakota; the Northern Woodlands region includes Iowa, Michigan, Minnesota, and Wisconsin; the Pacific Northwest region includes Idaho, Oregon, and Washington; the Southwest region includes Arizona, Colorado, New Mexico, and Utah; and “other” includes all remaining states not specified above that participated in the Behavioral Risk Factor Surveillance System during this period.
52 Chapter 2
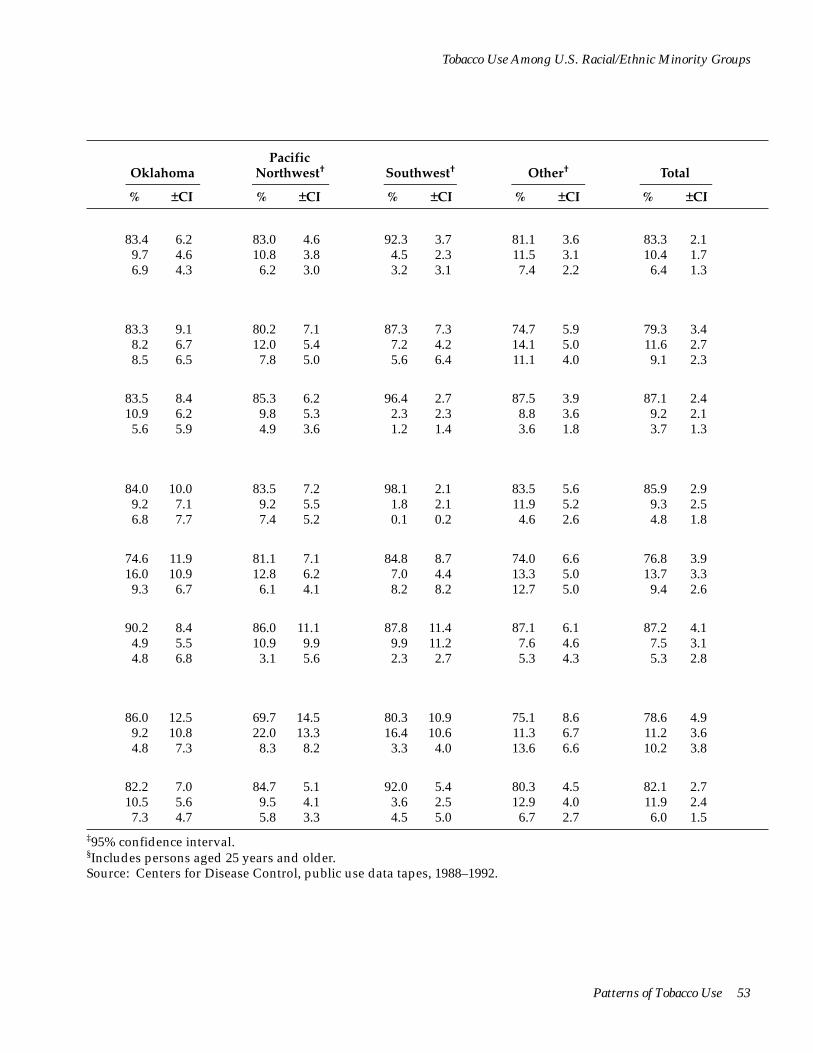
Tobacco Use Among U.S. Racial/Ethnic Minority Groups
Pacific Northwest†
% ±CI
Oklahoma
% ±CI
Southwest†
% ±CI
Other†
% ±CI
Total
% ±CI
83.4 6.2 83.0 4.6 92.3 3.7 81.1 3.6 83.3 2.1 9.7 4.6 10.8 3.8 4.5 2.3 11.5 3.1 10.4 1.7 6.9 4.3 6.2 3.0 3.2 3.1 7.4 2.2 6.4 1.3
83.3 9.1 80.2 7.1 87.3 7.3 74.7 5.9 79.3 3.4 8.2 6.7 12.0 5.4 7.2 4.2 14.1 5.0 11.6 2.7 8.5 6.5 7.8 5.0 5.6 6.4 11.1 4.0 9.1 2.3
83.5 8.4 85.3 6.2 96.4 2.7 87.5 3.9 87.1 2.4 10.9 6.2 9.8 5.3 2.3 2.3 8.8 3.6 9.2 2.1 5.6 5.9 4.9 3.6 1.2 1.4 3.6 1.8 3.7 1.3
84.0 10.0 83.5 7.2 98.1 2.1 83.5 5.6 85.9 2.9 9.2 7.1 9.2 5.5 1.8 2.1 11.9 5.2 9.3 2.5 6.8 7.7 7.4 5.2 0.1 0.2 4.6 2.6 4.8 1.8
74.6 11.9 81.1 7.1 84.8 8.7 74.0 6.6 76.8 3.9 16.0 10.9 12.8 6.2 7.0 4.4 13.3 5.0 13.7 3.3 9.3 6.7 6.1 4.1 8.2 8.2 12.7 5.0 9.4 2.6
90.2 8.4 86.0 11.1 87.8 11.4 87.1 6.1 87.2 4.1 4.9 5.5 10.9 9.9 9.9 11.2 7.6 4.6 7.5 3.1 4.8 6.8 3.1 5.6 2.3 2.7 5.3 4.3 5.3 2.8
86.0 12.5 69.7 14.5 80.3 10.9 75.1 8.6 78.6 4.9 9.2 10.8 22.0 13.3 16.4 10.6 11.3 6.7 11.2 3.6 4.8 7.3 8.3 8.2 3.3 4.0 13.6 6.6 10.2 3.8
82.2 7.0 84.7 5.1 92.0 5.4 80.3 4.5 82.1 2.7 10.5 5.6 9.5 4.1 3.6 2.5 12.9 4.0 11.9 2.4 7.3 4.7 5.8 3.3 4.5 5.0 6.7 2.7 6.0 1.5
‡95% confidence interval. §Includes persons aged 25 years and older. Source: Centers for Disease Control, public use data tapes, 1988–1992.
Patterns of Tobacco Use 53
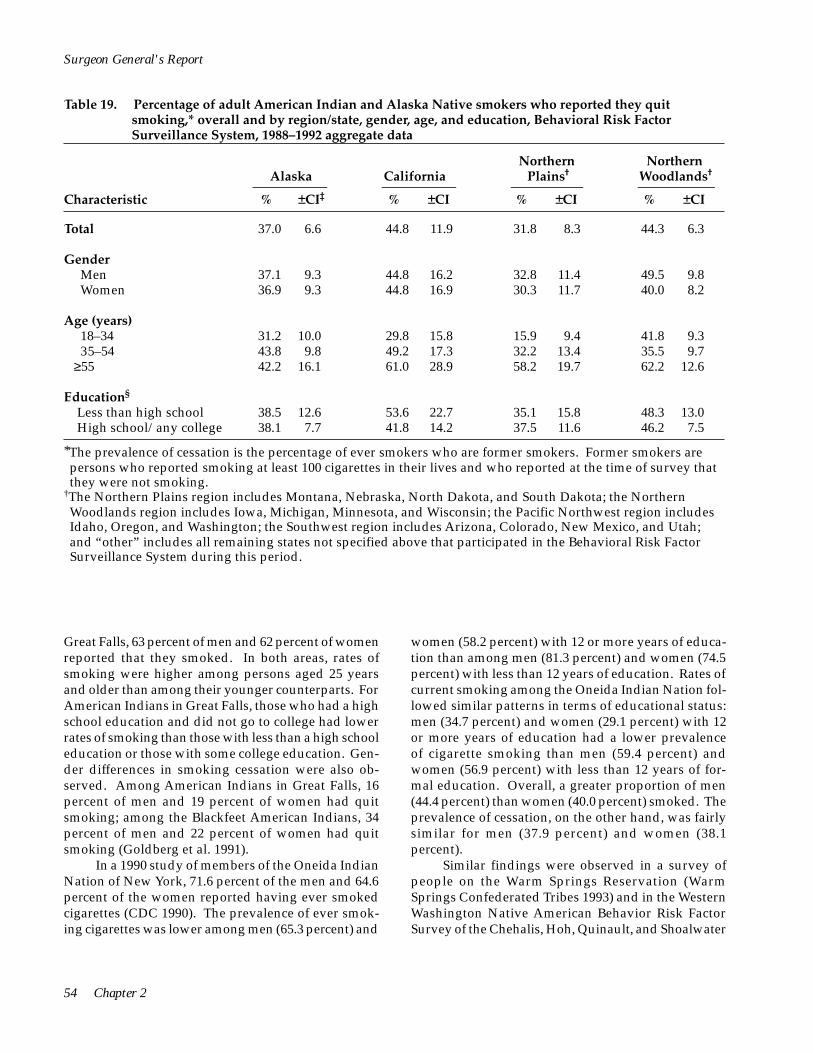
Surgeon General's Report
Table 19. Percentage of adult American Indian and Alaska Native smokers who reported they quit smoking,* overall and by region/state, gender, age, and education, Behavioral Risk Factor Surveillance System, 1988–1992 aggregate data
Northern Plains†
% ±CI
Northern Woodlands†
% ±CI
Alaska
% ±CI‡
California
% ±CICharacteristic
Total 37.0 6.6 44.8 11.9 31.8 8.3 44.3 6.3
Gender Men 37.1 9.3 44.8 16.2 32.8 11.4 49.5 9.8 Women 36.9 9.3 44.8 16.9 30.3 11.7 40.0 8.2
Age (years) 18–34 31.2 10.0 29.8 15.8 15.9 9.4 41.8 9.3 35–54 43.8 9.8 49.2 17.3 32.2 13.4 35.5 9.7 ≥55 42.2 16.1 61.0 28.9 58.2 19.7 62.2 12.6
Education§
Less than high school 38.5 12.6 53.6 22.7 35.1 15.8 48.3 13.0 High school/any college 38.1 7.7 41.8 14.2 37.5 11.6 46.2 7.5
*The prevalence of cessation is the percentage of ever smokers who are former smokers. Former smokers are persons who reported smoking at least 100 cigarettes in their lives and who reported at the time of survey that they were not smoking.
†The Northern Plains region includes Montana, Nebraska, North Dakota, and South Dakota; the Northern Woodlands region includes Iowa, Michigan, Minnesota, and Wisconsin; the Pacific Northwest region includes Idaho, Oregon, and Washington; the Southwest region includes Arizona, Colorado, New Mexico, and Utah; and “other” includes all remaining states not specified above that participated in the Behavioral Risk Factor Surveillance System during this period.
Great Falls, 63 percent of men and 62 percent of women reported that they smoked. In both areas, rates of smoking were higher among persons aged 25 years and older than among their younger counterparts. For American Indians in Great Falls, those who had a high school education and did not go to college had lower rates of smoking than those with less than a high school education or those with some college education. Gender differences in smoking cessation were also observed. Among American Indians in Great Falls, 16 percent of men and 19 percent of women had quit smoking; among the Blackfeet American Indians, 34 percent of men and 22 percent of women had quit smoking (Goldberg et al. 1991).
women (58.2 percent) with 12 or more years of education than among men (81.3 percent) and women (74.5 percent) with less than 12 years of education. Rates of current smoking among the Oneida Indian Nation followed similar patterns in terms of educational status: men (34.7 percent) and women (29.1 percent) with 12 or more years of education had a lower prevalence of cigarette smoking than men (59.4 percent) and women (56.9 percent) with less than 12 years of formal education. Overall, a greater proportion of men (44.4 percent) than women (40.0 percent) smoked. The prevalence of cessation, on the other hand, was fairly similar for men (37.9 percent) and women (38.1 percent).
In a 1990 study of members of the Oneida Indian Nation of New York, 71.6 percent of the men and 64.6 percent of the women reported having ever smoked cigarettes (CDC 1990). The prevalence of ever smoking cigarettes was lower among men (65.3 percent) and
Similar findings were observed in a survey of people on the Warm Springs Reservation (Warm Springs Confederated Tribes 1993) and in the Western Washington Native American Behavior Risk Factor Survey of the Chehalis, Hoh, Quinault, and Shoalwater
54 Chapter 2
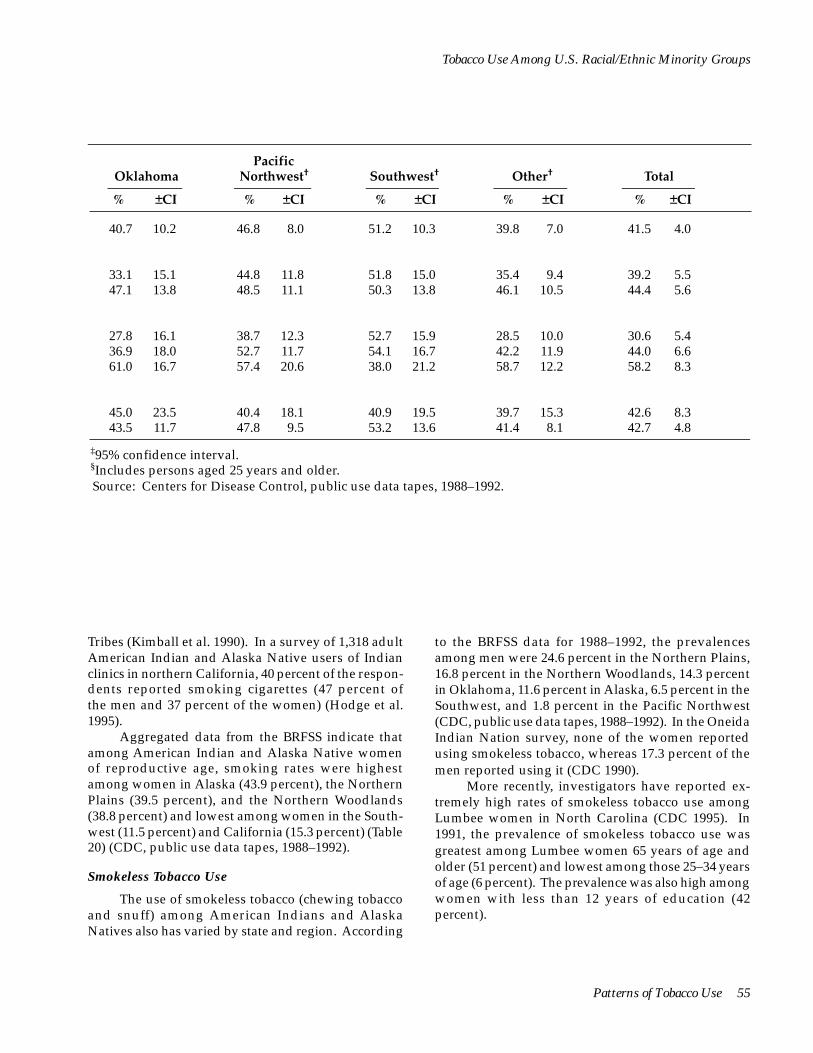
Tobacco Use Among U.S. Racial/Ethnic Minority Groups
Pacific Northwest†
% ±CI
Oklahoma
% ±CI
Southwest†
% ±CI
Other†
% ±CI
Total
% ±CI
40.7 10.2 46.8 8.0 51.2 10.3 39.8 7.0 41.5 4.0
33.1 15.1 44.8 11.8 51.8 15.0 35.4 9.4 39.2 5.5 47.1 13.8 48.5 11.1 50.3 13.8 46.1 10.5 44.4 5.6
27.8 16.1 38.7 12.3 52.7 15.9 28.5 10.0 30.6 5.4 36.9 18.0 52.7 11.7 54.1 16.7 42.2 11.9 44.0 6.6 61.0 16.7 57.4 20.6 38.0 21.2 58.7 12.2 58.2 8.3
45.0 23.5 40.4 18.1 40.9 19.5 39.7 15.3 42.6 8.3 43.5 11.7 47.8 9.5 53.2 13.6 41.4 8.1 42.7 4.8
‡95% confidence interval. §Includes persons aged 25 years and older. Source: Centers for Disease Control, public use data tapes, 1988–1992.
Tribes (Kimball et al. 1990). In a survey of 1,318 adult American Indian and Alaska Native users of Indian clinics in northern California, 40 percent of the respondents reported smoking cigarettes (47 percent of the men and 37 percent of the women) (Hodge et al. 1995).
Aggregated data from the BRFSS indicate that among American Indian and Alaska Native women of reproductive age, smoking rates were highest among women in Alaska (43.9 percent), the Northern Plains (39.5 percent), and the Northern Woodlands (38.8 percent) and lowest among women in the Southwest (11.5 percent) and California (15.3 percent) (Table 20) (CDC, public use data tapes, 1988–1992).
Smokeless Tobacco Use
to the BRFSS data for 1988–1992, the prevalences among men were 24.6 percent in the Northern Plains, 16.8 percent in the Northern Woodlands, 14.3 percent in Oklahoma, 11.6 percent in Alaska, 6.5 percent in the Southwest, and 1.8 percent in the Pacific Northwest (CDC, public use data tapes, 1988–1992). In the Oneida Indian Nation survey, none of the women reported using smokeless tobacco, whereas 17.3 percent of the men reported using it (CDC 1990).
The use of smokeless tobacco (chewing tobacco and snuff) among American Indians and Alaska Natives also has varied by state and region. According
More recently, investigators have reported extremely high rates of smokeless tobacco use among Lumbee women in North Carolina (CDC 1995). In 1991, the prevalence of smokeless tobacco use was greatest among Lumbee women 65 years of age and older (51 percent) and lowest among those 25–34 years of age (6 percent). The prevalence was also high among women with less than 12 years of education (42 percent).
Patterns of Tobacco Use 55

Surgeon General's Report
Table 20. Percentage of American Indian and Alaska Native women of reproductive age who reported being current cigarette smokers,* overall and by region/state, Behavioral Risk Factor Surveillance System, 1988–1992 aggregate data
Alaska California
Northern
Plains†
Northern
Woodlands†
% +CI‡ % +CI % +CI % +CI
43.9 9.3 15.3 9.1 39.5 12.3 38.8 7.1 Total
Oklahoma Pacific
Northwest† Southwest† Other†
% +CI
24.9 3.9
% +CI % +CI % +CI % +CI
30.4 12.5 32.6 9.7 11.5 5.4 26.7 7.1
*Current cigarette smokers are women aged 18–44 years who reported smoking at least 100 cigarettes in their lives and who reported at the time of survey that they currently smoked.
†The Northern Plains region includes Montana, Nebraska, North Dakota, and South Dakota; the Northern Woodlands region includes Iowa, Michigan, Minnesota, and Wisconsin; the Pacific Northwest region includes Idaho, Oregon, and Washington; the Southwest region includes Arizona, Colorado, New Mexico, and Utah; and “other” includes all remaining states not specified above that participated in the Behavioral Risk Factor Surveillance System during this period.
‡95% confidence interval. Source: Centers for Disease Control, public use data tapes, 1988–1992.
Asian Americans and Pacific Islanders
Data needed to assess long-term trends in cigarette smoking among Asian Americans and Pacific Islanders have been unavailable because U.S. surveys, census data, and other national databases have not always included detailed descriptions of race/ethnicity. Although data from specific Asian American and Pacific Islander groups and state surveys have provided information about cigarette smoking for certain racial/ethnic subgroups, these data have been limited in quantity and quality. The NHIS first included information about Asian Americans and Pacific Islanders in the 1978 survey. However, because the proportion of Asian Americans and Pacific Islanders in the United States is small, data from several years must be aggregated to increase the precision of estimates. Because of small sample sizes and aggregation of data, racial/ethnic subgroup differences in smoking behavior are masked. These differences are important because the category Asian American and Pacific Islander is heterogeneous in both culture and health behaviors. For example, this category includes about 32 different national and racial/ethnic subgroups (Austin et al. 1989; Hawks 1989) and nearly 500 languages and dialects (Chen 1993), and smoking patterns among these subgroups vary.
Prevalence of Cigarette Smoking
Between 1978 and 1995, the prevalence of smoking declined among Asian Americans and Pacific Islanders, according to NHIS data (Table 21) (NCHS, public use data tapes, 1978–1995). However, patterns between men and women differed. The cigarette smoking prevalence among Asian American and Pacific Islander men declined slightly, from 32.5 to 25.1 percent, whereas the prevalence of smoking among Asian American and Pacific Islander women declined approximately 60 percent, from 14.7 to 5.8 percent. Throughout this period, the prevalence of smoking among men remained more than twice that among women; in 1994–1995, men were 4.3 times more likely than women to report current smoking.
Number of Cigarettes Smoked Daily
From 1978 through 1995, the percentage of Asian American and Pacific Islander smokers who smoked fewer than 15 cigarettes per day increased significantly, according to the NHIS data (Table 22) (NCHS, public use data tapes, 1978–1995). Although large declines from 1978–1980 to 1992–1993 were observed in the prevalence
56 Chapter 2

Tobacco Use Among U.S. Racial/Ethnic Minority Groups
Table 21. Percentage of adult Asian Americans and Pacific Islanders who reported being current cigarette smokers,* overall and by gender, age, and education, National Health Interview Surveys, United States, 1978–1995 aggregate data
1978–1980† 1983–1985† 1987–1988† 1990–1991† 1992–1993† 1994–1995†
–––––––––– –––––––––– –––––––––– –––––––––– –––––––––– –––––––––– Characteristic % ±CI‡ % ±CI % ±CI % ±CI % ±CI % ±CI
Total 23.8 4.0 21.4 3.4 15.8 2.4 16.1 2.5 16.7 2.7 15.3 3.0
Gender Men 32.5 4.5 33.0 6.2 22.5 3.8 24.5 4.0 26.8 4.7 25.1 5.2 Women 14.7 6.6 9.6 3.5 9.2 2.8 6.6 2.0 6.8 2.7 5.8 2.3
Age (years) 18–34 22.5 5.8 21.6 4.6 16.3 3.5 15.5 3.2 15.7 4.2 17.6 5.3 35–54 28.7 8.5 20.8 4.8 16.1 3.6 17.1 4.6 21.0 4.7 15.5 4.3
>55 17.4 4.7 22.0 8.6 12.7 5.9 15.7 5.4 8.3 5.4 9.2 5.1
Education§
Less than high school 23.1 8.9 23.8 10.2 17.9 6.5 24.9 7.4 13.4 6.2 13.3 7.9 High school/any college 23.7 3.9 22.6 4.5 16.7 2.8 15.6 2.9 17.6 3.5 14.4 3.2
*Excludes Asian Americans and Pacific Islanders who indicated they were of Hispanic origin. For 1978–1991, current cigarette smokers include persons who reported smoking at least 100 cigarettes in their lives and who reported at the time of survey that they currently smoked. For 1992–1995, current smokers include persons who reported smoking at least 100 cigarettes in their lives and who reported at the time of survey that they currently smoked every day or on some days.
†1978, 1979, and 1980 data were combined; 1983 and 1985 data were combined; 1987 and 1988 data were combined; 1990 and 1991 data were combined; 1992 and 1993 data were combined; and 1994 and 1995 data were combined.
‡95% confidence interval. §Includes persons aged 25 years and older. Source: National Center for Health Statistics, public use data tapes, 1978–1995.
of smoking 25 or more cigarettes per day, recent estimates are imprecise and should be interpreted with caution.
Islanders aged 18 years and older who were daily smokers one year before the survey, 57.8 percent reported that they were still smoking daily and that they had not tried quitting for at least one day during the previous year (Table 4). Another 32.0 percent had tried quitting for at least one day, 4.8 percent were occasional smokers (i.e., smoked only on some days), 2.5 percent had not smoked for the past 1–90 days, and 2.9 percent had not smoked for the past 91–364 days. Among current smokers, Asian Americans and Pacific Islanders were slightly more likely than whites to report trying to quit for at least a day during the previous year.
Quitting Behavior
Between 1978 and 1995, the percentage of Asian Americans and Pacific Islanders who have ever smoked 100 cigarettes and have quit smoking increased some-what, NHIS data indicate (Table 23) (NCHS, public use data tapes, 1978–1995). The prevalence of cessation among women increased from 1987–1988 to 1994–1995, but no consistent pattern was observed among men. During each survey period, the prevalence of cessation was higher among Asian Americans and Pacific Island-ers 55 years of age and older than it was among their younger counterparts (Table 23).
Women of Reproductive Age
The prevalence of current smoking among Asian American and Pacific Islander women of reproductive age (18–44 years) has decreased substantially over
Data from the NCI Supplement of the 1992–1993 CPS indicate that among Asian Americans and Pacific
Patterns of Tobacco Use 57

<
<
<
<
<
<
<
Surgeon General's Report
Table 22. Percentage of adult Asian American and Pacific Islander smokers* who reported smoking <15, 15–24, or >25 cigarettes per day, overall and by gender, age, and education, National Health Interview Surveys, United States, 1978–1995 aggregate data
1978–1980† 1983–1985† 1987–1988† 1990–1991† 1992–1993† 1994–1995†
–––––––––– –––––––––– –––––––––– –––––––––– –––––––––– –––––––––– Characteristic % ±CI‡ % ±CI % ±CI % ±CI % ±CI % ±CI
Total <15 cigarettes 43.3 11.7 53.7 8.1 55.6 7.8 60.4 8.1 61.8 9.4 70.6 9.8
15–24 cigarettes 37.0 9.7 35.3 8.5 37.4 7.4 33.8 7.6 37.1 9.4 21.4 8.2 >25 cigarettes 19.7 6.5 11.0 6.5 7.0 3.3 5.8 3.9 1.0 1.3 8.0 6.5
Gender Men
<15 cigarettes 40.1 14.6 54.4 9.4 51.8 9.6 59.2 9.2 58.4 11.2 69.1 11.5 15–24 cigarettes 35.8 11.1 36.2 9.3 41.2 9.2 35.4 8.6 40.9 11.2 23.6 10.0
>25 cigarettes 24.1 8.2 9.4 6.6 7.0 4.2 5.5 4.4 0.7 1.4 7.3 7.4 Women
<15 cigarettes 50.4 13.7 51.1 14.9 64.4 11.3 65.8 16.8 75.4 11.6 77.3 13.9 15–24 cigarettes 39.6 12.8 32.0 15.2 28.5 9.8 26.8 16.5 22.2 11.5 11.5 11.0
>25 cigarettes 10.0 7.7 16.8 10.1 7.1 5.1 7.4 8.3 2.3 3.3 11.2 11.1 Age (years)
18–34 <15 cigarettes 42.2 12.2 48.2 10.4 59.0 11.0 60.3 10.7 61.3 13.7 73.2 13.6
15–24 cigarettes 37.3 11.5 40.5 11.5 35.1 10.5 35.2 10.5 38.2 13.7 24.3 13.2 >25 cigarettes 20.5 8.2 11.3 8.3 5.9 4.4 4.5 3.8 0.6 1.1 2.5 3.9
35–54 <15 cigarettes 45.0 17.1 54.9 13.5 54.5 10.9 62.9 13.5 63.6 13.0 65.0 15.2
15–24 cigarettes 35.5 15.0 32.2 13.1 40.4 11.0 26.9 10.5 34.9 12.9 22.3 11.8 >25 cigarettes 19.5 9.0 12.9 8.1 5.1 4.6 10.1 9.2 1.6 2.3 12.8 14.0
>55 <15 cigarettes 41.3 18.5 67.9 20.3 41.5 23.2 55.8 18.5 52.7 39.1 78.0 23.9
15–24 cigarettes 40.9 13.1 26.4 18.4 39.4 25.0 43.3 18.5 47.3 39.1 4.7 9.3 >25 cigarettes 17.9 14.4 5.7 8.2 19.1 16.5 0.9 1.8 0.0 0.0 17.3 23.4
Education§
Less than high school <15 cigarettes 59.6 21.3 66.0 15.2 48.7 19.6 72.9 13.9 80.2 17.3 73.8 32.2
15–24 cigarettes 28.6 18.0 23.3 14.2 42.4 19.8 22.2 13.3 19.8 17.3 6.2 9.5 >25 cigarettes 11.8 13.2 10.7 9.8 8.9 9.5 4.8 6.0 0.0 0.0 20.0 32.8
High school/any college <15 cigarettes 40.4 12.4 47.6 9.6 53.0 8.4 58.1 9.8 62.2 11.4 64.8 12.0
15–24 cigarettes 39.4 11.8 39.3 10.2 39.4 8.2 34.7 9.3 36.7 11.4 26.5 10.7 >25 cigarettes 20.2 7.4 13.0 8.1 7.6 4.2 7.2 5.5 1.1 1.6 8.7 7.5
*Excludes Asian Americans and Pacific Islanders who indicated they were of Hispanic origin. For 1978–1991, current cigarette smokers included persons who reported smoking at least 100 cigarettes in their lives and who reported at the time of survey that they currently smoked. For 1992–1995, current smokers included persons who reported smoking at least 100 cigarettes in their lives and who reported at the time of survey that they currently smoked every day or on some days.
†1978, 1979, and 1980 data were combined; 1983 and 1985 data were combined; 1987 and 1988 data were combined; 1990 and 1991 data were combined; 1992 and 1993 data were combined; and 1994 and 1995 data were combined.
‡95% confidence interval. §Includes persons aged 25 years and older. Source: National Center for Health Statistics, public use data tapes, 1978–1995.
58 Chapter 2
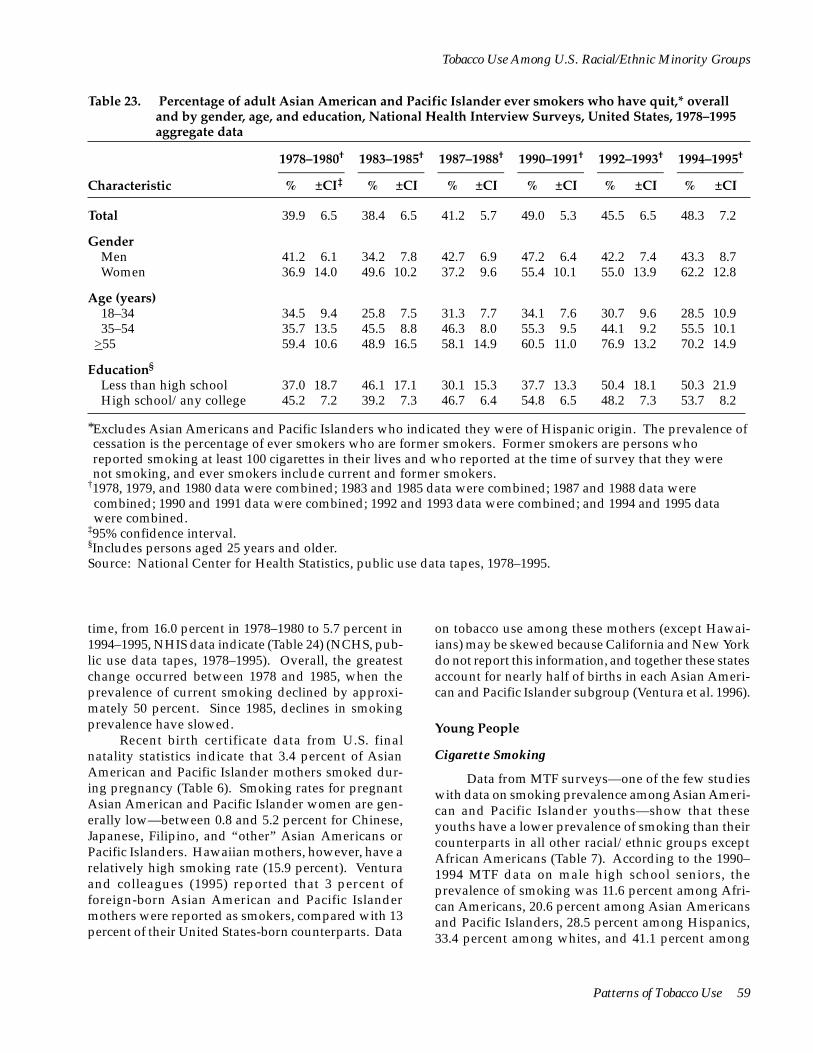
Tobacco Use Among U.S. Racial/Ethnic Minority Groups
Table 23. Percentage of adult Asian American and Pacific Islander ever smokers who have quit,* overall and by gender, age, and education, National Health Interview Surveys, United States, 1978–1995 aggregate data
1978–1980† 1983–1985† 1987–1988† 1990–1991† 1992–1993† 1994–1995†
–––––––––– –––––––––– –––––––––– –––––––––– –––––––––– –––––––––– Characteristic % ±CI‡ % ±CI % ±CI % ±CI % ±CI % ±CI
Total 39.9 6.5 38.4 6.5 41.2 5.7 49.0 5.3 45.5 6.5 48.3 7.2
Gender Men 41.2 6.1 34.2 7.8 42.7 6.9 47.2 6.4 42.2 7.4 43.3 8.7 Women 36.9 14.0 49.6 10.2 37.2 9.6 55.4 10.1 55.0 13.9 62.2 12.8
Age (years) 18–34 34.5 9.4 25.8 7.5 31.3 7.7 34.1 7.6 30.7 9.6 28.5 10.9 35–54 35.7 13.5 45.5 8.8 46.3 8.0 55.3 9.5 44.1 9.2 55.5 10.1
>55 59.4 10.6 48.9 16.5 58.1 14.9 60.5 11.0 76.9 13.2 70.2 14.9
Education§
Less than high school 37.0 18.7 46.1 17.1 30.1 15.3 37.7 13.3 50.4 18.1 50.3 21.9 High school/any college 45.2 7.2 39.2 7.3 46.7 6.4 54.8 6.5 48.2 7.3 53.7 8.2
*Excludes Asian Americans and Pacific Islanders who indicated they were of Hispanic origin. The prevalence of cessation is the percentage of ever smokers who are former smokers. Former smokers are persons who reported smoking at least 100 cigarettes in their lives and who reported at the time of survey that they were not smoking, and ever smokers include current and former smokers.
†1978, 1979, and 1980 data were combined; 1983 and 1985 data were combined; 1987 and 1988 data were combined; 1990 and 1991 data were combined; 1992 and 1993 data were combined; and 1994 and 1995 data were combined.
‡95% confidence interval. §Includes persons aged 25 years and older. Source: National Center for Health Statistics, public use data tapes, 1978–1995.
time, from 16.0 percent in 1978–1980 to 5.7 percent in 1994–1995, NHIS data indicate (Table 24) (NCHS, public use data tapes, 1978–1995). Overall, the greatest change occurred between 1978 and 1985, when the prevalence of current smoking declined by approximately 50 percent. Since 1985, declines in smoking prevalence have slowed.
Recent birth certificate data from U.S. final natality statistics indicate that 3.4 percent of Asian American and Pacific Islander mothers smoked during pregnancy (Table 6). Smoking rates for pregnant Asian American and Pacific Islander women are generally low—between 0.8 and 5.2 percent for Chinese, Japanese, Filipino, and “other” Asian Americans or Pacific Islanders. Hawaiian mothers, however, have a relatively high smoking rate (15.9 percent). Ventura and colleagues (1995) reported that 3 percent of foreign-born Asian American and Pacific Islander mothers were reported as smokers, compared with 13 percent of their United States-born counterparts. Data
on tobacco use among these mothers (except Hawaiians) may be skewed because California and New York do not report this information, and together these states account for nearly half of births in each Asian American and Pacific Islander subgroup (Ventura et al. 1996).
Young People
Cigarette Smoking
Data from MTF surveys—one of the few studies with data on smoking prevalence among Asian American and Pacific Islander youths—show that these youths have a lower prevalence of smoking than their counterparts in all other racial/ethnic groups except African Americans (Table 7). According to the 1990– 1994 MTF data on male high school seniors, the prevalence of smoking was 11.6 percent among African Americans, 20.6 percent among Asian Americans and Pacific Islanders, 28.5 percent among Hispanics, 33.4 percent among whites, and 41.1 percent among
Patterns of Tobacco Use 59
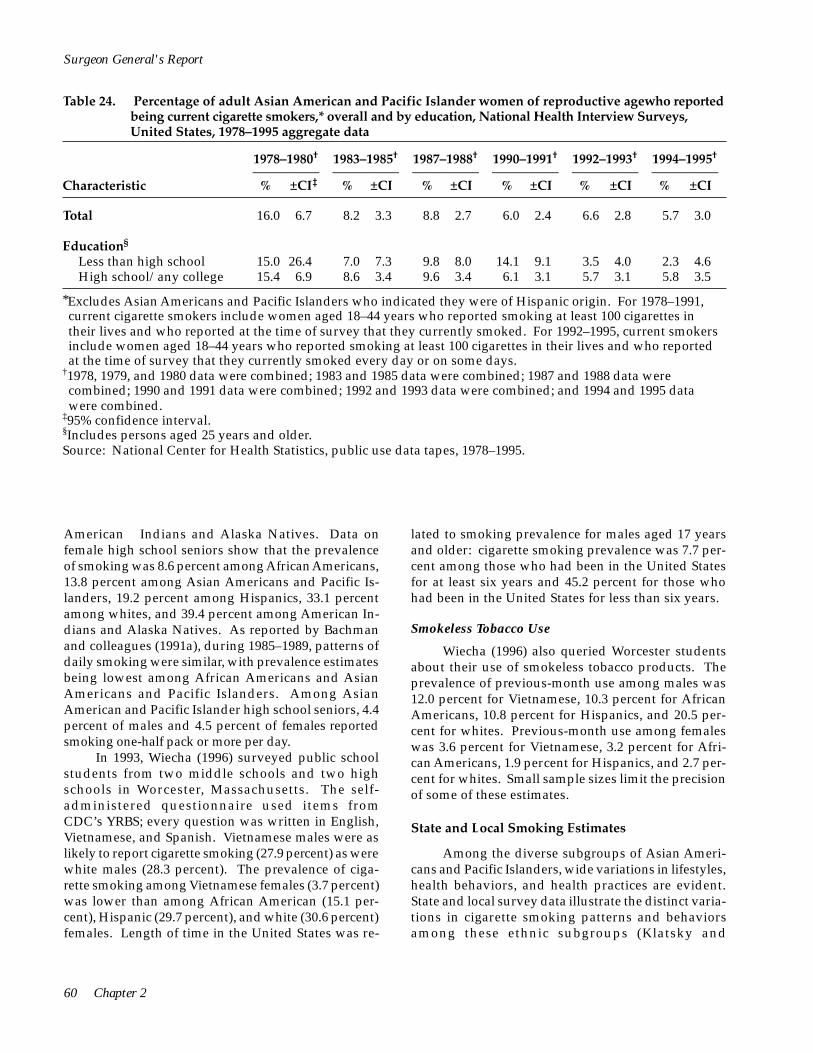
1978–1980† 1983–1985† 1987–1988† 1990–1991† 1992–1993† 1994–1995†
–––––––––– –––––––––– –––––––––– –––––––––– –––––––––– –––––––––– Characteristic % ±CI‡ % ±CI % ±CI % ±CI % ±CI % ±CI
Total 16.0 6.7 8.2 3.3 8.8 2.7 6.0 2.4 6.6 2.8 5.7 3.0
Education§
Less than high school 15.0 26.4 7.0 7.3 9.8 8.0 14.1 9.1 3.5 4.0 2.3 4.6 High school/any college 15.4 6.9 8.6 3.4 9.6 3.4 6.1 3.1 5.7 3.1 5.8 3.5
Surgeon General's Report
Table 24. Percentage of adult Asian American and Pacific Islander women of reproductive age who reported being current cigarette smokers,* overall and by education, National Health Interview Surveys, United States, 1978–1995 aggregate data
*Excludes Asian Americans and Pacific Islanders who indicated they were of Hispanic origin. For 1978–1991, current cigarette smokers include women aged 18–44 years who reported smoking at least 100 cigarettes in their lives and who reported at the time of survey that they currently smoked. For 1992–1995, current smokers include women aged 18–44 years who reported smoking at least 100 cigarettes in their lives and who reported at the time of survey that they currently smoked every day or on some days.
†1978, 1979, and 1980 data were combined; 1983 and 1985 data were combined; 1987 and 1988 data were combined; 1990 and 1991 data were combined; 1992 and 1993 data were combined; and 1994 and 1995 data were combined.
‡95% confidence interval. §Includes persons aged 25 years and older. Source: National Center for Health Statistics, public use data tapes, 1978–1995.
American Indians and Alaska Natives. Data on female high school seniors show that the prevalence of smoking was 8.6 percent among African Americans, 13.8 percent among Asian Americans and Pacific Islanders, 19.2 percent among Hispanics, 33.1 percent among whites, and 39.4 percent among American Indians and Alaska Natives. As reported by Bachman and colleagues (1991a), during 1985–1989, patterns of daily smoking were similar, with prevalence estimates being lowest among African Americans and Asian Americans and Pacific Islanders. Among Asian American and Pacific Islander high school seniors, 4.4 percent of males and 4.5 percent of females reported smoking one-half pack or more per day.
In 1993, Wiecha (1996) surveyed public school students from two middle schools and two high schools in Worcester, Massachusetts. The self-administered questionnaire used items from CDC’s YRBS; every question was written in English, Vietnamese, and Spanish. Vietnamese males were as likely to report cigarette smoking (27.9 percent) as were white males (28.3 percent). The prevalence of cigarette smoking among Vietnamese females (3.7 percent) was lower than among African American (15.1 percent), Hispanic (29.7 percent), and white (30.6 percent) females. Length of time in the United States was re
lated to smoking prevalence for males aged 17 years and older: cigarette smoking prevalence was 7.7 percent among those who had been in the United States for at least six years and 45.2 percent for those who had been in the United States for less than six years.
Smokeless Tobacco Use
Wiecha (1996) also queried Worcester students about their use of smokeless tobacco products. The prevalence of previous-month use among males was 12.0 percent for Vietnamese, 10.3 percent for African Americans, 10.8 percent for Hispanics, and 20.5 percent for whites. Previous-month use among females was 3.6 percent for Vietnamese, 3.2 percent for African Americans, 1.9 percent for Hispanics, and 2.7 percent for whites. Small sample sizes limit the precision of some of these estimates.
State and Local Smoking Estimates
Among the diverse subgroups of Asian Americans and Pacific Islanders, wide variations in lifestyles, health behaviors, and health practices are evident. State and local survey data illustrate the distinct variations in cigarette smoking patterns and behaviors among these ethnic subgroups (Klatsky and
60 Chapter 2
Tobacco Use Among U.S. Racial/Ethnic Minority Groups
Armstrong 1991; CDC 1992c; Blaisdell 1993; McPhee et al. 1993; McPhee et al. 1995; Wewers et al. 1995; Jenkins et al. 1997b). Although prevalence estimates from national surveys indicate that the smoking prevalence among Asian Americans and Pacific Islanders is lower than the prevalence of smoking in all other racial/ethnic groups and in the overall U.S. population, state and local surveys show that these estimates vary dramatically between racial/ethnic subgroups of Asian Americans and Pacific Islanders. Racial/ethnic subgroup-specific information on smoking behaviors is needed because broad groupings of these many distinct racial/ethnic groups mask important differences.
To characterize smoking and other risk behaviors more fully for program planning efforts at the local level, the California State Department of Health Services and two California agencies—Asian Health Services and the University of California, San Francisco, Vietnamese Health Promotion Project—adapted versions of the CDC’s Behavioral Risk Factor Surveys for use with Chinese and Vietnamese residents. The questionnaires were modified for cultural appropriateness and translated into Chinese or Vietnamese. The Chinese-language survey included face-to-face interviews with 296 Chinese adults in Oakland, California, between June 1989 and February 1990. In the Vietnamese-language survey, telephone interviews were conducted with 1,011 Vietnamese adults during February and March 1991 (CDC 1992b). Among both Chinese and Vietnamese respondents, men were more likely than women to be current smokers. The highest smoking prevalence was among men aged 25–44 years, and the prevalence of smoking was lower among men with higher levels of education (Table 25) (CDC 1992b). The mean number of cigarettes smoked per day by smokers was 15.9 among Chinese men, 11.0 among Vietnamese women, and 10.1 among Vietnamese men. This number declined with older age and increasing levels of education and income. (Data on Chinese women are unavailable because the number of Chinese women who smoked was too small for analysis.)
These surveys also measured acculturation by using several proxy variables, including the percentage of lifetime spent in the United States, fluency in English, and date of immigration. Among Chinese men, the average number of cigarettes smoked per day increased as the percentage of their lifetime spent in the United States increased (Table 25). Among Vietnamese respondents, the prevalence of smoking was higher among men who immigrated in 1981 or later and who were not fluent in English.
In a more recent statewide telephone survey of 32,125 California households, Burns and Pierce (1992) found that overall, the prevalence of smoking was lower among Asian Americans and Pacific Islanders than among whites, African Americans, and Hispanics. This trend was evident among both men and women. Because the survey was conducted only in English or Spanish, Asian Americans and Pacific Islanders with limited English fluency were unable to participate. This exclusion of recent immigrants and those with the lowest levels of acculturation may have produced a biased estimate of the prevalence of cigarette smoking among California’s Asian Americans and Pacific Islanders. In assessing the smoking prevalence for several racial/ethnic subgroups, Burns and Pierce (1992) found that Chinese reported the lowest prevalence of smoking (11.7 percent), whereas Koreans reported the highest prevalence (23.5 percent) (Table 26). Men in all racial/ethnic subgroups were substantially more likely than women to smoke cigarettes. For men, the prevalence of smoking was highest among Koreans (35.8 percent) and lowest among Chinese (19.1 percent). The prevalence of smoking was highest among men aged 25–44 years. Smoking prevalence declined substantially with increasing education across all racial/ethnic subgroups of men except Japanese men. For women, the prevalence of smoking was highest among Japanese (14.9 percent) and Koreans (13.6 percent) and lowest among Chinese (4.7 percent). Smoking prevalence declined with increasing level of education across all racial/ethnic subgroups of women except Chinese.
In a 1978–1985 survey of 13,031 persons of Asian ancestry enrolled in the Oakland, California, Kaiser Permanente Medical Care Program, the prevalence of cigarette smoking varied significantly by Asian subgroup for both men and women (Klatsky and Armstrong 1991). Among men, the prevalence of cigarette smoking was highest among Filipinos (32.9 percent) and lowest among Chinese (16.2 percent) (Table 27). Among women, the prevalence of smoking was highest among Japanese (18.6 percent) and lowest among Chinese (7.3 percent). Japanese men and women were more likely to smoke one or more packs of cigarettes per day than were their counterparts in other racial/ethnic groups.
During 1989, newly arrived Southeast Asian immigrants were surveyed by the Health Department in King County, Washington, regarding health problems and health risk behaviors (CDC 1992c). Investigators analyzed medical interview records for 274 Vietnamese, 147 Laotian, and 112 Cambodian immigrants and found that the smoking prevalence was substantially
Patterns of Tobacco Use 61
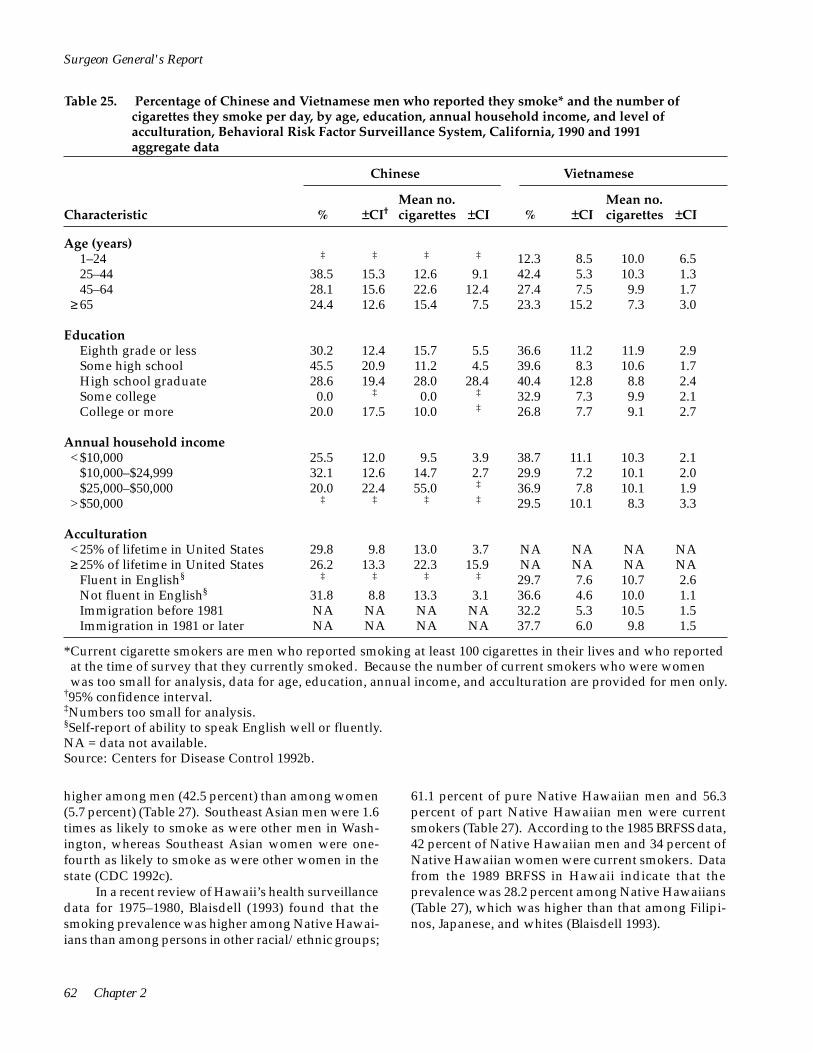
Surgeon General's Report
Table 25. Percentage of Chinese and Vietnamese men who reported they smoke* and the number of cigarettes they smoke per day, by age, education, annual household income, and level of acculturation, Behavioral Risk Factor Surveillance System, California, 1990 and 1991 aggregate data
Chinese Vietnamese
Mean no. Mean no. Characteristic % ±CI† cigarettes ±CI % ±CI cigarettes ±CI
Age (years) 1–24 ‡ ‡ ‡ ‡ 12.3 8.5 10.0 6.5 25–44 38.5 15.3 12.6 9.1 42.4 5.3 10.3 1.3 45–64 28.1 15.6 22.6 12.4 27.4 7.5 9.9 1.7
≥ 65 24.4 12.6 15.4 7.5 23.3 15.2 7.3 3.0
Education Eighth grade or less 30.2 12.4 15.7 5.5 36.6 11.2 11.9 2.9 Some high school 45.5 20.9 11.2 4.5 39.6 8.3 10.6 1.7 High school graduate Some college College or more
28.6 19.4 28.0 28.4 40.4 12.8 8.8 2.4 0.0 ‡ 0.0 ‡ 32.9 7.3 9.9 2.1
20.0 17.5 10.0 ‡ 26.8 7.7 9.1 2.7
Annual household income <$10,000 25.5 12.0 9.5 3.9 38.7 11.1 10.3 2.1
$10,000–$24,999 32.1 12.6 14.7 2.7 29.9 7.2 10.1 2.0 $25,000–$50,000 20.0 22.4 55.0 ‡ 36.9 7.8 10.1 1.9
>$50,000 ‡ ‡ ‡ ‡ 29.5 10.1 8.3 3.3
Acculturation <25% of lifetime in United States 29.8 9.8 13.0 3.7 NA NA NA NA ≥ 25% of lifetime in United States 26.2 13.3 22.3 15.9 NA NA NA NA
Fluent in English§
Not fluent in English§
‡ ‡ ‡ ‡ 29.7 7.6 10.7 2.6 31.8 8.8 13.3 3.1 36.6 4.6 10.0 1.1
Immigration before 1981 NA NA NA NA 32.2 5.3 10.5 1.5 Immigration in 1981 or later NA NA NA NA 37.7 6.0 9.8 1.5
*Current cigarette smokers are men who reported smoking at least 100 cigarettes in their lives and who reported at the time of survey that they currently smoked. Because the number of current smokers who were women was too small for analysis, data for age, education, annual income, and acculturation are provided for men only.
†95% confidence interval. ‡Numbers too small for analysis.§Self-report of ability to speak English well or fluently. NA = data not available. Source: Centers for Disease Control 1992b.
higher among men (42.5 percent) than among women (5.7 percent) (Table 27). Southeast Asian men were 1.6 times as likely to smoke as were other men in Wash-ington, whereas Southeast Asian women were one-fourth as likely to smoke as were other women in the state (CDC 1992c).
61.1 percent of pure Native Hawaiian men and 56.3 percent of part Native Hawaiian men were current smokers (Table 27). According to the 1985 BRFSS data, 42 percent of Native Hawaiian men and 34 percent of Native Hawaiian women were current smokers. Data from the 1989 BRFSS in Hawaii indicate that the prevalence was 28.2 percent among Native Hawaiians (Table 27), which was higher than that among Filipinos, Japanese, and whites (Blaisdell 1993).
In a recent review of Hawaii’s health surveillance data for 1975–1980, Blaisdell (1993) found that the smoking prevalence was higher among Native Hawai-ians than among persons in other racial/ethnic groups;
62 Chapter 2

Tobacco Use Among U.S. Racial/Ethnic Minority Groups
Table 26. Percentage of adult Asian Americans and Pacific Islanders who reported being current smokers,* overall and by gender, age, and education, Screener Survey, California, 1990 and 1991 aggregate data†
Characteristic Chinese (%) Filipinos (%) Japanese (%) Koreans (%) All Asians (%)
Total 11.7 15.9 17.4 23.5 15.9
Age (years) 18–24 9.7 12.2 19.7 26.9 14.6 25–44 12.4 21.0 20.3 26.1 18.1 45–64 11.4 14.4 16.8 16.2 15.3
>65 11.4 6.6 9.9 23.2 8.9
Education Less than high school 17.6 19.2 23.4 38.1 21.4 High school 16.7 20.3 21.5 21.3 19.4 Some college 11.2 15.2 16.2 25.3 15.2 College 6.6 11.2 12.3 19.1 10.5
Men Total 19.1 24.0 20.1 35.8 23.5
Age (years) 18–24 13.0 19.1 17.2 34.3 19.0 25–44 20.9 29.2 24.7 44.1 27.1 45–64 19.9 25.8 22.1 22.6 24.0
>65 19.8 10.6 11.1 60.6 14.0
Education Less than high school 35.4 32.1 18.4 70.6 36.9 High school 26.3 27.6 28.7 35.3 28.3 Some college 18.1 21.5 19.2 32.4 20.9 College 9.8 18.9 16.5 31.0 15.6
Women Total 4.7 8.9 14.9 13.6 8.9
Age (years) 18–24 5.8 4.0 22.9 19.9 9.5 25–44 5.5 14.6 16.3 13.9 10.4 45–64 2.5 5.1 13.4 9.9 7.4
>65 2.6 3.4 8.3 NA 3.8
Education Less than high school 1.7 11.6 28.8 20.9 9.4 High school 9.8 12.7 17.5 14.4 12.6 Some college 4.8 8.7 13.4 19.4 9.5 College 3.2 4.9 7.0 5.2 4.9
*Current cigarette smokers are persons aged 18 years and older who reported smoking at least 100 cigarettes in their lives and who reported at the time of survey that they currently smoked. Only English-speaking persons were interviewed.
†The variables needed to compute confidence intervals were not available. NA = data not available. Source: Burns and Pierce 1992.
Patterns of Tobacco Use 63

Table 27. Summary of selected findings on the percentage of Asian American and Pacific Islander adults who smoke, overall and by gender, 1975–1995
Sources Location/YearStudy Population
Characteristics
Adults_____________________________
Total Men Women
Klatsky and Armstrong 1991
CDC 1992c
Blaisdell 1993
McPhee et al. 1993
McPhee et al. 1995
Wewers et al. 1995
CDC 1997a
Jenkins et al. 1997b
Jenkins et al. 1997b
California, 1978–1985
Washington State, 1989
Hawaii, 1975–1980 Hawaii, 1975–1980 Hawaii, 1985 Hawaii, 1989
San Francisco and Alameda Counties, California, 1987, 1989
Santa Clara County, California, 1990
Franklin County, Ohio, 1992
Alameda County, California, 1994–1995
San Francisco and Alameda Counties, California, 1990
Houston, Texas 1990, 1992
Current smokers Chinese Filipino Japanese Other Asians
Persons who smoke >1 pack/day Chinese Filipino Japanese Other Asians
Southeast Asians, by age (years)
18–29 30–39 40–59
>60 Total
Pure Native Hawaiians Part Native Hawaiians Native Hawaiians Native Hawaiians
Vietnamese adults 1987 1989
Vietnamese men
Cambodians
Laotians
Vietnamese
Korean adults
Vietnamese men
Vietnamese men 1990 1992
NA 16.2 7.3 NA 32.9 11.4 NA 22.7 18.6 NA 30.9 12.6
NA 4.1 1.3 NA 7.1 1.7 NA 8.2 4.6 NA 6.7 1.6
17.6 29.5 3.0 26.3 53.7 5.6 26.6 54.5 8.3 28.9 55.9 7.1 23.1 42.5 5.7
NA 61.1 NA NA 56.3 NA NA 42 34 28.2 NA NA
NA 56 9 NA 45 2
NA 36 NA
20.6* 34.0 6.6 (30.3)✝ (38.8) (21.5) 27.8 45.6 4.2
(32.9) (48.2) (10.8) 27.6 43.3 6.0
(29.0) (43.3) (9.3)
21 39 6
NA 36.1 NA
NA 39.6 NA NA 40.9 NA
Surgeon General's Report
*Figures not in parentheses are from self-report. †Figures in parentheses represent cotinine-adjusted prevalences. Persons whose saliva cotinine levels were > 14 ng/mL were considered to be smokers.
NA = data not available.
64 Chapter 2

Tobacco Use Among U.S. Racial/Ethnic Minority Groups
Data collected from several surveys (conducted in 1987, 1989, 1990, and 1992) of Vietnamese men and women living in California, Texas, and Ohio showed that the prevalence of cigarette smoking was substantially higher among Vietnamese men than among all U.S. men (Jenkins et al. 1990; McPhee et al. 1993; McPhee et al. 1995; Wewers et al. 1995; Jenkins et al. 1997b). Vietnamese women, however, were significantly less likely to smoke than were Vietnamese men or other U.S. women (Table 27).
Several surveys have been conducted in San Francisco and Alameda Counties, California. In the 1987 survey, which included data from 215 randomly sampled Vietnamese, 56 percent of Vietnamese men reported smoking cigarettes, compared with 9 percent of Vietnamese women (Jenkins et al. 1990). Vietnamese men had twice the smoking prevalence of men in the United States. On average, however, the number of cigarettes smoked per day was smaller among Vietnamese men (13.4) than among men in the general U.S. population (23.0). In the 1989 survey of 151 Vietnamese adults, 45 percent of Vietnamese men and 2 percent of Vietnamese women reported being cigarette smokers (Table 27) (McPhee et al. 1993). The precision of the estimates of smoking prevalence from the 1987 and 1989 surveys is limited by small sample sizes. In the 1990 survey of 1,133 Vietnamese men, which served as the baseline measure in an evaluation of a community-based smoking cessation intervention, 36.1 percent were current smokers. These men smoked an average of 11.1 cigarettes per day (Jenkins et al. 1997b).
Another survey of Vietnamese men (n = 1,322), which also served as the 1990 baseline measure in an evaluation of a similar smoking cessation intervention, was conducted in Santa Clara County, California. In this population, 37.9 percent were current smokers; the smokers consumed an average of 9.9 cigarettes per day (McPhee et al. 1995). The comparison data for the two evaluation studies conducted by McPhee and colleagues were obtained from surveys of Vietnamese men living in Houston, Texas (McPhee et al. 1995; Jenkins et al. 1997b). In the 1990 survey (n = 1,581), 39.6 percent of the men were current smokers; in the 1992 survey (n = 1,209), 40.9 percent were current smokers. The mean number of cigarettes smoked daily was significantly lower in 1992 (11.9) than in 1990 (13.2).
immigrated to the United States (McPhee et al. 1995; Jenkins et al. 1997b). Data collected from 1,403 Southeast Asian immigrant men and women through a household interview indicate that self-reported cigarette smoking prevalence is underreported, especially among women (Wewers et al. 1995). Cigarette smoking status among Cambodian, Laotian, and Vietnamese adults in Franklin County, Ohio, was verified by saliva cotinine assay; a cutoff of 14 ng/mL was used to indicate active smoking. Self-reported smoking prevalence was 40.9 percent for men and 5.6 percent for women. However, results from biochemical verification indicated that 43.7 percent of men and 14.8 percent of women were current smokers. Misclassification as a result of exposure to environmental tobacco smoke is unlikely, given how high the cotinine levels were among self-reported former and never smokers (range 17–331 ng/mL). As other studies have found, current smoking was substantially higher among men than women for all racial/ethnic groups in the study (Table 27) and was higher among respondents with less education.
The 1990 and 1992 survey data showed an association between cigarette smoking prevalence and acculturation. In multivariate analyses that included statistical control for education, employment, and poverty status, the prevalence of cigarette smoking was elevated among persons with limited English-language proficiency and persons who had more recently
From August 1994 to February 1995, a telephone survey of 676 Korean Americans (aged 18 years and older) was conducted in Alameda County, California (Table 27) (CDC 1997a) . Overall, 39 percent reported that they had smoked at least 100 cigarettes in their lifetimes. Men (70 percent) were more likely than women (13 percent) to have smoked at least 100 lifetime cigarettes. Current smoking prevalence was 39 percent for Korean American men in Alameda County—an estimate that was substantially higher than the 19 percent prevalence estimate (from the 1995 California Behavioral Risk Factor Survey) for all men in the state. Conversely, only 6 percent of Korean American women from Alameda County reported current smoking—less than the statewide estimate for women of 14 percent.
Cigarette Smoking in Asian Countries
Because so many Asian Americans have recently immigrated to the United States, understanding how smoking practices in Asian countries may affect smoking practices among Asian Americans here is important. Currently, however, data are scarce on smoking trends in the countries from which Asian Americans and Pacific Islanders have emigrated. The information that is available suggests that the prevalence of smoking among men in Asia is much higher than among Asian American men.
Various studies from Asian countries indicate a very high cigarette smoking prevalence among men
Patterns of Tobacco Use 65

Surgeon General's Report
and a relatively low prevalence among women (Weng et al. 1987; Li et al. 1988; Hawks 1989; Koong et al. 1990; Gong et al. 1995; Jenkins et al. 1997a; World Health Organization, unpublished data). In many of these countries, the estimated prevalence of smoking among men exceeds 50 percent. However, the prevalence of smoking among women is generally below 20 percent. Some of these studies indicate that the prevalence of smoking among women increases with age (Weng et al. 1987; Koong et al. 1990). In Pacific Island nations, the prevalence of smoking among men is also very high, with estimates generally exceeding 50 percent, similar to those in Asian countries. Women in the Pacific Island nations are less likely to smoke than men, but they are more likely to smoke than women in Asian countries, with prevalence estimates generally exceeding 20 percent (World Health Organization, unpublished data).
Studies also show that smoking prevalences are much higher among Chinese male adolescents than among female adolescents. In a 1988 survey of 8,437 junior high school students and 3,823 senior high school students in Beijing, the self-reported prevalence of ever smoking was 34.4 percent among male junior high school students and 3.9 percent among their female counterparts (Zhu et al. 1992). Among senior high school students, the prevalence of ever smoking was 46.0 percent among males and 5.5 percent among females (Wang et al. 1994).
Hispanics
through retrospective analysis of smoking prevalence among successive birth cohorts of Hispanics (Escobedo and Remington 1989; Escobedo et al. 1989a).
No data are available on long-term trends in the prevalence of cigarette smoking among Hispanics in the United States. Before 1978, major U.S. government databases, surveys, and publications limited their classifications of race and ethnicity to “white” and “black,” and no information was available about persons of Hispanic ancestry. When questions about Hispanic ancestry were added to the NHIS in 1978, direct estimates of smoking prevalence among Hispanics were possible for the first time. Because Hispanics made up a small proportion of the U.S. population at the time of the initial surveys, survey data must be aggregated from several years to provide meaningful estimates. As with previous sections, data in this section are from the NHISs, which included Hispanic data aggregated as follows: (1) 1978, 1979, and 1980; (2) 1983 and 1985; (3) 1987 and 1988; (4) 1990 and 1991; (5) 1992 and 1993; and (6) 1994 and 1995. Not until the HHANES was administered from 1982 through 1984 was a large enough sample of Hispanics available to assess long-term reconstructed trends in smoking
Prevalence of Cigarette Smoking
NHIS data indicate that the prevalence of smoking declined among Hispanics from 1978 through 1995 (Table 28) (NCHS, public use data tapes, 1978– 1995). Birth cohort data from the HHANES also reflect recent declines in the prevalence of smoking among the three subgroups of Hispanics surveyed: Cuban Americans, Mexican Americans, and Puerto Ricans (Escobedo and Remington 1989).
Between 1978 and 1995, the prevalence of smoking among Hispanic men and women decreased, although smoking prevalence was consistently greater among men than among women, according to the NHIS data (Table 28). Previous analysis of the HHANES birth cohort data showed that after 1970, the prevalence of smoking declined sharply among Mexican American men and less dramatically among Puerto Rican and Cuban American men (Escobedo et al. 1989a). In contrast, the prevalence of smoking changed little or increased among most age groups of Cuban American, Mexican American, and Puerto Rican women. For men participating in the 1982–1984 HHANES, the smoking prevalence ranged from 41.3 percent (among Puerto Ricans) to 43.6 percent (among Mexican Americans) (Escobedo and Remington 1989), compared with 31.6 percent of Hispanic men in the 1983–1985 NHIS. For women participating in HHANES, the smoking prevalence ranged from 23.1 percent (among Cuban Americans) to 32.6 percent (among Puerto Ricans) (Escobedo and Remington 1989), compared with 20.4 percent of Hispanic women in the 1983–1985 NHIS.
Several factors help explain why the HHANES estimates for men are at least 10 percentage points higher than the NHIS estimates for men for a comparable period and why the HHANES estimates for women also show a higher prevalence than the NHIS estimates for women. Most importantly, the HHANES was more likely to select an immigrant population than the NHIS because HHANES offered respondents the choice of English or Spanish questionnaires. In addition, the HHANES sampled Cuban Americans from Dade County, Florida; Mexican Americans from Arizona, California, Colorado, New Mexico, and Texas; and Puerto Ricans from New York, New Jersey, and Connecticut. On the other hand, the NHIS, administered only in English, is a national sample of the general population, which includes a wider range of racial/ethnic
66 Chapter 2
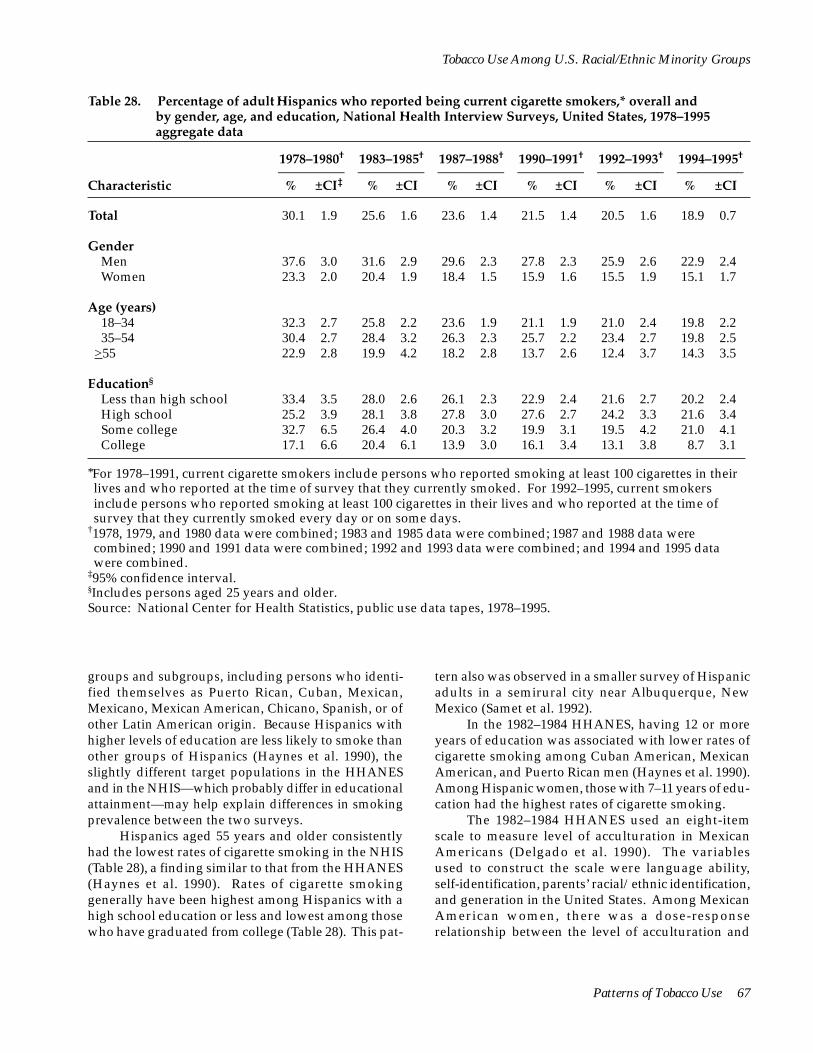
Tobacco Use Among U.S. Racial/Ethnic Minority Groups
Table 28. Percentage of adult Hispanics who reported being current cigarette smokers,* overall and by gender, age, and education, National Health Interview Surveys, United States, 1978–1995 aggregate data
1978–1980† 1983–1985† 1987–1988† 1990–1991† 1992–1993† 1994–1995†
–––––––––– –––––––––– –––––––––– –––––––––– –––––––––– –––––––––– Characteristic % ±CI‡ % ±CI % ±CI % ±CI % ±CI % ±CI
Total 30.1 1.9 25.6 1.6 23.6 1.4 21.5 1.4 20.5 1.6 18.9 0.7
Gender Men 37.6 3.0 31.6 2.9 29.6 2.3 27.8 2.3 25.9 2.6 22.9 2.4 Women 23.3 2.0 20.4 1.9 18.4 1.5 15.9 1.6 15.5 1.9 15.1 1.7
Age (years) 18–34 32.3 2.7 25.8 2.2 23.6 1.9 21.1 1.9 21.0 2.4 19.8 2.2 35–54 30.4 2.7 28.4 3.2 26.3 2.3 25.7 2.2 23.4 2.7 19.8 2.5
>55 22.9 2.8 19.9 4.2 18.2 2.8 13.7 2.6 12.4 3.7 14.3 3.5
Education§
Less than high school 33.4 3.5 28.0 2.6 26.1 2.3 22.9 2.4 21.6 2.7 20.2 2.4 High school 25.2 3.9 28.1 3.8 27.8 3.0 27.6 2.7 24.2 3.3 21.6 3.4 Some college 32.7 6.5 26.4 4.0 20.3 3.2 19.9 3.1 19.5 4.2 21.0 4.1 College 17.1 6.6 20.4 6.1 13.9 3.0 16.1 3.4 13.1 3.8 8.7 3.1
*For 1978–1991, current cigarette smokers include persons who reported smoking at least 100 cigarettes in their lives and who reported at the time of survey that they currently smoked. For 1992–1995, current smokers include persons who reported smoking at least 100 cigarettes in their lives and who reported at the time of survey that they currently smoked every day or on some days.
†1978, 1979, and 1980 data were combined; 1983 and 1985 data were combined; 1987 and 1988 data were combined; 1990 and 1991 data were combined; 1992 and 1993 data were combined; and 1994 and 1995 data were combined.
‡95% confidence interval. §Includes persons aged 25 years and older. Source: National Center for Health Statistics, public use data tapes, 1978–1995.
groups and subgroups, including persons who identi-fied themselves as Puerto Rican, Cuban, Mexican, Mexicano, Mexican American, Chicano, Spanish, or of other Latin American origin. Because Hispanics with higher levels of education are less likely to smoke than other groups of Hispanics (Haynes et al. 1990), the slightly different target populations in the HHANES and in the NHIS—which probably differ in educational attainment—may help explain differences in smoking prevalence between the two surveys.
tern also was observed in a smaller survey of Hispanic adults in a semirural city near Albuquerque, New Mexico (Samet et al. 1992).
Hispanics aged 55 years and older consistently had the lowest rates of cigarette smoking in the NHIS (Table 28), a finding similar to that from the HHANES (Haynes et al. 1990). Rates of cigarette smoking generally have been highest among Hispanics with a high school education or less and lowest among those who have graduated from college (Table 28). This pat-
In the 1982–1984 HHANES, having 12 or more years of education was associated with lower rates of cigarette smoking among Cuban American, Mexican American, and Puerto Rican men (Haynes et al. 1990). Among Hispanic women, those with 7–11 years of education had the highest rates of cigarette smoking.
The 1982–1984 HHANES used an eight-item scale to measure level of acculturation in Mexican Americans (Delgado et al. 1990). The variables used to construct the scale were language ability, self-identification, parents’ racial/ethnic identification, and generation in the United States. Among Mexican American women, there was a dose-response relationship between the level of acculturation and
Patterns of Tobacco Use 67
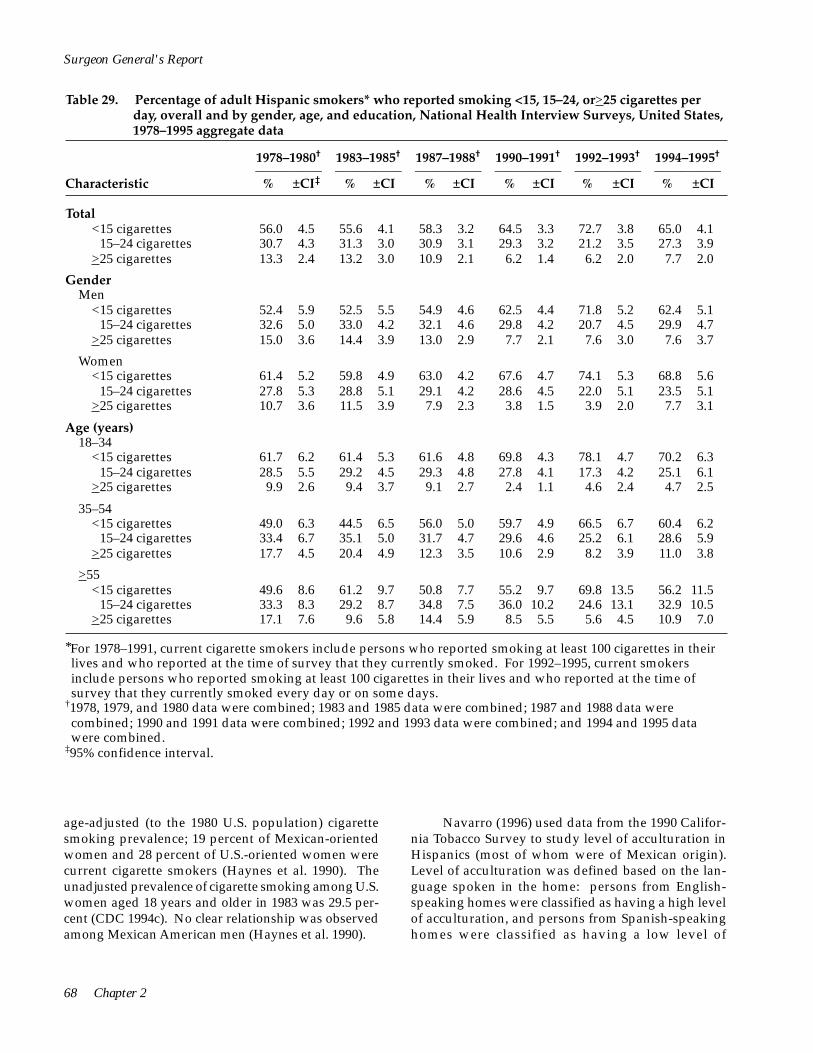
<15–24 cigarettes
<15–24 cigarettes
<15–24 cigarettes
<15–24 cigarettes
<15–24 cigarettes
<15–24 cigarettes
Surgeon General's Report
Table 29. Percentage of adult Hispanic smokers* who reported smoking <15, 15–24, or >25 cigarettes per day, overall and by gender, age, and education, National Health Interview Surveys, United States, 1978–1995 aggregate data
1978–1980† 1983–1985† 1987–1988† 1990–1991† 1992–1993† 1994–1995†
–––––––––– –––––––––– –––––––––– –––––––––– –––––––––– –––––––––– Characteristic % ±CI‡ % ±CI % ±CI % ±CI % ±CI % ±CI
Total <15 cigarettes
>25 cigarettes
56.0 4.5 55.6 4.1 58.3 3.2 64.5 3.3 72.7 3.8 65.0 4.1 30.7 4.3 31.3 3.0 30.9 3.1 29.3 3.2 21.2 3.5 27.3 3.9 13.3 2.4 13.2 3.0 10.9 2.1 6.2 1.4 6.2 2.0 7.7 2.0
Gender Men
<15 cigarettes
>25 cigarettes
52.4 5.9 52.5 5.5 54.9 4.6 62.5 4.4 71.8 5.2 62.4 5.1 32.6 5.0 33.0 4.2 32.1 4.6 29.8 4.2 20.7 4.5 29.9 4.7 15.0 3.6 14.4 3.9 13.0 2.9 7.7 2.1 7.6 3.0 7.6 3.7
Women <15 cigarettes
>25 cigarettes
61.4 5.2 59.8 4.9 63.0 4.2 67.6 4.7 74.1 5.3 68.8 5.6 27.8 5.3 28.8 5.1 29.1 4.2 28.6 4.5 22.0 5.1 23.5 5.1 10.7 3.6 11.5 3.9 7.9 2.3 3.8 1.5 3.9 2.0 7.7 3.1
Age (years) 18–34
<15 cigarettes
>25 cigarettes
61.7 6.2 61.4 5.3 61.6 4.8 69.8 4.3 78.1 4.7 70.2 6.3 28.5 5.5 29.2 4.5 29.3 4.8 27.8 4.1 17.3 4.2 25.1 6.1
9.9 2.6 9.4 3.7 9.1 2.7 2.4 1.1 4.6 2.4 4.7 2.5
35–54 <15 cigarettes
>25 cigarettes
49.0 6.3 44.5 6.5 56.0 5.0 59.7 4.9 66.5 6.7 60.4 6.2 33.4 6.7 35.1 5.0 31.7 4.7 29.6 4.6 25.2 6.1 28.6 5.9 17.7 4.5 20.4 4.9 12.3 3.5 10.6 2.9 8.2 3.9 11.0 3.8
>55 <15 cigarettes
>25 cigarettes
49.6 8.6 61.2 9.7 50.8 7.7 55.2 9.7 69.8 13.5 56.2 11.5 33.3 8.3 29.2 8.7 34.8 7.5 36.0 10.2 24.6 13.1 32.9 10.5 17.1 7.6 9.6 5.8 14.4 5.9 8.5 5.5 5.6 4.5 10.9 7.0
*For 1978–1991, current cigarette smokers include persons who reported smoking at least 100 cigarettes in their lives and who reported at the time of survey that they currently smoked. For 1992–1995, current smokers include persons who reported smoking at least 100 cigarettes in their lives and who reported at the time of survey that they currently smoked every day or on some days.
†1978, 1979, and 1980 data were combined; 1983 and 1985 data were combined; 1987 and 1988 data were combined; 1990 and 1991 data were combined; 1992 and 1993 data were combined; and 1994 and 1995 data were combined.
‡95% confidence interval.
age-adjusted (to the 1980 U.S. population) cigarette smoking prevalence; 19 percent of Mexican-oriented women and 28 percent of U.S.-oriented women were current cigarette smokers (Haynes et al. 1990). The unadjusted prevalence of cigarette smoking among U.S. women aged 18 years and older in 1983 was 29.5 per-cent (CDC 1994c). No clear relationship was observed among Mexican American men (Haynes et al. 1990).
Navarro (1996) used data from the 1990 California Tobacco Survey to study level of acculturation in Hispanics (most of whom were of Mexican origin). Level of acculturation was defined based on the language spoken in the home: persons from Englishspeaking homes were classified as having a high level of acculturation, and persons from Spanish-speaking homes were classified as having a low level of
68 Chapter 2

<
<
<
<
Tobacco Use Among U.S. Racial/Ethnic Minority Groups
Table 29. Continued
1978–1980† 1983–1985† 1987–1988† 1990–1991† 1992–1993† 1994–1995†
–––––––––– –––––––––– –––––––––– –––––––––– –––––––––– –––––––––– Characteristic % ±CI‡ % ±CI % ±CI % ±CI % ±CI % ±CI
Education§
Less than high school <15 cigarettes 55.4 5.0 54.1 5.3 59.2 5.1 66.2 5.2 71.1 6.6 63.5 7.2
15–24 cigarettes 29.9 5.6 33.7 5.9 30.3 4.7 27.6 5.1 23.1 6.1 30.0 7.2 >25 cigarettes 14.7 4.3 12.3 4.7 10.5 3.3 6.2 2.3 5.8 3.6 6.5 3.4
High school <15 cigarettes 53.4 9.9 53.9 7.5 53.9 6.6 60.9 6.0 70.5 7.2 61.3 7.3
15–24 cigarettes 34.7 9.4 33.2 7.1 32.5 6.6 32.6 5.7 25.4 7.0 28.7 6.6 >25 cigarettes 11.9 5.9 12.9 4.4 13.6 4.5 6.5 2.6 4.2 3.0 10.1 4.4
Some college <15 cigarettes 50.6 10.3 50.5 11.8 54.1 9.2 55.1 8.6 70.8 9.7 55.5 9.9
15–24 cigarettes 37.3 10.8 24.1 9.6 31.9 8.2 35.1 8.4 21.0 8.9 36.1 10.1 >25 cigarettes 12.2 7.5 25.5 9.9 14.0 6.4 9.8 5.3 8.2 5.1 8.4 5.1
College <15 cigarettes 55.6 22.1 50.0 17.1 55.3 11.7 64.4 11.3 75.8 11.7 71.6 15.7
15–24 cigarettes 17.8 15.2 36.4 13.5 29.6 10.6 27.1 10.3 16.7 10.3 17.9 12.8 >25 cigarettes 26.7 21.7 13.6 10.1 15.0 9.3 8.5 5.9 7.5 6.3 10.5 10.7
§Includes persons aged 25 years and older. Source: National Center for Health Statistics, public use data tapes, 1978–1995.
acculturation. The data were analyzed by gender and for three levels of educational attainment (<12, 12, and >12 years). Among men, smoking prevalence varied for those with <12 and 12 years of education; smoking prevalence was highest among whites, intermediate among Hispanics of high acculturation, and lowest among Hispanics of low acculturation. This pattern also existed for women, but in all three of the education categories. Additionally, in a multivariate analysis that controlled for age, gender, educational attainment, and Mexican origin, Hispanics with a low acculturation level were significantly less likely to smoke than those with a high acculturation level. Navarro suggested that level of acculturation may be related to the degree of urbanization of the person’s or family’s residence in the country of origin. For example, persons living in rural areas of Latin America appear to be less likely to smoke than those living in urban areas (USDHHS 1992). The relationship between cigarette smoking and level of acculturation among Hispanics living in the United States may be confounded by adaptation to industrial and urban societies (Navarro 1996), especially if persons or families from rural areas acculturate more slowly than those from urban areas. Future research into this
topic might ideally include information on the person’s or family’s residence in the country of origin.
Number of Cigarettes Smoked Daily
Between 1978 and 1985, trends in the number of cigarettes smoked per day by Hispanic smokers remained stable (Table 29) (NCHS, public use data tapes, 1978–1995). More recently, however, an increasing proportion of Hispanic smokers have been smoking fewer than 15 cigarettes per day, and a declining proportion of them have been smoking 25 or more cigarettes per day. For example, in 1978–1980, 13.3 percent of Hispanic smokers smoked 25 or more cigarettes per day. By 1994–1995, this proportion was 7.7 percent.
From 1978 to 1993, Hispanic men were more likely than Hispanic women to smoke 25 or more cigarettes per day, although these differences were not statistically significant (Table 29). Consumption patterns in 1994–1995 were similar across genders. Between 1978 and 1995, the prevalence of smoking 25 or more cigarettes per day declined among Hispanics at all levels of education (Table 29), although only the decline among persons with less than a high school education was statistically significant.
Patterns of Tobacco Use 69
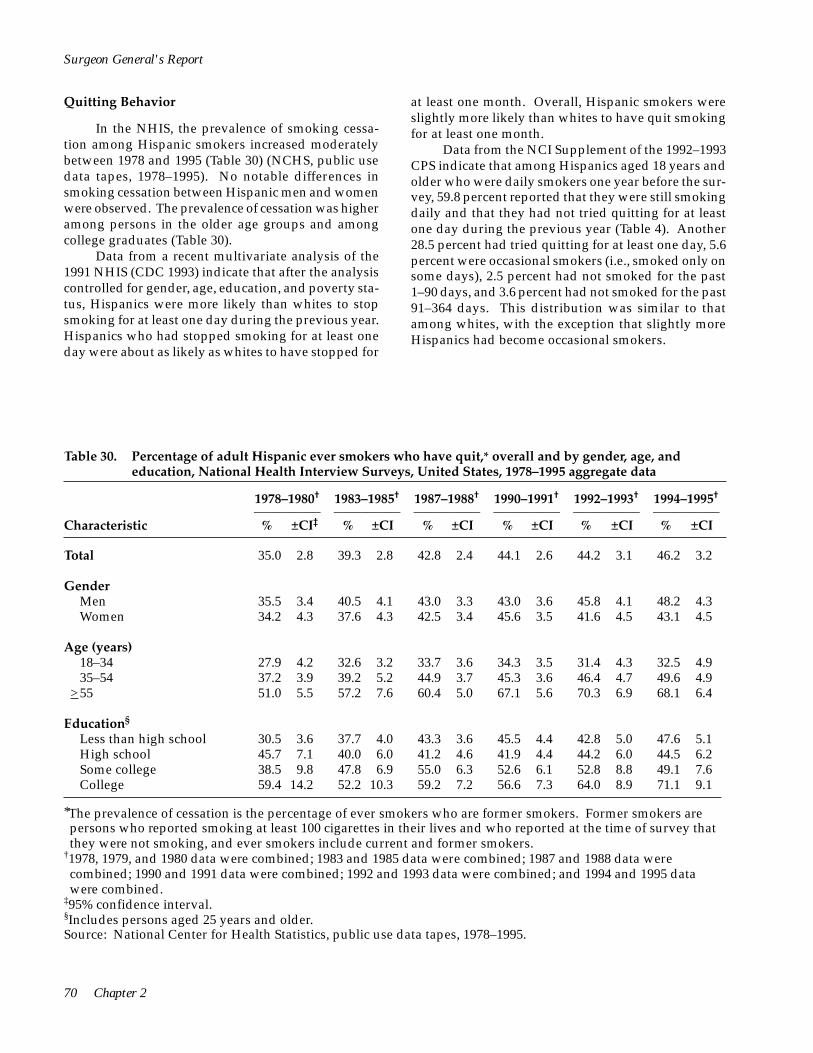
Surgeon General's Report
Quitting Behavior
In the NHIS, the prevalence of smoking cessation among Hispanic smokers increased moderately between 1978 and 1995 (Table 30) (NCHS, public use data tapes, 1978–1995). No notable differences in smoking cessation between Hispanic men and women were observed. The prevalence of cessation was higher among persons in the older age groups and among college graduates (Table 30).
Data from a recent multivariate analysis of the 1991 NHIS (CDC 1993) indicate that after the analysis controlled for gender, age, education, and poverty status, Hispanics were more likely than whites to stop smoking for at least one day during the previous year. Hispanics who had stopped smoking for at least one day were about as likely as whites to have stopped for
at least one month. Overall, Hispanic smokers were slightly more likely than whites to have quit smoking for at least one month.
Data from the NCI Supplement of the 1992–1993 CPS indicate that among Hispanics aged 18 years and older who were daily smokers one year before the survey, 59.8 percent reported that they were still smoking daily and that they had not tried quitting for at least one day during the previous year (Table 4). Another 28.5 percent had tried quitting for at least one day, 5.6 percent were occasional smokers (i.e., smoked only on some days), 2.5 percent had not smoked for the past 1–90 days, and 3.6 percent had not smoked for the past 91–364 days. This distribution was similar to that among whites, with the exception that slightly more Hispanics had become occasional smokers.
Table 30. Percentage of adult Hispanic ever smokers who have quit,* overall and by gender, age, and education, National Health Interview Surveys, United States, 1978–1995 aggregate data
1978–1980† 1983–1985† 1987–1988† 1990–1991† 1992–1993† 1994–1995†
–––––––––– –––––––––– –––––––––– –––––––––– –––––––––– –––––––––– Characteristic % ±CI‡ % ±CI % ±CI % ±CI % ±CI % ±CI
Total 35.0 2.8 39.3 2.8 42.8 2.4 44.1 2.6 44.2 3.1 46.2 3.2
Gender Men 35.5 3.4 40.5 4.1 43.0 3.3 43.0 3.6 45.8 4.1 48.2 4.3 Women 34.2 4.3 37.6 4.3 42.5 3.4 45.6 3.5 41.6 4.5 43.1 4.5
Age (years) 18–34 27.9 4.2 32.6 3.2 33.7 3.6 34.3 3.5 31.4 4.3 32.5 4.9 35–54 37.2 3.9 39.2 5.2 44.9 3.7 45.3 3.6 46.4 4.7 49.6 4.9
>55 51.0 5.5 57.2 7.6 60.4 5.0 67.1 5.6 70.3 6.9 68.1 6.4
Education§
Less than high school 30.5 3.6 37.7 4.0 43.3 3.6 45.5 4.4 42.8 5.0 47.6 5.1 High school 45.7 7.1 40.0 6.0 41.2 4.6 41.9 4.4 44.2 6.0 44.5 6.2 Some college 38.5 9.8 47.8 6.9 55.0 6.3 52.6 6.1 52.8 8.8 49.1 7.6 College 59.4 14.2 52.2 10.3 59.2 7.2 56.6 7.3 64.0 8.9 71.1 9.1
*The prevalence of cessation is the percentage of ever smokers who are former smokers. Former smokers are persons who reported smoking at least 100 cigarettes in their lives and who reported at the time of survey that they were not smoking, and ever smokers include current and former smokers.
†1978, 1979, and 1980 data were combined; 1983 and 1985 data were combined; 1987 and 1988 data were combined; 1990 and 1991 data were combined; 1992 and 1993 data were combined; and 1994 and 1995 data were combined.
‡95% confidence interval. §Includes persons aged 25 years and older. Source: National Center for Health Statistics, public use data tapes, 1978–1995.
70 Chapter 2
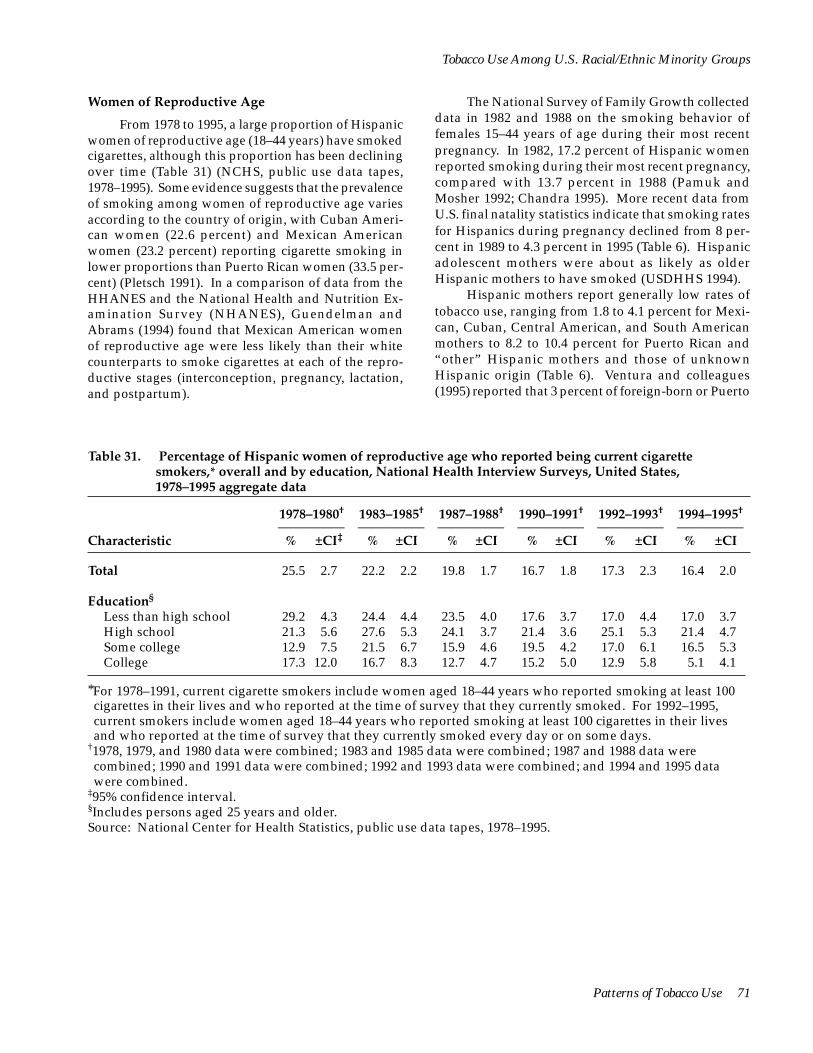
Tobacco Use Among U.S. Racial/Ethnic Minority Groups
Women of Reproductive Age
From 1978 to 1995, a large proportion of Hispanic women of reproductive age (18–44 years) have smoked cigarettes, although this proportion has been declining over time (Table 31) (NCHS, public use data tapes, 1978–1995). Some evidence suggests that the prevalence of smoking among women of reproductive age varies according to the country of origin, with Cuban American women (22.6 percent) and Mexican American women (23.2 percent) reporting cigarette smoking in lower proportions than Puerto Rican women (33.5 percent) (Pletsch 1991). In a comparison of data from the HHANES and the National Health and Nutrition Examination Survey (NHANES), Guendelman and Abrams (1994) found that Mexican American women of reproductive age were less likely than their white counterparts to smoke cigarettes at each of the reproductive stages (interconception, pregnancy, lactation, and postpartum).
The National Survey of Family Growth collected data in 1982 and 1988 on the smoking behavior of females 15–44 years of age during their most recent pregnancy. In 1982, 17.2 percent of Hispanic women reported smoking during their most recent pregnancy, compared with 13.7 percent in 1988 (Pamuk and Mosher 1992; Chandra 1995). More recent data from U.S. final natality statistics indicate that smoking rates for Hispanics during pregnancy declined from 8 percent in 1989 to 4.3 percent in 1995 (Table 6). Hispanic adolescent mothers were about as likely as older Hispanic mothers to have smoked (USDHHS 1994).
Hispanic mothers report generally low rates of tobacco use, ranging from 1.8 to 4.1 percent for Mexican, Cuban, Central American, and South American mothers to 8.2 to 10.4 percent for Puerto Rican and “other” Hispanic mothers and those of unknown Hispanic origin (Table 6). Ventura and colleagues (1995) reported that 3 percent of foreign-born or Puerto
Table 31. Percentage of Hispanic women of reproductive age who reported being current cigarette smokers,* overall and by education, National Health Interview Surveys, United States, 1978–1995 aggregate data
1978–1980† 1983–1985† 1987–1988† 1990–1991† 1992–1993† 1994–1995†
–––––––––– –––––––––– –––––––––– –––––––––– –––––––––– –––––––––– Characteristic % ±CI‡ % ±CI % ±CI % ±CI % ±CI % ±CI
Total 25.5 2.7 22.2 2.2 19.8 1.7 16.7 1.8 17.3 2.3 16.4 2.0
Education§
Less than high school 29.2 4.3 24.4 4.4 23.5 4.0 17.6 3.7 17.0 4.4 17.0 3.7 High school 21.3 5.6 27.6 5.3 24.1 3.7 21.4 3.6 25.1 5.3 21.4 4.7 Some college 12.9 7.5 21.5 6.7 15.9 4.6 19.5 4.2 17.0 6.1 16.5 5.3 College 17.3 12.0 16.7 8.3 12.7 4.7 15.2 5.0 12.9 5.8 5.1 4.1
*For 1978–1991, current cigarette smokers include women aged 18–44 years who reported smoking at least 100 cigarettes in their lives and who reported at the time of survey that they currently smoked. For 1992–1995, current smokers include women aged 18–44 years who reported smoking at least 100 cigarettes in their lives and who reported at the time of survey that they currently smoked every day or on some days.
†1978, 1979, and 1980 data were combined; 1983 and 1985 data were combined; 1987 and 1988 data were combined; 1990 and 1991 data were combined; 1992 and 1993 data were combined; and 1994 and 1995 data were combined.
‡95% confidence interval. §Includes persons aged 25 years and older. Source: National Center for Health Statistics, public use data tapes, 1978–1995.
Patterns of Tobacco Use 71

Surgeon General's Report
Rican-born Hispanic mothers smoked, compared with 9 percent of their United States-born counterparts (Ventura et al. 1995). Data on tobacco use among these mothers may be skewed because California and New York do not report this information, and together these states account for almost half of all Hispanic births (Ventura et al. 1996).
The National Pregnancy and Health Survey, conducted between October 1992 and August 1993 and sponsored by NIDA, provides nationally representative data on the prevalence of prenatal drug use among Hispanic females of reproductive age (15–44 years). According to National Pregnancy and Health Survey data, 5.8 percent of Hispanic women reported using cigarettes during their pregnancies (NIDA 1994). In the 1985 and 1990 NHISs, questions related to smoking were asked of women aged 18–44 years who had given birth within the past five years. In 1985, 16.8 percent of Hispanic women smoked during the 12 months before the birth and 10.3 percent smoked after learning of their pregnancy; in 1990, 12.1 percent smoked during the year before birth and 8 percent after learning of their pregnancy (Floyd et al. 1993).
Young People
Cigarette Smoking
Despite the dearth of information on tobacco use among Hispanic youths, several studies have been able to identify trends in smoking initiation and patterns of tobacco use by analyzing data from the HHANES, the MTF surveys of high school seniors (Figure 3), and small local surveys (for example, Smith et al. 1991; Dusenbury et al. 1992; Vega et al. 1993).
HHANES data have shown that smoking initiation increased rapidly among Cuban Americans, Mexican Americans, and Puerto Ricans between ages 11 and 15 years, peaked between ages 15 and 19 years, and declined after the age of 20 years (Escobedo et al. 1990). In all age groups, smoking initiation rates were higher among males than among females.
of smoking initiation, whereas those with more than a high school education had slightly lower smoking initiation rates. Because educational attainment is a reliable (Liberatos et al. 1988) although limited (Montgomery and Carter-Pokras 1993) indicator of socioeconomic status, these data suggest that an association between smoking initiation and socioeconomic status may exist among Hispanics, as it does for the general U.S. population. However, these differences in smoking initiation by educational attainment were not as large as those found among whites.
Slight variations in smoking initiation by level of education were found when the HHANES data were combined for all three Hispanic subgroups (although these were three separate surveys, it was necessary to combine three groups to estimate trends for all three groups). Hispanics with less than a high school education had the highest rates of smoking initiation, with an earlier age of onset and a more accelerated rate of smoking initiation during young adolescence, than Hispanics with more years of schooling. Hispanics with a high school education had intermediate rates
In addition, data from the 1994–1995 (combined) NHSDAs indicate that among persons aged 30–39 years, Hispanic men and women were less likely to become daily smokers than whites (Table 11) (USDHHS, Substance Abuse and Mental Health Services Administration, public use data tapes, 1994– 1995). Among persons in this age group who had ever smoked daily, the initiation patterns among Hispanics were more like those of African Americans than those of whites. The average ages for first trying a cigarette and for becoming a daily smoker were about one year higher for Hispanic men than for white men and about two years higher for Hispanic women than for white women (Table 11).
Among high school seniors who participated in the MTF in 1985–1989, 23.8 percent of Mexican American males, 22.0 percent of Puerto Rican and Latino males, 18.7 percent of Mexican American females, and 24.7 percent of Puerto Rican and Latina females smoked cigarettes in the previous month (Bachman et al. 1991b). In addition, 11.6 percent of Mexican American males, 13.3 percent of Puerto Rican and Latino males, 8.1 percent of Mexican American females, and 13.3 percent of Puerto Rican and Latina females smoked cigarettes daily in the previous month. The prevalence of smoking one-half pack of cigarettes or more per day was somewhat higher among males (5 to 6 percent) than among females (2 to 4 percent).
Between 1976 and 1989, the prevalence of daily smoking declined among Mexican American high school seniors of both genders and among Puerto Rican and Latina females, according to the MTF data (Bachman et al. 1991b). Decreases occurred between 1976 and 1984 among Mexican American males and between 1980 and 1989 among Puerto Rican and Latina females. Among Mexican American females, decreases in the prevalence of daily smoking occurred between 1976 and 1984, and no decline was observed in more recent years. In contrast, little change in the prevalence of daily smoking was observed among Puerto Rican and Latino males over the entire survey period (Bachman et al. 1991b).
72 Chapter 2

Tobacco Use Among U.S. Racial/Ethnic Minority Groups
Recent data indicate that rates of smoking are generally lower among Hispanic youths than among white youths. The 1989 TAPS showed that 11.8 percent of Hispanics reported some level of cigarette smoking, compared with 17.7 percent of whites and 6.2 percent of African Americans (Moss et al. 1992). However, patterns may differ for migrant and resident youths. In a recent study of 214 migrant Hispanic adolescents enrolled in school in San Diego, the prevalence of cigarette smoking within the 30 days preceding the survey increased by school grade, from a low of 10 percent of 9th graders to 14 percent of 10th graders, 21 percent of 11th graders, and 18 percent of 12th graders (Lovato et al. 1994). Also, acculturation may influence smoking behavior. In a study of sixth and seventh graders in Dade County, Florida, Vega and colleagues (1993) found that cigarette smoking was more frequent among United States-born Cuban American children (23.8 percent) than among foreign-born Cuban Americans (15.1 percent).
According to the 1995 YRBS, 34.0 percent of Hispanic high school students and 38.3 percent of white high school students smoked on one or more days during the previous month (CDC 1996). Hispanic students were significantly more likely than African American students (19.2 percent) to have smoked during the previous month. Regarding more frequent smoking, Hispanic youths (10.0 percent) and African American youths (4.5 percent) were less likely than white youths (19.5 percent) to have smoked on at least 20 days during the previous month.
Lowry and colleagues (1996) analyzed cross-sectional data on 6,321 adolescents (aged 12–17 years) from the YRBS supplement to the 1992 NHIS. Hispanics were significantly less likely than whites to have smoked in the previous 30 days. This analysis controlled statistically for the educational level of the responsible adult, for family income, for the age and gender of the adolescent, and for whether the adolescent was in or out of school. In an analysis comparing measured carbon monoxide from expired air with self-reported smoking among a sample of seventh- through tenth-grade New York State public school students, Wills and Cleary (1997) found that the self-report sensitivity was slightly lower for Hispanics than for whites but that the magnitude of the effect was small. When self-reported smoking rates were adjusted for carbon monoxide values, ninth- and tenth-grade Hispanic students had significantly lower smoking prevalences than whites.
Recent findings from focus groups conducted at several U.S. sites suggest that Hispanic parents may be more likely than white parents to express clear anti
smoking messages and that smoking by Hispanic adolescents may be a sign of disrespect toward parents (Mermelstein et al. 1996).
According to the 1996 MTF surveys, the prevalence of previous-month smoking (estimated by combining 1995 and 1996 data) among Hispanic high school seniors (25.4 percent) was intermediate to that among African American seniors (14.2 percent) and white seniors (38.1 percent) (Institute for Social Research, University of Michigan, unpublished data from the 1996 MTF surveys). A similar pattern was observed for tenth-grade students: previous-month smoking prevalences were 23.7 percent for Hispanics, 32.9 percent for whites, and 12.2 percent for African Americans. However, among eighth-grade students, the Hispanic-white difference was attenuated: 19.6 percent of Hispanics, 22.7 percent of whites, and 9.6 percent of African Americans were previous-month smokers. Trends in daily smoking among high school seniors show that rates for Hispanics have been consistently lower than for whites since 1977 and higher than for African Americans since the early 1980s (Figure 3).
The MTF surveys suggest that rates of smoking among Hispanics have increased in the 1990s. The prevalence of previous-month smoking (based on two-year rolling averages) among eighth-grade students was 16.7 percent in 1992 and 19.6 percent in 1996; among tenth-grade students, the prevalence was 18.3 percent in 1992 and 23.7 percent in 1996; and among high school seniors, the prevalence was 21.7 percent in 1990 and 25.4 percent in 1996 (Johnston et al. 1996; Institute for Social Research, University of Michigan, unpublished data from the 1996 MTF surveys). Similarly, YRBS data indicate that the prevalence of previous-month smoking among Hispanic high school students was 25.3 percent in 1991 (USDHHS 1994) and 34.0 percent in 1995 (CDC 1996).
Other Risk Behaviors
Using data from the YRBS supplement to the 1992 NHIS, Escobedo and colleagues (1997) observed associations (USDHHS 1994) between cigarette smoking among Hispanic adolescents and specific behaviors compromising to health. Marijuana use, binge drinking, and weapon carrying were significantly associated with cigarette smoking among Hispanic adolescent males; marijuana use, binge drinking, multiple sexual partners, and physical fighting were associated with cigarette use among Hispanic adolescent females. The analysis controlled statistically for age, ethnicity, gender, parental educational level, region of the country, and other risk behaviors.
Patterns of Tobacco Use 73

Surgeon General's Report
Smokeless Tobacco Use
Recent trends in smokeless tobacco use among Hispanic adolescents have changed little. According to the MTF surveys, previous-month smokeless tobacco use (based on two-year rolling averages) was reported by 4.2 percent of eighth-grade Hispanic students in 1992 and 5.2 percent in 1996; among tenth-grade students, the prevalence was 6.2 percent in 1992 and 4.0 percent in 1996; and among high school seniors, the prevalence was 4.4 percent in 1987 and 8.1 percent in 1996 (Johnston et al. 1996; Institute for Social Research, University of Michigan,
unpublished data from the 1996 MTF surveys). YRBS data indicate that the prevalence of previous-month use among Hispanic high school students was 5.5 percent in 1991 (USDHHS 1994) and 4.4 percent in 1995 (CDC 1996).
Hispanic adolescent males are much less likely than white adolescent males to use smokeless tobacco. Among male high school students participating in the 1995 YRBS, for example, 5.8 percent of Hispanics and 25.1 percent of whites had used smokeless tobacco during the previous month (CDC 1996). Prevalence among females was 3.1 percent for Hispanics and 2.5 percent for whites.
Retrospective Analyses of Smoking Prevalence Among African Americans and Hispanics
Because of the lack of long-term national survey data on smoking behavior among racial/ethnic groups, retrospective analysis is the only way to reconstruct smoking prevalences for African Americans before 1965 and for Hispanics before 1978. The retrospective method of constructing smoking prevalences for successive birth cohorts of men and women in the U.S. population was first reported by Harris (USDHEW 1979; Harris 1983). Harris’s methodology later served as the basis for a report in which smoking prevalences were presented for Cuban American, Mexican American, and Puerto Rican men and women (Escobedo and Remington 1989). Most recently, the NCI (1991) published some results of an analysis of birth cohorts of whites and African Americans. Another type of retrospective analysis has also been used to estimate long-term trends in cigarette smoking. This approach has been the basis of two published reports, one that presented smoking trends among Hispanics in various age groups (Escobedo et al. 1989a) and another that presented smoking trends among Hispanic young adults (Escobedo et al. 1989b). For this section of the report, both types of retrospective analysis were used to generate information not previously available.
Prevalence of Cigarette Smoking Among Successive Birth Cohorts
The following detailed analysis of smoking trends over time—according to gender and educational
attainment of defined birth cohorts (based on the year of birth)—uses data from the 1987 NHIS (for African Americans) and the 1982–1984 HHANES (for Hispanics). The smoking histories of respondents were constructed according to the ages they reported cigarette smoking initiation and cessation. Information about these two smoking-related events was then used to classify each respondent as a nonsmoker, current smoker, or former smoker from birth to interview and to calculate the proportion of people smoking each year in each birth cohort. (See Appendix 5 for a discussion of the validation of this methodology.) The resulting birth cohort curves (Figures 7–10) represent smoking prevalences of each cohort for each year from birth to interview (throughout childhood, adolescence, and adulthood) (NCHS, public use data tapes, 1978, 1979, 1980, 1982– 1984, and 1987 and 1988 combined). By comparing the curves among successive birth cohorts, one can examine smoking trends over time for those cohorts.
African Americans
The prevalence of smoking among successive birth cohorts of African American men with at least a high school education has declined gradually, with the peak and age-specific smoking prevalences for the most recent cohort (1958–1967) being lower than the prevalences for previous cohorts’ curves (Figure 4).
In contrast, little progress has been made in reducing the prevalence of cigarette smoking among
74 Chapter 2

High school education
Perc
enta
ge
80
70
60
50
40
30
20
10
0 1910 1920 1930 1940 1950 1960 1970 1980
Less than a high school education
Perc
enta
ge
80
70
60
50
40
30
20
10
0 1910 1920 1930 1940 1950 1960 1970 1980
Year Year
Birth cohorts:
1908–1917 1918–1927 1928–1937 1938–1947 1948–1957 1958–1967
Tobacco Use Among U.S. Racial/Ethnic Minority Groups
successive birth cohorts of African American men with less than a high school education (Figure 7). Although smoking prevalences declined slightly for successive cohorts, the peak prevalence for the most recent cohort continues to be nearly as high as that for previous cohorts. In addition, smoking prevalences during adolescence among African Americans with less than a high school education did not decrease between successive birth cohorts.
Despite initial increases in smoking prevalence among successive birth cohorts of African American women with at least a high school education, prevalences have declined in recent years (Figure 8). The declines in prevalence among African American women with at least a high school education are not as marked as the declines observed among successive birth cohorts of African American men of a similar educational background. Smoking prevalences among African American women with less than a high school education have increased markedly, with the most recent cohort (1958–1967) showing the highest peak (Figure 8).
Hispanics
Among six successive birth cohorts of Hispanic men with at least a high school education covering the years 1908–1967, the peak prevalence of smoking increased gradually for the first three cohorts but declined beginning with the 1938–1947 cohort (Figure 9). In addition, the rate of increase in smoking prevalence during adolescence slowed markedly for the most recent cohort compared with rates for previous cohorts.
The smoking prevalence pattern among successive birth cohorts of Hispanic men with less than a high school education (Figure 9) is similar to the pattern among African American men with a similar educational background. Smoking prevalences have declined slightly since the early 1950s, when the highest prevalence was observed for the 1918–1927 cohort.
The slight decline in smoking prevalence among successive birth cohorts of Hispanic women with at least a high school education is similar to the decline among African American women with a similar educational background (Figure 10). However, the decline
Figure 7. Cigarette smoking prevalence among successive birth cohorts of African American men, by education, National Health Interview Surveys, United States, 1978–1980, 1987, and 1988*
*Because these birth cohort curves are the result of calculations of smoking prevalence for each year from birth to interview, they provide information about the smoking prevalence of each cohort during childhood, adolescence, and adulthood.
Sources: National Center for Health Statistics, public use data tapes, 1978–1980, 1987 (Cancer Control Supplement and Epidemiology Supplement), and 1988; Escobedo and Peddicord 1996.
Patterns of Tobacco Use 75

High school education
Per
cent
age
80
70
60
50
40
30
20
10
0 1910 1920 1930 1940 1950 1960 1970 1980
Year
1910 1920 1930 1940 1950 1960 1970 1980 0
10
20
30
40
50
60
70
80
Per
cent
age
Less than a high school education
Year
Birth cohorts:
1908–1917 1918–1927 1928–1937 1938–1947 1948–1957 1958–1967
Surgeon General's Report
among Hispanic women began more recently, with the 1938–1947 cohort. The peak prevalence for the most recent cohort of Hispanic females with at least a high school education was similar to the peak prevalence for African American women of the same educational level (25 percent).
The smoking prevalences among successive birth cohorts of Hispanic women with less than a high school education increased slightly over time and then leveled off (Figure 10). In addition, the prevalence of smoking during adolescence increased much more rapidly in the most recent birth cohort than in previous cohorts. However, the overall pattern of smoking prevalence in this subgroup of Hispanic women does not show the dramatic increases observed in successive birth cohorts of African American women with a similar educational background. The peak prevalence for the most recent birth cohort of Hispanic women with less than a high school education (34 percent) was substantially lower than the peak prevalence for the corresponding cohort of African American women (54 percent).
The slight changes in smoking prevalences among successive birth cohorts of Hispanic women,
regardless of educational background, may be the result of the larger proportion of Mexican American women who compose these subgroups. Although few changes have been observed in the prevalence of smoking among successive birth cohorts of Mexican American women, in recent birth cohorts of Cuban American and Puerto Rican women, more women have smoked cigarettes than those in previous cohorts (Escobedo and Remington 1989). Had more Cuban American and Puerto Rican women been included in the HHANES, the pattern may well have been different.
The results of these birth cohort analyses show that educational attainment is the most powerful predictor of temporal trends in smoking prevalence. In both racial/ethnic groups, men, and to a lesser extent women, with at least a high school education have made progress in reducing cigarette smoking. However, men with less than a high school education, regardless of race/ethnicity, are as likely to smoke now as they were in previous decades. Recent cohorts of African American women with less than a high school education are now substantially more likely to smoke than their counterparts in previous decades.
Figure 8. Cigarette smoking prevalence among successive birth cohorts of African American women, by education, National Health Interview Surveys, United States, 1978–1980, 1987, and 1988*
*Because these birth cohort curves are the result of calculations of smoking prevalence for each year from birth to interview, they provide information about the smoking prevalence of each cohort during childhood, adolescence, and adulthood.
Sources: National Center for Health Statistics, public use data tapes, 1978–1980, 1987 (Cancer Control Supplement and Epidemiology Supplement), and 1988; Escobedo and Peddicord 1996.
76 Chapter 2

80 80
70 70
60 60
50 50
40
age
40ent
0
10
20
30
0
10
20
Perc 30
High school education
1910 1920 1930 1940 1950 1960 1970 1980
Less than a high school education
1910 1920 1930 1940 1950 1960 1970 1980 YearYear
Birth cohorts:
1908–1917 1918–1927 1928–1937 1938–1947 1948–1957 1958–1967
Perc
enta
ge
30
40
50
60
70
80 80
70 High school education
1910 1920 1930 0
10
20
1940 1950 1960 1970 1980 1910 1920 1930 1940 1950 1960 1970 1980 0
10
20
1908–1917
Birth cohorts:
Year
1918–1927 1928–1937 1938–1947
Year
1948–1957 1958–1967
Less than a high school education
60
Perc
enta
ge
Perc
enta
ge
50
40
30
Tobacco Use Among U.S. Racial/Ethnic Minority Groups
Figure 9. Cigarette smoking prevalence among successive birth cohorts of Hispanic men, by education, Hispanic Health and Nutrition Examination Survey, 1982–1984*
*Because these birth cohort curves are the result of calculations of smoking prevalence for each year from birth to interview, they provide information about the smoking prevalence of each cohort during childhood, adolescence, and adulthood.
Sources: National Center for Health Statistics, public use data tapes, 1982–1984; Escobedo and Peddicord 1996.
Figure 10. Cigarette smoking prevalence among successive birth cohorts of Hispanic women, by education, Hispanic Health and Nutrition Examination Survey, 1982–1984*
*Because these birth cohort curves are the result of calculations of smoking prevalence for each year from birth to interview, they provide information about the smoking prevalence of each cohort during childhood, adolescence, and adulthood.
Sources: National Center for Health Statistics, public use data tapes, 1982–1984; Escobedo and Peddicord 1996.
Patterns of Tobacco Use 77
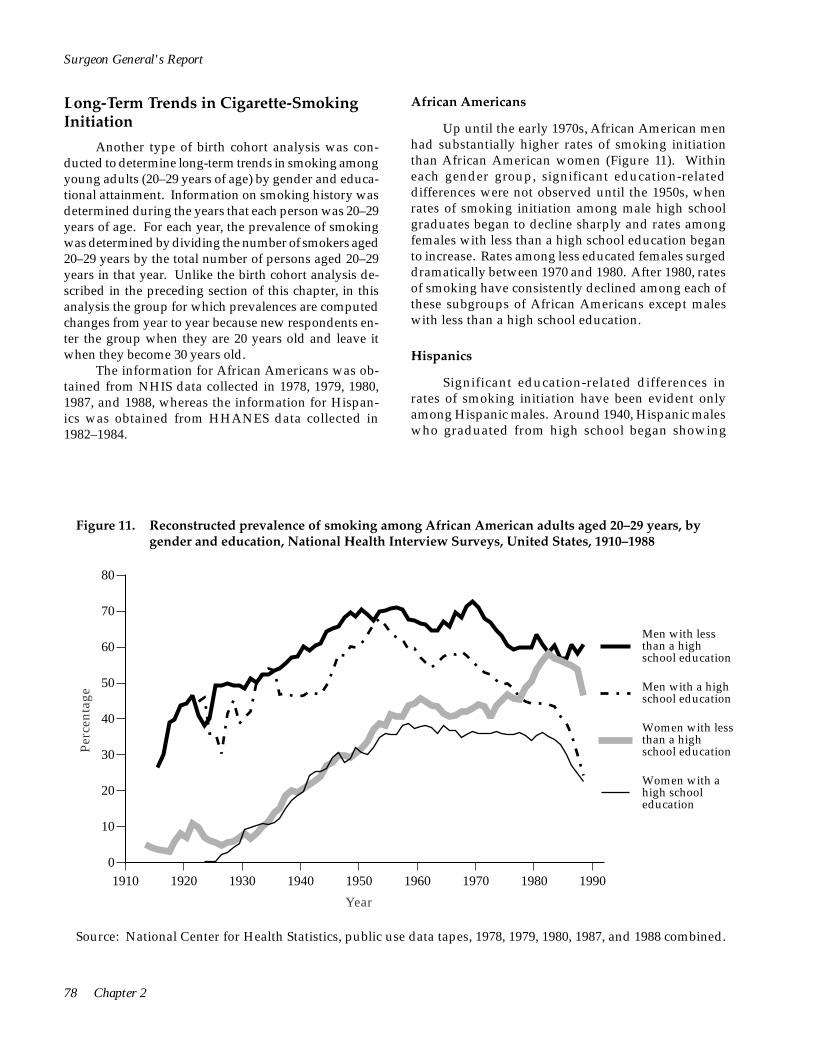
Perc
enta
ge
80
70
60
50
40
30
20
10
0
Men with less than a high school education
Men with a high school education
Women with less than a high school education
Women with a high school education
1910 1920 1930 1940 1950 1960 1970 1980 1990
Year
Surgeon General's Report
Long-Term Trends in Cigarette-Smoking Initiation
Another type of birth cohort analysis was conducted to determine long-term trends in smoking among young adults (20–29 years of age) by gender and educational attainment. Information on smoking history was determined during the years that each person was 20–29 years of age. For each year, the prevalence of smoking was determined by dividing the number of smokers aged 20–29 years by the total number of persons aged 20–29 years in that year. Unlike the birth cohort analysis described in the preceding section of this chapter, in this analysis the group for which prevalences are computed changes from year to year because new respondents enter the group when they are 20 years old and leave it when they become 30 years old.
The information for African Americans was obtained from NHIS data collected in 1978, 1979, 1980, 1987, and 1988, whereas the information for Hispanics was obtained from HHANES data collected in 1982–1984.
African Americans
Up until the early 1970s, African American men had substantially higher rates of smoking initiation than African American women (Figure 11). Within each gender group, significant education-related differences were not observed until the 1950s, when rates of smoking initiation among male high school graduates began to decline sharply and rates among females with less than a high school education began to increase. Rates among less educated females surged dramatically between 1970 and 1980. After 1980, rates of smoking have consistently declined among each of these subgroups of African Americans except males with less than a high school education.
Hispanics
Significant education-related differences in rates of smoking initiation have been evident only among Hispanic males. Around 1940, Hispanic males who graduated from high school began showing
Figure 11. Reconstructed prevalence of smoking among African American adults aged 20–29 years, by gender and education, National Health Interview Surveys, United States, 1910–1988
Source: National Center for Health Statistics, public use data tapes, 1978, 1979, 1980, 1987, and 1988 combined.
78 Chapter 2

Perc
enta
ge
80
70
60
50
40
30
20
10
0
Men with less than a high school education
Men with a high school education
Women with less than a high school education
Women with a high school education
1920 1930 1940 1950 1960 1970 1980 1990
Year
Tobacco Use Among U.S. Racial/Ethnic Minority Groups
appreciably lower smoking rates than Hispanic males with less than a high school education (Figure 12). These differences increased in the 1960s and even more rapidly in the mid-1970s. No consistent differences in smoking rates by education were observed among Hispanic females.
Cigarette Brand Preferences
Knowing what influences cigarette brand preference among smokers is believed to be important because this information can be used to develop counteradvertising strategies. In the late 1970s and the 1980s, the 12 most commonly used brands of cigarettes—Marlboro, Winston, Salem, Kool, Pall Mall, Kent, Benson & Hedges, Camel, Merit, Vantage, Virginia Slims, and Newport—were used by at least 76 percent of all current U.S. smokers, according to data from the 1986 Adult Use of Tobacco Survey (AUTS) and the 1978– 1980 and 1987 NHISs (Table 32). Brand use varied somewhat by race/ethnicity. For example, the top brands
preferred by African Americans were Kool, Newport, Salem, and Winston, whereas whites preferred Marlboro, Winston, Salem, and Benson & Hedges.
These differences in part reflect the greater use of mentholated cigarettes by African Americans (Cummings et al. 1987; USDHHS 1989). Fifty-five percent of all African American smokers reported using one of three brands that were available only in mentholated form (Newport, Kool, and Salem). Similar patterns and percentages of brand preferences were observed in the 1987 NHIS (Table 32).
Hymowitz and colleagues (1995) recently studied menthol cigarette smoking among adults who participated in a stop-smoking study. Among African Americans who smoked menthol cigarettes (n = 174), the top reasons given for smoking menthols were as follows: 83 percent said that menthol cigarettes tasted better than nonmenthol cigarettes, 63 percent said that they had always smoked menthol cigarettes, 52 percent said that menthol cigarettes were less harsh to the throat than nonmenthol cigarettes, 48 percent found inhalation to be easier with menthol cigarettes, and 33
Figure 12. Reconstructed prevalence of smoking among Hispanic adults aged 20–29 years, by gender and education, Hispanic Health and Nutrition Examination Surveys, 1920–1984
Source: National Center for Health Statistics, public use data tapes, 1982–1984.
Patterns of Tobacco Use 79

Surgeon General's Report
Table 32. Percentage of self-reported cigarette brand use among adult current cigarette smokers, overall and by race/ethnicity and gender, National Health Interview Surveys (NHIS) 1978–1980 combined, Adult Use of Tobacco Survey (AUTS) 1986, and NHIS 1987
Benson & Hedges
% ±CI‡
Camel
% ±CI
Kent
% ±CI
Kool
% ±CI
Marlboro
% ±CI Sample
Size* Survey
NHIS 1978–1980 African Americans
TotalMenWomen
1,540 6.0 1.6 1.3 0.7 1.6 0.6 28.0 4.0 3.8 1.3 750 4.0 1.7 2.3 1.2 1.1 0.8 31.3 4.7 4.2 1.7 790 8.1 2.4 0.3 0.4 2.2 0.8 24.4 4.5 3.3 1.6
Whites Total MenWomen
13,228 4.2 0.6 4.4 0.5 4.8 0.5 6.3 0.6 17.5 1.1 6,675 2.7 0.5 6.9 0.7 4.0 0.6 6.8 0.8 20.3 1.5 6,553 5.8 0.8 1.7 0.4 5.7 0.6 5.8 0.7 14.4 1.2
AUTS 1986 African Americans
TotalMenWomen
388 9.2 3.5 0.9 1.2 0.6 0.6 19.9 4.9 6.7 3.1 176 4.6 3.8 1.2 2.0 0.5 0.5 19.6 7.2 10.2 5.5 212 13.8 5.7 0.5 1.2 0.7 0.7 20.3 6.7 3.2 2.9
Whites Total Men Women
3,693 4.1 0.8 4.9 0.9 2.7 2.7 4.2 0.8 28.3 1.8 1,883 2.9 0.9 7.9 1.5 2.3 2.3 4.7 1.2 32.4 2.6 1,810 5.5 1.3 1.5 0.7 3.2 3.2 3.5 1.0 23.7 2.4
NHIS 1987 African Americans
TotalMenWomen
428 6.3 2.7 2.6 2.0 2.5 2.3 24.8 5.4 2.7 1.5 174 2.2 1.8 3.4 3.3 2.1 2.8 30.3 8.6 3.1 2.2 254 11.2 5.1 1.7 2.2 3.0 3.7 18.4 5.5 2.3 1.9
Whites TotalMenWomen
1,860 5.8 1.2 3.8 1.1 3.1 0.9 3.7 1.0 31.1 2.6 934 3.8 1.4 5.7 1.6 2.1 1.0 3.6 1.3 38.8 3.5 926 8.1 2.1 1.6 1.7 4.3 1.6 3.7 1.4 22.0 3.1
*Unweighted sample size. †In the NHIS, “other” includes other brands, no particular brand, and roll-your-own cigarettes; in the AUTS, “other” includes other brands.
percent said that they could inhale menthol cigarettes always smoked menthol cigarettes, and 21 percent found more deeply. Among a small sample (n = 39) of whites inhalation to be easier with menthol cigarettes. who smoked menthol cigarettes, 74 percent said that Evaluating changes in young smokers’ brand menthol cigarettes tasted better than nonmenthol ciga- preferences is especially important because it can rettes, 51 percent said that menthol cigarettes were more help identify factors that influence their choices and soothing to the throat, 39 percent said that they had may suggest ways to discourage them from starting
80 Chapter 2
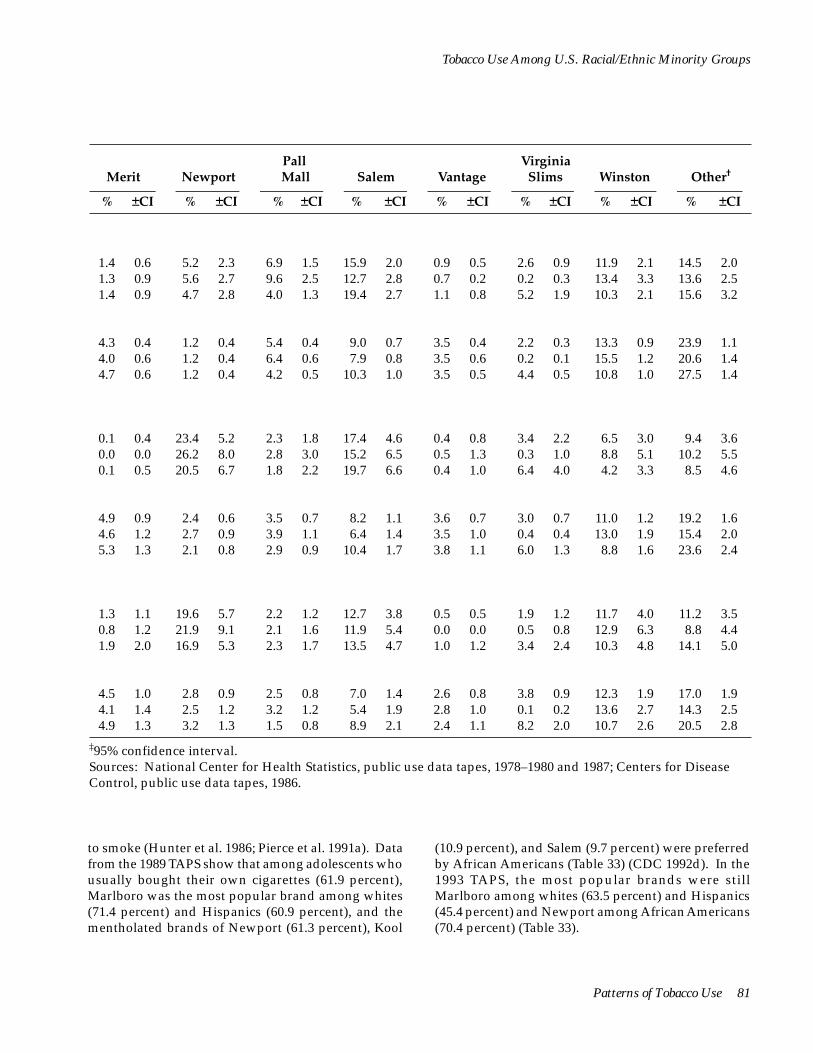
Tobacco Use Among U.S. Racial/Ethnic Minority Groups
Merit
% ±CI
Newport
% ±CI
Pall Mall
% ±CI
Salem
% ±CI
Vantage
% ±CI
Virginia Slims
% ±CI
Winston
% ±CI
Other†
% ±CI
1.4 1.3 1.4
0.6 0.9 0.9
5.2 5.6 4.7
2.3 2.7 2.8
6.9 9.6 4.0
1.5 2.5 1.3
15.9 12.7 19.4
2.0 2.8 2.7
0.9 0.7 1.1
0.5 0.2 0.8
2.6 0.2 5.2
0.9 0.3 1.9
11.9 13.4 10.3
2.1 3.3 2.1
14.5 13.6 15.6
2.0 2.5 3.2
4.3 4.0 4.7
0.4 0.6 0.6
1.2 1.2 1.2
0.4 0.4 0.4
5.4 6.4 4.2
0.4 0.6 0.5
9.0 7.9
10.3
0.7 0.8 1.0
3.5 3.5 3.5
0.4 0.6 0.5
2.2 0.2 4.4
0.3 0.1 0.5
13.3 15.5 10.8
0.9 1.2 1.0
23.9 20.6 27.5
1.1 1.4 1.4
0.1 0.0 0.1
0.4 0.0 0.5
23.4 26.2 20.5
5.2 8.0 6.7
2.3 2.8 1.8
1.8 3.0 2.2
17.4 15.2 19.7
4.6 6.5 6.6
0.4 0.5 0.4
0.8 1.3 1.0
3.4 0.3 6.4
2.2 1.0 4.0
6.5 8.8 4.2
3.0 5.1 3.3
9.4 10.2 8.5
3.6 5.5 4.6
4.9 4.6 5.3
0.9 1.2 1.3
2.4 2.7 2.1
0.6 0.9 0.8
3.5 3.9 2.9
0.7 1.1 0.9
8.2 6.4
10.4
1.1 1.4 1.7
3.6 3.5 3.8
0.7 1.0 1.1
3.0 0.4 6.0
0.7 0.4 1.3
11.0 13.0 8.8
1.2 1.9 1.6
19.2 15.4 23.6
1.6 2.0 2.4
1.3 0.8 1.9
1.1 1.2 2.0
19.6 21.9 16.9
5.7 9.1 5.3
2.2 2.1 2.3
1.2 1.6 1.7
12.7 11.9 13.5
3.8 5.4 4.7
0.5 0.0 1.0
0.5 0.0 1.2
1.9 0.5 3.4
1.2 0.8 2.4
11.7 12.9 10.3
4.0 6.3 4.8
11.2 8.8
14.1
3.5 4.4 5.0
4.5 4.1 4.9
1.0 1.4 1.3
2.8 2.5 3.2
0.9 1.2 1.3
2.5 3.2 1.5
0.8 1.2 0.8
7.0 5.4 8.9
1.4 1.9 2.1
2.6 2.8 2.4
0.8 1.0 1.1
3.8 0.1 8.2
0.9 0.2 2.0
12.3 13.6 10.7
1.9 2.7 2.6
17.0 14.3 20.5
1.9 2.5 2.8
‡95% confidence interval. Sources: National Center for Health Statistics, public use data tapes, 1978–1980 and 1987; Centers for Disease Control, public use data tapes, 1986.
to smoke (Hunter et al. 1986; Pierce et al. 1991a). Data from the 1989 TAPS show that among adolescents who usually bought their own cigarettes (61.9 percent), Marlboro was the most popular brand among whites (71.4 percent) and Hispanics (60.9 percent), and the mentholated brands of Newport (61.3 percent), Kool
(10.9 percent), and Salem (9.7 percent) were preferred by African Americans (Table 33) (CDC 1992d). In the 1993 TAPS, the most popular brands were still Marlboro among whites (63.5 percent) and Hispanics (45.4 percent) and Newport among African Americans (70.4 percent) (Table 33).
Patterns of Tobacco Use 81
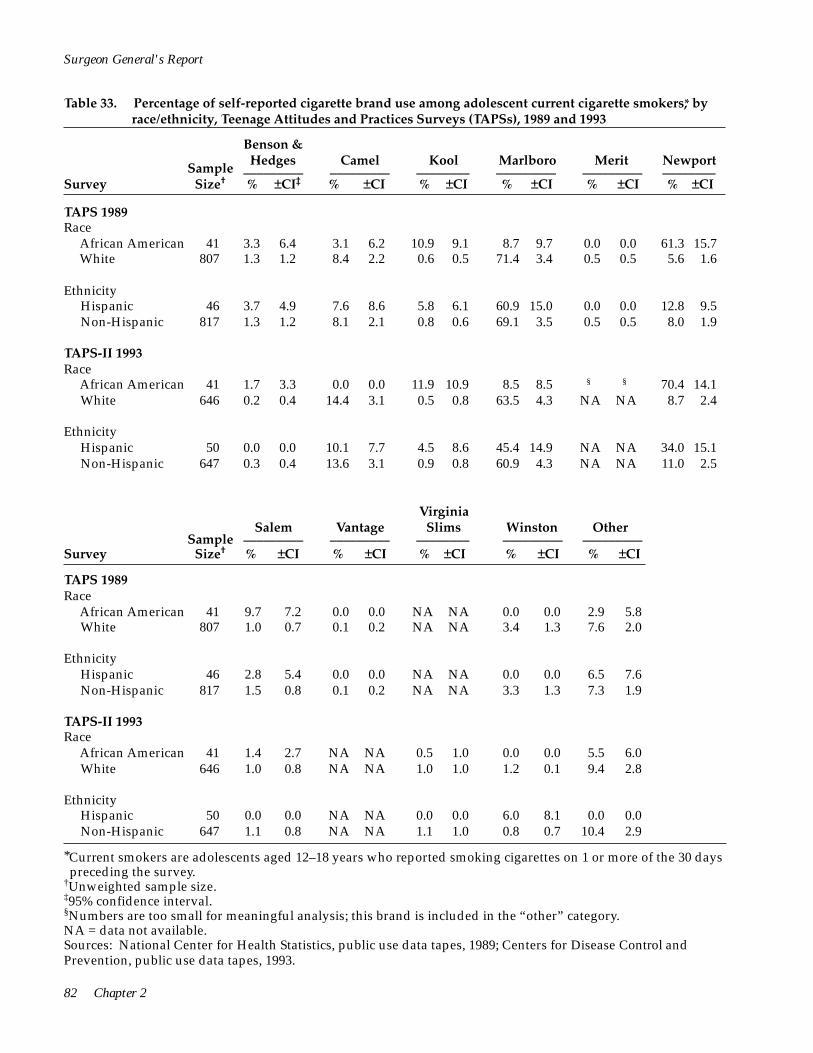
82 Chapter 2
African American
African American
African American
Surgeon General's Report
Table 33. Percentage of self-reported cigarette brand use among adolescent current cigarette smokers,* by race/ethnicity, Teenage Attitudes and Practices Surveys (TAPSs), 1989 and 1993
Benson & Hedges
_________ % ±CI‡
Sample Size† Survey
Camel _________ % ±CI
Kool ________ % ±CI
Marlboro _________ % ±CI
Merit _________ % ±CI
Newport ________ % ±CI
TAPS 1989 Race
African American 41 3.3 6.4 3.1 6.2 10.9 9.1 8.7 9.7 0.0 0.0 61.3 15.7 White 807 1.3 1.2 8.4 2.2 0.6 0.5 71.4 3.4 0.5 0.5 5.6 1.6
Ethnicity Hispanic 46 3.7 4.9 7.6 8.6 5.8 6.1 60.9 15.0 0.0 0.0 12.8 9.5Non-Hispanic 817 1.3 1.2 8.1 2.1 0.8 0.6 69.1 3.5 0.5 0.5 8.0 1.9
TAPS-II 1993 Race
41 1.7 3.3 0.0 0.0 11.9 10.9 8.5 8.5 § § 70.4 14.1White 646 0.2 0.4 14.4 3.1 0.5 0.8 63.5 4.3 NA NA 8.7 2.4
Ethnicity Hispanic 50 0.0 0.0 10.1 7.7 4.5 8.6 45.4 14.9 NA NA 34.0 15.1Non-Hispanic 647 0.3 0.4 13.6 3.1 0.9 0.8 60.9 4.3 NA NA 11.0 2.5
Salem _________% ±CI
Sample Size† Survey
TAPS 1989 Race
41 9.7 7.2 0.0 0.0 NA NA 0.0 0.0 2.9 5.8White 807 1.0 0.7 0.1 0.2 NA NA 3.4 1.3 7.6 2.0
Vantage _________ % ±CI
Virginia Slims
________ % ±CI
Winston _________ % ±CI
Other _________ % ±CI
Ethnicity Hispanic 46 2.8 5.4 0.0 0.0 NA NA 0.0 0.0 6.5 7.6Non-Hispanic 817 1.5 0.8 0.1 0.2 NA NA 3.3 1.3 7.3 1.9
TAPS-II 1993 Race
41 1.4 2.7 NA NA 0.5 1.0 0.0 0.0 5.5 6.0White 646 1.0 0.8 NA NA 1.0 1.0 1.2 0.1 9.4 2.8
Ethnicity Hispanic 50 0.0 0.0 NA NA 0.0 0.0 6.0 8.1 0.0 0.0Non-Hispanic 647 1.1 0.8 NA NA 1.1 1.0 0.8 0.7 10.4 2.9
*Current smokers are adolescents aged 12–18 years who reported smoking cigarettes on 1 or more of the 30 days preceding the survey.
†Unweighted sample size.‡95% confidence interval. §Numbers are too small for meaningful analysis; this brand is included in the “other” category. NA = data not available. Sources: National Center for Health Statistics, public use data tapes, 1989; Centers for Disease Control and Prevention, public use data tapes, 1993.
1 Let βi0 = logistic regression coefficient for the ith ethnicity group before education was included, and βi1 = logistic regression coefficient for the ith ethnicity group after education was included. Then βi0 - βi1 measures education’s confounding effect on the relationship between smoking and ethnicity. The variance of βi0 - βi1 can be approximated as var(βi0) + var(βi1); and thestandard error, SE(βi0 - βi1), is the square root of the variance. In terms of the more commonly used measure, odds ratio (OR), the following relationship exists: ORi0/ORi1 = exp(βi0 - βi1). The 95percent confidence interval for ORi0/ORi1 can then be computed as exp[(βi0 - βi1) ± 1.96 X SE(βi0 - βi1)]. Education’s confoundingeffect on the relationship between smoking and ethnicity is determined to be statistically significant if the 95 percent confidence interval for ORi0/ORi1 does not include 1.0.
Tobacco Use Among U.S. Racial/Ethnic Minority Groups
A notable change in brand preferences occurred between 1989 and 1993, however. The percentage of adolescents purchasing Marlboro cigarettes decreased 13 percent, whereas the percentage of those purchasing Camel cigarettes increased 64 percent and the percentage of those purchasing Newport cigarettes increased 55 percent (CDC 1994a). The declining preference for Marlboro cigarettes was greatest among Hispanics (CDC 1992d). Increases in brand preference were greatest among white adolescents who preferred Camel cigarettes and among Hispanic adolescents who preferred Newport cigarettes. In 1993, the brands of cigarettes most commonly smoked among a small
sample of Vietnamese middle and high school students in Worcester, Massachusetts, were Marlboro (71.0 percent) and Camel (9.7 percent) (Wiecha 1996).
Data from the 1989 and 1993 TAPSs indicate that brand preference is more concentrated among adolescents than among adults. In both surveys, the three most popular brands for each racial/ethnic group were purchased by at least 80 percent of adolescent smokers. Both surveys identified very small numbers of smokers among African American adolescents (41 in 1989 and 45 in 1993) and Hispanic adolescents (46 in 1989 and 50 in 1993); thus, brand preference estimates for these groups are imprecise.
Effects of Education and Race/Ethnicity on Cigarette-Smoking Behavior
In this chapter, smoking prevalence has been shown to vary by racial/ethnic minority group and by educational attainment. Because educational attainment varies among racial/ethnic groups and is related to smoking prevalence, the question arises as to whether racial/ethnic differences in smoking can be explained by differences in educational attainment.
A previous analysis of the 1985 NHIS data showed that controlling for selected measures of socioeconomic status, such as employment status and poverty level, reduced differences in the smoking prevalence between African Americans and whites (Novotny et al. 1988).
Although education, together with such variables as income and occupation, is often used to create a composite measure of socioeconomic status, many researchers have used education as a single proxy indicator of socioeconomic status because education is often associated with many lifestyle characteristics (Liberatos et al. 1988). In addition, education data are usually more accurate and easier to collect than income and occupation data (Liberatos et al. 1988).
for 1987, 1988, 1990, and 1991 (Table 34) (NCHS, public use data tapes, 1987, 1988, 1990, and 1991). The multivariable logistic regression technique was used to assess the odds ratios of smoking behaviors for African Americans, American Indians and Alaska Natives, Asian Americans and Pacific Islanders, and Hispanics compared with whites, before and after adjusting for the effects of educational attainment.1 Four separate logistic regression models were constructed for different measures of smoking behavior: current smoking, ever smoking, heavy smoking (among current smokers), and smoking cessation (among ever smokers). Four design variables were created to represent the racial/ethnic groups (African Americans, American Indians and Alaska Natives, Asian Americans and Pacific Islanders, and Hispanics), with whites serving as the reference group. Similarly, two design
Findings in this report indicate that the prevalences of cigarette smoking, smoking cessation, and heavy smoking are all associated with race/ ethnicity and educational attainment. Because racial/ ethnic group and educational attainment are often interrelated, multivariable models were used in this analysis to distinguish how each variable influences smoking behavior. Data were derived from the NHISs
Patterns of Tobacco Use 83

_
*Includes persons aged 25 years and older. †Education was evaluated at three levels: less than high school education, high school education, and at least some college.
‡OR0 = odds ratio not controlling for education; OR1 = odds ratio controlling for education. Odds ratios were calculated as follows: OR i0/ORi1 = exp(βi0 - βi1), where βi0 is the logistic regression coefficient for the ith ethnic group before controlling for education, and βi1 is the coefficient after controlling for education. Other variables in the logistic models include age, gender, marital status, geographic region, and year of survey.
§95% confidence interval. ΔCurrent cigarette smokers are persons who reported smoking at least 100 cigarettes in their lives and who
reported at the time of survey that they currently smoked. The association presented is for current smoking compared with former and never smoking.
¶Former smokers are those who reported smoking at least 100 cigarettes in their lives and who reported at the time of survey that they were not smoking cigarettes. The association presented is for former smoking compared with current smoking.
**Heavy smokers include current smokers who reported at the time of survey that they were smoking 25 or more cigarettes per day. The association presented is for heavy smoking compared with current smoking of 1–24 cigarettes per day.
††Ever smokers are those who reported at the time of survey that they had smoked at least 100 cigarettes in their lives, regardless of their current smoking status. The association presented is for ever smoking compared with never smoking.
Sources: National Center for Health Statistics, public use data tapes, 1987, 1988, 1990, and 1991; Escobedo et al. 1995.
Surgeon General's Report
Table 34. Relationship between smoking status and race/ethnicity among adults,* before and after controlling for education,† National Health Interview Surveys, United States, 1987, 1988, 1990, and 1991 aggregate data
Not controlling for education
_________________
OR ‡0 CI§
Controlling for education
________________
OR1 CI
Effect of education‡
_________________
OR0/OR1 CI Smoking status Race/ethnicity
CurrentΔ African Americans 1.11 1.06, 1.16 0.96 0.91, 1.00 1.16 1.08, 1.24 Hispanics 0.74 0.70, 0.79 0.58 0.54, 0.62 1.29 1.18, 1.42 Asian Americans and Pacific Islanders 0.51 0.45, 0.58 0.54 0.47, 0.62 0.94 0.78, 1.14 American Indians and Alaska Natives 1.46 1.16, 1.85 1.20 0.95, 1.51 1.22 0.88, 1.70 Whites 1.0 referent 1.0 referent 1.0 referent
Former¶ African Americans 0.65 0.61, 0.70 0.74 0.69, 0.78 0.89 0.81, 0.97 Hispanics 0.97 0.90, 1.05 1.16 1.07, 1.26 0.84 0.75, 0.94 Asian Americans and Pacific Islanders 0.95 0.80, 1.13 0.88 0.74, 1.05 1.08 0.85, 1.38 American Indians and Alaska Natives 0.66 0.47, 0.92 0.74 0.53, 1.02 0.89 0.56, 1.41 Whites 1.0 referent 1.0 referent 1.0 referent
Heavy** African Americans 0.19 0.16, 0.21 0.18 0.16, 0.20 1.04 0.87, 1.25 Hispanics 0.25 0.21, 0.30 0.23 0.20, 0.28 1.08 0.84, 1.38 Asian Americans and Pacific Islanders 0.17 0.11, 0.26 0.17 0.11, 0.27 0.97 0.52, 1.83 American Indians and Alaska Natives 0.74 0.58, 0.95 0.70 0.55, 0.90 1.05 0.74, 1.49 Whites 1.0 referent 1.0 referent 1.0 referent
Ever†† African Americans 0.82 0.79, 0.86 0.76 0.72, 0.79 1.09 1.02, 1.16 Hispanics 0.63 0.60, 0.67 0.55 0.52, 0.58 1.15 1.06, 1.24 Asian Americans and Pacific Islanders 0.39 0.35, 0.43 0.40 0.36, 0.44 0.97 0.83, 1.13 American Indians and Alaska Natives 1.21 1.05, 1.40 1.09 0.93, 1.27 1.11 0.90, 1.38 Whites 1.0 referent 1.0 referent 1.0 referent
84 Chapter 2

Tobacco Use Among U.S. Racial/Ethnic Minority Groups
variables were created to represent persons with and without a high school education, with persons having at least some college education serving as the reference group. In addition to including race/ethnicity and education, the logistic regression models included the year of the survey, age, gender, marital status, and geographic region.
Education was first omitted from and then entered in these models. The difference in estimated coefficients before and after the inclusion of education was computed for each of the four design variables representing the different racial/ethnic groups. The variance of this difference was estimated to be the sum of the variances of the two coefficients. The 95 percent confidence interval of the difference was computed by using this variance estimate. The difference in coefficients was translated into the ratio of the odds ratios before and after adjusting for education (Table 34) (Escobedo et al. 1995).
Current Smoking
Before adjustment for education, the data indicated that African Americans as well as American Indians and Alaska Natives were more likely than whites to be current smokers (Table 34). Hispanics as well as Asian Americans and Pacific Islanders were substantially less likely than whites to be current smokers. After adjustment for the confounding effects of education, the odds ratios for current smoking among African Americans and Hispanics decreased significantly (Table 34).
Thus, when the data were adjusted for education, current smoking among African Americans did not differ from whites—an indication that the differences in the unadjusted rates were probably attributable to factors related to differences in educational attainment. For Hispanics, current smoking was lower than for whites, and adjustment for the confounding effects of education further accentuated these differences.
Smoking Cessation
African Americans as well as American Indians and Alaska Natives who had ever smoked were substantially less likely than whites to have quit smoking (Table 34). When education was included in these models, the odds ratio for smoking cessation increased, suggesting that lack of education accounts for some but not all of the low rates of quitting in these two groups. Before adjustment for education, the data showed that Hispanics were as likely as whites to quit
smoking. However, after adjustment for education, the data showed that Hispanics were more likely than whites to quit smoking. Thus, the unadjusted smoking cessation rate was lower among both African Americans and Hispanics than among whites partially because of confounding by educational attainment. A similar magnitude of change was observed among American Indians and Alaska Natives, but this difference was not statistically significant. Educational attainment does not explain why African Americans are less likely than whites to quit smoking.
Heavy Smoking
Members of all four racial/ethnic groups were less likely than whites to be heavy smokers, before and after the data were adjusted for the effects of education (Table 34). These differences were greatest between whites and Asian Americans and Pacific Islanders and were smallest between whites and American Indians and Alaska Natives. Because the odds ratio of heavy smoking changed little after adjustment for education, the differences in heavy smoking between racial/ethnic groups appear to be independent of factors associated with educational attainment.
Ever Smoking
Before the data were adjusted for the effects of education, all racial/ethnic groups except American Indians and Alaska Natives were substantially less likely than whites to have ever smoked (Table 34). After adjustment for education, the odds ratios for ever smoking among African Americans and Hispanics declined even further, and these declines were statistically significant. This finding suggests that if African Americans and Hispanics had socioeconomic status more comparable with that of whites, they would be even less likely ever to smoke than whites.
Differences in current smoking, quitting, and ever smoking between whites and Asian Americans and Pacific Islanders also were found. Asian Americans and Pacific Islanders were less likely than whites to be current smokers, substantially less likely to be ever smokers, but also slightly less likely to have quit smoking. After adjustment for education, the odds ratios associated with these smoking behaviors changed little (Table 34). Thus, the lower smoking prevalences among Asian Americans and Pacific Islanders may be related to factors other than education—presumably cultural factors associated with being an Asian American or a Pacific Islander in the United States.
Patterns of Tobacco Use 85
Surgeon General's Report
Occasional Smoking
In addition to smoking more cigarettes each day, whites who currently smoke are generally more likely than members of other racial/ethnic groups to smoke on a daily basis. According to the 1993, 1994, and 1995 combined NHISs, 15.2 percent of whites who smoked were occasional (i.e., nondaily) smokers, compared with 26.0 percent of African Americans, 22.2 percent of American Indians and Alaska Natives, 33.1 percent of Asian Americans and Pacific Islanders, and 35.5 percent of Hispanics. Only the estimate for American Indians and Alaska Natives did not differ significantly from that for whites (data not shown) (NCHS, public use data tapes, 1993, 1994, 1995). Husten and
colleagues (1998) used data from the 1991 NHIS to study persons who had ever smoked 100 lifetime cigarettes but who had never smoked on a daily basis. Among the ever smokers, African Americans (12.0 percent), American Indians and Alaska Natives (15.0 percent), Asian Americans and Pacific Islanders (12.1 percent), and Hispanics (16.8 percent) were all significantly more likely than whites (6.2 percent) never to have smoked daily. In gender-specific multivariate analyses that controlled for income, age, and education, African Americans, Hispanics, and others (American Indians and Alaska Natives combined with Asian Americans and Pacific Islanders) were significantly more likely never to have smoked daily.
Exposure to Environmental Tobacco Smoke
Data on exposure to environmental tobacco smoke (ETS) among members of U.S. racial/ethnic minority groups are extremely limited. In the 1991– 1993 NHIS, nearly one-third of all respondents indicated exposure to ETS at home three or more days per week (Table 35) (NCHS, public use data tapes, 1991– 1993). African Americans (37.6 percent) and American Indians and Alaska Natives (36.9 percent) were more likely than other groups to report such levels of exposure to ETS at home. These findings are consistent with smoking prevalence data presented earlier in this chapter. Similar patterns exist among nonsmokers, although the occurrence of higher levels of exposure (three or more days) is reduced by 40 to 60 percent among nonsmokers compared with the total population. Among Asian American, Pacific Islander, American Indian, and Alaska Native nonsmokers, women had substantially more prolonged exposure than men.
Using 1988–1991 NHANES III data on persons aged 17 years and older who did not use tobacco, Pirkle and colleagues (1996) found that 36.9 percent of African Americans, 35.1 percent of Mexican Americans, and 37.4 percent of whites reported that they were exposed to ETS either at home or at work. Wagenknecht and colleagues (1993) analyzed data collected in 1985 and 1986 from 3,300 persons aged 18–30 years who were recruited in four urban centers (Birmingham, Chicago, Minneapolis, and Oakland). African Americans were more likely than whites to report home exposure to ETS and to report that they spent time mostly with smokers. Using 1988 NHIS data on
the number of smokers in the home, Overpeck and Moss (1991) estimated that 42.4 percent of U.S. children aged five years and younger were living in a household with a smoker. In 1988, African American children were more likely to be living with a smoker (51.3 percent) than were white children (41.6 percent), and non-Hispanic children (43.2 percent) were more likely to be doing so than were Hispanic children (35.8 percent).
In recent years, small-scale studies have reported on potential exposure to ETS among young people in U.S. racial/ethnic groups. For example, in two rural Alaska villages, an analysis of saliva samples from children in the Alaska Native Head Start program showed that 44 percent of the children (3–6 years of age) had cotinine concentrations indicative of exposure to ETS (Etzel et al. 1992). Recent research has compared levels of cotinine (a metabolite of nicotine) in biological fluids and hair of children, young adults, and adults (Pattishall et al. 1985; Wagenknecht et al. 1993; Crawford et al. 1994; Knight et al. 1996; Pirkle et al. 1996). Most of these investigations (Pattishall et al. 1985; Crawford et al. 1994; Knight et al. 1996; Pirkle et al. 1996) reported that African Americans who did not use tobacco had higher cotinine levels than whites, even after ETS exposure and other factors were taken into account. Further factors, including possible racial differences in nicotine absorption and metabolism (Pattishall et al. 1985; Benowitz et al. 1995; Clark et al. 1996; Knight et al. 1996) and measurement issues, need to be considered (see Racial/Ethnic Differences in Nicotine Metabolites in Chapter 3 for further discussion of this topic).
86 Chapter 2

Tobacco Use Among U.S. Racial/Ethnic Minority Groups
Table 35. Percentage of all adults and nonsmokers who reported levels of exposure to environmental tobacco smoke in the home, by race/ethnicity and gender, National Health Interview Surveys, United States, 1991–1993 aggregate data
exposure* Home
African Americans
% +CI†
Asian Americans/ Pacific Islanders
% +CI
American Indians/ Alaska Natives
% +CI
Hispanics
% +CI
Whites
% +CI Total (%)‡
All adults 0–2 days
Total Men Women
60.8 1.3 78.5 2.8 60.9 4.5 74.4 1.7 66.9 0.6 67.1 57.3 2.0 76.7 3.7 67.3 6.4 72.6 2.3 66.1 0.7 66.1 63.5 1.5 80.4 3.9 54.9 5.6 76.0 2.1 67.5 0.7 68.0
>3 days Total Men Women
37.6 0.7 20.5 2.9 36.9 4.4 24.5 1.6 31.9 0.6 31.7 41.1 2.0 21.9 3.7 30.8 6.1 26.3 2.2 32.7 0.7 32.7 34.8 1.5 19.0 3.8 42.7 5.9 22.7 2.1 31.3 0.7 30.8
Nonsmokers 0–2 days
Total Men Women
80.4 1.3 87.6 2.5 84.6 4.5 86.6 1.4 85.7 0.5 85.3 80.1 2.1 92.0 2.8 90.0 4.9 87.2 2.0 85.2 0.7 85.1 80.6 1.5 84.0 3.7 78.8 7.0 86.1 1.9 86.2 0.6 85.4
>3 days Total Men Women
18.3 1.2 11.7 2.5 13.5 4.3 12.6 1.4 13.5 0.5 13.9 18.6 2.0 7.0 2.7 9.5 4.8 12.0 1.9 14.0 0.7 14.0 15.1 1.5 15.5 3.6 17.8 6.4 13.0 2.0 13.1 0.6 13.8
*Home exposure was the average number of days per week that anyone was inside the home, as reported by respondents answering “yes” to the question, “Does anyone smoke cigarettes, cigars, or pipes anywhere inside this home?” However, these percentages include persons who indicated no exposure. Percentages exclude “don’t know” and “not ascertained” responses regarding the number of days; therefore, the sum may not total 100%.
†95% confidence interval. ‡Total includes persons of other, unknown, or multiple ethnicities and unknown Hispanic origin. Source: National Center for Health Statistics, public use data tapes, 1991–1993.
Comparisons Between Racial/Ethnic Minority Groups in Current Tobacco Use
Cigarette Smoking
The most recent data from the 1994 and 1995 combined NHISs show that the age-adjusted prevalence of current cigarette smoking was highest among American Indians and Alaska Natives (36.0 percent), intermediate among African Americans (26.5 percent) and whites (26.4 percent), and lowest among Hispanics (18.0 percent) and Asian Americans and Pacific Islanders (14.2 percent) (Table 36) (NCHS, public use
data tapes, 1994–1995). Among all racial/ethnic groups except American Indians and Alaska Natives, men had significantly higher rates of cigarette smoking than women. Using data from the NCI Supplement of the 1992–1993 CPS, Shopland and colleagues (1996) reported patterns similar to those seen in the NHIS for African Americans, Asian Americans and Pacific Islanders, Hispanics, and whites (data on American Indians and Alaska Natives were not included in their report). From 1978 through 1995, the age-adjusted
Patterns of Tobacco Use 87
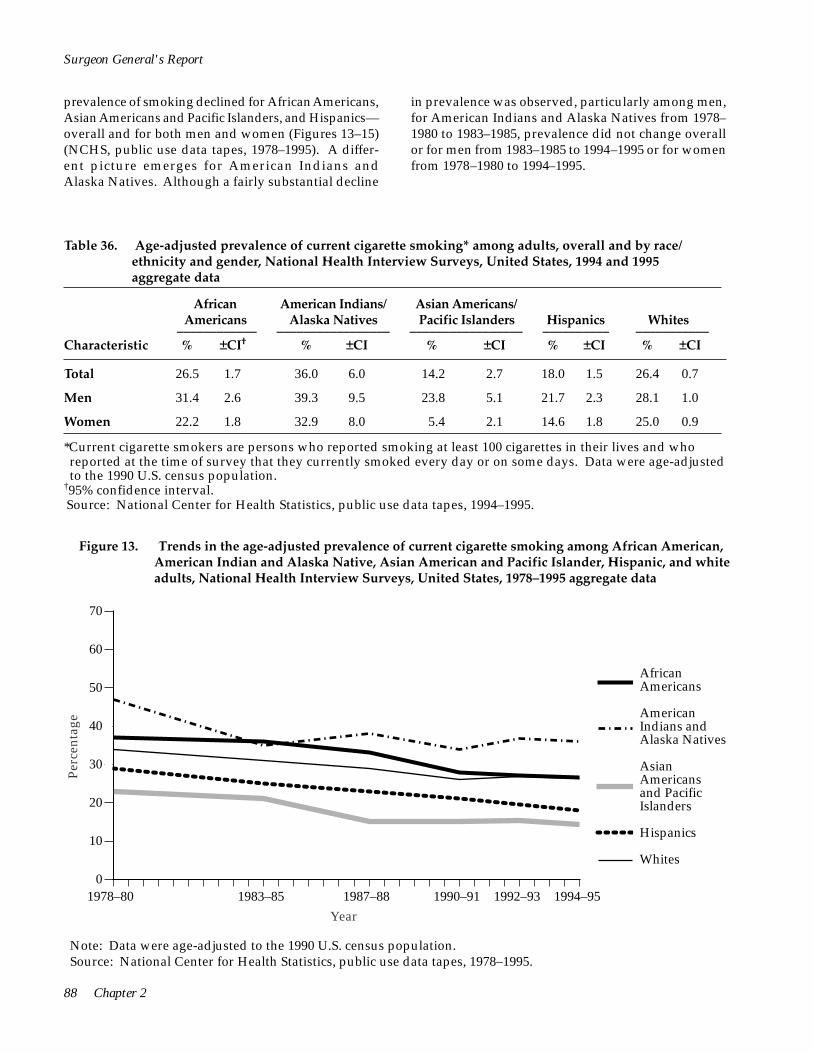
AfricanAmericans
AmericanIndians andAlaska Natives
AsianAmericansand PacificIslanders
Hispanics
Whites
70
60
50
40
30
20
10
0
Perc
enta
ge
1978–80 1983–85 1987–88 1990–91 1992–93 1994–95
African Americans
American Indians and Alaska Natives
Asian Americans and Pacific Islanders
Hispanics
Whites
Year
Surgeon General's Report
prevalence of smoking declined for African Americans, in prevalence was observed, particularly among men, Asian Americans and Pacific Islanders, and Hispanics— for American Indians and Alaska Natives from 1978– overall and for both men and women (Figures 13–15) 1980 to 1983–1985, prevalence did not change overall (NCHS, public use data tapes, 1978–1995). A differ- or for men from 1983–1985 to 1994–1995 or for women ent picture emerges for American Indians and from 1978–1980 to 1994–1995. Alaska Natives. Although a fairly substantial decline
Table 36. Age-adjusted prevalence of current cigarette smoking* among adults, overall and by race/ ethnicity and gender, National Health Interview Surveys, United States, 1994 and 1995 aggregate data
African Americans ____________ % ±CI†
American Indians/ Alaska Natives _________________
% ±CI
Asian Americans/ Pacific Islanders _________________
% ±CI
Hispanics __________ % ±CI
Whites ___________ % ±CI Characteristic
Total 26.5 1.7 36.0 6.0 14.2 2.7 18.0 1.5 26.4 0.7
Men 31.4 2.6 39.3 9.5 23.8 5.1 21.7 2.3 28.1 1.0
Women 22.2 1.8 32.9 8.0 5.4 2.1 14.6 1.8 25.0 0.9
*Current cigarette smokers are persons who reported smoking at least 100 cigarettes in their lives and who reported at the time of survey that they currently smoked every day or on some days. Data were age-adjusted to the 1990 U.S. census population.
†95% confidence interval. Source: National Center for Health Statistics, public use data tapes, 1994–1995.
Figure 13. Trends in the age-adjusted prevalence of current cigarette smoking among African American, American Indian and Alaska Native, Asian American and Pacific Islander, Hispanic, and white adults, National Health Interview Surveys, United States, 1978–1995 aggregate data
Note: Data were age-adjusted to the 1990 U.S. census population. Source: National Center for Health Statistics, public use data tapes, 1978–1995.
88 Chapter 2
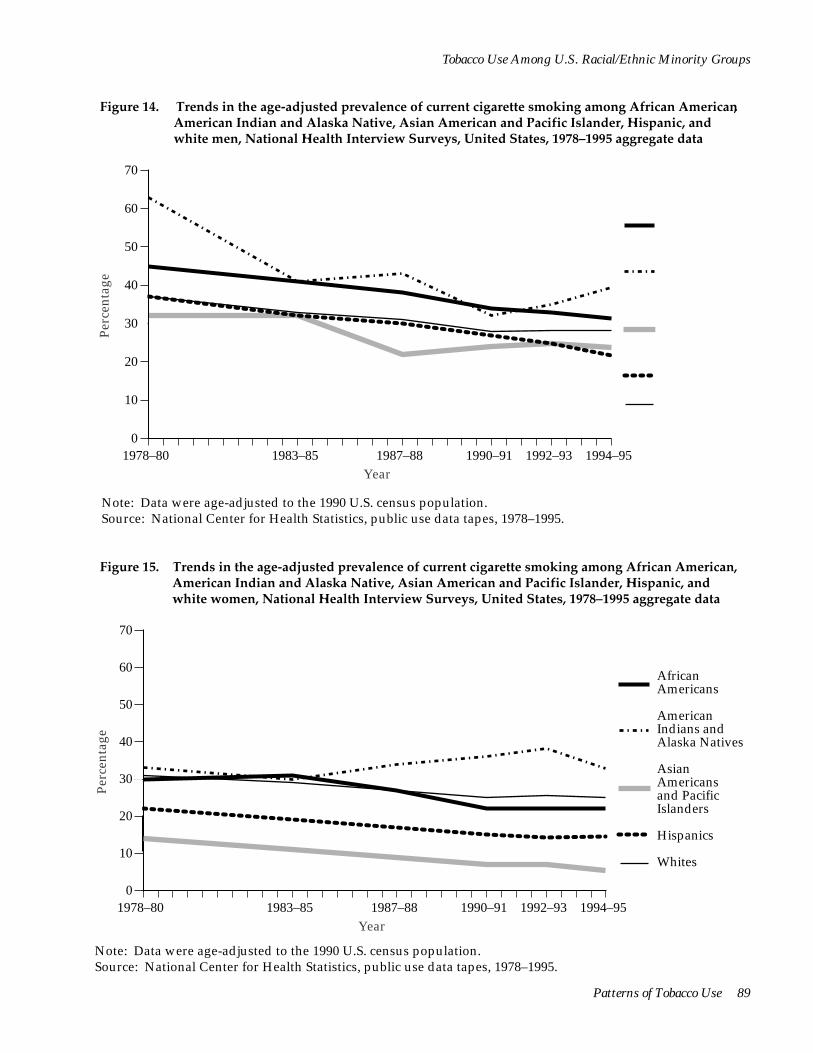
AfricanAmericans
AmericanIndians andAlaska Natives
AsianAmericans andPacificIslanders
Hispanics
Whites
70
60 African Americans
50 American
1978–80 1983–85 1987–88 1990–91 1992–93 1994–95 Year
Perc
enta
ge 40
30
20
10
0
Indians and Alaska Natives
Asian Americans and Pacific Islanders
Hispanics
Whites
Patterns of Tobacco Use 89
Tobacco Use Among U.S. Racial/Ethnic Minority Groups
Figure 14. Trends in the age-adjusted prevalence of current cigarette smoking among African American, American Indian and Alaska Native, Asian American and Pacific Islander, Hispanic, and white men, National Health Interview Surveys, United States, 1978–1995 aggregate data
Note: Data were age-adjusted to the 1990 U.S. census population. Source: National Center for Health Statistics, public use data tapes, 1978–1995.
Figure 15. Trends in the age-adjusted prevalence of current cigarette smoking among African American, American Indian and Alaska Native, Asian American and Pacific Islander, Hispanic, and white women, National Health Interview Surveys, United States, 1978–1995 aggregate data
Note: Data were age-adjusted to the 1990 U.S. census population. Source: National Center for Health Statistics, public use data tapes, 1978–1995.

<
<
<
Surgeon General's Report
Table 37. Cigarette smoking status*† and number of cigarettes smoked per day‡ among adults, overall and by race/ethnicity and gender, National Health Interview Surveys, United States, 1987, 1988, 1990, and 1991 aggregate data
African American Indians/ Asian Americans/ Characteristic Americans Alaska Natives Pacific Islanders
Total Never smokers 54.6 41.1 70.6 Former smokers 15.4 21.9 13.4 Current smokers 30.1 37.1 16.0
Cigarettes smoked per day <15 cigarettes 59.6 39.7 58.1
15–24 cigarettes 32.4 40.4 35.3 ≥25 cigarettes 8.0 19.9 6.5
Men Never smokers 44.6 36.1 56.8 Former smokers 19.6 26.0 19.6 Current smokers 35.9 38.0 23.6
Cigarettes smoked per day <15 cigarettes 54.1 27.5 56.1
15–24 cigarettes 36.3 49.7 37.8 ≥25 cigarettes 9.6 22.8 6.1
Women Never smokers 62.6 46.0 85.3 Former smokers 12.0 17.9 6.9 Current smokers 25.4 36.2 7.8
Cigarettes smoked per day <15 cigarettes 65.8 52.3 64.6
15–24 cigarettes 27.9 30.9 27.6 ≥25 cigarettes 6.3 16.8 7.9
Note: For racial/ethnic-specific data on cigars, pipes, chewing tobacco, snuff, or any form of tobacco, see Table 38. *Never smokers are those who reported that they had never smoked at least 100 cigarettes; former smokers are those who reported smoking at least 100 cigarettes in their lives but who reported at the time of survey that they did not currently smoke; and current smokers are persons who reported smoking at least 100 cigarettes in their lives and who reported at the time of survey that they currently smoked.
†95% confidence intervals for cigarette smoking status do not exceed ±0.6% for whites, ±1.4% for African Americans, ±3.1% for Asian Americans and Pacific Islanders, ±6.6% for American Indians and Alaska Natives, ±0.5% for all non-Hispanics, ±1.7% for all Hispanics, ±2.3% for Mexican Americans, ±5.2% for Puerto Ricans, ±6.5% for Cuban Americans, ±3.3% for other Hispanics, and ±0.5% for the total population.
Analyses of aggregated NHIS data from the 1987, Pacific Islanders (16.0 percent). The prevalence of 1988, 1990, and 1991 surveys indicate differing patterns never smoking cigarettes was highest among Asian in the prevalence of current smoking, never smoking, Americans and Pacific Islanders (70.6 percent) and former smoking, and cigarette consumption among lowest among American Indians and Alaska Natives members of the four racial/ethnic groups (Table 37) (41.1 percent). Rates of former cigarette smoking were (NCHS, public use data tapes, 1987, 1988, 1990, and highest among whites (26.0 percent) and lowest among 1991). The prevalence of current cigarette smoking was Asian Americans and Pacific Islanders (13.4 percent). highest among American Indians and Alaska Natives Overall, men were more likely than women to be cur(37.1 percent) and lowest among Asian Americans and rent or former smokers, whereas women were more
90 Chapter 2

Tobacco Use Among U.S. Racial/Ethnic Minority Groups
Hispanics
All Hispanics
Cuban Americans
Puerto Ricans
Mexican Americans
Other Hispanics Whites Total§
60.3 17.2 22.5
61.9 17.5 20.7
58.7 16.3 25.0
61.0 16.8 22.2
59.3 18.4 22.4
46.7 26.0 27.3
49.2 23.8 27.0
61.4 30.0 8.6
43.3 40.1 16.6
52.2 36.7 11.1
68.4 25.7 5.9
57.9 44.8 10.1
26.8 32.0 28.3
33.4 42.3 24.3
49.8 21.6 28.6
49.6 24.1 26.3
52.4 19.4 28.3
48.9 22.1 29.0
50.6 20.8 28.6
38.9 32.1 29.1
40.7 29.6 29.6
58.8 30.9 10.3
38.5 39.9 21.6
52.1 31.7 16.2
65.9 27.2 6.9
52.4 35.7 11.9
21.7 42.9 35.4
29.1 41.2 29.7
69.5 13.4 17.0
71.1 12.5 16.4
63.3 14.0 22.7
72.7 11.7 15.5
66.5 16.3 17.2
53.9 20.4 21.7
56.8 18.6 24.6
65.2 28.8 6.0
49.2 40.4 10.5
52.3 41.1 6.6
72.8 23.2 4.0
65.9 26.6 17.5
32.1 46.9 21.1
38.1 43.5 18.4
‡95% confidence intervals for the number of cigarettes smoked daily do not exceed ±0.8% for whites, ±2.2% for African Americans, ±9.7% for Asian Americans and Pacific Islanders, ±10.4% for American Indians and Alaska Natives, ±0.9% for all non-Hispanics, ±3.4% for all Hispanics, ±4.7% for Mexican Americans, ±8.6% for Puerto Ricans, ±12.4% for Cuban Americans, ±6.8% for other Hispanics, and ±0.8% for the total population.
§Includes persons of other, unknown, or multiple ethnicities and of unknown Hispanic origin. Source: Centers for Disease Control and Prevention 1994c.
likely than men never to have smoked. Among Afri-can Americans, Asian Americans and Pacific Island-ers, and all Hispanics except Cuban Americans, the majority of current smokers reported smoking fewer than 15 cigarettes per day, whereas whites, American Indians and Alaska Natives, and Cuban Americans were more likely than others to report smoking 25 or more cigarettes per day. For all groups except Puerto Ricans, women were much more likely than men to report smoking fewer than 15 cigarettes per day.
Pipe and Cigar Use
The prevalence of current pipe or cigar use has been higher among American Indians and Alaska Natives than among other racial/ethnic groups, accord-ing to aggregated data from the 1987 and 1991 NHISs (Table 38) (NCHS, public use data tapes, 1987 and 1991). Current pipe or cigar use occurred primarily among men; use was negligible among women of allracial/ethnic groups. The prevalence of cigar or pipe
Patterns of Tobacco Use 91
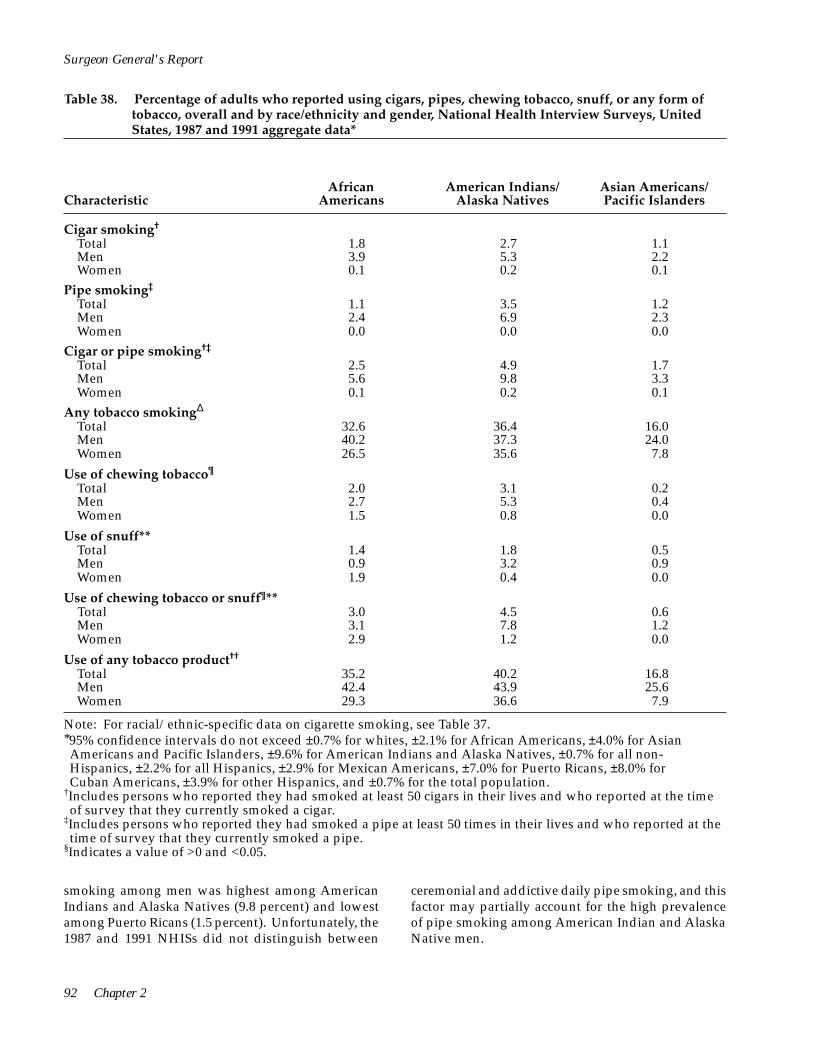
Surgeon General's Report
Table 38. Percentage of adults who reported using cigars, pipes, chewing tobacco, snuff, or any form of tobacco, overall and by race/ethnicity and gender, National Health Interview Surveys, United States, 1987 and 1991 aggregate data*
African Americans
American Indians/ Alaska Natives
Asian Americans/ Pacific Islanders Characteristic
Cigar smoking†
Total 1.8 2.7 1.1 Men 3.9 5.3 2.2 Women 0.1 0.2 0.1
Pipe smoking‡
Total 1.1 3.5 1.2 Men 2.4 6.9 2.3 Women 0.0 0.0 0.0
Cigar or pipe smoking†‡
Total 2.5 4.9 1.7 Men 5.6 9.8 3.3 Women 0.1 0.2 0.1
Any tobacco smokingΔ
Total 32.6 36.4 16.0 Men 40.2 37.3 24.0 Women 26.5 35.6 7.8
Use of chewing tobacco¶
Total 2.0 3.1 0.2 Men 2.7 5.3 0.4 Women 1.5 0.8 0.0
Use of snuff** Total 1.4 1.8 0.5 Men 0.9 3.2 0.9 Women 1.9 0.4 0.0
Use of chewing tobacco or snuff¶** Total 3.0 4.5 0.6
Men 3.1 7.8 1.2 Women 2.9 1.2 0.0
Use of any tobacco product††
Total 35.2 40.2 16.8 Men 42.4 43.9 25.6 Women 29.3 36.6 7.9
Note: For racial/ethnic-specific data on cigarette smoking, see Table 37. *95% confidence intervals do not exceed ±0.7% for whites, ±2.1% for African Americans, ±4.0% for Asian Americans and Pacific Islanders, ±9.6% for American Indians and Alaska Natives, ±0.7% for all non-Hispanics, ±2.2% for all Hispanics, ±2.9% for Mexican Americans, ±7.0% for Puerto Ricans, ±8.0% for Cuban Americans, ±3.9% for other Hispanics, and ±0.7% for the total population.
†Includes persons who reported they had smoked at least 50 cigars in their lives and who reported at the time of survey that they currently smoked a cigar.
‡Includes persons who reported they had smoked a pipe at least 50 times in their lives and who reported at the time of survey that they currently smoked a pipe.
§Indicates a value of >0 and <0.05.
smoking among men was highest among American ceremonial and addictive daily pipe smoking, and this Indians and Alaska Natives (9.8 percent) and lowest factor may partially account for the high prevalence among Puerto Ricans (1.5 percent). Unfortunately, the of pipe smoking among American Indian and Alaska 1987 and 1991 NHISs did not distinguish between Native men.
92 Chapter 2
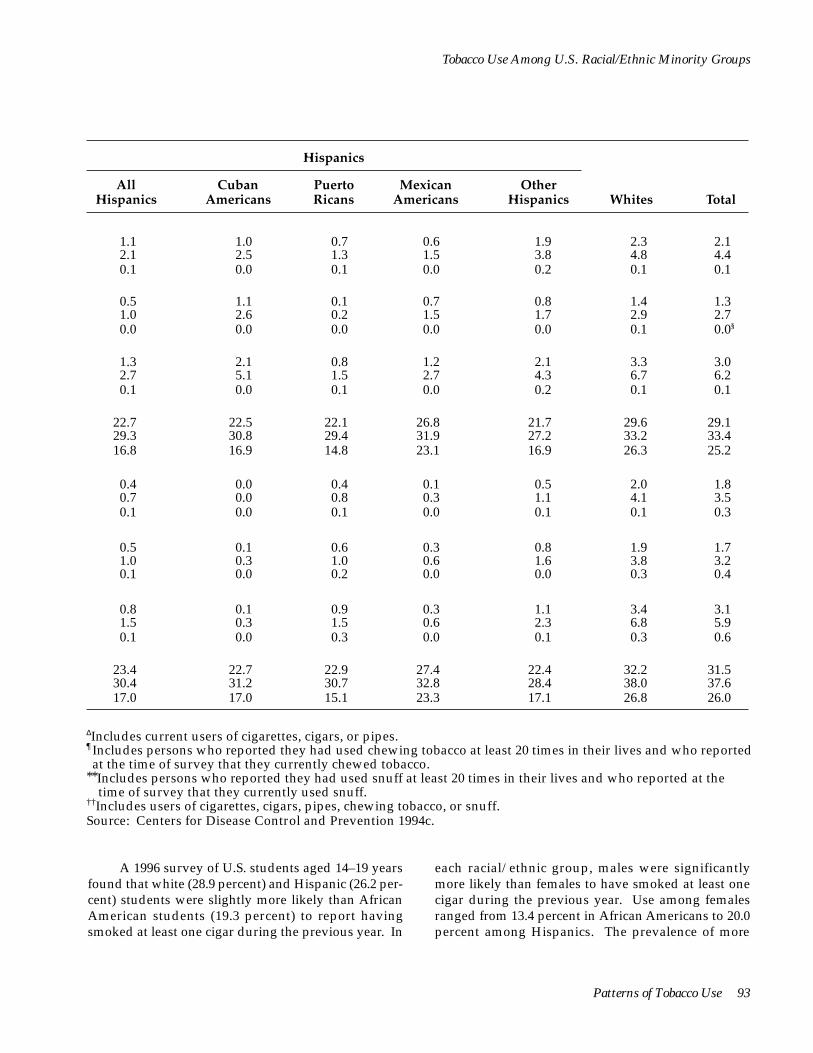
Tobacco Use Among U.S. Racial/Ethnic Minority Groups
Hispanics
All Hispanics
Cuban Americans
Puerto Ricans
Mexican Americans
Other Hispanics Whites Total
1.1 2.1 0.1
1.0 2.5 0.0
0.7 1.3 0.1
0.6 1.5 0.0
1.9 3.8 0.2
2.3 4.8 0.1
2.1 4.4 0.1
0.5 1.0 0.0
1.1 2.6 0.0
0.1 0.2 0.0
0.7 1.5 0.0
0.8 1.7 0.0
1.4 2.9 0.1
1.3 2.7 0.0§
1.3 2.7 0.1
2.1 5.1 0.0
0.8 1.5 0.1
1.2 2.7 0.0
2.1 4.3 0.2
3.3 6.7 0.1
3.0 6.2 0.1
22.729.3 16.8
22.5 30.8 16.9
22.1 29.4 14.8
26.8 31.9 23.1
21.7 27.2 16.9
29.6 33.2 26.3
29.1 33.4 25.2
0.4 0.7 0.1
0.0 0.0 0.0
0.4 0.8 0.1
0.1 0.3 0.0
0.5 1.1 0.1
2.0 4.1 0.1
1.8 3.5 0.3
0.5 1.0 0.1
0.1 0.3 0.0
0.6 1.0 0.2
0.3 0.6 0.0
0.8 1.6 0.0
1.9 3.8 0.3
1.7 3.2 0.4
0.8 1.5 0.1
0.1 0.3 0.0
0.9 1.5 0.3
0.3 0.6 0.0
1.1 2.3 0.1
3.4 6.8 0.3
3.1 5.9 0.6
23.4 30.4 17.0
22.7 31.2 17.0
22.9 30.7 15.1
27.4 32.8 23.3
22.4 28.4 17.1
32.2 38.0 26.8
31.5 37.6 26.0
ΔIncludes current users of cigarettes, cigars, or pipes.¶Includes persons who reported they had used chewing tobacco at least 20 times in their lives and who reported at the time of survey that they currently chewed tobacco.
**Includes persons who reported they had used snuff at least 20 times in their lives and who reported at the time of survey that they currently used snuff.
††Includes users of cigarettes, cigars, pipes, chewing tobacco, or snuff. Source: Centers for Disease Control and Prevention 1994c.
A 1996 survey of U.S. students aged 14–19 years each racial/ethnic group, males were significantly found that white (28.9 percent) and Hispanic (26.2 per- more likely than females to have smoked at least one cent) students were slightly more likely than African cigar during the previous year. Use among females American students (19.3 percent) to report having ranged from 13.4 percent in African Americans to 20.0 smoked at least one cigar during the previous year. In percent among Hispanics. The prevalence of more
Patterns of Tobacco Use 93
Surgeon General's Report
frequent cigar use did not differ by race/ethnicity; 3.6 percent of African Americans, 2.5 percent of Hispanics, and 2.3 percent of whites reported that they had smoked at least 50 cigars during the previous year (CDC 1997b).
Use of Smokeless Tobacco American Indians and Alaska Natives were the
most likely (4.5 percent) to use chewing tobacco or snuff, according to aggregated data from the 1987 and 1991 NHISs, whereas Asian Americans and Pacific Islanders (0.6 percent) as well as Hispanics (0.8 percent) were the least likely to use smokeless tobacco (Table 38).
Conclusions
Among all racial/ethnic groups except African Americans, men were much more likely than women to use chewing tobacco or snuff. Among African American women, the use of smokeless tobacco has been highest among those aged 65 years and older (CDC 1994c). These findings are consistent with those in published studies (Bauman et al. 1989; Novotny et al. 1989; Rouse 1989), although they differ somewhat from the 1985 CPS estimates for males aged 16 years and older; these estimates showed rates of reported snuff use among African Americans (0.7 percent) and whites (2.2 percent) that were significantly lower than the NHIS-based rates reported here (Marcus et al. 1989).
1. In 1978–1995, the prevalence of cigarette smoking declined among African American, Asian American and Pacific Islander, and Hispanic adults. However, among American Indians and Alaska Natives, current smoking prevalence did not change for men from 1983 to 1995 or for women from 1978 to 1995.
2. Tobacco use varies within and among racial/ ethnic groups; among adults, American Indians and Alaska Natives have the highest prevalence of tobacco use; African American and Southeast Asian men also have a high prevalence of smoking. Asian American and Hispanic women have the lowest prevalence.
3. In all racial/ethnic groups discussed in this report except American Indians and Alaska Natives, men have a higher prevalence of cigarette smoking than women.
4. In all racial/ethnic groups except African Americans, men are more likely than women to use smokeless tobacco.
5. Cigarette smoking prevalence increased in the 1990s among African American and Hispanic adolescents after several years of substantial decline among adolescents of all four racial/ethnic minority groups. This increase is particularly striking among African American youths, who had the greatest decline of the four groups during the 1970s and 1980s.
and Alaska Native women of reproductive age and has not declined as it has among African American, Asian American and Pacific Islander, and Hispanic women of reproductive age.
6. Since 1978, the prevalence of cigarette smoking has remained strikingly high among American Indian
7. Declines in smoking prevalence were greater among African American, Hispanic, and white men who were high school graduates than they were among those with less formal education. Among women in these three groups, education-related declines in cigarette smoking were less pronounced.
8. Educational attainment accounts for only some of the differences in smoking behaviors (current smoking, heavy smoking, ever smoking, and smoking cessation) between whites and the racial/ ethnic minority groups discussed in this report. Other biological, social, and cultural factors are likely to further account for these differences.
9. Compared with whites who smoke, smokers in each of the four racial/ethnic minority groups smoke fewer cigarettes each day. Among smokers, African Americans, Asian Americans and Pacific Islanders, and Hispanics are more likely than whites to smoke occasionally (less than daily).
10. The data in general suggest that acculturation influences smoking patterns in that individuals tend to adopt the smoking behavior of the current broader community; however, the exact effects of acculturation on smoking behavior are difficult to quantify because of limitations on most available measures of this cultural learning process.
94 Chapter 2
Tobacco Use Among U.S. Racial/Ethnic Minority Groups
Appendix 1. Sources of Data
Most of the data reported in this chapter were collected through a number of large-scale surveys conducted by the federal government or private researchers. When data from one period were insufficient (e.g., because of small sample size) for estimating the prevalence of a risk factor or a behavior, they were combined with similar data for several periods, provided the prevalence under consideration had not changed rapidly over the periods being aggregated. This process, used in some of the NHIS and BRFSS analyses, increased the reliability and stability of prevalence estimates (CDC 1992e).
The data reported in this chapter are limited in several ways. For example, because some racial/ ethnic groups were underrepresented in the data sources, the small number of responses may not be representative of the group as a whole. Moreover, most surveys have been conducted in English only, thus limiting the validity of the responses of individuals with limited proficiency in English, particularly among Asian Americans, Pacific Islanders, and Hispanics. In addition, some surveys have used telephone surveys (excluding persons who lack telephone service) or school surveys (excluding youths who dropped out of school or who were frequently absent from class); these surveys have thus excluded a number of respondents who may be at increased risk for cigarette smoking. Despite these limitations, the patterns described in this chapter are the first and largest effort to present a comprehensive perspective on cigarette use among members of racial/ethnic minority groups in the United States.
National Health Interview Survey (NHIS)
Since 1965, the CDC’s NCHS has collected data on tobacco use through the NHIS, which uses a probability sample of noninstitutionalized adult civilians in the United States (NCHS 1975, 1985a, 1989). Some NHISs have excluded adults 18 and 19 years of age; however, this report uses data from surveys that have included respondents who were aged 18 years and older (i.e., 1978, 1979, 1980, 1983, 1985, 1987, 1988, 1990, 1991, 1992, 1993, 1994, and 1995). Most interviews were conducted in the home; when respondents could not be interviewed in person, telephone interviews were conducted. The overall NHIS response rate for
surveys on smoking has remained at least 85 percent (NCHS 1985a). Overall, sample sizes have ranged from 10,342 in 1980 to 86,332 in 1966. In this report, data have been adjusted for nonresponse and have been weighted to provide national estimates. Confidence intervals have been calculated by using standard errors generated by the Professional Software for Survey Data Analysis (SUDAAN) (Shah et al. 1991). Responses from various administrations of the NHIS have been aggregated to produce more stable results for Hispanics, Asian Americans and Pacific Islanders, and American Indians and Alaska Natives.
Hispanic Health and Nutrition Examination Survey (HHANES)
The NCHS conducted the HHANES from 1982 through 1984 to assess the health and nutritional status and needs of Cuban Americans, Mexican Americans, and mainland Puerto Ricans. No other equivalent source of recent data is available for Hispanics. This survey sampled Mexican Americans from Arizona, California, Colorado, New Mexico, and Texas; Cuban Americans from Dade County, Florida (Miami); and Puerto Ricans from New York, New Jersey, and Connecticut. Demographic and cigarette smoking information were collected from Hispanics aged 20–74 years. All interviews were conducted in the home or in a mobile examination center. NCHS estimates that the HHANES data represent approximately 76 percent of the 1980 Hispanic-origin population. All data in this report have been adjusted and weighted for the complex sample design, nonresponse bias, potential noncoverage bias, and regional nature of the sample (NCHS 1985b).
Behavioral Risk Factor Surveillance System (BRFSS)
The CDC’s National Center for Chronic Disease Prevention and Health Promotion coordinates the state surveillance of behavioral risk factors through the BRFSS, initiated in 1981 (Gentry et al. 1985; Remington et al. 1988). Each state that participates in the BRFSS provides estimates of numerous risk behaviors for the state’s population of persons aged 18 years and older.
Patterns of Tobacco Use 95
Surgeon General's Report
States collect data through random digit-dialed telephone interviews. BRFSS sample sizes have ranged from 476 in Indiana in 1984 to 3,988 in California in 1992. Since 1991, at least 1,178 persons have been sampled in each state. In this report, the data have been weighted to reflect the age, race/ethnicity, and gender distribution of each participating state. Ninety-five percent confidence intervals have been calculated by using the Standard Errors Program for Computing of Standardized Rates from Sample Survey Data (SESUDAAN) (Shah 1981).
Adult Use of Tobacco Survey (AUTS)
Since 1964, the AUTS has been conducted periodically to determine rates of tobacco use as well as descriptive information on smoking patterns among representative samples of the U.S. population. Information gathered has included a history of individual use of any tobacco product as well as attitudes and beliefs about smoking-related issues. The AUTS was conducted in 1964, 1966, 1970, and 1975 by the USDHEW's National Clearinghouse for Smoking and Health, and the most recent survey was conducted in 1986 by the CDC’s Office on Smoking and Health. In the 1986 AUTS, a computer-assisted telephone interview protocol (random-digit dialing) was used to survey 13,031 noninstitutionalized civilian U.S. adults (>17 years of age). Population estimates were obtained by weighting the sample according to smoking status, age, race/ethnicity, gender, education, and geographic region (USDHHS 1990b).
Monitoring the Future (MTF) Surveys
Each spring since 1975, the University of Michigan’s Institute for Social Research, with grants from NIDA, has surveyed nationally representative samples of high school seniors as part of the MTF. Sample sizes have ranged from 15,850 to 18,448. The data in this report have been weighted to provide national estimates. Analyses were conducted on data collected for 1976–1994. Data from subsequent years were obtained from published reports (e.g., Johnston et al. 1996) and from the University of Michigan’s Institute for Social Research. Since 1991, data have been collected for eighth- and tenth-grade students. Some data from these surveys are cited in this report (Johnston et al. 1993b, 1995a, 1996).
Youth Risk Behavior Survey (YRBS)
The CDC developed the Youth Risk Behavior Surveillance System to measure six categories of priority health-risk behaviors, including tobacco use, among adolescents. Data were collected through national, state, and local school-based surveys of high school students, conducted during the spring of odd-numbered years, and a national household-based survey of youths aged 12–21 years, conducted during 1992 (Kolbe 1990; Kolbe et al. 1993; CDC 1996). Data from the 1991 and 1995 national school-based surveys and the 1992 national household survey are cited in this report (USDHHS 1994; CDC 1996; Lowry et al. 1996).
The national school-based YRBSs each used a three-stage cluster sample design to draw a nationally representative sample of ninth- to twelfth-grade students in public and private schools in all 50 states and the District of Columbia. Schools having a substantial proportion of African American and Hispanic students were oversampled. The questionnaire was administered in the classroom by trained data collectors. The data were weighted to provide national estimates.
The 1992 YRBS was a follow-back survey to the 1992 NHIS. The sample of young people aged 12–21 years was drawn from families who were interviewed for the 1992 NHIS. Participants responded in person. Respondents listened through a headset to an audiocassette containing previously recorded questions. Respondents recorded their responses on answer sheets, which were returned to the interviewers in sealed envelopes. The data were weighted to provide national estimates.
Teenage Attitudes and Practices Survey (TAPS)
In 1989 and 1993, the U.S. Public Health Service conducted the TAPS to collect data on knowledge, attitudes, and practices regarding tobacco use from a national household sample of adolescents (aged 12–18 years) through telephone interviews. The 1993 TAPS included a longitudinal component (TAPS-II) in which 7,960 (87.1 percent) of the 9,135 respondents to the 1989 TAPS were reinterviewed; these respondents were 15– 22 years of age during TAPS-II. TAPS-II also included 4,992 persons from a new probability sample. In this report, data on 9,135 TAPS respondents and 7,311 TAPSII respondents have been analyzed. Data have been weighted to provide national estimates, and confidence intervals have been calculated by using the standard errors generated by the SUDAAN (Shah et al. 1991).
96 Chapter 2

Tobacco Use Among U.S. Racial/Ethnic Minority Groups
Appendix 2. Measures of Tobacco Use
Several measures of tobacco use among members of racial/ethnic groups can be derived from state and national surveys and other data sources. The most common measures include cigarette smoking and cessation; the number of cigarettes smoked daily; and the use of cigars, pipes, and smokeless tobacco.
Cigarette Smoking and Cessation
The NHIS gathers information on a range of cigarette smoking behaviors, using some of the following terms and measurements:
• For 1978–1991, current smokers are defined as those who have smoked 100 or more cigarettes in their lifetime and who report at the time of survey that they currently smoke. For 1992–1995, current smokers are defined as those who have smoked at least 100 cigarettes in their lives and who report at the time of survey that they currently smoke every day or on some days.
• Former smokers are those who have smoked 100 or more cigarettes in their lifetime and who do not currently smoke.
• Never smokers are those who have smoked fewer than 100 cigarettes in their lifetime.
• Ever smokers consist of current smokers and former smokers.
• The prevalence of cessation (or quit ratio) is defined as the percentage of ever smokers who are former smokers (Fiore et al. 1989; USDHHS 1989, 1990a).
NHIS data on age at initiation of regular smoking and on duration of abstinence for former smokers have been used to reconstruct the prevalence of cigarette smoking for the decades in this century before systematic surveillance of cigarette smoking was conducted (NCI 1991). Information such as the respondent’s date of birth, age at initiation of smoking, and age at cessation for former smokers can be used to assess the smoking status of a respondent for any given year. Similar analyses have been reported in previous Surgeon General’s reports (USDHHS 1980, 1985) and in the literature (Harris 1983; Escobedo and Remington 1989; Pierce et al. 1991b).
The BRFSS has routinely reported estimates of “regular” cigarette smoking. Current regular smokers are defined as those (1) who report that they have
smoked ≥100 cigarettes and that they currently smoke and (2) who do not respond that they are occasional smokers when asked to report the average number of cigarettes they smoke daily. The use of a measure of current regular smoking generally results in median prevalence estimates that are about 0.7 to 1.0 percentage points lower than those estimates that include current occasional smokers (CDC 1994c). The BRFSS defines and calculates the prevalence of smoking cessation in the same manner as is done in the NHIS.
In the MTF surveys, current cigarette use patterns are defined as any use of cigarettes within the 30 days preceding the survey. This same definition was used for current alcohol, marijuana, cocaine, and any other illicit drug use.
Number of Cigarettes Smoked Daily
Cigarette consumption traditionally has been reported in three categories: (1) smoking fewer than 15 cigarettes per day, (2) smoking between 15 and 24 cigarettes per day, and (3) smoking 25 or more cigarettes per day. In the NHISs and the BRFSS surveys, respondents were asked to report the actual number of cigarettes smoked per day.
In the 1978–1991 NHISs, cigarette consumption was defined as the average number of cigarettes that current smokers reported smoking each day. Starting in 1992, however, current smokers who reported that they smoked only on some days were asked to report the number of days out of the past 30 days that they smoked any cigarettes and the average number of cigarettes they smoked on the days that they smoked.
The MTF survey asks respondents how frequently they have smoked during the previous 30 days. Possible responses are “not at all,” “less than one cigarette per day,” “one to five cigarettes per day,” “about one-half pack per day,” “about one pack per day,” “about one and one-half packs per day,” and “two packs or more per day.”
Use of Cigars, Pipes, and Smokeless Tobacco
The 1987 and 1991 NHISs defined current cigar smokers as those who had smoked 50 or more cigars in their lifetime and who were current cigar smokers, and they defined current pipe smokers as those who had smoked 50 or more pipes full of tobacco and who
Patterns of Tobacco Use 97

Surgeon General's Report
were current pipe smokers. Current snuff users were defined as those who had used snuff 20 or more times and were currently snuff users. The same logic was used to classify chewing tobacco users.
In the BRFSS surveys, smokeless tobacco users were defined as those who said that they had ever used smokeless tobacco (such as chewing tobacco or snuff) and who were current users of any smokeless tobacco products.
Appendix 3. Patterns of Cigarette Use Among Whites
Table 39. Percentage of white adults who reported being current cigarette smokers,* overall and by gender, age, and education, National Health Interview Surveys, United States, 1965–1995
Characteristic
1965 ____________ % ±CI‡
1966 ____________ % ±CI
1970 ____________ % ±CI
1974 ____________ % ±CI
Total 42.1 0.6 42.4 0.5 37.0 0.7 36.4 0.8
Gender Men Women
51.1 0.8 51.8 0.8 43.2 0.8 41.9 1.0 34.0 0.7 33.9 0.7 31.6 1.0 31.7 1.1
Age (years) 18–34 35–54
≥55
48.6 1.0 48.3 0.9 41.3 1.0 40.7 1.6 48.5 0.9 48.7 0.9 42.8 0.9 41.9 1.1 26.3 0.9 27.4 0.9 25.1 0.9 24.9 1.1
Education§
Less than high school High school Some college College
NA NA 41.3 0.9 37.1 1.0 36.9 1.3 41.9Δ 0.7 44.3 1.0 39.0 0.9 38.1 1.3 NA NA 44.4 1.8 38.5 1.4 37.9 2.0 40.4Δ 1.3 35.2 1.8 28.6 1.5 28.2 1.7
1985 ____________ % ±CI
1987 ____________ % ±CI
1988 ____________ % ±CI
1990 ____________ % ±CI Characteristic
Total 29.9 0.7 29.0 0.7 28.2 0.6 25.9 0.6
Gender Men Women
31.8 1.0 30.6 0.9 30.3 0.9 27.8 0.9 28.2 0.9 27.5 0.8 26.3 0.7 24.1 0.8
Age (years) 18–34 35–54
≥55
33.6 1.2 32.2 1.1 31.9 1.1 29.7 1.0 33.7 1.2 33.7 1.0 32.1 1.0 29.9 1.0 21.5 1.0 20.2 0.9 19.7 0.8 16.8 0.8
Education§
Less than high school High school Some college College
33.7 1.6 34.8 1.6 33.7 1.3 32.0 1.5 33.1 1.2 32.6 1.1 32.6 1.0 30.0 1.0 30.3 1.6 28.5 1.3 27.8 1.3 24.9 1.2 18.3 1.2 16.9 1.0 16.2 1.0 13.7 0.9
*Data collected before 1978 do not distinguish between whites of Hispanic origin and non-Hispanic whites; these data exclude those whites who indicated they were of Hispanic origin. For 1978–1991, current cigarette smokers include persons who reported smoking at least 100 cigarettes in their lives and who reported at the time of survey that they currently smoked. For 1992–1995, current smokers include persons who reported smoking at least 100 cigarettes in their lives and who reported at the time of survey that they currently smoked every day or on some days.
98 Chapter 2
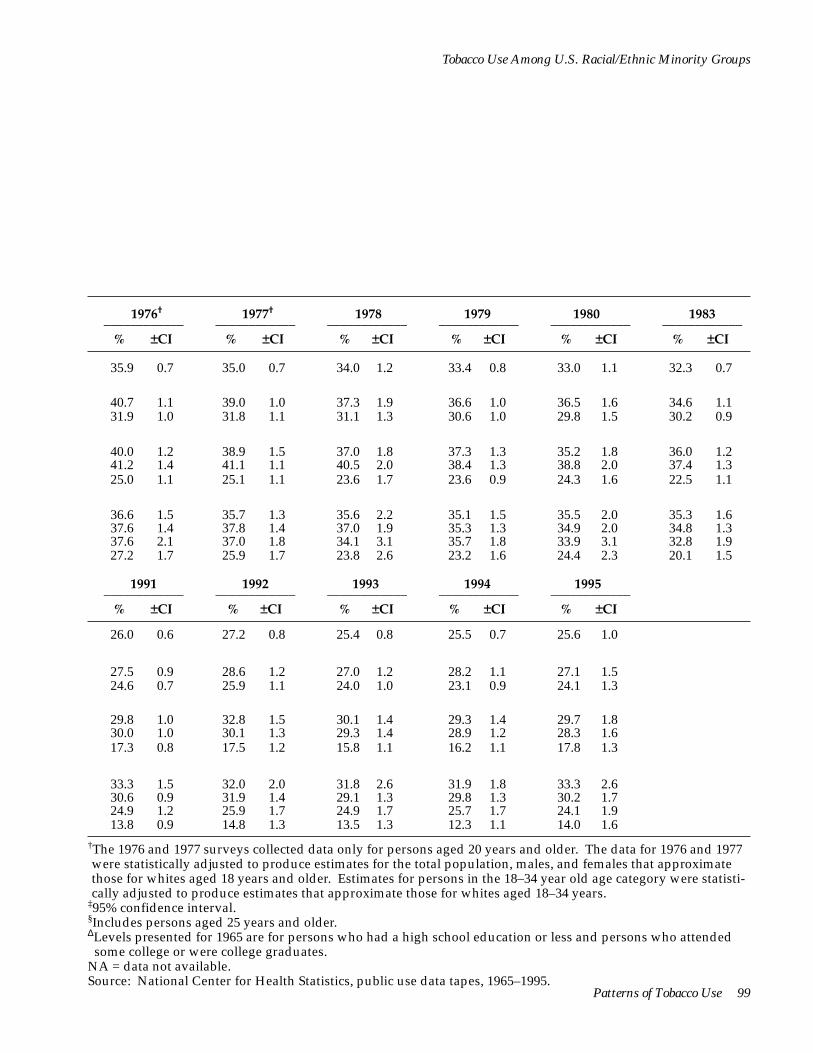
Patterns of Tobacco Use 99
Tobacco Use Among U.S. Racial/Ethnic Minority Groups
1976†____________
% ±CI
1977†____________
% ±CI
1978____________ % ±CI
1979 ____________ % ±CI
1980 ____________ % ±CI
1983 ____________ % ±CI
35.9 0.7 35.0 0.7 34.0 1.2 33.4 0.8 33.0 1.1 32.3 0.7
40.7 1.1 39.0 1.0 37.3 1.9 36.6 1.0 36.5 1.6 34.6 1.1 31.9 1.0 31.8 1.1 31.1 1.3 30.6 1.0 29.8 1.5 30.2 0.9
40.0 1.2 38.9 1.5 37.0 1.8 37.3 1.3 35.2 1.8 36.0 1.2 41.2 1.4 41.1 1.1 40.5 2.0 38.4 1.3 38.8 2.0 37.4 1.3 25.0 1.1 25.1 1.1 23.6 1.7 23.6 0.9 24.3 1.6 22.5 1.1
36.6 1.5 35.7 1.3 35.6 2.2 35.1 1.5 35.5 2.0 35.3 1.6 37.6 1.4 37.8 1.4 37.0 1.9 35.3 1.3 34.9 2.0 34.8 1.3 37.6 2.1 37.0 1.8 34.1 3.1 35.7 1.8 33.9 3.1 32.8 1.9 27.2 1.7 25.9 1.7 23.8 2.6 23.2 1.6 24.4 2.3 20.1 1.5
1991 ____________ % ±CI
1992 ____________ % ±CI
1993 ____________ % ±CI
1994 ____________ % ±CI
1995 ____________ % ±CI
26.0 0.6 27.2 0.8 25.4 0.8 25.5 0.7 25.6 1.0
27.5 0.9 28.6 1.2 27.0 1.2 28.2 1.1 27.1 1.5 24.6 0.7 25.9 1.1 24.0 1.0 23.1 0.9 24.1 1.3
29.8 1.0 32.8 1.5 30.1 1.4 29.3 1.4 29.7 1.8 30.0 1.0 30.1 1.3 29.3 1.4 28.9 1.2 28.3 1.6 17.3 0.8 17.5 1.2 15.8 1.1 16.2 1.1 17.8 1.3
33.3 1.5 32.0 2.0 31.8 2.6 31.9 1.8 33.3 2.6 30.6 0.9 31.9 1.4 29.1 1.3 29.8 1.3 30.2 1.7 24.9 1.2 25.9 1.7 24.9 1.7 25.7 1.7 24.1 1.9 13.8 0.9 14.8 1.3 13.5 1.3 12.3 1.1 14.0 1.6
†The 1976 and 1977 surveys collected data only for persons aged 20 years and older. The data for 1976 and 1977 were statistically adjusted to produce estimates for the total population, males, and females that approximate those for whites aged 18 years and older. Estimates for persons in the 18–34 year old age category were statistically adjusted to produce estimates that approximate those for whites aged 18–34 years.
‡95% confidence interval. §Includes persons aged 25 years and older.ΔLevels presented for 1965 are for persons who had a high school education or less and persons who attended some college or were college graduates.
NA = data not available. Source: National Center for Health Statistics, public use data tapes, 1965–1995.
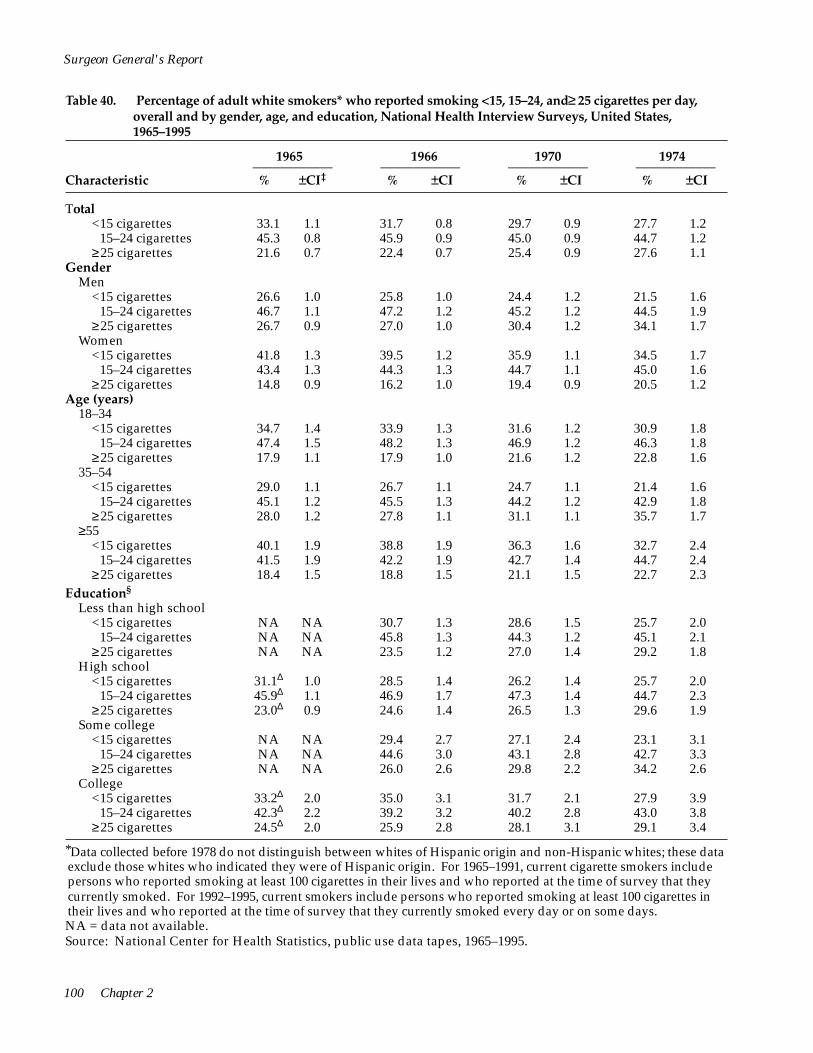
<
<
<
<
<
<
<
<15–24 cigarettes
<
<15–24 cigarettes
Surgeon General's Report
Table 40. Percentage of adult white smokers* who reported smoking <15, 15–24, and ≥ 25 cigarettes per day, overall and by gender, age, and education, National Health Interview Surveys, United States, 1965–1995
1965 1966 1970 1974 ____________ ____________ ____________ ____________ Characteristic % ±CI‡ % ±CI % ±CI % ±CI
Total <15 cigarettes 33.1 1.1 31.7 0.8 29.7 0.9 27.7 1.2
15–24 cigarettes 45.3 0.8 45.9 0.9 45.0 0.9 44.7 1.2 ≥25 cigarettes 21.6 0.7 22.4 0.7 25.4 0.9 27.6 1.1
Gender Men
<15 cigarettes 26.6 1.0 25.8 1.0 24.4 1.2 21.5 1.6 15–24 cigarettes 46.7 1.1 47.2 1.2 45.2 1.2 44.5 1.9
≥25 cigarettes 26.7 0.9 27.0 1.0 30.4 1.2 34.1 1.7 Women
<15 cigarettes 41.8 1.3 39.5 1.2 35.9 1.1 34.5 1.7 15–24 cigarettes 43.4 1.3 44.3 1.3 44.7 1.1 45.0 1.6
≥25 cigarettes 14.8 0.9 16.2 1.0 19.4 0.9 20.5 1.2 Age (years)
18–34 <15 cigarettes 34.7 1.4 33.9 1.3 31.6 1.2 30.9 1.8
15–24 cigarettes 47.4 1.5 48.2 1.3 46.9 1.2 46.3 1.8 ≥25 cigarettes 17.9 1.1 17.9 1.0 21.6 1.2 22.8 1.6
35–54 <15 cigarettes 29.0 1.1 26.7 1.1 24.7 1.1 21.4 1.6
15–24 cigarettes 45.1 1.2 45.5 1.3 44.2 1.2 42.9 1.8 ≥25 cigarettes 28.0 1.2 27.8 1.1 31.1 1.1 35.7 1.7
≥55 <15 cigarettes 40.1 1.9 38.8 1.9 36.3 1.6 32.7 2.4
15–24 cigarettes 41.5 1.9 42.2 1.9 42.7 1.4 44.7 2.4 ≥25 cigarettes 18.4 1.5 18.8 1.5 21.1 1.5 22.7 2.3
Education§
Less than high school <15 cigarettes NA NA 30.7 1.3 28.6 1.5 25.7 2.0
15–24 cigarettes NA NA 45.8 1.3 44.3 1.2 45.1 2.1 ≥25 cigarettes NA NA 23.5 1.2 27.0 1.4 29.2 1.8
High school <15 cigarettes
≥25 cigarettes
31.1Δ 1.0 28.5 1.4 26.2 1.4 25.7 2.0 45.9Δ 1.1 46.9 1.7 47.3 1.4 44.7 2.3 23.0Δ 0.9 24.6 1.4 26.5 1.3 29.6 1.9
Some college <15 cigarettes NA NA 29.4 2.7 27.1 2.4 23.1 3.1
15–24 cigarettes NA NA 44.6 3.0 43.1 2.8 42.7 3.3 ≥25 cigarettes NA NA 26.0 2.6 29.8 2.2 34.2 2.6
College <15 cigarettes
≥25 cigarettes
33.2Δ 2.0 35.0 3.1 31.7 2.1 27.9 3.9 42.3Δ 2.2 39.2 3.2 40.2 2.8 43.0 3.8 24.5Δ 2.0 25.9 2.8 28.1 3.1 29.1 3.4
*Data collected before 1978 do not distinguish between whites of Hispanic origin and non-Hispanic whites; these data exclude those whites who indicated they were of Hispanic origin. For 1965–1991, current cigarette smokers include persons who reported smoking at least 100 cigarettes in their lives and who reported at the time of survey that they currently smoked. For 1992–1995, current smokers include persons who reported smoking at least 100 cigarettes in their lives and who reported at the time of survey that they currently smoked every day or on some days. NA = data not available. Source: National Center for Health Statistics, public use data tapes, 1965–1995.
100 Chapter 2

Tobacco Use Among U.S. Racial/Ethnic Minority Groups
1976†____________
% ±CI
1977†____________
% ±CI
1978____________ % ±CI
1979 ____________ % ±CI
1980 ____________ % ±CI
1983 ____________ % ±CI
27.8 1.2 26.9 1.2 23.7 1.5 24.4 1.0 23.2 1.6 23.8 1.2 45.2 1.3 43.6 1.4 44.7 1.7 44.7 1.3 44.6 1.9 46.8 1.4 27.0 1.2 27.5 1.4 31.6 1.6 30.9 1.2 32.2 1.9 29.4 1.3
22.0 1.6 20.5 1.3 17.8 1.9 20.0 1.2 17.7 2.2 17.8 1.5 45.2 1.6 41.6 1.7 43.6 2.5 43.1 1.7 44.3 2.7 45.1 2.0 32.8 1.7 33.5 1.8 38.6 2.3 36.9 1.7 38.0 2.7 37.1 1.6
34.0 1.7 33.7 1.6 30.1 2.4 29.2 1.6 29.3 2.1 30.1 1.7 45.1 1.8 45.8 1.9 45.8 2.3 46.5 1.9 44.8 2.6 48.4 1.9 21.0 1.5 21.0 1.6 24.1 2.3 24.4 1.5 25.9 2.3 21.5 1.6
30.0 1.8 29.9 1.7 25.2 2.2 26.5 1.7 25.2 2.7 27.5 1.9 47.3 1.9 45.9 1.9 47.8 2.6 47.4 1.8 48.0 2.9 49.9 2.0 22.6 1.9 21.9 2.1 27.0 2.7 26.1 1.5 26.9 2.6 22.7 1.7
22.7 1.7 21.2 1.8 19.0 2.3 19.2 1.5 17.6 2.6 18.0 1.7 43.3 2.0 42.6 2.0 41.5 2.7 41.8 2.2 40.5 2.9 42.6 2.2 34.0 1.8 36.3 2.0 39.5 2.4 39.0 2.2 41.9 3.4 39.4 2.2
32.0 2.5 31.6 2.6 28.9 3.6 28.8 2.6 28.7 3.2 26.0 2.5 43.8 2.7 42.9 2.9 43.9 4.1 44.1 3.0 44.7 3.7 47.3 2.9 24.2 2.3 25.6 2.5 27.2 3.7 27.2 2.5 26.6 3.3 26.7 2.5
26.7 1.9 26.2 2.1 23.3 2.9 23.1 2.0 21.2 3.0 20.4 2.2 44.5 2.2 43.3 2.7 44.1 3.3 44.0 2.6 44.9 3.7 45.4 2.9 28.8 2.2 30.5 2.3 32.7 2.4 32.9 2.2 33.9 3.6 34.3 2.7
24.2 1.8 22.7 1.7 22.4 2.5 20.5 1.7 21.0 2.7 21.3 1.8 46.3 2.3 45.6 2.1 43.8 2.7 46.0 2.3 44.6 3.5 46.0 2.3 29.5 2.2 31.7 2.1 33.8 2.9 33.5 2.1 34.4 3.4 32.7 2.2
26.2 3.6 27.8 3.2 18.9 3.2 22.0 3.0 18.0 4.2 21.2 2.9 41.8 3.4 41.4 3.6 44.2 5.7 42.1 3.2 45.9 5.5 46.3 3.6 32.0 3.4 30.8 3.1 37.0 5.5 35.9 3.0 36.0 4.7 32.5 3.4
30.4 3.7 30.4 3.1 25.8 5.2 29.6 3.7 27.7 5.0 28.4 3.8 41.2 4.4 40.2 3.8 41.1 5.9 37.2 3.9 35.2 5.4 40.9 4.2 28.4 3.3 29.4 3.7 33.2 4.7 33.2 3.6 37.1 5.7 30.7 4.2
†The 1976 and 1977 surveys collected data only for persons aged 20 years and older. The data for 1976 and 1977 were statistically adjusted to produce estimates for the total population, males, and females that approximate those for whites aged 18 years and older. Estimates for persons in the 18–34 year old age category were statistically adjusted to produce estimates that approximate those for whites aged 18–34 years.
‡95% confidence interval. §Includes persons aged 25 years and older.ΔLevels presented for 1965 are for persons who had a high school education or less and persons who attended some college or were college graduates.
Patterns of Tobacco Use 101
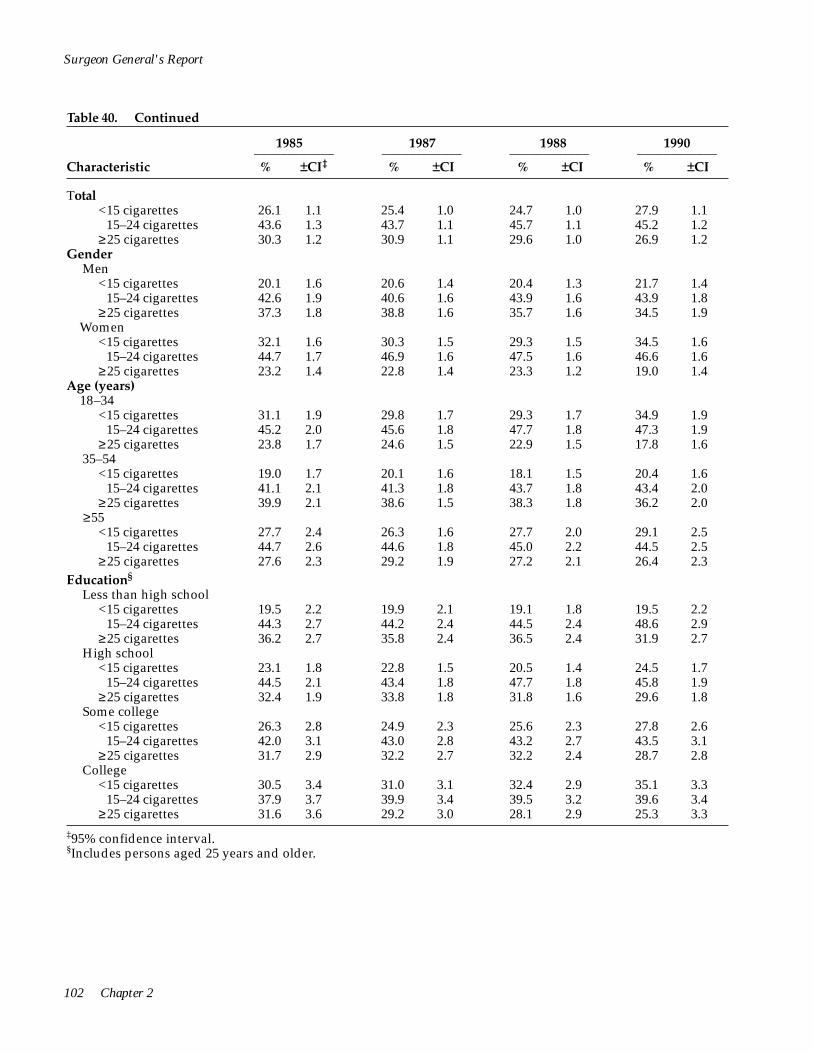
<
<
<
<
<
<
<
<
<
<
Surgeon General's Report
Table 40. Continued
1985 1987 1988 1990 ____________ ____________ ____________ ____________ Characteristic % ±CI‡ % ±CI % ±CI % ±CI
Total <15 cigarettes 26.1 1.1 25.4 1.0 24.7 1.0 27.9 1.1
15–24 cigarettes 43.6 1.3 43.7 1.1 45.7 1.1 45.2 1.2 ≥25 cigarettes 30.3 1.2 30.9 1.1 29.6 1.0 26.9 1.2
Gender Men
<15 cigarettes 20.1 1.6 20.6 1.4 20.4 1.3 21.7 1.4 15–24 cigarettes 42.6 1.9 40.6 1.6 43.9 1.6 43.9 1.8
≥25 cigarettes 37.3 1.8 38.8 1.6 35.7 1.6 34.5 1.9 Women
<15 cigarettes 32.1 1.6 30.3 1.5 29.3 1.5 34.5 1.6 15–24 cigarettes 44.7 1.7 46.9 1.6 47.5 1.6 46.6 1.6
≥25 cigarettes 23.2 1.4 22.8 1.4 23.3 1.2 19.0 1.4 Age (years)
18–34 <15 cigarettes 31.1 1.9 29.8 1.7 29.3 1.7 34.9 1.9
15–24 cigarettes 45.2 2.0 45.6 1.8 47.7 1.8 47.3 1.9 ≥25 cigarettes 23.8 1.7 24.6 1.5 22.9 1.5 17.8 1.6
35–54 <15 cigarettes 19.0 1.7 20.1 1.6 18.1 1.5 20.4 1.6
15–24 cigarettes 41.1 2.1 41.3 1.8 43.7 1.8 43.4 2.0 ≥25 cigarettes 39.9 2.1 38.6 1.5 38.3 1.8 36.2 2.0
≥55 <15 cigarettes 27.7 2.4 26.3 1.6 27.7 2.0 29.1 2.5
15–24 cigarettes 44.7 2.6 44.6 1.8 45.0 2.2 44.5 2.5 ≥25 cigarettes 27.6 2.3 29.2 1.9 27.2 2.1 26.4 2.3
Education§
Less than high school <15 cigarettes 19.5 2.2 19.9 2.1 19.1 1.8 19.5 2.2
15–24 cigarettes 44.3 2.7 44.2 2.4 44.5 2.4 48.6 2.9 ≥25 cigarettes 36.2 2.7 35.8 2.4 36.5 2.4 31.9 2.7
High school <15 cigarettes 23.1 1.8 22.8 1.5 20.5 1.4 24.5 1.7
15–24 cigarettes 44.5 2.1 43.4 1.8 47.7 1.8 45.8 1.9 ≥25 cigarettes 32.4 1.9 33.8 1.8 31.8 1.6 29.6 1.8
Some college <15 cigarettes 26.3 2.8 24.9 2.3 25.6 2.3 27.8 2.6
15–24 cigarettes 42.0 3.1 43.0 2.8 43.2 2.7 43.5 3.1 ≥25 cigarettes 31.7 2.9 32.2 2.7 32.2 2.4 28.7 2.8
College <15 cigarettes 30.5 3.4 31.0 3.1 32.4 2.9 35.1 3.3
15–24 cigarettes 37.9 3.7 39.9 3.4 39.5 3.2 39.6 3.4 ≥25 cigarettes 31.6 3.6 29.2 3.0 28.1 2.9 25.3 3.3
‡95% confidence interval. §Includes persons aged 25 years and older.
102 Chapter 2

Tobacco Use Among U.S. Racial/Ethnic Minority Groups
1991____________ % ±CI
1992____________ % ±CI
1993 ____________ % ±CI
1994 ____________ % ±CI
1995 ____________ % ±CI
29.8 1.2 31.7 1.5 32.5 1.7 35.6 1.8 35.0 2.0 45.0 1.3 43.3 1.6 44.9 1.7 44.4 1.9 41.8 2.1 25.2 1.2 25.0 1.4 22.6 1.4 20.0 1.4 23.2 1.8
24.6 1.6 25.8 1.9 27.5 2.4 30.5 2.5 28.0 2.6 43.4 1.7 41.8 2.4 43.0 2.5 44.3 2.7 41.6 3.0 31.9 1.8 32.4 2.2 29.5 2.3 25.1 2.2 30.4 2.8
35.0 1.6 37.7 2.3 37.6 2.3 40.8 2.5 42.3 2.8 46.6 1.7 44.9 2.2 46.8 2.4 44.5 2.4 41.9 2.8 18.4 1.3 17.4 1.6 15.6 1.8 14.6 1.9 15.8 2.0
36.5 2.0 37.4 2.6 39.5 3.0 42.5 3.0 44.3 3.4 46.1 2.1 43.9 2.5 45.6 2.8 45.4 3.1 41.1 3.4 17.5 1.7 18.6 2.2 15.0 2.0 12.1 1.7 14.6 2.9
23.9 1.6 26.8 2.3 27.6 2.6 29.6 2.6 31.0 3.0 43.4 1.9 42.3 2.8 44.1 2.5 42.9 2.6 41.6 3.0 32.7 1.9 30.9 2.4 28.3 2.4 27.6 2.5 27.4 2.6
29.1 2.1 29.9 3.2 30.0 3.4 34.6 3.6 27.0 3.4 46.2 2.4 44.2 3.6 45.2 4.1 45.9 4.1 43.2 4.2 24.7 2.2 25.9 2.9 24.8 3.1 19.5 3.2 29.8 4.2
21.4 2.2 24.6 3.2 25.3 3.5 25.6 3.5 19.9 3.7 43.8 2.6 41.5 3.7 45.9 4.0 44.5 4.5 45.4 4.8 34.8 2.7 33.9 3.7 28.8 3.7 29.9 4.1 34.7 4.6
25.7 1.6 26.7 2.3 28.2 2.5 30.5 2.7 29.2 2.8 47.7 1.9 46.3 2.8 46.2 2.7 46.8 2.9 45.0 3.1 26.6 1.9 27.0 2.4 25.6 2.4 22.7 2.3 25.8 3.0
33.0 2.7 33.7 3.7 34.0 3.7 36.8 4.4 40.2 4.6 43.6 2.9 42.0 3.6 44.3 4.3 44.0 4.0 39.2 4.6 23.4 2.4 24.3 3.5 21.8 3.4 19.2 3.3 20.6 3.8
35.3 3.4 43.2 4.5 42.1 5.4 48.7 5.4 50.6 5.6 42.9 3.4 37.6 4.6 37.7 5.0 36.9 5.3 34.0 5.5 21.8 2.9 19.2 4.1 20.2 3.8 14.4 3.7 15.4 3.8
Patterns of Tobacco Use 103
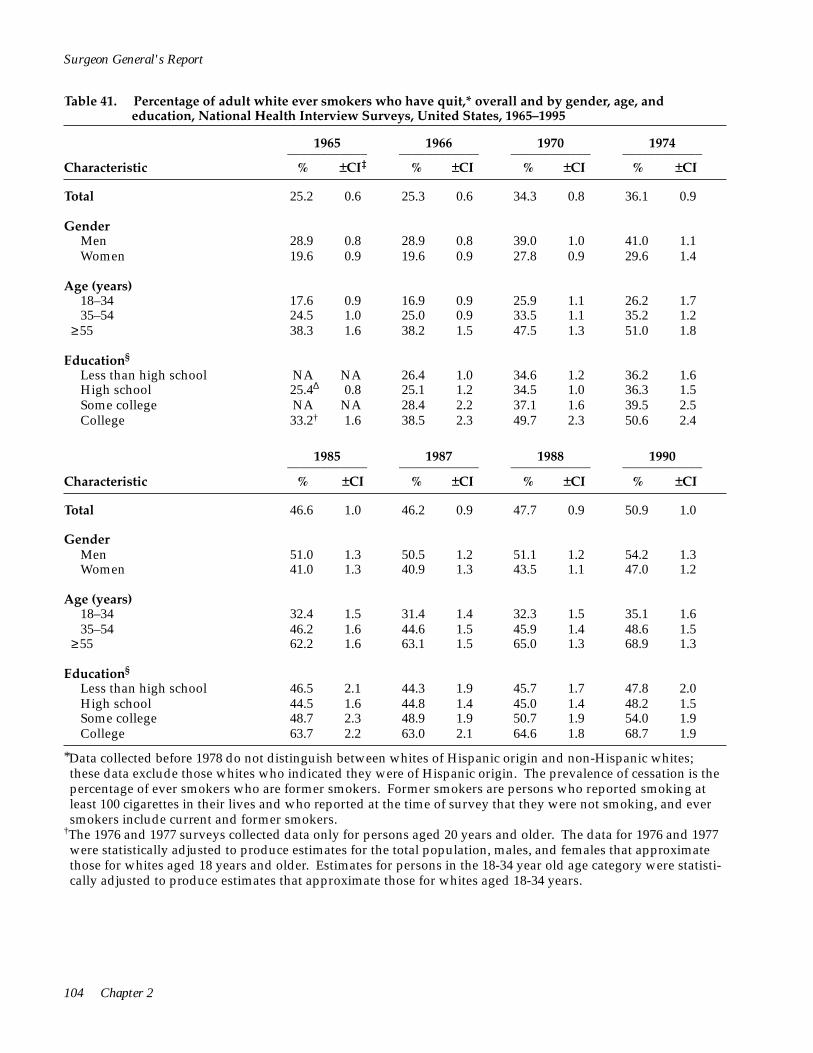
*Data collected before 1978 do not distinguish between whites of Hispanic origin and non-Hispanic whites; these data exclude those whites who indicated they were of Hispanic origin. The prevalence of cessation is the percentage of ever smokers who are former smokers. Former smokers are persons who reported smoking at least 100 cigarettes in their lives and who reported at the time of survey that they were not smoking, and ever smokers include current and former smokers.
†The 1976 and 1977 surveys collected data only for persons aged 20 years and older. The data for 1976 and 1977 were statistically adjusted to produce estimates for the total population, males, and females that approximate those for whites aged 18 years and older. Estimates for persons in the 18-34 year old age category were statistically adjusted to produce estimates that approximate those for whites aged 18-34 years.
Surgeon General's Report
Table 41. Percentage of adult white ever smokers who have quit,* overall and by gender, age, and education, National Health Interview Surveys, United States, 1965–1995
Characteristic
1965 ____________ % ±CI‡
1966 ____________ % ±CI
1970 ____________ % ±CI
1974 ____________ % ±CI
Total 25.2 0.6 25.3 0.6 34.3 0.8 36.1 0.9
Gender Men Women
28.9 0.8 28.9 0.8 39.0 1.0 41.0 1.119.6 0.9 19.6 0.9 27.8 0.9 29.6 1.4
Age (years) 18–34 35–54
≥55
17.6 0.9 16.9 0.9 25.9 1.1 26.2 1.724.5 1.0 25.0 0.9 33.5 1.1 35.2 1.2 38.3 1.6 38.2 1.5 47.5 1.3 51.0 1.8
Education§
Less than high school High school Some college College
NA NA 26.4 1.0 34.6 1.2 36.2 1.625.4Δ 0.8 25.1 1.2 34.5 1.0 36.3 1.5NA NA 28.4 2.2 37.1 1.6 39.5 2.533.2† 1.6 38.5 2.3 49.7 2.3 50.6 2.4
Characteristic
1985 ____________ % ±CI
1987 ____________ % ±CI
1988 ____________ % ±CI
1990 ____________ % ±CI
Total 46.6 1.0 46.2 0.9 47.7 0.9 50.9 1.0
Gender Men Women
51.0 1.3 50.5 1.2 51.1 1.2 54.2 1.341.0 1.3 40.9 1.3 43.5 1.1 47.0 1.2
Age (years) 18–34 35–54
≥55
32.4 1.5 31.4 1.4 32.3 1.5 35.1 1.646.2 1.6 44.6 1.5 45.9 1.4 48.6 1.5 62.2 1.6 63.1 1.5 65.0 1.3 68.9 1.3
Education§
Less than high school High school Some college College
46.5 2.1 44.3 1.9 45.7 1.7 47.8 2.044.5 1.6 44.8 1.4 45.0 1.4 48.2 1.548.7 2.3 48.9 1.9 50.7 1.9 54.0 1.963.7 2.2 63.0 2.1 64.6 1.8 68.7 1.9
104 Chapter 2
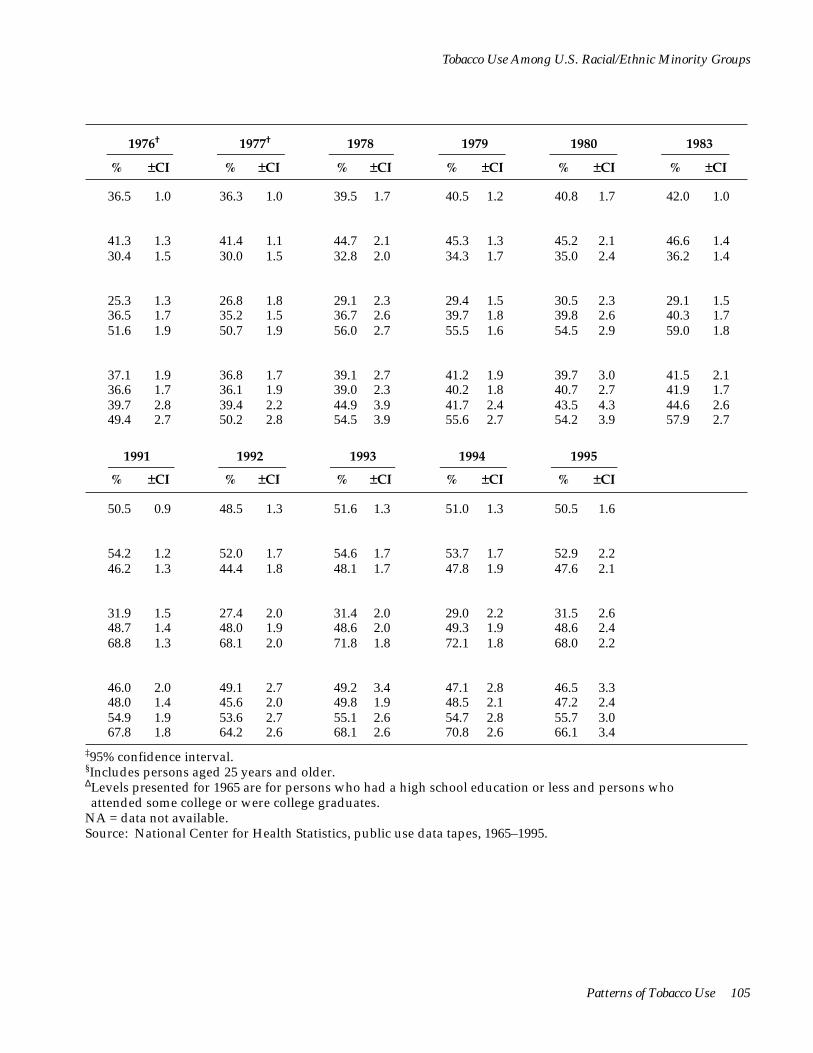
Tobacco Use Among U.S. Racial/Ethnic Minority Groups
1976†
% ±CI
1977†
% ±CI
1978
% ±CI
1979
% ±CI
1980
% ±CI
1983
% ±CI
36.5 1.0 36.3 1.0 39.5 1.7 40.5 1.2 40.8 1.7 42.0 1.0
41.3 1.3 41.4 1.1 44.7 2.1 45.3 1.3 45.2 2.1 46.6 1.4 30.4 1.5 30.0 1.5 32.8 2.0 34.3 1.7 35.0 2.4 36.2 1.4
25.3 1.3 26.8 1.8 29.1 2.3 29.4 1.5 30.5 2.3 29.1 1.5 36.5 1.7 35.2 1.5 36.7 2.6 39.7 1.8 39.8 2.6 40.3 1.7 51.6 1.9 50.7 1.9 56.0 2.7 55.5 1.6 54.5 2.9 59.0 1.8
37.1 1.9 36.8 1.7 39.1 2.7 41.2 1.9 39.7 3.0 41.5 2.1 36.6 1.7 36.1 1.9 39.0 2.3 40.2 1.8 40.7 2.7 41.9 1.7 39.7 2.8 39.4 2.2 44.9 3.9 41.7 2.4 43.5 4.3 44.6 2.6 49.4 2.7 50.2 2.8 54.5 3.9 55.6 2.7 54.2 3.9 57.9 2.7
1991
% ±CI
1992
% ±CI
1993
% ±CI
1994
% ±CI
1995
% ±CI
50.5 0.9 48.5 1.3 51.6 1.3 51.0 1.3 50.5 1.6
54.2 1.2 52.0 1.7 54.6 1.7 53.7 1.7 52.9 2.2 46.2 1.3 44.4 1.8 48.1 1.7 47.8 1.9 47.6 2.1
31.9 1.5 27.4 2.0 31.4 2.0 29.0 2.2 31.5 2.6 48.7 1.4 48.0 1.9 48.6 2.0 49.3 1.9 48.6 2.4 68.8 1.3 68.1 2.0 71.8 1.8 72.1 1.8 68.0 2.2
46.0 2.0 49.1 2.7 49.2 3.4 47.1 2.8 46.5 3.3 48.0 1.4 45.6 2.0 49.8 1.9 48.5 2.1 47.2 2.4 54.9 1.9 53.6 2.7 55.1 2.6 54.7 2.8 55.7 3.0 67.8 1.8 64.2 2.6 68.1 2.6 70.8 2.6 66.1 3.4
‡95% confidence interval. §Includes persons aged 25 years and older.ΔLevels presented for 1965 are for persons who had a high school education or less and persons who attended some college or were college graduates.
NA = data not available. Source: National Center for Health Statistics, public use data tapes, 1965–1995.
Patterns of Tobacco Use 105
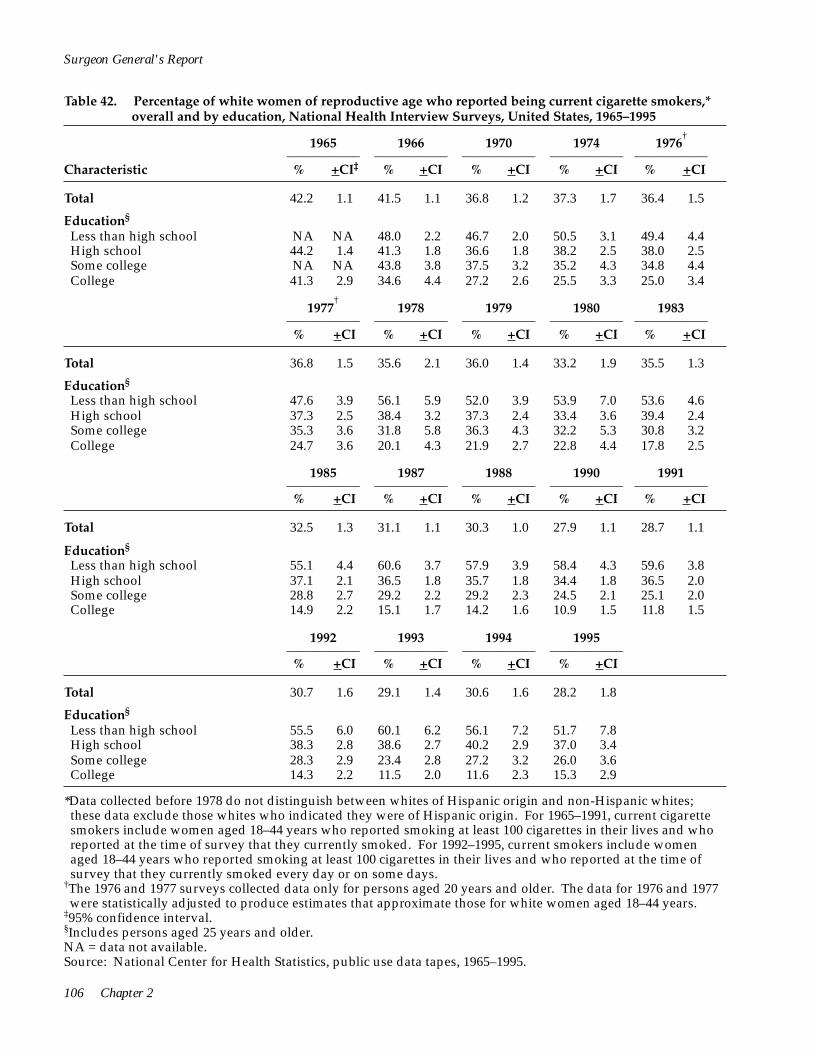
Surgeon General's Report
Table 42. Percentage of white women of reproductive age who reported being current cigarette smokers,* overall and by education, National Health Interview Surveys, United States, 1965–1995
Characteristic
1965 ––––––––––– % +CI‡
1966 –––––––––––
% +CI
1970 –––––––––––
% +CI
1974 –––––––––––
% +CI
1976†
––––––––––– % +CI
Total 42.2 1.1 41.5 1.1 36.8 1.2 37.3 1.7 36.4 1.5
Education§
Less than high school High school Some college College
NA NA 48.0 2.2 46.7 2.0 50.5 3.1 49.4 4.4 44.2 1.4 41.3 1.8 36.6 1.8 38.2 2.5 38.0 2.5 NA NA 43.8 3.8 37.5 3.2 35.2 4.3 34.8 4.4 41.3 2.9 34.6 4.4 27.2 2.6 25.5 3.3 25.0 3.4
† 1977
––––––––––– % +CI
1978 ––––––––––– % +CI
1979 ––––––––––– % +CI
1980 ––––––––––– % +CI
1983 –––––––––––
% +CI
Total 36.8 1.5 35.6 2.1 36.0 1.4 33.2 1.9 35.5 1.3
Education§
Less than high school 47.6 3.9 56.1 5.9 52.0 3.9 53.9 7.0 53.6 4.6 High school 37.3 2.5 38.4 3.2 37.3 2.4 33.4 3.6 39.4 2.4 Some college 35.3 3.6 31.8 5.8 36.3 4.3 32.2 5.3 30.8 3.2 College 24.7 3.6 20.1 4.3 21.9 2.7 22.8 4.4 17.8 2.5
1985 ––––––––––– % +CI
1987 ––––––––––– % +CI
1988 ––––––––––– % +CI
1990 ––––––––––– % +CI
1991 –––––––––––
% +CI
Total 32.5 1.3 31.1 1.1 30.3 1.0 27.9 1.1 28.7 1.1
Education§
Less than high school 55.1 4.4 60.6 3.7 57.9 3.9 58.4 4.3 59.6 3.8 High school 37.1 2.1 36.5 1.8 35.7 1.8 34.4 1.8 36.5 2.0 Some college 28.8 2.7 29.2 2.2 29.2 2.3 24.5 2.1 25.1 2.0 College 14.9 2.2 15.1 1.7 14.2 1.6 10.9 1.5 11.8 1.5
1992 ––––––––––– % +CI
1993 ––––––––––– % +CI
1994 ––––––––––– % +CI
1995 ––––––––––– % +CI
Total 30.7 1.6 29.1 1.4 30.6 1.6 28.2 1.8
Education§
Less than high school 55.5 6.0 60.1 6.2 56.1 7.2 51.7 7.8 High school 38.3 2.8 38.6 2.7 40.2 2.9 37.0 3.4 Some college 28.3 2.9 23.4 2.8 27.2 3.2 26.0 3.6 College 14.3 2.2 11.5 2.0 11.6 2.3 15.3 2.9
*Data collected before 1978 do not distinguish between whites of Hispanic origin and non-Hispanic whites; these data exclude those whites who indicated they were of Hispanic origin. For 1965–1991, current cigarette smokers include women aged 18–44 years who reported smoking at least 100 cigarettes in their lives and who reported at the time of survey that they currently smoked. For 1992–1995, current smokers include women aged 18–44 years who reported smoking at least 100 cigarettes in their lives and who reported at the time of survey that they currently smoked every day or on some days.
†The 1976 and 1977 surveys collected data only for persons aged 20 years and older. The data for 1976 and 1977 were statistically adjusted to produce estimates that approximate those for white women aged 18–44 years.
‡95% confidence interval. §Includes persons aged 25 years and older. NA = data not available. Source: National Center for Health Statistics, public use data tapes, 1965–1995.
106 Chapter 2
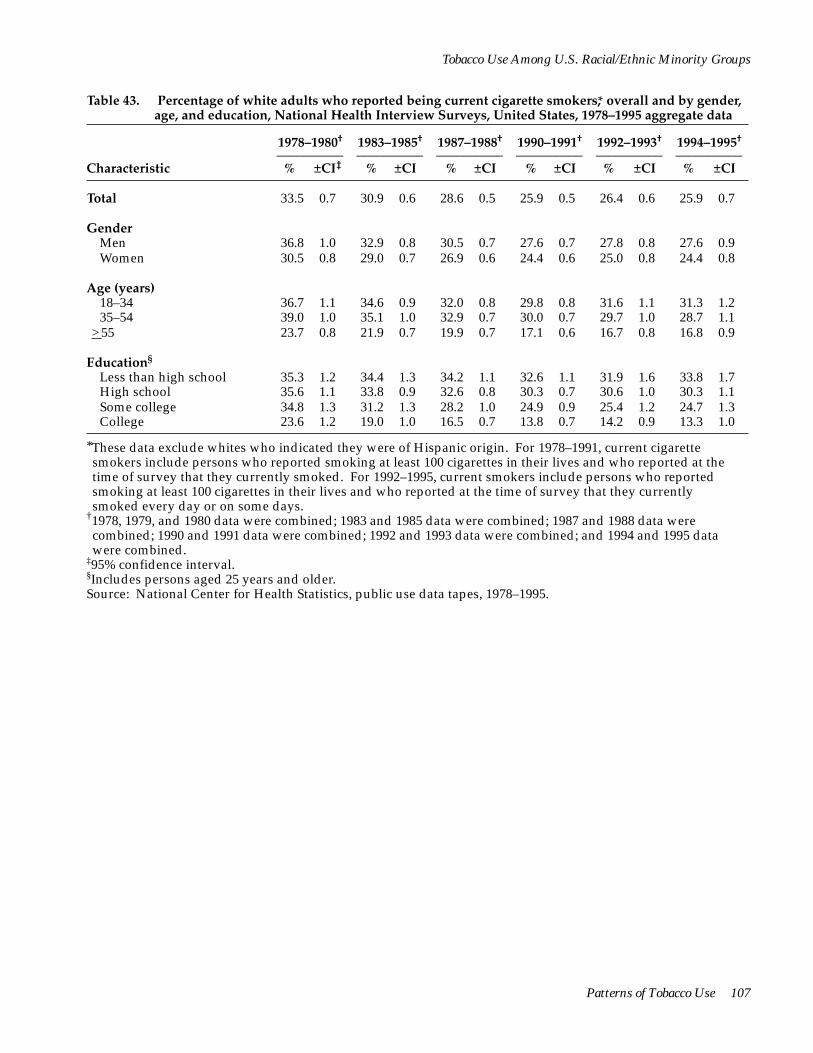
Tobacco Use Among U.S. Racial/Ethnic Minority Groups
Table 43. Percentage of white adults who reported being current cigarette smokers,* overall and by gender, age, and education, National Health Interview Surveys, United States, 1978–1995 aggregate data
1978–1980† 1983–1985† 1987–1988† 1990–1991† 1992–1993† 1994–1995†
–––––––––– –––––––––– –––––––––– –––––––––– –––––––––– –––––––––– Characteristic % ±CI‡ % ±CI % ±CI % ±CI % ±CI % ±CI
Total 33.5 0.7 30.9 0.6 28.6 0.5 25.9 0.5 26.4 0.6 25.9 0.7
Gender Men 36.8 1.0 32.9 0.8 30.5 0.7 27.6 0.7 27.8 0.8 27.6 0.9
Women 30.5 0.8 29.0 0.7 26.9 0.6 24.4 0.6 25.0 0.8 24.4 0.8
Age (years) 18–34 36.7 1.1 34.6 0.9 32.0 0.8 29.8 0.8 31.6 1.1 31.3 1.2 35–54 39.0 1.0 35.1 1.0 32.9 0.7 30.0 0.7 29.7 1.0 28.7 1.1
>55 23.7 0.8 21.9 0.7 19.9 0.7 17.1 0.6 16.7 0.8 16.8 0.9
Education§
Less than high school 35.3 1.2 34.4 1.3 34.2 1.1 32.6 1.1 31.9 1.6 33.8 1.7 High school 35.6 1.1 33.8 0.9 32.6 0.8 30.3 0.7 30.6 1.0 30.3 1.1 Some college 34.8 1.3 31.2 1.3 28.2 1.0 24.9 0.9 25.4 1.2 24.7 1.3 College 23.6 1.2 19.0 1.0 16.5 0.7 13.8 0.7 14.2 0.9 13.3 1.0
*These data exclude whites who indicated they were of Hispanic origin. For 1978–1991, current cigarette smokers include persons who reported smoking at least 100 cigarettes in their lives and who reported at the time of survey that they currently smoked. For 1992–1995, current smokers include persons who reported smoking at least 100 cigarettes in their lives and who reported at the time of survey that they currently smoked every day or on some days.
†1978, 1979, and 1980 data were combined; 1983 and 1985 data were combined; 1987 and 1988 data were combined; 1990 and 1991 data were combined; 1992 and 1993 data were combined; and 1994 and 1995 data were combined.
‡95% confidence interval. §Includes persons aged 25 years and older. Source: National Center for Health Statistics, public use data tapes, 1978–1995.
Patterns of Tobacco Use 107

<>25 cigarettes
<15–24 cigarettes >25 cigarettes
<>25 cigarettes
<>25 cigarettes
<15–24 cigarettes >25 cigarettes
<15–24 cigarettes
Surgeon General's Report
Table 44. Percentage of adult white smokers* who reported smoking <15, 15–24, or >25 cigarettes per day, overall and by gender, age, and education, National Health Interview Surveys, United States, 1978–1995 aggregate data
1978–1980† 1983–1985† 1987–1988† 1990–1991† 1992–1993† 1994–1995†
–––––––––– –––––––––– –––––––––– –––––––––– –––––––––– –––––––––– Characteristic % ±CI‡ % ±CI % ±CI % ±CI % ±CI % ±CI
Total <15 cigarettes
15–24 cigarettes 24.0 0.7 25.1 0.8 25.0 0.7 28.9 0.8 32.1 1.1 35.3 1.3 44.7 0.9 44.9 0.9 44.7 0.8 45.1 0.9 44.0 1.2 43.1 1.4 31.4 0.9 30.0 0.9 30.3 0.8 26.1 0.9 23.9 1.1 21.6 1.1
Gender Men
<15 cigarettes 18.9 0.9 19.1 1.2 20.5 1.0 23.2 1.1 26.6 1.6 29.3 1.8 43.5 1.3 43.7 1.3 42.3 1.1 43.6 1.3 42.3 1.8 43.0 2.0 37.6 1.3 37.2 1.4 37.3 1.2 33.2 1.3 31.1 1.6 27.7 1.8
Women <15 cigarettes
15–24 cigarettes 29.4 1.1 31.3 1.2 29.8 1.0 34.7 1.2 37.7 1.6 41.6 1.9 45.9 1.3 46.2 1.3 47.2 1.1 46.6 1.2 45.7 1.6 43.2 1.8 24.7 1.1 22.5 1.1 23.0 0.9 18.7 1.0 16.6 1.2 15.2 1.4
Age (years) 18–34
<15 cigarettes 15–24 cigarettes
25.9 1.3 29.6 1.3 29.6 1.2 35.7 1.4 38.3 2.0 43.3 2.2 47.6 1.2 47.1 1.4 46.7 1.3 46.7 1.5 44.6 1.9 43.4 2.3 26.5 1.3 23.3 1.2 23.8 1.1 17.6 1.2 17.1 1.5 13.3 1.6
35–54<15 cigarettes 18.8 1.0 18.6 1.4 19.1 1.1 22.2 1.1 27.2 1.7 30.3 2.0
41.4 1.6 41.7 1.7 42.5 1.3 43.4 1.5 43.1 1.8 42.2 2.0 39.8 1.5 39.7 1.7 38.4 1.3 34.4 1.5 29.7 1.6 27.5 1.8
>55 <15 cigarettes
>25 cigarettes
28.8 1.7 27.0 1.7 27.0 1.4 29.1 1.6 29.9 2.5 30.5 2.5 44.2 2.0 45.8 1.8 44.8 1.6 45.4 1.7 44.7 2.7 44.4 2.9 27.1 1.7 27.2 1.7 28.2 1.5 25.5 1.6 25.4 2.2 25.0 2.7
*These data exclude those whites who indicated they were of Hispanic origin. For 1978–1991, current cigarette smokers include persons who reported smoking at least 100 cigarettes in their lives and who reported at the time of survey that they currently smoked. For 1992–1995, current smokers include persons who reported smoking at least 100 cigarettes in their lives and who reported at the time of survey that they currently smoked every day or on some days.
108 Chapter 2

<
<
<
<
Tobacco Use Among U.S. Racial/Ethnic Minority Groups
Table 44. Continued
1978–1980† 1983–1985† 1987–1988† 1990–1991† 1992–1993† 1994–1995†
–––––––––– –––––––––– –––––––––– –––––––––– –––––––––– –––––––––– Characteristic % ±CI‡ % ±CI % ±CI % ±CI % ±CI % ±CI
Education§
Less than high school <15 cigarettes 22.7 1.4 19.9 1.6 19.5 1.4 20.5 1.6 24.9 2.3 22.8 2.6
15–24 cigarettes 44.2 1.9 44.8 2.0 44.3 1.7 46.1 1.9 43.5 2.8 45.0 3.3 >25 cigarettes 33.1 1.6 35.4 1.9 36.1 1.7 33.4 1.9 31.6 2.7 32.2 3.1
High school <15 cigarettes 21.1 1.2 22.4 1.3 21.6 1.0 25.1 1.2 27.4 1.6 29.9 2.0
15–24 cigarettes 45.1 1.9 45.1 1.5 45.6 1.3 46.8 1.4 46.2 1.9 45.9 2.1 >25 cigarettes 33.8 1.7 32.5 1.5 32.8 1.2 28.1 1.4 26.4 1.7 24.2 1.9
Some college <15 cigarettes 20.4 1.9 24.3 2.3 25.3 1.6 30.5 1.9 33.8 2.7 38.5 3.2
15–24 cigarettes 43.5 2.1 43.7 2.5 43.1 2.0 43.5 2.2 43.1 2.8 41.7 3.1 >25 cigarettes 36.2 2.4 32.0 2.4 31.7 1.7 26.0 1.8 23.1 2.3 19.9 2.5
College <15 cigarettes 28.2 2.8 29.6 2.7 31.7 2.3 35.2 2.4 42.7 3.4 49.7 3.9
15–24 cigarettes 37.6 2.9 39.2 2.7 39.7 2.3 41.3 2.3 37.6 3.3 35.3 3.8 >25 cigarettes 34.2 2.5 31.2 2.6 28.6 2.1 23.5 2.2 19.6 2.7 15.0 2.6
†1978, 1979, and 1980 data were combined; 1983 and 1985 data were combined; 1987 and 1988 data were combined; 1990 and 1991 data were combined; 1992 and 1993 data were combined; and 1994 and 1995 data were combined.
‡95% confidence interval. §Includes persons aged 25 years and older. Source: National Center for Health Statistics, public use data tapes, 1978–1995.
Patterns of Tobacco Use 109

Surgeon General's Report
Table 45. Percentage of adult white ever smokers who have quit,* overall and by gender, age, and education, National Health Interview Surveys, United States, 1978–1995 aggregate data
1978–1980† 1983–1985† 1987–1988† 1990–1991† 1992–1993† 1994–1995†
–––––––––– –––––––––– –––––––––– –––––––––– –––––––––– –––––––––– Characteristic % ±CI‡ % ±CI % ±CI % ±CI % ±CI % ±CI
Total 40.3 1.1 44.7 0.8 46.9 0.7 50.7 0.7 50.0 0.9 50.7 1.0
Gender Men 45.1 1.2 49.3 1.0 50.8 0.9 54.2 0.9 53.2 1.2 53.3 1.4
Women 34.1 1.4 39.1 1.0 42.2 0.9 46.6 0.9 46.1 1.3 47.7 1.4
Age (years) 18–34 29.6 1.3 31.1 1.1 31.8 1.1 33.5 1.1 29.2 1.5 30.2 1.7 35–54 39.0 1.3 43.9 1.3 45.3 1.1 48.6 1.1 48.3 1.3 49.0 1.5
>55 55.4 1.4 60.9 1.2 64.1 1.0 68.9 0.9 69.9 1.3 70.1 1.4
Education§
Less than high school 40.3 1.4 44.5 1.8 45.0 1.4 46.9 1.5 49.1 2.1 46.8 2.2 High school 40.0 1.5 43.5 1.1 44.9 1.1 48.1 1.0 47.6 1.5 47.9 1.6 Some college 42.9 1.8 47.1 1.8 49.8 1.4 54.5 1.3 54.3 1.8 55.2 2.0 College 55.0 2.2 61.6 1.7 63.8 1.4 68.2 1.4 66.1 1.9 68.4 2.2
*These data exclude those whites who indicated they were of Hispanic origin. The prevalence of cessation is the percentage of ever smokers who are former smokers. Former smokers are persons who reported smoking at least 100 cigarettes in their lives and who reported at the time of survey that they were not current smokers, and ever smokers include current and former smokers.
†1978, 1979, and 1980 data were combined; 1983 and 1985 data were combined; 1987 and 1988 data were combined; 1990 and 1991 data were combined; 1992 and 1993 data were combined; and 1994 and 1995 data were combined.
‡95% confidence interval. §Includes persons aged 25 years and older. Source: National Center for Health Statistics, public use data tapes, 1978–1995.
110 Chapter 2

*These data exclude whites who indicated they were of Hispanic origin. For 1978–1991, current cigarette smokers include women aged 18–44 years who reported smoking at least 100 cigarettes in their lives and who reported at the time of survey that they currently smoked. For 1992–1995, current smokers include women aged 18–44 years who reported smoking at least 100 cigarettes in their lives and who reported at the time of survey that they currently smoked every day or on some days.
†1978, 1979, and 1980 data were combined; 1983 and 1985 data were combined; 1987 and 1988 data were combined; 1990 and 1991 data were combined; 1992 and 1993 data were combined; and 1994 and 1995 data were combined.
‡95% confidence interval. Source: National Center for Health Statistics, public use data tapes, 1978–1995.
Tobacco Use Among U.S. Racial/Ethnic Minority Groups
Table 46. Percentage of white women of reproductive age who reported being current cigarette smokers,* overall and by education, National Health Interview Surveys, United States, 1978–1995 aggregate data
1978–1980† 1983–1985† 1987–1988† 1990–1991† 1992–1993† 1994–1995†
–––––––––– –––––––––– –––––––––– –––––––––– –––––––––– –––––––––– Characteristic % ±CI‡ % ±CI % ±CI % ±CI % ±CI % ±CI
Total 35.3 1.2 33.7 1.0 30.7 0.8 28.3 0.8 30.0 1.2 29.4 1.2
Education Less than high school 53.4 3.0 54.5 3.4 59.2 2.7 59.0 3.0 57.5 4.2 53.9 5.2 High school 36.6 1.8 38.0 1.7 36.1 1.4 35.5 1.3 38.5 2.1 38.6 2.3 Some college 34.2 2.8 29.6 2.1 29.2 1.7 24.8 1.5 26.0 2.1 26.6 2.4 College 21.7 1.9 16.0 1.6 14.6 1.2 11.4 1.0 13.0 1.4 13.5 1.8
Patterns of Tobacco Use 111
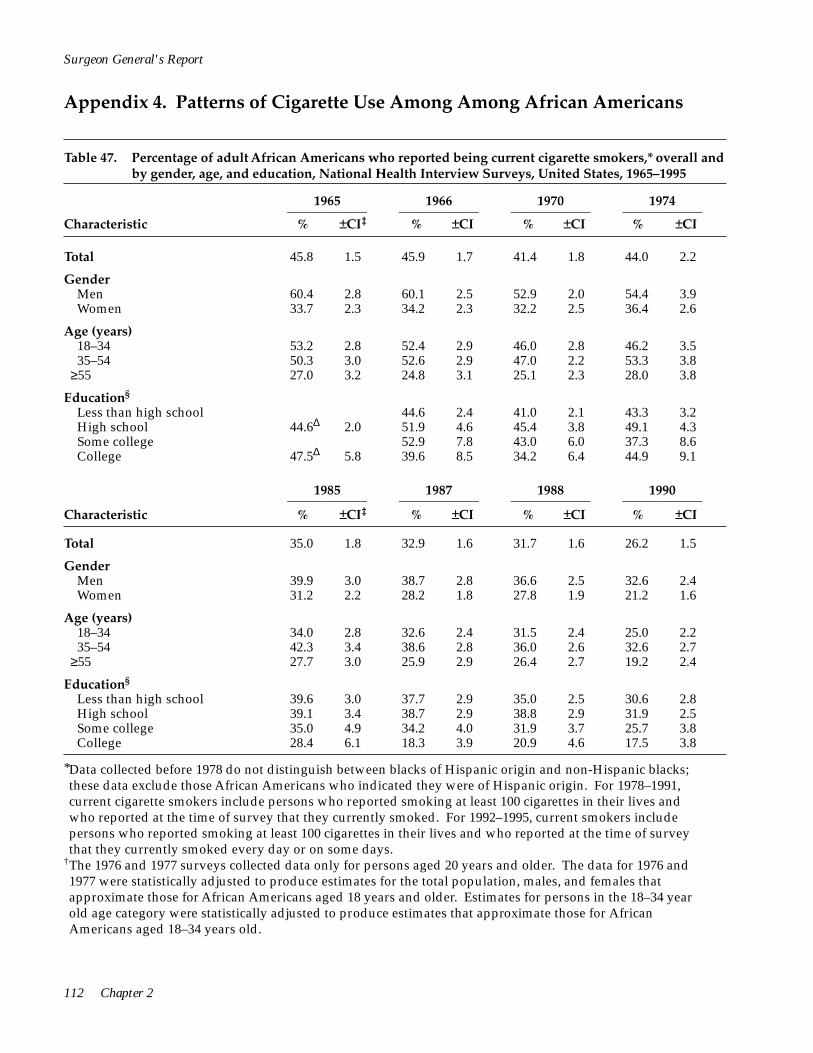
≥55
Surgeon General's Report
Appendix 4. Patterns of Cigarette Use Among Among African Americans
Table 47. Percentage of adult African Americans who reported being current cigarette smokers,* overall and by gender, age, and education, National Health Interview Surveys, United States, 1965–1995
1965 ____________ % ±CI‡
1966 ____________ % ±CI
1970 ____________ % ±CI
1974 ____________ % ±CI Characteristic
Total 45.8 1.5 45.9 1.7 41.4 1.8 44.0 2.2
Gender Men 60.4 2.8 60.1 2.5 52.9 2.0 54.4 3.9 Women 33.7 2.3 34.2 2.3 32.2 2.5 36.4 2.6
Age (years) 18–34 53.2 2.8 52.4 2.9 46.0 2.8 46.2 3.5 35–54 50.3 3.0 52.6 2.9 47.0 2.2 53.3 3.8
≥55 27.0 3.2 24.8 3.1 25.1 2.3 28.0 3.8
Education§
Less than high school 44.6 2.4 41.0 2.1 43.3 3.2 High school 44.6Δ 2.0 51.9 4.6 45.4 3.8 49.1 4.3 Some college 52.9 7.8 43.0 6.0 37.3 8.6 College 47.5Δ 5.8 39.6 8.5 34.2 6.4 44.9 9.1
1985 ____________ % ±CI‡
1987 ____________ % ±CI
1988 ____________ % ±CI
1990 ____________ % ±CI Characteristic
Total 35.0 1.8 32.9 1.6 31.7 1.6 26.2 1.5
Gender Men 39.9 3.0 38.7 2.8 36.6 2.5 32.6 2.4 Women 31.2 2.2 28.2 1.8 27.8 1.9 21.2 1.6
Age (years) 18–34 34.0 2.8 32.6 2.4 31.5 2.4 25.0 2.2 35–54 42.3 3.4 38.6 2.8 36.0 2.6 32.6 2.7
27.7 3.0 25.9 2.9 26.4 2.7 19.2 2.4
Education§
Less than high school 39.6 3.0 37.7 2.9 35.0 2.5 30.6 2.8 High school 39.1 3.4 38.7 2.9 38.8 2.9 31.9 2.5 Some college 35.0 4.9 34.2 4.0 31.9 3.7 25.7 3.8 College 28.4 6.1 18.3 3.9 20.9 4.6 17.5 3.8
*Data collected before 1978 do not distinguish between blacks of Hispanic origin and non-Hispanic blacks; these data exclude those African Americans who indicated they were of Hispanic origin. For 1978–1991, current cigarette smokers include persons who reported smoking at least 100 cigarettes in their lives and who reported at the time of survey that they currently smoked. For 1992–1995, current smokers include persons who reported smoking at least 100 cigarettes in their lives and who reported at the time of survey that they currently smoked every day or on some days.
†The 1976 and 1977 surveys collected data only for persons aged 20 years and older. The data for 1976 and 1977 were statistically adjusted to produce estimates for the total population, males, and females that approximate those for African Americans aged 18 years and older. Estimates for persons in the 18–34 year old age category were statistically adjusted to produce estimates that approximate those for African Americans aged 18–34 years old.
112 Chapter 2
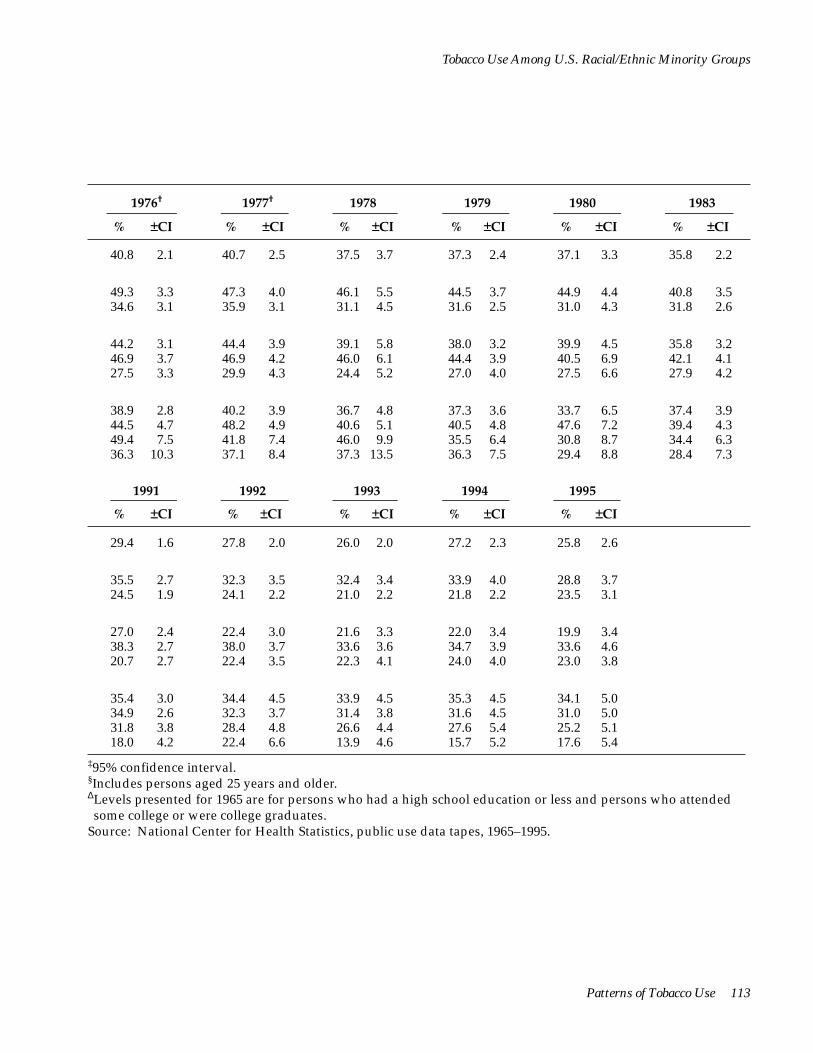
Tobacco Use Among U.S. Racial/Ethnic Minority Groups
1976†
% ±CI
1977†
% ±CI
1978
% ±CI
1979
% ±CI
1980
% ±CI
1983
% ±CI
40.8 2.1 40.7 2.5 37.5 3.7 37.3 2.4 37.1 3.3 35.8 2.2
49.3 3.3 47.3 4.0 46.1 5.5 44.5 3.7 44.9 4.4 40.8 3.5 34.6 3.1 35.9 3.1 31.1 4.5 31.6 2.5 31.0 4.3 31.8 2.6
44.2 3.1 44.4 3.9 39.1 5.8 38.0 3.2 39.9 4.5 35.8 3.2 46.9 3.7 46.9 4.2 46.0 6.1 44.4 3.9 40.5 6.9 42.1 4.1 27.5 3.3 29.9 4.3 24.4 5.2 27.0 4.0 27.5 6.6 27.9 4.2
38.9 2.8 40.2 3.9 36.7 4.8 37.3 3.6 33.7 6.5 37.4 3.9 44.5 4.7 48.2 4.9 40.6 5.1 40.5 4.8 47.6 7.2 39.4 4.3 49.4 7.5 41.8 7.4 46.0 9.9 35.5 6.4 30.8 8.7 34.4 6.3 36.3 10.3 37.1 8.4 37.3 13.5 36.3 7.5 29.4 8.8 28.4 7.3
1991
% ±CI
1992
% ±CI
1993
% ±CI
1994
% ±CI
1995
% ±CI
29.4 1.6 27.8 2.0 26.0 2.0 27.2 2.3 25.8 2.6
35.5 2.7 32.3 3.5 32.4 3.4 33.9 4.0 28.8 3.7 24.5 1.9 24.1 2.2 21.0 2.2 21.8 2.2 23.5 3.1
27.0 2.4 22.4 3.0 21.6 3.3 22.0 3.4 19.9 3.4 38.3 2.7 38.0 3.7 33.6 3.6 34.7 3.9 33.6 4.6 20.7 2.7 22.4 3.5 22.3 4.1 24.0 4.0 23.0 3.8
35.4 3.0 34.4 4.5 33.9 4.5 35.3 4.5 34.1 5.0 34.9 2.6 32.3 3.7 31.4 3.8 31.6 4.5 31.0 5.0 31.8 3.8 28.4 4.8 26.6 4.4 27.6 5.4 25.2 5.1 18.0 4.2 22.4 6.6 13.9 4.6 15.7 5.2 17.6 5.4
‡95% confidence interval. §Includes persons aged 25 years and older.ΔLevels presented for 1965 are for persons who had a high school education or less and persons who attended some college or were college graduates.
Source: National Center for Health Statistics, public use data tapes, 1965–1995.
Patterns of Tobacco Use 113

Table 48. Percentage of adult African American smokers* who reported smoking <15, 15–24, or >25 cigarettes per day, overall and by gender, age, and education, National Health Interview Surveys, United States, 1965–1995
1965
% ±CI‡
< 15–24 cigarettes 35.5 2.5 36.2 2.5 36.0 2.4 33.0 3.1
<
<
<
< 15–24 cigarettes 39.9 3.8 39.1 3.7 38.7 3.6 39.4 5.7
≥55
Surgeon General's Report
1966
% ±CI
1970
% ±CI
1974
% ±CI Characteristic
Total <15 cigarettes 56.9 2.7 55.8 2.5 55.5 2.5 58.3 3.2
≥25 cigarettes 7.6 1.4 8.0 1.3 8.6 1.4 8.7 1.8 Gender
Men <15 cigarettes 49.1 3.3 48.3 3.2 49.6 3.2 52.9 5.0
15–24 cigarettes 42.0 3.3 41.8 3.1 40.7 3.1 36.5 4.9 ≥25 cigarettes 9.0 1.9 9.9 1.9 9.7 1.7 10.6 2.9
Women <15 cigarettes 68.0 3.7 66.1 3.8 62.8 2.8 64.3 4.0
15–24 cigarettes 26.3 3.5 28.5 3.5 30.0 2.5 29.1 3.8 ≥25 cigarettes 5.7 1.9 5.5 1.7 7.2 1.7 6.6 2.3
Age (years) 18–34
<15 cigarettes 59.7 4.0 57.3 3.9 58.5 3.2 64.0 3.9 15–24 cigarettes 33.0 3.7 35.0 4.0 34.0 3.2 27.8 4.0
≥25 cigarettes 7.4 2.1 7.7 2.1 7.4 2.0 8.2 2.4 35–54
<15 cigarettes 51.4 3.9 52.0 3.9 50.7 3.2 49.3 6.2
≥25 cigarettes 8.7 2.2 8.9 2.3 10.6 2.0 11.3 3.5
<15 cigarettes 65.2 6.4 63.3 6.9 59.3 5.9 65.3 7.5 15–24 cigarettes 29.8 6.4 30.6 7.2 34.3 5.6 31.4 8.2
≥25 cigarettes 5.1 3.0 6.1 3.5 6.5 2.1 3.4 2.6 Education§
Less than high school <15 cigarettes NA NA 55.3 3.5 52.5 3.9 55.8 5.5
15–24 cigarettes NA NA 36.0 3.3 38.0 3.7 35.8 5.3 ≥25 cigarettes NA NA 8.7 2.0 9.5 2.1 8.4 2.6
High school <15 cigarettes 55.8Δ 3.1 50.6 5.7 52.7 4.3 52.9 8.0
15–24 cigarettes 35.9Δ 3.0 40.4 7.9 37.9 4.4 37.4 6.6 ≥25 cigarettes 8.3Δ 1.8 9.1 3.2 9.4 2.8 9.8 4.1
Some college <15 cigarettes NA NA 59.0 10.4 49.9 10.1 56.4 12.5
15–24 cigarettes NA NA 32.1 9.4 37.1 8.9 29.5 11.0 ≥25 cigarettes NA NA 9.0 5.8 13.0 6.5 14.1 10.5
College <15 cigarettes 54.6Δ 9.1 60.9 10.1 69.0 11.1 64.8 15.1
15–24 cigarettes 36.1Δ 8.5 32.3 10.1 23.4 9.7 30.2 14.3 ≥25 cigarettes 9.3Δ 5.3 6.8 5.3 7.6 7.3 5.1 7.1
*Data collected before 1978 do not distinguish between African Americans of Hispanic origin and non-Hispanic African Americans; these data exclude those African Americans who indicated they were of Hispanic origin. For 1965–1991, current cigarette smokers include persons who reported smoking at least 100 cigarettes in their lives and who reported at the time of survey that they currently smoked. For 1992–1995, current smokers include persons who reported smoking at least 100 cigarettes in their lives and who reported at the time of survey that they currently smoked every day or on some days.
†The 1976 and 1977 surveys collected data only for persons aged 20 years and older. The data for 1976 and 1977 were statistically adjusted to produce estimates for the total population, males, and females that approximate those for African Americans aged 18 years and older. Estimates for persons in the 18–34 year old age category were statistically adjusted to produce estimates that approximate those for African Americans aged 18–34 years old.
114 Chapter 2

Tobacco Use Among U.S. Racial/Ethnic Minority Groups
1976†
% ±CI
1977†
% ±CI
1978
% ±CI
1979
% ±CI
1980
% ±CI
1983
% ±CI
52.4 3.9 54.7 4.8 57.0 5.1 55.9 3.2 55.2 5.7 54.9 3.9 39.0 3.7 35.7 4.4 34.0 4.6 33.3 3.1 33.8 4.8 35.6 3.7 8.6 2.1 9.8 2.1 9.1 2.8 10.8 1.6 11.0 3.3 9.5 2.4
44.7 4.7 48.4 5.9 49.5 7.3 51.5 4.9 48.8 9.2 51.4 5.7 44.2 4.4 35.3 5.2 37.3 6.3 36.3 4.7 38.7 6.8 36.5 5.3 11.2 3.0 12.6 3.9 13.2 5.1 12.2 2.6 12.5 5.5 12.1 4.1
60.3 5.8 61.2 6.2 65.0 7.0 60.8 4.4 62.1 6.8 58.5 5.1 33.8 5.9 36.1 5.6 30.4 6.4 30.0 3.8 28.5 6.3 34.6 5.0 6.0 2.2 6.9 2.3 4.6 3.0 9.2 2.6 9.4 3.2 6.9 2.5
56.5 5.5 59.4 5.8 60.3 7.9 60.5 5.2 57.8 6.0 57.7 5.7 35.9 5.3 34.8 6.3 31.5 7.0 31.1 4.3 33.1 6.3 33.0 5.2 7.6 2.6 8.0 3.4 8.2 4.2 8.4 2.5 9.1 3.8 9.4 3.7
44.8 6.5 51.6 7.3 53.0 8.4 48.4 5.1 56.1 10.5 47.6 6.4 44.0 6.9 35.4 6.2 37.2 7.5 36.2 4.5 32.1 9.2 40.6 6.1 11.3 3.4 13.0 3.6 9.8 4.8 15.4 4.3 11.8 7.1 11.9 4.4
57.4 6.4 51.1 8.6 56.1 12.6 59.1 8.7 46.5 11.9 61.7 8.8 36.9 6.8 40.2 7.5 33.9 12.5 33.3 8.6 38.9 10.6 32.9 8.6 5.8 3.7 8.7 4.5 10.0 7.2 7.6 4.1 14.7 10.4 5.4 4.0
50.4 5.8 54.1 7.0 53.4 9.2 52.8 5.7 53.9 9.4 52.8 6.6 41.2 5.1 35.2 5.6 35.4 8.3 32.9 5.2 32.6 9.1 34.0 6.3 8.3 3.3 10.7 3.2 11.3 5.4 14.3 4.2 13.6 7.3 13.2 5.1
48.4 6.9 53.9 7.9 60.4 9.5 53.5 5.6 48.9 9.1 52.6 7.0 44.3 6.2 34.0 7.4 31.1 9.1 36.1 6.3 35.8 8.1 42.1 6.9 7.3 3.1 12.1 4.8 8.5 5.5 10.4 4.4 15.3 5.6 5.4 3.1
54.7 11.7 49.5 12.0 41.5 17.6 57.0 11.5 44.7 18.2 50.2 12.1 29.2 9.9 42.8 12.7 46.1 16.8 30.1 9.2 42.7 18.5 37.1 11.7 16.1 7.9 7.7 6.0 12.5 9.0 13.0 6.8 12.5 11.0 12.7 7.9
44.9 14.9 48.1 15.6 71.9 17.1 47.5 13.2 65.7 18.7 51.6 15.3 38.8 13.9 37.9 15.6 22.6 12.5 40.1 11.5 31.1 18.3 36.7 14.8 16.3 13.0 14.0 9.6 5.5 9.8 12.5 9.2 3.3 6.4 11.7 10.9
‡95% confidence interval. §Includes persons aged 25 years and older.ΔLevels presented for 1965 are for persons who had a high school education or less and persons who attended some college or were college graduates.
NA = data not available. Source: National Center for Health Statistics, public use data tapes, 1965–1995.
Patterns of Tobacco Use 115
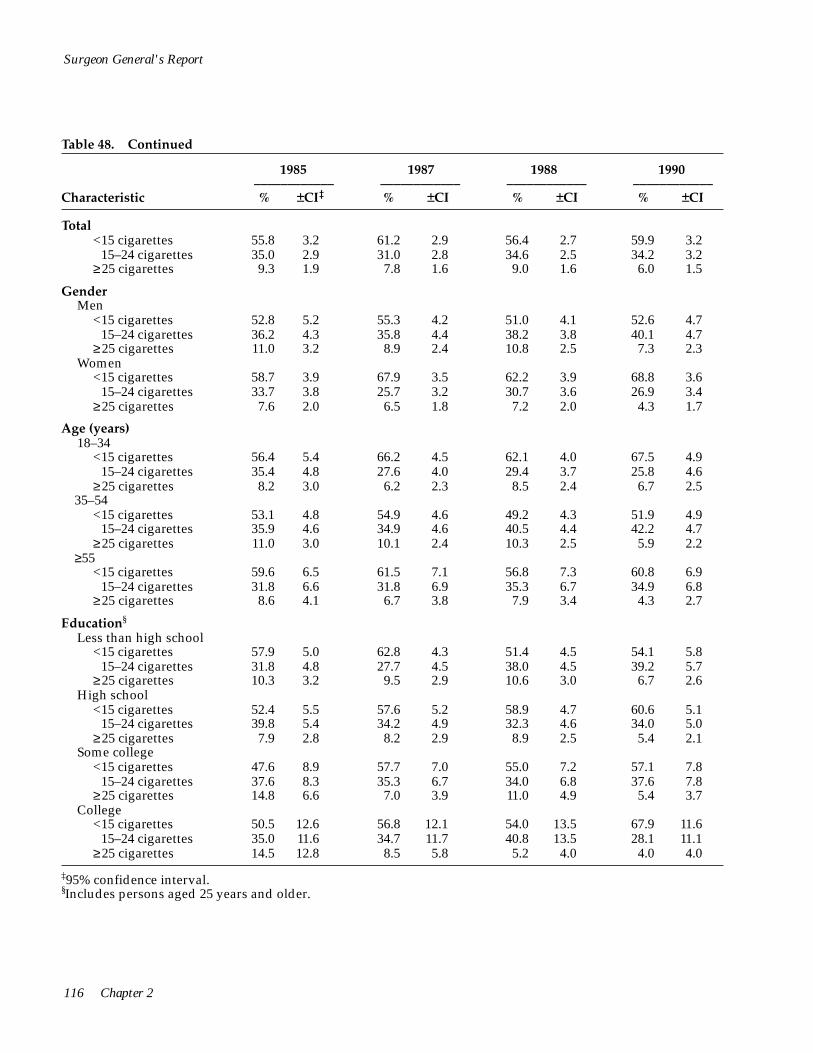
116 Chapter 2
< 15–24 cigarettes
< 15–24 cigarettes
<
<
<
<
<
<
<
<
Surgeon General's Report
Table 48. Continued
1985 1987 1988 1990 ____________ ____________ ____________ ____________
Characteristic % ±CI‡ % ±CI % ±CI % ±CI
Total <15 cigarettes 55.8 3.2 61.2 2.9 56.4 2.7 59.9 3.2
≥25 cigarettes 35.0 2.9 31.0 2.8 34.6 2.5 34.2 3.2 9.3 1.9 7.8 1.6 9.0 1.6 6.0 1.5
Gender Men
<15 cigarettes 52.8 5.2 55.3 4.2 51.0 4.1 52.6 4.7
≥25 cigarettes 36.2 4.3 35.8 4.4 38.2 3.8 40.1 4.7 11.0 3.2 8.9 2.4 10.8 2.5 7.3 2.3
Women <15 cigarettes 58.7 3.9 67.9 3.5 62.2 3.9 68.8 3.6
15–24 cigarettes 33.7 3.8 25.7 3.2 30.7 3.6 26.9 3.4 ≥25 cigarettes 7.6 2.0 6.5 1.8 7.2 2.0 4.3 1.7
Age (years) 18–34
<15 cigarettes 56.4 5.4 66.2 4.5 62.1 4.0 67.5 4.9 15–24 cigarettes 35.4 4.8 27.6 4.0 29.4 3.7 25.8 4.6
≥25 cigarettes 8.2 3.0 6.2 2.3 8.5 2.4 6.7 2.5 35–54
<15 cigarettes 53.1 4.8 54.9 4.6 49.2 4.3 51.9 4.9 15–24 cigarettes 35.9 4.6 34.9 4.6 40.5 4.4 42.2 4.7
≥25 cigarettes 11.0 3.0 10.1 2.4 10.3 2.5 5.9 2.2 ≥55
<15 cigarettes 59.6 6.5 61.5 7.1 56.8 7.3 60.8 6.9 15–24 cigarettes
≥25 cigarettes31.8 6.6 31.8 6.9 35.3 6.7 34.9 6.8
8.6 4.1 6.7 3.8 7.9 3.4 4.3 2.7
Education§
Less than high school <15 cigarettes 57.9 5.0 62.8 4.3 51.4 4.5 54.1 5.8
15–24 cigarettes ≥25 cigarettes
31.8 4.8 27.7 4.5 38.0 4.5 39.2 5.7 10.3 3.2 9.5 2.9 10.6 3.0 6.7 2.6
High school <15 cigarettes 52.4 5.5 57.6 5.2 58.9 4.7 60.6 5.1
15–24 cigarettes 39.8 5.4 34.2 4.9 32.3 4.6 34.0 5.0 ≥25 cigarettes 7.9 2.8 8.2 2.9 8.9 2.5 5.4 2.1
Some college <15 cigarettes 47.6 8.9 57.7 7.0 55.0 7.2 57.1 7.8
15–24 cigarettes ≥25 cigarettes
37.6 8.3 35.3 6.7 34.0 6.8 37.6 7.8 14.8 6.6 7.0 3.9 11.0 4.9 5.4 3.7
College <15 cigarettes 50.5 12.6 56.8 12.1 54.0 13.5 67.9 11.6
15–24 cigarettes 35.0 11.6 34.7 11.7 40.8 13.5 28.1 11.1 ≥25 cigarettes 14.5 12.8 8.5 5.8 5.2 4.0 4.0 4.0
‡95% confidence interval. §Includes persons aged 25 years and older.

Tobacco Use Among U.S. Racial/Ethnic Minority Groups
1991
% ±CI
1992
% ±CI
1993
% ±CI
1994
% ±CI
1995
% ±CI
61.2 3.0 61.4 4.3 65.6 4.2 65.3 4.8 62.5 5.2 30.0 2.8 33.3 3.9 28.5 4.1 27.2 4.3 29.7 4.8 8.7 1.8 5.3 1.7 6.0 2.1 7.5 3.2 7.8 2.7
57.5 4.4 55.7 6.8 63.3 6.2 64.1 7.0 57.6 7.4 31.7 4.0 39.0 6.3 29.2 5.9 25.2 5.8 32.5 7.2 10.8 2.8 5.3 2.4 7.4 3.4 10.7 5.6 9.9 4.5
65.7 3.5 67.5 4.9 68.4 5.8 66.7 5.5 69.7 9.7 28.0 3.4 27.3 4.5 27.5 5.7 29.8 5.5 22.1 8.2 6.2 1.9 5.2 2.0 4.1 2.2 3.5 1.7 8.2 6.0
66.9 4.6 68.5 6.6 70.6 7.9 71.5 7.3 68.3 8.5 27.3 4.4 27.7 6.5 22.8 7.0 22.3 7.0 24.4 8.1 5.7 2.5 3.8 2.1 6.6 3.8 6.2 3.1 7.2 4.4
56.7 4.4 59.0 6.0 62.2 6.0 60.6 7.3 57.2 7.3 32.7 4.0 34.9 5.7 31.2 6.1 31.1 6.4 33.5 7.0 10.7 2.8 6.1 2.7 6.6 3.2 8.4 5.8 9.4 4.2
60.0 6.8 54.3 8.8 64.6 10.3 66.2 9.6 67.1 9.1 29.3 6.5 39.8 8.5 32.0 10.4 26.2 8.4 28.4 8.5 10.7 4.3 5.9 3.9 3.4 3.6 7.6 6.6 4.5 3.7
60.0 5.2 56.2 8.2 59.4 8.1 59.3 8.7 52.3 8.6 28.7 4.8 36.6 8.0 30.9 8.2 32.0 7.9 33.0 8.4 11.3 3.5 7.2 3.4 9.7 5.0 8.6 6.1 14.8 6.8
57.6 4.9 61.3 6.1 64.6 6.9 63.9 8.3 64.1 7.9 35.5 4.8 34.4 5.8 32.1 6.7 28.8 7.2 29.5 7.2 6.9 2.2 4.3 2.4 3.3 2.7 7.2 6.6 6.4 4.1
63.8 7.7 62.5 9.2 64.4 10.3 66.9 11.6 58.8 11.7 28.2 7.4 32.1 9.1 29.8 9.8 27.1 11.3 37.6 11.5 8.1 4.2 5.4 4.0 5.9 4.8 6.0 4.1 3.6 2.8
62.4 13.2 72.5 12.6 78.3 17.4 73.3 17.8 83.0 11.1 22.1 10.8 21.3 11.2 19.4 17.3 26.7 17.8 12.1 9.7 15.6 11.7 6.1 6.8 2.3 3.6 0.0 0.0 4.9 6.0
Patterns of Tobacco Use 117

Surgeon General's Report
Table 49. Percentage of adult African American ever smokers who have quit,* overall and by gender, age, and education, National Health Interview Surveys, United States, 1965–1995
Characteristic
1965 ____________ % ±CI‡
1966 ____________ % ±CI
1970 ____________ % ±CI
1974 ____________ % ±CI
Total 15.5 1.7 14.2 1.7 20.6 1.5 19.7 2.4
Gender Men Women
16.1 2.2 15.5 2.2 22.2 2.0 21.7 3.6 14.5 2.7 12.3 2.4 18.4 2.1 17.4 2.9
Age (years) 18–3435–54
>55
8.3 2.0 7.2 1.8 12.8 1.8 13.0 3.9 16.7 2.6 14.0 2.4 21.1 2.0 16.9 3.3 29.3 5.2 32.4 5.4 37.4 3.6 38.1 5.8
Education§
Less than high school High school Some college College
NA NA 17.5 2.3 23.2 2.1 23.3 3.5 18.2Δ 2.1 11.2 3.5 19.4 3.7 17.4 4.7 NA NA 12.8 6.5 24.2 6.8 33.2 11.8 13.2Δ 5.7 19.9 8.6 33.9 9.9 20.4 9.9
Characteristic
1985 ____________ % ±CI
1987 ____________ % ±CI
1988 ____________ % ±CI
1990 ____________ % ±CI
Total 31.3 2.4 31.1 2.4 32.5 2.1 39.0 2.6
Gender Men Women
34.4 3.6 32.9 3.6 34.9 3.1 39.5 3.4 27.9 3.3 29.0 2.7 29.7 3.0 38.4 3.5
Age (years) 18–34 35–54
≥55
21.1 3.5 18.3 3.1 19.2 3.1 24.8 3.9 30.6 3.7 31.2 3.7 34.9 3.7 39.1 3.8 48.5 4.6 50.1 4.5 48.3 4.1 58.3 4.6
Education§
Less than high school High school Some college College
32.8 3.6 34.2 3.7 35.8 3.4 40.4 4.4 30.8 4.4 27.0 3.7 27.6 3.5 35.7 3.9 36.6 6.6 35.8 5.5 37.3 5.8 43.8 6.5 37.4 8.7 49.9 8.2 50.4 8.3 51.4 8.2
*Data collected before 1978 do not distinguish between African Americans of Hispanic origin and non-Hispanic African Americans; these data exclude those African Americans who indicated they were of Hispanic origin. The prevalence of cessation is the percentage of ever smokers who are former smokers. Former smokers are those who reported smoking at least 100 cigarettes in their lives and who reported at the time of survey that they were not smoking.
†The 1976 and 1977 surveys collected data only for persons aged 20 years and older. The data for 1976 and 1977 were statistically adjusted to produce estimates for the total population, males, and females that approximate those for African Americans aged 18 years and older. Estimates for persons in the 18–34 year old age category were statistically adjusted to produce estimates that approximate those for African Americans aged 18–34 years old.
118 Chapter 2
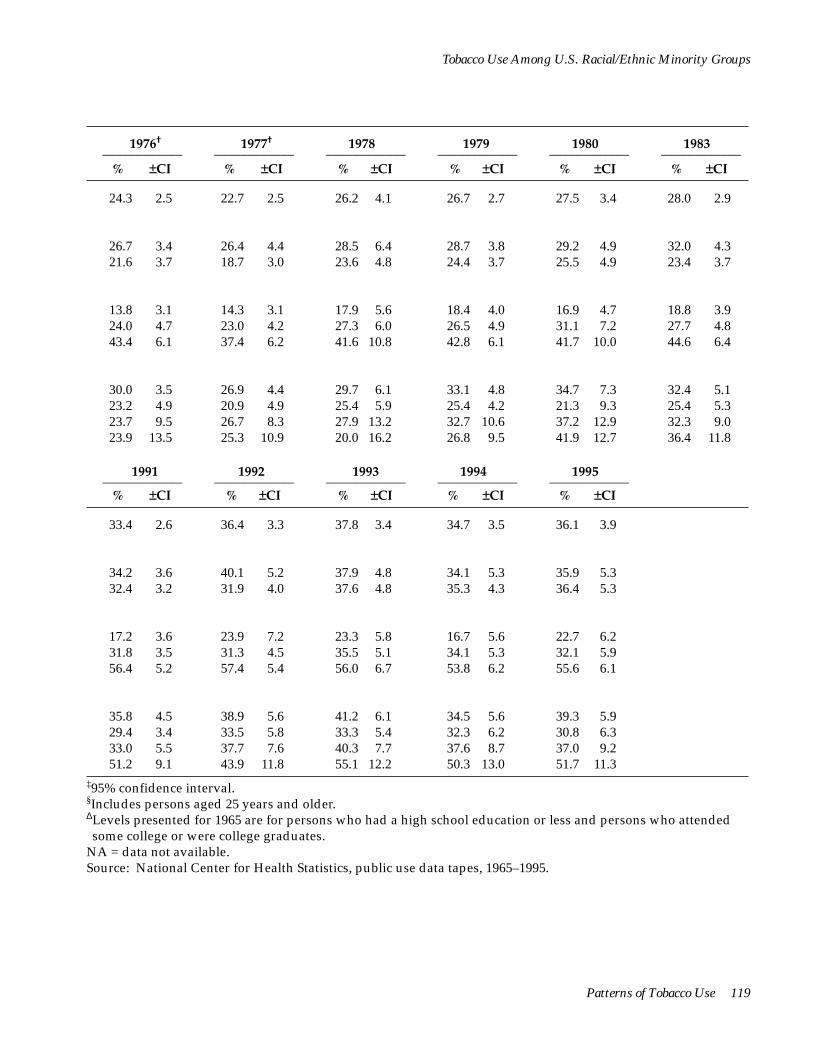
Tobacco Use Among U.S. Racial/Ethnic Minority Groups
1976†____________
% ±CI
1977†____________
% ±CI
1978____________ % ±CI
1979 ____________ % ±CI
1980 ____________ % ±CI
1983 ____________ % ±CI
24.3 2.5 22.7 2.5 26.2 4.1 26.7 2.7 27.5 3.4 28.0 2.9
26.7 3.4 26.4 4.4 28.5 6.4 28.7 3.8 29.2 4.9 32.0 4.3 21.6 3.7 18.7 3.0 23.6 4.8 24.4 3.7 25.5 4.9 23.4 3.7
13.8 3.1 14.3 3.1 17.9 5.6 18.4 4.0 16.9 4.7 18.8 3.9 24.0 4.7 23.0 4.2 27.3 6.0 26.5 4.9 31.1 7.2 27.7 4.8 43.4 6.1 37.4 6.2 41.6 10.8 42.8 6.1 41.7 10.0 44.6 6.4
30.0 3.5 26.9 4.4 29.7 6.1 33.1 4.8 34.7 7.3 32.4 5.1 23.2 4.9 20.9 4.9 25.4 5.9 25.4 4.2 21.3 9.3 25.4 5.3 23.7 9.5 26.7 8.3 27.9 13.2 32.7 10.6 37.2 12.9 32.3 9.0 23.9 13.5 25.3 10.9 20.0 16.2 26.8 9.5 41.9 12.7 36.4 11.8
1991 ____________ % ±CI
1992 ____________ % ±CI
1993 ____________ % ±CI
1994 ____________ % ±CI
1995 ____________ % ±CI
33.4 2.6 36.4 3.3 37.8 3.4 34.7 3.5 36.1 3.9
34.2 3.6 40.1 5.2 37.9 4.8 34.1 5.3 35.9 5.3 32.4 3.2 31.9 4.0 37.6 4.8 35.3 4.3 36.4 5.3
17.2 3.6 23.9 7.2 23.3 5.8 16.7 5.6 22.7 6.2 31.8 3.5 31.3 4.5 35.5 5.1 34.1 5.3 32.1 5.9 56.4 5.2 57.4 5.4 56.0 6.7 53.8 6.2 55.6 6.1
35.8 4.5 38.9 5.6 41.2 6.1 34.5 5.6 39.3 5.9 29.4 3.4 33.5 5.8 33.3 5.4 32.3 6.2 30.8 6.3 33.0 5.5 37.7 7.6 40.3 7.7 37.6 8.7 37.0 9.2 51.2 9.1 43.9 11.8 55.1 12.2 50.3 13.0 51.7 11.3
‡95% confidence interval. §Includes persons aged 25 years and older.ΔLevels presented for 1965 are for persons who had a high school education or less and persons who attended some college or were college graduates.
NA = data not available. Source: National Center for Health Statistics, public use data tapes, 1965–1995.
Patterns of Tobacco Use 119
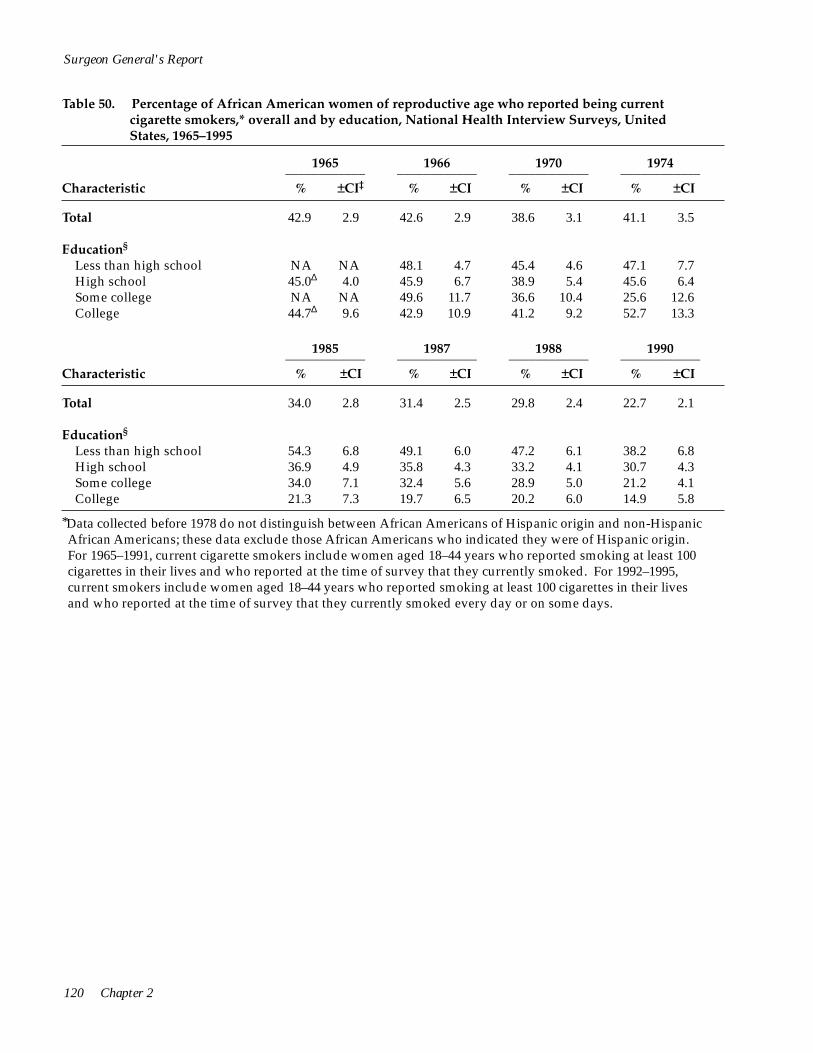
Surgeon General's Report
Table 50. Percentage of African American women of reproductive age who reported being current cigarette smokers,* overall and by education, National Health Interview Surveys, United States, 1965–1995
1965 ____________ % ±CI‡
1966 ____________ % ±CI
1970 ____________ % ±CI
1974 ____________ % ±CI Characteristic
Total 42.9 2.9 42.6 2.9 38.6 3.1 41.1 3.5
Education§
Less than high school NA NA 48.1 4.7 45.4 4.6 47.1 7.7 High school 45.0Δ 4.0 45.9 6.7 38.9 5.4 45.6 6.4 Some college NA NA 49.6 11.7 36.6 10.4 25.6 12.6 College 44.7Δ 9.6 42.9 10.9 41.2 9.2 52.7 13.3
1985 ____________ % ±CI
1987 ____________ % ±CI
1988 ____________ % ±CI
1990 ____________ % ±CI Characteristic
Total 34.0 2.8 31.4 2.5 29.8 2.4 22.7 2.1
Education§
Less than high school 54.3 6.8 49.1 6.0 47.2 6.1 38.2 6.8 High school 36.9 4.9 35.8 4.3 33.2 4.1 30.7 4.3 Some college 34.0 7.1 32.4 5.6 28.9 5.0 21.2 4.1 College 21.3 7.3 19.7 6.5 20.2 6.0 14.9 5.8
*Data collected before 1978 do not distinguish between African Americans of Hispanic origin and non-Hispanic African Americans; these data exclude those African Americans who indicated they were of Hispanic origin. For 1965–1991, current cigarette smokers include women aged 18–44 years who reported smoking at least 100 cigarettes in their lives and who reported at the time of survey that they currently smoked. For 1992–1995, current smokers include women aged 18–44 years who reported smoking at least 100 cigarettes in their lives and who reported at the time of survey that they currently smoked every day or on some days.
120 Chapter 2

Tobacco Use Among U.S. Racial/Ethnic Minority Groups
1976†
% ±CI
1977†
% ±CI
1978
% ±CI
1979
% ±CI
1980
% ±CI
1983
% ±CI
38.8 4.2 41.7 4.0 36.4 6.3 35.2 3.0 34.6 5.4 34.3 3.4
45.3 7.1 44.0 9.0 41.5 10.3 43.2 8.9 35.7 12.9 49.6 8.9 39.1 7.3 49.3 7.6 36.4 7.7 34.5 6.8 40.0 10.0 36.5 6.2 46.0 9.6 41.4 10.5 53.0 15.3 33.2 9.7 30.5 11.8 29.3 8.4 35.5 15.4 36.6 15.1 45.9 19.2 36.2 10.3 31.0 17.4 22.5 9.2
1991
% ±CI
1992
% ±CI
1993
% ±CI
1994
% ±CI
1995
% ±CI
28.1 2.4 24.5 2.9 23.1 2.9 22.9 1.8 23.8 3.9
50.4 6.1 45.9 10.0 45.6 9.4 43.6 9.4 49.6 12.3 32.4 4.0 29.8 5.2 30.2 5.5 26.1 5.2 30.6 6.9 31.5 5.6 26.1 6.7 26.3 6.5 27.4 8.2 24.9 7.6 19.8 6.6 18.5 8.2 8.2 6.0 8.0 5.7 13.6 7.9
†The 1976 and 1977 surveys collected data only for persons aged 20 years and older. The data for 1976 and 1977 were statistically adjusted to produce estimates that approximate those for African American women aged 18–44 years.
‡95% confidence interval. § Includes persons aged 25 years and older. ΔLevels presented for 1965 are for persons who had a high school education or less and persons who attended some college or were college graduates.
NA = data not available. Source: National Center for Health Statistics, public use data tapes, 1965–1995.
Patterns of Tobacco Use 121

122 Chapter 2
__________________ _________________ _________________ _____________
>HS >HS
Surgeon General's Report
Appendix 5. Validation of the Retrospective Assessment of Smoking Prevalence
Because the method of computing smoking prevalences retrospectively is inherent in the birth cohort analyses described in this chapter, comparability of these estimates with accepted cross-sectional estimates was examined. At least two factors contribute to the observed difference between retrospective and cross-sectional estimates of smoking prevalence: how a former smoker is defined and differences in mortality between smokers and nonsmokers (differential mortality). Retrospective estimates will be greater than cross-sectional ones because they are based on the age at which a smoker quits once and for all. However, cross-sectional estimates, using the accepted definition of a former smoker (a person who has ever smoked 100 cigarettes but does not smoke now), classify ever smokers who are not currently smoking as quitters, even though many will relapse several times before finally quitting. Differential mortality results in retrospective
estimates smaller than cross-sectional ones because smokers are less likely than others to survive and report their smoking history. This factor affects only the older birth cohorts (Harris 1983).
Retrospective estimates of smoking prevalence were assessed by comparing them with smoking prevalence estimates from the NHISs from 1965 through 1988 and from Gallup surveys from 1944 through 1988. The NHIS and Gallup surveys both sample adults only; thus, for the comparison, retrospective prevalences computed for each year included only respondents aged 18 years and older in that calendar year. Sample sizes for the birth cohorts included in this analysis varied widely (Table 51) (NCHS, public use data tapes, 1978, 1979, 1980, 1982–1984 [HHANES], and 1987 and 1988 combined).
When this methodology was used to estimate smoking prevalences retrospectively for the national
Table 51. Sample sizes for birth cohorts, by gender, race/ethnicity, and education,* National Health Interview Surveys, 1978–1980, 1987 and 1988 combined, and Hispanic Health and Nutrition Examination Survey, 1982–1984
Men ______ Women __________African American Hispanic African American Hispanic
Birth Cohort <HS <HS <HS >HS <HS >HS
1908–1917 401 96 142 33 601 185 229 30
1918–1927 494 222 267 111 683 444 376 113
1928–1937 370 387 387 178 531 638 508 233
1938–1947 292 622 266 226 457 1,013 392 277
1948–1957 277 1,066 322 375 555 2,006 417 462
1958–1967† 175 755 180 255 415 1,510 224 319
*Education was identified as either <12 years of school completed (<HS [high school]) or ≥12 years of school completed (≥HS).
†The smoking experience of this cohort is still incomplete. Source: National Center for Health Statistics, public use data tapes, 1978, 1979, 1980, 1982–1984 (Cancer Control Supplement and Epidemiology Supplement), and 1987 and 1988 combined.
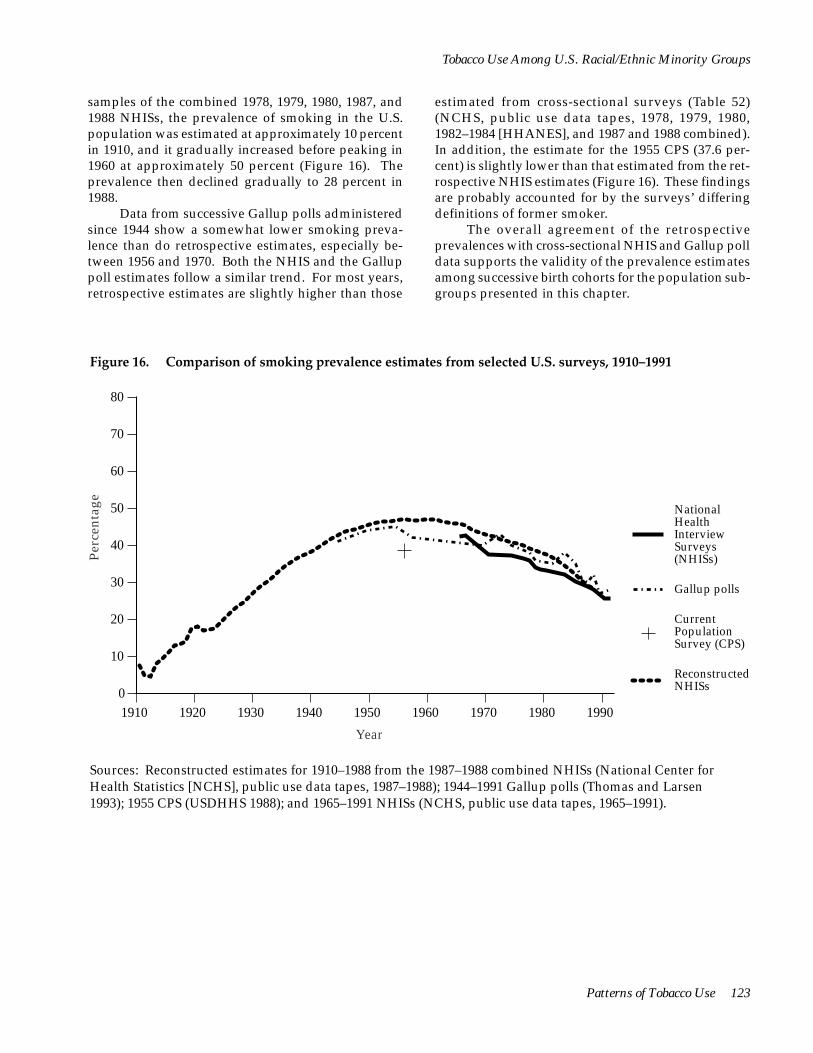
Per
cent
age
80
70
60
50 National Health Interview
40 Surveys (NHISs)
30 Gallup polls
Current Population Survey (CPS)
10 Reconstructed NHISs
20
0 1910 1920 1930 1940 1950 1960 1970 1980 1990
Year
Tobacco Use Among U.S. Racial/Ethnic Minority Groups
samples of the combined 1978, 1979, 1980, 1987, and 1988 NHISs, the prevalence of smoking in the U.S. population was estimated at approximately 10 percent in 1910, and it gradually increased before peaking in 1960 at approximately 50 percent (Figure 16). The prevalence then declined gradually to 28 percent in 1988.
Data from successive Gallup polls administered since 1944 show a somewhat lower smoking prevalence than do retrospective estimates, especially between 1956 and 1970. Both the NHIS and the Gallup poll estimates follow a similar trend. For most years, retrospective estimates are slightly higher than those
estimated from cross-sectional surveys (Table 52) (NCHS, public use data tapes, 1978, 1979, 1980, 1982–1984 [HHANES], and 1987 and 1988 combined). In addition, the estimate for the 1955 CPS (37.6 percent) is slightly lower than that estimated from the retrospective NHIS estimates (Figure 16). These findings are probably accounted for by the surveys’ differing definitions of former smoker.
The overall agreement of the retrospective prevalences with cross-sectional NHIS and Gallup poll data supports the validity of the prevalence estimates among successive birth cohorts for the population subgroups presented in this chapter.
Figure 16. Comparison of smoking prevalence estimates from selected U.S. surveys, 1910–1991
Sources: Reconstructed estimates for 1910–1988 from the 1987–1988 combined NHISs (National Center for Health Statistics [NCHS], public use data tapes, 1987–1988); 1944–1991 Gallup polls (Thomas and Larsen 1993); 1955 CPS (USDHHS 1988); and 1965–1991 NHISs (NCHS, public use data tapes, 1965–1991).
Patterns of Tobacco Use 123
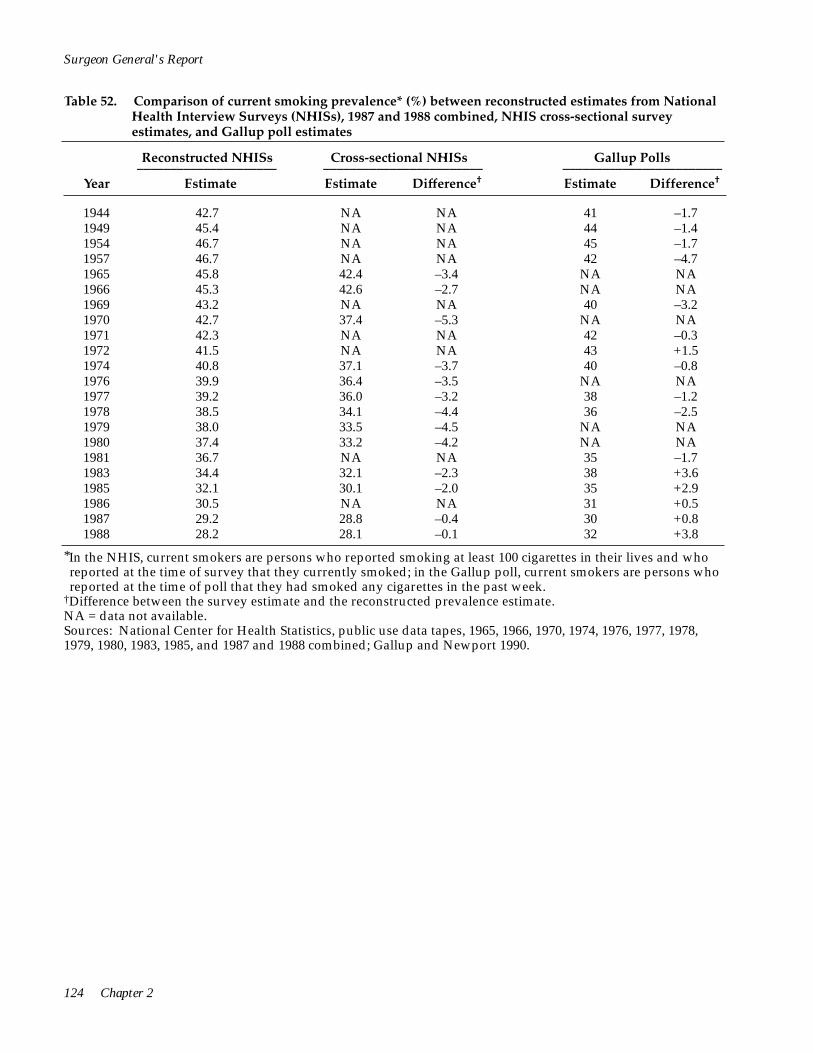
Surgeon General's Report
Table 52. Comparison of current smoking prevalence* (%) between reconstructed estimates from National Health Interview Surveys (NHISs), 1987 and 1988 combined, NHIS cross-sectional survey estimates, and Gallup poll estimates
Reconstructed NHISs Cross-sectional NHISs Gallup Polls _____________________ ________________________ ________________________
Year Estimate Estimate Difference† Estimate Difference†
1944 42.7 NA NA 41 –1.7 1949 45.4 NA NA 44 –1.4 1954 46.7 NA NA 45 –1.7 1957 46.7 NA NA 42 –4.7 1965 45.8 42.4 –3.4 NA NA 1966 45.3 42.6 –2.7 NA NA 1969 43.2 NA NA 40 –3.2 1970 42.7 37.4 –5.3 NA NA 1971 42.3 NA NA 42 –0.3 1972 41.5 NA NA 43 +1.5 1974 40.8 37.1 –3.7 40 –0.8 1976 39.9 36.4 –3.5 NA NA 1977 39.2 36.0 –3.2 38 –1.2 1978 38.5 34.1 –4.4 36 –2.5 1979 38.0 33.5 –4.5 NA NA 1980 37.4 33.2 –4.2 NA NA 1981 36.7 NA NA 35 –1.7 1983 34.4 32.1 –2.3 38 +3.6 1985 32.1 30.1 –2.0 35 +2.9 1986 30.5 NA NA 31 +0.5 1987 29.2 28.8 –0.4 30 +0.8 1988 28.2 28.1 –0.1 32 +3.8
*In the NHIS, current smokers are persons who reported smoking at least 100 cigarettes in their lives and who reported at the time of survey that they currently smoked; in the Gallup poll, current smokers are persons who reported at the time of poll that they had smoked any cigarettes in the past week.
†Difference between the survey estimate and the reconstructed prevalence estimate. NA = data not available. Sources: National Center for Health Statistics, public use data tapes, 1965, 1966, 1970, 1974, 1976, 1977, 1978, 1979, 1980, 1983, 1985, and 1987 and 1988 combined; Gallup and Newport 1990.
124 Chapter 2
Tobacco Use Among U.S. Racial/Ethnic Minority Groups
References
Andreski P, Breslau N. Smoking and nicotine dependence in young adults: differences between blacks and whites. Drug and Alcohol Dependence 1993; 32(2):11–925.
Austin GA, Prendergast ML, Lee H. Substance Abuse Among Asian American Youth: Prevention Research Update 1989;5(Winter):1–29.
Bachman JG, Johnston LD, O’Malley PM. Monitoring the Future: Questionnaire Responses from the Nation’s High School Seniors, 1976. Ann Arbor (MI): Survey Research Center, Institute for Social Research, University of Michigan, 1980a.
Bachman JG, Johnston LD, O’Malley PM. Monitoring the Future: Questionnaire Responses from the Nation’s High School Seniors, 1978. Ann Arbor (MI): Survey Research Center, Institute for Social Research, University of Michigan, 1980b.
Bachman JG, Johnston LD, O’Malley PM. Monitoring the Future: Questionnaire Responses from the Nation’s High School Seniors, 1980. Ann Arbor (MI): Survey Research Center, Institute for Social Research, University of Michigan, 1981.
Bachman JG, Johnston LD, O’Malley PM. Monitoring the Future: Questionnaire Responses from the Nation’s High School Seniors, 1982. Ann Arbor (MI): Survey Research Center, Institute for Social Research, University of Michigan, 1984.
Bachman JG, Johnston LD, O’Malley PM. Monitoring the Future: Questionnaire Responses from the Nation’s High School Seniors, 1984. Ann Arbor (MI): Survey Research Center, Institute for Social Research, University of Michigan, 1985.
Bachman JG, Johnston LD, O’Malley PM. Monitoring the Future: Questionnaire Responses from the Nation’s High School Seniors, 1986. Ann Arbor (MI): Survey Research Center, Institute for Social Research, University of Michigan, 1987.
Bachman JG, Johnston LD, O’Malley PM. Monitoring the Future: Questionnaire Responses from the Nation’s High School Seniors, 1988. Ann Arbor (MI): Survey Research Center, Institute for Social Research, University of Michigan, 1991a.
Bachman JG, Johnston LD, O’Malley PM. Monitoring the Future: Questionnaire Responses from the Nation’s High School Seniors, 1990. Ann Arbor (MI): Survey Research Center, Institute for Social Research, University of Michigan, 1993a.
Bachman JG, Johnston LD, O’Malley PM. Monitoring the Future: Questionnaire Responses from the Nation’s High School Seniors, 1992. Ann Arbor (MI): Survey Research Center, Institute for Social Research, University of Michigan, 1993b.
Bachman JG, Johnston LD, O’Malley PM. Monitoring the Future: Questionnaire Responses from the Nation’s High School Seniors, 1994. Ann Arbor (MI): Survey Research Center, Institute for Social Research, University of Michigan, 1997.
Bachman JG, Wallace JM Jr, O’Malley PM, Johnston LD, Kurth CL, Neighbors HW. Racial/ethnic differences in smoking, drinking, and illicit drug use among American high school seniors, 1976–89. American Journal of Public Health 1991b;81(3):372–7.
Backinger CL, Bruerd B, Kinney MB, Szpunar SM. Knowledge, intent to use, and use of smokeless tobacco among sixth grade schoolchildren in six selected U.S. sites. Public Health Reports 1993;108(5):637–42.
Bauman KE, Ennett SE. Tobacco use by black and white adolescents: the validity of self-reports. American Journal of Public Health 1994;84(3):394–8.
Bauman KE, Koch GG, Fisher LA, Bryan ES. Use of smokeless tobacco by age, race, and gender in ten standard metropolitan statistical areas of the Southeast United States. In: National Cancer Institute. Smokeless Tobacco Use in the United States. National Cancer Institute Monograph No. 8. Bethesda (MD): US Department of Health and Human Services, Public Health Service, National Institutes of Health, National Cancer Institute, Division of Cancer Prevention and Control, Smoking, Tobacco, and Cancer Program. NIH Publication No. 89-3055, 1989:35–7.
Benowitz NL, Pérez-Stable E, Herrera B, Jacob P. African American-Caucasian differences in nicotine and cotinine metabolism [abstract]. Clinical Pharmacology and Therapeutics 1995;57(2):159.
Patterns of Tobacco Use 125
Surgeon General's Report
Blaisdell RK. The health status of the Kanaka Maoli. Asian American and Pacific Islander Journal of Health 1993;1(2):116–60.
Blum RW, Harmon B, Harris L, Bergeisen L, Resnick MD. American Indian-Alaska Native youth health. Journal of the American Medical Association 1992;267 (12):1637–44.
Bruerd B. Smokeless tobacco use among Native American children. Public Health Reports 1990;105 (2):196–201.
Burns D, Pierce JP. Tobacco Use in California, 1990–1991. Sacramento (CA): California Department of Health Services, 1992.
Camp DE, Klesges RC, Relyea G. The relationship between body weight concerns and adolescent smoking. Health Psychology 1993;12(1):24–32.
Centers for Disease Control. Oneida Indian Nation of New York Health Needs Assessment 1990. Atlanta: US Department of Health and Human Services, Public Health Service, Centers for Disease Control, 1990.
Centers for Disease Control. Cigarette smoking among reproductive-aged women—Behavioral Risk Factor Surveillance System, 1989. Morbidity and Mortality Weekly Report 1991a;40(42):719–23.
Centers for Disease Control. Cigarette smoking among youth—United States, 1989. Morbidity and Mortality Weekly Report 1991b;40(41):712–5.
Centers for Disease Control. Differences in the age of smoking initiation between blacks and whites— United States. Morbidity and Mortality Weekly Report 1991c;40(44):754–7.
Centers for Disease Control. Cigarette smoking among American Indians and Alaskan Natives—Behavioral Risk Factor Surveillance System, 1987–1991. Morbidity and Mortality Weekly Report 1992a;41(45):861–3.
Centers for Disease Control. Cigarette smoking among Chinese, Vietnamese, and Hispanics—California, 1989–1991. Morbidity and Mortality Weekly Report 1992b;41(20):362–7.
Centers for Disease Control. Cigarette smoking among Southeast Asian immigrants—Washington State, 1989. Morbidity and Mortality Weekly Report 1992c;41(45): 854–61.
Centers for Disease Control. Comparison of the cigarette brand preferences of adult and teenaged smokers—United States, 1989, and 10 U.S. communities, 1988 and 1990. Morbidity and Mortality Weekly Report 1992d;41(10):169–73, 179–81.
Centers for Disease Control. Using Chronic Disease Data: A Handbook for Public Health Practitioners. Atlanta: US Department of Health and Human Services, Public Health Service, Centers for Disease Control, National Center for Chronic Disease Prevention and Health Promotion, Office of Surveillance and Analysis, 1992e.
Centers for Disease Control and Prevention. Smoking cessation during previous year among adults—United States, 1990 and 1991. Morbidity and Mortality Weekly Report 1993:42(26):504–7.
Centers for Disease Control and Prevention. Changes in the cigarette brand preferences of adolescent smokers—United States, 1989–1993. Morbidity and Mortality Weekly Report 1994a;43(32):577–81.
Centers for Disease Control and Prevention. Cigarette smoking among women of reproductive age—United States, 1987–1992. Morbidity and Mortality Weekly Report 1994b;43(43):789–91, 797.
Centers for Disease Control and Prevention. Surveillance for selected tobacco-use behaviors—United States, 1900–1994. Morbidity and Mortality Weekly Report 1994c;43(SS-3):1–43.
Centers for Disease Control and Prevention. Smokeless tobacco use among American Indian women— Southeastern North Carolina, 1991. Morbidity and Mortality Weekly Report 1995;44(6):113–7.
Centers for Disease Control and Prevention. Tobacco use and usual source of cigarettes among high school students—United States, 1995. Morbidity and Mortality Weekly Report 1996;45(20):413–8.
Centers for Disease Control and Prevention. Behavioral Risk Factor Survey of Korean Americans— Alameda County, California, 1994. Morbidity and Mortality Weekly Report 1997a;46(33):774–7.
Centers for Disease Control and Prevention. Cigar smoking among teenagers—United States, Massachusetts, and New York, 1996. Morbidity and Mortality Weekly Report 1997b;46(20):433–40.
126 Chapter 2
Tobacco Use Among U.S. Racial/Ethnic Minority Groups
Chandra A. Health Aspects of Pregnancy and Childbirth: United States, 1982–88. Vital and Health Statistics. Series 23, No. 18. Hyattsville (MD): US Department of Health and Human Services, Public Health Service, Centers for Disease Control and Prevention, National Center for Health Statistics. DHHS Publication No. (PHS) 95-1994, 1995.
Chen VW. Smoking and the health gap in minorities. Annals of Epidemiology 1993;3(2):159–64.
Clark PI, Gautam S, Gerson LW. Effect of menthol cigarettes on biochemical markers of smoke exposure among black and white smokers. Chest 1996;110(5): 1194–8.
Crawford FG, Mayer J, Santella RM, Cooper TB, Ottman R, Tsai WY, et al. Biomarkers of environmental tobacco smoke in preschool children and their mothers. Journal of the National Cancer Institute 1994;86(18): 1398–402.
Cummings KM, Giovino G, Mendicino AJ. Cigarette advertising and black-white differences in brand preferences. Public Health Reports 1987;102(6):698–701.
Davis RL, Helgerson SD, Waller P. Smoking during pregnancy among Northwest Native Americans. Public Health Reports 1992;107(1):66-9.
Delgado JL, Johnson CL, Roy I, Treviño FM. Hispanic Health and Nutrition Examination Survey: Methodological Considerations. American Journal of Public Health 1990;80(Suppl):6–10.
Dusenbury L, Kerner JF, Baker E, Botvin G, James-Ortiz S, Zauber A. Predictors of smoking prevalence among New York Latino youth. American Journal of Public Health 1992;82(1):55–8.
Escobedo LG, Anda RF, Smith PF, Remington PL, Mast EE. Sociodemographic characteristics of cigarette smoking initiation in the United States: implications for smoking prevention policy. Journal of the American Medical Association 1990;264(12):1550–5.
Escobedo LG, Peddicord JP. Smoking prevalence in US birth cohorts: the influence of gender and education. American Journal of Public Health 1996;86(2):231–6.
Escobedo LG, Reddy M, DuRant RH. Relationship between cigarette smoking and health risk and problem behaviors among US adolescents. Archives of Pediatrics and Adolescent Medicine 1997;151(1):66–71.
Escobedo LG, Remington PL. Birth cohort analysis of prevalence of cigarette smoking among Hispanics in the United States. Journal of the American Medical Association 1989;261(1):66–9.
Escobedo LG, Remington PL, Anda RF. Long-term age-specific prevalence of cigarette smoking among Hispanics in the United States. Journal of Psychoactive Drugs 1989a;21(3):307–18.
Escobedo LG, Remington PL, Anda RF. Long-term secular trends in initiation of cigarette smoking among Hispanics in the United States. Public Health Reports 1989b;104(6):583–7.
Escobedo LG, Zhu BP, Giovino GA, Eriksen MP. Educational attainment and racial differences in cigarette smoking. Journal of the National Cancer Institute 1995; 87(20):1552–3.
Etzel RA, Jones DB, Schlife CM, Lyke JR, Spierto FW, Middaugh JP. Passive smoking and tobacco chewing among Alaskan children: measuring saliva cotinine. Journal of Smoking-Related Diseases 1992;3(2):161–5.
Faulkner DL, Escobedo LG, Zhu BP, Chrismon JH, Merritt RK. Race and the incidence of cigarette smoking among adolescents in the United States. Journal of the National Cancer Institute 1996;88(16):1158–60.
Fiore MC, Novotny TE, Pierce JP, Hatziandreu EJ, Patel KM, Davis RM. Trends in cigarette smoking in the United States: the changing influence of gender and race. Journal of the American Medical Association 1989;261(1):49–55.
Flay BR, Brannon BR, Johnson CA, Hansen WB, Ulene AL, Whitney-Saltiel DA, et al. The Television School and Family Smoking Prevention and Cessation Project. Preventive Medicine 1988;17(5):585–607.
Floyd RL, Rimer BK, Giovino GA, Mullen PD, Sullivan SE. A review of smoking in pregnancy: effects on pregnancy outcomes and cessation efforts. Annual Review of Public Health 1993;14:379–411.
Gallup G Jr, Newport F. Many Americans favor restrictions on smoking in public places. The Gallup Poll Monthly 1990;298(July):19–27.
Patterns of Tobacco Use 127
Surgeon General's Report
Gentry EM, Kalsbeek WD, Hogelin GC, Jones JT, Gaines KL, Forman MR, et al. The Behavioral Risk Factor Surveys: II. Design, methods, and estimates from combined state data. American Journal of Preventive Medicine 1985;1(6):9–14.
Goldberg HI, Warren CW, Oge LL, Friedman JS, Helgerson SD, Pepion DD, et al. Prevalence of behavioral risk factors in two American Indian populations in Montana. American Journal of Preventive Medicine 1991;7(3):155–60.
Gong YL, Koplan JP, Feng W, Chen CHC, Zheng P, Harris JR. Cigarette Smoking in China: prevalence, characteristics, and attitudes in Minhang district. Journal of the American Medical Association 1995; 274(15):1232–4.
Greenlund KJ, Johnson C, Wattigney W, Bao W, Webber LS, Berenson GS, et al. Trends in cigarette smoking among children in a southern community, 1976–1994: the Bogalusa Heart Study. Annals of Epidemiology 1996;6(6):476–482.
Guendelman S, Abrams B. Dietary, alcohol, and tobacco intake among Mexican-American women of childbearing age: results from HANES data. American Journal of Health Promotion 1994;8(5):363–72.
Harris JE. Cigarette smoking among successive birth cohorts of men and women in the United States during 1900-80. Journal of the National Cancer Institute 1983; 71(3):473–9.
Hawks BL. Smoking and smoking-related cancers among Asian and Pacific Islander Americans. In: Jones LA, editor. Minorities and Cancer. New York: Springer-Verlag, 1989:137–51.
Haynes SG, Harvey C, Montes H, Nickens H, Cohen BH. VIII. Patterns of cigarette smoking among Hispanics in the United States: results from HHANES 1982–84. American Journal of Public Health 1990;80 (Suppl):47–54.
Hodge FS, Cummings S, Fredericks L, Kipnis P, Williams M, Teehee K. Prevalence of smoking among adult American Indian clinic users in northern California. Preventive Medicine 1995;24(5):441–6.
Hunter SM, Croft JB, Burke GL, Parker FC, Webber LS, Berenson GS. Longitudinal patterns of cigarette smoking and smokeless tobacco use in youth: the Bogalusa Heart Study. American Journal of Public Health 1986;76(2):193–5.
Husten CG, McCarty MC, Giovino GA, Chrismon JH, Zhu B-P. Intermittent smokers: a descriptive analysis of persons who have never smoked daily. American Journal of Public Health 1998;88(1):86–9.
Hymowitz N, Sexton M, Ockene J, Grandits G. Baseline factors associated with smoking cessation and relapse. Preventive Medicine 1991;20(5):590–601.
Hymowitz N, Mouton C, Edkholdt H. Menthol cigarette smoking in African Americans and whites [letter]. Tobacco Control 1995;4(2):194–5.
Jenkins CNH, McPhee SJ, Bird JA, Bonilla N-TH. Cancer risks and prevention practices among Vietnamese refugees. Western Journal of Medicine 1990;153(1):34–9.
Jenkins CNH, Dai PX, Ngoc DH, Kinh HV, Hoang TT, Bales S, et al. Tobacco use in Vietnam: prevalence, predictors, and the role of the transnational tobacco corporations. Journal of the American Medical Association 1997a;277(21):1726–31.
Jenkins CNH, McPhee SJ, Le A, Pham GQ, Ha N-T, Stewart S. The effectiveness of a media-led intervention to reduce smoking among Vietnamese-American men. American Journal of Public Health 1997b;87(6): 1031–4.
Johnston LD, Bachman JG, O’Malley PM. Monitoring the Future: Questionnaire Responses from the Nation’s High School Seniors, 1977. Ann Arbor (MI): Survey Research Center, Institute for Social Research, University of Michigan, 1980a.
Johnston LD, Bachman JG, O’Malley PM. Monitoring the Future: Questionnaire Responses from the Nation’s High School Seniors, 1979. Ann Arbor (MI): Survey Research Center, Institute for Social Research, University of Michigan, 1980b.
Johnston LD, Bachman JG, O’Malley PM. Monitoring the Future: Questionnaire Responses from the Nation’s High School Seniors, 1981. Ann Arbor (MI): Survey Research Center, Institute for Social Research, University of Michigan, 1982.
128 Chapter 2

Tobacco Use Among U.S. Racial/Ethnic Minority Groups
Johnston LD, Bachman JG, O’Malley PM. Monitoring the Future: Questionnaire Responses from the Nation’s High School Seniors, 1983. Ann Arbor (MI): Survey Research Center, Institute for Social Research, University of Michigan, 1984.
Johnston LD, Bachman JG, O’Malley PM. Monitoring the Future: Questionnaire Responses from the Nation’s High School Seniors, 1985. Ann Arbor (MI): Survey Research Center, Institute for Social Research, University of Michigan, 1986.
Johnston LD, Bachman JG, O’Malley PM. Monitoring the Future: Questionnaire Responses from the Nation’s High School Seniors, 1987. Ann Arbor (MI): Survey Research Center, Institute for Social Research, University of Michigan, 1991.
Johnston LD, Bachman JG, O’Malley PM. Monitoring the Future: Questionnaire Responses from the Nation’s High School Seniors, 1989. Ann Arbor (MI): Survey Research Center, Institute for Social Research, University of Michigan, 1992.
Johnston LD, Bachman JG, O’Malley PM. Monitoring the Future: Questionnaire Responses from the Nation’s High School Seniors, 1991. Ann Arbor (MI): Survey Research Center, Institute for Social Research, University of Michigan, 1993a.
Johnston LD, Bachman JG, O’Malley PM. Monitoring the Future: Questionnaire Responses from the Nation’s High School Seniors, 1993. Ann Arbor (MI): Survey Research Center, Institute for Social Research, University of Michigan, 1995a.
Johnston LD, Bachman JG, O’Malley PM. Monitoring the Future: Questionnaire Responses from the Nation’s High School Seniors, 1995. Ann Arbor (MI): Survey Research Center, Institute for Social Research, University of Michigan, 1997.
Johnston LD, O’Malley PM, Bachman JG. National Survey Results on Drug Use from Monitoring the Future Study, 1975–1992: Volume 1, Secondary School Students. Rockville (MD): US Department of Health and Human Services, Public Health Service, National Institutes of Health, National Institute on Drug Abuse. NIH Publication No. 93-3597, 1993b.
Johnston LD, O’Malley PM, Bachman JG. National Survey Results on Drug Use from Monitoring the Future Study, 1975–1994: Volume 1, Secondary School Students. Rockville (MD): US Department of Health and Human Services, Public Health Service, National Institutes of Health, National Institute on Drug Abuse. NIH Publication No. 95-4026, 1995b.
Johnston LD, O’Malley PM, Bachman JG. National Survey Results on Drug Use from the Monitoring the Future Study, 1975–1995: Volume 1, Secondary School Students. Rockville (MD): US Department of Health and Human Services, Public Health Service, National Institutes of Health, National Institute on Drug Abuse. NIH Publication No. 96-4139, 1996.
Kimball EH, Goldberg HI, Oberle MW. Western Washington Native American Behavioral Risk Factor Survey, 1989, Final Report. Washington (DC): Chehalis, Hoh, Quinault, and Shoalwater Bay Indian Tribes, Indian Health Service, Centers for Disease Control, University of Washington School of Public Health and Community Medicine, reprinted by the US Department of Health and Human Services, Public Health Service, 1990.
Klatsky AL, Armstrong MA. Cardiovascular risk factors among Asian Americans living in northern California. American Journal of Public Health 1991;81(11): 1423–8.
Kleinman JC, Kopstein A. Smoking during pregnancy, 1967–80. American Journal of Public Health 1987; 77(7):823–5.
Knight JM, Eliopoulos C, Klein J, Greenwald M, Koren G. Passive smoking in children: racial differences in systemic exposure to cotinine by hair and urine analysis. Chest 1996;109(2):446–50.
Koepke D, Flay BR, Johnson CA. Health behaviors in minority families: the case of cigarette smoking. Family and Community Health 1990;13(1):35–43.
Kolbe LJ. An epidemiological surveillance system to monitor the prevalence of youth behaviors that most affect health. Health Education 1990;21(6):44–8.
Kolbe LJ, Kann L, Collins JL. Overview of the Youth Risk Behavior Surveillance System. Public Health Reports 1993;108(1 Supp1):2–10.
Patterns of Tobacco Use 129
Surgeon General's Report
Kominski R, Adams A. Educational Attainment in the United States: March 1993 and 1992. Washington (DC): US Government Printing Office. Current Population Reports, P20–476, 1994.
Koong SL, Malison MD, Nakashima AK. A prevalence survey of behavioural risk factors in Taipei City, Taiwan. International Journal of Epidemiology 1990;19 (1):154–9.
Kopstein AN, Roth PT. Drug Abuse Among Racial/Ethnic Groups. Rockville (MD): US Department of Health and Human Services, Public Health Service, National Institutes of Health, National Institute on Drug Abuse, 1993.
Lando HA, Johnson KM, Graham-Tomasi RP, McGovern PG, Solberg L. Urban Indians’ smoking patterns and interest in quitting. Public Health Reports 1992;107(3):340–4.
Lefkowitz D, Underwood C. Personal Health Practices: Findings from the Survey of American Indians and Alaska Natives. National Medical Expenditure Survey Research Findings 10. Rockville (MD): US Department of Health and Human Services, Public Health Service, Agency for Health Care Policy and Research. AHCPR Publication No. 91-0034, 1991.
Leonard B, Paisano R, Smith EM, Kileen MJ, Cobb N. IHS Tobacco Project. The IHS Primary Care Provider 1993;18(6):107–16.
Li VC, Hu J-H, Zhou M, Zheng J. Behavioral aspects of cigarette smoking among industrial college men of Shanghai, China. American Journal of Public Health 1988;78(12):1550–3.
Liberatos P, Link BG, Kelsey JL. The measurement of social class in epidemiology. Epidemiologic Reviews. Vol. 10. Baltimore (MD): The Johns Hopkins University School of Hygiene and Public Health, 1988:87–121.
Lovato CY, Litrownik AJ, Elder J, Nuñez-Liriano A, Suarez D, Talavera GA. Cigarette and alcohol use among migrant Hispanic adolescents. Family & Community Health 1994;16(4):23–36.
Lowry R, Kann L, Collins JL, Kolbe LJ. The effect of socioeconomic status on chronic disease risk behaviors among US adolescents. Journal of the American Medical Association 1996;276(10):792–7.
Marcus AC, Crane LA, Shopland DR, Lynn WR. Use of smokeless tobacco in the United States: recent estimates from the Current Population Survey. In: National Cancer Institute. Smokeless Tobacco Use in the United States. National Cancer Institute Monograph No. 8. Bethesda (MD): US Department of Health and Human Services, Public Health Service, National Institutes of Health, National Cancer Institute, Division of Cancer Prevention and Control, Smoking, Tobacco, and Cancer Program. NIH Publication No. 89-3055, 1989:17–23.
McIntosh H. Black teens not smoking in great numbers. Journal of the National Cancer Institute 1995; 87(8):564.
McPhee SJ, Jenkins CNH, Anh L. Smoking Prevention and Cessation Among Vietnamese in Northern California: Final Report. Sacramento (CA): Report submitted to the Tobacco Control Section, Department of Health Services, State of California, 1993.
McPhee SJ, Jenkins CNH, Wong C, Fordham D, Lai KQ, Bird JA, Moskowitz JM. Smoking cessation intervention among Vietnamese Americans: a controlled trial. Tobacco Control 1995;4(Suppl 1):16S–24S.
Mermelstein R, Robinson R, Ericksen M, Crosset L, Feldman S. Explanations of race and gender differences in teen tobacco use. Paper presented at the 124th annual meeting of the American Public Health Association, New York City, November 19, 1996.
Montgomery LE, Carter-Pokras O. Health status by social class and/or minority status: implications for environmental equity research. Toxicology and Industrial Health 1993;9(5):729–73.
Moss AJ, Allen KF, Giovino GA, Mills SL. Recent Trends in Adolescent Smoking, Smoking-Uptake Correlates, and Expectations About the Future. Advance Data. No. 221. Hyattsville (MD): US Department of Health and Human Services, Public Health Service, Centers for Disease Control and Prevention, National Center for Health Statistics. DHHS Publication No. (PHS) 93-1250, 1992.
National Cancer Institute. Strategies to Control Tobacco Use in the United States: A Blueprint for Public Health Action in the 1990’s. Smoking and Tobacco Control Monograph No. 1. Bethesda (MD): US Department of Health and Human Services, Public Health Service, National Institutes of Health, National Cancer Institute. NIH Publication No. 92-3316, 1991.
130 Chapter 2
Tobacco Use Among U.S. Racial/Ethnic Minority Groups
National Center for Health Statistics. Health Interview Survey Procedure, 1957–1974. Vital and Health Statistics. Series 1, No. 11. Rockville (MD): US Department of Health, Education, and Welfare, Public Health Service, Health Resources Administration, National Center for Health Statistics. DHEW Publication No. (HRA) 75-1311, 1975.
National Center for Health Statistics. The National Health Interview Survey Design, 1973–84, and Procedures, 1975–83. Vital and Health Statistics. Series 1, No. 18. Hyattsville (MD): US Department of Health and Human Services, Public Health Service, National Center for Health Statistics. DHHS Publication No. (PHS) 85-1320, 1985a.
National Center for Health Statistics. Plan and Operation of the Hispanic Health and Nutrition Examination Survey, 1982–84. Vital and Health Statistics. Series 1, No. 19. Hyattsville (MD): US Department of Health and Human Services, Public Health Service, National Center for Health Statistics. DHHS Publication No. (PHS) 85-1321, 1985b.
National Center for Health Statistics. Design and Estimation for the National Health Interview Survey, 1985– 94. Vital and Health Statistics. Series 2, No. 110. Hyattsville (MD): US Department of Health and Human Services, Public Health Service, National Center for Health Statistics. DHHS Publication No. (PHS) 891384, 1989.
National Center for Health Statistics. Advance Report on New Data from the 1989 Birth Certificate. Monthly Vital Statistics Report 1992;40(12 Suppl).
National Center for Health Statistics. Advance Report of Maternal and Infant Health Data from the Birth Certificate, 1990. Monthly Vital Statistics Report 1993;42(2 Suppl).
National Center for Health Statistics. Advance Report of Maternal and Infant Health Data from the Birth Certificate, 1991. Monthly Vital Statistics Report 1994;42(11 Suppl).
National Center for Health Statistics. Health, United States, 1995. Hyattsville (MD): Public Health Service. DHHS Publication No. (PHS) 96-1232, 1996.
National Institute on Drug Abuse. Summary Tables: Annualized Estimates from the National Pregnancy and Health Survey. Rockville (MD): US Department of Health and Human Services, Public Health Service, National Institutes of Health, National Institute on Drug Abuse, 1994.
Navarro AM. Cigarette smoking among adult Latinos: the California Tobacco Baseline Survey. Annals of Behavioral Medicine 1996;18(4)238–45.
Nelson DE, Giovino GA, Shopland DR, Mowery PD, Mills SL, Eriksen MP. Trends in cigarette smoking among US adolescents, 1974 through 1991. American Journal of Public Health 1995;85(1):34–40.
Novotny TE, Pierce JP, Fiore MC, Davis RM. Smokeless tobacco use in the United States: the Adult Use of Tobacco Surveys. In: National Cancer Institute. Smokeless Tobacco Use in the United States. National Cancer Institute Monograph No. 8. Bethesda (MD): US Department of Health and Human Services, Public Health Service, National Institutes of Health, National Cancer Institute, Division of Cancer Prevention and Control, Smoking, Tobacco, and Cancer Program. NIH Publication No. 89-3055, 1989:25–8.
Novotny TE, Warner KE, Kendrick JS, Remington PL. Smoking by blacks and whites: socioeconomic and demographic differences. American Journal of Public Health 1988;78(9):1187–9.
Overpeck MD, Moss AJ. Children’s Exposure to Environmental Cigarette Smoke Before and After Birth: Health of Our Nation’s Children, United States, 1988. Advance Data. No. 202. Hyattsville (MD): US Department of Health and Human Services, Public Health Service, Centers for Disease Control, National Center for Health Statistics. DHHS Publication No. (PHS) 911250, 1991.
Pamuk ER, Mosher WD. Health Aspects of Pregnancy and Childbirth: United States, 1982. Vital and Health Statistics. Series 23, No. 16. Hyattsville (MD): US Department of Health and Human Services, Public Health Service, Centers for Disease Control, National Center for Health Statistics. DHHS Publication No. (PHS) 891992, 1992.
Parnell K, Sargent R, Thompson SH, Duhe SF, Valois RF, Kemper RC. Black and white adolescent females’ perceptions of ideal body size. Journal of School Health 1996;66(3):112–8.
Patterns of Tobacco Use 131

Surgeon General's Report
Pattishall EN, Strope GL, Etzel RA, Helms RW, Haley NJ, Denny FW. Serum cotinine as a measure of tobacco smoke exposure in children. American Journal of Diseases of Children 1985;139(11):1101–4.
Pierce JP, Fiore MC, Novotny TE, Hatziandreu EJ, Davis RM. Trends in cigarette smoking in the United States: educational differences are increasing. Journal of the American Medical Association 1989;261(1):56–60.
Pierce JP, Gilpin E, Burns DM, Whalen E, Rosbrook B, Shopland D, et al. Does tobacco advertising target young people to start smoking? evidence from California. Journal of the American Medical Association 1991a; 266(22):3154–8.
Pierce JP, Naquin M, Gilpin E, Giovino G, Mills S, Marcus S. Smoking initiation in the United States: a role for worksite and college smoking bans. Journal of the National Cancer Institute 1991b;83(14):1009–13.
Pirkle JL, Flegal KM, Bernert JT, Brody DJ, Etzel RA, Maurer KR. Exposure of the U.S. population to environmental tobacco smoke: the third National Health and Nutrition Examination Survey, 1988–1991. Journal of the American Medical Association 1996;275(16): 1233–40.
Pletsch PK. Prevalence of cigarette smoking in Hispanic women of childbearing age. Nursing Research 1991;40(2):103–6.
Remington PL, Smith MY, Williamson DF, Anda RF, Gentry EM, Hogelin GC. Design, characteristics, and usefulness of state-based behavioral risk factor surveillance: 1981–87. Public Health Reports 1988;103(4): 366–75.
Roscoe RJ, Deddens JA, Salvan A, Schnorr TM. Mortality among Navajo uranium miners. American Journal of Public Health 1995;85(4):535–40.
Rouse BA. Epidemiology of smokeless tobacco use: a national study. In: National Cancer Institute. Smokeless Tobacco Use in the United States. National Cancer Institute Monograph No. 8. Bethesda (MD): US Department of Health and Human Services, Public Health Service, National Cancer Institute, Division of Cancer Prevention and Control, Smoking, Tobacco, and Cancer Program. NIH Publication No. 89-3055, 1989: 29–33.
Royce JM, Hymowitz N, Corbett K, Hartwell TD, Orlandi MA, for the COMMIT Research Group. Smoking cessation factors among African Americans and whites. American Journal of Public Health 1993;83(2): 220–6.
Samet JM, Howard CA, Coultas DB, Skipper BJ. Acculturation, education, and income as determinants of cigarette smoking in New Mexico Hispanics. Cancer Epidemiology, Biomarkers & Prevention 1992;1(3): 235–40.
Shah BV. SESUDAAN: Standard Errors Program for Computing of Standardized Rates from Sample Survey Data. Research Triangle Park (NC): Research Triangle Institute, 1981.
Shah BV, Barnwell BG, Hunt PN, LaVange LM. SUDAAN: Professional Software for Survey Data Analysis (SUDAAN User’s Manual, Release 5.50). Research Triangle Park (NC): Research Triangle Institute, 1991.
Sheridan DP, Hornung CA, McCutcheon EP, Wheeler FC. Demographic and educational differences in smoking in a tobacco-growing state. American Journal of Preventive Medicine 1993;9(3):155–9.
Shopland DR, Hartman AM, Gibson JT, Mueller MD, Kessler LG, Lynn WR. Cigarette smoking among U.S. adults by state and region: estimates from the Current Population Survey. Journal of the National Cancer Institute 1996;88(23):1748–58.
Smith KW, McGraw SA, Carrillo JE. Factors affecting cigarette smoking and intention to smoke among Puerto Rican-American high school students. Hispanic Journal of Behavioral Sciences 1991;13(4):401–11.
Sugarman JR, Brenneman G, LaRoque W, Warren CW, Goldberg HI. The urban American Indian oversample in the 1988 National Maternal and Infant Health Survey. Public Health Reports 1994;109(2):243–50.
Sugarman JR, Warren CW, Oge L, Helgerson SD. Using the Behavioral Risk Factor Surveillance System to monitor year 2000 objectives among American Indians. Public Health Reports 1992;107(4):449–56.
Thomas RM, Larsen MD. Smoking prevalence, beliefs, and activities: by gender and other demographic indicators. Paper presented at the 1993 AAPOR Annual Convention, St. Charles, Illinois, May 1993.
132 Chapter 2
Tobacco Use Among U.S. Racial/Ethnic Minority Groups
Thornberry OT Jr, Massey JT. Trends in United States telephone coverage across time and subgroups. In: Groves RM, Biemer PP, Lyberg LE, Massey JT, Nicholls WL II, Waksberg J, editors. Telephone Survey Methodology. New York: John Wiley & Sons, 1988:25–49.
US Bureau of the Census. Statistical Brief: Phoneless in America. Washington (DC): US Department of Commerce, Economics and Statistics Administration, Bureau of the Census. SB/94-16, 1994.
US Department of Health and Human Services. The Health Consequences of Smoking for Women. A Report of the Surgeon General. Rockville (MD): US Department of Health and Human Services, Public Health Service, Office of the Assistant Secretary for Health, Office on Smoking and Health, 1980.
US Department of Health and Human Services. The Health Consequences of Smoking: Cardiovascular Disease. A Report of the Surgeon General. Rockville (MD): US Department of Health and Human Services, Public Health Service, Office on Smoking and Health. DHHS Publication No. (PHS) 84-50204, 1983.
US Department of Health and Human Services. The Health Consequences of Smoking: Cancer and Chronic Lung Disease in the Workplace. A Report of the Surgeon General. Rockville (MD): US Department of Health and Human Services, Public Health Service, Office on Smoking and Health. DHHS Publication No. (PHS) 85-50207, 1985.
US Department of Health and Human Services. The Health Consequences of Smoking: Nicotine Addiction. A Report of the Surgeon General. Rockville (MD): US Department of Health and Human Services, Public Health Service, Centers for Disease Control, Center for Health Promotion and Education, Office on Smoking and Health. DHHS Publication No. (CDC) 88-8406, 1988.
US Department of Health and Human Services. Reducing the Health Consequences of Smoking: 25 Years of Progress. A Report of the Surgeon General. Atlanta: US Department of Health and Human Services, Public Health Service, Centers for Disease Control, Center for Chronic Disease Prevention and Health Promotion, Office on Smoking and Health. DHHS Publication No. (CDC) 89-8411, 1989.
US Department of Health and Human Services. The Health Benefits of Smoking Cessation. A Report of the Surgeon General. Rockville (MD): US Department of Health and Human Services, Public Health Service, Centers for Disease Control, Center for Chronic Disease Prevention and Health Promotion, Office on Smoking and Health. DHHS Publication No. (CDC) 90-8416, 1990a.
US Department of Health and Human Services. Tobacco Use in 1986: Methods and Basic Tabulations from Adult Use of Tobacco Survey. Rockville (MD): US Department of Health and Human Services, Public Health Service, Centers for Disease Control, Center for Chronic Disease Prevention and Health Promotion, Office on Smoking and Health. DHHS Publication No. (OM) 902004, 1990b.
US Department of Health and Human Services. Smoking and Health in the Americas. A 1992 Report of the Surgeon General. Atlanta: US Department of Health and Human Services, Centers for Disease Control, National Center for Chronic Disease Prevention and Health Promotion, Office on Smoking and Health. DHHS Publication No. (CDC) 92-8419, 1992.
US Department of Health and Human Services. Preventing Tobacco Use Among Young People. A Report of the Surgeon General. Atlanta: US Department of Health and Human Services, Public Health Service, Centers for Disease Control and Prevention, National Center for Chronic Disease Prevention and Health Promotion, Office on Smoking and Health, 1994.
US Department of Health, Education, and Welfare. Smoking and Health. A Report of the Surgeon General. Washington (DC): US Department of Health, Education, and Welfare, Public Health Service, Office of the Assistant Secretary for Health, Office on Smoking and Health. DHEW Publication No. (PHS) 79-50066, 1979.
Vega WA, Gil AG, Zimmerman RS. Patterns of drug use among Cuban-American, African-American, and white non-Hispanic boys. American Journal of Public Health 1993;83(2):257–9.
Ventura SJ, Martin JA, Taffel SM, Mathews TJ, Clarke SC. Advance Report of Final Natality Statistics, 1992. Monthly Vital Statistics Report 1994;43(5 Suppl).
Ventura SJ, Martin JA, Taffel SM, Mathews TJ, Clarke SC. Advance Report of Final Natality Statistics, 1993. Monthly Vital Statistics Report 1995;44(3 Suppl).
Patterns of Tobacco Use 133

Surgeon General's Report
Ventura SJ, Martin JA, Mathews TJ, Clarke SC. Advance Report of Final Natality Statistics, 1994. Monthly Vital Statistics Report 1996;44(11 Suppl).
Ventura SJ, Martin JA, Curtin SC, Mathews TJ. Report of Final Natality Statistics, 1995. Monthly Vital Statistics Report 1997;45(11 Suppl).
Wagenknecht LE, Burke GL, Perkins LL, Haley NJ, Friedman GD. Misclassification of smoking status in the CARDIA study: a comparison of self-report with serum cotinine levels. American Journal of Public Health 1992;82(1):33–6.
Wagenknecht LE, Manolio TA, Sidney S, Burke GL, Haley NJ. Environmental tobacco smoke exposure as determined by cotinine in black and white young adults: the CARDIA study. Environmental Research 1993;63(1):39–46.
Wallace JM Jr, Bachman JG. Explaining racial/ethnic differences in adolescent drug use: the impact of background and lifestyle. Social Problems 1991;38(3):333–57.
Wang S-Q, Yu J-J, Zhu B-P, Liu M, He G-Q. Cigarette smoking and its risk factors among senior high school students in Beijing, China, 1988. Tobacco Control 1994;(3):107–14.
Warm Springs Confederated Tribes. Warm Springs Confederated Tribes Behavioral Risk Factor Survey, 1990. Warm Springs (OR): Warm Springs Confederated Tribes, Community Health Promotion Department, Human Services Branch, 1993.
Welty TK, Lee ET, Yeh J, Cowan LD, Go O, Fabsitz RR, et al. Cardiovascular disease risk factors among American Indians: the Strong Heart Study. American Journal of Epidemiology 1995;142(3):269–87.
Weng X-Z, Hong Z-G, Chen D-Y. Smoking prevalence in Chinese aged 15 and above. Chinese Medical Journal 1987;100(11):886–92.
Wewers ME, Dhatt RK, Moeschberger ML, Guthrie RM, Kuun P, Chen MS. Misclassification of smoking status among Southeast Asian adult immigrants. American Journal of Respiratory and Critical Care Medicine 1995;152(6 Pt1):1917–21.
Wiecha JM. Differences in patterns of tobacco use in Vietnamese, African-American, Hispanic, and Caucasian adolescents in Worcester, Massachusetts. American Journal of Preventive Medicine 1996;12(1):29–37.
Wills TA, Cleary SD. The validity of self-reports of smoking: analyses by race/ethnicity in a school sample of urban adolescents. American Journal of Public Health 1997;87(1):56–61.
Zhu B-P, Liu M, Wang S-Q, He G-Q, Chen D-H, Shi JH, et al. Cigarette smoking among junior high school students in Beijing, China, 1988. International Journal of Epidemiology 1992;21(5):854–61.
134 Chapter 2


