1
Centre for Finance Working Paper Series
Working paper 2009 007
The Impact of International Terrorist Attacks on the Risk and Return of
Malaysian Equity Portfolios
Vikash Ramiah
Abstract
The consequences of five recent terrorist attacks on equities listed on the Malaysian
Stock Exchange are investigated in this paper. In particular, this paper studies how
the risks and returns of industrial and market portfolios are altered in both the short
term and long term as a result of terrorist events. Both parametric and non-parametric
tests are used to explore the relationship between equity stock returns and terrorist
attacks and the CAPM is employed to assess whether systematic risks change after
these events. The findings are consistent with the bulk of literature whereby
September 11 had negative impact on the equity returns coupled with a general
increase in the systematic risks. This paper documents negative industry abnormal
returns as high as 10.94% on the first day of trading in the Healthcare sector.
However, the other conclusions challenge the existing literature as they show that the
Malaysian equity markets were insensitive to the subsequent terrorist attacks namely
Bali, Madrid, London and Mumbai bombings.

2
I. Introduction
According to a recent study by Lee, Enders and Sandler (2009), terrorism assumes a
transnational character when a terrorist incident in one country involves victims,
targets, institutions or citizens of another country. These regrettable events not only
results in the loss of lives, property damages and psychological scars in the domestic
country but have some consequences on foreign countries. Nikkinen, Omran,
Sahltrom and Aijo (2008) argue that the extent to which international markets are
influenced by terrorism activities depends on the how well these international markets
are integrated with the country directly under terrorist attack. The literature in the area
of how international markets are affected by terrorist activities is quite sparse and as
such, the primary task of this study is to test if terrorist activities in one country affect a
foreign country.
In the economic1 literature, it has been documented that terrorism tends to have a
negative response on, but not limited to, the following factors overall economic
activities, per capita GDP, consumption, investment, net exports and growth.
However, in the finance2 area, research is limited to risks and returns analysis and it
is generally accepted that terrorist activities are negatively related to the returns of the
stock markets as a result of the negative sentiment that prevails around the time of
these events. This first outcome assume that equity holders respond negatively to
such events as they perceive an increase in the expected costs of terrorist activities or
1 See Araz-Takay, Arin and Omay (2009), Blomberg et al. (2004), Eckstein and Tsiddon (2004), Abedie
and Gardeazabal (2003) and others. 2 See Ito and Lee (2005), Richman, Santos, and Barkoulas (2005), Worthington and Valadkhani (2005),
Carter and Simkims (2004), Chen and Siems (2004), and Drakos (2004).

3
a decrease in their revenue.Cam (2006) challenges the concept of negative reaction
of terrorism and shows that certain sectors may well positively react to the terrorism
activities namely the Water, Defence and Telecommunications industries. These
recent findings are consistent with conditions that prevailed during the periods of war,
where the price of basic necessities like foods, alcohol and tobacco generally
increases. These empirical results gave credibility to a second outcome that assumes
an improvement in the revenue of the business. A third outcome that we cannot
ignore is the possibility that terrorism activities do not have any effect on capital
markets and there is currently little research to supports this. Under this market
condition, it is assumed that market players do not react as they do not perceive that
the attack has an impact on expected returns. To test which of the three competing
theories hold, this study looks at the consequences of five recent terrorist attacks on
the returns of equity markets. The next logical step will be analyze how the terrorist
activities affect the risk of capital markets. The extant literature may lead one to
believe that terrorist attacks result in either an increase in terrorist risk or no change in
the systematic risk [see Nikkinen et al. (2008), Ito and Lee (2005), Richman et al.
(2005) Chen and Siems (2004) and Drakos (2004)]. Which of the following outcomes
prevails most is not clearly known and given the recent terrorist attacks has not been
adequately research; this paper investigates the relationship between systematic risk
and terrorist attacks.
The Malaysian Stock Exchange provides an ideal testing ground for the above
arguments. Enders and Sandler (2006) argue that Muslim extremists have shifted
their attack venues to regions like Asia where they can easily blend into the population
and establish a support system. Malaysia has a multicultural population with a strong
presence of a Muslim community and has not been directly under terrorist attacks.

4
The Malaysian market has been overlooked in the terrorism literature as only Chen
and Siems (2004), Richman, Santos, and Barkoulas (2005) studied the how this
market in general reacted to September 11. Both studies showed that the Malaysian
market reacted negatively to the September 11 terrorist attacks. Chen and Siems
(2004) also looked at the Banking sector in this market and documented a fall in the
return of this industry. Using a long term regression analysis, Richman, Santos, and
Barkoulas (2005) assessed the long term effect on the systematic risk in that market
and reported an increase in the level of systematic risk. Our results support these two
studies in that we do observe a negative impact on the Malaysian market and an
increase in the systematic risk following 9/11.
The contributions of this research are as follows. Firstly, a detailed industry analysis is
carried out and this determines precisely which sectors in Malaysia were affected.
Next the effects of the subsequent terrorist attacks are investigated on a both risk and
return basis for all the industries and market portfolios. To the best of my knowledge
there is no current study that looks at the consequences of the recent terrorist attacks
on Malaysian industries. Hence the first objective of this paper is to bridge the gap
between the current terrorism literature and Malaysian equity industries. This study
will be of interest to market participants who trade in Asia, more specifically Malaysia
as it documents how the market react to terrorism activities. In the event of another
attack, at a time where there is a war on terror, investors can use the results of this
report as a guidance to make their investment decisions. This analysis will be
beneficial to portfolio managers that use the top-down investment process as it
provides industry effects of terrorism activities. Thirdly the methodologies used in this
paper are augmented compared to the earlier research. For instance, firm specific
information is excluded in both the industry and market portfolios. Most of the existing

5
literatures fail to exclude firm specific information and thus report results which
contain both the impact of terrorist attacks and other non terrorist components. This
may lead to some biases in the results of the earlier studies.
The current terrorism literature points towards an increase in systematic risk following
a terrorist attack. Using the Bali, Madrid, London and Mumbai evidence, this paper
shows that such conclusion does not hold in Malaysia. Furthermore, unlike the
majority of the literature, this research analyses the effects of terrorism at micro level.
This study looks at how the major international terrorist attacks had an impact on one
single country industrial portfolios whilst other studies show how one terrorist attack
affects the rest of the world. The outcomes of this research are consistent with the
prior literature, in that September 11 did, indeed, resulted in a decrease in returns and
an increase in the systematic risks in the Malaysian market and Malaysian industrial
portfolios. However, the Malaysian market and most of the Malaysian industries are
insensitive to the remaining terrorist attacks. In Section II, I present the data and
methods used in this paper. Section III presents the empirical findings and Section IV
provides some concluding remarks.
II. Data and Methods
Data
Daily stock returns indexes, market return calculated from the Kuala Lumpur
Composite Index (KLCI3), and risk free rate is proxied by the three-month Treasury
Bills, for the period August 1999 to February 2008. All the data were downloaded from
Datastream. Using the Global Industry Classification Standards (GICS), we organised
918 firms in the sample into industry portfolios based. Using the entire sample of 918
3 also formerly known as the KLSE Composite Index

6
companies, a market portfolio was also created. The number of firms in each of these
industry sectors and market portfolio is shown in Table 1. Table 1 reports the
descriptive statistics for each of the different industries and the market portfolio. The
average daily return for the Automobile, Capital Goods, Consumer Durables and
Apparels and Pharmaceutical sectors are statistically negative. The banking sector
shows a positive return while the remaining portfolios exhibit no statistical change in
the average daily return for the period. Further, we fail to reject the null hypothesis
that the returns for four sectors are normally distributed and these sectors are Banks,
Media, Pharmaceuticals and Travel. Table 1 also includes the standard deviation,
skewness, excess kurtosis, range of returns, and the count in each industry portfolio.
A brief description of the five terrorist attacks that occurred in the United States, Bali,
Madrid, London and Mumbai, are summarised in Table 2.
Methodology
Event study methodology is used in this empirical analysis to determine the whether
the returns of the industries and market portfolios have changed following the terrorist
attacks. First the daily return on the Malaysian stocks and the KLCI are calculated as:
=
−1
lnit
it
itSRI
SRIDR (1)
where DRit is the daily return for the Malaysian stock i, SRIit is the stock return index
for the Malaysian stock i at time t, and SRIit-1 is the previous day stock return index for
that same stock i. Following Brown and Warner (1985), the ex-post abnormal returns
(ARit) for each Malaysian firm is calculated as the difference between observed
returns of firm i at event day t, and the expected return, E(Rit).
( )ititit RERAR −= (2)

7
The daily expected return, E(Rit), is estimated using an excess return CAPM over the
last 260 observed daily returns:
( ) ( )ftmtit rrRE ~~10 −+= ββ (3)
where mtr~ is the return on the KLCI and ftr~ is the return on the three-month
Treasury Bills. The abnormal return for industry I, ARIt at time t is then obtained by
averaging the abnormal return of each firm within the industry.
∑=
=N
i
itIt ARN
AR1
1 (4)
On the day of the terrorist attack, the industry abnormal return calculated by equation
4 will primarily respond to two components namely firm specific information and the
actual terrorist event. In an effort to capture only the impact of the terrorist attack and
to be free from other firm specific information, all firms with firm specific information 15
days on either side of the event day are excluded from the industry portfolio. Firm
specific information is defined as any announcement made on the Malaysian Stock
Exchange.
Parametric Tests
The parametric tests used in this study rely on the important assumption that the
industry abnormal returns and cumulative abnormal returns are normally distributed.
The standard t-statistic for the abnormal return is:
( )It
It
ARARSD
ARt
It= (5)
where ARIt is defined as above in equation 4 and SD(ARIt) is an estimate of the
standard deviation of the abnormal returns. By cumulating the periodic abnormal
return for the Malaysian industry over five days, the five day cumulative abnormal
return, CARIt is generated.
8
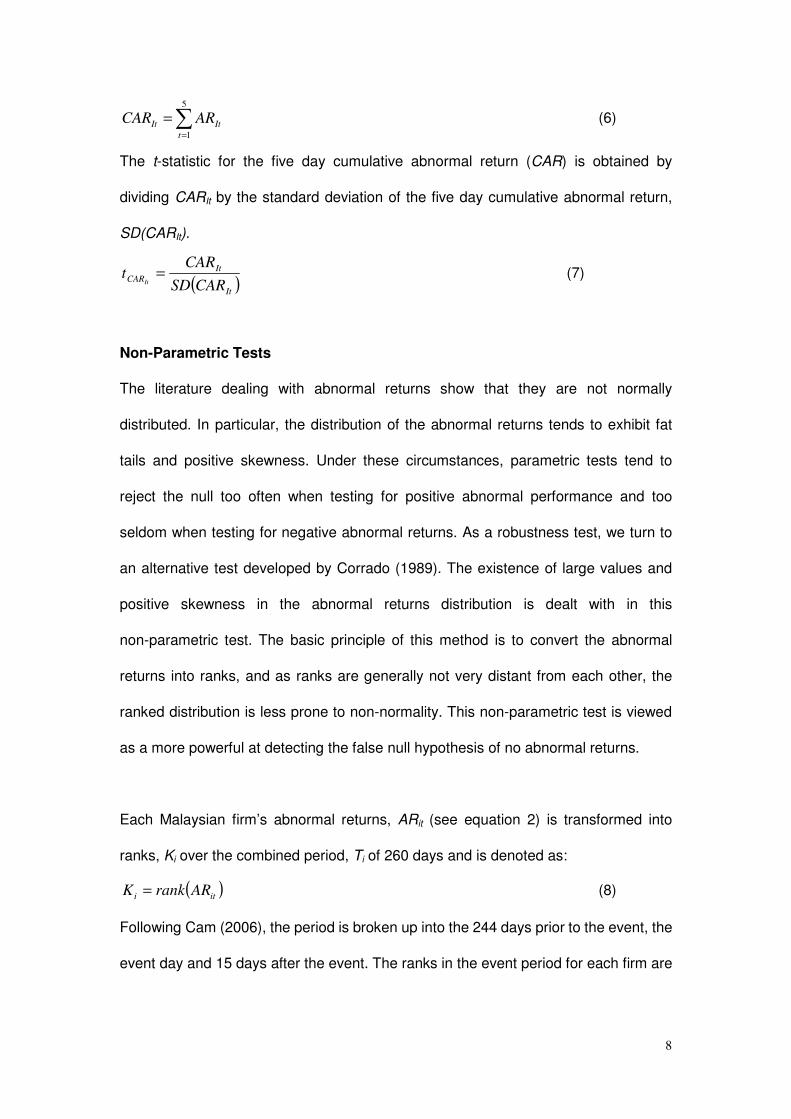
∑=
=5
1t
ItIt ARCAR (6)
The t-statistic for the five day cumulative abnormal return (CAR) is obtained by
dividing CARIt by the standard deviation of the five day cumulative abnormal return,
SD(CARIt).
( )It
It
CARCARSD
CARt
It= (7)
Non-Parametric Tests
The literature dealing with abnormal returns show that they are not normally
distributed. In particular, the distribution of the abnormal returns tends to exhibit fat
tails and positive skewness. Under these circumstances, parametric tests tend to
reject the null too often when testing for positive abnormal performance and too
seldom when testing for negative abnormal returns. As a robustness test, we turn to
an alternative test developed by Corrado (1989). The existence of large values and
positive skewness in the abnormal returns distribution is dealt with in this
non-parametric test. The basic principle of this method is to convert the abnormal
returns into ranks, and as ranks are generally not very distant from each other, the
ranked distribution is less prone to non-normality. This non-parametric test is viewed
as a more powerful at detecting the false null hypothesis of no abnormal returns.
Each Malaysian firm’s abnormal returns, ARit (see equation 2) is transformed into
ranks, Ki over the combined period, Ti of 260 days and is denoted as:
( )iti ARrankK = (8)
Following Cam (2006), the period is broken up into the 244 days prior to the event, the
event day and 15 days after the event. The ranks in the event period for each firm are

9
then compared with the expected average rank
_
iK under the null hypothesis of no
abnormal returns. The expected average rank
_
iK is given by
25.0 i
i
TK +=
−
(9)
As such, the non-parametric t-statistic, tnp, for the null hypothesis of no abnormal
returns for each industry is therefore given by:
−
=∑
=
−
_
1
1
KSD
KKN
t
N
i
ii
np (10)
where
−
KSD is the standard deviation of the average rank and is denoted by:
∑ ∑=
−−
−=
T
t
iit KKNT
KSD1
2
2
11 (11)
Regression Analysis
It is assumed that the efficient market hypothesis holds as Malaysian investors assess
all the economic, political and terrorist risks before making their financial decisions.
When a terrorist attack occurs, it may affect the systematic risk by the amount of the
terrorist risk. So next I test if the terrorist events had an impact on the systematic risk
of the industrial and market portfolios. To that end, a standard CAPM is estimated and
the Chow breakpoint test is applied to see if the model has changed after the terrorist
attacks. This simple procedure will only inform us whether there are some changes in
the model but cannot specify whether the effect is short or long term. As a result the
CAPM was modified to capture the changes (if any) in systematic risk in these two
different states.
Equation 12 below is used to test if terrorist attacks have had an impact on the

10
systematic risk of Malaysian industries on the days of the attack. A multiplicative
dummy variable was introduced in the standard CAPM to test this possibility.
itftmtIftmtIIftIt Drrrrrr εββφ ~*]~~[]~~[~~ 21 +−+−+=− (12)
where Itr~ is the industry i’s portfolio return at time t, ftr~ is the 3-month Treasury
Bills at time t, and mtr~ is the return on the KLCI at time t. D on the other hand, is a
dummy variable that takes the value of 1 on the day of the event, and 0 otherwise.
This variable is meant to capture the effect of terrorist attacks on the systematic risk.
itε~ , 1
Iβ , and 2
Iβ are the error term, the CAPM beta and the coefficient of the dummy
variable respectively. iφ is the intercept of the regression equation (E( iφ ) = 0)
The inclusion of an additive dummy variable in the above equation 12 results in a near
singular, variance-covariance matrix. As a result I estimate a separate equation to test
if the intercept was affected by the attacks;
itIftmtIIftIt Drrrr εααϕ ~]~~[~~ 21 ++−+=− (13)
Equation 12 and equation 13 capture the short term effects of international terrorist
attacks on the systematic risks of the Malaysian equity markets. The long term effects
of these attacks on the systematic risk of Malaysian firms are calculated using
equation 14 below.
itIftmtIftmtIIit SDSDrrrrr εδδδϕ ~*]~~[]~~[~ 321 ++−+−+= (14)
The test determines whether the level of risk, particularly captured by structural
changes, is altered after the event day. SD is a structural dummy variable that takes
the value of 0 prior to the event, and 1 after the day of the event. This variable
captures the structural changes and influence of terrorist attacks on the systematic
risk over a long term horizon.

11
Returns for each industry are gathered 244 days prior to the event, and 15 days after
the event. Standard tests and residual diagnostics revealed no major concerns with
the above two econometric models. I also test if these dummy variables were
redundant in the above equations using a Wald test for restrictions.
III. Empirical Findings
This section outlines the empirical findings of five different international terrorist
attacks that happened in the US, Spain, Indonesia, UK, and India on the Malaysian
Stock Exchange. Using parametric tests, non-parametric test and regression analysis
I test whether the risk and return of 19 Malaysian industries and the Malaysian market
were affected by these five events. The attacks in the US had a strong negative
impact on returns for all the portfolios investigated and a general increase in
systematic risk of most of the portfolios in both the short term and long term.
Interestingly, we do not find similar evidence for the subsequent attacks. Surprisingly,
the attack on a neighbouring country, Indonesia, had a positive impact in one of the
Malaysian sector.
United States- September 11
The US market opened 6 days after the September 11 whilst the Malaysian market
had to cease trading on the 12th of September 2001. It is thus important to note that I
am assessing the performance of the Malaysian portfolios on the 13th of September
2001 and this is consistent to the approach used by Richman et al. (2005). This
implies that the market participants had at least one day to think about their strategy in
the Malaysian equity markets. Further it is important to remember that firms with firm

12
specific information surrounding the event were excluded in this analysis and this may
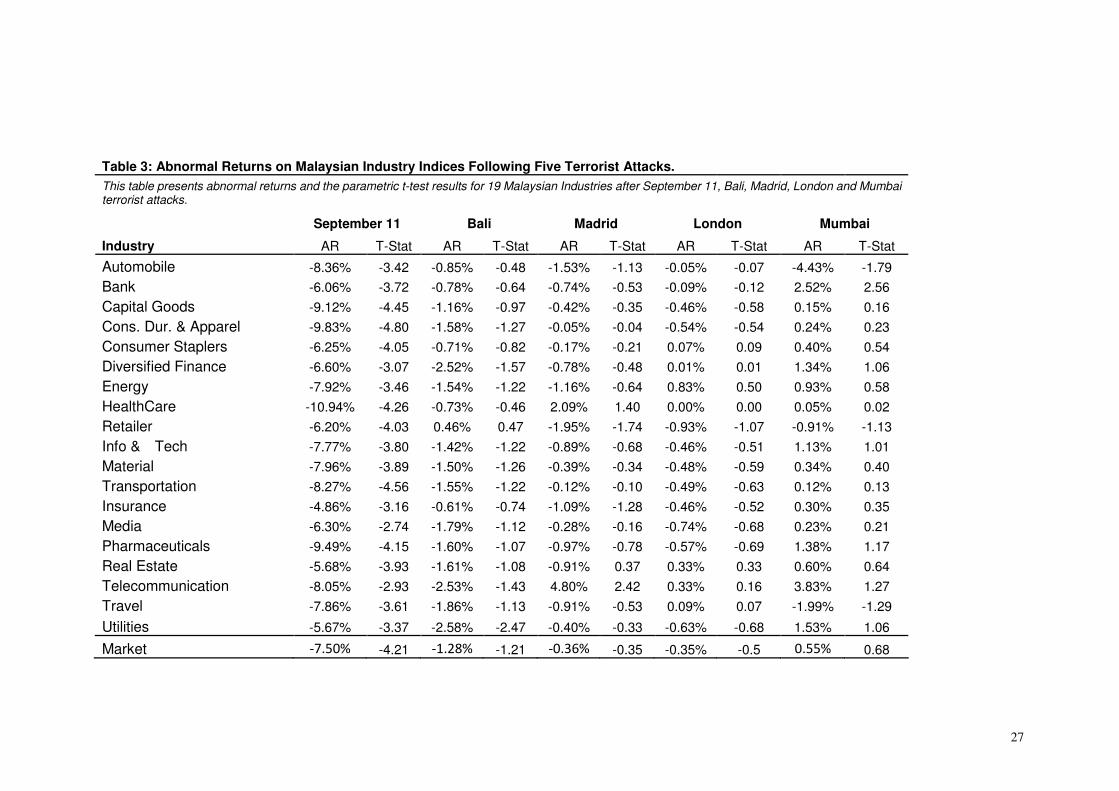
account for the results presented in this study. Table 3 and Table 4 summarise the
parametric empirical results for September 11 for the different sectors. The abnormal
return on the day, and the five day cumulative abnormal return as well as their
respective t-statistics for the 19 different industries and the Malaysian market portfolio
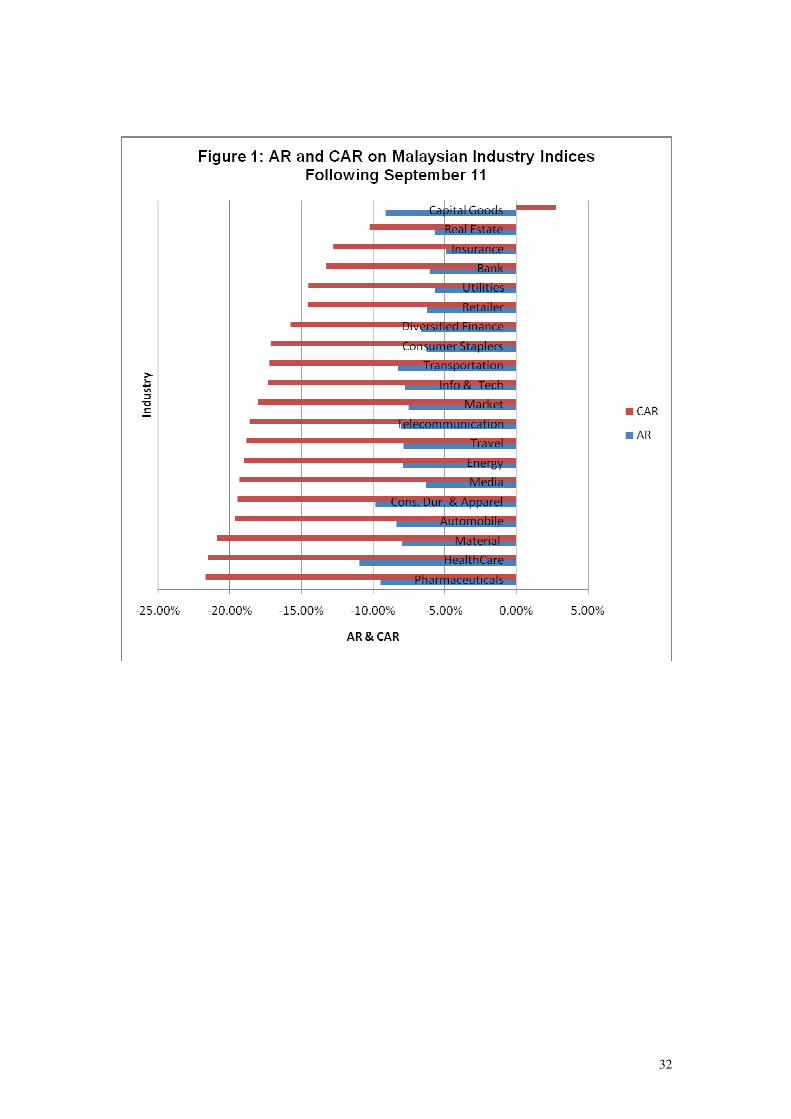
are reported. The results reported in Table 3 and Table 4 show a clear and consistent
negative effect on equities listed in the Malaysian Stock Exchange following the
September 11 attack. Figure 1 depicts both the abnormal and cumulative abnormal
return of the equity portfolios and illustrates both a negative abnormal return and a
negative five day cumulative abnormal return (except for Capital Goods).
Columns 2 and 3 of Table 3 report the abnormal returns and the parametric t-statistics
for the various sectors and market portfolio. Table 3 shows that the returns in the
Capital Goods sector fell by 9.12% after the September 11 attack, and the t-statistic
shows that this value is statistically different from zero. Interestingly, all the other
equity portfolios exhibited a negative and significant abnormal return. In other words
the nineteen industrial portfolios and the market portfolio were severely affected by
the event. The sector that was affected the most was the Healthcare sector, which fell
by 10.94%. This is not a large proportion given that Cam (2006), reports a 35% fall
in the returns of Airline and Airport industry and after the September 11 attacks in the
US. Carter and Simkins (2004) and Drakos (2004) demonstrate a 10% to 16% decline
in the Japanese Airline businesses immediately after the attack. Although the GICS
industry classification differs from the one country to another, the Travel sector was
only down by 7.86% on the first day of trading in Malaysia. To the best of my
knowledge there is only one paper that looks at the industry analysis of September 11
on Malaysian market and it is also limited to the Banking sector and the market
13
portfolio. Chen and Siems (2004) documents that the Banking sector was down by
5.2%, immediately after the attack and the result presented in this paper shows that
the Bank sector declined by 6.06%. Chen and Siems (2004) and Richman et al.
(2005) shows that the overall Malaysian market was down by 4.46% and 3.9% whilst
this study argues a more significant drop of 7.50%. These discrepancies may lie in
the portfolio construction methodology whereby firm specific information was
excluded in this experiment. The abnormal return findings presented in Table 2 for the
September 11 attacks are consistent with most the existing literature in that there is a
negative sentiment surrounding this event. However there are some inconsistent
results with Cam (2006), as none of the portfolios exhibited a positive reaction or did
not react to the incident.
The event day ARs show the immediate investor reaction to terrorist attacks whilst the
five day cumulative abnormal returns provide a stronger indication of the capital
market’s stickiness or capability to rebound from the terrorist attacks. The CAR
approach reinforces the above findings in terms of this methodology supports the
hypothesis of negative sentiment after the September 11 attack. Of the 20 equity
portfolios that were studied, 19 portfolios exhibit a negative cumulative abnormal
return over the following five days. The second column of Table 4 shows that the
Capital Goods sector rebounded and that the remaining sectors deteriorated with
Pharmaceutical sector being the worst performing sector with -21.65% as CAR over
the next five days. This is also depicted in Figure 1 and it is also noticeable from that
same figure that the CAR is generally higher than the event day AR for all the
industries that were negatively affected. This implies that the market continued to
plummet over the following five days and amazingly the returns fell by more than twice
of the amount of the AR. These findings are consistent with Chen and Siems (2004)

14
who showed that cumulative abnormal return is around -13.36% and 15.41% six days
after the event for the Banking sector and market portfolio respectively. Such result is,
however, inconsistent with Cam (2006) who found that the CAR over the following six
days is lower than the abnormal return for US firms.
To address the issue of non-normality in the distribution of AR, a robustness test in
terms of a non-parametric ranking test was used. Generally speaking the results of
the non-parametric tests supports the results observed in the parametric analysis.
Considering the non-parametric4results in Table 5, it appears that this test support the
view of a negative sentiment surrounding the September 11 attacks in the Malaysian
equity markets as all the non-parametric t-tests were negative. However, just over
50% of the portfolios are statistically significant. The negative impact of the 9/11 event
on Malaysian market portfolio and ten other industry portfolios were not questionable
by the non-parametric tests. For instance, column 2 of Table 5 shows that the
non-parametric t-statistic is -2.28 for the Bank industry. This reflects the negative
abnormal returns identified earlier in the parametric tests.
Following the above discussion, it is reasonable to conclude that the returns of the
Malaysian industries and the market portfolio were strongly negatively affected
following the September 11 attack. Based on the risk and return theories, it is fair to
assume that such drop in return will be matched by an increase in the systematic risk
of these equity portfolios. Hence the next objective will be to ascertain if the empirical
results sustain this theoretical concept. A standard CAPM was estimated and the
Chow breakpoint test was conducted for that purpose. The results show, that in
4 Generally speaking, when the reported non-parametric t-statistics is less (greater) than negative two
(positive two), we conclude that the abnormal returns were negative (positive) on the day of the event.
15
almost all cases, there appears to be a change in the CAPM following the September
11. However, the Chow test5 does not explicitly tell us how the model has changed. In
particular, it fails to indicate whether first the intercept or the slope of the model has
changed or second whether the changes were short term or long term or both short
term and long term.
The multiplicative regression analysis (see equation 12) attempts to clarify these
questions for the short term and a positive (negative) coefficient of the multiplicative
dummy variable ( 2
Iβ ) reflects an increase (decrease) in systematic risk. Columns 2 to
4 of Table 6 report the results of the short term multiplicative dummy variable model
and this model only explains if there is a change in the slope-systematic risk-beta of
the CAPM. The sign of the coefficient ( 2
Iβ ) appears to be positive in all of the
nineteen industries and market portfolio explored. In addition, it requires the
coefficient of the multiplicative dummy variable to be statistically different from zero, to
imply a significant statistical change in the systematic risk of the industry. The
t-statistics results from column 4 of Table 6 show that systematic risk statistically
increased in fifteen sectors out of the nineteen sectors. For example the beta of the
Bank sector was 0.87 (see column 3 of Table 6) prior to the attack and increased by
0.71 (see column 4 of Table 6) after the attack. The 0.71 increase can be regarded as
the short term systematic risk originating from terrorist activities and thus the terrorist
risk. The systematic risk increased from 0.87 to 1.58 and from 0.97 to 1.71 after the
attack for the bank sector and the market portfolio respectively. The Wald test
5 Note that we do not report the results of the Chow Test and the Wald Test in this paper.

16
confirms that terrorist risk is not a redundant factor in this model. On the other hand,
there is no statistical evidence of an increase in systematic risk in the other remaining
industries namely Energy, Insurance, Media and Telecommunication. Another finding
of this study is that terrorist attacks do not always lead to an increase in systematic
risk and that terrorist risk varies significantly across industries. These results are
consistent with Nikkinen et al. (2008), Ito and Lee (2005), Richman et al. (2005) Chen
and Siems (2004) and Drakos (2004) who also observed either a general increase or
no change in the systematic risk levels following 9/11 events. These findings also
support the transnational theory of Lee, Enders and Sandler (2009) in that they show
that September 11 altered a foreign country’s risks and returns profile.
Now that we know about the changes in the slope of the CAPM in the short term, this
study will look at whether September 11 changed the intercept of the CAPM. The
additive dummy variable equation 13 shows the impact of September 11 on the
intercept of the CAPM. It can be observed from Table 6 that in all portfolios the values
of the additive dummy variable are negative. Furthermore these values are negative
and significant in 16 industries. It must be noted that the intercept of an excess return
CAPM is expected to take a value of zero and thus the evidence provided on the
additive dummy variable (equation 13) does not have any practical interpretation.
These results are provided for purely completeness purposes.
Equations 12 and 13 only show the short term impact of the September 11 attacks on
the Malaysian equity markets and to capture the long term effect, equation 14 is
estimated. The structural multiplicative dummy variable in equation 14 represents the
change in the long term systematic risk while the additive structural dummy variable in
that same equation characterizes the long term change in the intercept level. This

17
model tests if the increase in systematic risk observed in the short term as a result of
terrorist risks persists in the long term. The results, presented in Table 6 column 10,
show that around ninety percent of the industries exhibit an increase in systematic risk
in the long run. For example, the systematic of the Banking industry increased by 0.55
after the September attacks. Once again these results are consistent with the majority
of the literature in the field on this point.
As a general conclusion, it is possible to claim that the aftermath of 9/11 is far more
beyond what is reported in Table 2 and the existing literature. The evidence provided
in this section shows the financial consequences of this event at a micro level in a
country other than the US. Almost every industry in Malaysia was affected by terrorist
events that happened outside their own territories. The next question will be whether
other terrorist attacks had similar consequences in these Malaysian industries.
Bali
Bali bombing is geographically the closest to the Malaysian soil and this event
occurred on Saturday 12th October 2002. The first day that the Malaysian market
traded after the attack, was on the Monday 14th October 2002. Theoretically and
based on the above empirical evidence, one will expect a decrease in the return of
Malaysian equity markets coupled with a decrease in the systematic risk following this
attack. Intuitively, this geographical closeness will lead one to believe that the effects
will be more pronounced. Contrary to the prior beliefs, the empirical evidence
documented in this paper shows otherwise. The results of the parametric test on
sector returns for this day are shown in Table 3 (Columns 4 and 5). At face value, all
the portfolios show a negative response to the attack. However, only the Utilities
sector was statistically significantly affected. The robustness test also support the

18
claim of a negative effect in the Utilities sector on the first day of trading. The third
column of Table 5 shows the results on the non-parametric test on the various
Malaysian industries. Similar to the event day AR results, the non-parametric t-
statistic is negative for all the industries but significant for only the Utilities industry.
Over the following 5 day trading period, most portfolios changed from negative
abnormal returns to positive abnormal returns. However, only the Media industry
recorded a statistically significant cumulative abnormal cumulative return (see Table
4) for Bali bombing. Against all the priori beliefs about the impact of terrorist attacks
that occurred in Indonesia on the Malaysian returns, the general conclusion that can
be drawn is that immediately after the event, only one sector, Media industry, was
positively affected while all other sectors were insensitive to the event. Similar to the
return analysis, the short run regression analysis6 shows no significant results except
for the Utilities sector in the short term. The Utilities industry reported a statistical drop
in the AR and a general increase in the beta in the short run. In the long run, none of
the portfolios recorded a change in the level of the systematic risk. Based on these
empirical results, another conclusion can be drawn. Bali bombings did not have a
negative effect on the Malaysian equity markets and on the contrary had a positive
influence in one sector. These results are against prior expectations but are
consistent with most of the existing terrorist literature that shows that some markets
are insensitive to certain terrorist attacks. It is not possible to have a direction
comparison with earlier studies as this is the first paper that look at how Bali bombings
affect Malaysian industries. In a modest way, this can be regarded as the unique
contribution of this paper. It is worth noting that there are few papers that looked at the
Bali bombings in other markets [see Worthington and Valadkhani (2005) and Ito and
6 Note that we do not any regression analysis as it is mostly comprised of insignificant results.

19
Lee (2005)] and they observed that the Bali events affected the Australian Consumer
Discretionary sector and Airline Industry negatively in other nations.
So far, the empirical evidence is mixed in terms of the effects of terrorist on risk and
return. On the one hand, the September 11 attacks had a major negative influenced
on the Malaysian industries whilst the Malaysian sectors were insensitive to the
Indonesian terrorist attacks. It is thus important to study other terrorist attacks before
a consensus can be drawn on the effects of terrorist attacks on the risk and return of
Malaysian equity markets. To that end, the Madrid terrorist attack is being
investigated.
Madrid
So far, geographical differences have not shown any clear indication as to how
terrorist activities will affect the Malaysian economy. On the one hand, the empirical
evidence shows that a distant nation like the US had an impact on this country’s stock
market whilst a geographically closer attack in Indonesia had no major influence.
Therefore it is worth studying how terrorist events that occurred in Europe influence
an Asian country. To the best of my knowledge, there is no current study that looks at
the consequences of Madrid terrorist attacks on the Malaysian financial markets. This
result can be regarded as another contribution to the literature as at present there is
no study that looks at the impact of Madrid bombings on the Malaysian market. The
bombings in Madrid occurred on Thursday 11th March 2004 and with the time zone
difference, the Malaysian market opened on the following day. The techniques
described in the methodology section were applied to test if the risks and returns of
Malaysian industries and market were responsive to the terrorist attacks that occurred
in Spain. The results of the parametric test immediately after the attacks and five day
20
after the attacks are shown in columns 6 and 7 of Table 3 and Table 4 respectively.
Based on these two parametric tests, only the Telecommunication industry was
significantly positively affected five days after the attack. However this was not
followed by a change in the systematic risk of that sector and in addition none of the
sectors recorded a change in their systematic risks. As a general conclusion, it is
possible to state that terrorist events that incurred in Spain did not have a major
influence on the Malaysian market. These results reinforce the findings of the Bali
bombings whereby terrorist events do not affect the risk and return of Malaysian
equity markets.
London
Other than the September 11 attacks, the two subsequent attacks did not play a major
role in the risks and returns of Malaysian equities. This unfortunate incident will allow
us to further understand how the Malaysian equity markets respond to terrorist attacks.
On Thursday 7th July 2005, London was subject to terrorist attacks and given that
Malaysia was an ex-colony of the British Empire, one would think that this incident will
move the Malaysian market. Surprisingly enough, the market’s response to the attack
was muted. Both the parametric and the non-parametric tests show that none of the
portfolios studied were altered on the first day of trading and five days after the attack
the Consumer Durable and Apparels sector was positively influenced. Furthermore
the CAPM also reported no changes in the systematic risk. The lessons learnt from
this incident are similar to the lessons learnt from the Bali and Madrid bombings as
most of the industries were immunized from the London bombings.
Mumbai

21
It is now clearer that the Malaysian market is not sensitive to the terrorist attacks
(except for the September 11 attack). With this priori hypothesis in mind, I will
postulate that Mumbai’s attacks will not move the Malaysian market. The majority of
the portfolios support the priori hypothesis of no effect on the risks and returns of
Malaysian firms. The Indian, British, Spanish, and Indonesian evidence shows that it
is wrong to assume that terrorist attacks will impact negatively on stock markets and
fails to support the transnational characteristic of Lee, Enders and Sandler (2009). As
such investment havens do exist even under terrorist attacks.
IV. Conclusion
So far, the extent of the literature in this field postulates a negative relationship
between terrorism and the stock market. However the recent terrorist attacks diverts
from this view. Using the five recent terrorist attacks, this study shows that equity
markets, in particular, the Malaysian equity market was insensitive to most of the
events despite the negative sentiment that prevails after the incidents. The risks and
returns of the industrial portfolios and market portfolios did not change after Bali,
Madrid, London and Mumbai’s terrorist attacks. One must be careful in generalizing
and extending the hypothesis that the stock markets are not responsive to terrorist
activities in other stock markets. I believe that the same research needs to be
conducted in other countries to test which of these two competing theory holds. This
paper finds theoretical consistency with the earlier theory whereby the September 11
events had a negative impact on the Malaysian equity market. Surprisingly all of the
industries were down on the day of that event, and most of remained negatively
affected 5 days after the event. Approximately eighty percent of the industries studied
showed an increase in systematic risk following the 9/11 attacks in both the short term
and long term. Based on the above findings, one can conclude that except for terrorist

22
attacks that occur in the United States, investors can consider Malaysia as an
investment paradise after a terrorist attack.
Acknowledgements
The authors wish to acknowledge the invaluable research assistance of Li Lu, Liu Na,
Long Zhou, Wang Jia, Linda, and Wang Fan in gathering the data and completing
some of the empirical analysis. Any remaining errors, however, are my own.
23
References
Araz-Takay, B., Arin, K. P., & Omay T., 2009, ‘The endogenous and non-linear relationship
between terrorism and economic performance: Turkish’, Defence and Peace
Economics, vol. 20, no. 1, 1-10.
Abedie, A., & Gardeazabal, J., 2003, ‘The economic costs of conflict: a case study of the
Basque country’, American Economic Review, vol. 93, no.1, 113-132.
Blomberg, S.B., Hess, G.D., & Orphanides, A., 2004, ‘The macroeconomic consequences of
terrorism’, Journal of Monetary Economics, vol. 51, no. 5, 1007-1032.
Brown, S. J., & Warner, J.B., 1985, ‘Using daily stock returns: The case of event studies’,
Journal of Financial Economics, vol. 14, no. 1, 3-31.
Cam, M., 2006, ‘The impact of terrorism on United States Industry indexes’, School of
Economics, Finance and Marketing, Royal Melbourne Institute of Technology,
Melbourne.
Carter, D. A., & Simkins, B. J., 2004, ‘The market’s reaction to unexpected, catastrophic
events: the case of airline stock returns and the September 11th attacks’, The
Quarterly Review of Economics and Finance 44, 539–558.
Chen, A. H., & Siems T. F., 2004, ‘The effects of terrorism on global capital markets’,
European Journal of Political Economy, vol.20, 349-366.
Corrado, C.J., 1989, ‘A non parametric test for abnormal security price performance in event
studies’, Journal of Financial Economics, vol. 23, 385-395.
Drakos, K., 2004, ‘Terrorism-induced structural shifts in financial risk: airline stocks in the
aftermath of the September 11th terror attacks’, European Journal of Political
Economy, vol. 20, 435–446.
Eckstein, Z., & Tsiddon, D., 2004, ‘Macroeconomic consequences of terror’, Journal of
Monetary Economics, vol. 51, no. 5, 971-1002.

24
Enders, W., & Sandler, T., 2006, ‘The Political Economy of Terrorism’, Cambridge:
Cambridge University Press.
Ito, H., & Lee D., 2005, ‘Comparing the Impact of the September 11th Terrorist Attacks on
International Airline Demand’, International Journal of the Economics of Business, vol.
12, no. 2, 225-249.
Lee, B. S., Enders W., & Sandler T., 2009, ‘9/11:What did we know and when did we know
it?’, Defence and Peace Economics, vol. 20, no. 2, 79-93.
Nikkinen, J., Omran M. M., Sahltrom P., & Aijo J., 2008, ‘Stock returns and volatility following
the September 11 attacks: Evidence from 53 equity markets’, International Review of
Financial Analysis17, 27–46.
Richman, V., Santos M. R., & Barkoulas J. T., 2005, ‘Short- and Long-Term effects of the
9/11 Event: The International Evidence’, International Journal of Theoretical and
Applied Finance, vol. 8, no. 7, 947-958.
Worthington, A., & Valadkhani, A., 2005, ‘Catastrophic Shocks and Capital Markets: A
Comparative Analysis by Disaster and Sector’, Economics Working Paper, University
of Wollongong, Australia.

25
Table 1: Descriptive Statistics of Daily Returns for the Malaysian Industrial Sectors From August 1999 to February 2008.
Return Mean Stdev Skewness Excess Kurt Range Count T-Test Statistics JB-Statistics
Automobile -0.043% 0.0007 -1.34 2.11 0.003 31 -3.47 15.05
Bank 0.020% 0.0003 0.09 -1.08 0.001 13 2.03 0.65
Capital Goods -0.019% 0.0011 -0.49 13.25 0.012 186 -2.50 1367.91
Cons. Dur. & Apparel -0.025% 0.001 3.27 18.87 0.008 59 -1.95 980.35
Consumer Staplers 0.102% 0.0053 8.33 75.06 0.052 95 1.86 23399.33
Diversified Finance -0.008% 0.0011 -1.44 6.18 0.007 35 -0.44 67.84
Energy 0.603% 0.0131 3.25 11.19 0.05 14 1.72 97.69
HealthCare 0.186% 0.004 3.05 9.68 0.014 11 1.55 60.01
Retailer 0.005% 0.0009 1.72 5.98 0.005 25 0.30 49.53
Info & Tech -0.004% 0.0014 2.65 19.97 0.015 202 -0.43 3590.76
Material 0.007% 0.0012 3.35 19.53 0.01 99 0.58 1758.89
Transportation 0.036% 0.0009 1.39 2.78 0.004 29 2.14 18.67
Insurance 0.002% 0.0006 -1.27 3.01 0.002 12 0.10 7.76
Media 0.001% 0.0005 0.72 0.83 0.002 13 0.09 1.48
Pharmaceuticals -0.026% 0.0006 -0.01 -0.23 0.003 38 -2.76 0.09
Real Estate 0.001% 0.0011 -2.10 5.21 0.004 8 0.03 14.93
Telecommunication -0.090% 0.0016 -1.10 2.01 0.005 8 -1.64 2.96
Travel -0.002% 0.0005 -0.04 -0.45 0.002 26 -0.16 0.22
Utilities -0.003% 0.0006 -1.75 2.38 0.002 14 -0.20 10.47
Market 0.014% 0.0027 14.04 248.89 0.057 918 1.59 2399550.38

26
Table 2: The Five Major Terrorist Attacks and Their Consequences. Terrorist Attack Date Location Fatalities Events
September 11 - United States 11/09/2001 World Trade Centre, New York
3,025 Three hijacked planes crashed into U.S. on Tuesday, destroying both of New York's mighty twin towers and plunging the Pentagon in Washington into flames
Bali Bombing - Indonesia 12/10/2002 Kuta, Bali 202 The 2002 Bali bombings occurred on 12 October 2002 in the tourist district of Kuta on the Indonesian island of Bali. The attack was the deadliest act of terrorism in the history of Indonesia, killing 202 people, 164 of whom were foreign nationals, and 38 Indonesian citizens. A further 209 people were injured.
Madrid - Spain 11/03/2004 Commuter train system, Madrid
191 The 2004 Madrid train bombings consisted of a series of coordinated bombings against the Cercanías (commuter train) system of Madrid, Spain on the morning of 11 March 2004 (three days before Spain's general elections), killing 191 people and wounding 2,050
London - United Kingdom 7/07/2005 Public transport system, London
55 The 7 July 2005 London bombings were a series of coordinated terrorist bomb blasts that hit London's public transport system during the morning rush hour. At 8:50 a.m., three bombs exploded within fifty seconds of each other on three London Underground trains.
Mumbai - India 11/07/2006 Suburban railway, Mumbai.
209 The 11 July 2006 Mumbai train bombings were a series of seven bomb blasts that took place over a period of 11 minutes on the Suburban Railway in Mumbai, capital city of the Indian state of Maharashtra and India's financial capital. 209 people lost their lives and over 700 were injured in the attacks.
Source from Wikimedia, Foundation(2006)
27
Table 3: Abnormal Returns on Malaysian Industry Indices Following Five Terrorist Attacks.
This table presents abnormal returns and the parametric t-test results for 19 Malaysian Industries after September 11, Bali, Madrid, London and Mumbai terrorist attacks.
September 11 Bali Madrid London Mumbai
Industry AR T-Stat AR T-Stat AR T-Stat AR T-Stat AR T-Stat
Automobile -8.36% -3.42 -0.85% -0.48 -1.53% -1.13 -0.05% -0.07 -4.43% -1.79
Bank -6.06% -3.72 -0.78% -0.64 -0.74% -0.53 -0.09% -0.12 2.52% 2.56
Capital Goods -9.12% -4.45 -1.16% -0.97 -0.42% -0.35 -0.46% -0.58 0.15% 0.16
Cons. Dur. & Apparel -9.83% -4.80 -1.58% -1.27 -0.05% -0.04 -0.54% -0.54 0.24% 0.23
Consumer Staplers -6.25% -4.05 -0.71% -0.82 -0.17% -0.21 0.07% 0.09 0.40% 0.54
Diversified Finance -6.60% -3.07 -2.52% -1.57 -0.78% -0.48 0.01% 0.01 1.34% 1.06
Energy -7.92% -3.46 -1.54% -1.22 -1.16% -0.64 0.83% 0.50 0.93% 0.58
HealthCare -10.94% -4.26 -0.73% -0.46 2.09% 1.40 0.00% 0.00 0.05% 0.02
Retailer -6.20% -4.03 0.46% 0.47 -1.95% -1.74 -0.93% -1.07 -0.91% -1.13
Info & Tech -7.77% -3.80 -1.42% -1.22 -0.89% -0.68 -0.46% -0.51 1.13% 1.01
Material -7.96% -3.89 -1.50% -1.26 -0.39% -0.34 -0.48% -0.59 0.34% 0.40
Transportation -8.27% -4.56 -1.55% -1.22 -0.12% -0.10 -0.49% -0.63 0.12% 0.13
Insurance -4.86% -3.16 -0.61% -0.74 -1.09% -1.28 -0.46% -0.52 0.30% 0.35
Media -6.30% -2.74 -1.79% -1.12 -0.28% -0.16 -0.74% -0.68 0.23% 0.21
Pharmaceuticals -9.49% -4.15 -1.60% -1.07 -0.97% -0.78 -0.57% -0.69 1.38% 1.17
Real Estate -5.68% -3.93 -1.61% -1.08 -0.91% 0.37 0.33% 0.33 0.60% 0.64
Telecommunication -8.05% -2.93 -2.53% -1.43 4.80% 2.42 0.33% 0.16 3.83% 1.27
Travel -7.86% -3.61 -1.86% -1.13 -0.91% -0.53 0.09% 0.07 -1.99% -1.29
Utilities -5.67% -3.37 -2.58% -2.47 -0.40% -0.33 -0.63% -0.68 1.53% 1.06
Market -7.50% -4.21 -1.28% -1.21 -0.36% -0.35 -0.35% -0.5 0.55% 0.68

28
Table 4: Cumulative Abnormal Returns for Five Days on Malaysian Industry Indices Following Five Terrorist Attacks.
This table presents five day cumulative abnormal returns and the parametric t-test results for 19 Malaysian Industries after September 11, Bali, Madrid, London and Mumbai terrorist attacks.
September 11 Bali Madrid London Mumbai
Industry CAR T-Stat CAR T-Stat CAR T-Stat CAR T-Stat CAR T-Stat
Automobile -19.63% -3.17 4.71% 1.13 -3.07% -0.91 3.06% 1.70 -4.98% -0.83
Bank -13.24% -3.34 4.78% 1.58 1.14% 0.31 -1.45% -0.72 -2.53% -1.13
Capital Goods 2.77% 0.88 2.77% 0.88 0.02% 0.01 4.00% 1.90 -4.38% -1.80
Cons. Dur. & Apparel -19.43% -3.58 2.14% 0.70 -0.59% -0.15 5.09% 2.00 -1.91% -0.72
Consumer Staplers -17.13% -4.02 2.56% 1.14 0.30% 0.13 3.97% 1.85 -3.51% -1.83
Diversified Finance -15.76% -2.93 4.41% 1.09 1.06% 0.24 4.08% 1.53 -4.32% -1.44
Energy -18.97% -3.15 3.21% 1.11 0.30% 0.07 7.06% 1.72 -7.75% -2.24
HealthCare -21.47% -3.29 6.27% 1.68 1.80% 0.44 1.67% 0.80 -4.50% -0.87
Retailer -14.52% -3.52 2.94% 1.11 -0.93% -1.07 2.17% 0.94 -3.17% -1.89
Info & Tech -17.30% -3.17 3.18% 1.04 -1.31% -0.35 4.15% 1.62 -5.28% -1.76
Material -20.86% -3.78 0.72% 0.24 0.97% 0.29 2.81% 1.26 -5.04% -2.17
Transportation -17.21% -3.73 4.85% 1.47 0.00% 0.00 0.74% 0.41 -3.97% -1.87
Insurance -12.78% -3.21 2.05% 0.97 -0.63% -0.29 1.70% 0.83 -1.53% -0.75
Media -19.30% -3.12 7.99% 2.18 -0.97% -0.20 2.61% 1.03 -3.79% -1.44
Pharmaceuticals -21.65% -3.53 3.10% 0.88 -2.65% -0.74 2.01% 1.03 -3.80% -1.32
Real Estate -10.24% -3.93 -2.18% -0.69 1.56% 0.48 2.10% 0.84 -2.37% -1.42
Telecommunication -18.61% -2.97 -1.90% -0.50 13.62% 2.37 2.74% 0.57 -6.81% -1.06
Travel -18.79% -3.48 4.45% 1.09 0.42% 0.12 1.89% 0.58 -5.82% -1.71
Utilities -14.51% -3.42 5.26% 1.92 -0.37% -0.12 2.42% 1.10 -1.49% -0.48
Market -18.01% -3.72 0.03% 1.07 0.00% 0.00 0.03% 1.65 -0.04% -1.87

29
Table 5: The Impact of Five Terrorist Attacks on Malaysian Industry Indices- Non-Parametric Results
This table presents the non-parametric t-test results for 19 Malaysian Industries after September 11, Bali, Madrid, London and Mumbai terrorist attacks.
Industry Sep-11 Bali Madrid London Mumbai
Automobile -2.54 -1.45 -1.76 -0.11 -1.12
Bank -2.28 -0.11 -1.12 -0.13 -0.08
Capital Goods -1.07 -1.26 -1.14 -1.02 -0.81
Cons. Dur. & Apparel -2.38 -1.27 -0.99 -0.40 -0.10
Consumer Staplers -1.86 -1.21 -0.99 -0.38 -0.08
Diversified Finance -2.34 -1.48 -0.83 -0.63 0.67
Energy -1.65 -1.36 -1.24 -0.73 -0.56
HealthCare -1.78 -0.91 -0.57 -0.56 -0.67
Retailer -2.64 -0.62 -1.09 -1.30 -1.54
Info & Tech -1.52 -1.14 -1.12 -0.79 0.07
Material -1.82 -1.37 -1.15 -1.04 -0.66
Transportation -2.20 -1.46 -0.69 -1.10 0.19
Insurance -2.15 -1.56 -1.48 -1.30 0.24
Media -2.18 -1.42 -1.03 -0.69 0.61
Pharmaceuticals -1.82 -1.31 -0.55 -0.43 -0.63
Real Estate -1.53 -1.23 -0.43 -0.52 1.09
Telecommunication -1.22 -1.17 -0.76 -0.80 0.01
Travel -2.91 -1.85 -1.30 -1.61 -0.87
Utilities -2.04 -2.05 -0.98 -1.05 -0.34
Market -2.25 -1.38 -1.06 -0.96 -0.24

30
Table 6: The Impact of September 11 Attack on the Systematic Risk of the Malaysian Industry Indices
The table presents the regression analysis results for 19 Malaysian Industries after September 11 terrorist attack. The first multiplicative
dummy variable equation 12 illustrates the impact on systematic risk and the second additive dummy variable equation 13 shows the impact
on the intercept. The third equation 14 illustrates the long term structural impact on the sector.
Equation 12 Equation 13 Equation 14
Industry Intercept Coefficient Coefficient Intercept Coefficient Coefficient Intercept Coefficient Coefficient Coefficient
Automobile 0.00 0.88 2.34 0.00 0.88 -0.01 0.00 0.85 1.53 0.01
T-Statistics -0.75 11.71 14.96 -0.75 11.71 -1.78 -0.32 8.86 6.97 1.63
Bank 0.00 0.87 0.71 0.00 0.87 -0.03 0.00 0.79 0.55 0.00
T-Statistics 0.49 15.85 2.38 0.49 15.85 -2.38 0.49 13.18 4.03 0.54
Capital Goods 0.00 0.69 2.70 0.00 0.73 -0.03 0.00 0.67 1.22 0.01
T-Statistics -2.05 18.08 21.26 -1.32 16.59 -6.39 -2.95 16.95 7.85 4.31
CDA 0.00 0.54 3.34 0.00 0.55 -0.03 0.00 0.51 1.57 0.01
T-Statistics -1.52 13.83 18.39 -1.31 13.17 -4.50 -1.97 13.64 5.55 2.88
Cons. Staplers 0.00 0.57 1.78 0.00 0.57 -0.01 0.00 0.59 1.10 0.00
T-Statistics -0.83 16.21 20.15 -0.74 15.62 -5.18 -0.18 11.29 9.22 0.55
Div. Fin. 0.00 0.86 1.50 0.00 0.86 -0.06 0.00 0.81 1.50 0.01
T-Statistics -1.88 18.91 14.82 -1.88 18.91 -14.82 -2.26 18.13 14.39 4.17
Energy 0.00 0.38 0.29 0.00 0.38 -0.01 0.00 0.31 0.42 0.00
T-Statistics 0.64 4.35 0.61 0.64 4.35 -0.61 0.68 3.18 1.88 0.11
HealthCare 0.00 1.02 1.28 0.00 1.02 -0.05 0.00 0.92 1.21 0.01
T-Statistics -0.94 12.66 3.28 -0.94 12.66 -3.29 -0.95 10.26 6.35 1.75
Retailer 0.00 0.58 1.73 0.00 0.58 -0.07 0.00 0.55 1.32 0.01
T-Statistics -0.95 15.41 18.13 -0.96 15.40 -18.13 -1.41 14.10 11.48 1.67
Info Tech 0.00 0.84 1.95 0.00 0.84 -0.02 0.00 0.78 0.93 0.01
T-Statistics -1.30 18.38 16.68 -1.22 18.36 -4.65 -1.41 15.11 4.96 1.50

31
Material 0.00 0.63 2.34 0.00 0.62 -0.02 0.00 0.75 1.33 0.01
T-Statistics -1.25 11.61 19.52 -1.05 11.35 -4.84 -0.93 10.48 8.09 1.41
Transportation 0.00 0.81 2.02 0.00 0.81 -0.08 0.00 0.75 1.09 0.00
T-Statistics 0.10 17.39 16.62 0.10 17.39 -16.62 -0.28 11.86 7.47 1.53
Insurance 0.00 0.56 0.02 0.00 0.56 0.00 0.00 0.52 0.68 0.00
T-Statistics 0.11 9.59 0.16 0.11 9.59 -0.16 0.11 8.80 6.75 0.11
Media 0.00 1.23 0.43 0.00 1.01 -0.06 0.00 0.96 1.11 0.01
T-Statistics -0.88 25.52 0.00 -1.31 19.45 -11.03 -1.38 17.16 7.28 1.24
Pharmaceuticals 0.00 0.67 0.69 0.00 0.67 -0.03 0.00 0.62 1.13 0.01
T-Statistics -1.37 12.60 3.61 -1.37 12.60 -3.61 -1.63 11.86 5.05 0.94
Real Estate 0.00 0.45 1.16 0.00 0.45 -0.04 0.00 0.44 0.69 0.00
T-Statistics -0.20 8.83 2.05 -0.20 8.83 -2.05 -0.24 7.22 7.34 0.00
Telecommunication 0.00 1.01 0.30 0.00 1.01 -0.01 0.00 0.92 0.62 0.00
T-Statistics 0.68 8.89 1.55 0.68 8.89 -1.55 0.84 7.97 1.86 -0.19
Travel 0.00 0.92 1.97 0.00 0.92 -0.08 0.00 0.87 1.03 0.00
T-Statistics -0.71 18.47 11.45 -0.71 18.47 -11.45 -0.76 16.37 4.84 0.83
Utilities 0.00 0.92 0.22 0.00 0.92 -0.04 0.00 0.89 0.65 0.00
T-Statistics 0.40 18.05 2.22 0.37 18.18 -7.63 0.86 16.64 5.24 0.66
Market 0.00 0.97 0.74 0.00 0.97 -0.01 0.00 0.96 0.25 0.00
T-Statistics 0.78 14.23 2.21 0.69 14.43 -2.01 1.01 13.96 3.91 1.43
32


