
12nd quarter 2012
www.raiffeisenresearch.at
Central & Eastern European StrategyCentral & Eastern European Strategy2nd quarter 2012
Turning point in economic cycle
Economic outlook improving on Eurozone revision
Limited potential for further FX appreciation
Buy recommendation on equities
Overweight risky assets in CEE
2 2nd quarter 2012
Content
Topical issue: Turning point in economic cycle 3
Forecasts CEE incl. Austria 4
Asset allocation CEE incl. Austria 6
Special: CEE growth revision – where is growth coming from? 10
Austria 12
CE: Poland 14
Hungary 16
Czech Republic 18
Slovakia 20
Slovenia 21
SEE: Croatia 22
Romania 24
Bulgaria 26
Serbia 27
Bosnia and Herzegovina 28
Albania 29
CIS: Russia 30
Ukraine 32
Belarus 34
Turkey 36
Sovereign Eurobonds 38
Corporate Eurobonds 40
Equity markets 42
Sectors 48
Equities - top picks 54
Equities - region overview 59
Sector weightings in comparison 63
Technical analysis 64
Quantitative analysis 66
Acknowledgements & abbreviations 67
Explanation:e ... estimatef ... forecastp ... preliminary figures Eurozone ... Austria, Belgium, Cyprus, Estonia, Finland, France, Germany, Greece, Ireland, Italy, Luxembourg, Malta, Netherlands, Portugal, Slovenia, Slovakia, SpainCE ... Central European countries - Poland, Hungary, Czech Republic, Slovakia, SloveniaSEE ... South East European countries - Albania, Bosnia and Herzegovina, Bulgaria, Croatia, Romania, SerbiaCIS ... European CIS (Commonwealth of Independent States) countries - Russia, Ukraine, BelarusCEE ... Central and Eastern Europe (CE + SEE + CIS)
Central & Eastern European Strategy
32nd quarter 2012
Topical issue
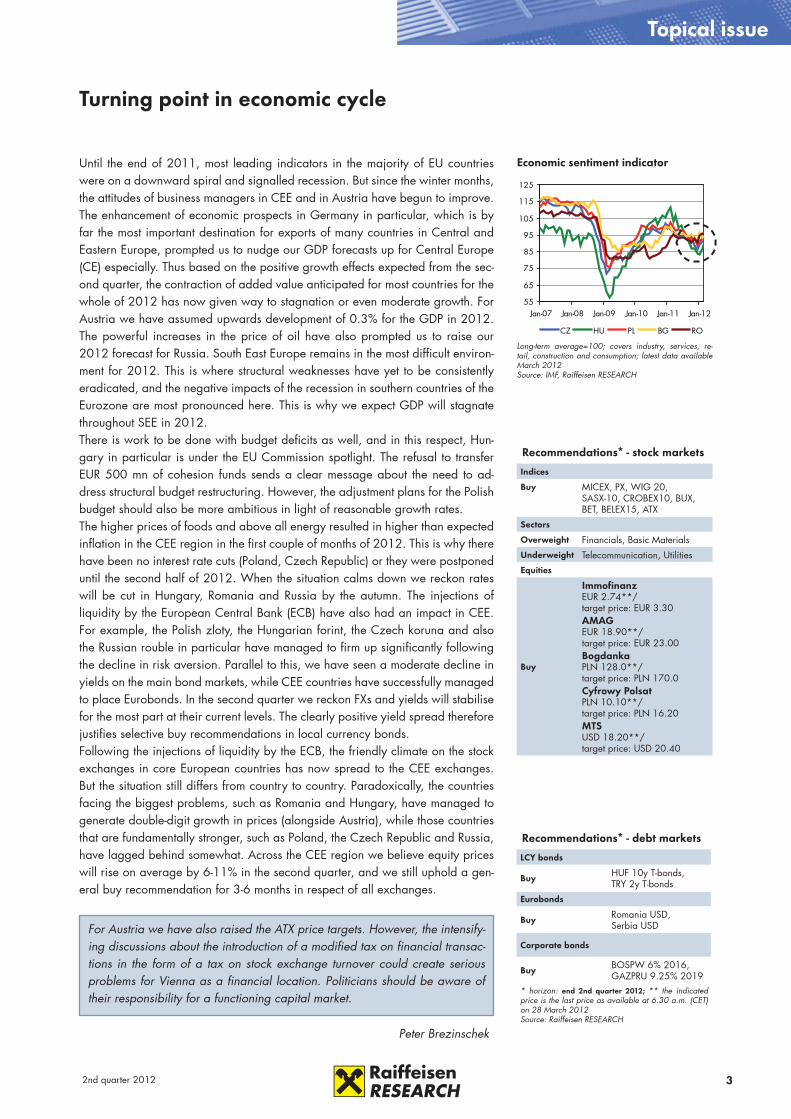
Until the end of 2011, most leading indicators in the majority of EU countries were on a downward spiral and signalled recession. But since the winter months, the attitudes of business managers in CEE and in Austria have begun to improve. The enhancement of economic prospects in Germany in particular, which is by far the most important destination for exports of many countries in Central and Eastern Europe, prompted us to nudge our GDP forecasts up for Central Europe (CE) especially. Thus based on the positive growth effects expected from the sec-ond quarter, the contraction of added value anticipated for most countries for the whole of 2012 has now given way to stagnation or even moderate growth. For Austria we have assumed upwards development of 0.3% for the GDP in 2012. The powerful increases in the price of oil have also prompted us to raise our 2012 forecast for Russia. South East Europe remains in the most difficult environ-ment for 2012. This is where structural weaknesses have yet to be consistently eradicated, and the negative impacts of the recession in southern countries of the Eurozone are most pronounced here. This is why we expect GDP will stagnate throughout SEE in 2012. There is work to be done with budget deficits as well, and in this respect, Hun-gary in particular is under the EU Commission spotlight. The refusal to transfer EUR 500 mn of cohesion funds sends a clear message about the need to ad-dress structural budget restructuring. However, the adjustment plans for the Polish budget should also be more ambitious in light of reasonable growth rates.The higher prices of foods and above all energy resulted in higher than expected inflation in the CEE region in the first couple of months of 2012. This is why there have been no interest rate cuts (Poland, Czech Republic) or they were postponed until the second half of 2012. When the situation calms down we reckon rates will be cut in Hungary, Romania and Russia by the autumn. The injections of liquidity by the European Central Bank (ECB) have also had an impact in CEE. For example, the Polish zloty, the Hungarian forint, the Czech koruna and also the Russian rouble in particular have managed to firm up significantly following the decline in risk aversion. Parallel to this, we have seen a moderate decline in yields on the main bond markets, while CEE countries have successfully managed to place Eurobonds. In the second quarter we reckon FXs and yields will stabilise for the most part at their current levels. The clearly positive yield spread therefore justifies selective buy recommendations in local currency bonds.Following the injections of liquidity by the ECB, the friendly climate on the stock exchanges in core European countries has now spread to the CEE exchanges. But the situation still differs from country to country. Paradoxically, the countries facing the biggest problems, such as Romania and Hungary, have managed to generate double-digit growth in prices (alongside Austria), while those countries that are fundamentally stronger, such as Poland, the Czech Republic and Russia, have lagged behind somewhat. Across the CEE region we believe equity prices will rise on average by 6-11% in the second quarter, and we still uphold a gen-eral buy recommendation for 3-6 months in respect of all exchanges.
Turning point in economic cycle
Recommendations* - debt markets
LCY bonds
Buy HUF 10y T-bonds, TRY 2y T-bonds
Eurobonds
Buy Romania USD, Serbia USD
Corporate bonds
Buy BOSPW 6% 2016,GAZPRU 9.25% 2019
* horizon: end 2nd quarter 2012; ** the indicated price is the last price as available at 6.30 a.m. (CET) on 28 March 2012Source: Raiffeisen RESEARCH
Recommendations* - stock markets
Indices
Buy MICEX, PX, WIG 20, SASX-10, CROBEX10, BUX, BET, BELEX15, ATX
Sectors
Overweight Financials, Basic MaterialsUnderweight Telecommunication, UtilitiesEquities
Buy
ImmofinanzEUR 2.74**/ target price: EUR 3.30AMAGEUR 18.90**/ target price: EUR 23.00BogdankaPLN 128.0**/ target price: PLN 170.0Cyfrowy PolsatPLN 10.10**/ target price: PLN 16.20MTSUSD 18.20**/ target price: USD 20.40
Economic sentiment indicator
Long-term average=100; covers industry, services, re-tail, construction and consumption; latest data available March 2012Source: IMF, Raiffeisen RESEARCH
55
65
75
85
95
105
115
125
Jan-07 Jan-08 Jan-09 Jan-10 Jan-11 Jan-12
CZ HU PL BG RO
Peter Brezinschek
For Austria we have also raised the ATX price targets. However, the intensify-ing discussions about the introduction of a modified tax on financial transac-tions in the form of a tax on stock exchange turnover could create serious problems for Vienna as a financial location. Politicians should be aware of their responsibility for a functioning capital market.
4 2nd quarter 2012
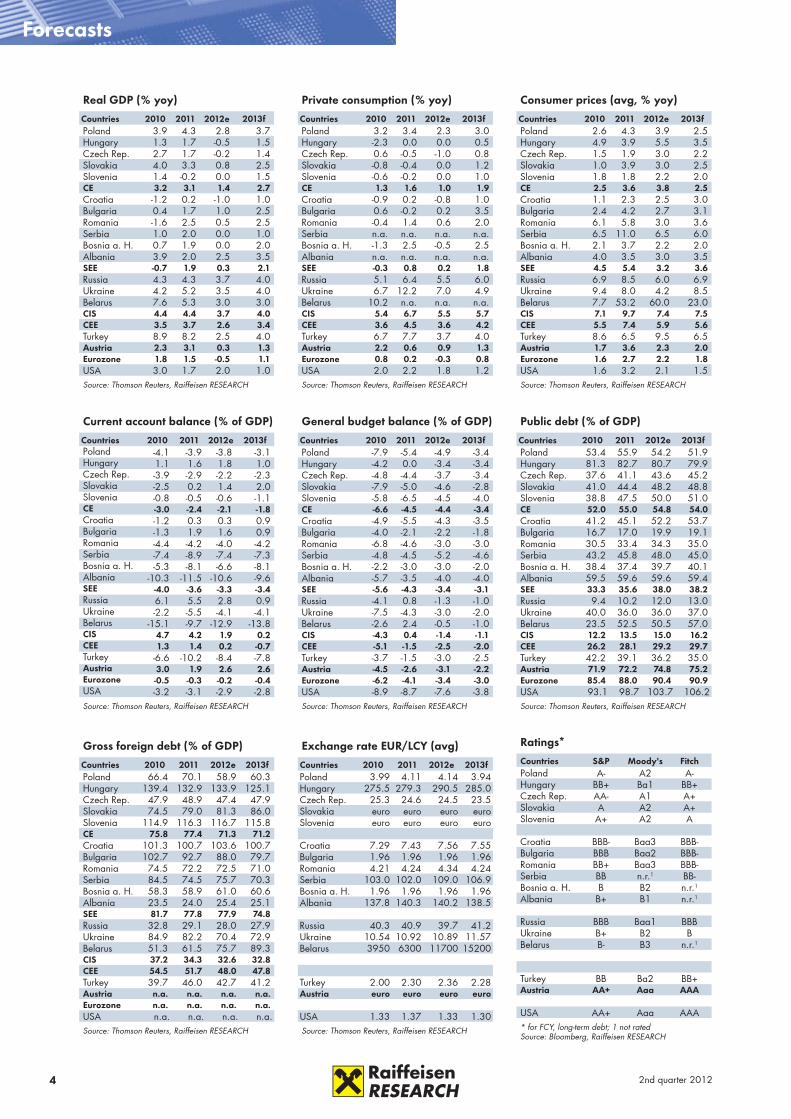
Real GDP (% yoy)
Countries 2010 2011 2012e 2013fPoland 3.9 4.3 2.8 3.7Hungary 1.3 1.7 -0.5 1.5Czech Rep. 2.7 1.7 -0.2 1.4Slovakia 4.0 3.3 0.8 2.5Slovenia 1.4 -0.2 0.0 1.5CE 3.2 3.1 1.4 2.7Croatia -1.2 0.2 -1.0 1.0Bulgaria 0.4 1.7 1.0 2.5Romania -1.6 2.5 0.5 2.5Serbia 1.0 2.0 0.0 1.0Bosnia a. H. 0.7 1.9 0.0 2.0Albania 3.9 2.0 2.5 3.5SEE -0.7 1.9 0.3 2.1Russia 4.3 4.3 3.7 4.0Ukraine 4.2 5.2 3.5 4.0Belarus 7.6 5.3 3.0 3.0CIS 4.4 4.4 3.7 4.0CEE 3.5 3.7 2.6 3.4Turkey 8.9 8.2 2.5 4.0Austria 2.3 3.1 0.3 1.3Eurozone 1.8 1.5 -0.5 1.1USA 3.0 1.7 2.0 1.0Source: Thomson Reuters, Raiffeisen RESEARCH
Private consumption (% yoy)
Countries 2010 2011 2012e 2013fPoland 3.2 3.4 2.3 3.0Hungary -2.3 0.0 0.0 0.5Czech Rep. 0.6 -0.5 -1.0 0.8Slovakia -0.8 -0.4 0.0 1.2Slovenia -0.6 -0.2 0.0 1.0CE 1.3 1.6 1.0 1.9Croatia -0.9 0.2 -0.8 1.0Bulgaria 0.6 -0.2 0.2 3.5Romania -0.4 1.4 0.6 2.0Serbia n.a. n.a. n.a. n.a.Bosnia a. H. -1.3 2.5 -0.5 2.5Albania n.a. n.a. n.a. n.a.SEE -0.3 0.8 0.2 1.8Russia 5.1 6.4 5.5 6.0Ukraine 6.7 12.2 7.0 4.9Belarus 10.2 n.a. n.a. n.a.CIS 5.4 6.7 5.5 5.7CEE 3.6 4.5 3.6 4.2Turkey 6.7 7.7 3.7 4.0Austria 2.2 0.6 0.9 1.3Eurozone 0.8 0.2 -0.3 0.8USA 2.0 2.2 1.8 1.2Source: Thomson Reuters, Raiffeisen RESEARCH
Consumer prices (avg, % yoy)
Countries 2010 2011 2012e 2013fPoland 2.6 4.3 3.9 2.5Hungary 4.9 3.9 5.5 3.5Czech Rep. 1.5 1.9 3.0 2.2Slovakia 1.0 3.9 3.0 2.5Slovenia 1.8 1.8 2.2 2.0CE 2.5 3.6 3.8 2.5Croatia 1.1 2.3 2.5 3.0Bulgaria 2.4 4.2 2.7 3.1Romania 6.1 5.8 3.0 3.6Serbia 6.5 11.0 6.5 6.0Bosnia a. H. 2.1 3.7 2.2 2.0Albania 4.0 3.5 3.0 3.5SEE 4.5 5.4 3.2 3.6Russia 6.9 8.5 6.0 6.9Ukraine 9.4 8.0 4.2 8.5Belarus 7.7 53.2 60.0 23.0CIS 7.1 9.7 7.4 7.5CEE 5.5 7.4 5.9 5.6Turkey 8.6 6.5 9.5 6.5Austria 1.7 3.6 2.3 2.0Eurozone 1.6 2.7 2.2 1.8USA 1.6 3.2 2.1 1.5Source: Thomson Reuters, Raiffeisen RESEARCH
Current account balance (% of GDP)
Countries 2010 2011 2012e 2013fPoland -4.1 -3.9 -3.8 -3.1Hungary 1.1 1.6 1.8 1.0Czech Rep. -3.9 -2.9 -2.2 -2.3Slovakia -2.5 0.2 1.4 2.0Slovenia -0.8 -0.5 -0.6 -1.1CE -3.0 -2.4 -2.1 -1.8Croatia -1.2 0.3 0.3 0.9Bulgaria -1.3 1.9 1.6 0.9Romania -4.4 -4.2 -4.0 -4.2Serbia -7.4 -8.9 -7.4 -7.3Bosnia a. H. -5.3 -8.1 -6.6 -8.1Albania -10.3 -11.5 -10.6 -9.6SEE -4.0 -3.6 -3.3 -3.4Russia 6.1 5.5 2.8 0.9Ukraine -2.2 -5.5 -4.1 -4.1Belarus -15.1 -9.7 -12.9 -13.8CIS 4.7 4.2 1.9 0.2CEE 1.3 1.4 0.2 -0.7Turkey -6.6 -10.2 -8.4 -7.8Austria 3.0 1.9 2.6 2.6Eurozone -0.5 -0.3 -0.2 -0.4USA -3.2 -3.1 -2.9 -2.8Source: Thomson Reuters, Raiffeisen RESEARCH
Forecasts
General budget balance (% of GDP)
Countries 2010 2011 2012e 2013fPoland -7.9 -5.4 -4.9 -3.4Hungary -4.2 0.0 -3.4 -3.4Czech Rep. -4.8 -4.4 -3.7 -3.4Slovakia -7.9 -5.0 -4.6 -2.8Slovenia -5.8 -6.5 -4.5 -4.0CE -6.6 -4.5 -4.4 -3.4Croatia -4.9 -5.5 -4.3 -3.5Bulgaria -4.0 -2.1 -2.2 -1.8Romania -6.8 -4.6 -3.0 -3.0Serbia -4.8 -4.5 -5.2 -4.6Bosnia a. H. -2.2 -3.0 -3.0 -2.0Albania -5.7 -3.5 -4.0 -4.0SEE -5.6 -4.3 -3.4 -3.1Russia -4.1 0.8 -1.3 -1.0Ukraine -7.5 -4.3 -3.0 -2.0Belarus -2.6 2.4 -0.5 -1.0CIS -4.3 0.4 -1.4 -1.1CEE -5.1 -1.5 -2.5 -2.0Turkey -3.7 -1.5 -3.0 -2.5Austria -4.5 -2.6 -3.1 -2.2Eurozone -6.2 -4.1 -3.4 -3.0USA -8.9 -8.7 -7.6 -3.8Source: Thomson Reuters, Raiffeisen RESEARCH
Public debt (% of GDP)
Countries 2010 2011 2012e 2013fPoland 53.4 55.9 54.2 51.9Hungary 81.3 82.7 80.7 79.9Czech Rep. 37.6 41.1 43.6 45.2Slovakia 41.0 44.4 48.2 48.8Slovenia 38.8 47.5 50.0 51.0CE 52.0 55.0 54.8 54.0Croatia 41.2 45.1 52.2 53.7Bulgaria 16.7 17.0 19.9 19.1Romania 30.5 33.4 34.3 35.0Serbia 43.2 45.8 48.0 45.0Bosnia a. H. 38.4 37.4 39.7 40.1Albania 59.5 59.6 59.6 59.4SEE 33.3 35.6 38.0 38.2Russia 9.4 10.2 12.0 13.0Ukraine 40.0 36.0 36.0 37.0Belarus 23.5 52.5 50.5 57.0CIS 12.2 13.5 15.0 16.2CEE 26.2 28.1 29.2 29.7Turkey 42.2 39.1 36.2 35.0Austria 71.9 72.2 74.8 75.2Eurozone 85.4 88.0 90.4 90.9USA 93.1 98.7 103.7 106.2Source: Thomson Reuters, Raiffeisen RESEARCH
Gross foreign debt (% of GDP)
Countries 2010 2011 2012e 2013fPoland 66.4 70.1 58.9 60.3Hungary 139.4 132.9 133.9 125.1Czech Rep. 47.9 48.9 47.4 47.9Slovakia 74.5 79.0 81.3 86.0Slovenia 114.9 116.3 116.7 115.8CE 75.8 77.4 71.3 71.2Croatia 101.3 100.7 103.6 100.7Bulgaria 102.7 92.7 88.0 79.7Romania 74.5 72.2 72.5 71.0Serbia 84.5 74.5 75.7 70.3Bosnia a. H. 58.3 58.9 61.0 60.6Albania 23.5 24.0 25.4 25.1SEE 81.7 77.8 77.9 74.8Russia 32.8 29.1 28.0 27.9Ukraine 84.9 82.2 70.4 72.9Belarus 51.3 61.5 75.7 89.3CIS 37.2 34.3 32.6 32.8CEE 54.5 51.7 48.0 47.8Turkey 39.7 46.0 42.7 41.2Austria n.a. n.a. n.a. n.a.Eurozone n.a. n.a. n.a. n.a.USA n.a. n.a. n.a. n.a.Source: Thomson Reuters, Raiffeisen RESEARCH
Exchange rate EUR/LCY (avg)
Countries 2010 2011 2012e 2013fPoland 3.99 4.11 4.14 3.94Hungary 275.5 279.3 290.5 285.0Czech Rep. 25.3 24.6 24.5 23.5Slovakia euro euro euro euroSlovenia euro euro euro euro
Croatia 7.29 7.43 7.56 7.55Bulgaria 1.96 1.96 1.96 1.96Romania 4.21 4.24 4.34 4.24Serbia 103.0 102.0 109.0 106.9Bosnia a. H. 1.96 1.96 1.96 1.96Albania 137.8 140.3 140.2 138.5
Russia 40.3 40.9 39.7 41.2Ukraine 10.54 10.92 10.89 11.57Belarus 3950 6300 11700 15200
Turkey 2.00 2.30 2.36 2.28Austria euro euro euro euro
USA 1.33 1.37 1.33 1.30Source: Thomson Reuters, Raiffeisen RESEARCH
Ratings*
Countries S&P Moody's FitchPoland A- A2 A-Hungary BB+ Ba1 BB+Czech Rep. AA- A1 A+Slovakia A A2 A+Slovenia A+ A2 A
Croatia BBB- Baa3 BBB-Bulgaria BBB Baa2 BBB-Romania BB+ Baa3 BBB-Serbia BB n.r.1 BB-Bosnia a. H. B B2 n.r.1
Albania B+ B1 n.r.1
Russia BBB Baa1 BBBUkraine B+ B2 BBelarus B- B3 n.r.1
Turkey BB Ba2 BB+Austria AA+ Aaa AAA
USA AA+ Aaa AAA* for FCY, long-term debt; 1 not ratedSource: Bloomberg, Raiffeisen RESEARCH
52nd quarter 2012
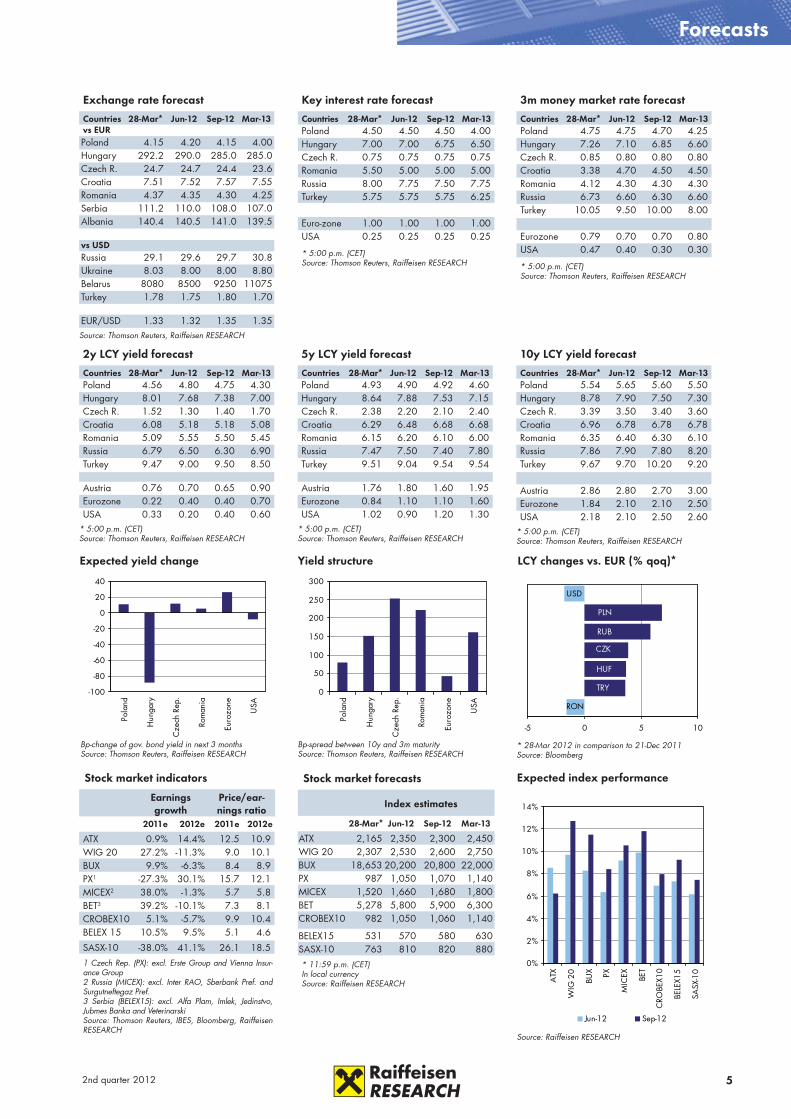
Exchange rate forecast
Countries 28-Mar* Jun-12 Sep-12 Mar-13vs EURPoland 4.15 4.20 4.15 4.00Hungary 292.2 290.0 285.0 285.0Czech R. 24.7 24.7 24.4 23.6Croatia 7.51 7.52 7.57 7.55Romania 4.37 4.35 4.30 4.25Serbia 111.2 110.0 108.0 107.0Albania 140.4 140.5 141.0 139.5
vs USDRussia 29.1 29.6 29.7 30.8Ukraine 8.03 8.00 8.00 8.80Belarus 8080 8500 9250 11075Turkey 1.78 1.75 1.80 1.70
EUR/USD 1.33 1.32 1.35 1.35Source: Thomson Reuters, Raiffeisen RESEARCH
2y LCY yield forecast
Countries 28-Mar* Jun-12 Sep-12 Mar-13Poland 4.56 4.80 4.75 4.30Hungary 8.01 7.68 7.38 7.00Czech R. 1.52 1.30 1.40 1.70Croatia 6.08 5.18 5.18 5.08Romania 5.09 5.55 5.50 5.45Russia 6.79 6.50 6.30 6.90Turkey 9.47 9.00 9.50 8.50
Austria 0.76 0.70 0.65 0.90Eurozone 0.22 0.40 0.40 0.70USA 0.33 0.20 0.40 0.60
* 5:00 p.m. (CET)Source: Thomson Reuters, Raiffeisen RESEARCH
Key interest rate forecast
Countries 28-Mar* Jun-12 Sep-12 Mar-13Poland 4.50 4.50 4.50 4.00Hungary 7.00 7.00 6.75 6.50Czech R. 0.75 0.75 0.75 0.75Romania 5.50 5.00 5.00 5.00Russia 8.00 7.75 7.50 7.75Turkey 5.75 5.75 5.75 6.25
Euro-zone 1.00 1.00 1.00 1.00USA 0.25 0.25 0.25 0.25
* 5:00 p.m. (CET)Source: Thomson Reuters, Raiffeisen RESEARCH
Forecasts
3m money market rate forecast
Countries 28-Mar* Jun-12 Sep-12 Mar-13Poland 4.75 4.75 4.70 4.25Hungary 7.26 7.10 6.85 6.60Czech R. 0.85 0.80 0.80 0.80Croatia 3.38 4.70 4.50 4.50Romania 4.12 4.30 4.30 4.30Russia 6.73 6.60 6.30 6.60Turkey 10.05 9.50 10.00 8.00
Eurozone 0.79 0.70 0.70 0.80USA 0.47 0.40 0.30 0.30
* 5:00 p.m. (CET)Source: Thomson Reuters, Raiffeisen RESEARCH
5y LCY yield forecast
Countries 28-Mar* Jun-12 Sep-12 Mar-13Poland 4.93 4.90 4.92 4.60Hungary 8.64 7.88 7.53 7.15Czech R. 2.38 2.20 2.10 2.40Croatia 6.29 6.48 6.68 6.68Romania 6.15 6.20 6.10 6.00Russia 7.47 7.50 7.40 7.80Turkey 9.51 9.04 9.54 9.54
Austria 1.76 1.80 1.60 1.95Eurozone 0.84 1.10 1.10 1.60USA 1.02 0.90 1.20 1.30
* 5:00 p.m. (CET)Source: Thomson Reuters, Raiffeisen RESEARCH
10y LCY yield forecast
Countries 28-Mar* Jun-12 Sep-12 Mar-13Poland 5.54 5.65 5.60 5.50Hungary 8.78 7.90 7.50 7.30Czech R. 3.39 3.50 3.40 3.60Croatia 6.96 6.78 6.78 6.78Romania 6.35 6.40 6.30 6.10Russia 7.86 7.90 7.80 8.20Turkey 9.67 9.70 10.20 9.20
Austria 2.86 2.80 2.70 3.00Eurozone 1.84 2.10 2.10 2.50USA 2.18 2.10 2.50 2.60
* 5:00 p.m. (CET)Source: Thomson Reuters, Raiffeisen RESEARCH
Yield structure
Bp-spread between 10y and 3m maturitySource: Thomson Reuters, Raiffeisen RESEARCH
0
50
100
150
200
250
300
Pola
nd
Hun
gary
Cze
ch R
ep.
Rom
ania
Euro
zone
USA
LCY changes vs. EUR (% qoq)*
* 28-Mar 2012 in comparison to 21-Dec 2011Source: Bloomberg
RON
TRY
HUF
CZK
RUB
PLN
USD
-5 0 5 10
Expected yield change
Bp-change of gov. bond yield in next 3 monthsSource: Thomson Reuters, Raiffeisen RESEARCH
-100
-80
-60
-40
-20
0
20
40
Pola
nd
Hun
gary
Cze
ch R
ep.
Rom
ania
Euro
zone
USA
Expected index performance
Source: Raiffeisen RESEARCH
0%
2%
4%
6%
8%
10%
12%
14%
ATX
WIG
20
BUX PX
MIC
EX BET
CRO
BEX1
0
BELE
X15
SASX
-10
Jun-12 Sep-12
Stock market indicators
Earnings growth
Price/ear-nings ratio
2011e 2012e 2011e 2012e
ATX 0.9% 14.4% 12.5 10.9 WIG 20 27.2% -11.3% 9.0 10.1 BUX 9.9% -6.3% 8.4 8.9 PX1 -27.3% 30.1% 15.7 12.1 MICEX2 38.0% -1.3% 5.7 5.8 BET3 39.2% -10.1% 7.3 8.1 CROBEX10 5.1% -5.7% 9.9 10.4 BELEX 15 10.5% 9.5% 5.1 4.6
SASX-10 -38.0% 41.1% 26.1 18.5 1 Czech Rep. (PX): excl. Erste Group and Vienna Insur-ance Group2 Russia (MICEX): excl. Inter RAO, Sberbank Pref. and Surgutneftegaz Pref.3 Serbia (BELEX15): excl. Alfa Plam, Imlek, Jedinstvo, Jubmes Banka and VeterinarskiSource: Thomson Reuters, IBES, Bloomberg, Raiffeisen RESEARCH
Stock market forecasts
Index estimates
28-Mar* Jun-12 Sep-12 Mar-13
ATX 2,165 2,350 2,300 2,450WIG 20 2,307 2,530 2,600 2,750BUX 18,653 20,200 20,800 22,000PX 987 1,050 1,070 1,140MICEX 1,520 1,660 1,680 1,800BET 5,278 5,800 5,900 6,300CROBEX10 982 1,050 1,060 1,140
BELEX15 531 570 580 630SASX-10 763 810 820 880* 11:59 p.m. (CET)In local currencySource: Raiffeisen RESEARCH
6 2nd quarter 2012
Forecasts
Sum of last quarter*
RBI portfolio (in EUR) 11.10%
Benchmark (in EUR) 11.27%RBI outperformance (in EUR) -0.16%by weighting of equities vs. bonds -0.15%
regional equity weightings -0.05%
weighting of Eurobonds vs. LCY bonds
0.00%
country weightings of LCY bonds 0.03%
country weightings of Eurobonds EUR
0.00%
country weightings of Eurobonds USD
0.00%
joint effects / duration 0.01%* 31/12/2011 - 22/03/2012; EB...EurobondsSource: Raiffeisen RESEARCH
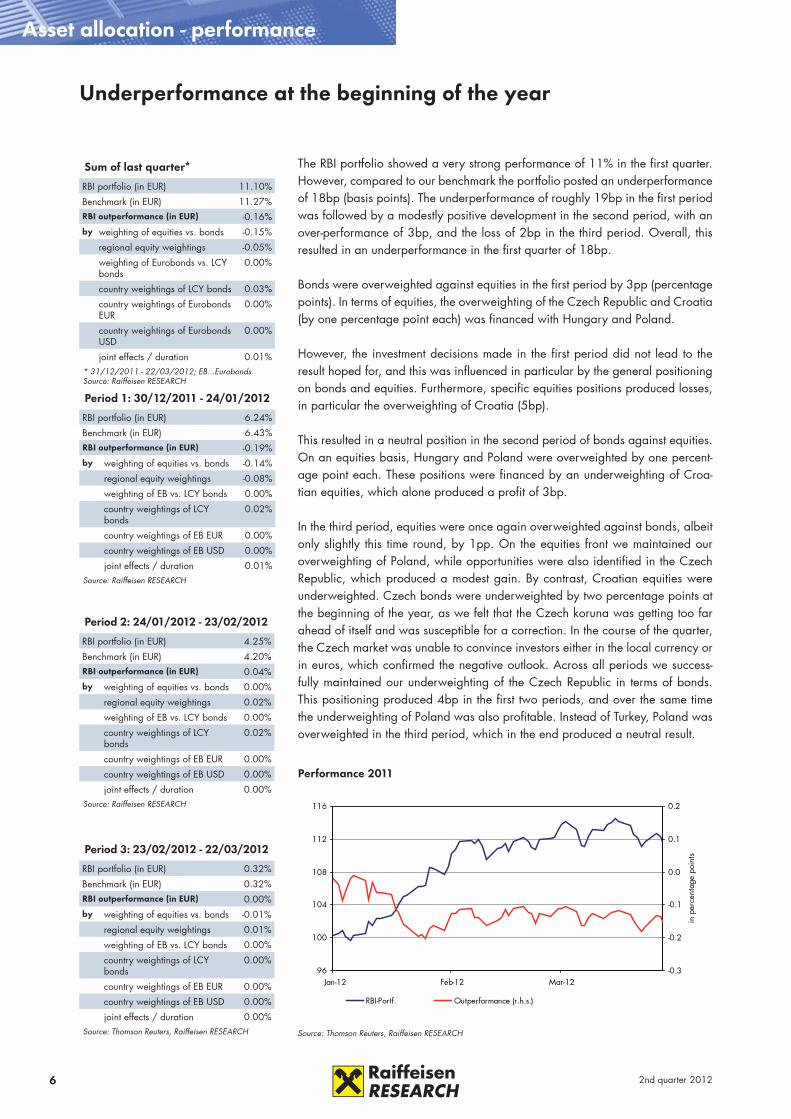
The RBI portfolio showed a very strong performance of 11% in the first quarter. However, compared to our benchmark the portfolio posted an underperformance of 18bp (basis points). The underperformance of roughly 19bp in the first period was followed by a modestly positive development in the second period, with an over-performance of 3bp, and the loss of 2bp in the third period. Overall, this resulted in an underperformance in the first quarter of 18bp.
Bonds were overweighted against equities in the first period by 3pp (percentage points). In terms of equities, the overweighting of the Czech Republic and Croatia (by one percentage point each) was financed with Hungary and Poland.
However, the investment decisions made in the first period did not lead to the result hoped for, and this was influenced in particular by the general positioning on bonds and equities. Furthermore, specific equities positions produced losses, in particular the overweighting of Croatia (5bp).
This resulted in a neutral position in the second period of bonds against equities. On an equities basis, Hungary and Poland were overweighted by one percent-age point each. These positions were financed by an underweighting of Croa-tian equities, which alone produced a profit of 3bp.
In the third period, equities were once again overweighted against bonds, albeit only slightly this time round, by 1pp. On the equities front we maintained our overweighting of Poland, while opportunities were also identified in the Czech Republic, which produced a modest gain. By contrast, Croatian equities were underweighted. Czech bonds were underweighted by two percentage points at the beginning of the year, as we felt that the Czech koruna was getting too far ahead of itself and was susceptible for a correction. In the course of the quarter, the Czech market was unable to convince investors either in the local currency or in euros, which confirmed the negative outlook. Across all periods we success-fully maintained our underweighting of the Czech Republic in terms of bonds. This positioning produced 4bp in the first two periods, and over the same time the underweighting of Poland was also profitable. Instead of Turkey, Poland was overweighted in the third period, which in the end produced a neutral result.
Underperformance at the beginning of the year
Period 1: 30/12/2011 - 24/01/2012
RBI portfolio (in EUR) 6.24%
Benchmark (in EUR) 6.43%RBI outperformance (in EUR) -0.19%by weighting of equities vs. bonds -0.14%
regional equity weightings -0.08%
weighting of EB vs. LCY bonds 0.00%
country weightings of LCY bonds
0.02%
country weightings of EB EUR 0.00%
country weightings of EB USD 0.00%
joint effects / duration 0.01%Source: Raiffeisen RESEARCH
Period 2: 24/01/2012 - 23/02/2012
RBI portfolio (in EUR) 4.25%
Benchmark (in EUR) 4.20%RBI outperformance (in EUR) 0.04%by weighting of equities vs. bonds 0.00%
regional equity weightings 0.02%
weighting of EB vs. LCY bonds 0.00%
country weightings of LCY bonds
0.02%
country weightings of EB EUR 0.00%
country weightings of EB USD 0.00%
joint effects / duration 0.00%Source: Raiffeisen RESEARCH
Period 3: 23/02/2012 - 22/03/2012
RBI portfolio (in EUR) 0.32%
Benchmark (in EUR) 0.32%RBI outperformance (in EUR) 0.00%by weighting of equities vs. bonds -0.01%
regional equity weightings 0.01%
weighting of EB vs. LCY bonds 0.00%
country weightings of LCY bonds
0.00%
country weightings of EB EUR 0.00%
country weightings of EB USD 0.00%
joint effects / duration 0.00%Source: Thomson Reuters, Raiffeisen RESEARCH
96
100
104
108
112
116
Jan-12 Feb-12 Mar-12-0.3
-0.2
-0.1
0.0
0.1
0.2
in p
erce
ntag
e po
ints
RBI-Portf. Outperformance (r.h.s.)
Performance 2011
Source: Thomson Reuters, Raiffeisen RESEARCH
Asset allocation - performance
72nd quarter 2012
xxAsset allocation - total portfolio
It does not seem as if the European sovereign debt crisis will pass through to core countries in Eastern Europe for now. The intervention by the European Central Bank offering the European banking system better access to liquidity seems to have borne fruit. The yield spreads of (almost) all countries at risk on the Euro-pean periphery to German Bunds have fallen drastically during the last quarter. European banks have presumably used part of the extra liquidity provided under favourable conditions to buy (euro) government bonds. This also means that one of the main risk factors has been averted – namely a collapse of the European banking system followed by a massive deleveraging process and the resultant tur-moil in the economies of CEE. This scenario was rated extremely likely by many investors, and penalised by massive sales of equities and government bonds from the CEE region. Many Eastern European currencies were also badly affected by this veritable sell-off.
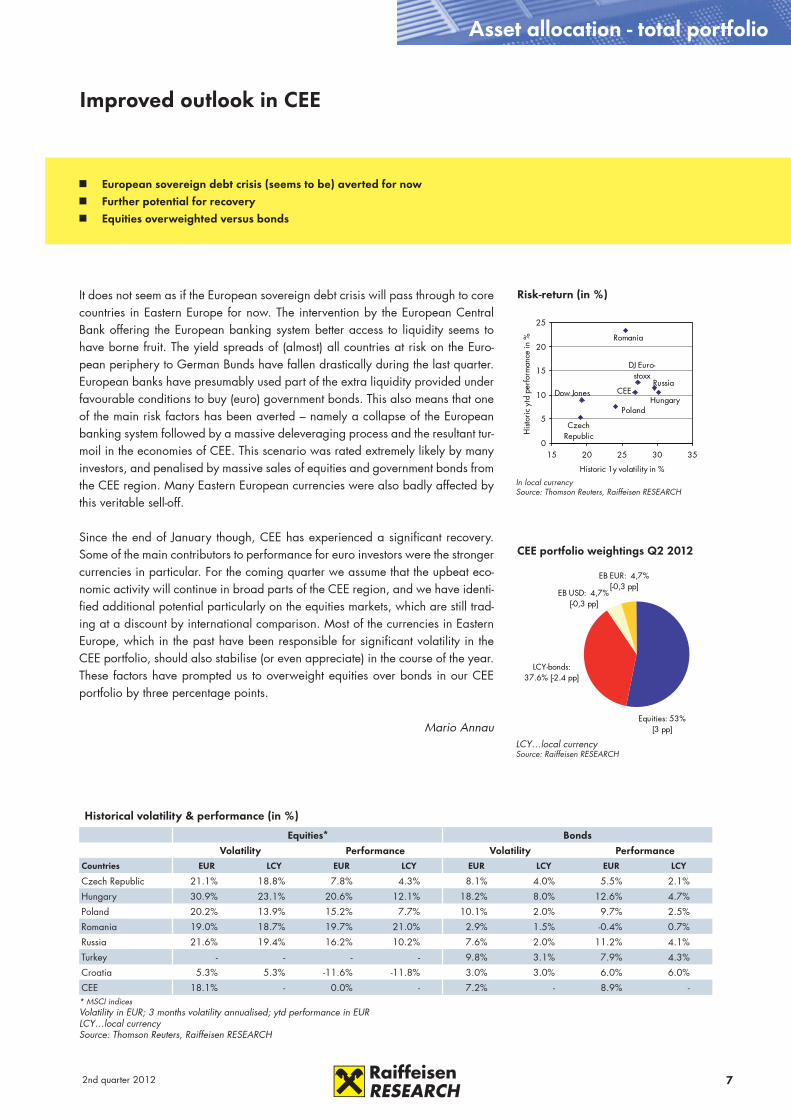
Since the end of January though, CEE has experienced a significant recovery. Some of the main contributors to performance for euro investors were the stronger currencies in particular. For the coming quarter we assume that the upbeat eco-nomic activity will continue in broad parts of the CEE region, and we have identi-fied additional potential particularly on the equities markets, which are still trad-ing at a discount by international comparison. Most of the currencies in Eastern Europe, which in the past have been responsible for significant volatility in the CEE portfolio, should also stabilise (or even appreciate) in the course of the year. These factors have prompted us to overweight equities over bonds in our CEE portfolio by three percentage points.
Mario Annau
Improved outlook in CEE
Historical volatility & performance (in %)
Equities* BondsVolatility Performance Volatility Performance
Countries EUR LCY EUR LCY EUR LCY EUR LCY
Czech Republic 21.1% 18.8% 7.8% 4.3% 8.1% 4.0% 5.5% 2.1%
Hungary 30.9% 23.1% 20.6% 12.1% 18.2% 8.0% 12.6% 4.7%
Poland 20.2% 13.9% 15.2% 7.7% 10.1% 2.0% 9.7% 2.5%
Romania 19.0% 18.7% 19.7% 21.0% 2.9% 1.5% -0.4% 0.7%
Russia 21.6% 19.4% 16.2% 10.2% 7.6% 2.0% 11.2% 4.1%
Turkey - - - - 9.8% 3.1% 7.9% 4.3%
Croatia 5.3% 5.3% -11.6% -11.8% 3.0% 3.0% 6.0% 6.0%
CEE 18.1% - 0.0% - 7.2% - 8.9% -* MSCI indicesVolatility in EUR; 3 months volatility annualised; ytd performance in EURLCY…local currencySource: Thomson Reuters, Raiffeisen RESEARCH
CEE portfolio weightings Q2 2012
LCY…local currencySource: Raiffeisen RESEARCH
Risk-return (in %)
In local currencySource: Thomson Reuters, Raiffeisen RESEARCH
European sovereign debt crisis (seems to be) averted for now Further potential for recovery Equities overweighted versus bonds
Equities: 53% [3 pp]
LCY-bonds: 37.6% [-2.4 pp]
EB EUR: 4,7% [-0,3 pp]
EB USD: 4,7% [-0,3 pp]
DJ Euro-stoxx
CEE
Poland
Czech Republic
Russia
HungaryDow Jones
Romania
0
5
10
15
20
25
15 20 25 30 35
Historic 1y volatility in %
Hist
oric
ytd
per
form
ance
in %
8 2nd quarter 2012
Forecasts
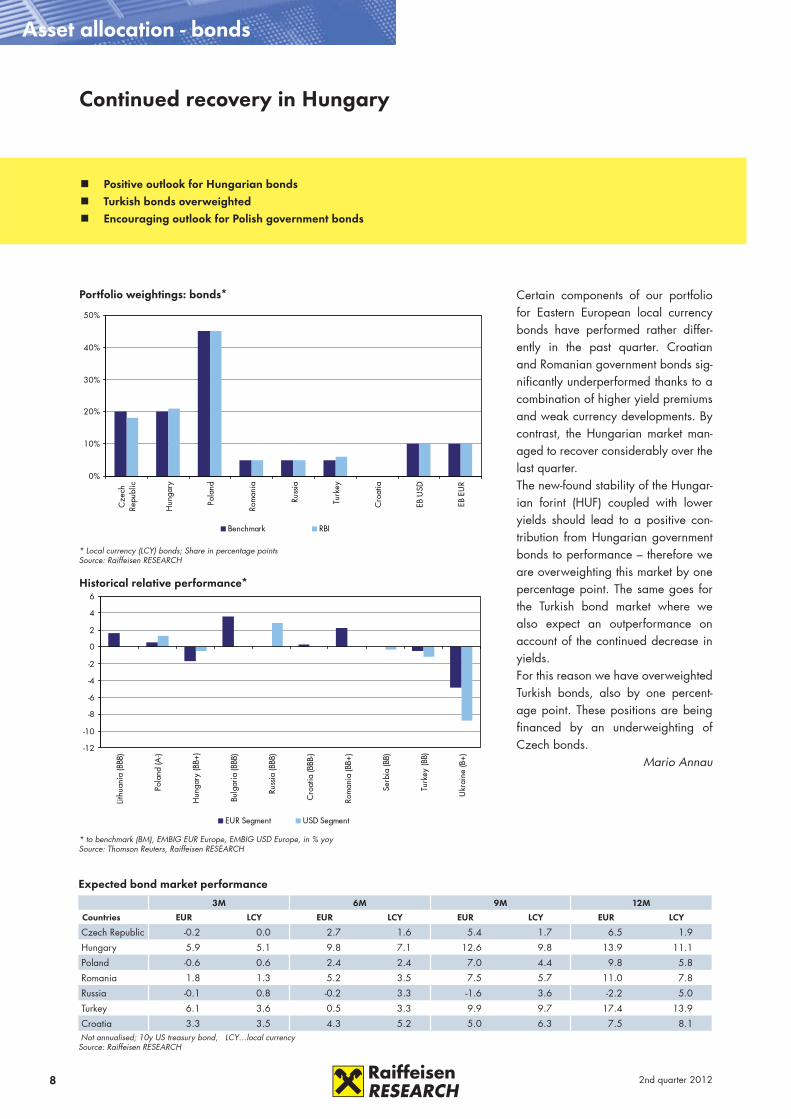
Certain components of our portfolio for Eastern European local currency bonds have performed rather differ-ently in the past quarter. Croatian and Romanian government bonds sig-nificantly underperformed thanks to a combination of higher yield premiums and weak currency developments. By contrast, the Hungarian market man-aged to recover considerably over the last quarter.The new-found stability of the Hungar-ian forint (HUF) coupled with lower yields should lead to a positive con-tribution from Hungarian government bonds to performance – therefore we are overweighting this market by one percentage point. The same goes for the Turkish bond market where we also expect an outperformance on account of the continued decrease in yields. For this reason we have overweighted Turkish bonds, also by one percent-age point. These positions are being financed by an underweighting of Czech bonds.
Mario Annau
Continued recovery in Hungary
Asset allocation - bonds
Expected bond market performance
3M 6M 9M 12M
Countries EUR LCY EUR LCY EUR LCY EUR LCY
Czech Republic -0.2 0.0 2.7 1.6 5.4 1.7 6.5 1.9
Hungary 5.9 5.1 9.8 7.1 12.6 9.8 13.9 11.1
Poland -0.6 0.6 2.4 2.4 7.0 4.4 9.8 5.8
Romania 1.8 1.3 5.2 3.5 7.5 5.7 11.0 7.8
Russia -0.1 0.8 -0.2 3.3 -1.6 3.6 -2.2 5.0
Turkey 6.1 3.6 0.5 3.3 9.9 9.7 17.4 13.9
Croatia 3.3 3.5 4.3 5.2 5.0 6.3 7.5 8.1 Not annualised; 10y US treasury bond, LCY…local currencySource: Raiffeisen RESEARCH
-12
-10
-8
-6
-4
-2
0
2
4
6
Lithu
ania
(BBB
)
Pola
nd (A
-)
Hun
gary
(BB+
)
Bulg
aria
(BBB
)
Russ
ia (B
BB)
Cro
atia
(BBB
-)
Rom
ania
(BB+
)
Serb
ia (B
B)
Turk
ey (B
B)
Ukr
aine
(B+)
EUR Segment USD Segment
Historical relative performance*
* to benchmark (BM), EMBIG EUR Europe, EMBIG USD Europe, in % yoySource: Thomson Reuters, Raiffeisen RESEARCH
0%
10%
20%
30%
40%
50%
Cze
chRe
publ
ic
Hun
gary
Pola
nd
Rom
ania
Russ
ia
Turk
ey
Cro
atia
EB U
SD
EB E
UR
Benchmark RBI
Portfolio weightings: bonds*
* Local currency (LCY) bonds; Share in percentage pointsSource: Raiffeisen RESEARCH
Positive outlook for Hungarian bonds Turkish bonds overweighted Encouraging outlook for Polish government bonds
92nd quarter 2012
xxAsset allocation - equities
Offensive country weighting
Russia: boosted by high commodity prices Poland: valuations still attractive Czech Republic: relatively weak within the region
Expected stock market performance (in %)
3M 6M 9M 12M
Countries EUR LCY EUR LCY EUR LCY EUR LCY
Poland -7.2 -7.2 -1.5 -4.9 7.0 -0.3 24.9 13.6
Hungary -8.5 -9.1 -5.2 -7.4 3.5 -0.6 20.3 13.6
Czech Republic -7.7 -9.1 -3.5 -6.8 3.6 -1.1 22.1 13.6
Russia -7.6 -5.4 -7.6 -4.0 -2.1 1.8 14.3 19.1
Romania -9.1 -7.0 -5.7 -4.7 2.3 2.3 16.3 16.2
Croatia -7.3 -7.5 -5.0 -5.4 -0.1 -0.3 12.6 13.1Not annualised, LCY…local currency, since 21/12/2011Source: Raiffeisen RESEARCH
-20%
-10%
0%
10%
20%
Hun
gary
Cze
chRe
publ
ic
Russ
ia
Cro
atia
Pola
nd
Rom
ania
EUR Local currency
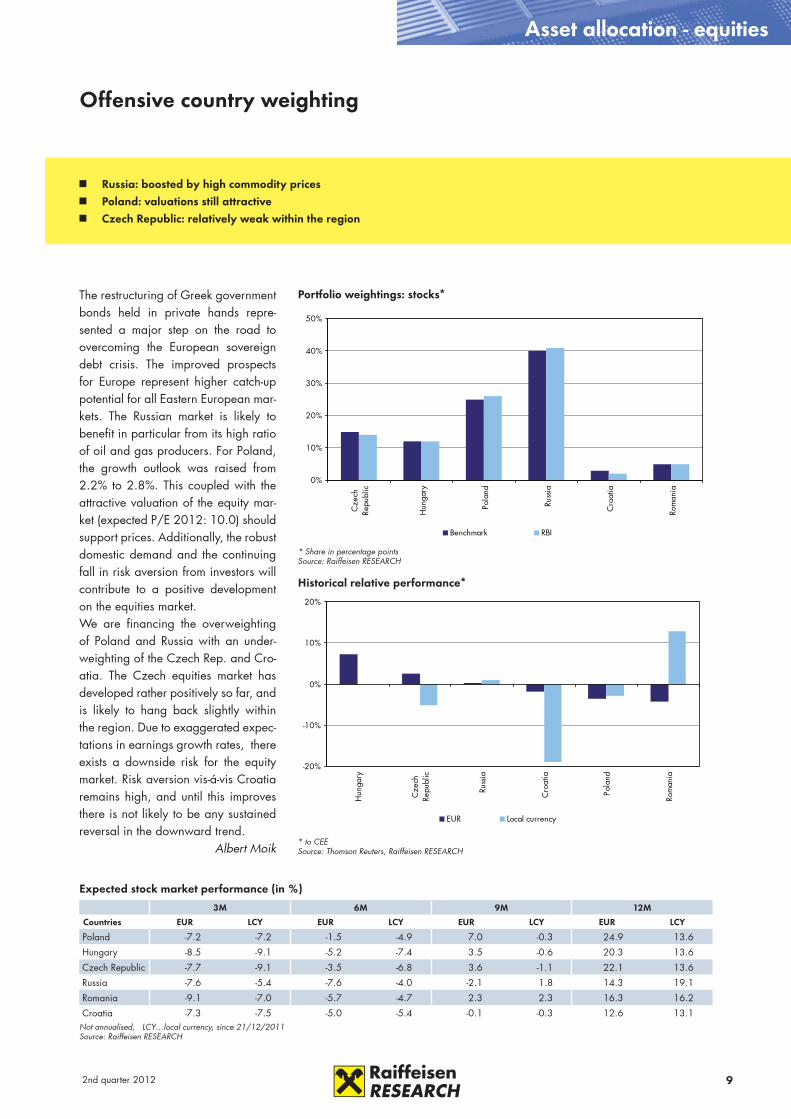
Historical relative performance*
* to CEESource: Thomson Reuters, Raiffeisen RESEARCH
0%
10%
20%
30%
40%
50%
Cze
chRe
publ
ic
Hun
gary
Pola
nd
Russ
ia
Cro
atia
Rom
ania
Benchmark RBI
Portfolio weightings: stocks*
* Share in percentage pointsSource: Raiffeisen RESEARCH
The restructuring of Greek government bonds held in private hands repre-sented a major step on the road to overcoming the European sovereign debt crisis. The improved prospects for Europe represent higher catch-up potential for all Eastern European mar-kets. The Russian market is likely to benefit in particular from its high ratio of oil and gas producers. For Poland, the growth outlook was raised from 2.2% to 2.8%. This coupled with the attractive valuation of the equity mar-ket (expected P/E 2012: 10.0) should support prices. Additionally, the robust domestic demand and the continuing fall in risk aversion from investors will contribute to a positive development on the equities market. We are financing the overweighting of Poland and Russia with an under-weighting of the Czech Rep. and Cro-atia. The Czech equities market has developed rather positively so far, and is likely to hang back slightly within the region. Due to exaggerated expec-tations in earnings growth rates, there exists a downside risk for the equity market. Risk aversion vis-á-vis Croatia remains high, and until this improves there is not likely to be any sustained reversal in the downward trend.
Albert Moik

10 2nd quarter 2012
Forecasts
The most recent economic indicators confirm our expectations of an economic slowdown, but at the same time the data indicates that our initial expectations of the extent of this downturn where a touch too negative. Even though we continue to expect slower growth into 2012, the recession should be a lighter one. In the following special we want to shed some light on why we have revised our eco-nomic expectations for CEE and especially for the CE region upwards. Why we expect the SEE region to remain rather subdued compared to CEE, and last but not least, we want to give a brief outlook of what to expect from the whole region in 2012.
Looking at high frequency indicators such as PMI manufacturing or economic sen-timent it seems that the negative expectations bottomed out at the end of 2011. There are clear signs of an improvement and thus we decided to increase our growth expectations for the Eurozone in 2012 from -1.0% to -0.5%. The increase in the economic growth outlook for Germany was crucially important (where we now expect stagnation rather than a recession) as it is the main trading partner for the CE countries. Germany accounts for 20-30% of total exports in the small open economies of the CE region and is by far the biggest export market. With the export sector currently the only source of growth, this importance cannot be stressed enough. This is one of our main arguments underpinning the improve-ment, especially in the CE GDP outlook.
CELooking at our growth expectations for the CE region it might seem as if the entire region will grow solidly in 2012, but we need to differentiate strongly between the different countries in the region. While Poland can rely on relatively strong do-mestic demand, solid investment growth besides the export sector, and it has less severe cuts in government spending to cope with, the story looks very different for the remaining CE countries. Rising unemployment rates are dampening domestic demand with Hungary and Slovenia probably suffering the most in 2012, while the Czech Republic and Slovakia are not likely to witness any stronger domestic demand recovery either. Looking at gross fixed capital formation (GFCF) the story is similar: Poland fell the least and recovered well from early 2010, as did Slova-kia to some extent. Hungary and Slovenia, however, are not showing comparable improvements in the same time-frame, and are unlikely to do so in 2012. That said, the growth projections in 2012 for Poland are solid, with Slovakia also likely to gain some momentum, especially in H2. The Czech Republic, however, should only see flat economic development due to the weak domestic demand and restric-tive fiscal policy. The downside potential seems to be the highest in Hungary and Slovenia, where only the export sector should prevent a deeper recession.
CEE growth revision – where is growth coming from?
Special - External debt in CEE
Household consumption (% yoy)
3-month moving averageSource: Central banks
Gross fixed capital formation (% yoy)
Government consumption (% yoy)
3-month moving averageSource: Central banks
3-month moving averageSource: Central banks
-8-6-4-202468
1012
Q3
2002
Q3
2003
Q3
2004
Q3
2005
Q3
2006
Q3
2007
Q3
2008
Q3
2009
Q3
2010
Q3
2011
Slovakia Poland HungaryCzech Rep. Slovenia
-30-25-20-15-10
-505
10152025
Q3
2002
Q3
2003
Q3
2004
Q3
2005
Q3
2006
Q3
2007
Q3
2008
Q3
2009
Q3
2010
Q3
2011
Slovakia Poland HungarySlovenia Czech Rep.
-8-6-4-202468
101214
Q3
2002
Q3
2003
Q3
2004
Q3
2005
Q3
2006
Q3
2007
Q3
2008
Q3
2009
Q3
2010
Q3
2011
Slovakia Poland HungaryCzech Rep. Slovenia
CE economy will remain export driven and profit most from the upward revision of the Eurozone SEE economies to show stagnation as domestic demand will remain subdued and main export partners are the troubled
southern Eurozone countries CIS to continue strongest economic performance, driven by high oil and commodity prices

112nd quarter 2012
xxSpecial - External debt in CEE
Household consumption (% yoy)
3-month moving averageSource: Central banks
Government consumption (% yoy)
Gross fixed capital formation (% yoy)
3-month moving averageSource: Central banks
3-month moving averageSource: Central banks
SEEWhile we have revised the GDP forecast for the CE region up considerably on the back of the improved outlook in the Eurozone, the SEE region remains more or less flat compared to our earlier expectations from Q1 2012. SEE has far fewer export ties to the stronger performing northern Eurozone countries (such as Ger-many) which have been revised upwards, but far more export links to troubled Eurozone countries in the south, such as Italy. Therefore, the region will continue to have to deal with the full blow of the Eurozone debt crisis via the export sector. Do-mestic demand has seen a comparable decline to most countries of the CE region after the financial crisis, household consumption as a pillar for economic growth has deteriorated considerably, and is not likely to improve in 2012 given the high unemployment and ongoing austerity. Government consumption will also remain hamstrung given the need of further austerity measures to reduce the budget defi-cits. GFCF did show some improvement according to the latest data, but the rate of improvement should remain low in 2012. Adding all this up the SEE region is profiting less from the upward revision of GDP in the northern Eurozone member states, and instead will have to deal with the pessimistic outlooks in the southern Eurozone member states. Therefore, we only expect stagnation in economic de-velopment in 2012.
CISCIS remains one of the best performing regions, where we expect the stronger development to last in 2012. While we were already rather optimistic on CIS before our last GDP revision, the latest economic indicators along with rising oil and commodity prices via the global economic recovery indicate that the region will grow even more strongly in 2012. Therefore, we have increased our GDP estimates from 3.1% to 3.7%. A vast portfolio of export partners as well as their commodity-driven economies have a positive impact on the region. The high oil price is currently supported by global growth, and hence Russia should continue to withstand the troubles surrounding the Eurozone. The Ukrainian as well as Be-larusian economies have closer ties to the Russian economy than to the Eurozone, shielding these economies to some extent from the slowing economic growth in the Eurozone.
All told, the economic indicators are stabilising in CEE, even though we predict the recession will get worse in H1 2012 before we see some improvement in the second half of 2012. However, a lot of these expectations depend on the export sector as the main source of growth in 2012 and therefore on the ability of the Eu-rozone to regain its growth momentum. Domestic as well as government demand will remain weak throughout almost the entire CEE region, with a few exceptions. Attracting investments into CEE will be the main objective to support the export-driven growth, but the success of this task will most likely be as varied across the different countries as their current economic situations.
Wolfgang Ernst
-20-15-10
-505
10152025
Q3
2005
Q2
2006
Q1
2007
Q4
2007
Q3
2008
Q2
2009
Q1
2010
Q4
2010
Q3
2011
Romania Croatia BulgariaRussia Ukraine
F t
-20-15-10
-505
10152025
Q3
2005
Q2
2006
Q1
2007
Q4
2007
Q3
2008
Q2
2009
Q1
2010
Q4
2010
Q3
2011
Croatia Bulgaria RomaniaRussia Ukraine
-70-60-50-40-30-20-10
010203040
Q3
2005
Q2
2006
Q1
2007
Q4
2007
Q3
2008
Q2
2009
Q1
2010
Q4
2010
Q3
2011
Romania Bulgaria CroatiaRussia Ukraine

12 2nd quarter 2012
Forecasts
The dark storm clouds that gathered over the Austrian economy in the autumn held nothing more than a brief rain shower. Although real gross domestic product contracted in the fourth quarter of 2011 compared to the previous quarter (-0.1% qoq), the feared sharp decline is now not likely to come.
The looming slowdown in international economic activity became apparent rela-tively early. Crucial leading indicators for example (purchasing manager index for manufacturing and the economic sentiment index of the European Commission) reached their cyclical highs in early 2011 before starting to head sharply down-wards. However, the situation stabilised again in the autumn. This gloomier pic-ture was also reflected in hard economic data, with real GDP growth in the third quarter of 2011 amounting to just 0.2% qoq (Q1: +0.9% qoq, Q2: +0.5% qoq). This means the impressive annual growth rate of 3.1% yoy in 2011 is largely attributable to the positive developments in the first two quarters. Exports were strong in this respect, along with investment activity to a slightly lesser extent. The latter proved to be comparatively robust in Q3 and Q4 2011, whereas exports contracted in both of these three-month periods.
The Austrian economy is set to weaken in the first quarter of this year as well, but then the worst part should be over. This is because the remaining quarters should post positive, although not stunning rates of growth, resulting in an expected growth rate of real GDP in 2012 of +0.3% yoy. For the following year (2013) we expect real GDP growth of +1.3% yoy.
Investments and external trade should be a drag on economic activity in the first quarter, though investments are likely to contract to a lesser extent. This is because confidence in industry has already moved far away from its cyclical low recorded in November. What is more, capacity utilisation has stabilised slightly below its
long-term average. While private con-sumption did not weaken in the sec-ond half of the year, it was not overly dynamic either. Retail sales have been rather unsatisfactory of late, while consumer confidence is currently also at a low level. But if we manage to avoid any unexpected inflation hikes – resulting from a higher than expected oil price for example –, private con-sumption should gain some momentum in the course of the year. This view is supported not least by the low unem-ployment rate and the encouraging employment trends.
Slowdown, but no setback
Austria
Inflation has already peaked
Source: Thomson Reuters, Statistics Austria, Raiffeisen RESEARCH
Industrial sector bottomed out
Source: Thomson Reuters, Raiffeisen RESEARCH
Key economic figures and forecasts
2010 2011 2012e 2013fReal GDP (% yoy) 2.3 3.1 0.3 1.3
Private consumption (% yoy) 2.2 0.6 0.9 1.3
Gross fixed capital formation (% yoy) 0.1 5.7 1.1 2.2
Nominal exports (% yoy) 10.1 10.5 1.8 5.7
Nominal imports (% yoy) 9.8 10.8 2.1 5.6
Trade balance (EUR bn) 12.3 9.0 8.7 9.3
Current account balance (EUR bn) 8.5 5.9 8.0 8.3
General budget balance (EUR bn)* -12.9 -7.8 -9.6 -7.0
General budget balance (% of GDP)* -4.5 -2.6 -3.1 -2.2
Unemployment rate (avg, %, EU definition) 4.4 4.2 4.3 4.2
Consumer prices (avg, % yoy) 1.7 3.6 2.3 2.0
Real wages (% yoy) -1.2 -1.0 0.9 0.8
Unit labour costs (% yoy) 0.0 1.3 3.4 2.3* state, provinces, municipalities and social security authoritiesSource: Statistics Austria, Thomson Reuters, Raiffeisen RESEARCH
Feared downturn in economic activity will not materialise Weak first quarter should be low point, external trade and investments to blame Inflation has already peaked, further declines likely The government’s austerity package is a first step, nothing more
-8
-6
-4
-2
0
2
4
6
8
Jan-09 Oct-09 Jul-10 Apr-11 Jan-12
Inflation (HICP, % yoy)Inflation perception (goods of weekly use, % yoy)
-50
-40
-30
-20
-10
0
10
20
30
2001 2003 2005 2007 2009 201175
77
79
81
83
85
87
89
91
Industrial production (% yoy)Industrial confidenceCapacity utilisation (%, r.h.s.)

132nd quarter 2012
The dynamic inflation trend recorded last year has already peaked (HICP in September: +3.9% yoy). This devel-opment was driven first and foremost by transport, housing as well as res-taurants and hotels. Pressure on prices has faded noticeably since the start of the year, which is in no small part owed to the much lower contribution of transport to inflation. Consumer prices (HICP) in February, for example, in-creased by only 2.6% yoy. In spite of the elevated oil price, inflation is set to fall in the coming months as the base effects, which led to a sharp increase in the HICP in the early months of last year, expire (inflation forecast 2012: 2.3% yoy).
The recently announced measures to consolidate the budget mean that sov-ereign debt should fall from 72.2% of GDP (2011) to 70.0% of GDP (2016). Having said that, the measures total-ling EUR 27.9 bn by 2016 are subject to a high degree of uncertainty. For ex-ample, the envisaged tax agreement with Switzerland and the planned rev-enues from a financial transaction tax yet to be introduced are anything but certain. Moreover, the reform package is missing genuine structural reforms – first and foremost in the areas of pen-sions and healthcare. Such reforms are necessary, however, in order to ensure the long-term sustainability of public finances.
Matthias Reith
xxAustria
GDP: expenditure composition
Change (% yoy, in real terms) 2010 2011 2012e 2013f
Private consumption 2.2 0.6 0.9 1.3
Public consumption -0.2 2.7 0.6 0.1
Gross fixed capital formation 0.1 5.7 1.1 2.2
Equipment 4.3 8.6 2.3 4.2
Construction -2.9 2.7 0.0 0.5
Exports (broad definition) 8.3 6.7 -0.5 3.7
Imports (broad definition) 8.0 7.0 -0.2 3.5
Gross domestic product 2.3 3.1 0.3 1.3Source: Statistics Austria, Raiffeisen RESEARCH
GDP: value added by sector
Change (% yoy, in real terms) 2010 2011 2012e 2013f
Agriculture & forestry -5.5 4.1 0.0 0.0
Prod. of goods/mining 7.2 9.9 0.5 4.0
Energy/water supply 3.8 10.3 3.0 1.5
Construction -3.0 2.7 0.0 0.5
Wholesale and retail trade 3.1 0.1 1.2 1.5
Transportation -1.1 2.9 -3.0 1.0
Accom. & restaurant trade 1.8 -0.5 0.0 1.5
Information and communication -3.7 -1.5 -1.0 2.0
Credit and insurance 6.9 6.0 1.5 2.0
Property & business services -0.6 -0.1 1.5 1.5
Other economic services 5.0 2.8 1.0 1.5
Public sector 0.0 0.0 -0.1 -0.1
Healthcare, social services 0.6 1.7 0.0 0.7
Other services 1.7 0.5 0.0 0.5
Gross domestic product 2.3 3.1 0.3 1.3Source: Statistics Austria, Raiffeisen RESEARCH
Budget consolidation: Even 2016 gross debt not below 70%!
*For 2011 no breakdown into structural and cyclical budget balance available yetSource: European Commission, Ministry of Finance, Raiffeisen RESEARCH
70.0
74.4
-5
-4
-3
-2
-1
0
1
22000 2002 2004 2006 2008 2010 2012f 2014f 2016f
50
55
60
65
70
75
80
85
Structural budget balance (% GDP) Cyclical budget balance (% GDP)Gross debt (% GDP)
Governmentforecast
*
14 2nd quarter 2012
0
1
2
3
4
5
6
7
2007
2008
2009
2010
2011
2012
e
2013
f -5
-3
0
3
5
8
10
Real GDP (% yoy)Industrial output (% yoy, r.h.s.)
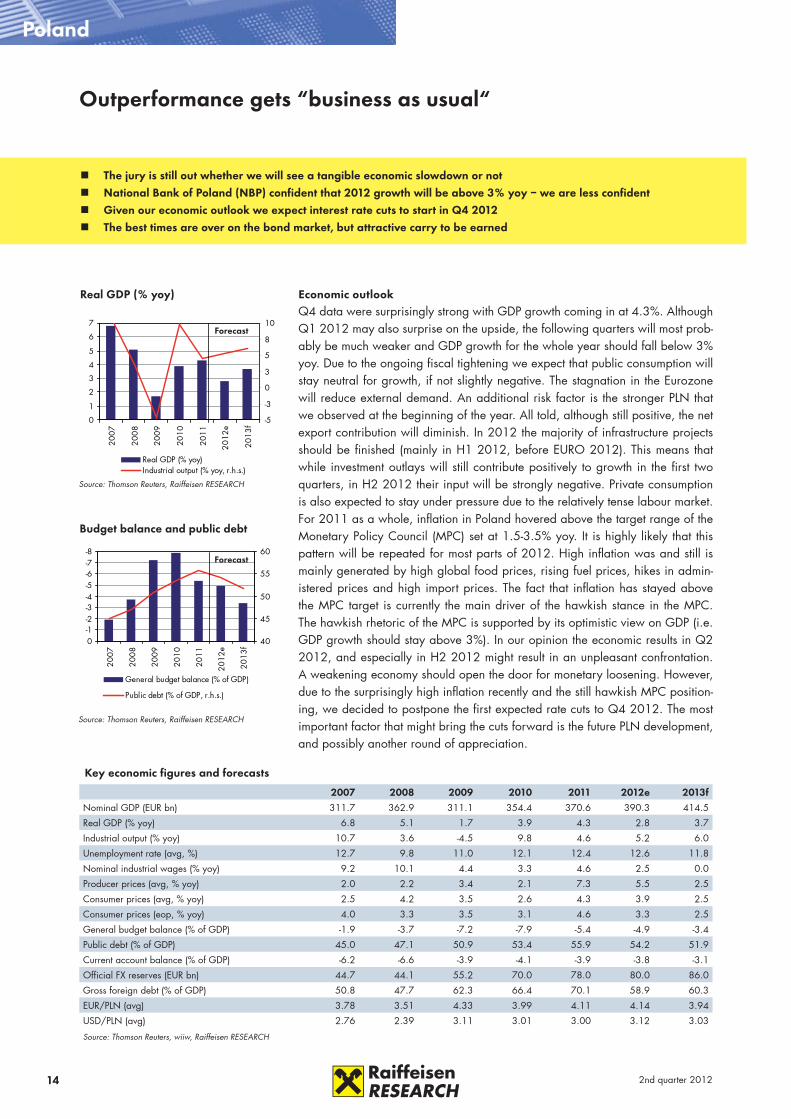
Real GDP (% yoy)
Source: Thomson Reuters, Raiffeisen RESEARCH
Poland
Outperformance gets “business as usual“
-8-7-6-5-4-3-2-10
2007
2008
2009
2010
2011
2012
e
2013
f 40
45
50
55
60
General budget balance (% of GDP)
Public debt (% of GDP, r.h.s.)
Budget balance and public debt
Source: Thomson Reuters, Raiffeisen RESEARCH
Forecast
Key economic figures and forecasts
2007 2008 2009 2010 2011 2012e 2013fNominal GDP (EUR bn) 311.7 362.9 311.1 354.4 370.6 390.3 414.5
Real GDP (% yoy) 6.8 5.1 1.7 3.9 4.3 2.8 3.7
Industrial output (% yoy) 10.7 3.6 -4.5 9.8 4.6 5.2 6.0
Unemployment rate (avg, %) 12.7 9.8 11.0 12.1 12.4 12.6 11.8
Nominal industrial wages (% yoy) 9.2 10.1 4.4 3.3 4.6 2.5 0.0
Producer prices (avg, % yoy) 2.0 2.2 3.4 2.1 7.3 5.5 2.5
Consumer prices (avg, % yoy) 2.5 4.2 3.5 2.6 4.3 3.9 2.5
Consumer prices (eop, % yoy) 4.0 3.3 3.5 3.1 4.6 3.3 2.5
General budget balance (% of GDP) -1.9 -3.7 -7.2 -7.9 -5.4 -4.9 -3.4
Public debt (% of GDP) 45.0 47.1 50.9 53.4 55.9 54.2 51.9
Current account balance (% of GDP) -6.2 -6.6 -3.9 -4.1 -3.9 -3.8 -3.1
Official FX reserves (EUR bn) 44.7 44.1 55.2 70.0 78.0 80.0 86.0
Gross foreign debt (% of GDP) 50.8 47.7 62.3 66.4 70.1 58.9 60.3
EUR/PLN (avg) 3.78 3.51 4.33 3.99 4.11 4.14 3.94
USD/PLN (avg) 2.76 2.39 3.11 3.01 3.00 3.12 3.03
Source: Thomson Reuters, wiiw, Raiffeisen RESEARCH
Forecast
Economic outlookQ4 data were surprisingly strong with GDP growth coming in at 4.3%. Although Q1 2012 may also surprise on the upside, the following quarters will most prob-ably be much weaker and GDP growth for the whole year should fall below 3% yoy. Due to the ongoing fiscal tightening we expect that public consumption will stay neutral for growth, if not slightly negative. The stagnation in the Eurozone will reduce external demand. An additional risk factor is the stronger PLN that we observed at the beginning of the year. All told, although still positive, the net export contribution will diminish. In 2012 the majority of infrastructure projects should be finished (mainly in H1 2012, before EURO 2012). This means that while investment outlays will still contribute positively to growth in the first two quarters, in H2 2012 their input will be strongly negative. Private consumption is also expected to stay under pressure due to the relatively tense labour market. For 2011 as a whole, inflation in Poland hovered above the target range of the Monetary Policy Council (MPC) set at 1.5-3.5% yoy. It is highly likely that this pattern will be repeated for most parts of 2012. High inflation was and still is mainly generated by high global food prices, rising fuel prices, hikes in admin-istered prices and high import prices. The fact that inflation has stayed above the MPC target is currently the main driver of the hawkish stance in the MPC. The hawkish rhetoric of the MPC is supported by its optimistic view on GDP (i.e. GDP growth should stay above 3%). In our opinion the economic results in Q2 2012, and especially in H2 2012 might result in an unpleasant confrontation. A weakening economy should open the door for monetary loosening. However, due to the surprisingly high inflation recently and the still hawkish MPC position-ing, we decided to postpone the first expected rate cuts to Q4 2012. The most important factor that might bring the cuts forward is the future PLN development, and possibly another round of appreciation.
The jury is still out whether we will see a tangible economic slowdown or not National Bank of Poland (NBP) confident that 2012 growth will be above 3% yoy – we are less confident Given our economic outlook we expect interest rate cuts to start in Q4 2012 The best times are over on the bond market, but attractive carry to be earned
152nd quarter 2012
4.5
4.8
5.0
5.3
5.5
5.8
6.0
0 1 2 3 4 5 6 7 8 9 10
Yields as of Mar-12Yield curve Mar-12Yield curve Dec-11Forecast Jun-12
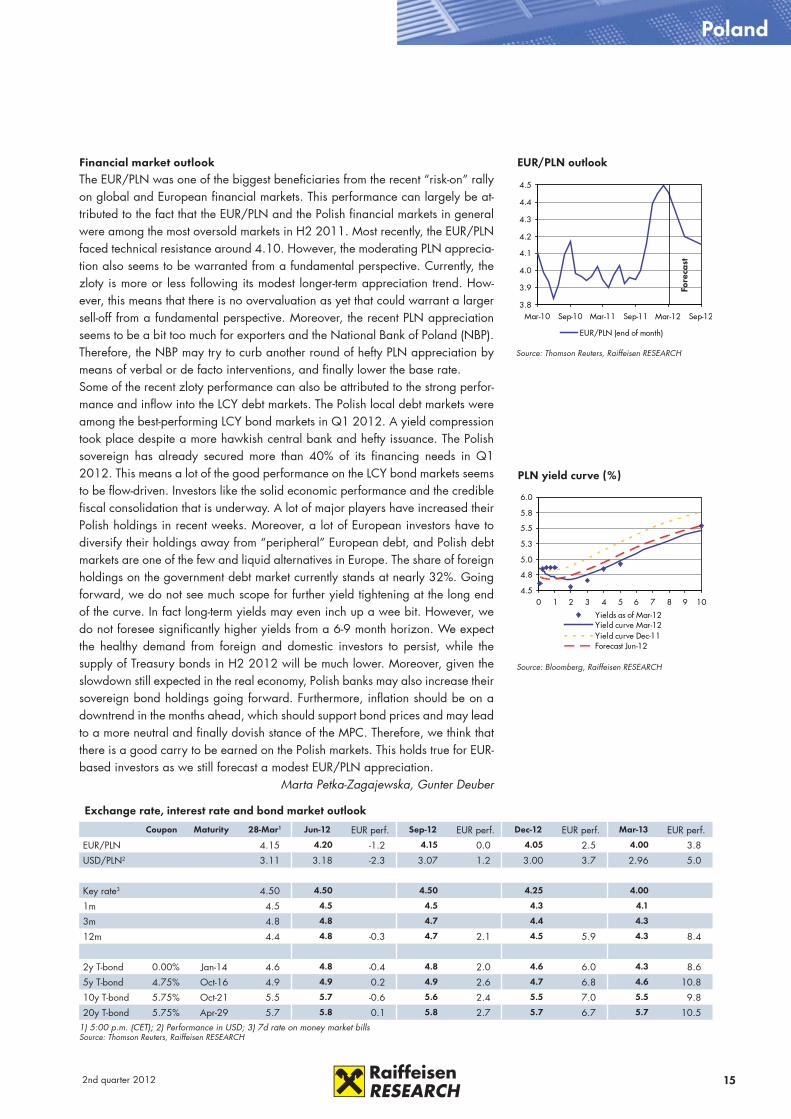
3.8
3.9
4.0
4.1
4.2
4.3
4.4
4.5
Mar-10 Sep-10 Mar-11 Sep-11 Mar-12 Sep-12
EUR/PLN (end of month)
Poland
EUR/PLN outlook
Source: Thomson Reuters, Raiffeisen RESEARCH
PLN yield curve (%)
Source: Bloomberg, Raiffeisen RESEARCH
Exchange rate, interest rate and bond market outlook
Coupon Maturity 28-Mar1 Jun-12 EUR perf. Sep-12 EUR perf. Dec-12 EUR perf. Mar-13 EUR perf.
EUR/PLN 4.15 4.20 -1.2 4.15 0.0 4.05 2.5 4.00 3.8
USD/PLN2 3.11 3.18 -2.3 3.07 1.2 3.00 3.7 2.96 5.0
Key rate3 4.50 4.50 4.50 4.25 4.00
1m 4.5 4.5 4.5 4.3 4.1
3m 4.8 4.8 4.7 4.4 4.3
12m 4.4 4.8 -0.3 4.7 2.1 4.5 5.9 4.3 8.4
2y T-bond 0.00% Jan-14 4.6 4.8 -0.4 4.8 2.0 4.6 6.0 4.3 8.6
5y T-bond 4.75% Oct-16 4.9 4.9 0.2 4.9 2.6 4.7 6.8 4.6 10.8
10y T-bond 5.75% Oct-21 5.5 5.7 -0.6 5.6 2.4 5.5 7.0 5.5 9.8
20y T-bond 5.75% Apr-29 5.7 5.8 0.1 5.8 2.7 5.7 6.7 5.7 10.51) 5:00 p.m. (CET); 2) Performance in USD; 3) 7d rate on money market billsSource: Thomson Reuters, Raiffeisen RESEARCH
Fore
cast
Financial market outlookThe EUR/PLN was one of the biggest beneficiaries from the recent “risk-on” rally on global and European financial markets. This performance can largely be at-tributed to the fact that the EUR/PLN and the Polish financial markets in general were among the most oversold markets in H2 2011. Most recently, the EUR/PLN faced technical resistance around 4.10. However, the moderating PLN apprecia-tion also seems to be warranted from a fundamental perspective. Currently, the zloty is more or less following its modest longer-term appreciation trend. How-ever, this means that there is no overvaluation as yet that could warrant a larger sell-off from a fundamental perspective. Moreover, the recent PLN appreciation seems to be a bit too much for exporters and the National Bank of Poland (NBP). Therefore, the NBP may try to curb another round of hefty PLN appreciation by means of verbal or de facto interventions, and finally lower the base rate.Some of the recent zloty performance can also be attributed to the strong perfor-mance and inflow into the LCY debt markets. The Polish local debt markets were among the best-performing LCY bond markets in Q1 2012. A yield compression took place despite a more hawkish central bank and hefty issuance. The Polish sovereign has already secured more than 40% of its financing needs in Q1 2012. This means a lot of the good performance on the LCY bond markets seems to be flow-driven. Investors like the solid economic performance and the credible fiscal consolidation that is underway. A lot of major players have increased their Polish holdings in recent weeks. Moreover, a lot of European investors have to diversify their holdings away from “peripheral” European debt, and Polish debt markets are one of the few and liquid alternatives in Europe. The share of foreign holdings on the government debt market currently stands at nearly 32%. Going forward, we do not see much scope for further yield tightening at the long end of the curve. In fact long-term yields may even inch up a wee bit. However, we do not foresee significantly higher yields from a 6-9 month horizon. We expect the healthy demand from foreign and domestic investors to persist, while the supply of Treasury bonds in H2 2012 will be much lower. Moreover, given the slowdown still expected in the real economy, Polish banks may also increase their sovereign bond holdings going forward. Furthermore, inflation should be on a downtrend in the months ahead, which should support bond prices and may lead to a more neutral and finally dovish stance of the MPC. Therefore, we think that there is a good carry to be earned on the Polish markets. This holds true for EUR-based investors as we still forecast a modest EUR/PLN appreciation.
Marta Petka-Zagajewska, Gunter Deuber

16 2nd quarter 2012
-8
-6
-4
-2
0
2
4
2007
2008
2009
2010
2011
2012
e
2013
f -24
-18
-12
-6
0
6
12
Real GDP (% yoy)Industrial output (% yoy, r.h.s.)
-8
-6
-4
-2
0
2
4
2007
2008
2009
2010
2011
2012
e
2013
f -4
-2
0
2
4
6
8
Current account (% of GDP)
Net FDI (% of GDP, r.h.s.)
Real GDP (% yoy)
Source: Thomson Reuters, Raiffeisen RESEARCH
Hungary
Light recession ahead
Current account and FDI inflows
Source: Thomson Reuters, Raiffeisen RESEARCH
Forecast
Forecast
Key economic figures and forecasts
2007 2008 2009 2010 2011 2012e 2013fNominal GDP (EUR bn) 99.4 105.5 91.5 97.2 100.8 99.3 105.5
Real GDP (% yoy) 0.1 0.9 -6.8 1.3 1.7 -0.5 1.5
Industrial output (% yoy) 7.9 0.0 -17.8 10.6 5.4 2.0 3.0
Unemployment rate (avg, %) 7.5 7.8 9.8 11.1 11.0 11.4 11.0
Nominal industrial wages (% yoy) 8.4 6.5 3.8 5.5 6.2 9.3 4.3
Producer prices (avg, % yoy) 0.1 5.1 4.9 4.5 4.3 6.4 2.6
Consumer prices (avg, % yoy) 8.0 6.1 4.2 4.9 3.9 5.5 3.5
Consumer prices (eop, % yoy) 7.4 3.5 5.6 4.7 4.1 5.0 3.4
General budget balance (% of GDP) -5.1 -3.7 -4.6 -4.2 0.0 -3.4 -3.4
Public debt (% of GDP) 67.0 72.9 79.7 81.3 82.7 80.7 79.9
Current account balance (% of GDP) -6.6 -7.1 0.3 1.1 1.6 1.8 1.0
Official FX reserves (EUR bn) 16.0 24.0 30.0 33.7 37.8 39.6 40.7
Gross foreign debt (% of GDP) 103.2 116.1 146.6 139.4 132.9 133.9 125.1
EUR/HUF (avg) 251.3 250.8 280.1 275.5 279.3 290.5 285.0
USD/HUF (avg) 183.3 170.5 200.9 207.7 203.9 218.8 219.2
Source: Thomson Reuters, wiiw, Raiffeisen RESEARCH
Economic outlook2011 GDP growth (1.7%) was driven by the above-average output of agriculture and strong manufacturing exports facilitated by the benign external environment. Expansionary fiscal policy was unable to ignite local demand.In 2012 we expect no growth in the export markets and a massively restrictive fiscal stance. After last year’s performance, any plus from agriculture would be a nice surprise. Apart from the booming car industry (new plants of Mercedes, Audi and GM/Opel) we still cannot identify any growth. Still, the car industry is helping manufacturing and exports remain in the black. Real household income is unlikely to increase, and the labour market is expected to stagnate – at best. Therefore, we do not expect any household consumption growth. Public services will be cut, and private services are likely to be in the red too (especially financial services). No recovery is yet due in the construction industry, and we expect a recession in 2012 (GDP -0.5%). Fiscal austerity is quite tangible in 2012. The government is proceeding with structural reforms and there is a wide range of tax hikes (VAT hike; excise duty hike; abolition of the system of personal income tax deduction, etc.). Current fis-cal austerity aims to improve the budget balance by over 3% of GDP. Still, it is likely that additional measures will be needed to reach the budget deficit target of below 3%. The big issue, however, is the 2013 budget: how to fill the budget gap caused by the diminishing crisis and banking tax receipts (approximately 1% of GDP)? If the government is able to give a proper (i.e. orthodox) answer to this, then Hungary may exit the EDP procedure and sign the new IMF loan agreement with relative ease. The bad news is that there are no painless solu-tions. Further fiscal measures would certainly weigh down on Hungary’s growth prospects for 2013 (and potentially damage the popularity of the governing party). Short-term and long-term views conflict with each other, while economics conflicts with politics.
2012 should bring no economic growth and a massively restrictive fiscal stance Government is proceeding with structural reforms and a wide range of tax hikes IMF and EU agreement would mean an end to unorthodox measures in the medium term Forint and yields showed strong volatility, more stability expected after an IMF/EU agreement
172nd quarter 2012
Hungary
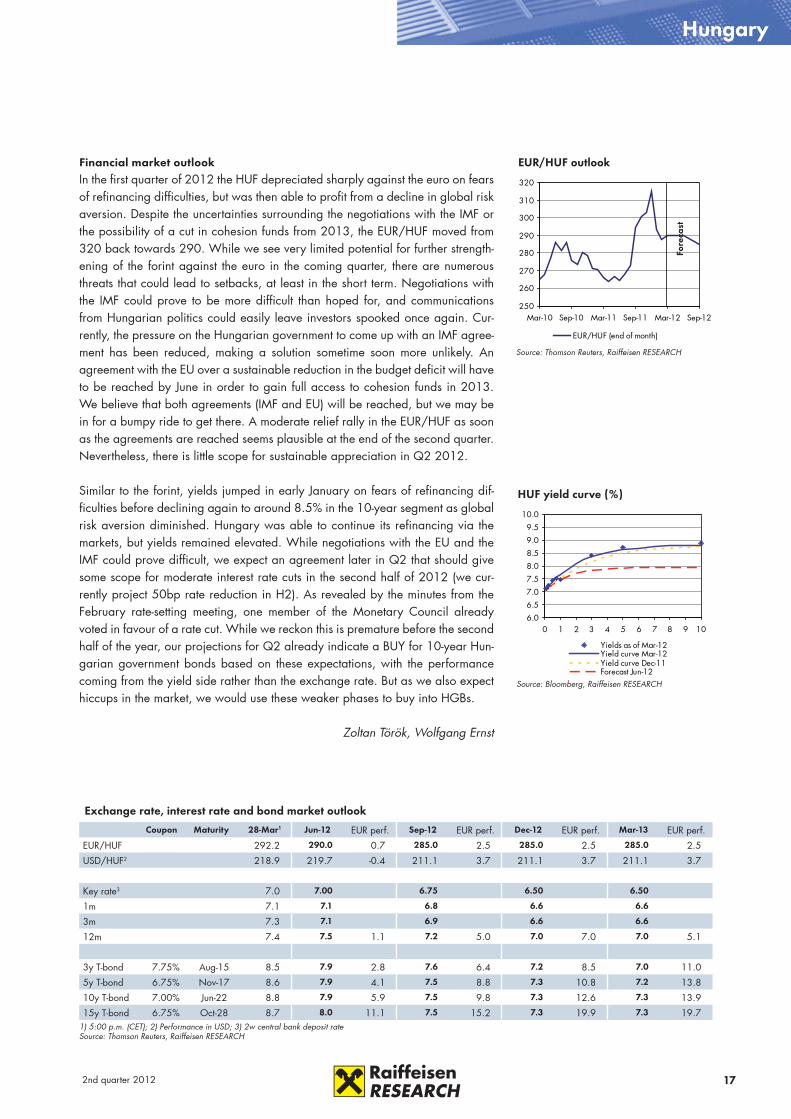
250
260
270
280
290
300
310
320
Mar-10 Sep-10 Mar-11 Sep-11 Mar-12 Sep-12
EUR/HUF (end of month)
EUR/HUF outlook
Source: Thomson Reuters, Raiffeisen RESEARCH
6.0
6.5
7.0
7.5
8.0
8.5
9.0
9.5
10.0
0 1 2 3 4 5 6 7 8 9 10
Yields as of Mar-12Yield curve Mar-12Yield curve Dec-11Forecast Jun-12
HUF yield curve (%)
Source: Bloomberg, Raiffeisen RESEARCH
Financial market outlookIn the first quarter of 2012 the HUF depreciated sharply against the euro on fears of refinancing difficulties, but was then able to profit from a decline in global risk aversion. Despite the uncertainties surrounding the negotiations with the IMF or the possibility of a cut in cohesion funds from 2013, the EUR/HUF moved from 320 back towards 290. While we see very limited potential for further strength-ening of the forint against the euro in the coming quarter, there are numerous threats that could lead to setbacks, at least in the short term. Negotiations with the IMF could prove to be more difficult than hoped for, and communications from Hungarian politics could easily leave investors spooked once again. Cur-rently, the pressure on the Hungarian government to come up with an IMF agree-ment has been reduced, making a solution sometime soon more unlikely. An agreement with the EU over a sustainable reduction in the budget deficit will have to be reached by June in order to gain full access to cohesion funds in 2013. We believe that both agreements (IMF and EU) will be reached, but we may be in for a bumpy ride to get there. A moderate relief rally in the EUR/HUF as soon as the agreements are reached seems plausible at the end of the second quarter. Nevertheless, there is little scope for sustainable appreciation in Q2 2012.
Similar to the forint, yields jumped in early January on fears of refinancing dif-ficulties before declining again to around 8.5% in the 10-year segment as global risk aversion diminished. Hungary was able to continue its refinancing via the markets, but yields remained elevated. While negotiations with the EU and the IMF could prove difficult, we expect an agreement later in Q2 that should give some scope for moderate interest rate cuts in the second half of 2012 (we cur-rently project 50bp rate reduction in H2). As revealed by the minutes from the February rate-setting meeting, one member of the Monetary Council already voted in favour of a rate cut. While we reckon this is premature before the second half of the year, our projections for Q2 already indicate a BUY for 10-year Hun-garian government bonds based on these expectations, with the performance coming from the yield side rather than the exchange rate. But as we also expect hiccups in the market, we would use these weaker phases to buy into HGBs.
Zoltan Török, Wolfgang Ernst
Exchange rate, interest rate and bond market outlook
Coupon Maturity 28-Mar1 Jun-12 EUR perf. Sep-12 EUR perf. Dec-12 EUR perf. Mar-13 EUR perf.
EUR/HUF 292.2 290.0 0.7 285.0 2.5 285.0 2.5 285.0 2.5
USD/HUF2 218.9 219.7 -0.4 211.1 3.7 211.1 3.7 211.1 3.7
Key rate3 7.0 7.00 6.75 6.50 6.50
1m 7.1 7.1 6.8 6.6 6.6
3m 7.3 7.1 6.9 6.6 6.6
12m 7.4 7.5 1.1 7.2 5.0 7.0 7.0 7.0 5.1
3y T-bond 7.75% Aug-15 8.5 7.9 2.8 7.6 6.4 7.2 8.5 7.0 11.0
5y T-bond 6.75% Nov-17 8.6 7.9 4.1 7.5 8.8 7.3 10.8 7.2 13.8
10y T-bond 7.00% Jun-22 8.8 7.9 5.9 7.5 9.8 7.3 12.6 7.3 13.9
15y T-bond 6.75% Oct-28 8.7 8.0 11.1 7.5 15.2 7.3 19.9 7.3 19.71) 5:00 p.m. (CET); 2) Performance in USD; 3) 2w central bank deposit rateSource: Thomson Reuters, Raiffeisen RESEARCH
Fore
cast

18 2nd quarter 2012
-6
-4
-2
0
2
4
6
8
2007
2008
2009
2010
2011
2012
e
2013
f -15
-10
-5
0
5
10
15
20
Real GDP (% yoy)Industrial output (% yoy, r.h.s.)
Czech Republic
-7
-6-5
-4
-3
-2-1
0
2007
2008
2009
2010
2011
2012
e
2013
f 0
1020
30
40
5060
70
General budget balance (% of GDP)
Public debt (% of GDP, r.h.s.)
Real GDP (% yoy)
Source: Thomson Reuters, Raiffeisen RESEARCH
Economic outlookThe Czech economy slipped into a mild recession in H2 2012 as it contracted by 0.1% qoq in Q3 and Q4. The annual growth of GDP reached 1.7% in 2011. The decline in Q4 was driven by falling investment (mainly inventories) and government consumption. Household consumption remained flat. The VAT hike from January came as a one-off boost to retail sales and construction in Q4. The only positive driver of GDP was net exports. In other words, the weak domestic demand was the cause of the recession. We expect the recession to deepen in Q1 because these one-time factors will mainly reduce household consumption. The way we see it, GDP should decline by 0.4% qoq in Q1. The situation should stabilise at the end of H1 or at the beginning of H2, mainly thanks to an improve-ment in external demand. A recovery is now visible in new industrial orders. As a result we forecast an annual decline of the Czech economy by 0.2% in 2012.Due to the VAT hike, CPI inflation rose to 3.5% yoy in January. However, funds obtained from the VAT hike are apparently insufficient to achieve the 2012 fiscal target (deficit of 3.2% of GDP) and further expenditure cuts will be necessary throughout the year. To achieve the fiscal targets after 2012 the Czech gov-ernment is considering implementing other VAT hikes in 2013. The most likely strategy, at this moment, is to raise both rates by one percentage point to 21% and 15% respectively. This would nudge inflation again, and thus inflation would remain above the inflation target of 2% even in 2013. Another measure consid-ered is freezing pensions, which would reduce the weak domestic demand even further.The new president will be elected by a ballot at the beginning of 2013. In the autumn of 2012 the leftist opposition has a good chance of remaining in power in some regions due to the general dissatisfaction with austerity measures of the central government.
Economic weakness in the first half of 2012
Budget balance and public debt
Source: Thomson Reuters, Raiffeisen RESEARCH
Forecast
Forecast
Key economic figures and forecasts
2007 2008 2009 2010 2011 2012e 2013fNominal GDP (EUR bn) 132.2 154.2 141.5 149.2 154.9 156.9 169.7
Real GDP (% yoy) 5.7 3.1 -4.7 2.7 1.7 -0.2 1.4
Industrial output (% yoy) 9.0 0.4 -13.4 10.1 6.9 -0.9 1.9
Unemployment rate (avg, %) 6.6 5.4 8.1 9.0 8.5 8.9 9.1
Nominal industrial wages (% yoy) 7.2 8.1 3.5 3.7 4.4 3.0 3.8
Producer prices (avg, % yoy) 4.1 4.5 -3.1 1.2 5.6 2.7 2.2
Consumer prices (avg, % yoy) 2.8 6.3 1.0 1.5 1.9 3.0 2.2
Consumer prices (eop, % yoy) 5.4 3.6 1.0 2.3 2.4 2.5 2.0
General budget balance (% of GDP) -0.7 -2.2 -5.8 -4.8 -4.4 -3.7 -3.4
Public debt (% of GDP) 29.0 28.7 34.4 37.6 41.1 43.6 45.2
Current account balance (% of GDP) -4.3 -2.1 -2.4 -3.9 -2.9 -2.2 -2.3
Official FX reserves (EUR bn) 23.7 26.6 28.9 31.8 31.1 32.0 34.0
Gross foreign debt (% of GDP) 39.1 38.7 43.7 47.9 48.9 47.4 47.9
EUR/CZK (avg) 27.7 24.9 26.4 25.3 24.6 24.5 23.5
USD/CZK (avg) 20.2 17.0 19.0 19.1 17.9 18.5 18.1
Source: Thomson Reuters, wiiw, Raiffeisen RESEARCH
Czech economy in technical recession, recovery expected in H2 More VAT hikes possible in 2013 Czech crown showing strong appreciation in Q1 2012, sideways movement expected in Q2 No change in interest rates expected over the next 12 months

192nd quarter 2012
Czech Republic
23.0
23.5
24.0
24.5
25.0
25.5
26.0
Mar-10 Sep-10 Mar-11 Sep-11 Mar-12 Sep-12
EUR/CZK (end of month)
EUR/CZK outlook
Source: Thomson Reuters, Raiffeisen RESEARCH
0.00.51.01.52.02.53.03.54.04.5
0 1 2 3 4 5 6 7 8 9 10
Yields as of Mar-12Yield curve Mar-12Yield curve Dec-11Forecast Jun-12
CZK yield curve (%)
Source: Bloomberg, Raiffeisen RESEARCH
Financial market outlookIn the first quarter of 2012 the Czech crown more than met our expectations. Against the euro the Czech koruna appreciated to 24.40 from almost 26.0 at the beginning of 2012. The faster than expected appreciation can mostly be explained by the fall in risk aversion after the adoption of the LTROs by the ECB. Our baseline view on the Czech currency, however, remains unchanged. Funda-mentally, the CZK-EUR convergence story still has some way to go. Nevertheless, in the short-term the sudden rises and falls of risk aversion might significantly influence the path of the EUR/CZK.As the outlook on the economy improved this year and inflation started a bit higher in 2012, the chances of an interest rate cut have diminished. On the other hand, some board members have started to talk about a possible need to increase interest rates in the foreseeable future. As mentioned, we expect the CZK will appreciate more in H2. We assume that the ECB will leave interest rates unchanged over the next 12 months. The Czech economy will be driven by ex-ports and just a gradual rise of investments. Domestic demand will probably be subdued throughout 2012-2013 as fiscal policy will be restrictive. All in all we do not expect any change in the CNB key interest rate over the next 12 months.In Q1 2012, Czech government bond yields moved sideways, justifying our neutral recommendation on Czech government bonds. The Ministry of Finance essentially has no problems placing domestic bonds. In February the Ministry successfully sold EUR 2.0 bn. The net borrowing requirement decreased to about CZK142 bn in 2011 and for 2012 the Ministry expects CZK 107.2 bn. The central government budget deficit is expected to reach CZK105 bn this year. The gross borrowing requirement is likely to reach CZK 243.4 bn which is slightly lower than in 2011. Assuming the debt crisis in the Eurozone does not escalate anew, the Ministry should not have any problems securing all its requirements for 2012. In our baseline scenario we expect a gradual decrease in the spread between Czech government bonds and the German benchmark. For the second quarter of 2012 our recommendation remains hold.
Pavel Mertlik, Michal Brozka
Exchange rate, interest rate and bond market outlook
Coupon Maturity 28-Mar1 Jun-12 EUR perf. Sep-12 EUR perf. Dec-12 EUR perf. Mar-13 EUR perf.
EUR/CZK 24.7 24.7 -0.2 24.4 1.1 23.8 3.6 23.6 4.5
USD/CZK2 18.5 18.7 -0.9 18.1 2.6 17.6 5.2 17.5 6.1
Key rate3 0.8 0.75 0.75 0.75 0.75
1m 0.6 0.7 0.7 0.7 0.7
3m 0.9 0.8 0.8 0.8 0.8
12m 1.1 1.4 0.1 1.4 1.7 1.4 4.6 1.4 5.9
2y T-bond 2.75% Mar-14 1.5 1.3 0.6 1.4 2.0 1.5 4.9 1.7 3.5
5y T-bond 4.00% Apr-17 2.4 2.2 1.2 2.1 3.4 2.2 6.6 2.4 7.7
10y T-bond 3.85% Sep-21 3.4 3.5 -0.2 3.4 2.7 3.5 5.4 3.6 6.5
15y T-bond 5.70% May-24 3.7 3.7 0.7 3.7 2.9 3.8 5.6 3.9 6.61) 5:00 p.m. (CET); 2) Performance in USD, 3) 2w repo rateSource: Thomson Reuters, Raiffeisen RESEARCH
Fore
cast
20 2nd quarter 2012
Slovakia
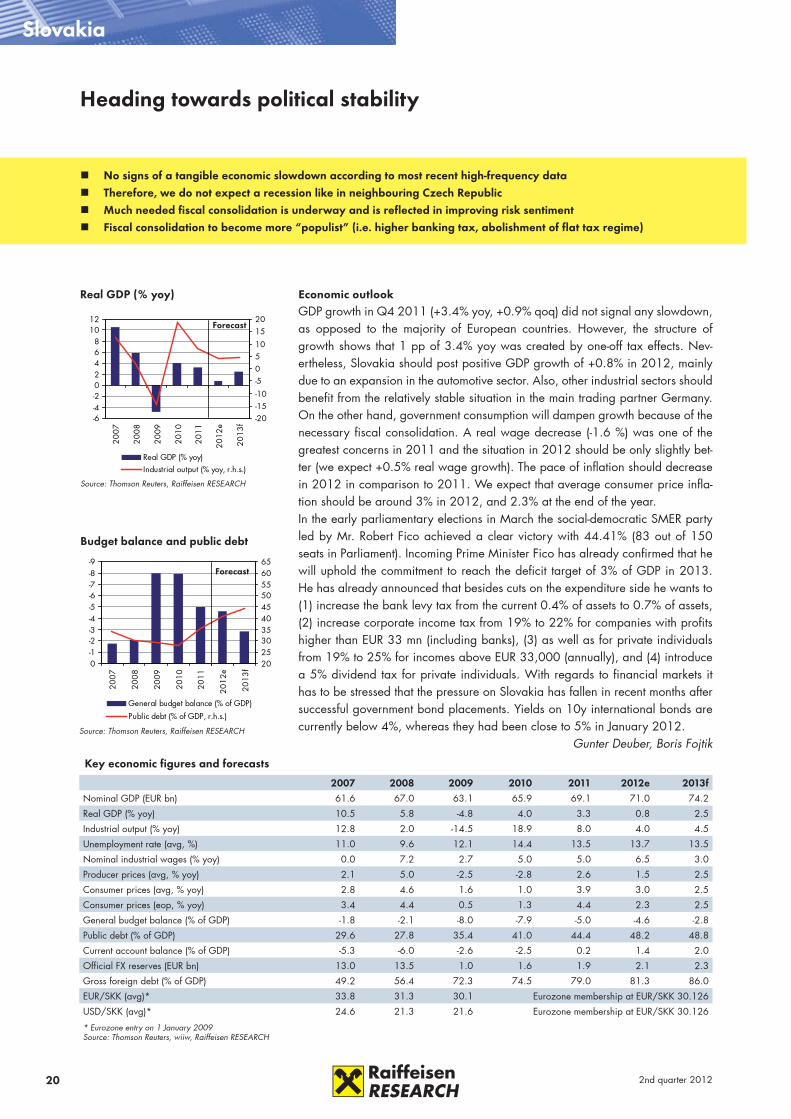
-9-8-7-6-5-4-3-2-10
2007
2008
2009
2010
2011
2012
e
2013
f 20253035404550556065
General budget balance (% of GDP)
Public debt (% of GDP, r.h.s.)
Source: Thomson Reuters, Raiffeisen RESEARCH
Budget balance and public debt
Source: Thomson Reuters, Raiffeisen RESEARCH
Forecast
-6-4-202468
1012
2007
2008
2009
2010
2011
2012
e
2013
f -20-15-10
-50510
1520
Real GDP (% yoy)Industrial output (% yoy, r.h.s.)
Heading towards political stability
Key economic figures and forecasts
2007 2008 2009 2010 2011 2012e 2013fNominal GDP (EUR bn) 61.6 67.0 63.1 65.9 69.1 71.0 74.2
Real GDP (% yoy) 10.5 5.8 -4.8 4.0 3.3 0.8 2.5
Industrial output (% yoy) 12.8 2.0 -14.5 18.9 8.0 4.0 4.5
Unemployment rate (avg, %) 11.0 9.6 12.1 14.4 13.5 13.7 13.5
Nominal industrial wages (% yoy) 0.0 7.2 2.7 5.0 5.0 6.5 3.0
Producer prices (avg, % yoy) 2.1 5.0 -2.5 -2.8 2.6 1.5 2.5
Consumer prices (avg, % yoy) 2.8 4.6 1.6 1.0 3.9 3.0 2.5
Consumer prices (eop, % yoy) 3.4 4.4 0.5 1.3 4.4 2.3 2.5
General budget balance (% of GDP) -1.8 -2.1 -8.0 -7.9 -5.0 -4.6 -2.8
Public debt (% of GDP) 29.6 27.8 35.4 41.0 44.4 48.2 48.8
Current account balance (% of GDP) -5.3 -6.0 -2.6 -2.5 0.2 1.4 2.0
Official FX reserves (EUR bn) 13.0 13.5 1.0 1.6 1.9 2.1 2.3
Gross foreign debt (% of GDP) 49.2 56.4 72.3 74.5 79.0 81.3 86.0
EUR/SKK (avg)* 33.8 31.3 30.1 Eurozone membership at EUR/SKK 30.126
USD/SKK (avg)* 24.6 21.3 21.6 Eurozone membership at EUR/SKK 30.126
* Eurozone entry on 1 January 2009Source: Thomson Reuters, wiiw, Raiffeisen RESEARCH
Forecast
Real GDP (% yoy) Economic outlookGDP growth in Q4 2011 (+3.4% yoy, +0.9% qoq) did not signal any slowdown, as opposed to the majority of European countries. However, the structure of growth shows that 1 pp of 3.4% yoy was created by one-off tax effects. Nev-ertheless, Slovakia should post positive GDP growth of +0.8% in 2012, mainly due to an expansion in the automotive sector. Also, other industrial sectors should benefit from the relatively stable situation in the main trading partner Germany. On the other hand, government consumption will dampen growth because of the necessary fiscal consolidation. A real wage decrease (-1.6 %) was one of the greatest concerns in 2011 and the situation in 2012 should be only slightly bet-ter (we expect +0.5% real wage growth). The pace of inflation should decrease in 2012 in comparison to 2011. We expect that average consumer price infla-tion should be around 3% in 2012, and 2.3% at the end of the year.In the early parliamentary elections in March the social-democratic SMER party led by Mr. Robert Fico achieved a clear victory with 44.41% (83 out of 150 seats in Parliament). Incoming Prime Minister Fico has already confirmed that he will uphold the commitment to reach the deficit target of 3% of GDP in 2013. He has already announced that besides cuts on the expenditure side he wants to (1) increase the bank levy tax from the current 0.4% of assets to 0.7% of assets, (2) increase corporate income tax from 19% to 22% for companies with profits higher than EUR 33 mn (including banks), (3) as well as for private individuals from 19% to 25% for incomes above EUR 33,000 (annually), and (4) introduce a 5% dividend tax for private individuals. With regards to financial markets it has to be stressed that the pressure on Slovakia has fallen in recent months after successful government bond placements. Yields on 10y international bonds are currently below 4%, whereas they had been close to 5% in January 2012.
Gunter Deuber, Boris Fojtik
No signs of a tangible economic slowdown according to most recent high-frequency data Therefore, we do not expect a recession like in neighbouring Czech Republic Much needed fiscal consolidation is underway and is reflected in improving risk sentiment Fiscal consolidation to become more “populist” (i.e. higher banking tax, abolishment of flat tax regime)
212nd quarter 2012
-10-8-6-4-202468
10
2007
2008
2009
2010
2011
2012
e
2013
f -20-16-12-8-4048121620
Real GDP (% yoy)Industrial output (% yoy, r.h.s.)
Slovenia
-7
-6
-5
-4
-3
-2
-1
0
2007
2008
2009
2010
2011
2012
e
2013
f 0
10
20
30
40
50
60
70
General budget balance (% of GDP)
Public debt (% of GDP, r.h.s.)
Real GDP (% yoy)
Source: Thomson Reuters, Raiffeisen RESEARCH
Budget balance and public debt
Source: Thomson Reuters, Raiffeisen RESEARCH
Forecast
Forecast
After the elections – reform efforts urgently needed
Key economic figures and forecasts
2007 2008 2009 2010 2011 2012e 2013fNominal GDP (EUR bn) 34.6 37.1 35.3 35.4 35.6 36.0 38.0
Real GDP (% yoy) 6.8 3.5 -7.7 1.4 -0.2 0.0 1.5
Industrial output (% yoy) 7.1 -1.6 -16.5 6.9 3.7 1.0 3.5
Unemployment rate (avg, %) 7.7 6.7 9.2 10.7 11.8 12.5 12.0
Nominal industrial wages (% yoy) 5.9 9.9 4.6 3.6 2.7 2.0 3.5
Producer prices (avg, % yoy) 4.2 3.9 -1.3 2.1 4.4 3.0 3.0
Consumer prices (avg, % yoy) 3.6 5.7 0.9 1.8 1.8 2.2 2.0
Consumer prices (eop, % yoy) 5.6 2.1 1.8 1.9 2.0 2.0 2.0
General budget balance (% of GDP) 0.0 -1.9 -6.1 -5.8 -6.5 -4.5 -4.0
Public debt (% of GDP) 23.1 21.9 35.3 38.8 47.5 50.0 51.0
Current account balance (% of GDP) -4.8 -6.9 -1.3 -0.8 -0.5 -0.6 -1.1
Official FX reserves (EUR bn) 0.7 0.7 0.7 0.8 0.8 0.8 0.8
Gross foreign debt (% of GDP) 100.6 105.7 114.1 114.9 116.3 116.7 115.8
EUR/SIT (avg)* 239.6 Eurozone membership at EUR/SIT 239.64
USD/SIT (avg)* 174.8 Eurozone membership at EUR/SIT 239.64
* Eurozone entry on 1 January 2007Source: Thomson Reuters, wiiw, Raiffeisen RESEARCH
Janez Jansa elected as new Prime Minister (PM) Ambitious government plans needed to cut budget deficit to 3% of GDP Reform measures will be challenging in a five party coalition with diverging interests Muted growth outlook with potential for negative surprises
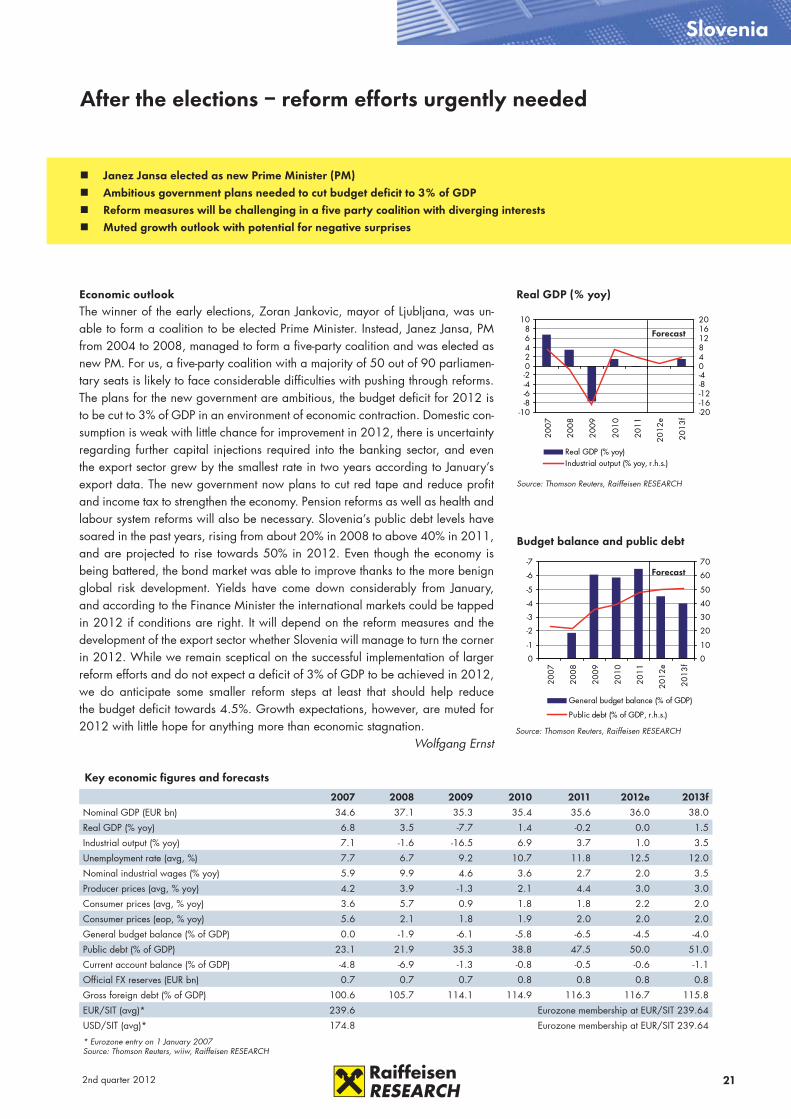
Economic outlookThe winner of the early elections, Zoran Jankovic, mayor of Ljubljana, was un-able to form a coalition to be elected Prime Minister. Instead, Janez Jansa, PM from 2004 to 2008, managed to form a five-party coalition and was elected as new PM. For us, a five-party coalition with a majority of 50 out of 90 parliamen-tary seats is likely to face considerable difficulties with pushing through reforms. The plans for the new government are ambitious, the budget deficit for 2012 is to be cut to 3% of GDP in an environment of economic contraction. Domestic con-sumption is weak with little chance for improvement in 2012, there is uncertainty regarding further capital injections required into the banking sector, and even the export sector grew by the smallest rate in two years according to January’s export data. The new government now plans to cut red tape and reduce profit and income tax to strengthen the economy. Pension reforms as well as health and labour system reforms will also be necessary. Slovenia’s public debt levels have soared in the past years, rising from about 20% in 2008 to above 40% in 2011, and are projected to rise towards 50% in 2012. Even though the economy is being battered, the bond market was able to improve thanks to the more benign global risk development. Yields have come down considerably from January, and according to the Finance Minister the international markets could be tapped in 2012 if conditions are right. It will depend on the reform measures and the development of the export sector whether Slovenia will manage to turn the corner in 2012. While we remain sceptical on the successful implementation of larger reform efforts and do not expect a deficit of 3% of GDP to be achieved in 2012, we do anticipate some smaller reform steps at least that should help reduce the budget deficit towards 4.5%. Growth expectations, however, are muted for 2012 with little hope for anything more than economic stagnation.
Wolfgang Ernst

22 2nd quarter 2012
-10-8-6-4-20246
2007
2008
2009
2010
2011
2012
e
2013
f
Real GDP (% yoy)Industrial output (% yoy)
Croatia
-6
-5
-4
-3
-2
-1
0
2007
2008
2009
2010
2011
2012
e
2013
f 25
30
35
40
45
50
55
General budget balance (% of GDP)
Public debt (% of GDP, r.h.s.)
Real GDP (% yoy)
Source: Thomson Reuters, Raiffeisen RESEARCH
Economic outlookAfter two years of GDP contraction the economy stagnated in 2011 and will probably slip back into recession again this year. The 2012 budget seems to herald the start of fiscal consolidation with planned expenditures reduced by 2.8% yoy. With 1.5% targeted for revenue growth, this should bring the gen-eral government deficit down. The government clearly opted for a step-by-step approach rather than strong and comprehensive cuts, which is understandable given the falling living standards. Rating agencies seem to have provided some relief for the Government, at least for now. In the meantime, the Government faces two problems. On the one hand, the lack of fiscal consolidation and the higher budget deficit in 2011 have jeopardised the credit rating and triggered higher costs of foreign borrowing (paired with increased risk aversion). Hence, the Government has no alternative this year but to act pro-cyclically to balance public finances. On the other hand, the potential growth of the domestic econ-omy has deteriorated significantly in the last three years. This is why we expect the policy to go in two directions.There is no doubt that further fiscal consolidation is inevitable because the cur-rent measures will not suffice to achieve a structural deficit in line with the new EU fiscal sustainability targets. Therefore, additional adjustment measures will be necessary in the medium term. Nevertheless, it is crucial that potential economic growth is increased in the medium term, which assumes structural reforms, espe-cially in the labour market, public administration and social security, but also a better business and investment climate. Simply balancing budget revenues and expenditures, without structural reforms and more substantial economic growth, would only lead to long-term stagnation. We expect the July budget revision will show some signs of structural reforms. Moreover, Croatia will become an EU
Step by step – a long way to recovery
Budget balance and public debt
Source: Thomson Reuters, Raiffeisen RESEARCH
Forecast
Forecast
Key economic figures and forecasts
2007 2008 2009 2010 2011 2012e 2013fNominal GDP (EUR bn) 43.4 47.8 45.7 45.9 46.2 46.0 48.0
Real GDP (% yoy) 5.1 2.2 -6.0 -1.2 0.2 -1.0 1.0
Industrial output (% yoy) 5.6 1.6 -9.2 -1.5 -1.2 -1.5 3.5
Unemployment rate (avg, %) 14.8 13.2 14.9 17.4 18.0 18.5 18.3
Nominal industrial wages (% yoy) 5.6 6.2 1.4 -0.5 1.0 0.2 0.5
Producer prices (avg, % yoy) 3.4 8.4 -0.4 4.3 6.4 4.0 3.3
Consumer prices (avg, % yoy) 2.9 6.1 2.4 1.1 2.3 2.5 3.0
Consumer prices (eop, % yoy) 5.8 2.9 1.9 1.8 2.1 2.8 2.9
General budget balance (% of GDP) -2.5 -1.4 -4.1 -4.9 -5.5 -4.3 -3.5
Public debt (% of GDP) 32.9 29.2 35.1 41.2 45.1 52.2 53.7
Current account balance (% of GDP) -7.2 -8.8 -5.2 -1.2 0.3 0.3 0.9
Official FX reserves (EUR bn) 9.3 9.1 10.4 10.7 11.2 12.0 12.3
Gross foreign debt (% of GDP) 77.7 85.0 99.1 101.3 100.7 103.6 100.7
EUR/HRK (avg) 7.34 7.22 7.34 7.29 7.43 7.56 7.55
USD/HRK (avg) 5.35 4.91 5.26 5.49 5.42 5.69 5.81
Source: Thomson Reuters, wiiw, Raiffeisen RESEARCH
Economy stagnated in 2011 and will probably slip back into recession Further fiscal consolidation is inevitable Constant depreciation pressures on the kuna Further interest in Croatian debt securities depends on the success of maintaining the credit rating

232nd quarter 2012
7.107.157.20
7.257.307.357.407.45
7.507.557.60
Mar-10 Sep-10 Mar-11 Sep-11 Mar-12 Sep-12
EUR/HRK (end of month)
0123456789
0 1 2 3 4 5 6 7 8 9 10Yields as of Mar-12Yield curve Mar-12Yield curve Dec-11Forecast Jun-12
Croatia
EUR/HRK outlook
Source: Thomson Reuters, Raiffeisen RESEARCH
HRK yield curve (%)
Source: Bloomberg, Raiffeisen RESEARCH
member in 2013, which will help to attract more foreign investment and provide access to more affordable foreign financing.
Financial market outlookDespite the constant depreciation pressures on the kuna, the CNB remained con-fident in protecting the EUR/HRK rate, intervening three times on the FX market selling EUR 458 mn, and raising the minimum reserve requirement rate to 15%. Silent demand for EUR-linked T-bills of foreign investors then emerged, becoming, as in 2010, the main driver behind FX movements (appreciation pressures on HRK). Expectations of a lower EUR/HRK in the second quarter are supported by the upcoming tourist season and the forthcoming USD-Eurobond issue, although we believe that foreign currency will be converted at the CNB. In this case, in-ternational reserves will increase, creating a more comfortable situation for mon-etary policy to maintain HRK stability. This is even more important considering the fact that the second quarter of the year is usually a period when foreign cur-rency outflows in the domestic market outstrip inflows (due to dividend payouts to non-residents). However, steady corporate demand for euro, the lack of foreign currency inflows as well as the slowdown in the already weak export climate will continue to prevent any significant FX correction.Since the beginning of the year, demand for Croatian debt securities has been supported by ample liquidity, not only on the local market but also on the US and European markets as well, and, at least for now, by the Fitch rating confirmation. Yields went south, spreads over benchmarks narrowed, but still the economic outlook remained miserable. Formidable tasks remain in the fiscal sphere (con-solidation), with structural reforms and improving the investment climate, and the Croatian rating is anything but secure. As long as the positive spill-over from international markets persists (ample liquidity and solid risk appetite), we reckon there will be further interest in Croatian debt securities, especially short-term ones. Of course, everything depends on the success of maintaining the credit rating, which will come under the spotlight again with the first budget revision in 2012, already announced for the summer (July).The domestic market will continue to suffer from weak domestic supply and mar-ket players reluctant to drive sales. Thirst for a local bond issue will certainly not be quenched until the summer. Namely, for lack of a transparent issuance calen-dar we assume the government will wait for the budget revision and the results of the H1 budget performance. Therefore, tapping the domestic market is not likely until the third quarter.
Zrinka Zivkovic-Matijevic
Exchange rate, interest rate and bond market outlook
Coupon Maturity 28-Mar1 Jun-12 EUR perf. Sep-12 EUR perf. Dec-12 EUR perf. Mar-13 EUR perf.
EUR/HRK 7.51 7.52 -0.2 7.57 -0.9 7.60 -1.2 7.55 -0.6
USD/HRK2 5.65 5.70 -0.9 5.61 0.7 5.63 0.3 5.59 1.0
1m 1.2 3.6 3.4 3.2 2.8
3m 3.4 4.7 4.5 4.3 4.5
6m 4.6 5.5 5.5 5.6 5.4
12m 5.2 5.9 5.9 5.9 5.9
3y T-bond 5.25% Dec-15 6.1 5.9 1.4 5.9 2.2 5.9 3.3 5.8 5.5
5y T-bond 4.75% Feb-17 6.3 6.5 1.1 6.7 1.3 6.7 2.1 6.7 4.4
10y T-bond 6.75% Mar-20 7.0 6.8 3.3 6.8 4.3 6.8 5.0 6.8 7.51) 5:00 p.m. (CET); 2) Performance in USDSource: Thomson Reuters, Raiffeisen RESEARCH
Fore
cast

24 2nd quarter 2012
Romania
-10-9-8-7-6-5-4-3-2-10
2007
2008
2009
2010
2011
2012
e
2013
f 0481216202428323640
General budget balance (% of GDP)
Public debt (% of GDP, r.h.s.)
Real GDP (% yoy)
Source: Thomson Reuters, Raiffeisen RESEARCH
Economic outlookReal GDP fell marginally in Q4 (-0.2% qoq) in the context of a negative contribu-tion from agriculture (after a very good performance in Q3). As expected, the performance of industry and exports deteriorated as their upwards trend was curbed in Q4 (flat dynamics from Q3 on the whole). Private consumption and in-vestments supplied some positive news after increasing in Q4, albeit slowly. We think that real GDP may have contracted slightly in Q1 2012 (-0.3% qoq). We reckon there will be a small contraction in industry and exports as the fall in the last two months in 2011 was not recovered in Q1. The negative contribution of industry was probably not offset in full by the other sectors (i.e. services), which continued to perform weakly. On the demand side we think that the recovery in consumption and investments remained weak (slow growth), while the foreign trade deficit increased in Q1 and made a negative contribution to GDP growth. However, 2012 got off to a better start than we expected. This strengthens our view that the contraction in Q4 and Q1 was temporary and growth should re-turn again in Q2. But growth should remain modest in the short term as foreign capital inflows and confidence are still low.Local elections are pencilled in for 10 June, while parliamentary elections should take place in November. A tight race is foreseen. The ruling party wants to re-gain as much of the public support as possible which has decreased substantially in the last few years following the implementation of austerity policies. The gov-ernment reshuffling in February was seen as a step in this direction. The recent decision to increase public wages in June is not perceived as an isolated move and is related to some extent to the elections. The wide differences between the doctrines of the two opposition parties raise questions about the possibility of harmonising their objectives after the elections (or even during the elections).
Struggling to remain on upwards trend
Budget balance and public debt
Source: Thomson Reuters, Raiffeisen RESEARCH
Forecast
Forecast
-7.5-6.0-4.5-3.0-1.50.01.53.04.56.07.5
2007
2008
2009
2010
2011
2012
e
2013
f
Real GDP (% yoy)Industrial output (% yoy)
Key economic figures and forecasts
2007 2008 2009 2010 2011 2012e 2013fNominal GDP (EUR bn) 124.7 139.8 118.3 124.1 136.5 140.7 153.5
Real GDP (% yoy) 6.3 7.3 -6.6 -1.6 2.5 0.5 2.5
Industrial output (% yoy) 5.4 2.5 -5.5 5.5 5.6 1.0 4.0
Unemployment rate (avg, %) 6.4 5.8 6.9 7.3 7.3 7.1 6.9
Nominal industrial wages (% yoy) 19.9 22.6 10.0 8.3 7.0 4.0 8.0
Producer prices (avg, % yoy) 8.1 15.3 1.9 6.3 8.9 5.0 3.8
Consumer prices (avg, % yoy) 4.8 7.9 5.6 6.1 5.8 3.0 3.6
Consumer prices (eop, % yoy) 6.6 6.3 4.7 8.0 3.1 3.7 3.5
General budget balance (% of GDP) -2.9 -5.7 -9.0 -6.8 -4.6 -3.0 -3.0
Public debt (% of GDP) 12.6 13.4 23.6 30.5 33.4 34.3 35.0
Current account balance (% of GDP) -13.4 -11.6 -4.2 -4.4 -4.2 -4.0 -4.2
Official FX reserves (EUR bn) 25.3 26.2 28.3 32.4 33.2 33.0 33.0
Gross foreign debt (% of GDP) 47.0 51.8 68.7 74.5 72.2 72.5 71.0
EUR/RON (avg) 3.34 3.68 4.24 4.21 4.24 4.34 4.24
USD/RON (avg) 2.43 2.50 3.04 3.17 3.09 3.27 3.26
Source: Thomson Reuters, wiiw, Raiffeisen RESEARCH
Marginal contraction in Q1 and sluggish recovery in subsequent quarters NBR has room to cut key rate, but yields already incorporate the move Downside risks for RON and local bond prices are somewhat limited Political issues return to agenda with local elections due on 10 June
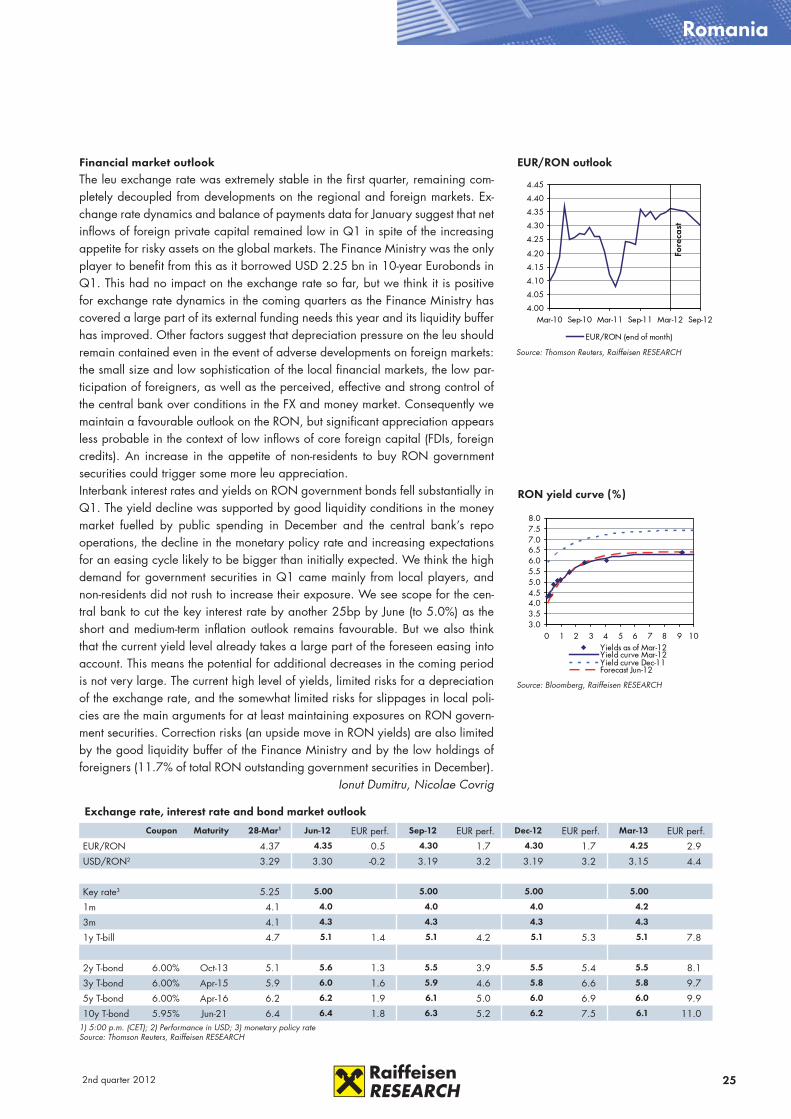
252nd quarter 2012
Romania
4.00
4.05
4.10
4.15
4.20
4.25
4.30
4.35
4.40
4.45
Mar-10 Sep-10 Mar-11 Sep-11 Mar-12 Sep-12
EUR/RON (end of month)
EUR/RON outlook
Source: Thomson Reuters, Raiffeisen RESEARCH
3.03.54.04.55.05.56.06.57.07.58.0
0 1 2 3 4 5 6 7 8 9 10Yields as of Mar-12Yield curve Mar-12Yield curve Dec-11Forecast Jun-12
.
RON yield curve (%)
Source: Bloomberg, Raiffeisen RESEARCH
Exchange rate, interest rate and bond market outlook
Coupon Maturity 28-Mar1 Jun-12 EUR perf. Sep-12 EUR perf. Dec-12 EUR perf. Mar-13 EUR perf.
EUR/RON 4.37 4.35 0.5 4.30 1.7 4.30 1.7 4.25 2.9
USD/RON2 3.29 3.30 -0.2 3.19 3.2 3.19 3.2 3.15 4.4
Key rate3 5.25 5.00 5.00 5.00 5.00
1m 4.1 4.0 4.0 4.0 4.2
3m 4.1 4.3 4.3 4.3 4.3
1y T-bill 4.7 5.1 1.4 5.1 4.2 5.1 5.3 5.1 7.8
2y T-bond 6.00% Oct-13 5.1 5.6 1.3 5.5 3.9 5.5 5.4 5.5 8.1
3y T-bond 6.00% Apr-15 5.9 6.0 1.6 5.9 4.6 5.8 6.6 5.8 9.7
5y T-bond 6.00% Apr-16 6.2 6.2 1.9 6.1 5.0 6.0 6.9 6.0 9.9
10y T-bond 5.95% Jun-21 6.4 6.4 1.8 6.3 5.2 6.2 7.5 6.1 11.01) 5:00 p.m. (CET); 2) Performance in USD; 3) monetary policy rateSource: Thomson Reuters, Raiffeisen RESEARCH
Fore
cast
Financial market outlookThe leu exchange rate was extremely stable in the first quarter, remaining com-pletely decoupled from developments on the regional and foreign markets. Ex-change rate dynamics and balance of payments data for January suggest that net inflows of foreign private capital remained low in Q1 in spite of the increasing appetite for risky assets on the global markets. The Finance Ministry was the only player to benefit from this as it borrowed USD 2.25 bn in 10-year Eurobonds in Q1. This had no impact on the exchange rate so far, but we think it is positive for exchange rate dynamics in the coming quarters as the Finance Ministry has covered a large part of its external funding needs this year and its liquidity buffer has improved. Other factors suggest that depreciation pressure on the leu should remain contained even in the event of adverse developments on foreign markets: the small size and low sophistication of the local financial markets, the low par-ticipation of foreigners, as well as the perceived, effective and strong control of the central bank over conditions in the FX and money market. Consequently we maintain a favourable outlook on the RON, but significant appreciation appears less probable in the context of low inflows of core foreign capital (FDIs, foreign credits). An increase in the appetite of non-residents to buy RON government securities could trigger some more leu appreciation.Interbank interest rates and yields on RON government bonds fell substantially in Q1. The yield decline was supported by good liquidity conditions in the money market fuelled by public spending in December and the central bank’s repo operations, the decline in the monetary policy rate and increasing expectations for an easing cycle likely to be bigger than initially expected. We think the high demand for government securities in Q1 came mainly from local players, and non-residents did not rush to increase their exposure. We see scope for the cen-tral bank to cut the key interest rate by another 25bp by June (to 5.0%) as the short and medium-term inflation outlook remains favourable. But we also think that the current yield level already takes a large part of the foreseen easing into account. This means the potential for additional decreases in the coming period is not very large. The current high level of yields, limited risks for a depreciation of the exchange rate, and the somewhat limited risks for slippages in local poli-cies are the main arguments for at least maintaining exposures on RON govern-ment securities. Correction risks (an upside move in RON yields) are also limited by the good liquidity buffer of the Finance Ministry and by the low holdings of foreigners (11.7% of total RON outstanding government securities in December).
Ionut Dumitru, Nicolae Covrig
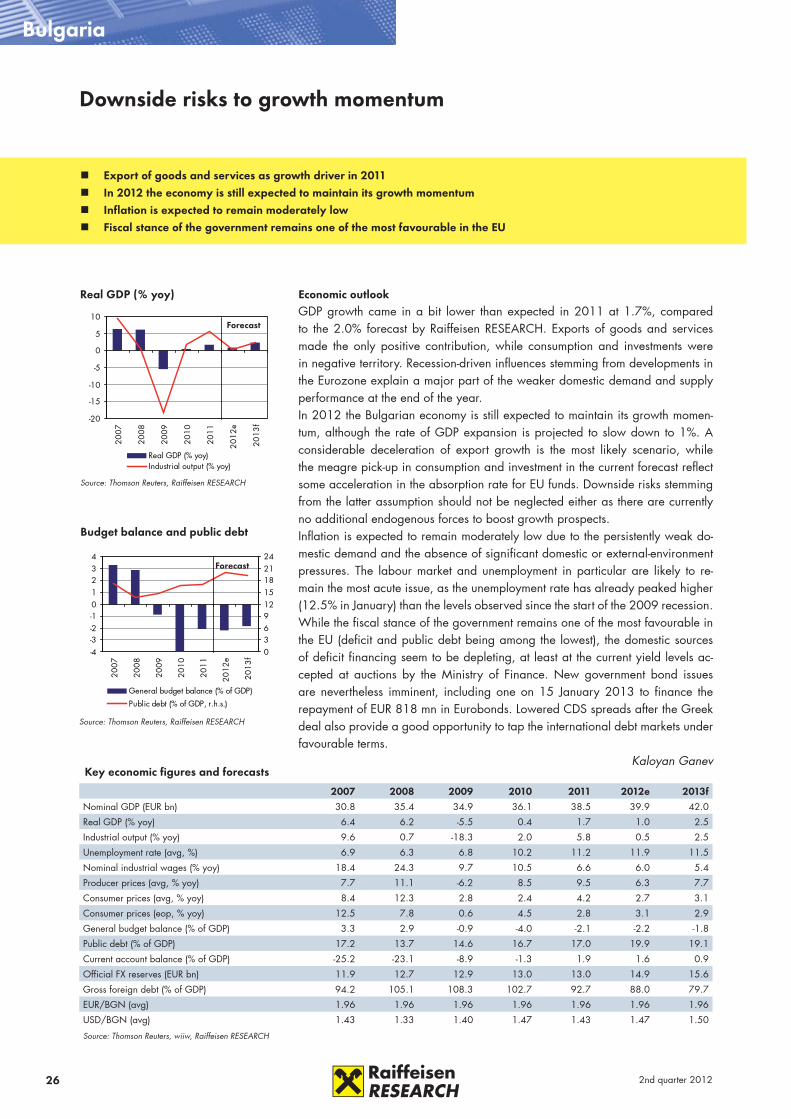
26 2nd quarter 2012
Bulgaria
-4-3-2-101234
2007
2008
2009
2010
2011
2012
e
2013
f 03691215182124
General budget balance (% of GDP)
Public debt (% of GDP, r.h.s.)
Real GDP (% yoy)
Source: Thomson Reuters, Raiffeisen RESEARCH
Budget balance and public debt
Source: Thomson Reuters, Raiffeisen RESEARCH
Forecast
Forecast
-20
-15
-10
-5
0
5
10
2007
2008
2009
2010
2011
2012
e
2013
f
Real GDP (% yoy)Industrial output (% yoy)
Downside risks to growth momentum
Key economic figures and forecasts
2007 2008 2009 2010 2011 2012e 2013fNominal GDP (EUR bn) 30.8 35.4 34.9 36.1 38.5 39.9 42.0
Real GDP (% yoy) 6.4 6.2 -5.5 0.4 1.7 1.0 2.5
Industrial output (% yoy) 9.6 0.7 -18.3 2.0 5.8 0.5 2.5
Unemployment rate (avg, %) 6.9 6.3 6.8 10.2 11.2 11.9 11.5
Nominal industrial wages (% yoy) 18.4 24.3 9.7 10.5 6.6 6.0 5.4
Producer prices (avg, % yoy) 7.7 11.1 -6.2 8.5 9.5 6.3 7.7
Consumer prices (avg, % yoy) 8.4 12.3 2.8 2.4 4.2 2.7 3.1
Consumer prices (eop, % yoy) 12.5 7.8 0.6 4.5 2.8 3.1 2.9
General budget balance (% of GDP) 3.3 2.9 -0.9 -4.0 -2.1 -2.2 -1.8
Public debt (% of GDP) 17.2 13.7 14.6 16.7 17.0 19.9 19.1
Current account balance (% of GDP) -25.2 -23.1 -8.9 -1.3 1.9 1.6 0.9
Official FX reserves (EUR bn) 11.9 12.7 12.9 13.0 13.0 14.9 15.6
Gross foreign debt (% of GDP) 94.2 105.1 108.3 102.7 92.7 88.0 79.7
EUR/BGN (avg) 1.96 1.96 1.96 1.96 1.96 1.96 1.96
USD/BGN (avg) 1.43 1.33 1.40 1.47 1.43 1.47 1.50
Source: Thomson Reuters, wiiw, Raiffeisen RESEARCH
Export of goods and services as growth driver in 2011 In 2012 the economy is still expected to maintain its growth momentum Inflation is expected to remain moderately low Fiscal stance of the government remains one of the most favourable in the EU
Economic outlookGDP growth came in a bit lower than expected in 2011 at 1.7%, compared to the 2.0% forecast by Raiffeisen RESEARCH. Exports of goods and services made the only positive contribution, while consumption and investments were in negative territory. Recession-driven influences stemming from developments in the Eurozone explain a major part of the weaker domestic demand and supply performance at the end of the year.In 2012 the Bulgarian economy is still expected to maintain its growth momen-tum, although the rate of GDP expansion is projected to slow down to 1%. A considerable deceleration of export growth is the most likely scenario, while the meagre pick-up in consumption and investment in the current forecast reflect some acceleration in the absorption rate for EU funds. Downside risks stemming from the latter assumption should not be neglected either as there are currently no additional endogenous forces to boost growth prospects.Inflation is expected to remain moderately low due to the persistently weak do-mestic demand and the absence of significant domestic or external-environment pressures. The labour market and unemployment in particular are likely to re-main the most acute issue, as the unemployment rate has already peaked higher (12.5% in January) than the levels observed since the start of the 2009 recession.While the fiscal stance of the government remains one of the most favourable in the EU (deficit and public debt being among the lowest), the domestic sources of deficit financing seem to be depleting, at least at the current yield levels ac-cepted at auctions by the Ministry of Finance. New government bond issues are nevertheless imminent, including one on 15 January 2013 to finance the repayment of EUR 818 mn in Eurobonds. Lowered CDS spreads after the Greek deal also provide a good opportunity to tap the international debt markets under favourable terms.
Kaloyan Ganev

272nd quarter 2012
Serbia
9092949698
100102104106108110112114
Mar-10 Sep-10 Mar-11 Sep-11 Mar-12 Sep-12
EUR/RSD (end of month)
Real GDP (% yoy)
Source: Thomson Reuters, Raiffeisen RESEARCH
EUR/RSD outlook
Source: Thomson Reuters, Raiffeisen RESEARCH
Forecast
Fore
cast
-14-12-10
-8-6-4-20246
2007
2008
2009
2010
2011
2012
e
2013
f
Real GDP (% yoy)Industrial output (% yoy)
Waiting till the elections are over
Key economic figures and forecasts
2007 2008 2009 2010 2011 2012e 2013fNominal GDP (EUR bn) 28.5 32.7 28.9 28.2 32.4 32.4 35.4
Real GDP (% yoy) 5.4 3.8 -3.5 1.0 2.0 0.0 1.0
Industrial output (% yoy) 4.1 1.4 -12.6 2.5 2.2 -0.5 1.5
Unemployment rate (avg, %) 18.1 13.6 16.1 20.0 22.0 24.0 23.7
Nominal industrial wages (% yoy) 23.7 13.2 5.0 10.0 5.0 1.5 1.5
Producer prices (avg, % yoy) 5.9 12.4 5.6 12.7 14.2 8.5 7.0
Consumer prices (avg, % yoy) 6.5 11.7 8.4 6.5 11.0 6.5 6.0
Consumer prices (eop, % yoy) 11.0 8.6 6.6 10.3 7.0 5.5 5.5
General budget balance (% of GDP) -1.9 -2.6 -4.3 -4.8 -4.5 -5.2 -4.6
Public debt (% of GDP) 31.2 26.9 34.1 43.2 45.8 48.0 45.0
Current account balance (% of GDP) -17.7 -21.6 -7.2 -7.4 -8.9 -7.4 -7.3
Official FX reserves (EUR bn) 9.7 8.2 10.6 10.0 12.5 11.7 12.0
Gross foreign debt (% of GDP) 60.2 64.6 77.9 84.5 74.5 75.7 70.3
EUR/RSD (avg) 80.0 81.5 93.9 103.0 102.0 109.0 106.9
USD/RSD (avg) 58.4 55.4 67.4 77.6 74.4 82.1 82.2
Source: Thomson Reuters, wiiw, Raiffeisen RESEARCH
EU decided to grant candidate status to Serbia Parliamentary and local elections take place on 6 May IMF’s Stand-By Arrangement being frozen until the middle of the year Economic activity to stagnate in 2012
Economic outlookDifferences between the government and the IMF over the EUR 100 mn recapi-talisation of Komercijalna Banka, planned for the end of 2012, sovereign guar-antees envisaged by the 2012 budget and risk reservations for 2012 resulted in the IMF’s SBA being frozen until the middle of the year until the new parliament passes the revised budget law for 2012. The deal freeze and proximity of the parliamentary and local elections (6 May) led to restraint from investors. Ac-cording to latest opinion polls the opposition Serbian Progressive Party (SNS) of Tomislav Nikolic has a marginal lead over President Boris Tadic’s Democratic Party (DS). No party is likely to get a majority and will have to consider a coali-tion, which would be easier for the current (main) ruling party, the Democratic Party (DS). This taken together with the decision of the largest exporter, US Steel, to leave the market and the expected recession in the Eurozone, Serbia’s key export market, prompted us to cut GDP growth from 1% to 0% in 2012. In Q3, despite negotiations on the coalition government and the summer holiday season, the economy might improve somewhat due to expected launch of FIAT exports and the continuation of the IMF deal. A recession will be avoided thanks to public infrastructure investments and potentially the start of FIAT production. The expected lagging economy will overflow on lower tax revenues, driving the budget deficit to GDP ratio to 5.25% whilst boosting public debt/GDP to 48% (ceiling: 45%). The downbeat newsflow was reflected in sizeable dinar weaken-ing. The key trigger was the delay in the IMF deal, while the EU’s decision grant-ing candidate status to Serbia and S&P’s country-rating confirmation gave some support to a more stable dinar. Substantial FX interventions from the National Bank of Serbia are to stabilise the dinar depreciation. We reckon the dinar will gain throughout the year, supported by the unfreezing of the IMF deal, the new government, public-sector reforms and the start of FDI.
Ljiljana Grubic
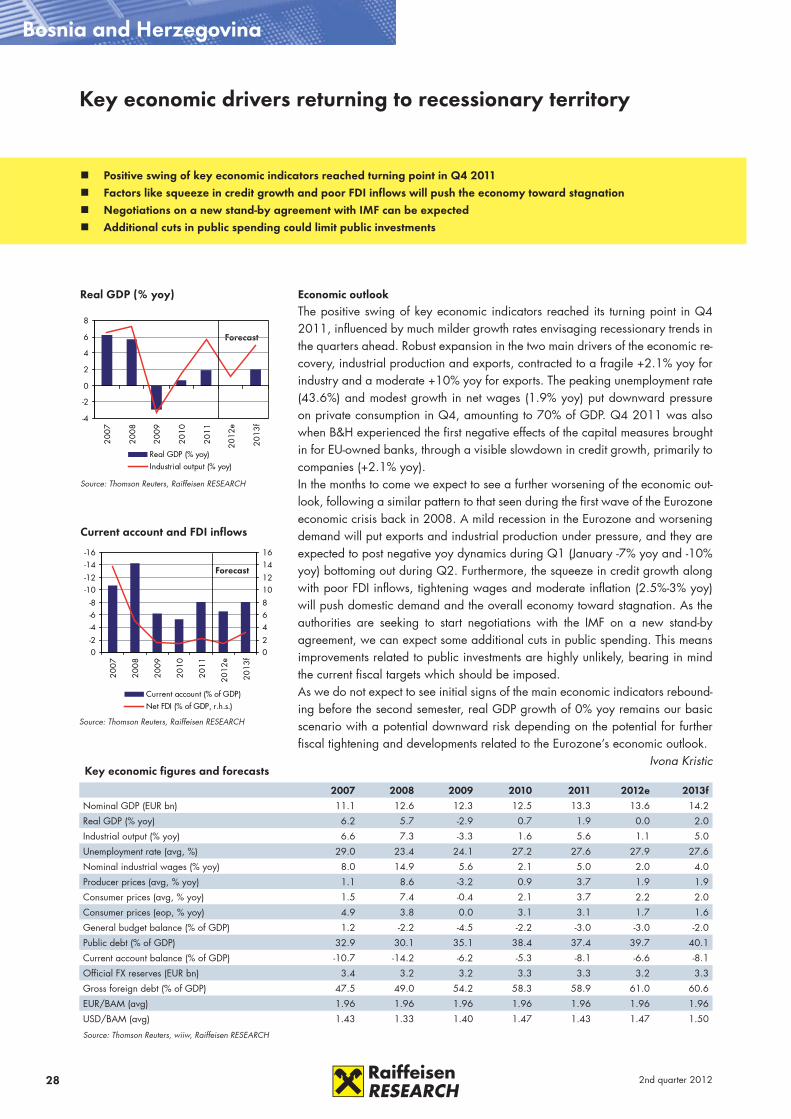
28 2nd quarter 2012
Bosnia and Herzegovina
-16-14
-12-10
-8-6-4
-20
2007
2008
2009
2010
2011
2012
e
2013
f 02
468
1012
1416
Current account (% of GDP)Net FDI (% of GDP, r.h.s.)
Real GDP (% yoy)
Source: Thomson Reuters, Raiffeisen RESEARCH
Current account and FDI inflows
Source: Thomson Reuters, Raiffeisen RESEARCH
Forecast
Forecast
-4
-2
0
2
4
6
8
2007
2008
2009
2010
2011
2012
e
2013
f
Real GDP (% yoy)Industrial output (% yoy)
Key economic drivers returning to recessionary territory
Key economic figures and forecasts
2007 2008 2009 2010 2011 2012e 2013fNominal GDP (EUR bn) 11.1 12.6 12.3 12.5 13.3 13.6 14.2
Real GDP (% yoy) 6.2 5.7 -2.9 0.7 1.9 0.0 2.0
Industrial output (% yoy) 6.6 7.3 -3.3 1.6 5.6 1.1 5.0
Unemployment rate (avg, %) 29.0 23.4 24.1 27.2 27.6 27.9 27.6
Nominal industrial wages (% yoy) 8.0 14.9 5.6 2.1 5.0 2.0 4.0
Producer prices (avg, % yoy) 1.1 8.6 -3.2 0.9 3.7 1.9 1.9
Consumer prices (avg, % yoy) 1.5 7.4 -0.4 2.1 3.7 2.2 2.0
Consumer prices (eop, % yoy) 4.9 3.8 0.0 3.1 3.1 1.7 1.6
General budget balance (% of GDP) 1.2 -2.2 -4.5 -2.2 -3.0 -3.0 -2.0
Public debt (% of GDP) 32.9 30.1 35.1 38.4 37.4 39.7 40.1
Current account balance (% of GDP) -10.7 -14.2 -6.2 -5.3 -8.1 -6.6 -8.1
Official FX reserves (EUR bn) 3.4 3.2 3.2 3.3 3.3 3.2 3.3
Gross foreign debt (% of GDP) 47.5 49.0 54.2 58.3 58.9 61.0 60.6
EUR/BAM (avg) 1.96 1.96 1.96 1.96 1.96 1.96 1.96
USD/BAM (avg) 1.43 1.33 1.40 1.47 1.43 1.47 1.50
Source: Thomson Reuters, wiiw, Raiffeisen RESEARCH
Positive swing of key economic indicators reached turning point in Q4 2011 Factors like squeeze in credit growth and poor FDI inflows will push the economy toward stagnation Negotiations on a new stand-by agreement with IMF can be expected Additional cuts in public spending could limit public investments
Economic outlookThe positive swing of key economic indicators reached its turning point in Q4 2011, influenced by much milder growth rates envisaging recessionary trends in the quarters ahead. Robust expansion in the two main drivers of the economic re-covery, industrial production and exports, contracted to a fragile +2.1% yoy for industry and a moderate +10% yoy for exports. The peaking unemployment rate (43.6%) and modest growth in net wages (1.9% yoy) put downward pressure on private consumption in Q4, amounting to 70% of GDP. Q4 2011 was also when B&H experienced the first negative effects of the capital measures brought in for EU-owned banks, through a visible slowdown in credit growth, primarily to companies (+2.1% yoy). In the months to come we expect to see a further worsening of the economic out-look, following a similar pattern to that seen during the first wave of the Eurozone economic crisis back in 2008. A mild recession in the Eurozone and worsening demand will put exports and industrial production under pressure, and they are expected to post negative yoy dynamics during Q1 (January -7% yoy and -10% yoy) bottoming out during Q2. Furthermore, the squeeze in credit growth along with poor FDI inflows, tightening wages and moderate inflation (2.5%-3% yoy) will push domestic demand and the overall economy toward stagnation. As the authorities are seeking to start negotiations with the IMF on a new stand-by agreement, we can expect some additional cuts in public spending. This means improvements related to public investments are highly unlikely, bearing in mind the current fiscal targets which should be imposed. As we do not expect to see initial signs of the main economic indicators rebound-ing before the second semester, real GDP growth of 0% yoy remains our basic scenario with a potential downward risk depending on the potential for further fiscal tightening and developments related to the Eurozone’s economic outlook.
Ivona Kristic
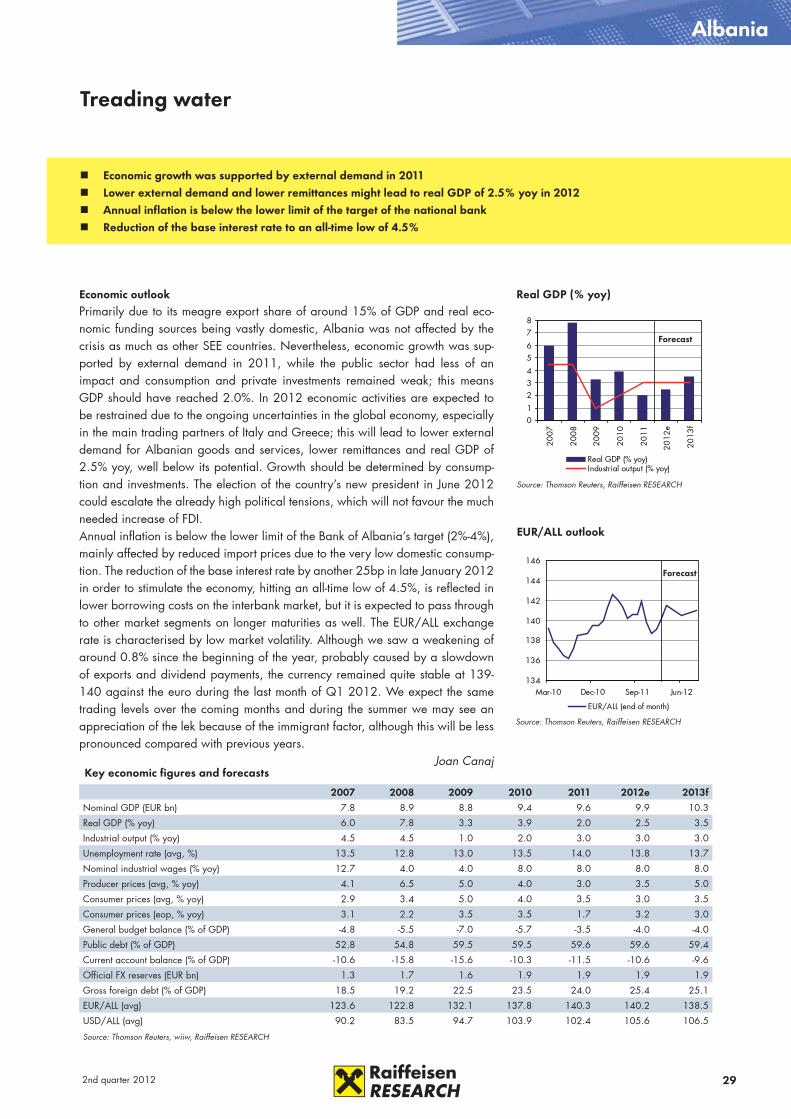
292nd quarter 2012
Albania
134
136
138
140
142
144
146
Mar-10 Dec-10 Sep-11 Jun-12
EUR/ALL (end of month)
Real GDP (% yoy)
Source: Thomson Reuters, Raiffeisen RESEARCH
EUR/ALL outlook
Source: Thomson Reuters, Raiffeisen RESEARCH
Forecast
Forecast
01
234
56
78
2007
2008
2009
2010
2011
2012
e
2013
f
Real GDP (% yoy)Industrial output (% yoy)
Treading water
Key economic figures and forecasts
2007 2008 2009 2010 2011 2012e 2013fNominal GDP (EUR bn) 7.8 8.9 8.8 9.4 9.6 9.9 10.3
Real GDP (% yoy) 6.0 7.8 3.3 3.9 2.0 2.5 3.5
Industrial output (% yoy) 4.5 4.5 1.0 2.0 3.0 3.0 3.0
Unemployment rate (avg, %) 13.5 12.8 13.0 13.5 14.0 13.8 13.7
Nominal industrial wages (% yoy) 12.7 4.0 4.0 8.0 8.0 8.0 8.0
Producer prices (avg, % yoy) 4.1 6.5 5.0 4.0 3.0 3.5 5.0
Consumer prices (avg, % yoy) 2.9 3.4 5.0 4.0 3.5 3.0 3.5
Consumer prices (eop, % yoy) 3.1 2.2 3.5 3.5 1.7 3.2 3.0
General budget balance (% of GDP) -4.8 -5.5 -7.0 -5.7 -3.5 -4.0 -4.0
Public debt (% of GDP) 52.8 54.8 59.5 59.5 59.6 59.6 59.4
Current account balance (% of GDP) -10.6 -15.8 -15.6 -10.3 -11.5 -10.6 -9.6
Official FX reserves (EUR bn) 1.3 1.7 1.6 1.9 1.9 1.9 1.9
Gross foreign debt (% of GDP) 18.5 19.2 22.5 23.5 24.0 25.4 25.1
EUR/ALL (avg) 123.6 122.8 132.1 137.8 140.3 140.2 138.5
USD/ALL (avg) 90.2 83.5 94.7 103.9 102.4 105.6 106.5
Source: Thomson Reuters, wiiw, Raiffeisen RESEARCH
Economic growth was supported by external demand in 2011 Lower external demand and lower remittances might lead to real GDP of 2.5% yoy in 2012 Annual inflation is below the lower limit of the target of the national bank Reduction of the base interest rate to an all-time low of 4.5%
Economic outlookPrimarily due to its meagre export share of around 15% of GDP and real eco-nomic funding sources being vastly domestic, Albania was not affected by the crisis as much as other SEE countries. Nevertheless, economic growth was sup-ported by external demand in 2011, while the public sector had less of an impact and consumption and private investments remained weak; this means GDP should have reached 2.0%. In 2012 economic activities are expected to be restrained due to the ongoing uncertainties in the global economy, especially in the main trading partners of Italy and Greece; this will lead to lower external demand for Albanian goods and services, lower remittances and real GDP of 2.5% yoy, well below its potential. Growth should be determined by consump-tion and investments. The election of the country’s new president in June 2012 could escalate the already high political tensions, which will not favour the much needed increase of FDI.Annual inflation is below the lower limit of the Bank of Albania’s target (2%-4%), mainly affected by reduced import prices due to the very low domestic consump-tion. The reduction of the base interest rate by another 25bp in late January 2012 in order to stimulate the economy, hitting an all-time low of 4.5%, is reflected in lower borrowing costs on the interbank market, but it is expected to pass through to other market segments on longer maturities as well. The EUR/ALL exchange rate is characterised by low market volatility. Although we saw a weakening of around 0.8% since the beginning of the year, probably caused by a slowdown of exports and dividend payments, the currency remained quite stable at 139-140 against the euro during the last month of Q1 2012. We expect the same trading levels over the coming months and during the summer we may see an appreciation of the lek because of the immigrant factor, although this will be less pronounced compared with previous years.
Joan Canaj
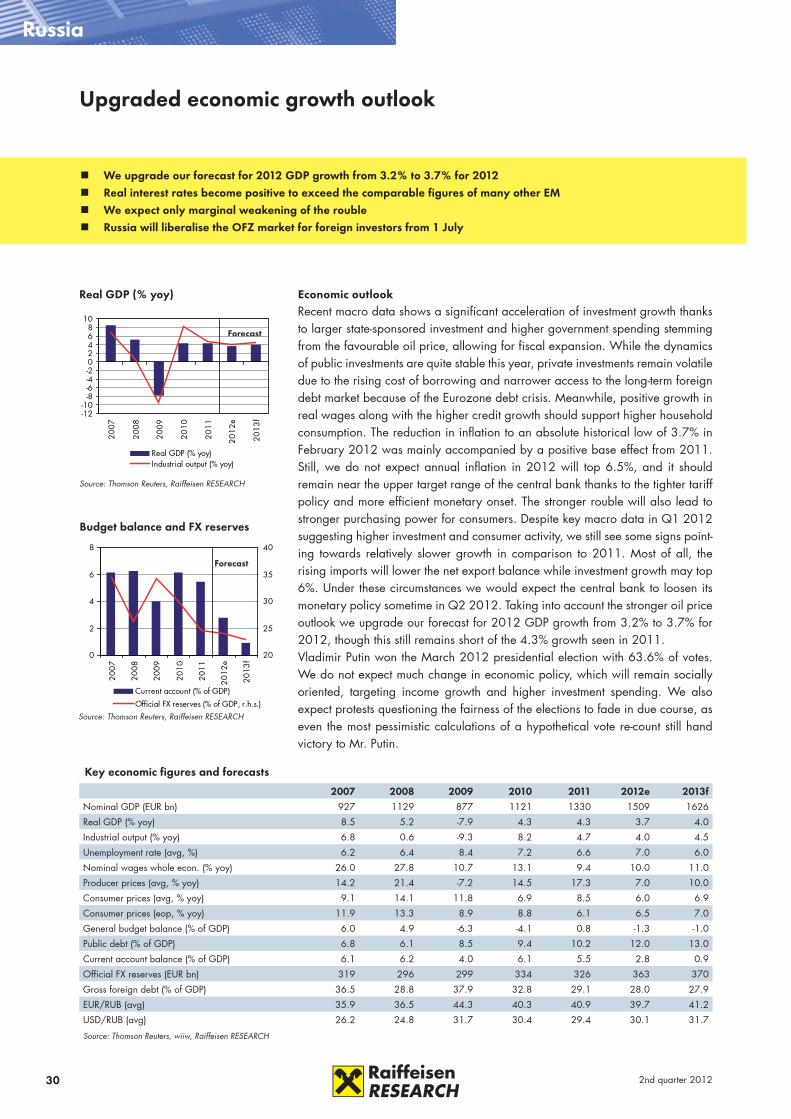
30 2nd quarter 2012
Russia
0
2
4
6
8
2007
2008
2009
2010
2011
2012
e
2013
f 20
25
30
35
40
Current account (% of GDP)
Official FX reserves (% of GDP, r.h.s.)
Real GDP (% yoy)
Source: Thomson Reuters, Raiffeisen RESEARCH
Upgraded economic growth outlook
Budget balance and FX reserves
Source: Thomson Reuters, Raiffeisen RESEARCH
Forecast
Forecast
-12-10
-8-6-4-202468
10
2007
2008
2009
2010
2011
2012
e
2013
f
Real GDP (% yoy)Industrial output (% yoy)
Key economic figures and forecasts
2007 2008 2009 2010 2011 2012e 2013fNominal GDP (EUR bn) 927 1129 877 1121 1330 1509 1626
Real GDP (% yoy) 8.5 5.2 -7.9 4.3 4.3 3.7 4.0
Industrial output (% yoy) 6.8 0.6 -9.3 8.2 4.7 4.0 4.5
Unemployment rate (avg, %) 6.2 6.4 8.4 7.2 6.6 7.0 6.0
Nominal wages whole econ. (% yoy) 26.0 27.8 10.7 13.1 9.4 10.0 11.0
Producer prices (avg, % yoy) 14.2 21.4 -7.2 14.5 17.3 7.0 10.0
Consumer prices (avg, % yoy) 9.1 14.1 11.8 6.9 8.5 6.0 6.9
Consumer prices (eop, % yoy) 11.9 13.3 8.9 8.8 6.1 6.5 7.0
General budget balance (% of GDP) 6.0 4.9 -6.3 -4.1 0.8 -1.3 -1.0
Public debt (% of GDP) 6.8 6.1 8.5 9.4 10.2 12.0 13.0
Current account balance (% of GDP) 6.1 6.2 4.0 6.1 5.5 2.8 0.9
Official FX reserves (EUR bn) 319 296 299 334 326 363 370
Gross foreign debt (% of GDP) 36.5 28.8 37.9 32.8 29.1 28.0 27.9
EUR/RUB (avg) 35.9 36.5 44.3 40.3 40.9 39.7 41.2
USD/RUB (avg) 26.2 24.8 31.7 30.4 29.4 30.1 31.7
Source: Thomson Reuters, wiiw, Raiffeisen RESEARCH
Economic outlookRecent macro data shows a significant acceleration of investment growth thanks to larger state-sponsored investment and higher government spending stemming from the favourable oil price, allowing for fiscal expansion. While the dynamics of public investments are quite stable this year, private investments remain volatile due to the rising cost of borrowing and narrower access to the long-term foreign debt market because of the Eurozone debt crisis. Meanwhile, positive growth in real wages along with the higher credit growth should support higher household consumption. The reduction in inflation to an absolute historical low of 3.7% in February 2012 was mainly accompanied by a positive base effect from 2011. Still, we do not expect annual inflation in 2012 will top 6.5%, and it should remain near the upper target range of the central bank thanks to the tighter tariff policy and more efficient monetary onset. The stronger rouble will also lead to stronger purchasing power for consumers. Despite key macro data in Q1 2012 suggesting higher investment and consumer activity, we still see some signs point-ing towards relatively slower growth in comparison to 2011. Most of all, the rising imports will lower the net export balance while investment growth may top 6%. Under these circumstances we would expect the central bank to loosen its monetary policy sometime in Q2 2012. Taking into account the stronger oil price outlook we upgrade our forecast for 2012 GDP growth from 3.2% to 3.7% for 2012, though this still remains short of the 4.3% growth seen in 2011.Vladimir Putin won the March 2012 presidential election with 63.6% of votes. We do not expect much change in economic policy, which will remain socially oriented, targeting income growth and higher investment spending. We also expect protests questioning the fairness of the elections to fade in due course, as even the most pessimistic calculations of a hypothetical vote re-count still hand victory to Mr. Putin.
We upgrade our forecast for 2012 GDP growth from 3.2% to 3.7% for 2012 Real interest rates become positive to exceed the comparable figures of many other EM We expect only marginal weakening of the rouble Russia will liberalise the OFZ market for foreign investors from 1 July

312nd quarter 2012
Russia
4
5
6
7
8
9
0 2 4 6 8 10
Yields as of Mar-12Yield curve Mar-12Forecast Jun-12Forecast Sep-12
27
28
29
30
31
32
33
Mar-10 Sep-10 Mar-11 Sep-11 Mar-12 Sep-1238
39
40
41
42
43
44
USD/RUB (end of month)EUR/RUB (end of month, r.h.s.)
EUR/RUB outlook
Source: Thomson Reuters, Raiffeisen RESEARCH
RU yield curve (%)
Source: Thomson Reuters, Raiffeisen RESEARCH
Exchange rate, interest rate and bond market outlook
Coupon Maturity 28-Mar1 Jun-12 EUR perf. Sep-12 EUR perf. Dec-12 EUR perf. Mar-13 EUR perf.
EUR/RUB 38.8 39.1 -0.9 40.1 -3.4 40.8 -5.0 41.6 -6.9
USD/RUB2 29.1 29.6 -1.9 29.7 -2.1 30.2 -3.8 30.8 -5.7
Key rate3 8.00 7.75 7.50 7.50 7.75
1m 6.0 5.5 5.2 5.6 5.7
3m 6.7 6.6 6.3 6.5 6.6
12m 6.4 6.1 5.9 6.1 6.2
2y T-bond 7.10% Mar-14 6.8 6.5 1.0 6.3 0.3 6.8 0.0 6.9 -0.3
5y T-bond 7.40% Jun-17 7.5 7.5 0.3 7.4 -0.1 7.7 -0.8 7.8 -0.2
10y T-bond 7.60% Apr-21 7.9 7.9 -0.1 7.8 -0.2 8.1 -2.0 8.2 -2.21) 5:00 p.m. (CET); 2) Performance in USD; 3) refinancing rate; USD/LCY perf. in USD termsSource: Thomson Reuters, Raiffeisen RESEARCH
Fore
cast
Financial market outlookThe higher than expected oil price and the improved investor confidence has bolstered risk appetite. This situation has helped to attract more foreign portfo-lio investment. We believe Russian rouble bonds have become more profitable since yields in real terms headed into positive territory amidst falling inflation. Real interest rates have not only become positive, they also exceed the compa-rable figures of many other emerging economies offering better rate arbitrage options. Decelerating capital outflows strengthening the overall balance of pay-ments position also allowed the rouble to rally to nearly 9% vs. the dual currency basket from the start of 2012. The better outlook for the oil price at USD 114 a barrel on average for 2012 compelled us to upgrade our current account and capital account outlooks, to the benefit of the rouble. The FX market balance has changed, transforming the central bank from a net seller into a net buyer of FX liquidity in the domestic market. Yet we expect the central bank to cut the level of FX interventions owing to its policy shift, favouring a free float of the rouble and a switch to inflation targeting. Thus, we expect rouble volatility will increase in the coming months. Still, an improving balance of payments outlook, especially for the capital account, has prompted us to lower our expectations for rouble depreciation for the whole of 2012. We still expect a marginal weakening of around 4.5% until the end of the year, which implies a rouble depreciation back to 35.0 vs. the basket. Rouble appreciation together with falling inflation and an influx of fresh foreign investment pushed the rouble OFZ market up, translating into healthy price gains over the course of Q1 2012. Yields on longer dated OFZ have fallen back below 8% from over 8.5% in just a few months. Investors are also cherishing Russian government measures to liberalise the OFZ market for foreign investors, granting easier access and beneficial ownership rights to foreign buyers of OFZ debt rather than local custodians. These measures should prop prices up on OFZ bonds in the coming quarter since the bulk of the meas-ures will be introduced on 1 July 2012. We also see some good opportunities in the rouble corporate market since the yield differential between state bonds and corporate issues remains pretty high at about 100-200bp. We expect the rouble liquidity situation will improve, which should also result in a better buying outlook for rouble bonds, while we expect the central bank will keep its monetary policy tied to economic realities. For this reason we reckon the bank will bring its key interest rates down by 25bp in Q2, helping it to narrow the interest rate corridor and increase the efficiency of the rate policy pass-through impact. With this in mind we project rouble yields will tighten marginally in Q2,.
Maria Pomelnikova, Gintaras Shlizhyus
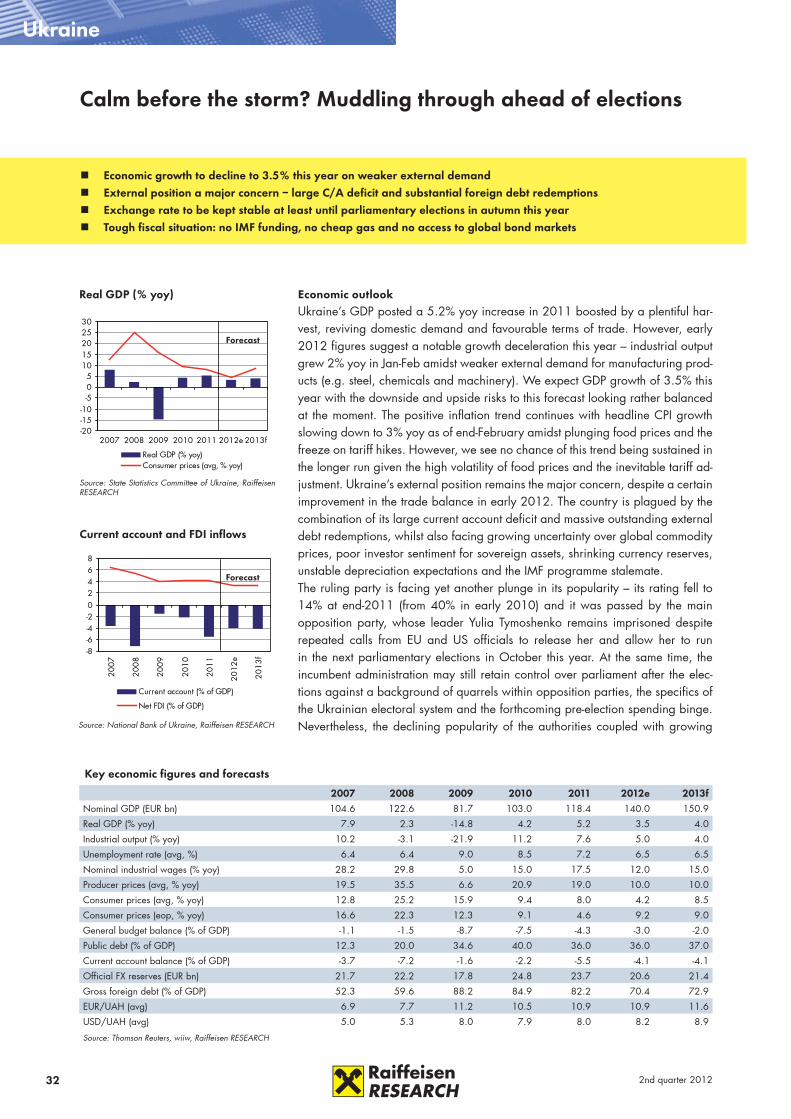
32 2nd quarter 2012
-20-15-10
-505
1015202530
2007 2008 2009 2010 2011 2012e 2013f
Real GDP (% yoy)Consumer prices (avg, % yoy)
Ukraine
-8-6-4-202468
2007
2008
2009
2010
2011
2012
e
2013
f
Current account (% of GDP)
Net FDI (% of GDP)
Real GDP (% yoy)
Source: State Statistics Committee of Ukraine, Raiffeisen RESEARCH
Calm before the storm? Muddling through ahead of elections
Current account and FDI inflows
Source: National Bank of Ukraine, Raiffeisen RESEARCH
Forecast
Forecast
Key economic figures and forecasts
2007 2008 2009 2010 2011 2012e 2013fNominal GDP (EUR bn) 104.6 122.6 81.7 103.0 118.4 140.0 150.9
Real GDP (% yoy) 7.9 2.3 -14.8 4.2 5.2 3.5 4.0
Industrial output (% yoy) 10.2 -3.1 -21.9 11.2 7.6 5.0 4.0
Unemployment rate (avg, %) 6.4 6.4 9.0 8.5 7.2 6.5 6.5
Nominal industrial wages (% yoy) 28.2 29.8 5.0 15.0 17.5 12.0 15.0
Producer prices (avg, % yoy) 19.5 35.5 6.6 20.9 19.0 10.0 10.0
Consumer prices (avg, % yoy) 12.8 25.2 15.9 9.4 8.0 4.2 8.5
Consumer prices (eop, % yoy) 16.6 22.3 12.3 9.1 4.6 9.2 9.0
General budget balance (% of GDP) -1.1 -1.5 -8.7 -7.5 -4.3 -3.0 -2.0
Public debt (% of GDP) 12.3 20.0 34.6 40.0 36.0 36.0 37.0
Current account balance (% of GDP) -3.7 -7.2 -1.6 -2.2 -5.5 -4.1 -4.1
Official FX reserves (EUR bn) 21.7 22.2 17.8 24.8 23.7 20.6 21.4
Gross foreign debt (% of GDP) 52.3 59.6 88.2 84.9 82.2 70.4 72.9
EUR/UAH (avg) 6.9 7.7 11.2 10.5 10.9 10.9 11.6
USD/UAH (avg) 5.0 5.3 8.0 7.9 8.0 8.2 8.9
Source: Thomson Reuters, wiiw, Raiffeisen RESEARCH
Economic outlookUkraine’s GDP posted a 5.2% yoy increase in 2011 boosted by a plentiful har-vest, reviving domestic demand and favourable terms of trade. However, early 2012 figures suggest a notable growth deceleration this year – industrial output grew 2% yoy in Jan-Feb amidst weaker external demand for manufacturing prod-ucts (e.g. steel, chemicals and machinery). We expect GDP growth of 3.5% this year with the downside and upside risks to this forecast looking rather balanced at the moment. The positive inflation trend continues with headline CPI growth slowing down to 3% yoy as of end-February amidst plunging food prices and the freeze on tariff hikes. However, we see no chance of this trend being sustained in the longer run given the high volatility of food prices and the inevitable tariff ad-justment. Ukraine’s external position remains the major concern, despite a certain improvement in the trade balance in early 2012. The country is plagued by the combination of its large current account deficit and massive outstanding external debt redemptions, whilst also facing growing uncertainty over global commodity prices, poor investor sentiment for sovereign assets, shrinking currency reserves, unstable depreciation expectations and the IMF programme stalemate.The ruling party is facing yet another plunge in its popularity – its rating fell to 14% at end-2011 (from 40% in early 2010) and it was passed by the main opposition party, whose leader Yulia Tymoshenko remains imprisoned despite repeated calls from EU and US officials to release her and allow her to run in the next parliamentary elections in October this year. At the same time, the incumbent administration may still retain control over parliament after the elec-tions against a background of quarrels within opposition parties, the specifics of the Ukrainian electoral system and the forthcoming pre-election spending binge. Nevertheless, the declining popularity of the authorities coupled with growing
Economic growth to decline to 3.5% this year on weaker external demand External position a major concern – large C/A deficit and substantial foreign debt redemptions Exchange rate to be kept stable at least until parliamentary elections in autumn this year Tough fiscal situation: no IMF funding, no cheap gas and no access to global bond markets
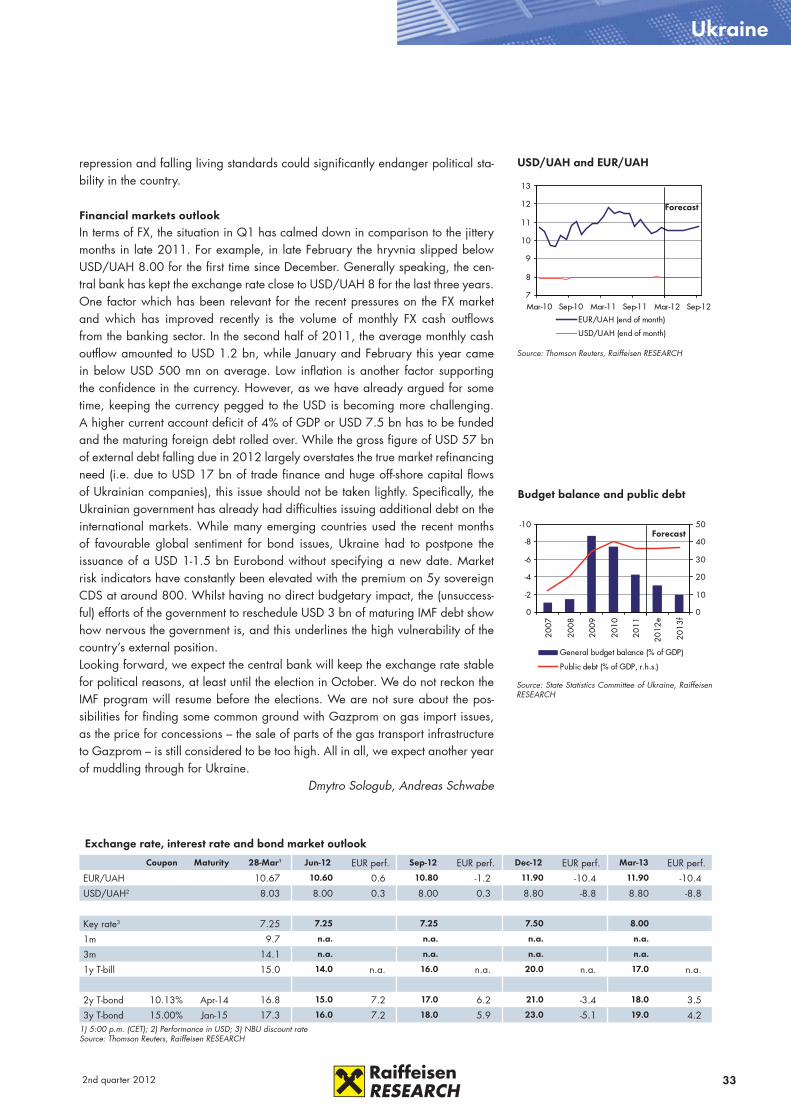
332nd quarter 2012
repression and falling living standards could significantly endanger political sta-bility in the country.
Financial markets outlookIn terms of FX, the situation in Q1 has calmed down in comparison to the jittery months in late 2011. For example, in late February the hryvnia slipped below USD/UAH 8.00 for the first time since December. Generally speaking, the cen-tral bank has kept the exchange rate close to USD/UAH 8 for the last three years. One factor which has been relevant for the recent pressures on the FX market and which has improved recently is the volume of monthly FX cash outflows from the banking sector. In the second half of 2011, the average monthly cash outflow amounted to USD 1.2 bn, while January and February this year came in below USD 500 mn on average. Low inflation is another factor supporting the confidence in the currency. However, as we have already argued for some time, keeping the currency pegged to the USD is becoming more challenging. A higher current account deficit of 4% of GDP or USD 7.5 bn has to be funded and the maturing foreign debt rolled over. While the gross figure of USD 57 bn of external debt falling due in 2012 largely overstates the true market refinancing need (i.e. due to USD 17 bn of trade finance and huge off-shore capital flows of Ukrainian companies), this issue should not be taken lightly. Specifically, the Ukrainian government has already had difficulties issuing additional debt on the international markets. While many emerging countries used the recent months of favourable global sentiment for bond issues, Ukraine had to postpone the issuance of a USD 1-1.5 bn Eurobond without specifying a new date. Market risk indicators have constantly been elevated with the premium on 5y sovereign CDS at around 800. Whilst having no direct budgetary impact, the (unsuccess-ful) efforts of the government to reschedule USD 3 bn of maturing IMF debt show how nervous the government is, and this underlines the high vulnerability of the country’s external position.Looking forward, we expect the central bank will keep the exchange rate stable for political reasons, at least until the election in October. We do not reckon the IMF program will resume before the elections. We are not sure about the pos-sibilities for finding some common ground with Gazprom on gas import issues, as the price for concessions – the sale of parts of the gas transport infrastructure to Gazprom – is still considered to be too high. All in all, we expect another year of muddling through for Ukraine.
Dmytro Sologub, Andreas Schwabe
7
8
9
10
11
12
13
Mar-10 Sep-10 Mar-11 Sep-11 Mar-12 Sep-12
EUR/UAH (end of month)
USD/UAH (end of month)
-10
-8
-6
-4
-2
0
2007
2008
2009
2010
2011
2012
e
2013
f 0
10
20
30
40
50
General budget balance (% of GDP)
Public debt (% of GDP, r.h.s.)
Ukraine
USD/UAH and EUR/UAH
Source: Thomson Reuters, Raiffeisen RESEARCH
Budget balance and public debt
Source: State Statistics Committee of Ukraine, Raiffeisen RESEARCH
Exchange rate, interest rate and bond market outlook
Coupon Maturity 28-Mar1 Jun-12 EUR perf. Sep-12 EUR perf. Dec-12 EUR perf. Mar-13 EUR perf.
EUR/UAH 10.67 10.60 0.6 10.80 -1.2 11.90 -10.4 11.90 -10.4
USD/UAH2 8.03 8.00 0.3 8.00 0.3 8.80 -8.8 8.80 -8.8
Key rate3 7.25 7.25 7.25 7.50 8.00
1m 9.7 n.a. n.a. n.a. n.a.
3m 14.1 n.a. n.a. n.a. n.a.
1y T-bill 15.0 14.0 n.a. 16.0 n.a. 20.0 n.a. 17.0 n.a.
2y T-bond 10.13% Apr-14 16.8 15.0 7.2 17.0 6.2 21.0 -3.4 18.0 3.5
3y T-bond 15.00% Jan-15 17.3 16.0 7.2 18.0 5.9 23.0 -5.1 19.0 4.21) 5:00 p.m. (CET); 2) Performance in USD; 3) NBU discount rateSource: Thomson Reuters, Raiffeisen RESEARCH
Forecast
Forecast
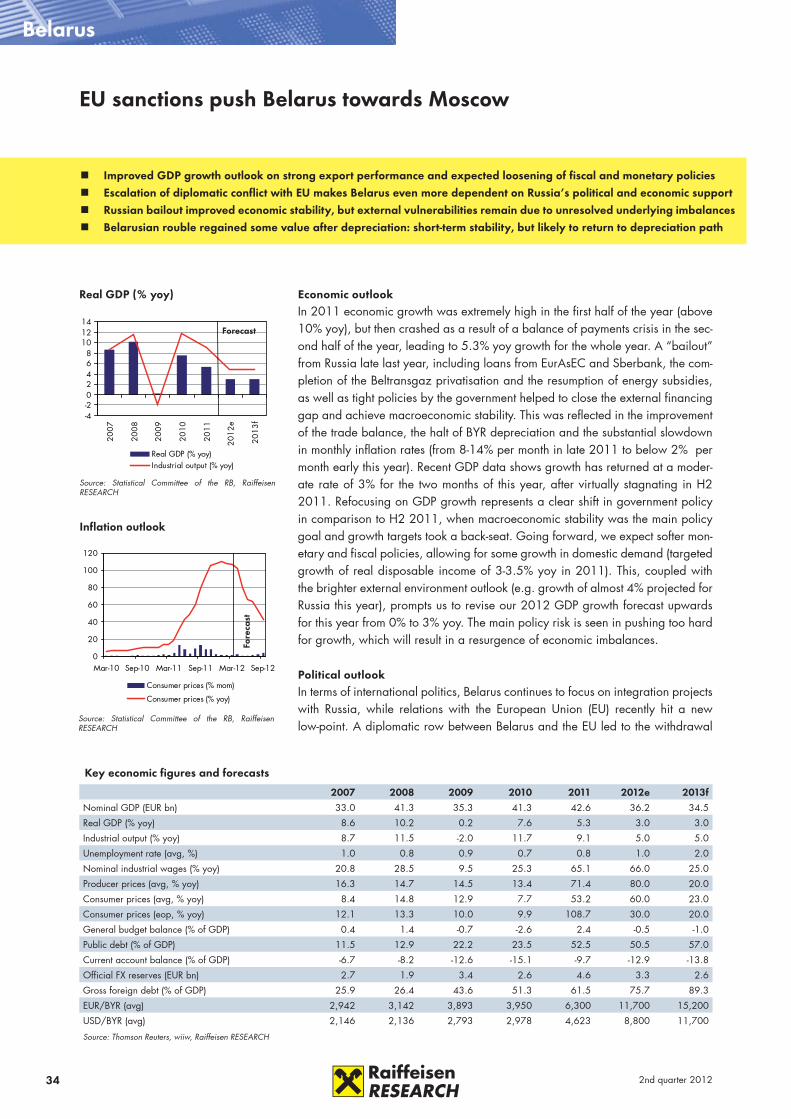
34 2nd quarter 2012
-4-202468
101214
2007
2008
2009
2010
2011
2012
e
2013
f
Real GDP (% yoy)Industrial output (% yoy)
Belarus
0
20
40
60
80
100
120
Mar-10 Sep-10 Mar-11 Sep-11 Mar-12 Sep-12
Consumer prices (% mom)
Consumer prices (% yoy)
Real GDP (% yoy)
Source: Statistical Committee of the RB, Raiffeisen RESEARCH
EU sanctions push Belarus towards Moscow
Inflation outlook
Source: Statistical Committee of the RB, Raiffeisen RESEARCH
Forecast
Fore
cast
Key economic figures and forecasts
2007 2008 2009 2010 2011 2012e 2013fNominal GDP (EUR bn) 33.0 41.3 35.3 41.3 42.6 36.2 34.5
Real GDP (% yoy) 8.6 10.2 0.2 7.6 5.3 3.0 3.0
Industrial output (% yoy) 8.7 11.5 -2.0 11.7 9.1 5.0 5.0
Unemployment rate (avg, %) 1.0 0.8 0.9 0.7 0.8 1.0 2.0
Nominal industrial wages (% yoy) 20.8 28.5 9.5 25.3 65.1 66.0 25.0
Producer prices (avg, % yoy) 16.3 14.7 14.5 13.4 71.4 80.0 20.0
Consumer prices (avg, % yoy) 8.4 14.8 12.9 7.7 53.2 60.0 23.0
Consumer prices (eop, % yoy) 12.1 13.3 10.0 9.9 108.7 30.0 20.0
General budget balance (% of GDP) 0.4 1.4 -0.7 -2.6 2.4 -0.5 -1.0
Public debt (% of GDP) 11.5 12.9 22.2 23.5 52.5 50.5 57.0
Current account balance (% of GDP) -6.7 -8.2 -12.6 -15.1 -9.7 -12.9 -13.8
Official FX reserves (EUR bn) 2.7 1.9 3.4 2.6 4.6 3.3 2.6
Gross foreign debt (% of GDP) 25.9 26.4 43.6 51.3 61.5 75.7 89.3
EUR/BYR (avg) 2,942 3,142 3,893 3,950 6,300 11,700 15,200
USD/BYR (avg) 2,146 2,136 2,793 2,978 4,623 8,800 11,700
Source: Thomson Reuters, wiiw, Raiffeisen RESEARCH
Economic outlookIn 2011 economic growth was extremely high in the first half of the year (above 10% yoy), but then crashed as a result of a balance of payments crisis in the sec-ond half of the year, leading to 5.3% yoy growth for the whole year. A “bailout” from Russia late last year, including loans from EurAsEC and Sberbank, the com-pletion of the Beltransgaz privatisation and the resumption of energy subsidies, as well as tight policies by the government helped to close the external financing gap and achieve macroeconomic stability. This was reflected in the improvement of the trade balance, the halt of BYR depreciation and the substantial slowdown in monthly inflation rates (from 8-14% per month in late 2011 to below 2% per month early this year). Recent GDP data shows growth has returned at a moder-ate rate of 3% for the two months of this year, after virtually stagnating in H2 2011. Refocusing on GDP growth represents a clear shift in government policy in comparison to H2 2011, when macroeconomic stability was the main policy goal and growth targets took a back-seat. Going forward, we expect softer mon-etary and fiscal policies, allowing for some growth in domestic demand (targeted growth of real disposable income of 3-3.5% yoy in 2011). This, coupled with the brighter external environment outlook (e.g. growth of almost 4% projected for Russia this year), prompts us to revise our 2012 GDP growth forecast upwards for this year from 0% to 3% yoy. The main policy risk is seen in pushing too hard for growth, which will result in a resurgence of economic imbalances.
Political outlookIn terms of international politics, Belarus continues to focus on integration projects with Russia, while relations with the European Union (EU) recently hit a new low-point. A diplomatic row between Belarus and the EU led to the withdrawal
Improved GDP growth outlook on strong export performance and expected loosening of fiscal and monetary policies Escalation of diplomatic conflict with EU makes Belarus even more dependent on Russia’s political and economic support Russian bailout improved economic stability, but external vulnerabilities remain due to unresolved underlying imbalances Belarusian rouble regained some value after depreciation: short-term stability, but likely to return to depreciation path
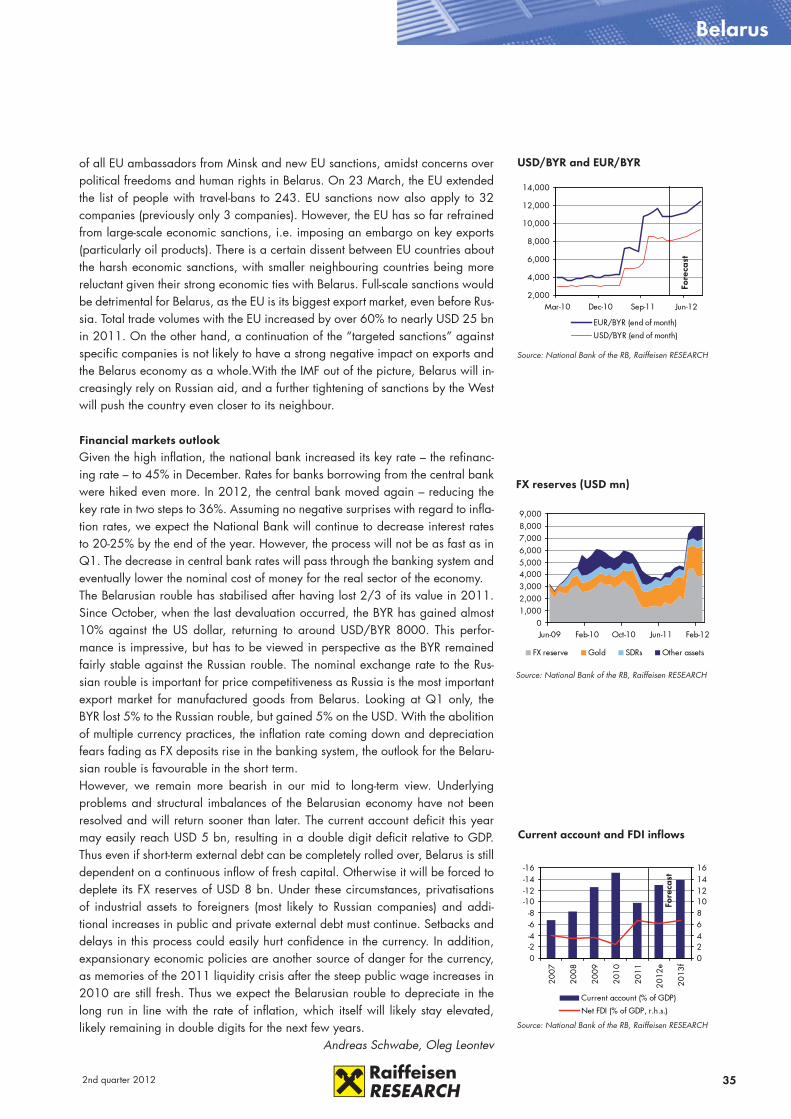
352nd quarter 2012
Belarus
01,0002,0003,0004,0005,0006,0007,0008,0009,000
Jun-09 Feb-10 Oct-10 Jun-11 Feb-12
FX reserve Gold SDRs Other assets
FX reserves (USD mn)
Source: National Bank of the RB, Raiffeisen RESEARCH
of all EU ambassadors from Minsk and new EU sanctions, amidst concerns over political freedoms and human rights in Belarus. On 23 March, the EU extended the list of people with travel-bans to 243. EU sanctions now also apply to 32 companies (previously only 3 companies). However, the EU has so far refrained from large-scale economic sanctions, i.e. imposing an embargo on key exports (particularly oil products). There is a certain dissent between EU countries about the harsh economic sanctions, with smaller neighbouring countries being more reluctant given their strong economic ties with Belarus. Full-scale sanctions would be detrimental for Belarus, as the EU is its biggest export market, even before Rus-sia. Total trade volumes with the EU increased by over 60% to nearly USD 25 bn in 2011. On the other hand, a continuation of the “targeted sanctions” against specific companies is not likely to have a strong negative impact on exports and the Belarus economy as a whole.With the IMF out of the picture, Belarus will in-creasingly rely on Russian aid, and a further tightening of sanctions by the West will push the country even closer to its neighbour.
Financial markets outlookGiven the high inflation, the national bank increased its key rate – the refinanc-ing rate – to 45% in December. Rates for banks borrowing from the central bank were hiked even more. In 2012, the central bank moved again – reducing the key rate in two steps to 36%. Assuming no negative surprises with regard to infla-tion rates, we expect the National Bank will continue to decrease interest rates to 20-25% by the end of the year. However, the process will not be as fast as in Q1. The decrease in central bank rates will pass through the banking system and eventually lower the nominal cost of money for the real sector of the economy.The Belarusian rouble has stabilised after having lost 2/3 of its value in 2011. Since October, when the last devaluation occurred, the BYR has gained almost 10% against the US dollar, returning to around USD/BYR 8000. This perfor-mance is impressive, but has to be viewed in perspective as the BYR remained fairly stable against the Russian rouble. The nominal exchange rate to the Rus-sian rouble is important for price competitiveness as Russia is the most important export market for manufactured goods from Belarus. Looking at Q1 only, the BYR lost 5% to the Russian rouble, but gained 5% on the USD. With the abolition of multiple currency practices, the inflation rate coming down and depreciation fears fading as FX deposits rise in the banking system, the outlook for the Belaru-sian rouble is favourable in the short term.However, we remain more bearish in our mid to long-term view. Underlying problems and structural imbalances of the Belarusian economy have not been resolved and will return sooner than later. The current account deficit this year may easily reach USD 5 bn, resulting in a double digit deficit relative to GDP. Thus even if short-term external debt can be completely rolled over, Belarus is still dependent on a continuous inflow of fresh capital. Otherwise it will be forced to deplete its FX reserves of USD 8 bn. Under these circumstances, privatisations of industrial assets to foreigners (most likely to Russian companies) and addi-tional increases in public and private external debt must continue. Setbacks and delays in this process could easily hurt confidence in the currency. In addition, expansionary economic policies are another source of danger for the currency, as memories of the 2011 liquidity crisis after the steep public wage increases in 2010 are still fresh. Thus we expect the Belarusian rouble to depreciate in the long run in line with the rate of inflation, which itself will likely stay elevated, likely remaining in double digits for the next few years.
Andreas Schwabe, Oleg Leontev
2,000
4,000
6,000
8,000
10,000
12,000
14,000
Mar-10 Dec-10 Sep-11 Jun-12
EUR/BYR (end of month)
USD/BYR (end of month)
USD/BYR and EUR/BYR
Source: National Bank of the RB, Raiffeisen RESEARCH
Fore
cast
-16-14-12-10
-8-6-4-20
2007
2008
2009
2010
2011
2012
e
2013
f 0246810121416
Current account (% of GDP)
Net FDI (% of GDP, r.h.s.)
Current account and FDI inflows
Source: National Bank of the RB, Raiffeisen RESEARCH
Fore
cast

36 2nd quarter 2012
-6
-5
-4
-3
-2
-1
0
2007
2008
2009
2010
2011
2012
e
2013
f 0
10
20
30
40
50
60
General budget balance (% of GDP)
Public debt (% of GDP, r.h.scale)
-6-4-202468
1012
2007
2008
2009
2010
2011
2012
e
2013
f
Real GDP (% yoy)Consumer prices (avg, % yoy)
Turkey
Economic outlookThe predominantly tight monetary policy stance by the Turkish central bank (TCMB) along with the worsening global growth outlook has already started to hurt Turkey’s growth dynamics. Although the solid performance of industrial output and exports in Q4 2011 tilt the risks to our estimate to the upside, we re-main comfortable with our 8.0% real GDP estimate for 2011 (January-September 2011 GDP growth average of 9.6% yoy). Leading indicators recently released support our view that the economy remains in soft-landing mode. Against this backdrop and the recently shrinking but still considerable year-to-date (ytd) gains of the TRY against the USD, demand-driven inflation seems to be off the table for the foreseeable future. However, price pressures are only easing slowly as last year’s administered price increases and the FX pass-through – both expected to be one-off effects – should at least prevail until early summer. Underbidding our 7.0% call, the TCMB expects 2012 year-end annual CPI inflation to come in at 6.5%, but the likelihood of its success depends to a huge extent on the per-formance of the lira (and, in turn, oil prices). We recall that the approximately 20% depreciation of the TRY versus the USD last year added an estimated 5pp to 2011’s year-end inflation figure. Finally, the eagerly awaited rebalancing be-tween external and internal demand is continuing, albeit at a slower pace than market agents had expected. While the narrowing of the non-energy deficit is likely to continue in line with the slowing economy, the development of the oil price —Brent oil price up 15% between December 2011 and March 2012 – partly offsets the gains on the non-energy front. Indeed, this is the main risk to our expectation of a narrowing of the current account deficit (C/A) from 10.2% of GDP in 2011 to 8.7% in 2012. Accordingly, the gradual narrowing of the 12m rolling C/A seen since the end of 2011 surprisingly came to a halt in January – remaining unchanged versus the previous month at 10.2% of estimated GDP.
Forecast
Forecast
Key economic figures and forecasts
2007 2008 2009 2010 2011 2012e 2013fNominal GDP (EUR bn) 470.1 494.6 437.9 551.6 546.0 601.1 694.9
Real GDP (% yoy) 4.7 0.7 -4.8 9.0 8.2 3.0 4.0
Industrial output (% yoy) 7.0 -0.6 -9.9 13.1 8.0 4.0 5.0
Unemployment rate (avg, %) 10.1 10.7 13.7 11.9 10.2 10.5 10.0
Nominal wages whole econ. (% yoy) 10.1 11.5 8.1 8.0 0.0 0.0 0.0
Producer prices (avg, % yoy) 6.3 12.7 1.2 8.5 11.1 11.0 8.0
Consumer prices (avg, % yoy) 8.8 10.4 6.3 8.6 6.5 9.5 6.5
Consumer prices (eop, % yoy) 8.4 10.1 6.5 6.4 10.4 7.0 6.0
General budget balance (% of GDP) -1.8 -1.9 -5.5 -3.7 -1.5 -3.0 -2.5
Public debt (% of GDP) 42.3 43.0 48.9 42.2 39.1 36.2 35.0
Current account balance (% of GDP) -6.0 -5.8 -2.3 -6.6 -10.2 -8.4 -7.7
Official FX reserves (EUR bn) 50.2 50.7 49.4 60.2 60.3 54.1 57.7
Gross foreign debt (% of GDP) 36.8 41.3 43.2 39.7 46.0 42.5 41.0
EUR/TRY (avg) 1.79 1.92 2.17 2.00 2.30 2.36 2.28
USD/TRY (avg) 1.31 1.31 1.55 1.51 1.68 1.78 1.75
Source: Thomson Reuters, wiiw, Raiffeisen RESEARCH
Global risk-on mode diverts attention from macro imbalances
Economy remains in soft landing mode with easing price pressures from H2 2012 Rebalancing of external and internal demand sluggish, oil prices major risk to current account deficit narrowing No substantial change expected in monetary policy, liquidity tightening main tool to defend the TRY Repetition of lira market rally from Q1 cannot be ruled out, but further gains only expected in H2 2012
Source: Thomson Reuters, Raiffeisen RESEARCH
Real GDP (% yoy)
Source: Thomson Reuters, Raiffeisen RESEARCH
Budget balance and public debt
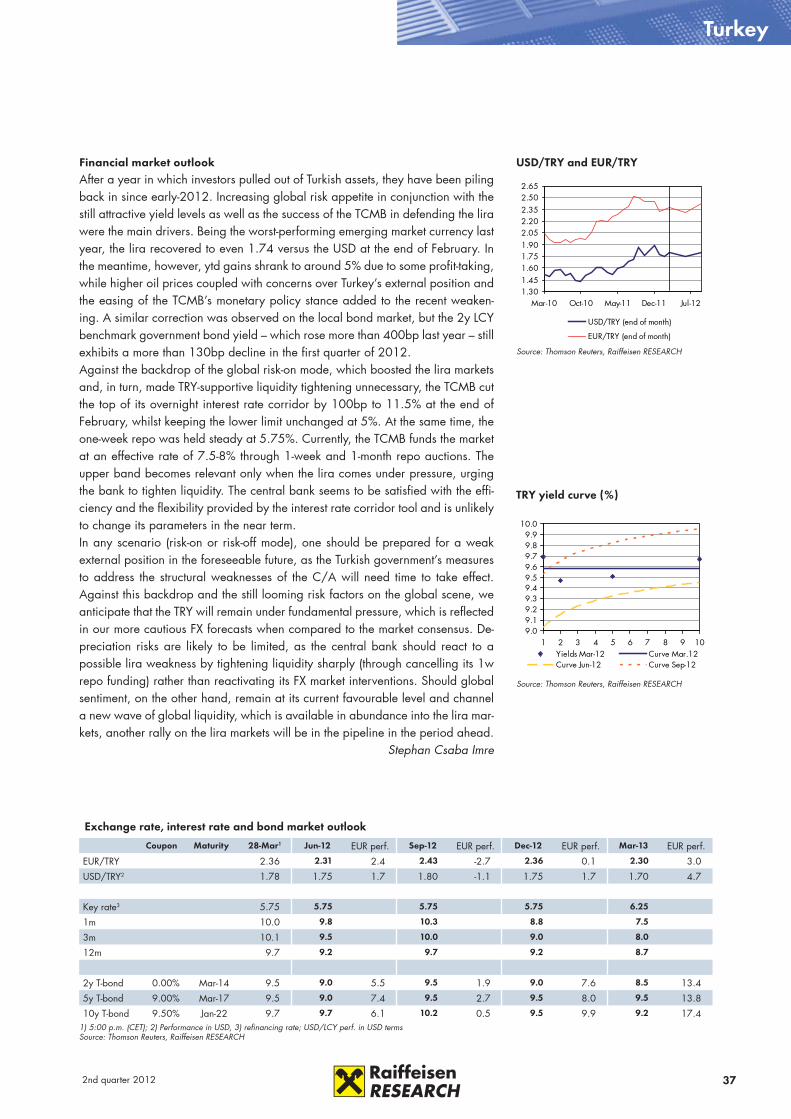
372nd quarter 2012
Turkey
Exchange rate, interest rate and bond market outlook
Coupon Maturity 28-Mar1 Jun-12 EUR perf. Sep-12 EUR perf. Dec-12 EUR perf. Mar-13 EUR perf.
EUR/TRY 2.36 2.31 2.4 2.43 -2.7 2.36 0.1 2.30 3.0
USD/TRY2 1.78 1.75 1.7 1.80 -1.1 1.75 1.7 1.70 4.7
Key rate3 5.75 5.75 5.75 5.75 6.25
1m 10.0 9.8 10.3 8.8 7.5
3m 10.1 9.5 10.0 9.0 8.0
12m 9.7 9.2 9.7 9.2 8.7
2y T-bond 0.00% Mar-14 9.5 9.0 5.5 9.5 1.9 9.0 7.6 8.5 13.4
5y T-bond 9.00% Mar-17 9.5 9.0 7.4 9.5 2.7 9.5 8.0 9.5 13.8
10y T-bond 9.50% Jan-22 9.7 9.7 6.1 10.2 0.5 9.5 9.9 9.2 17.41) 5:00 p.m. (CET); 2) Performance in USD, 3) refinancing rate; USD/LCY perf. in USD termsSource: Thomson Reuters, Raiffeisen RESEARCH
Financial market outlookAfter a year in which investors pulled out of Turkish assets, they have been piling back in since early-2012. Increasing global risk appetite in conjunction with the still attractive yield levels as well as the success of the TCMB in defending the lira were the main drivers. Being the worst-performing emerging market currency last year, the lira recovered to even 1.74 versus the USD at the end of February. In the meantime, however, ytd gains shrank to around 5% due to some profit-taking, while higher oil prices coupled with concerns over Turkey’s external position and the easing of the TCMB’s monetary policy stance added to the recent weaken-ing. A similar correction was observed on the local bond market, but the 2y LCY benchmark government bond yield – which rose more than 400bp last year – still exhibits a more than 130bp decline in the first quarter of 2012.Against the backdrop of the global risk-on mode, which boosted the lira markets and, in turn, made TRY-supportive liquidity tightening unnecessary, the TCMB cut the top of its overnight interest rate corridor by 100bp to 11.5% at the end of February, whilst keeping the lower limit unchanged at 5%. At the same time, the one-week repo was held steady at 5.75%. Currently, the TCMB funds the market at an effective rate of 7.5-8% through 1-week and 1-month repo auctions. The upper band becomes relevant only when the lira comes under pressure, urging the bank to tighten liquidity. The central bank seems to be satisfied with the effi-ciency and the flexibility provided by the interest rate corridor tool and is unlikely to change its parameters in the near term.In any scenario (risk-on or risk-off mode), one should be prepared for a weak external position in the foreseeable future, as the Turkish government’s measures to address the structural weaknesses of the C/A will need time to take effect. Against this backdrop and the still looming risk factors on the global scene, we anticipate that the TRY will remain under fundamental pressure, which is reflected in our more cautious FX forecasts when compared to the market consensus. De-preciation risks are likely to be limited, as the central bank should react to a possible lira weakness by tightening liquidity sharply (through cancelling its 1w repo funding) rather than reactivating its FX market interventions. Should global sentiment, on the other hand, remain at its current favourable level and channel a new wave of global liquidity, which is available in abundance into the lira mar-kets, another rally on the lira markets will be in the pipeline in the period ahead.
Stephan Csaba Imre
1.301.451.601.751.902.052.202.352.502.65
Mar-10 Oct-10 May-11 Dec-11 Jul-12
USD/TRY (end of month)
EUR/TRY (end of month)
Source: Thomson Reuters, Raiffeisen RESEARCH
USD/TRY and EUR/TRY
9.09.19.29.39.49.59.69.79.89.9
10.0
1 2 3 4 5 6 7 8 9 10Yields Mar-12 Curve Mar.12Curve Jun-12 Curve Sep-12
Source: Thomson Reuters, Raiffeisen RESEARCH
TRY yield curve (%)
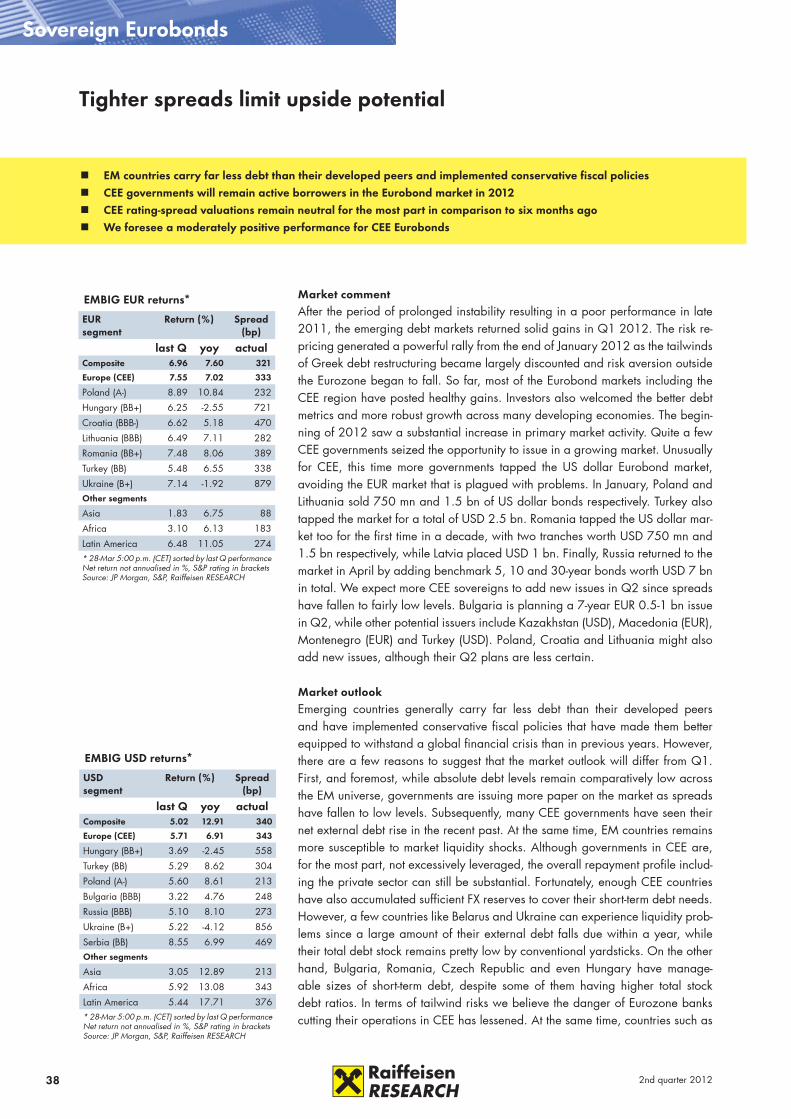
38 2nd quarter 2012
Sovereign Eurobonds
Market commentAfter the period of prolonged instability resulting in a poor performance in late 2011, the emerging debt markets returned solid gains in Q1 2012. The risk re-pricing generated a powerful rally from the end of January 2012 as the tailwinds of Greek debt restructuring became largely discounted and risk aversion outside the Eurozone began to fall. So far, most of the Eurobond markets including the CEE region have posted healthy gains. Investors also welcomed the better debt metrics and more robust growth across many developing economies. The begin-ning of 2012 saw a substantial increase in primary market activity. Quite a few CEE governments seized the opportunity to issue in a growing market. Unusually for CEE, this time more governments tapped the US dollar Eurobond market, avoiding the EUR market that is plagued with problems. In January, Poland and Lithuania sold 750 mn and 1.5 bn of US dollar bonds respectively. Turkey also tapped the market for a total of USD 2.5 bn. Romania tapped the US dollar mar-ket too for the first time in a decade, with two tranches worth USD 750 mn and 1.5 bn respectively, while Latvia placed USD 1 bn. Finally, Russia returned to the market in April by adding benchmark 5, 10 and 30-year bonds worth USD 7 bn in total. We expect more CEE sovereigns to add new issues in Q2 since spreads have fallen to fairly low levels. Bulgaria is planning a 7-year EUR 0.5-1 bn issue in Q2, while other potential issuers include Kazakhstan (USD), Macedonia (EUR), Montenegro (EUR) and Turkey (USD). Poland, Croatia and Lithuania might also add new issues, although their Q2 plans are less certain.
Market outlookEmerging countries generally carry far less debt than their developed peers and have implemented conservative fiscal policies that have made them better equipped to withstand a global financial crisis than in previous years. However, there are a few reasons to suggest that the market outlook will differ from Q1. First, and foremost, while absolute debt levels remain comparatively low across the EM universe, governments are issuing more paper on the market as spreads have fallen to low levels. Subsequently, many CEE governments have seen their net external debt rise in the recent past. At the same time, EM countries remains more susceptible to market liquidity shocks. Although governments in CEE are, for the most part, not excessively leveraged, the overall repayment profile includ-ing the private sector can still be substantial. Fortunately, enough CEE countries have also accumulated sufficient FX reserves to cover their short-term debt needs. However, a few countries like Belarus and Ukraine can experience liquidity prob-lems since a large amount of their external debt falls due within a year, while their total debt stock remains pretty low by conventional yardsticks. On the other hand, Bulgaria, Romania, Czech Republic and even Hungary have manage-able sizes of short-term debt, despite some of them having higher total stock debt ratios. In terms of tailwind risks we believe the danger of Eurozone banks cutting their operations in CEE has lessened. At the same time, countries such as
Tighter spreads limit upside potential
EMBIG USD returns*
USD segment
Return (%) Spread (bp)
last Q yoy actualComposite 5.02 12.91 340
Europe (CEE) 5.71 6.91 343
Hungary (BB+) 3.69 -2.45 558
Turkey (BB) 5.29 8.62 304
Poland (A-) 5.60 8.61 213
Bulgaria (BBB) 3.22 4.76 248
Russia (BBB) 5.10 8.10 273
Ukraine (B+) 5.22 -4.12 856
Serbia (BB) 8.55 6.99 469Other segments
Asia 3.05 12.89 213
Africa 5.92 13.08 343
Latin America 5.44 17.71 376* 28-Mar 5:00 p.m. (CET) sorted by last Q performanceNet return not annualised in %, S&P rating in bracketsSource: JP Morgan, S&P, Raiffeisen RESEARCH
EMBIG EUR returns*
EUR segment
Return (%) Spread (bp)
last Q yoy actualComposite 6.96 7.60 321
Europe (CEE) 7.55 7.02 333
Poland (A-) 8.89 10.84 232
Hungary (BB+) 6.25 -2.55 721
Croatia (BBB-) 6.62 5.18 470
Lithuania (BBB) 6.49 7.11 282
Romania (BB+) 7.48 8.06 389
Turkey (BB) 5.48 6.55 338
Ukraine (B+) 7.14 -1.92 879Other segments
Asia 1.83 6.75 88
Africa 3.10 6.13 183
Latin America 6.48 11.05 274* 28-Mar 5:00 p.m. (CET) sorted by last Q performanceNet return not annualised in %, S&P rating in bracketsSource: JP Morgan, S&P, Raiffeisen RESEARCH
EM countries carry far less debt than their developed peers and implemented conservative fiscal policies CEE governments will remain active borrowers in the Eurobond market in 2012 CEE rating-spread valuations remain neutral for the most part in comparison to six months ago We foresee a moderately positive performance for CEE Eurobonds

392nd quarter 2012
EMBIG forecast and performance
Spread Range Spread Range Spread Range
Dur. 28-Mar* Jun-12 min. max. Perf. (%) Sep-12 min. max. Perf. (%) Dec-12 min. max. Perf. (%)
Poland (A-) EUR 6.0 232 200 157 243 0.22 220 177 263 -0.97 190 147 233 -0.97USD 5.8 213 220 175 265 0.41 215 170 260 -1.03 200 155 245 -0.74
Lithuania (BBB) EUR 3.5 282 250 196 304 0.12 260 206 314 -0.23 230 176 284 -0.23Hungary (BB+) EUR 3.9 721 650 575 725 1.64 670 595 745 0.87 600 525 675 2.42Russia (BBB) USD 5.6 273 260 227 293 1.52 270 237 303 -0.71 250 217 283 -0.16Croatia (BBB-) EUR 3.2 470 420 367 473 0.69 450 397 503 -0.26 400 347 453 0.38Romania (BB+) EUR 3.6 389 340 278 402 0.75 360 298 422 0.02 320 258 382 0.39
USD 7.3 388 350 288 412 3.38 360 298 422 -0.29 330 268 392 1.18Serbia (BB) USD 5.9 469 440 383 497 2.55 450 393 507 0.19 420 363 477 1.37Turkey (BB) EUR 4.7 338 300 266 334 0.44 310 276 344 -0.03 260 226 294 0.91
USD 7.5 304 290 249 331 1.64 300 259 341 -2.12 250 209 291 0.89Ukraine (B+) EUR 3.0 879 850 747 953 0.02 900 797 1003 -1.46 800 697 903 0.61
USD 3.7 856 860 787 933 0.38 870 797 943 -1.11 800 727 873 1.13* closing prices 5:00 p.m. (CET); Performance as cumulative return of gross prices up to forecast horizonSource: JP Morgan, S&P, Raiffeisen RESEARCH
Sovereign Eurobonds
100
200
300
400
500
Mar-11 Jul-11 Nov-11 Mar-12
EMBIG EUR EuropeEMBIG USD Europe
EMBIG Europe spread, EUR vs. USD*
*in basis pointsSource: JP Morgan, Raiffeisen RESEARCH
Agency,USD 0.3 bn,
1%
Corporate, USD
10.4 bn, 30%
Banks, USD 7.4 bn,
21%Sovereign,
USD 16.5 bn,
48%
CEE/MEA primary market breakdown
* in 2012, % total, 2012 year-to-dateSource: Bloomberg, Raiffeisen RESEARCH
0.00
20.00
40.00
60.00
80.00
100.00
2004
2005
2006
2007
2008
2009
2010
2011
2012
*
CEE/MEA ASIA LATAM
Sovereign Eurobond issuance*
* 2012 year-to-date (USD bn) Source: Bloomberg, Raiffeisen RESEARCH
Ukraine, Romania, Hungary and Latvia have to make sizable payments to the IMF this year. Meanwhile, the CEE rating outlook will be stable, while countries like Ukraine, Belarus and Hungary will remain under pressure from negative outlooks. Consequently, CEE rating-spread valuations will remain neutral for the most part in comparison to six months ago.
Market strategyWe expect tougher times ahead for CEE Eurobonds as their spreads have tight-ened considerably. Meanwhile, higher issuance volumes will weaken the CEE market from a technical (demand-supply) perspective. However, a brighter out-look for global economic growth outside the Eurozone and the low interest rate environment should counterbalance the risks and support the CEE markets. So far we foresee a moderately positive performance for CEE Eurobonds, whilst expecting only a mild impact from possible market consolidation in Q2. Never-theless, the absolute performance results will be modest for CEE Eurobonds as additional spread tightening will be contingent on a better fundamental outlook and the prospect of rating upgrades, which will be rare in the region. We rec-ommend lengthening portfolio durations to capitalise more on the moderately positive performance of the Eurobond market in Q2. At present, the average CEE portfolio duration is 5 years, and 5.9 years for the euro and US dollar seg-ments respectively. Investors can reap better returns by taking underperforming sovereigns without any apparent fundamental problems. In this regard, we find the Balkan region of CEE has good potential, especially in the US dollar segment. We prefer Romania and Serbia Eurobonds in US dollars since both countries have undergone a tangible improvement. Romania’s US dollar bond appears to be relatively cheap to the peer group with a BB rating spread, while fiscal consolidation and improved debt coverage could result in an outlook upgrade in 2012. Serbia joining the club of EU aspirants amidst improving relations with the EU and its relatively safe debt metrics could compress spreads too. Since Serbia’s Eurobonds lagged behind the competition in Q1, its market may catch up in Q2. By contrast, we recommend against having Belarus bonds as the country faces new EU sanctions and is increasing its dependence on Russia. We underweight Ukraine due to the lack of fiscal and pension reforms and its inability to clinch an agreement with the IMF.
Gunter Deuber, Gintaras Shlizhyus
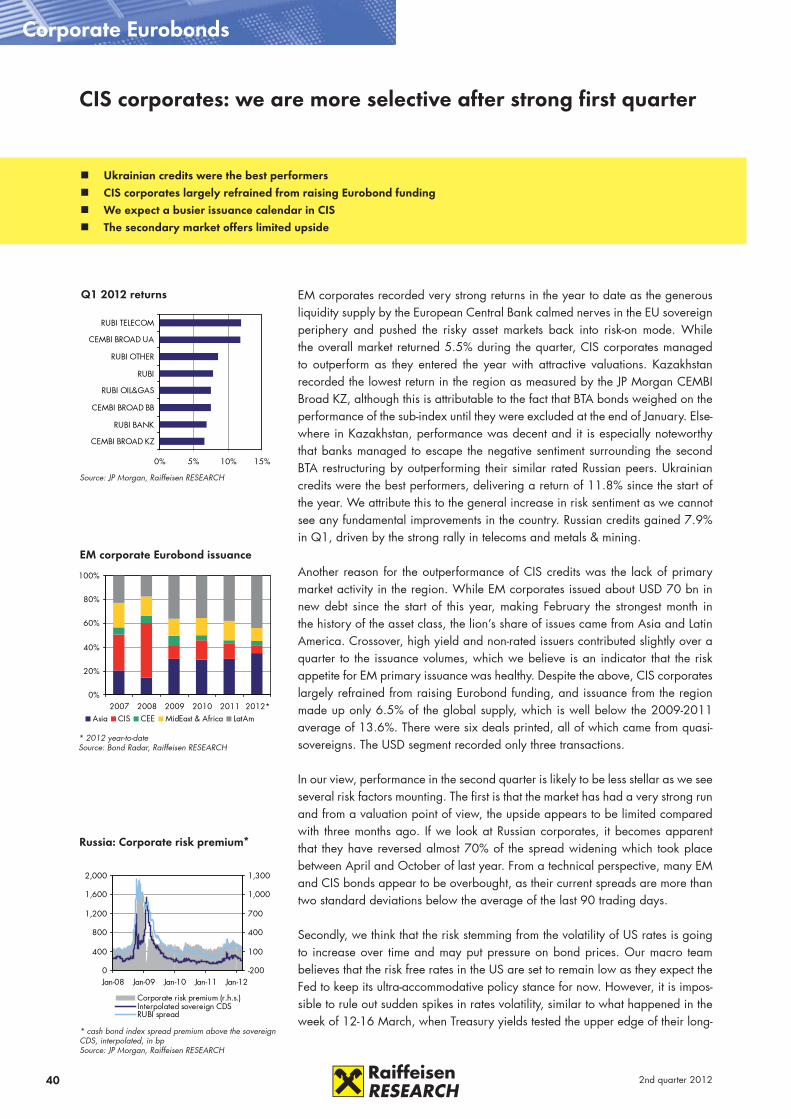
40 2nd quarter 2012
0% 5% 10% 15%
CEMBI BROAD KZ
RUBI BANK
CEMBI BROAD BB
RUBI OIL&GAS
RUBI
RUBI OTHER
CEMBI BROAD UA
RUBI TELECOM
Q1 2012 returns
Source: JP Morgan, Raiffeisen RESEARCH
Corporate Eurobonds
EM corporates recorded very strong returns in the year to date as the generous liquidity supply by the European Central Bank calmed nerves in the EU sovereign periphery and pushed the risky asset markets back into risk-on mode. While the overall market returned 5.5% during the quarter, CIS corporates managed to outperform as they entered the year with attractive valuations. Kazakhstan recorded the lowest return in the region as measured by the JP Morgan CEMBI Broad KZ, although this is attributable to the fact that BTA bonds weighed on the performance of the sub-index until they were excluded at the end of January. Else-where in Kazakhstan, performance was decent and it is especially noteworthy that banks managed to escape the negative sentiment surrounding the second BTA restructuring by outperforming their similar rated Russian peers. Ukrainian credits were the best performers, delivering a return of 11.8% since the start of the year. We attribute this to the general increase in risk sentiment as we cannot see any fundamental improvements in the country. Russian credits gained 7.9% in Q1, driven by the strong rally in telecoms and metals & mining.
Another reason for the outperformance of CIS credits was the lack of primary market activity in the region. While EM corporates issued about USD 70 bn in new debt since the start of this year, making February the strongest month in the history of the asset class, the lion’s share of issues came from Asia and Latin America. Crossover, high yield and non-rated issuers contributed slightly over a quarter to the issuance volumes, which we believe is an indicator that the risk appetite for EM primary issuance was healthy. Despite the above, CIS corporates largely refrained from raising Eurobond funding, and issuance from the region made up only 6.5% of the global supply, which is well below the 2009-2011 average of 13.6%. There were six deals printed, all of which came from quasi-sovereigns. The USD segment recorded only three transactions.
In our view, performance in the second quarter is likely to be less stellar as we see several risk factors mounting. The first is that the market has had a very strong run and from a valuation point of view, the upside appears to be limited compared with three months ago. If we look at Russian corporates, it becomes apparent that they have reversed almost 70% of the spread widening which took place between April and October of last year. From a technical perspective, many EM and CIS bonds appear to be overbought, as their current spreads are more than two standard deviations below the average of the last 90 trading days.
Secondly, we think that the risk stemming from the volatility of US rates is going to increase over time and may put pressure on bond prices. Our macro team believes that the risk free rates in the US are set to remain low as they expect the Fed to keep its ultra-accommodative policy stance for now. However, it is impos-sible to rule out sudden spikes in rates volatility, similar to what happened in the week of 12-16 March, when Treasury yields tested the upper edge of their long-
CIS corporates: we are more selective after strong first quarter
0%
20%
40%
60%
80%
100%
2007 2008 2009 2010 2011 2012*Asia CIS CEE MidEast & Africa LatAm
EM corporate Eurobond issuance
* 2012 year-to-dateSource: Bond Radar, Raiffeisen RESEARCH
Ukrainian credits were the best performers CIS corporates largely refrained from raising Eurobond funding We expect a busier issuance calendar in CIS The secondary market offers limited upside
0
400
800
1,200
1,600
2,000
Jan-08 Jan-09 Jan-10 Jan-11 Jan-12-200
100
400
700
1,000
1,300
Corporate risk premium (r.h.s.)Interpolated sovereign CDSRUBI spread
* cash bond index spread premium above the sovereign CDS, interpolated, in bpSource: JP Morgan, Raiffeisen RESEARCH
Russia: Corporate risk premium*
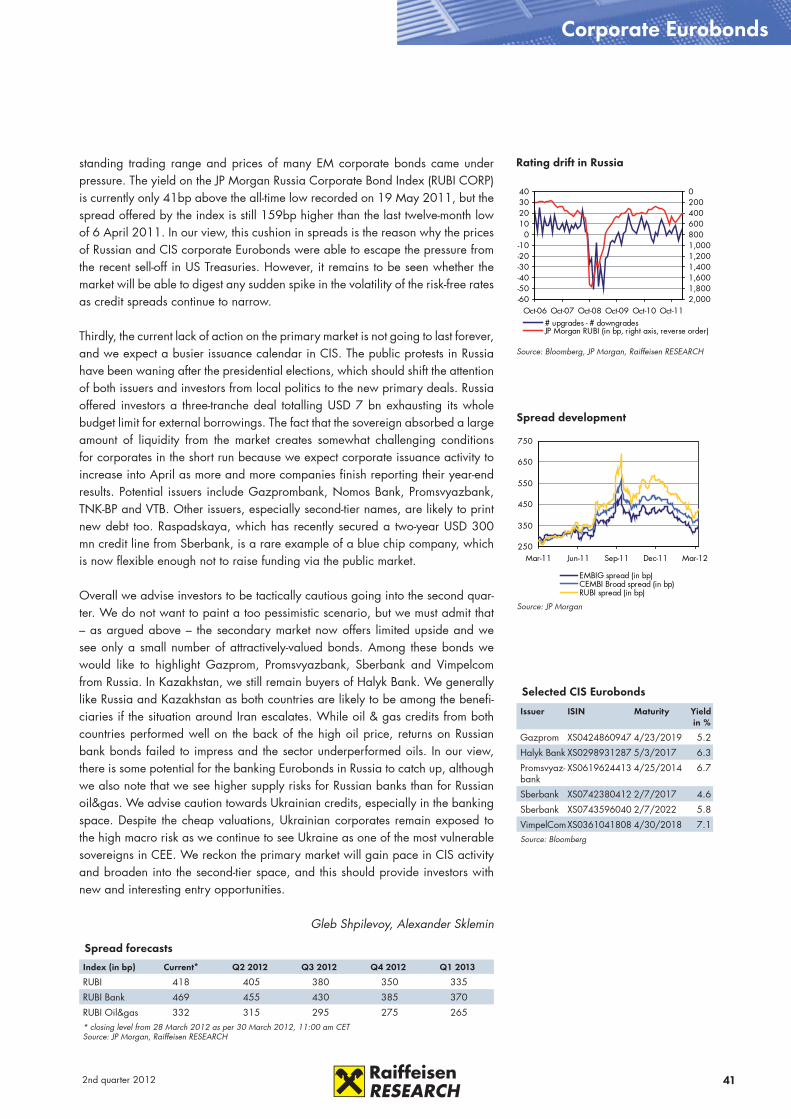
412nd quarter 2012
Corporate Eurobonds
standing trading range and prices of many EM corporate bonds came under pressure. The yield on the JP Morgan Russia Corporate Bond Index (RUBI CORP) is currently only 41bp above the all-time low recorded on 19 May 2011, but the spread offered by the index is still 159bp higher than the last twelve-month low of 6 April 2011. In our view, this cushion in spreads is the reason why the prices of Russian and CIS corporate Eurobonds were able to escape the pressure from the recent sell-off in US Treasuries. However, it remains to be seen whether the market will be able to digest any sudden spike in the volatility of the risk-free rates as credit spreads continue to narrow.
Thirdly, the current lack of action on the primary market is not going to last forever, and we expect a busier issuance calendar in CIS. The public protests in Russia have been waning after the presidential elections, which should shift the attention of both issuers and investors from local politics to the new primary deals. Russia offered investors a three-tranche deal totalling USD 7 bn exhausting its whole budget limit for external borrowings. The fact that the sovereign absorbed a large amount of liquidity from the market creates somewhat challenging conditions for corporates in the short run because we expect corporate issuance activity to increase into April as more and more companies finish reporting their year-end results. Potential issuers include Gazprombank, Nomos Bank, Promsvyazbank, TNK-BP and VTB. Other issuers, especially second-tier names, are likely to print new debt too. Raspadskaya, which has recently secured a two-year USD 300 mn credit line from Sberbank, is a rare example of a blue chip company, which is now flexible enough not to raise funding via the public market.
Overall we advise investors to be tactically cautious going into the second quar-ter. We do not want to paint a too pessimistic scenario, but we must admit that – as argued above – the secondary market now offers limited upside and we see only a small number of attractively-valued bonds. Among these bonds we would like to highlight Gazprom, Promsvyazbank, Sberbank and Vimpelcom from Russia. In Kazakhstan, we still remain buyers of Halyk Bank. We generally like Russia and Kazakhstan as both countries are likely to be among the benefi-ciaries if the situation around Iran escalates. While oil & gas credits from both countries performed well on the back of the high oil price, returns on Russian bank bonds failed to impress and the sector underperformed oils. In our view, there is some potential for the banking Eurobonds in Russia to catch up, although we also note that we see higher supply risks for Russian banks than for Russian oil&gas. We advise caution towards Ukrainian credits, especially in the banking space. Despite the cheap valuations, Ukrainian corporates remain exposed to the high macro risk as we continue to see Ukraine as one of the most vulnerable sovereigns in CEE. We reckon the primary market will gain pace in CIS activity and broaden into the second-tier space, and this should provide investors with new and interesting entry opportunities.
Gleb Shpilevoy, Alexander Sklemin
Spread forecasts
Index (in bp) Current* Q2 2012 Q3 2012 Q4 2012 Q1 2013
RUBI 418 405 380 350 335
RUBI Bank 469 455 430 385 370
RUBI Oil&gas 332 315 295 275 265 * closing level from 28 March 2012 as per 30 March 2012, 11:00 am CETSource: JP Morgan, Raiffeisen RESEARCH
250
350
450
550
650
750
Mar-11 Jun-11 Sep-11 Dec-11 Mar-12
EMBIG spread (in bp)CEMBI Broad spread (in bp)RUBI spread (in bp)
Source: JP Morgan
Spread development
-60-50-40-30-20-10
010203040
Oct-06 Oct-07 Oct-08 Oct-09 Oct-10 Oct-11
02004006008001,0001,2001,4001,6001,8002,000
# upgrades - # downgradesJP Morgan RUBI (in bp, right axis, reverse order)
Source: Bloomberg, JP Morgan, Raiffeisen RESEARCH
Rating drift in Russia
Selected CIS Eurobonds
Issuer ISIN Maturity Yield in %
Gazprom XS0424860947 4/23/2019 5.2
Halyk Bank XS0298931287 5/3/2017 6.3
Promsvyaz-bank
XS0619624413 4/25/2014 6.7
Sberbank XS0742380412 2/7/2017 4.6
Sberbank XS0743596040 2/7/2022 5.8
VimpelComXS0361041808 4/30/2018 7.1Source: Bloomberg

42 2nd quarter 2012
Value matrix*
Domestic business activity 3 (4)
Exports OECD - excl. Eastern Europe 4 (4)
Eastern Europe 4 (4)
Asia 2 (2)
Company earnings 3 (3)
Key sectors 2 (3)
Valuation - P/E-ratio 2 (2)
Interest rates / yields 1 (1)
Exchange rates 3 (3)
Foreign equity markets 2 (4)
European liquidity 1 (1)
Technical outlook 3 (2)1 (4) denotes highly positive (negative) influence on the market. All factors are weighted equally.* expected trend for the next 3 to 6 months Source: Raiffeisen RESEARCH, Raiffeisen Centrobank
Sector structure ATX
Sector Company WeightFinancials CA Immobilien, conwert, Erste Group, Immofinanz, Raiffeisen Bank International, Vienna Insurance Group 38.0%
Industrials Andritz, Oesterreichische Post, Strabag, Wienerberger, Zumtobel 17.5%
Energy OMV, Schoeller-Bleckmann 15.8%
Basic materials Mayr-Melnhof, Lenzing, RHI, voestalpine 15.9%
Telecom Telekom Austria 7.0%
Utilities EVN, Verbund 5.8%Source: Raiffeisen RESEARCH, Raiffeisen Centrobank, Vienna Stock Exchange
The Austrian equity market has experienced some remarkable developments since the turn of the year. After 2011 produced clear losses across the board, and Austrian Financials in particular were forced to chalk up significant price losses on account of the uncertainties in the financial system, 2012 so far has been very robust. Generally speaking, sentiment regarding future economic activity has brightened up again somewhat recently. On the one hand this is most certainly attributable to the successful debt haircut in Greece. On the other hand, the situation has also been helped by the injections of liquidity by the ECB, which have resulted in a narrowing of sovereign spreads. And one must not forget the solid US economic data that we have observed for some time now. At any rate, this does not change the fact that the first quarter will still produce negative growth in Austria, although in the second quarter we will probably see a modest expansion of economic activity. That said, this is no time to celebrate. The development of the Austrian purchasing managers’ index suggests that economic output is set to rise only moderately over 2012 as a whole. We anticipate growth of 0.3%.
Supportive factors will prevail
Equity market/Austria
-50%
-40%
-30%
-20%
-10%
0%
10%
20%
30%
40%
50%
Market Energy Materials Industrials Financials Utilities
Euro Stoxx Small Euro Stoxx
Valuation premium of ATX sector
Valuation discount of ATX sector
Relative P/E ratio 2012e ATX
Source: Raiffeisen RESEARCH
The crisis in the Eurozone has recently left its mark in the countries of Central and Eastern Europe, and the pace of economic growth has slowed here as well. Similarly to our last strategy pub-lication, we still expect a recession in the Czech Republic and in Hungary in 2012. They are suffering first and foremost from their high dependency on exports in the Eurozone. Yet for the CEE region as a whole, we main-tain our assumption that economic output will not shrink and instead we are likely to see moderate expansion amounting to 2.6%. Breaking the re-gion up we are expecting to see CIS perform the best, as Russia in particu-
Sentiment regarding future economic activity has brightened up Earnings trend is likely to stay positive Moderate valuation of the Austrian equity market Support from abundant liquidity

432nd quarter 2012
lar, as an exporter of energy, is set to benefit from the relatively robust energy prices.In spite of the economic downturn, Austrian businesses performed not too badly at all in the past reporting season. The number of disappointing reports fell in comparison to the preceding period. Companies producing encouraging results included, in particular, OMV, Erste Group, RBI, Andritz and Mayr-Melnhof. Oth-ers performing less efficiently included Zumtobel, Wienerberger and Verbund. While the majority of companies were increasingly prudent prior to the turn of the year on account of the poor visibility, recently we have started to see a moderate improvement in prospects. The earnings trend is likely to stay positive. The companies included on the ATX managed to post a positive profit growth rate in the past year, albeit only just. In aggregate terms this growth amounted to roughly 1%, which includes the nega-tive impacts such as those caused by foreign currency problems. Consequently, the growth rate for 2012 is slightly stronger, coming in at around 14.4%. The debt haircut in Greece did not influence listed Financials very much at all. In spite of the strong development since the beginning of the year, valuations have not really risen very much. At a P/E ratio for 2012 of 10.9 they are not displaying any premium to the established equity markets in Western Europe either. In any case, on a book value basis, the Austrian equities market remains favourably priced, especially the banking stocks on the ATX. All of the topics that negatively influenced the Austrian equity market in 2011 have in the meantime faded or been completely resolved. In this context we can mention the effects stemming from the foreign currency loan problems in Hungary, which have now been fully taken into account in the results of the banks affected. Similarly, the discussions regarding the capital requirements of the European Banking Authority (EBA) as well as the uncertainty surrounding the debt haircut in Greece, which has now been completed, were not exactly sup-portive for prices in the European financial sector as a whole, and therefore for the heavily weighted Financials in the ATX. Accordingly, we remain essentially optimistic for the coming months. That said, the strong upwards dynamics seen at present are likely to suffer a correction as there are still a number of prob-lematic issues lurking around (e.g. the European economy, elections in Greece, referenda about the European fiscal pact, etc.), which are all capable of fuelling considerable uncertainty. Nevertheless, we believe that the abundant liquidity on the markets and the moderate valuation of the Austrian equity market provide enough share price potential to justify a “BUY” recommendation for the ATX.
Johannes Mattner
Fair value of ATX* - March 2013
Bond yields (10y)
EY-BY** 2.75% 3.00% 3.25%
6.50% 2,148 2,091 2,0386.25% 2,208 2,148 2,0916.00% 2,271 2,208 2,1485.75% 2,338 2,271 2,2085.50% 2,408 2,338 2,2715.25% 2,484 2,408 2,3385.00% 2,564 2,484 2,4084.75% 2,649 2,564 2,4844.50% 2,741 2,649 2,5644.25% 2,838 2,741 2,6494.00% 2,944 2,838 2,7413.75% 3,057 2,944 2,8383.50% 3,179 3,057 2,9443.25% 3,311 3,179 3,057
* based on the expected earnings for 2012/2013 (i.e. 198.7index points)** earnings yield less bond yieldSource: Raiffeisen RESEARCH, Raiffeisen Centrobank
Valuation and forecasts
28-Mar* Jun-12 Sep-12 Dec-12 Mar-13
12-months forward earnings 173.6 179.9 186.2 192.5 198.7
Bond yield forecast 2.84 2.80 2.70 2.80 3.00
Earnings yield less bond yield (EY-BY) 5.18 4.75 5.50 5.00 5.00
ATX-forecast based on EY-BY 2383 2271 2468 2484
ATX-forecast 2,164.9 2,350 2,300 2,450 2,450
Expected price change 8.6% 6.2% 13.2% 13.2%
Range 1900-2500 2000-2500 2000-2600 2100-2700
P/E based on 12-month forward earnings 12.5 13.1 12.4 12.7 12.3* 11:59 p.m. (CET); Source: Raiffeisen RESEARCH, Raiffeisen Centrobank
Equity market/Austria
Earnings yield* less bond yield
* in %, earnings yield = E/P; based on 12-month forward earningsSource: Thomson Reuters, Raiffeisen RESEARCH, Raif-feisen Centrobank
0
2
4
6
8
10
12
14
16
18
20
Oct-00 Sep-02 Aug-04 Jul-06 Jun-08 May-10 Apr-12
Fore
cast
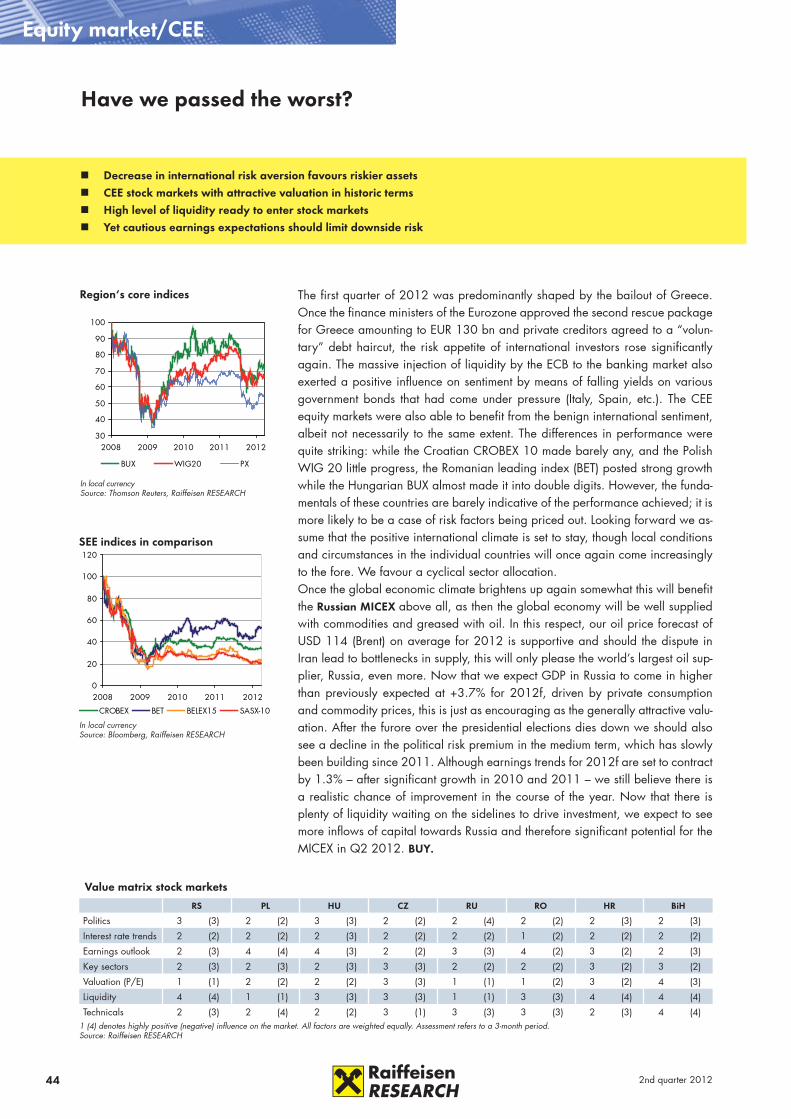
44 2nd quarter 2012
The first quarter of 2012 was predominantly shaped by the bailout of Greece. Once the finance ministers of the Eurozone approved the second rescue package for Greece amounting to EUR 130 bn and private creditors agreed to a “volun-tary” debt haircut, the risk appetite of international investors rose significantly again. The massive injection of liquidity by the ECB to the banking market also exerted a positive influence on sentiment by means of falling yields on various government bonds that had come under pressure (Italy, Spain, etc.). The CEE equity markets were also able to benefit from the benign international sentiment, albeit not necessarily to the same extent. The differences in performance were quite striking: while the Croatian CROBEX 10 made barely any, and the Polish WIG 20 little progress, the Romanian leading index (BET) posted strong growth while the Hungarian BUX almost made it into double digits. However, the funda-mentals of these countries are barely indicative of the performance achieved; it is more likely to be a case of risk factors being priced out. Looking forward we as-sume that the positive international climate is set to stay, though local conditions and circumstances in the individual countries will once again come increasingly to the fore. We favour a cyclical sector allocation.Once the global economic climate brightens up again somewhat this will benefit the Russian MICEX above all, as then the global economy will be well supplied with commodities and greased with oil. In this respect, our oil price forecast of USD 114 (Brent) on average for 2012 is supportive and should the dispute in Iran lead to bottlenecks in supply, this will only please the world’s largest oil sup-plier, Russia, even more. Now that we expect GDP in Russia to come in higher than previously expected at +3.7% for 2012f, driven by private consumption and commodity prices, this is just as encouraging as the generally attractive valu-ation. After the furore over the presidential elections dies down we should also see a decline in the political risk premium in the medium term, which has slowly been building since 2011. Although earnings trends for 2012f are set to contract by 1.3% – after significant growth in 2010 and 2011 – we still believe there is a realistic chance of improvement in the course of the year. Now that there is plenty of liquidity waiting on the sidelines to drive investment, we expect to see more inflows of capital towards Russia and therefore significant potential for the MICEX in Q2 2012. BUY.
Have we passed the worst?
Value matrix stock markets
RS PL HU CZ RU RO HR BiH
Politics 3 (3) 2 (2) 3 (3) 2 (2) 2 (4) 2 (2) 2 (3) 2 (3)
Interest rate trends 2 (2) 2 (2) 2 (3) 2 (2) 2 (2) 1 (2) 2 (2) 2 (2)
Earnings outlook 2 (3) 4 (4) 4 (3) 2 (2) 3 (3) 4 (2) 3 (2) 2 (3)
Key sectors 2 (3) 2 (3) 2 (3) 3 (3) 2 (2) 2 (2) 3 (2) 3 (2)
Valuation (P/E) 1 (1) 2 (2) 2 (2) 3 (3) 1 (1) 1 (2) 3 (2) 4 (3)
Liquidity 4 (4) 1 (1) 3 (3) 3 (3) 1 (1) 3 (3) 4 (4) 4 (4)
Technicals 2 (3) 2 (4) 2 (2) 3 (1) 3 (3) 3 (3) 2 (3) 4 (4)1 (4) denotes highly positive (negative) influence on the market. All factors are weighted equally. Assessment refers to a 3-month period. Source: Raiffeisen RESEARCH
Equity market/CEE
0
20
40
60
80
100
120
2008 2009 2010 2011 2012
CROBEX BET BELEX15 SASX-10
SEE indices in comparison
In local currencySource: Bloomberg, Raiffeisen RESEARCH
Decrease in international risk aversion favours riskier assets CEE stock markets with attractive valuation in historic terms High level of liquidity ready to enter stock markets Yet cautious earnings expectations should limit downside risk
30
40
50
60
70
80
90
100
2008 2009 2010 2011 2012
BUX WIG20 PX
In local currencySource: Thomson Reuters, Raiffeisen RESEARCH
Region‘s core indices
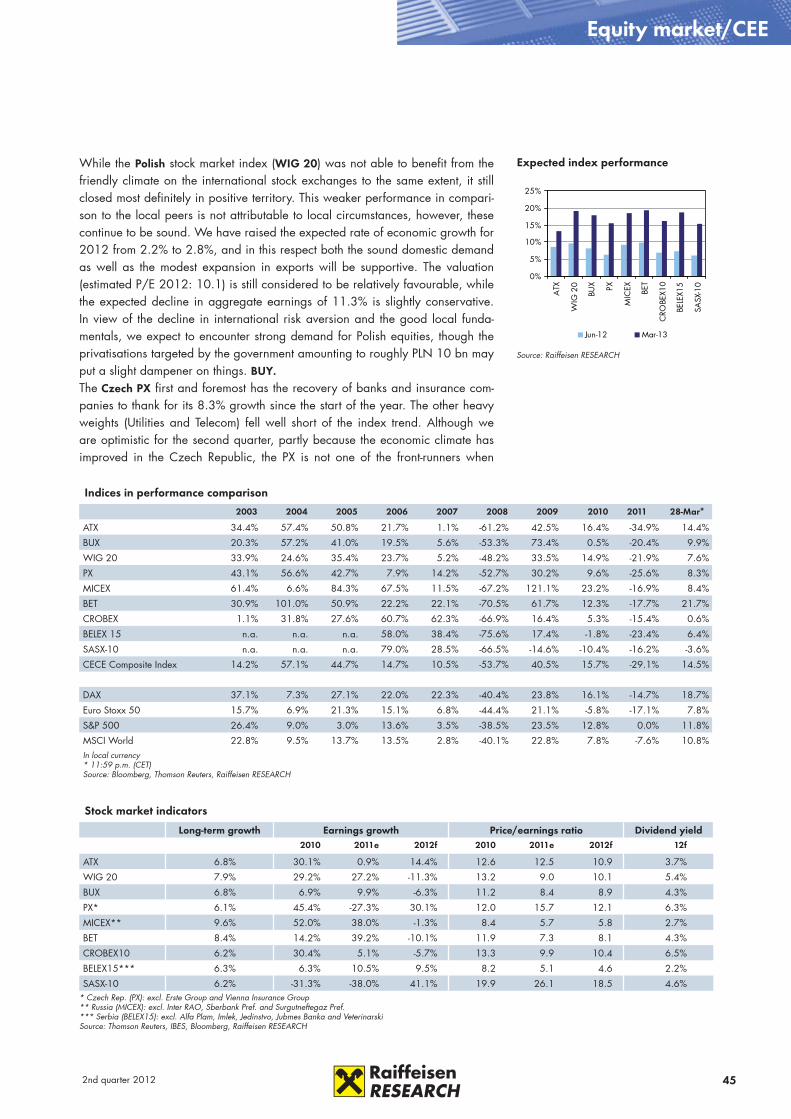
452nd quarter 2012
While the Polish stock market index (WIG 20) was not able to benefit from the friendly climate on the international stock exchanges to the same extent, it still closed most definitely in positive territory. This weaker performance in compari-son to the local peers is not attributable to local circumstances, however, these continue to be sound. We have raised the expected rate of economic growth for 2012 from 2.2% to 2.8%, and in this respect both the sound domestic demand as well as the modest expansion in exports will be supportive. The valuation (estimated P/E 2012: 10.1) is still considered to be relatively favourable, while the expected decline in aggregate earnings of 11.3% is slightly conservative. In view of the decline in international risk aversion and the good local funda-mentals, we expect to encounter strong demand for Polish equities, though the privatisations targeted by the government amounting to roughly PLN 10 bn may put a slight dampener on things. BUY.The Czech PX first and foremost has the recovery of banks and insurance com-panies to thank for its 8.3% growth since the start of the year. The other heavy weights (Utilities and Telecom) fell well short of the index trend. Although we are optimistic for the second quarter, partly because the economic climate has improved in the Czech Republic, the PX is not one of the front-runners when
Indices in performance comparison
2003 2004 2005 2006 2007 2008 2009 2010 2011 28-Mar*
ATX 34.4% 57.4% 50.8% 21.7% 1.1% -61.2% 42.5% 16.4% -34.9% 14.4%
BUX 20.3% 57.2% 41.0% 19.5% 5.6% -53.3% 73.4% 0.5% -20.4% 9.9%
WIG 20 33.9% 24.6% 35.4% 23.7% 5.2% -48.2% 33.5% 14.9% -21.9% 7.6%
PX 43.1% 56.6% 42.7% 7.9% 14.2% -52.7% 30.2% 9.6% -25.6% 8.3%
MICEX 61.4% 6.6% 84.3% 67.5% 11.5% -67.2% 121.1% 23.2% -16.9% 8.4%
BET 30.9% 101.0% 50.9% 22.2% 22.1% -70.5% 61.7% 12.3% -17.7% 21.7%
CROBEX 1.1% 31.8% 27.6% 60.7% 62.3% -66.9% 16.4% 5.3% -15.4% 0.6%
BELEX 15 n.a. n.a. n.a. 58.0% 38.4% -75.6% 17.4% -1.8% -23.4% 6.4%
SASX-10 n.a. n.a. n.a. 79.0% 28.5% -66.5% -14.6% -10.4% -16.2% -3.6%
CECE Composite Index 14.2% 57.1% 44.7% 14.7% 10.5% -53.7% 40.5% 15.7% -29.1% 14.5%
DAX 37.1% 7.3% 27.1% 22.0% 22.3% -40.4% 23.8% 16.1% -14.7% 18.7%
Euro Stoxx 50 15.7% 6.9% 21.3% 15.1% 6.8% -44.4% 21.1% -5.8% -17.1% 7.8%
S&P 500 26.4% 9.0% 3.0% 13.6% 3.5% -38.5% 23.5% 12.8% 0.0% 11.8%
MSCI World 22.8% 9.5% 13.7% 13.5% 2.8% -40.1% 22.8% 7.8% -7.6% 10.8%In local currency* 11:59 p.m. (CET)Source: Bloomberg, Thomson Reuters, Raiffeisen RESEARCH
Stock market indicators
Long-term growth Earnings growth Price/earnings ratio Dividend yield2010 2011e 2012f 2010 2011e 2012f 12f
ATX 6.8% 30.1% 0.9% 14.4% 12.6 12.5 10.9 3.7%
WIG 20 7.9% 29.2% 27.2% -11.3% 13.2 9.0 10.1 5.4%
BUX 6.8% 6.9% 9.9% -6.3% 11.2 8.4 8.9 4.3%
PX* 6.1% 45.4% -27.3% 30.1% 12.0 15.7 12.1 6.3%
MICEX** 9.6% 52.0% 38.0% -1.3% 8.4 5.7 5.8 2.7%
BET 8.4% 14.2% 39.2% -10.1% 11.9 7.3 8.1 4.3%
CROBEX10 6.2% 30.4% 5.1% -5.7% 13.3 9.9 10.4 6.5%
BELEX15*** 6.3% 6.3% 10.5% 9.5% 8.2 5.1 4.6 2.2%
SASX-10 6.2% -31.3% -38.0% 41.1% 19.9 26.1 18.5 4.6%* Czech Rep. (PX): excl. Erste Group and Vienna Insurance Group** Russia (MICEX): excl. Inter RAO, Sberbank Pref. and Surgutneftegaz Pref.*** Serbia (BELEX15): excl. Alfa Plam, Imlek, Jedinstvo, Jubmes Banka and VeterinarskiSource: Thomson Reuters, IBES, Bloomberg, Raiffeisen RESEARCH
Equity market/CEE
Expected index performance
Source: Raiffeisen RESEARCH
0%
5%
10%
15%
20%
25%
ATX
WIG
20
BUX PX
MIC
EX BET
CRO
BEX1
0
BELE
X15
SASX
-10
Jun-12 Mar-13
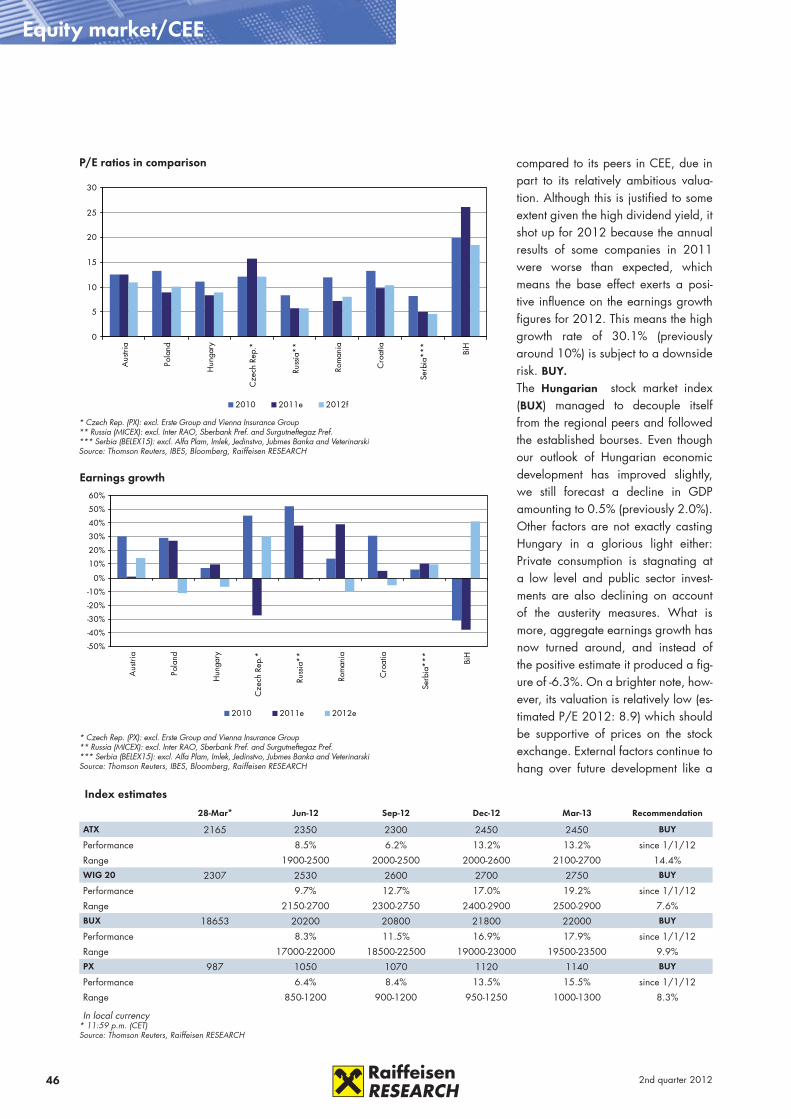
46 2nd quarter 2012
compared to its peers in CEE, due in part to its relatively ambitious valua-tion. Although this is justified to some extent given the high dividend yield, it shot up for 2012 because the annual results of some companies in 2011 were worse than expected, which means the base effect exerts a posi-tive influence on the earnings growth figures for 2012. This means the high growth rate of 30.1% (previously around 10%) is subject to a downside risk. BUY.The Hungarian stock market index (BUX) managed to decouple itself from the regional peers and followed the established bourses. Even though our outlook of Hungarian economic development has improved slightly, we still forecast a decline in GDP amounting to 0.5% (previously 2.0%). Other factors are not exactly casting Hungary in a glorious light either: Private consumption is stagnating at a low level and public sector invest-ments are also declining on account of the austerity measures. What is more, aggregate earnings growth has now turned around, and instead of the positive estimate it produced a fig-ure of -6.3%. On a brighter note, how-ever, its valuation is relatively low (es-timated P/E 2012: 8.9) which should be supportive of prices on the stock exchange. External factors continue to hang over future development like a
Equity market/CEE
Index estimates
28-Mar* Jun-12 Sep-12 Dec-12 Mar-13 Recommendation
ATX 2165 2350 2300 2450 2450 BUY
Performance 8.5% 6.2% 13.2% 13.2% since 1/1/12
Range 1900-2500 2000-2500 2000-2600 2100-2700 14.4%WIG 20 2307 2530 2600 2700 2750 BUY
Performance 9.7% 12.7% 17.0% 19.2% since 1/1/12
Range 2150-2700 2300-2750 2400-2900 2500-2900 7.6%BUX 18653 20200 20800 21800 22000 BUY
Performance 8.3% 11.5% 16.9% 17.9% since 1/1/12
Range 17000-22000 18500-22500 19000-23000 19500-23500 9.9%PX 987 1050 1070 1120 1140 BUY
Performance 6.4% 8.4% 13.5% 15.5% since 1/1/12
Range 850-1200 900-1200 950-1250 1000-1300 8.3%
In local currency* 11:59 p.m. (CET)Source: Thomson Reuters, Raiffeisen RESEARCH
0
5
10
15
20
25
30
Aus
tria
Pola
nd
Hun
gary
Cze
ch R
ep.*
Russ
ia**
Rom
ania
Cro
atia
Serb
ia**
*
BiH
2010 2011e 2012f
P/E ratios in comparison
* Czech Rep. (PX): excl. Erste Group and Vienna Insurance Group** Russia (MICEX): excl. Inter RAO, Sberbank Pref. and Surgutneftegaz Pref.*** Serbia (BELEX15): excl. Alfa Plam, Imlek, Jedinstvo, Jubmes Banka and VeterinarskiSource: Thomson Reuters, IBES, Bloomberg, Raiffeisen RESEARCH
-50%
-40%
-30%
-20%
-10%
0%
10%
20%
30%
40%
50%
60%
Aus
tria
Pola
nd
Hun
gary
Cze
ch R
ep.*
Russ
ia**
Rom
ania
Cro
atia
Serb
ia**
*
BiH
2010 2011e 2012e
Earnings growth
* Czech Rep. (PX): excl. Erste Group and Vienna Insurance Group** Russia (MICEX): excl. Inter RAO, Sberbank Pref. and Surgutneftegaz Pref.*** Serbia (BELEX15): excl. Alfa Plam, Imlek, Jedinstvo, Jubmes Banka and VeterinarskiSource: Thomson Reuters, IBES, Bloomberg, Raiffeisen RESEARCH
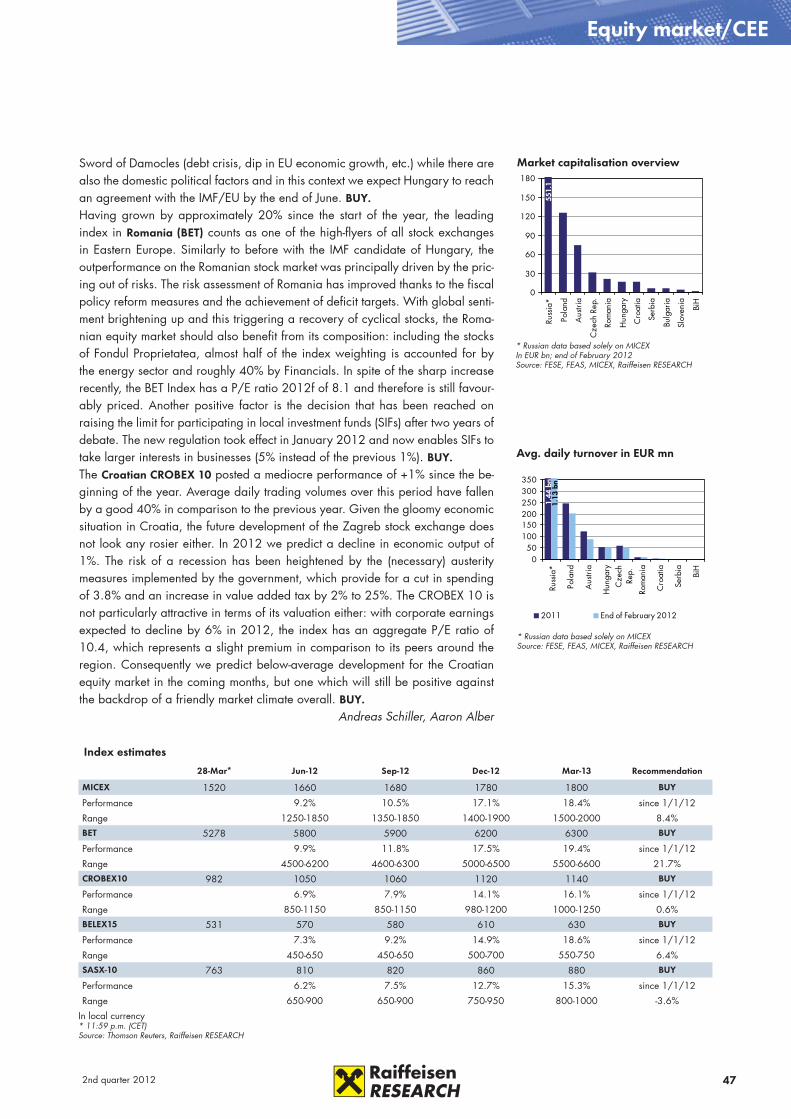
472nd quarter 2012
Equity market/CEE
0
30
60
90
120
150
180
Russ
ia*
Pola
nd
Aus
tria
Cze
ch R
ep.
Rom
ania
Hun
gary
Cro
atia
Serb
ia
Bulg
aria
Slov
enia
BiH
551.
1
Market capitalisation overview
* Russian data based solely on MICEXIn EUR bn; end of February 2012Source: FESE, FEAS, MICEX, Raiffeisen RESEARCH
050
100150200250300350
Russ
ia*
Pola
nd
Aus
tria
Hun
gary
Cze
chRe
p.
Rom
ania
Cro
atia
Serb
ia
BiH
2011 End of February 2012
1.13
bn
1.4
4 bn
Avg. daily turnover in EUR mn
* Russian data based solely on MICEXSource: FESE, FEAS, MICEX, Raiffeisen RESEARCH
Index estimates
28-Mar* Jun-12 Sep-12 Dec-12 Mar-13 Recommendation
MICEX 1520 1660 1680 1780 1800 BUY
Performance 9.2% 10.5% 17.1% 18.4% since 1/1/12
Range 1250-1850 1350-1850 1400-1900 1500-2000 8.4%BET 5278 5800 5900 6200 6300 BUY
Performance 9.9% 11.8% 17.5% 19.4% since 1/1/12
Range 4500-6200 4600-6300 5000-6500 5500-6600 21.7%CROBEX10 982 1050 1060 1120 1140 BUY
Performance 6.9% 7.9% 14.1% 16.1% since 1/1/12
Range 850-1150 850-1150 980-1200 1000-1250 0.6%BELEX15 531 570 580 610 630 BUY
Performance 7.3% 9.2% 14.9% 18.6% since 1/1/12
Range 450-650 450-650 500-700 550-750 6.4%SASX-10 763 810 820 860 880 BUY
Performance 6.2% 7.5% 12.7% 15.3% since 1/1/12
Range 650-900 650-900 750-950 800-1000 -3.6%In local currency* 11:59 p.m. (CET)Source: Thomson Reuters, Raiffeisen RESEARCH
Sword of Damocles (debt crisis, dip in EU economic growth, etc.) while there are also the domestic political factors and in this context we expect Hungary to reach an agreement with the IMF/EU by the end of June. BUY.Having grown by approximately 20% since the start of the year, the leading index in Romania (BET) counts as one of the high-flyers of all stock exchanges in Eastern Europe. Similarly to before with the IMF candidate of Hungary, the outperformance on the Romanian stock market was principally driven by the pric-ing out of risks. The risk assessment of Romania has improved thanks to the fiscal policy reform measures and the achievement of deficit targets. With global senti-ment brightening up and this triggering a recovery of cyclical stocks, the Roma-nian equity market should also benefit from its composition: including the stocks of Fondul Proprietatea, almost half of the index weighting is accounted for by the energy sector and roughly 40% by Financials. In spite of the sharp increase recently, the BET Index has a P/E ratio 2012f of 8.1 and therefore is still favour-ably priced. Another positive factor is the decision that has been reached on raising the limit for participating in local investment funds (SIFs) after two years of debate. The new regulation took effect in January 2012 and now enables SIFs to take larger interests in businesses (5% instead of the previous 1%). BUY.The Croatian CROBEX 10 posted a mediocre performance of +1% since the be-ginning of the year. Average daily trading volumes over this period have fallen by a good 40% in comparison to the previous year. Given the gloomy economic situation in Croatia, the future development of the Zagreb stock exchange does not look any rosier either. In 2012 we predict a decline in economic output of 1%. The risk of a recession has been heightened by the (necessary) austerity measures implemented by the government, which provide for a cut in spending of 3.8% and an increase in value added tax by 2% to 25%. The CROBEX 10 is not particularly attractive in terms of its valuation either: with corporate earnings expected to decline by 6% in 2012, the index has an aggregate P/E ratio of 10.4, which represents a slight premium in comparison to its peers around the region. Consequently we predict below-average development for the Croatian equity market in the coming months, but one which will still be positive against the backdrop of a friendly market climate overall. BUY.
Andreas Schiller, Aaron Alber
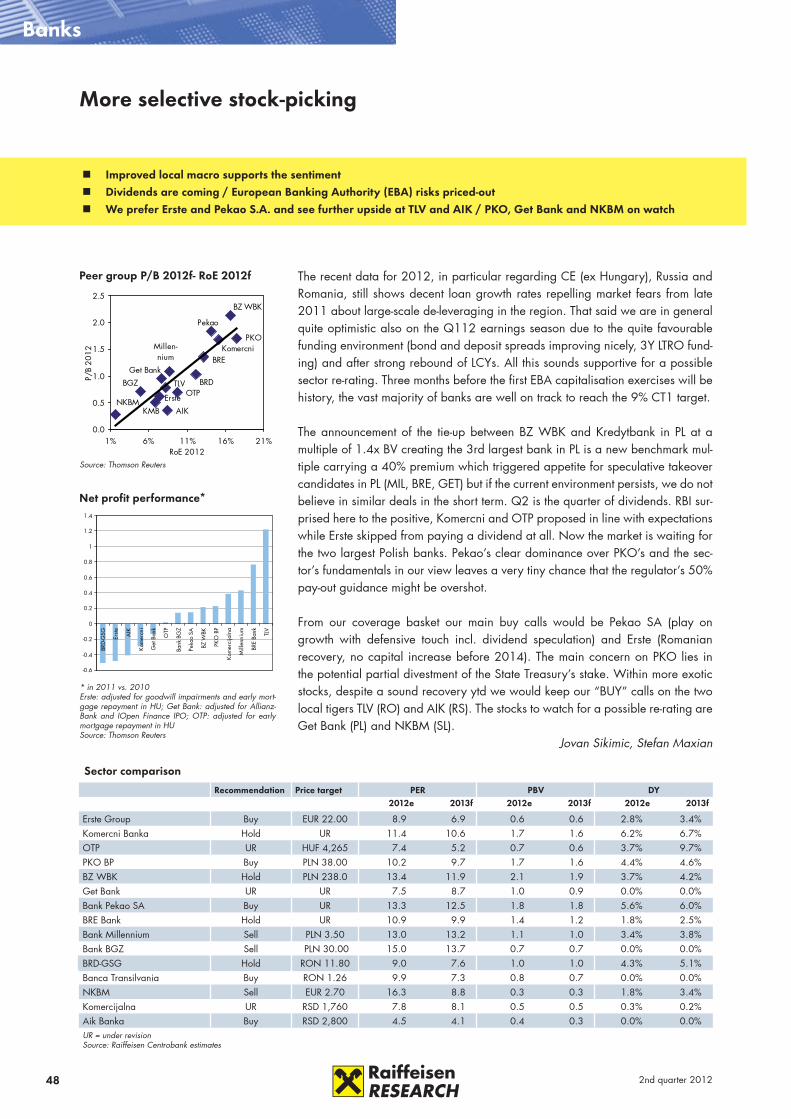
48 2nd quarter 2012
Banks
The recent data for 2012, in particular regarding CE (ex Hungary), Russia and Romania, still shows decent loan growth rates repelling market fears from late 2011 about large-scale de-leveraging in the region. That said we are in general quite optimistic also on the Q112 earnings season due to the quite favourable funding environment (bond and deposit spreads improving nicely, 3Y LTRO fund-ing) and after strong rebound of LCYs. All this sounds supportive for a possible sector re-rating. Three months before the first EBA capitalisation exercises will be history, the vast majority of banks are well on track to reach the 9% CT1 target.
The announcement of the tie-up between BZ WBK and Kredytbank in PL at a multiple of 1.4x BV creating the 3rd largest bank in PL is a new benchmark mul-tiple carrying a 40% premium which triggered appetite for speculative takeover candidates in PL (MIL, BRE, GET) but if the current environment persists, we do not believe in similar deals in the short term. Q2 is the quarter of dividends. RBI sur-prised here to the positive, Komercni and OTP proposed in line with expectations while Erste skipped from paying a dividend at all. Now the market is waiting for the two largest Polish banks. Pekao’s clear dominance over PKO’s and the sec-tor’s fundamentals in our view leaves a very tiny chance that the regulator’s 50% pay-out guidance might be overshot.
From our coverage basket our main buy calls would be Pekao SA (play on growth with defensive touch incl. dividend speculation) and Erste (Romanian recovery, no capital increase before 2014). The main concern on PKO lies in the potential partial divestment of the State Treasury’s stake. Within more exotic stocks, despite a sound recovery ytd we would keep our “BUY” calls on the two local tigers TLV (RO) and AIK (RS). The stocks to watch for a possible re-rating are Get Bank (PL) and NKBM (SL).
Jovan Sikimic, Stefan Maxian
More selective stock-picking
Improved local macro supports the sentiment Dividends are coming / European Banking Authority (EBA) risks priced-out We prefer Erste and Pekao S.A. and see further upside at TLV and AIK / PKO, Get Bank and NKBM on watch
Sector comparison
Recommendation Price target PER PBV DY2012e 2013f 2012e 2013f 2012e 2013f
Erste Group Buy EUR 22.00 8.9 6.9 0.6 0.6 2.8% 3.4%Komercni Banka Hold UR 11.4 10.6 1.7 1.6 6.2% 6.7%OTP UR HUF 4,265 7.4 5.2 0.7 0.6 3.7% 9.7%PKO BP Buy PLN 38.00 10.2 9.7 1.7 1.6 4.4% 4.6%BZ WBK Hold PLN 238.0 13.4 11.9 2.1 1.9 3.7% 4.2%Get Bank UR UR 7.5 8.7 1.0 0.9 0.0% 0.0%Bank Pekao SA Buy UR 13.3 12.5 1.8 1.8 5.6% 6.0%BRE Bank Hold UR 10.9 9.9 1.4 1.2 1.8% 2.5%Bank Millennium Sell PLN 3.50 13.0 13.2 1.1 1.0 3.4% 3.8%Bank BGZ Sell PLN 30.00 15.0 13.7 0.7 0.7 0.0% 0.0%BRD-GSG Hold RON 11.80 9.0 7.6 1.0 1.0 4.3% 5.1%Banca Transilvania Buy RON 1.26 9.9 7.3 0.8 0.7 0.0% 0.0%NKBM Sell EUR 2.70 16.3 8.8 0.3 0.3 1.8% 3.4%Komercijalna UR RSD 1,760 7.8 8.1 0.5 0.5 0.3% 0.2%Aik Banka Buy RSD 2,800 4.5 4.1 0.4 0.3 0.0% 0.0%UR = under revisionSource: Raiffeisen Centrobank estimates
KMB
Komercni
TLV BRD
NKBM Erste OTP
PKO
BZ WBK
Get Bank
Pekao
BRE
Millen-nium
BGZ
AIK
0.0
0.5
1.0
1.5
2.0
2.5
1% 6% 11% 16% 21%RoE 2012
P/B
2012
Source: Thomson Reuters
Peer group P/B 2012f- RoE 2012f
-0.6
-0.4
-0.2
0
0.2
0.4
0.6
0.8
1
1.2
1.4
BRD-
GSG
Erste AIK
Kom
ercn
i
Get
Ban
k
OTP
Bank
BG
Z
Peka
o SA
BZ W
BK
PKO
BP
Kom
erci
jaln
a
Mill
enni
um
BRE
Bank TLV
* in 2011 vs. 2010Erste: adjusted for goodwill impairments and early mort-gage repayment in HU; Get Bank: adjusted for Allianz-Bank and IOpen Finance IPO; OTP: adjusted for early mortgage repayment in HUSource: Thomson Reuters
Net profit performance*
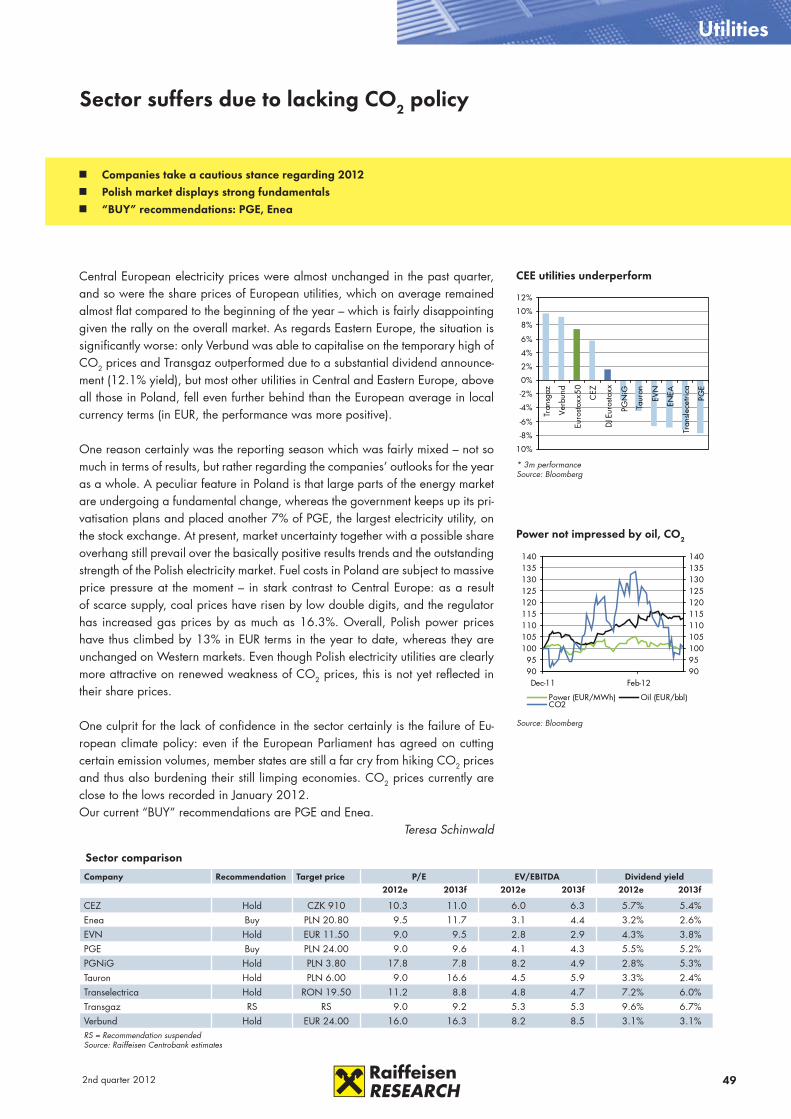
492nd quarter 2012
Utilities
Sector comparison
Company Recommendation Target price P/E EV/EBITDA Dividend yield2012e 2013f 2012e 2013f 2012e 2013f
CEZ Hold CZK 910 10.3 11.0 6.0 6.3 5.7% 5.4%Enea Buy PLN 20.80 9.5 11.7 3.1 4.4 3.2% 2.6%EVN Hold EUR 11.50 9.0 9.5 2.8 2.9 4.3% 3.8%PGE Buy PLN 24.00 9.0 9.6 4.1 4.3 5.5% 5.2%PGNiG Hold PLN 3.80 17.8 7.8 8.2 4.9 2.8% 5.3%Tauron Hold PLN 6.00 9.0 16.6 4.5 5.9 3.3% 2.4%Transelectrica Hold RON 19.50 11.2 8.8 4.8 4.7 7.2% 6.0%Transgaz RS RS 9.0 9.2 5.3 5.3 9.6% 6.7%Verbund Hold EUR 24.00 16.0 16.3 8.2 8.5 3.1% 3.1%RS = Recommendation suspendedSource: Raiffeisen Centrobank estimates
Sector suffers due to lacking CO2 policy
Companies take a cautious stance regarding 2012 Polish market displays strong fundamentals “BUY” recommendations: PGE, Enea
-10%
-8%
-6%
-4%
-2%
0%
2%
4%
6%
8%
10%
12%
Tran
sgaz
Verb
und
Euro
stoxx
50
CEZ
DJ E
uros
toxx
PGN
iG
Taur
on
EVN
ENEA
Tran
slece
trica
PGE
* 3m performanceSource: Bloomberg
CEE utilities underperform
9095
100105110115120125130135140
Dec-11 Feb-129095100105110115120125130135140
Power (EUR/MWh) Oil (EUR/bbl)CO2
Source: Bloomberg
Power not impressed by oil, CO2
Central European electricity prices were almost unchanged in the past quarter, and so were the share prices of European utilities, which on average remained almost flat compared to the beginning of the year – which is fairly disappointing given the rally on the overall market. As regards Eastern Europe, the situation is significantly worse: only Verbund was able to capitalise on the temporary high of CO2 prices and Transgaz outperformed due to a substantial dividend announce-ment (12.1% yield), but most other utilities in Central and Eastern Europe, above all those in Poland, fell even further behind than the European average in local currency terms (in EUR, the performance was more positive).
One reason certainly was the reporting season which was fairly mixed – not so much in terms of results, but rather regarding the companies’ outlooks for the year as a whole. A peculiar feature in Poland is that large parts of the energy market are undergoing a fundamental change, whereas the government keeps up its pri-vatisation plans and placed another 7% of PGE, the largest electricity utility, on the stock exchange. At present, market uncertainty together with a possible share overhang still prevail over the basically positive results trends and the outstanding strength of the Polish electricity market. Fuel costs in Poland are subject to massive price pressure at the moment – in stark contrast to Central Europe: as a result of scarce supply, coal prices have risen by low double digits, and the regulator has increased gas prices by as much as 16.3%. Overall, Polish power prices have thus climbed by 13% in EUR terms in the year to date, whereas they are unchanged on Western markets. Even though Polish electricity utilities are clearly more attractive on renewed weakness of CO2 prices, this is not yet reflected in their share prices.
One culprit for the lack of confidence in the sector certainly is the failure of Eu-ropean climate policy: even if the European Parliament has agreed on cutting certain emission volumes, member states are still a far cry from hiking CO2 prices and thus also burdening their still limping economies. CO2 prices currently are close to the lows recorded in January 2012. Our current “BUY” recommendations are PGE and Enea.
Teresa Schinwald

50 2nd quarter 2012
Telecommunication
An improvement in trend dynamics
Sector comparison
Company Recommendation Target price P/E EV/EBITDA Dividend yield2012e 2013f 2012e 2013f 2012e 2013f
Telekom Austria Hold EUR 9.60 23.3 17.6 5.9 5.4 4.3% 5.1%Hrvatski Telekom Hold HRK 253.0 9.9 9.6 3.8 3.7 10.7% 10.5%Magyar Telekom Hold HUF 590.0 12.2 8.9 4.9 4.4 8.7% 11.3%Telefonica CR Hold CZK 428.0 15.0 14.4 5.8 5.9 10.3% 9.0%TPSA Hold PLN 19.40 18.5 15.4 5.0 4.7 8.9% 8.9%Netia Hold PLN 7.10 44.3 15.9 4.9 3.9 1.8% 5.0%MTS Buy USD 20.40 13.6 12.0 4.7 4.3 4.4% 5.0%VimpelCom Ltd Hold UR 8.4 25.7 4.3 5.4 7.1% 7.1%UR = under revisionSource: Raiffeisen Centrobank estimates
CEE incumbents published their results broadly in line with our and market expec-tations in Q4 2011. Key sets of figures showed an improvement in the underlying trends. Top line performance ranged from -5.9% yoy (TPSA) to 1.5% yoy (Mag-yar Telekom) while growth rates in adjusted EBITDA were between -9.8% yoy (TPSA) and 2.0% yoy (T-HT) in Q4 2011. Fixed line revenues were negatively influenced by ongoing fixed-to-mobile substitution. Internet revenues grew only moderately except at T-HT, whose internet revenues jumped by 10.5% yoy. CEE mobile revenues were under pressure in all cases due to gradual MTR cuts and intense competition (e.g. Vodafone’s tariff reduction in the corporate segment in the Czech Republic). Sales of smart phones were picking up and represented between 35% (TPSA) and 78% (MT) of handset sales in the post-paid segment. Smart phone penetration stood between 14% (TPSA) and 19.5% (Telefonica CR) in CE-3 countries (Poland, Hungary and Czech Republic) in Q4 11. The positive surprise was the proposed share buyback of up to 10% of Telefonica CR shares. For this year we expect moderate improvement in top line trends and limited EBITDA margin erosion. In addition we expect the CE-3 incumbents to pay stable dividends this year. In our opinion, the relatively high dividend yields limit the downside potential of the covered stocks in these uncertain times. We have a generally positive outlook on the Russian stock market, mostly driven by external factors, such as global macro and liquidity. On the other hand, there is a downside risk from the oil price, as Saudi Arabia has recently expressed its intention to increase oil supply, which should push the price down. Our top pick for the quarter is MTS, which is expected to post strong Q1 12 results on good economic trends and consumption statistics, pays dividends yielding 4.8-5.7% with an ex-date in early May and exhibits lower dependence on the oil price compared to commodity stocks.
Jindrich Svatek
No operating rebound in FY 2012 Telefonica CR to propose a share buyback Demand for smart phones is growing
-10.0% -5.0% 0.0% 5.0%
TO2CR
T-HT
MT
TPSA
TA
Sales adj. EBITDA
Source: Company data, Raiffeisen Centrobank
Sales and EBITDA Q4 11 yoy
0.0%
2.0%
4.0%
6.0%
8.0%
10.0%
12.0%
TO2CR T-HT MT TPSA TA
Div yield 11e Spread*Spread between 10y gov. yields and div. yieldsSource: Company data, Bloomberg, Raiffeisen Centro bank
Dividend yields vs bond yields*
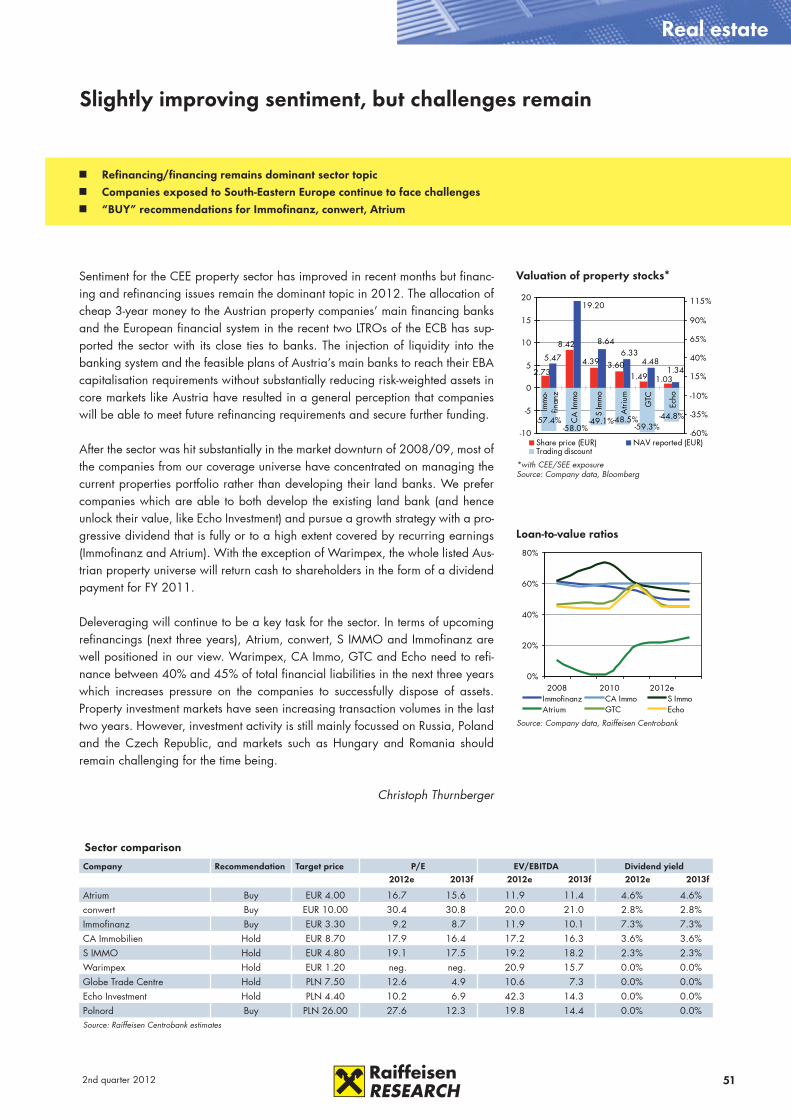
512nd quarter 2012
Real estate
Sentiment for the CEE property sector has improved in recent months but financ-ing and refinancing issues remain the dominant topic in 2012. The allocation of cheap 3-year money to the Austrian property companies’ main financing banks and the European financial system in the recent two LTROs of the ECB has sup-ported the sector with its close ties to banks. The injection of liquidity into the banking system and the feasible plans of Austria’s main banks to reach their EBA capitalisation requirements without substantially reducing risk-weighted assets in core markets like Austria have resulted in a general perception that companies will be able to meet future refinancing requirements and secure further funding.
After the sector was hit substantially in the market downturn of 2008/09, most of the companies from our coverage universe have concentrated on managing the current properties portfolio rather than developing their land banks. We prefer companies which are able to both develop the existing land bank (and hence unlock their value, like Echo Investment) and pursue a growth strategy with a pro-gressive dividend that is fully or to a high extent covered by recurring earnings (Immofinanz and Atrium). With the exception of Warimpex, the whole listed Aus-trian property universe will return cash to shareholders in the form of a dividend payment for FY 2011.
Deleveraging will continue to be a key task for the sector. In terms of upcoming refinancings (next three years), Atrium, conwert, S IMMO and Immofinanz are well positioned in our view. Warimpex, CA Immo, GTC and Echo need to refi-nance between 40% and 45% of total financial liabilities in the next three years which increases pressure on the companies to successfully dispose of assets. Property investment markets have seen increasing transaction volumes in the last two years. However, investment activity is still mainly focussed on Russia, Poland and the Czech Republic, and markets such as Hungary and Romania should remain challenging for the time being.
Christoph Thurnberger
Sector comparison
Company Recommendation Target price P/E EV/EBITDA Dividend yield2012e 2013f 2012e 2013f 2012e 2013f
Atrium Buy EUR 4.00 16.7 15.6 11.9 11.4 4.6% 4.6%conwert Buy EUR 10.00 30.4 30.8 20.0 21.0 2.8% 2.8%Immofinanz Buy EUR 3.30 9.2 8.7 11.9 10.1 7.3% 7.3%CA Immobilien Hold EUR 8.70 17.9 16.4 17.2 16.3 3.6% 3.6%S IMMO Hold EUR 4.80 19.1 17.5 19.2 18.2 2.3% 2.3%Warimpex Hold EUR 1.20 neg. neg. 20.9 15.7 0.0% 0.0%Globe Trade Centre Hold PLN 7.50 12.6 4.9 10.6 7.3 0.0% 0.0%Echo Investment Hold PLN 4.40 10.2 6.9 42.3 14.3 0.0% 0.0%Polnord Buy PLN 26.00 27.6 12.3 19.8 14.4 0.0% 0.0%Source: Raiffeisen Centrobank estimates
Slightly improving sentiment, but challenges remain
Refinancing/financing remains dominant sector topic Companies exposed to South-Eastern Europe continue to face challenges “BUY” recommendations for Immofinanz, conwert, Atrium
1.031.493.604.39
2.73
8.42
1.344.48
6.338.64
19.20
5.47
-57.4%-58.0%
-49.1%-48.5%-59.3%
-44.8%
-10
-5
0
5
10
15
20
Imm
o-fin
anz
CA
Imm
o
S Im
mo
Atri
um
GTC
Echo
-60%
-35%
-10%
15%
40%
65%
90%
115%
Share price (EUR) NAV reported (EUR)Trading discount
*with CEE/SEE exposure Source: Company data, Bloomberg
Valuation of property stocks*
0%
20%
40%
60%
80%
2008 2010 2012eImmofinanz CA Immo S ImmoAtrium GTC Echo
Source: Company data, Raiffeisen Centrobank
Loan-to-value ratios

52 2nd quarter 2012
Metals & Mining
In Q1 12 we saw quite impressive growth in metals prices which was supported by the Fed’s prolonged loose monetary policy and cash injections by the ECB. On the back of respective 11% ytd and 15% ytd growth in CRC and HRC global benchmark prices some steel stocks substantially appreciated (Severstal +18% ytd; voestalpine +17% ytd; Nippon Steel +18% ytd). However, in our view the re-cent steel price move came too fast as demand from end-users remains subdued. We therefore anticipate that in Q2 12e further appreciation in steel prices should be limited which should put pressure on the sector.
Given the forthcoming reporting season for Russian steel names we anticipate steels to enter a roller coaster. The expected poor performance of Financials in 2011 might be offset by a brighter performance in H1 2012, which could prevent steel stocks from a sharp drop and might even provide room for further growth. We stick to our neutral view on the sector but recommend keeping an eye on the cost-efficient names (NLMK and Severstal).
High volatility in EUR/USD has been the core headwind for precious metals’ prices in the past three months, leading some investors to question the safe-haven status of gold. Given a slightly improving economic outlook for the USA amid China’s slowdown and an increase in import taxes on gold from 2% to 4% in India, downside pressure on the gold price (in particular) should remain high in Q2 12e. We also expect plenty of room for sideways movements in other metals’ prices (e.g. copper and aluminium). China’s fiscal “black box” plays the key role determining the further direction. Weakening economic data should proportion-ally increase the probability of introduction of an additional loosening in China which is why we believe there should be some upside potential at the end of the quarter.
Iryna Trygub-Kainz
Metals & Mining - On a roller coaster
Sector comparison
Company Recommendation Target price P/E EV Sales EV/EBITDA2012e 2013f 2012e 2013f 2012e 2013f
AMAG Buy EUR 23.00 10.4 8.9 0.9 0.9 5.6 5.2Bogdanka Buy PLN 170.0 9.8 6.7 2.4 1.7 6.0 4.1Evraz Hold GBP 477.0 9.9 6.0 0.9 0.8 4.4 3.5MMK Hold USD 7.10 16.1 8.1 0.8 0.7 5.0 3.4NLMK Buy USD 28.60 6.5 5.3 1.0 0.8 4.3 3.3Polymetal International Buy GBP 1,171 10.7 9.0 3.8 3.2 8.1 8.6Severstal Buy USD 17.70 5.7 5.0 0.8 0.7 3.7 3.2Source: Raiffeisen Centrobank estimates
Weak end-user demand limits robust steel price growth Outlook for Q2 12e is pressured by China Roller coaster ride for metals continues
15.44%
14.50%
10.34%
10.01%
9.79%
6.04%
5.48%
0.00%
-6.42%
CRC
Silver
Iron ore 62%/65% Fe
Copper
HRC
Gold
Aluminium
Coking Coal
Nickel
HRC = Hot Rolled Coil; CRC = Cold Rolled CoilPerformance from Jan 1, 2012 up to March 26, 2012Source: Bloomberg
Performance Q1 2012
0
50
100
150
200
250
300
350
400
Jan-11 Apr-11 Jul-11 Sep-11 Dec-11
000
t
0
100
200
300
400
500
600
700
800
900
USD
per
t
China steel inventory, weekly, 000 tHRC, USD/t, global benchmark
Source: Bloomberg
China – steel inventories vs HRC price
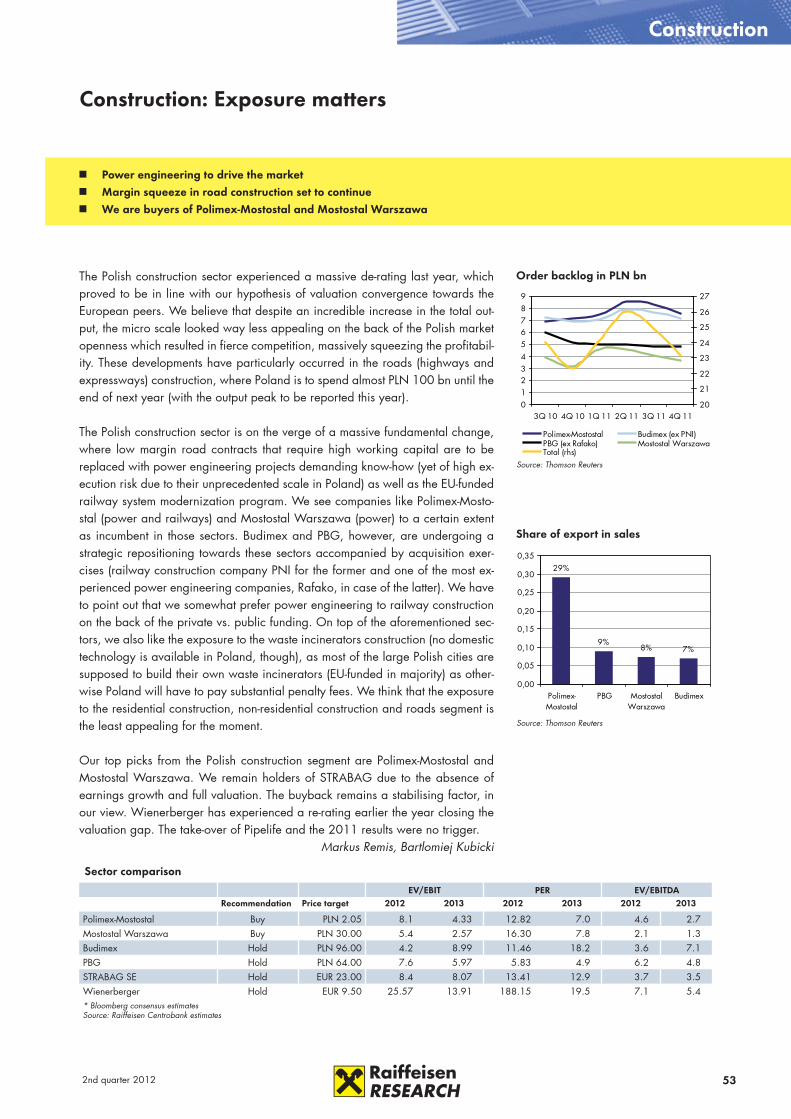
532nd quarter 2012
Construction
Sector comparison
EV/EBIT PER EV/EBITDARecommendation Price target 2012 2013 2012 2013 2012 2013
Polimex-Mostostal Buy PLN 2.05 8.1 4.33 12.82 7.0 4.6 2.7Mostostal Warszawa Buy PLN 30.00 5.4 2.57 16.30 7.8 2.1 1.3Budimex Hold PLN 96.00 4.2 8.99 11.46 18.2 3.6 7.1PBG Hold PLN 64.00 7.6 5.97 5.83 4.9 6.2 4.8STRABAG SE Hold EUR 23.00 8.4 8.07 13.41 12.9 3.7 3.5Wienerberger Hold EUR 9.50 25.57 13.91 188.15 19.5 7.1 5.4* Bloomberg consensus estimatesSource: Raiffeisen Centrobank estimates
Construction: Exposure matters
Power engineering to drive the market Margin squeeze in road construction set to continue We are buyers of Polimex-Mostostal and Mostostal Warszawa
0123456789
3Q 10 4Q 10 1Q 11 2Q 11 3Q 11 4Q 1120
21
22
23
24
25
26
27
Polimex-Mostostal Budimex (ex PNI)PBG (ex Rafako) Mostostal WarszawaTotal (rhs)
Source: Thomson Reuters
Order backlog in PLN bn
29%
9%8% 7%
0,00
0,05
0,10
0,15
0,20
0,25
0,30
0,35
Polimex-Mostostal
PBG MostostalWarszawa
Budimex
Source: Thomson Reuters
Share of export in sales
The Polish construction sector experienced a massive de-rating last year, which proved to be in line with our hypothesis of valuation convergence towards the European peers. We believe that despite an incredible increase in the total out-put, the micro scale looked way less appealing on the back of the Polish market openness which resulted in fierce competition, massively squeezing the profitabil-ity. These developments have particularly occurred in the roads (highways and expressways) construction, where Poland is to spend almost PLN 100 bn until the end of next year (with the output peak to be reported this year).
The Polish construction sector is on the verge of a massive fundamental change, where low margin road contracts that require high working capital are to be replaced with power engineering projects demanding know-how (yet of high ex-ecution risk due to their unprecedented scale in Poland) as well as the EU-funded railway system modernization program. We see companies like Polimex-Mosto-stal (power and railways) and Mostostal Warszawa (power) to a certain extent as incumbent in those sectors. Budimex and PBG, however, are undergoing a strategic repositioning towards these sectors accompanied by acquisition exer-cises (railway construction company PNI for the former and one of the most ex-perienced power engineering companies, Rafako, in case of the latter). We have to point out that we somewhat prefer power engineering to railway construction on the back of the private vs. public funding. On top of the aforementioned sec-tors, we also like the exposure to the waste incinerators construction (no domestic technology is available in Poland, though), as most of the large Polish cities are supposed to build their own waste incinerators (EU-funded in majority) as other-wise Poland will have to pay substantial penalty fees. We think that the exposure to the residential construction, non-residential construction and roads segment is the least appealing for the moment.
Our top picks from the Polish construction segment are Polimex-Mostostal and Mostostal Warszawa. We remain holders of STRABAG due to the absence of earnings growth and full valuation. The buyback remains a stabilising factor, in our view. Wienerberger has experienced a re-rating earlier the year closing the valuation gap. The take-over of Pipelife and the 2011 results were no trigger.
Markus Remis, Bartlomiej Kubicki

54 2nd quarter 2012
Key ratios
2010/11 2011/12e 2012/13f 2013/14f
EPS 0.31 0.26 0.30 0.32
PER 10.3 10.5 9.2 8.7
Operating CF per share 0.17 0.23 0.15 0.18
Price cash flow 18.8 11.8 18.2 15.0
Book value per share 5.48 5.32 5.47 5.59
Price book value 0.6 0.5 0.5 0.5
Dividend yield 3.1% 5.5% 7.3% 7.3%
ROE 6.2% 4.8% 5.5% 5.7%
ROCE 5.1% 4.7% 5.2% 5.5%
EV/EBITDA 14.6 12.8 11.9 10.1Source: Immofinanz, Raiffeisen Centrobank estimates
Immofinanz remains our top-pick in the CEE property universe. The company pursues a growth strategy but at the same time seeks to strengthen its profile as a property investment company with rising recurring earnings. The balanced developer-investor profile with a progressive dividend policy offers an appealing investment proposition. Immofinanz still is an optimisation story with significant value generation potential. Until recently, the Immofinanz executives were fully occupied with managing a distressed company and have now shifted their op-erational focus towards sustainable growth and strengthening the group’s profit-ability. The portfolio streamlining gained first momentum in FY 2010/11. Immofi-nanz’s cost structure is still heavily affected by its formerly dubious and inefficient corporate structure and high restructuring expenses, which offers significant oper-ating upside when the targeted quarterly cost run rates are achieved.
Immofinanz’s recently reported Q3 11/12 results showed a stronger rental income development than ex-pected. The improvement was driven by several development completions in the second quarter. That notwith-standing, the group’s EBITDA was hit by a negative one-off effect with re-spect to the first-time consolidation of Romanian developer Adama. In addi-tion, the company announced the ac-quisition of the remaining 50% stake in the Golden Babylon Rostokino shopping centre in Moscow - which is one of the biggest in Continental Europe - with a gross lettable area of approx. 168,000 sqm. The deal will give a significant boost to the group’s rental income and it will bring the com-pany much closer to its FY 2012/13 EBITDA target of EUR 600 mn. How-ever, a question still looms around the refinancing of the property given that Immofinanz’s share is 100% equity fi-nanced. We would expect a positive news-flow on this issue in the coming weeks which should be a short-term trigger for the stock.
Christoph Thurnberger
Immofinanz: Still the favourite in the CEE property universe
Equities - top picks
Income statement & balance sheet (IFRS)
in EUR mn 2010/11 2011/12e 2012/13f 2013/14f
Income Statement
Consolidated sales 763 775 900 940
EBITDA 453 484 564 606
EBIT 419 484 556 598
EBT 342 287 343 362
Net profit b.m. 308 258 307 327
Net profit a.m. 310 258 307 327
Balance sheet
Total assets 11,756 11,456 11,484 11,459
Shareholders' equity 5,156 5,518 5,670 5,790
Goodwill 202 202 202 202
NIBD 3,958 3,688 4,171 3,527Source: Immofinanz, Raiffeisen Centrobank estimates
* the indicated price is the last price as available at 6.30 a.m. (CET) on 28 March 2012
Recommendation: BUY Current share price: EUR 2.74 / Target price: EUR 3.30 Market capitalisation: EUR 2,836 mn
A M J J A S O N D J F M 55
60
65
70
75
80
85
90
95
100
105
IMMOFINANZATX - AUSTRIAN TRADED INDEX - PRICE INDEX
Source: Thomson Reuters
Immofinanz

552nd quarter 2012
We think that AMAG represents a quality play to participate in the secular de-mand growth for aluminium products. The company combines attractive assets in the upstream (via its 20% stake in Alouette) and downstream (Ranshofen site, the single largest scrap recycler in Europe) worlds. Following record EBITDA in FY 11, FY 12e should be determined by lower earnings but the installation of incremental capacity in Ranshofen allows to restore volume growth.
The management has given the green light for a substantial capacity expansion in Ranshofen. A new rolling mill allowing for the production of wider and thicker products should boost capacity by 50% to 225k tons per annum by 2015. Roll-ing slab production will be increased in two stages from 180k tons to 270k tons by 2017. Over the next three years EUR 220 mn will be invested. With a gearing of only 2% at YE 11 AMAG’s balance sheet provides a strong base for the in-vestment plans. We also highlight that the envisaged expansion of Alouette (not yet formally decided) would give AMAG nearly 60% more primary alu-minium capacity and thus add more flavour for growth.
In FY 11 AMAG operated at virtually full capacity utilisation, implying that growth was primarily driven by the LME price and product mix effects. As initial incremental capacity will not become available until 2013 we char-acterise the current year as a transi-tion period. The management has already indicated that EBITDA will be down yoy due to capacity constraints, a lower average LME price and input cost inflation. We expect a 15% de-cline to EUR 127 mn, inducing an EPS drop to EUR 1.81 (-26% yoy).
We expect AMAG to return to growth in FY 13e driven by higher down-stream volumes and prices (consensus LME price USD 2,400). We project EBITDA of EUR 143.5 mn (+13% yoy) and EPS of EUR 2.12 (+17%). The trend should continue into FY 14e for which we forecast EBITDA and EPS to reach EUR 158.7 mn and EUR 2.37, respectively.
Markus Remis
Key ratios
2011 2012e 2013f 2014f
EPS 2.44 1.81 2.12 2.37
PER 6.5 10.4 8.9 8.0
Operating CF per share 2.96 3.42 2.78 3.02
Price cash flow 5.3 5.5 6.8 6.3
Book value per share 15.39 15.70 17.37 19.20
Price book value 1.0 1.2 1.1 1.0
Dividend yield 9.5% 2.4% 2.8% 3.1%
ROE 19.9% 11.6% 12.9% 12.9%
ROCE 16.3% 11.1% 11.8% 11.8%
EV/EBITDA 3.8 5.6 5.2 5.0Source: AMAG, Raiffeisen Centrobank estimates
AMAG: An attractively priced quality aluminium play
Income statement & balance sheet (IFRS)
EUR mn 2011 2012e 2013f 2014f
Income Statement
Consolidated sales 813 775 853 939
EBITDA 150 127 143 159
EBIT 104 80 94 107
EBT 99 75 88 98
Net profit b.m. 88 64 75 83
Net profit a.m. 86 64 75 83
Balance sheet
Total assets 876 915 1,009 1,113
Shareholders' equity 543 554 612 677
Goodwill 0 0 0 0
NIBD 13 46 93 136Source: AMAG, Raiffeisen Centrobank estimates
Equities - top picks
* the indicated price is the last price as available at 6.30 a.m. (CET) on 28 March 2012
Recommendation: BUY Current share price: EUR 18.90*/ Target price: EUR 23.00 Market capitalisation: EUR 666 mn
MAY JUL SEP NOV JAN MAR 50
60
70
80
90
100
110
AMAG AUSTRIA METALL ATX - AUSTRIAN TRADED INDEX - PRICE INDEX
Source: Thomson Reuters
AMAG

56 2nd quarter 2012
Key ratios
2011 2012e 2013f 2014f
EPS 6.50 13.10 19.03 19.78
PER 16.0 9.8 6.7 6.5
Operating CF per share 9.20 20.06 26.02 27.34
Price cash flow 11.30 6.4 4.9 4.7
Book value per share 62.70 75.79 94.82 114.60
Price book value 1.70 1.7 1.3 1.1
Dividend yield 1.6% 0.0% 0.0% 15.5%
ROE 10.8% 18.9% 22.3% 18.9%
ROCE 9.6% 17.0% 20.9% 18.5%
EV/EBITDA 8.4 6.0 4.1 3.4
Source: Bogdanka, Raiffeisen Centrobank estimates
Bogdanka is the most efficient and cheapest thermal coal producer in Poland with annual output reaching 6 mn tons, however, projected to gradually increase to 11.5 mn tons in 2014 as a consequence of the implementation of its mine ex-pansion program. Furthermore, we have a positive outlook for thermal coal in Po-land, which seems to work on an isolated basis vs. the global coal market on the back of the Polish electricity generation fleet being based on coal and consuming whatever is produced domestically as well as signs of a bottleneck appearing regarding coal imports from abroad. To us, it looks as if the Polish thermal coal market is experiencing a supply squeeze as increasing electricity consumption triggers rising coal demand. Furthermore, most of the mines located in the south of Poland are suffering the consequences of years of underinvestments with their output decreasing every year. Hence, we see Bogdanka well positioned to ben-efit from the supply squeeze environment and expect the group to be able to a) increase prices (based on just renegotiated long-term contracts the prices are
to increase by 9% yoy in 2012) and b) place all its increased production domestically. Moreover, the company has signed a number of long-term de-livery contracts with the new power plants to be erected in the neighbour-hood (with an apparent transportation cost advantage for Bogdanka).
We see Bogdanka potentially as the best dividend stock listed on the War-saw Stock Exchange in the future. For the moment, the management has only recommended a 30% payout ra-tio from 2011 profits (which translates into an approx. 2% dividend yield). Yet, we see the payout ratio to be in-creased even to 100% once the ex-pansion project is completed (2013-end). Furthermore, we expect the net profit to triple in the next two years from just reported PLN 221 mn for 2011 to almost PLN 650 mn in 2013.
Bartlomiej Kubicki
Bogdanka: Benefitting on the coal supply squeeze in Poland
Equities - top picks
Income statement & balance sheet (IFRS)
PLN mn 2011 2012e 2013f 2014f
Income statement
Consolidated sales 1,301 1,919 2,441 2,664
EBITDA 451 758 1,032 1,082
EBIT 266 544 792 815
EBT 272 550 799 831
Net profit b.m. 221 445 647 673
Net profit a.m. 221 445 647 673
Balance sheet
Total assets 3,076 3,589 4,200 4,738
Shareholders' equity 2,133 2,578 3,225 3,898
Goodwill 0 0 0 0
NIBD 341 158 -177 -704Source: Bogdanka, Raiffeisen Centrobank estimates
* the indicated price is the last price as available at 6.30 a.m. (CET) on 28 March 2012
Recommendation: BUY Current share price: PLN 128.0*/ Target price: PLN 170.0 Market capitalisation: EUR 1,047 mn
A M J J A S O N D J F M 65
70
75
80
85
90
95
100
105
BOGDANKAWARSAW GENERAL INDEX 20 - PRICE INDEX
Source: Thomson Reuters
Bogdanka
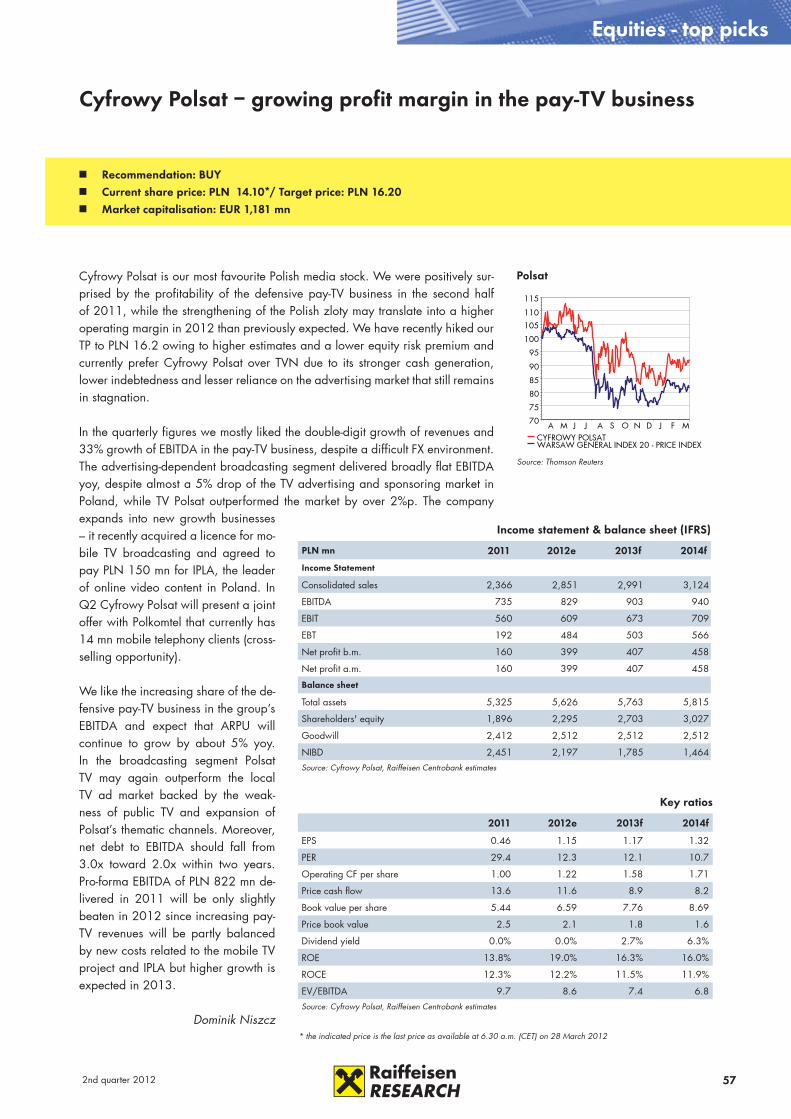
572nd quarter 2012
Recommendation: BUY Current share price: PLN 14.10*/ Target price: PLN 16.20 Market capitalisation: EUR 1,181 mn
Cyfrowy Polsat is our most favourite Polish media stock. We were positively sur-prised by the profitability of the defensive pay-TV business in the second half of 2011, while the strengthening of the Polish zloty may translate into a higher operating margin in 2012 than previously expected. We have recently hiked our TP to PLN 16.2 owing to higher estimates and a lower equity risk premium and currently prefer Cyfrowy Polsat over TVN due to its stronger cash generation, lower indebtedness and lesser reliance on the advertising market that still remains in stagnation.
In the quarterly figures we mostly liked the double-digit growth of revenues and 33% growth of EBITDA in the pay-TV business, despite a difficult FX environment. The advertising-dependent broadcasting segment delivered broadly flat EBITDA yoy, despite almost a 5% drop of the TV advertising and sponsoring market in Poland, while TV Polsat outperformed the market by over 2%p. The company expands into new growth businesses – it recently acquired a licence for mo-bile TV broadcasting and agreed to pay PLN 150 mn for IPLA, the leader of online video content in Poland. In Q2 Cyfrowy Polsat will present a joint offer with Polkomtel that currently has 14 mn mobile telephony clients (cross-selling opportunity).
We like the increasing share of the de-fensive pay-TV business in the group’s EBITDA and expect that ARPU will continue to grow by about 5% yoy. In the broadcasting segment Polsat TV may again outperform the local TV ad market backed by the weak-ness of public TV and expansion of Polsat’s thematic channels. Moreover, net debt to EBITDA should fall from 3.0x toward 2.0x within two years. Pro-forma EBITDA of PLN 822 mn de-livered in 2011 will be only slightly beaten in 2012 since increasing pay-TV revenues will be partly balanced by new costs related to the mobile TV project and IPLA but higher growth is expected in 2013.
Dominik Niszcz
Key ratios
2011 2012e 2013f 2014f
EPS 0.46 1.15 1.17 1.32
PER 29.4 12.3 12.1 10.7
Operating CF per share 1.00 1.22 1.58 1.71
Price cash flow 13.6 11.6 8.9 8.2
Book value per share 5.44 6.59 7.76 8.69
Price book value 2.5 2.1 1.8 1.6
Dividend yield 0.0% 0.0% 2.7% 6.3%
ROE 13.8% 19.0% 16.3% 16.0%
ROCE 12.3% 12.2% 11.5% 11.9%
EV/EBITDA 9.7 8.6 7.4 6.8Source: Cyfrowy Polsat, Raiffeisen Centrobank estimates
Cyfrowy Polsat – growing profit margin in the pay-TV business
Income statement & balance sheet (IFRS)
PLN mn 2011 2012e 2013f 2014f
Income Statement
Consolidated sales 2,366 2,851 2,991 3,124
EBITDA 735 829 903 940
EBIT 560 609 673 709
EBT 192 484 503 566
Net profit b.m. 160 399 407 458
Net profit a.m. 160 399 407 458
Balance sheet
Total assets 5,325 5,626 5,763 5,815
Shareholders' equity 1,896 2,295 2,703 3,027
Goodwill 2,412 2,512 2,512 2,512
NIBD 2,451 2,197 1,785 1,464Source: Cyfrowy Polsat, Raiffeisen Centrobank estimates
Equities - top picks
* the indicated price is the last price as available at 6.30 a.m. (CET) on 28 March 2012
A M J J A S O N D J F M 70
75
80
85
90
95
100
105 110
115
CYFROWY POLSATWARSAW GENERAL INDEX 20 - PRICE INDEX
Source: Thomson Reuters
Polsat
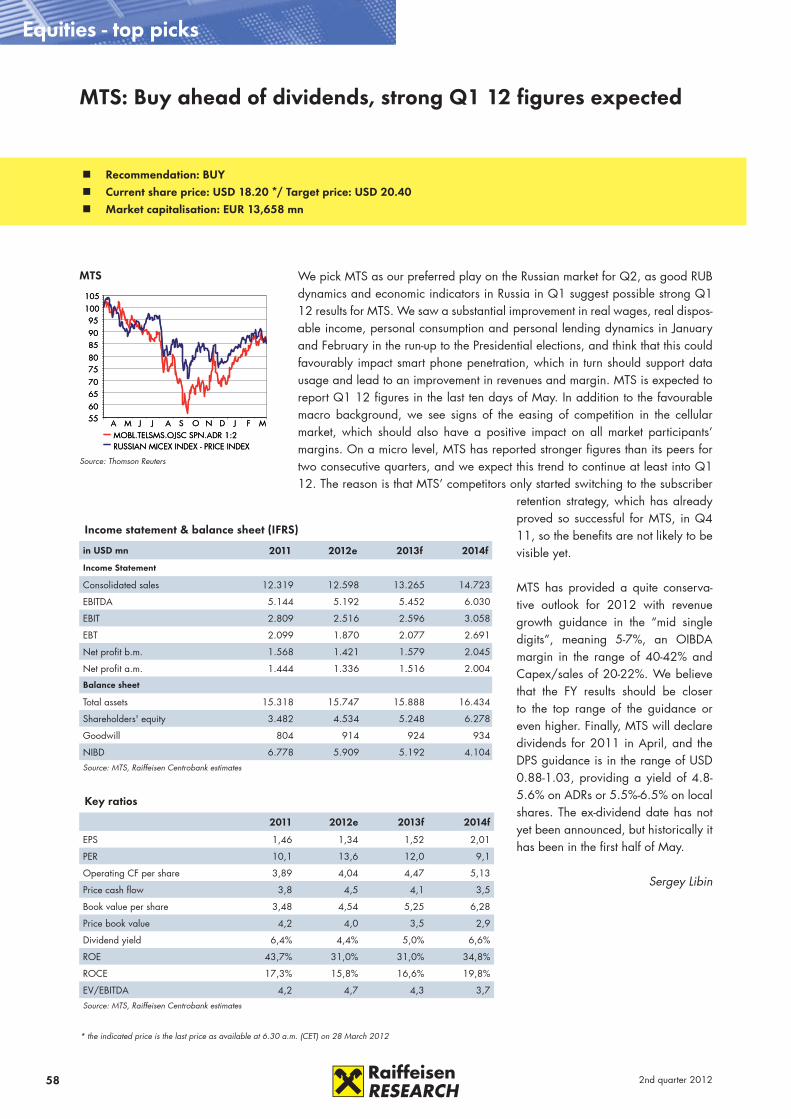
58 2nd quarter 2012
xx
Key ratios
2011 2012e 2013f 2014f
EPS 1,46 1,34 1,52 2,01
PER 10,1 13,6 12,0 9,1
Operating CF per share 3,89 4,04 4,47 5,13
Price cash flow 3,8 4,5 4,1 3,5
Book value per share 3,48 4,54 5,25 6,28
Price book value 4,2 4,0 3,5 2,9
Dividend yield 6,4% 4,4% 5,0% 6,6%
ROE 43,7% 31,0% 31,0% 34,8%
ROCE 17,3% 15,8% 16,6% 19,8%
EV/EBITDA 4,2 4,7 4,3 3,7Source: MTS, Raiffeisen Centrobank estimates
We pick MTS as our preferred play on the Russian market for Q2, as good RUB dynamics and economic indicators in Russia in Q1 suggest possible strong Q1 12 results for MTS. We saw a substantial improvement in real wages, real dispos-able income, personal consumption and personal lending dynamics in January and February in the run-up to the Presidential elections, and think that this could favourably impact smart phone penetration, which in turn should support data usage and lead to an improvement in revenues and margin. MTS is expected to report Q1 12 figures in the last ten days of May. In addition to the favourable macro background, we see signs of the easing of competition in the cellular market, which should also have a positive impact on all market participants’ margins. On a micro level, MTS has reported stronger figures than its peers for two consecutive quarters, and we expect this trend to continue at least into Q1 12. The reason is that MTS’ competitors only started switching to the subscriber
retention strategy, which has already proved so successful for MTS, in Q4 11, so the benefits are not likely to be visible yet.
MTS has provided a quite conserva-tive outlook for 2012 with revenue growth guidance in the “mid single digits”, meaning 5-7%, an OIBDA margin in the range of 40-42% and Capex/sales of 20-22%. We believe that the FY results should be closer to the top range of the guidance or even higher. Finally, MTS will declare dividends for 2011 in April, and the DPS guidance is in the range of USD 0.88-1.03, providing a yield of 4.8-5.6% on ADRs or 5.5%-6.5% on local shares. The ex-dividend date has not yet been announced, but historically it has been in the first half of May.
Sergey Libin
MTS: Buy ahead of dividends, strong Q1 12 figures expected
Equities - top picks
Income statement & balance sheet (IFRS)
in USD mn 2011 2012e 2013f 2014f
Income Statement
Consolidated sales 12.319 12.598 13.265 14.723
EBITDA 5.144 5.192 5.452 6.030
EBIT 2.809 2.516 2.596 3.058
EBT 2.099 1.870 2.077 2.691
Net profit b.m. 1.568 1.421 1.579 2.045
Net profit a.m. 1.444 1.336 1.516 2.004
Balance sheet
Total assets 15.318 15.747 15.888 16.434
Shareholders' equity 3.482 4.534 5.248 6.278
Goodwill 804 914 924 934
NIBD 6.778 5.909 5.192 4.104Source: MTS, Raiffeisen Centrobank estimates
* the indicated price is the last price as available at 6.30 a.m. (CET) on 28 March 2012
Recommendation: BUY Current share price: USD 18.20 */ Target price: USD 20.40 Market capitalisation: EUR 13,658 mn
A M J J A S O N D J F M 556065707580859095
100 105
MOBL.TELSMS.OJSC SPN.ADR 1:2RUSSIAN MICEX INDEX - PRICE INDEX
A M J J A S O N D J F M 556065707580859095
100 105
MOBL.TELSMS.OJSC SPN.ADR 1:2RUSSIAN MICEX INDEX - PRICE INDEX
Source: Thomson Reuters
MTS
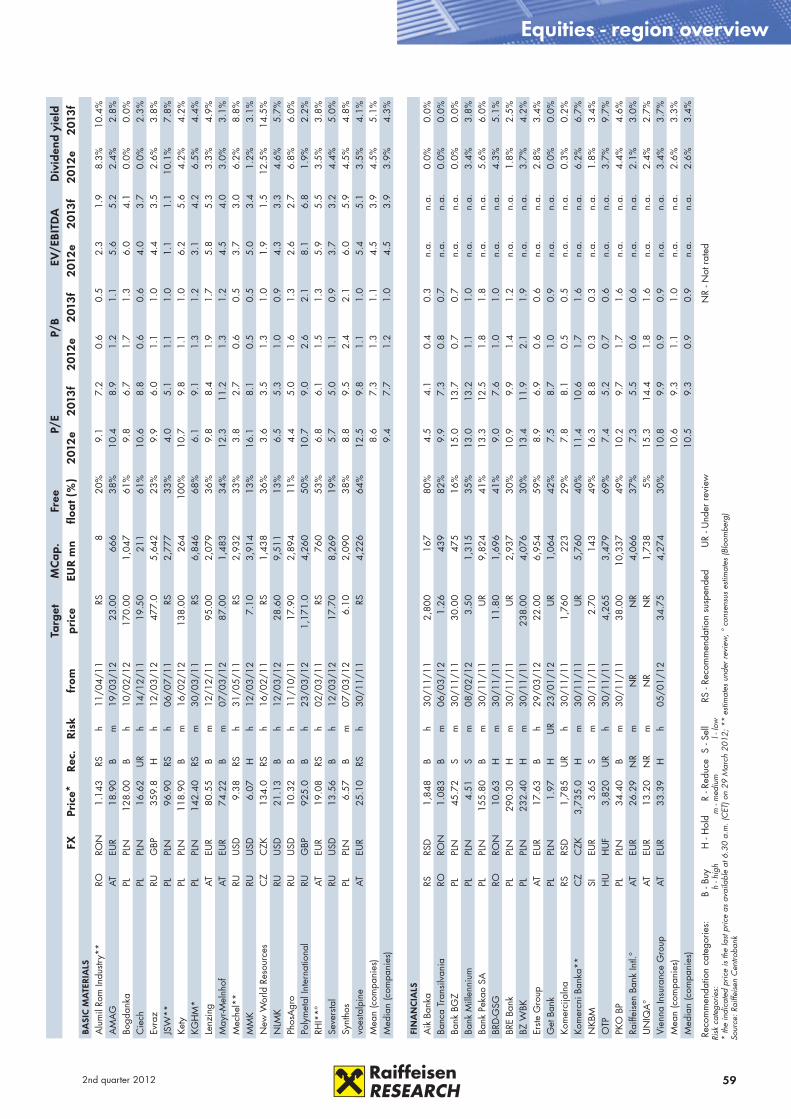
592nd quarter 2012
Targ
etM
Cap
.Fr
ee
P/E
P/B
EV/E
BITD
AD
ivid
end
yiel
dFX
Pric
e*Re
c.R
isk
from
pric
eEU
R m
nflo
at (
%)
2012
e20
13f
2012
e20
13f
2012
e20
13f
2012
e20
13f
BASI
C M
ATE
RIA
LSA
lum
il Ro
m In
dustr
y**
RORO
N1.
143
RSh
11/0
4/11
RS8
20%
9.1
7.2
0.6
0.5
2.3
1.9
8.3%
10.4
%A
MA
GAT
EUR
18.9
0B
m19
/03/
1223
.00
666
38%
10.4
8.9
1.2
1.1
5.6
5.2
2.4%
2.8%
Bogd
anka
PLPL
N12
8.00
Bh
10/0
2/12
170.
001,
047
61%
9.8
6.7
1.7
1.3
6.0
4.1
0.0%
0.0%
Cie
chPL
PLN
16.6
2U
Rh
14/1
2/11
19.5
021
161
%10
.68.
80.
60.
64.
03.
70.
0%2.
3%Ev
raz
RUG
BP35
9.8
Hh
12/0
3/12
477.
05,
642
23%
9.9
6.0
1.1
1.0
4.4
3.5
2.6%
3.8%
JSW
**PL
PLN
96.9
0RS
h06
/07/
11RS
2,77
733
%4.
05.
11.
11.
01.
11.
110
.1%
7.8%
Kety
PLPL
N11
8.90
Bm
16/0
2/12
138.
0026
410
0%10
.79.
81.
11.
06.
25.
64.
2%4.
2%KG
HM
*PL
PLN
142.
40RS
m30
/03/
11RS
6,84
668
%6.
19.
11.
31.
23.
14.
26.
5%4.
4%Le
nzin
gAT
EUR
80.5
5B
m12
/12/
1195
.00
2,07
936
%9.
88.
41.
91.
75.
85.
33.
3%4.
9%M
ayr-M
elnh
ofAT
EUR
74.2
2B
m07
/03/
1287
.00
1,48
334
%12
.311
.21.
31.
24.
54.
03.
0%3.
1%M
eche
l**
RUU
SD9.
38RS
h31
/05/
11RS
2,93
233
%3.
82.
70.
60.
53.
73.
06.
2%8.
8%M
MK
RUU
SD6.
07H
h12
/03/
127.
103,
914
13%
16.1
8.1
0.5
0.5
5.0
3.4
1.2%
3.1%
New
Wor
ld R
esou
rces
CZ
CZK
134.
0RS
h16
/02/
11RS
1,43
836
%3.
63.
51.
31.
01.
91.
512
.5%
14.5
%N
LMK
RUU
SD21
.13
Bh
12/0
3/12
28.6
09,
511
13%
6.5
5.3
1.0
0.9
4.3
3.3
4.6%
5.7%
Phos
Agr
oRU
USD
10.3
2B
h11
/10/
1117
.90
2,89
411
%4.
45.
01.
61.
32.
62.
76.
8%6.
0%Po
lym
etal
Inte
rnat
iona
lRU
GBP
925.
0B
h23
/03/
121,
171.
04,
260
50%
10.7
9.0
2.6
2.1
8.1
6.8
1.9%
2.2%
RHI*
*°AT
EUR
19.0
8RS
h02
/03/
11RS
760
53%
6.8
6.1
1.5
1.3
5.9
5.5
3.5%
3.8%
Seve
rsta
lRU
USD
13.5
6B
h12
/03/
1217
.70
8,26
919
%5.
75.
01.
10.
93.
73.
24.
4%5.
0%Sy
ntho
sPL
PLN
6.57
Bm
07/0
3/12
6.10
2,09
038
%8.
89.
52.
42.
16.
05.
94.
5%4.
8%vo
esta
lpin
eAT
EUR
25.1
0RS
h30
/11/
11RS
4,22
664
%12
.59.
81.
11.
05.
45.
13.
5%4.
1%M
ean
(com
pani
es)
8.6
7.3
1.3
1.1
4.5
3.9
4.5%
5.1%
Med
ian
(com
pani
es)
9.4
7.7
1.2
1.0
4.5
3.9
3.9%
4.3%
FIN
AN
CIA
LSA
ik B
anka
RSRS
D1,
848
Bh
30/1
1/11
2,80
016
780
%4.
54.
10.
40.
3n.
a.n.
a.0.
0%0.
0%Ba
nca
Tran
silv
ania
RORO
N1.
083
Bm
06/0
3/12
1.26
439
82%
9.9
7.3
0.8
0.7
n.a.
n.a.
0.0%
0.0%
Bank
BG
ZPL
PLN
45.7
2S
m30
/11/
1130
.00
475
16%
15.0
13.7
0.7
0.7
n.a.
n.a.
0.0%
0.0%
Bank
Mill
enni
umPL
PLN
4.51
Sm
08/0
2/12
3.50
1,31
535
%13
.013
.21.
11.
0n.
a.n.
a.3.
4%3.
8%Ba
nk P
ekao
SA
PLPL
N15
5.80
Bm
30/1
1/11
UR
9,82
441
%13
.312
.51.
81.
8n.
a.n.
a.5.
6%6.
0%BR
D-G
SGRO
RON
10.6
3H
m30
/11/
1111
.80
1,69
641
%9.
07.
61.
01.
0n.
a.n.
a.4.
3%5.
1%BR
E Ba
nkPL
PLN
290.
30H
m30
/11/
11U
R2,
937
30%
10.9
9.9
1.4
1.2
n.a.
n.a.
1.8%
2.5%
BZ W
BKPL
PLN
232.
40H
m30
/11/
1123
8.00
4,07
630
%13
.411
.92.
11.
9n.
a.n.
a.3.
7%4.
2%Er
ste G
roup
ATEU
R17
.63
Bh
29/0
3/12
22.0
06,
954
59%
8.9
6.9
0.6
0.6
n.a.
n.a.
2.8%
3.4%
Get
Ban
kPL
PLN
1.97
HU
R23
/01/
12U
R1,
064
42%
7.5
8.7
1.0
0.9
n.a.
n.a.
0.0%
0.0%
Kom
erci
jaln
aRS
RSD
1,78
5U
Rh
30/1
1/11
1,76
022
329
%7.
88.
10.
50.
5n.
a.n.
a.0.
3%0.
2%Ko
mer
cni B
anka
**C
ZC
ZK3,
735.
0H
m30
/11/
11U
R5,
760
40%
11.4
10.6
1.7
1.6
n.a.
n.a.
6.2%
6.7%
NKB
MSI
EUR
3.65
Sm
30/1
1/11
2.70
143
49%
16.3
8.8
0.3
0.3
n.a.
n.a.
1.8%
3.4%
OTP
HU
HU
F3,
820
UR
h30
/11/
114,
265
3,47
969
%7.
45.
20.
70.
6n.
a.n.
a.3.
7%9.
7%PK
O B
PPL
PLN
34.4
0B
m30
/11/
1138
.00
10,3
3749
%10
.29.
71.
71.
6n.
a.n.
a.4.
4%4.
6%Ra
iffei
sen
Bank
Intl.
°AT
EUR
26.2
9N
Rm
NR
NR
4,06
637
%7.
35.
50.
60.
6n.
a.n.
a.2.
1%3.
0%U
NIQ
A°
ATEU
R13
.20
NR
mN
RN
R1,
738
5%15
.314
.41.
81.
6n.
a.n.
a.2.
4%2.
7%Vi
enna
Insu
ranc
e G
roup
ATEU
R33
.39
Hh
05/0
1/12
34.7
54,
274
30%
10.8
9.9
0.9
0.9
n.a.
n.a.
3.4%
3.7%
Mea
n (c
ompa
nies
)10
.69.
31.
11.
0n.
a.n.
a.2.
6%3.
3%M
edia
n (c
ompa
nies
)10
.59.
30.
90.
9n.
a.n.
a.2.
6%3.
4%
Rec
omm
enda
tion
cate
gorie
s:
B - B
uy
H -
Hol
d R
- Red
uce
S - S
ell
RS
- Rec
omm
enda
tion
susp
ende
d
UR
- Und
er re
view
NR
- Not
rate
dRi
sk c
ateg
orie
s:
h - h
igh
m
- m
ediu
m
l - lo
w
* th
e in
dica
ted
pric
e is
the
last
pric
e as
ava
ilabl
e at
6.3
0 a.
m. (
CET
) on
29 M
arch
201
2; *
* es
timat
es u
nder
revi
ew, °
con
sens
us e
stim
ates
(Blo
ombe
rg)
Sour
ce: R
aiffe
isen
Cen
troba
nk
Equities - region overview
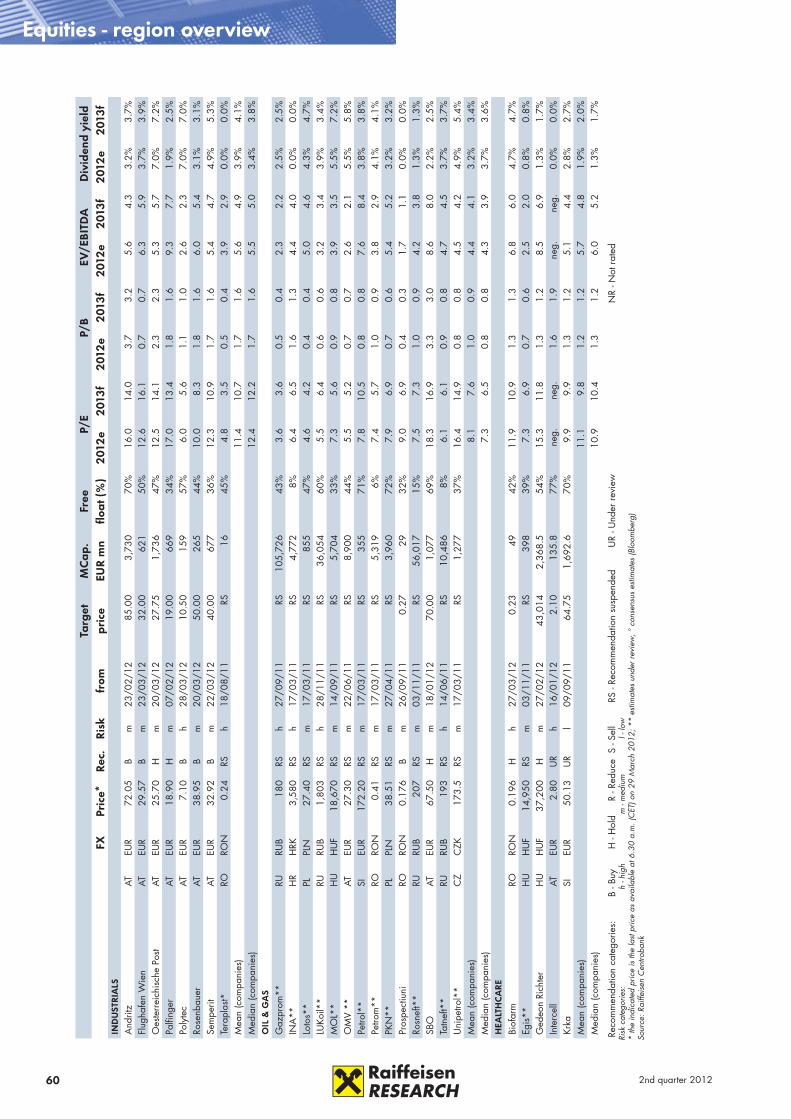
60 2nd quarter 2012
Equities - region overview
Targ
etM
Cap
.Fr
ee
P/E
P/B
EV/E
BITD
AD
ivid
end
yiel
dFX
Pric
e*Re
c.R
isk
from
pric
eEU
R m
nflo
at (
%)
2012
e20
13f
2012
e20
13f
2012
e20
13f
2012
e20
13f
IND
UST
RIA
LSA
ndrit
zAT
EUR
72.0
5B
m23
/02/
1285
.00
3,73
070
%16
.014
.03.
73.
25.
64.
33.
2%3.
7%Fl
ugha
fen
Wie
nAT
EUR
29.5
7B
m23
/03/
1232
.00
621
50%
12.6
16.1
0.7
0.7
6.3
5.9
3.7%
3.9%
Oes
terr
eich
isch
e Po
stAT
EUR
25.7
0H
m20
/03/
1227
.75
1,73
647
%12
.514
.12.
32.
35.
35.
77.
0%7.
2%Pa
lfing
erAT
EUR
18.9
0H
m07
/02/
1219
.00
669
34%
17.0
13.4
1.8
1.6
9.3
7.7
1.9%
2.5%
Poly
tec
ATEU
R7.
10B
h28
/03/
1210
.50
159
57%
6.0
5.6
1.1
1.0
2.6
2.3
7.0%
7.0%
Rose
nbau
erAT
EUR
38.9
5B
m20
/03/
1250
.00
265
44%
10.0
8.3
1.8
1.6
6.0
5.4
3.1%
3.1%
Sem
perit
ATEU
R32
.92
Bm
22/0
3/12
40.0
067
736
%12
.310
.91.
71.
65.
44.
74.
9%5.
3%Te
rapl
ast*
RORO
N0.
24RS
h18
/08/
11RS
1645
%4.
83.
50.
50.
43.
92.
90.
0%0.
0%M
ean
(com
pani
es)
11.4
10.7
1.7
1.6
5.6
4.9
3.9%
4.1%
Med
ian
(com
pani
es)
12.4
12.2
1.7
1.6
5.5
5.0
3.4%
3.8%
OIL
& G
AS
Gaz
prom
**RU
RUB
180
RSh
27/0
9/11
RS10
5,72
643
%3.
63.
60.
50.
42.
32.
22.
5%2.
5%IN
A**
HR
HRK
3,58
0RS
h17
/03/
11RS
4,77
28%
6.4
6.5
1.6
1.3
4.4
4.0
0.0%
0.0%
Loto
s**
PLPL
N27
.40
RSm
17/0
3/11
RS85
547
%4.
64.
20.
40.
45.
04.
64.
3%4.
7%LU
Koil*
*RU
RUB
1,80
3RS
h28
/11/
11RS
36,0
5460
%5.
56.
40.
60.
63.
23.
43.
9%3.
4%M
OL*
*H
UH
UF
18,6
70RS
m14
/09/
11RS
5,70
433
%7.
35.
60.
90.
83.
93.
55.
5%7.
2%O
MV
**AT
EUR
27.3
0RS
m22
/06/
11RS
8,90
044
%5.
55.
20.
70.
72.
62.
15.
5%5.
8%Pe
trol*
*SI
EUR
172.
20RS
m17
/03/
11RS
355
71%
7.8
10.5
0.8
0.8
7.6
8.4
3.8%
3.8%
Petro
m**
RORO
N0.
41RS
m17
/03/
11RS
5,31
96%
7.4
5.7
1.0
0.9
3.8
2.9
4.1%
4.1%
PKN
**PL
PLN
38.5
1RS
m27
/04/
11RS
3,96
072
%7.
96.
90.
70.
65.
45.
23.
2%3.
2%Pr
ospe
ctiu
niRO
RON
0.17
6B
m26
/09/
110.
2729
32%
9.0
6.9
0.4
0.3
1.7
1.1
0.0%
0.0%
Rosn
eft*
*RU
RUB
207
RSm
03/1
1/11
RS56
,017
15%
7.5
7.3
1.0
0.9
4.2
3.8
1.3%
1.3%
SBO
ATEU
R67
.50
Hm
18/0
1/12
70.0
01,
077
69%
18.3
16.9
3.3
3.0
8.6
8.0
2.2%
2.5%
Tatn
eft*
*RU
RUB
193
RSh
14/0
6/11
RS10
,486
8%6.
16.
10.
90.
84.
74.
53.
7%3.
7%U
nipe
trol*
*C
ZC
ZK17
3.5
RSm
17/0
3/11
RS1,
277
37%
16.4
14.9
0.8
0.8
4.5
4.2
4.9%
5.4%
Mea
n (c
ompa
nies
)8.
17.
61.
00.
94.
44.
13.
2%3.
4%M
edia
n (c
ompa
nies
)7.
36.
50.
80.
84.
33.
93.
7%3.
6%H
EALT
HC
ARE
Biof
arm
RORO
N0.
196
Hh
27/0
3/12
0.23
4942
%11
.910
.91.
31.
36.
86.
04.
7%4.
7%Eg
is**
HU
HU
F14
,950
RSm
03/1
1/11
RS39
839
%7.
36.
90.
70.
62.
52.
00.
8%0.
8%G
edeo
n Ri
chte
rH
UH
UF
37,2
00H
m27
/02/
1243
,014
2,36
8.5
54%
15.3
11.8
1.3
1.2
8.5
6.9
1.3%
1.7%
Inte
rcel
lAT
EUR
2.80
UR
h16
/01/
122.
1013
5.8
77%
neg.
neg.
1.6
1.9
neg.
neg.
0.0%
0.0%
Krka
SIEU
R50
.13
UR
l09
/09/
1164
.75
1,69
2.6
70%
9.9
9.9
1.3
1.2
5.1
4.4
2.8%
2.7%
Mea
n (c
ompa
nies
)11
.19.
81.
21.
25.
74.
81.
9%2.
0%M
edia
n (c
ompa
nies
)10
.910
.41.
31.
26.
05.
21.
3%1.
7%
Rec
omm
enda
tion
cate
gorie
s:
B - B
uy
H -
Hol
d R
- Red
uce
S - S
ell
RS
- Rec
omm
enda
tion
susp
ende
d
UR
- Und
er re
view
NR
- Not
rate
dRi
sk c
ateg
orie
s:
h - h
igh
m
- m
ediu
m
l - lo
w
* th
e in
dica
ted
pric
e is
the
last
pric
e as
ava
ilabl
e at
6.3
0 a.
m. (
CET
) on
29 M
arch
201
2; *
* es
timat
es u
nder
revi
ew, °
con
sens
us e
stim
ates
(Blo
ombe
rg)
Sour
ce: R
aiffe
isen
Cen
troba
nk
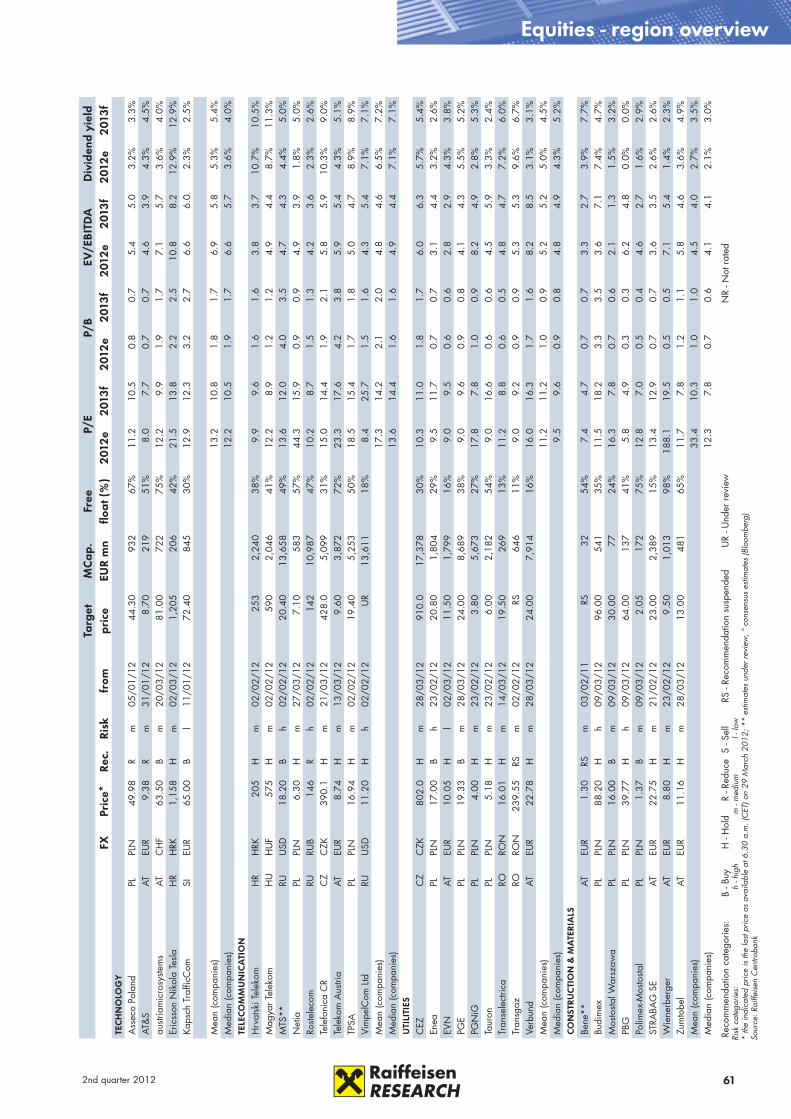
612nd quarter 2012
Equities - region overview
Targ
etM
Cap
.Fr
ee
P/E
P/B
EV/E
BITD
AD
ivid
end
yiel
dFX
Pric
e*Re
c.R
isk
from
pric
eEU
R m
nflo
at (
%)
2012
e20
13f
2012
e20
13f
2012
e20
13f
2012
e20
13f
TEC
HN
OLO
GY
Ass
eco
Pola
ndPL
PLN
49.9
8R
m05
/01/
1244
.30
932
67%
11.2
10.5
0.8
0.7
5.4
5.0
3.2%
3.3%
AT&
SAT
EUR
9.38
Rm
31/0
1/12
8.70
219
51%
8.0
7.7
0.7
0.7
4.6
3.9
4.3%
4.5%
austr
iam
icro
syste
ms
ATC
HF
63.5
0B
m20
/03/
1281
.00
722
75%
12.2
9.9
1.9
1.7
7.1
5.7
3.6%
4.0%
Eric
sson
Nik
ola
Tesla
HR
HRK
1,15
8H
m02
/03/
121,
205
206
42%
21.5
13.8
2.2
2.5
10.8
8.2
12.9
%12
.9%
Kaps
ch T
raffi
cCom
SIEU
R65
.00
Bl
11/0
1/12
72.4
084
530
%12
.912
.33.
22.
76.
66.
02.
3%2.
5%
Mea
n (c
ompa
nies
)13
.210
.81.
81.
76.
95.
85.
3%5.
4%M
edia
n (c
ompa
nies
)12
.210
.51.
91.
76.
65.
73.
6%4.
0%TE
LEC
OM
MU
NIC
ATI
ON
Hrv
atsk
i Tel
ekom
HR
HRK
205
Hm
02/0
2/12
253
2,24
038
%9.
99.
61.
61.
63.
83.
710
.7%
10.5
%M
agya
r Tel
ekom
HU
HU
F57
5H
m02
/02/
1259
02,
046
41%
12.2
8.9
1.2
1.2
4.9
4.4
8.7%
11.3
%M
TS**
RUU
SD18
.20
Bh
02/0
2/12
20.4
013
,658
49%
13.6
12.0
4.0
3.5
4.7
4.3
4.4%
5.0%
Net
iaPL
PLN
6.30
Hm
27/0
3/12
7.10
583
57%
44.3
15.9
0.9
0.9
4.9
3.9
1.8%
5.0%
Roste
leco
mRU
RUB
146
Rh
02/0
2/12
142
10,9
8747
%10
.28.
71.
51.
34.
23.
62.
3%2.
6%Te
lefo
nica
CR
CZ
CZK
390.
1H
m21
/03/
1242
8.0
5,09
931
%15
.014
.41.
92.
15.
85.
910
.3%
9.0%
Tele
kom
Aus
tria
ATEU
R8.
74H
m13
/03/
129.
603,
872
72%
23.3
17.6
4.2
3.8
5.9
5.4
4.3%
5.1%
TPSA
PLPL
N16
.94
Hm
02/0
2/12
19.4
05,
253
50%
18.5
15.4
1.7
1.8
5.0
4.7
8.9%
8.9%
Vim
pelC
om L
tdRU
USD
11.2
0H
h02
/02/
12U
R13
,611
18%
8.4
25.7
1.5
1.6
4.3
5.4
7.1%
7.1%
Mea
n (c
ompa
nies
)17
.314
.22.
12.
04.
84.
66.
5%7.
2%M
edia
n (c
ompa
nies
)13
.614
.41.
61.
64.
94.
47.
1%7.
1%U
TILI
TIES
CEZ
CZ
CZK
802.
0H
m28
/03/
1291
0.0
17,3
7830
%10
.311
.01.
81.
76.
06.
35.
7%5.
4%En
eaPL
PLN
17.0
0B
h23
/02/
1220
.80
1,80
429
%9.
511
.70.
70.
73.
14.
43.
2%2.
6%EV
NAT
EUR
10.0
5H
l02
/03/
1211
.50
1,79
916
%9.
09.
50.
60.
62.
82.
94.
3%3.
8%PG
EPL
PLN
19.3
3B
m28
/03/
1224
.00
8,68
938
%9.
09.
60.
90.
84.
14.
35.
5%5.
2%PG
NiG
PLPL
N4.
00H
m23
/02/
123.
805,
673
27%
17.8
7.8
1.0
0.9
8.2
4.9
2.8%
5.3%
Taur
onPL
PLN
5.18
Hm
23/0
2/12
6.00
2,18
254
%9.
016
.60.
60.
64.
55.
93.
3%2.
4%Tr
anse
lect
rica
RORO
N16
.01
Hm
14/0
3/12
19.5
026
913
%11
.28.
80.
60.
54.
84.
77.
2%6.
0%Tr
ansg
azRO
RON
239.
55RS
m02
/02/
12RS
646
11%
9.0
9.2
0.9
0.9
5.3
5.3
9.6%
6.7%
Verb
und
ATEU
R22
.78
Hm
28/0
3/12
24.0
07,
914
16%
16.0
16.3
1.7
1.6
8.2
8.5
3.1%
3.1%
Mea
n (c
ompa
nies
)11
.211
.21.
00.
95.
25.
25.
0%4.
5%M
edia
n (c
ompa
nies
)9.
59.
60.
90.
84.
84.
94.
3%5.
2%C
ON
STRU
CTI
ON
& M
ATE
RIA
LS
Bene
**AT
EUR
1.30
RSm
03/0
2/11
RS32
54%
7.4
4.7
0.7
0.7
3.3
2.7
3.9%
7.7%
Budi
mex
PLPL
N88
.20
Hh
09/0
3/12
96.0
054
135
%11
.518
.23.
33.
53.
67.
17.
4%4.
7%M
osto
stal W
arsz
awa
PLPL
N16
.00
Bm
09/0
3/12
30.0
077
24%
16.3
7.8
0.7
0.6
2.1
1.3
1.5%
3.2%
PBG
PLPL
N39
.77
Hh
09/0
3/12
64.0
013
741
%5.
84.
90.
30.
36.
24.
80.
0%0.
0%Po
limex
-Mos
tosta
lPL
PLN
1.37
Bm
09/0
3/12
2.05
172
75%
12.8
7.0
0.5
0.4
4.6
2.7
1.6%
2.9%
STRA
BAG
SE
ATEU
R22
.75
Hm
21/0
2/12
23.0
02,
389
15%
13.4
12.9
0.7
0.7
3.6
3.5
2.6%
2.6%
Wie
nerb
erge
rAT
EUR
8.80
Hm
23/0
2/12
9.50
1,01
398
%18
8.1
19.5
0.5
0.5
7.1
5.4
1.4%
2.3%
Zum
tobe
lAT
EUR
11.1
6H
m28
/03/
1213
.00
481
65%
11.7
7.8
1.2
1.1
5.8
4.6
3.6%
4.9%
Mea
n (c
ompa
nies
)33
.410
.31.
01.
04.
54.
02.
7%3.
5%M
edia
n (c
ompa
nies
)12
.37.
80.
70.
64.
14.
12.
1%3.
0%
Rec
omm
enda
tion
cate
gorie
s:
B - B
uy
H -
Hol
d R
- Red
uce
S - S
ell
RS
- Rec
omm
enda
tion
susp
ende
d
UR
- Und
er re
view
NR
- Not
rate
dRi
sk c
ateg
orie
s:
h - h
igh
m
- m
ediu
m
l - lo
w
* th
e in
dica
ted
pric
e is
the
last
pric
e as
ava
ilabl
e at
6.3
0 a.
m. (
CET
) on
29 M
arch
201
2; *
* es
timat
es u
nder
revi
ew, °
con
sens
us e
stim
ates
(Blo
ombe
rg)
Sour
ce: R
aiffe
isen
Cen
troba
nk

62 2nd quarter 2012
• Equities - region overview
Targ
etM
Cap
.Fr
ee
P/E
P/B
EV/E
BITD
AD
ivid
end
yiel
dFX
Pric
e*Re
c.R
isk
from
pric
eEU
R m
nflo
at (
%)
2012
e20
13f
2012
e20
13f
2012
e20
13f
2012
e20
13f
REA
L ES
TATE
Atri
umAT
EUR
3.73
Bm
12/0
3/12
4.00
1,39
950
%16
.715
.60.
60.
611
.911
.44.
6%4.
6%C
A Im
mob
ilien
ATEU
R8.
41H
m29
/03/
128.
7073
983
%17
.916
.40.
40.
417
.216
.33.
6%3.
6%co
nwer
tAT
EUR
8.88
Bm
12/0
3/12
10.0
072
473
%30
.430
.80.
60.
620
.021
.02.
8%2.
8%Ec
ho In
vestm
ent
PLPL
N4.
35H
h12
/03/
124.
4043
932
%10
.26.
90.
80.
742
.314
.30.
0%0.
0%G
lobe
Tra
de C
entre
PLPL
N6.
79H
h12
/03/
127.
5035
855
%12
.64.
90.
50.
410
.67.
30.
0%0.
0%Im
mof
inan
zAT
EUR
2.74
Bm
29/0
3/12
3.30
2,83
690
%9.
28.
70.
50.
511
.910
.17.
3%7.
3%Po
lnor
dPL
PLN
15.2
5B
h12
/03/
1226
.00
8751
%27
.612
.30.
30.
319
.814
.40.
0%0.
0%S
IMM
OAT
EUR
4.35
Hh
12/0
3/12
4.80
296
78%
19.1
17.5
0.6
0.6
19.2
18.2
2.3%
2.3%
War
impe
xAT
EUR
1.01
Hh
12/0
3/12
1.20
5440
%ne
g.ne
g.0.
70.
820
.915
.70.
0%0.
0%M
ean
(com
pani
es)
18.0
14.1
0.6
0.5
19.3
14.3
2.3%
2.3%
Med
ian
(com
pani
es)
17.3
13.9
0.6
0.6
19.2
14.4
2.3%
2.3%
CO
NSU
MER
, CY
CLI
CA
L
Ago
raPL
PLN
13.0
5H
m21
/02/
1214
.50
160
89%
18.0
15.0
0.5
0.5
3.9
3.6
3.8%
3.8%
Cin
ema
City
PLPL
N32
.25
Hh
16/1
2/11
32.0
039
725
%18
.515
.81.
51.
47.
66.
90.
0%0.
0%C
TC M
edia
RUU
SD11
.58
Bh
22/0
3/12
14.0
01,
380
37%
12.0
10.9
2.4
2.2
6.6
6.1
4.6%
4.7%
Cyf
row
y Po
lsat
PLPL
N14
.10
Bm
22/0
3/12
16.2
01,
181
48%
12.3
12.1
2.1
1.8
8.6
7.4
0.0%
2.7%
Gor
enje
SIEU
R6.
10B
h21
/11/
116.
7596
54%
7.9
5.1
0.2
0.2
4.7
4.1
0.0%
0.0%
LPP
PLPL
N2,
556.
00H
m09
/03/
122,
800.
001,
073
48%
21.7
17.3
5.0
4.3
12.1
10.0
2.8%
3.5%
M.v
ideo
RURU
B24
8B
h26
/03/
1235
21,
141
31%
13.6
11.4
3.1
2.6
5.7
4.6
2.4%
2.9%
TVN
PLPL
N11
.00
Hm
16/0
2/12
12.2
090
944
%3.
913
.02.
01.
84.
07.
51.
3%3.
1%W
olfo
rdAT
EUR
23.8
1H
m28
/03/
1225
.50
117
49%
15.2
12.8
1.3
1.2
6.7
5.7
2.5%
2.5%
Mea
n (c
ompa
nies
)13
.712
.62.
01.
86.
66.
21.
9%2.
6%M
edia
n (c
ompa
nies
)13
.612
.82.
01.
86.
66.
12.
4%2.
9%C
ON
SUM
ER, N
ON
-CY
CLI
CA
L
Adr
isH
RH
RK20
3.4
Hh
07/0
3/12
248.
043
964
%7.
07.
30.
40.
40.
70.
23.
4%3.
4%A
gran
a**
ATEU
R80
.65
Hm
14/1
0/11
UR
1,14
525
%12
.511
.71.
11.
06.
56.
23.
6%3.
6%C
EDC
**PL
USD
4.99
UR
h12
/12/
11U
R32
670
%12
.29.
50.
30.
38.
27.
60.
0%0.
0%Eu
roca
shPL
PLN
35.6
0H
m14
/03/
1237
.00
1,17
044
%24
.917
.77.
95.
913
.210
.71.
2%1.
5%M
agni
tRU
USD
28.9
9H
h16
/02/
1230
.60
10,2
8551
%33
.925
.14.
74.
013
.610
.80.
3%0.
4%M
erca
tor
SIEU
R12
5.00
Rh
06/0
2/12
132.
0046
544
%37
.624
.80.
60.
69.
48.
80.
0%0.
0%O
Key
RUU
SD9.
00H
h30
/01/
128.
051,
819
14%
20.9
16.1
4.6
3.6
9.2
7.4
0.0%
0.0%
Podr
avka
HR
HRK
249
Hh
17/0
2/12
270
174
35%
11.6
10.6
0.7
0.7
6.1
5.9
2.2%
2.4%
Viro
HR
HRK
461
Hh
21/0
3/12
492
8532
%7.
07.
11.
11.
05.
15.
12.
6%2.
8%X5
RUU
SD23
.15
Bh
26/0
1/12
31.5
04,
717
30%
24.7
17.4
2.5
2.2
8.5
7.4
0.0%
0.0%
Mea
n (c
ompa
nies
)19
.214
.72.
42.
08.
07.
01.
3%1.
4%M
edia
n (c
ompa
nies
)16
.713
.91.
11.
08.
37.
40.
8%0.
9%
Rec
omm
enda
tion
cate
gorie
s:
B - B
uy
H -
Hol
d R
- Red
uce
S - S
ell
RS
- Rec
omm
enda
tion
susp
ende
d
UR
- Und
er re
view
NR
- Not
rate
dRi
sk c
ateg
orie
s:
h - h
igh
m
- m
ediu
m
l - lo
w
* th
e in
dica
ted
pric
e is
the
last
pric
e as
ava
ilabl
e at
6.3
0 a.
m. (
CET
) on
29 M
arch
201
2; *
* es
timat
es u
nder
revi
ew, °
con
sens
us e
stim
ates
(Blo
ombe
rg)
Sour
ce: R
aiffe
isen
Cen
troba
nk

632nd quarter 2012
Utilities12.6%
Materials17.9%
Energy16.1%
Telecommunications6.6%
Insurance12.0%
Media1.1%
Software & Services2.3%
Food Beverage & Tobacco2.0%
Banks28.8%
Real Estate0.7%
Sector weightings Poland, WIG 20
Dom. market cap.: EUR 125.9 bn (Source: FESE; 29.02.2012)
Equities - region overview
Source: Thomson Reuters, Raiffeisen RESEARCH
Real Estate0.3%Software & Services
0.1%
Telecommunications23.3%
Utilities30.2%
Energy6.6% Retailing
0.2%
Food Beverage & Tobacco4.1%
Banks26.3%
Media1.4%
Hotels, Restaurants, Leisure0.9%
Consumer Durables0.7%
Materials5.8%
Sector weightings Czech Republic, PX
Source: Thomson Reuters, Raiffeisen RESEARCH
Sector weightings Hungary, BUX Sector weightings Russia, MICEX
Sector weightings Romania, BET Sector weightings Croatia, CROBEX10
Sector weightings in comparison
Dom. market cap.: EUR 31.5 bn (Source: FESE; 29.02.2012)
Energy32.4%
Pharma & Biotechnology
21.0%
Commercial Services0.3%
Materials0.5%
Telecommunications14.8%
Software & Services0.1%
Insurance1.4%
Banks29.6%
Dom. market cap.: EUR 17.52 bn (Source: FESE; 29.02.2012)
Energy54.9%Materials
14.6%
Food & Drug Retailing1.7%
Transportation0.4%
Utilities4.9%
Telecommunications3.7%
Banks19.8%
Dom. market cap.: EUR 551.1 bn (Source: MICEX ; 29.02.2012)
Source: Thomson Reuters, Raiffeisen RESEARCH Source: Thomson Reuters, Raiffeisen RESEARCH
Health Care2.8%
Utilities3.1%
Materials2.7%Oil & Gas
27.7%
Investment fund20.5%
Financials43.2%
Dom. market cap.: EUR 21.11 bn (Source: FEAS; 29.02.2012)
Consumer Staples41.0%
Industrials19.3%
Telecommunication Services20.0%
Information Technology
13.5%
Energy6.2%
Dom. market cap.: EUR 17.21 bn (Source: FEAS; 29.02.2012)
Source: Bloomberg, Raiffeisen RESEARCH Source: Bloomberg, Raiffeisen RESEARCH
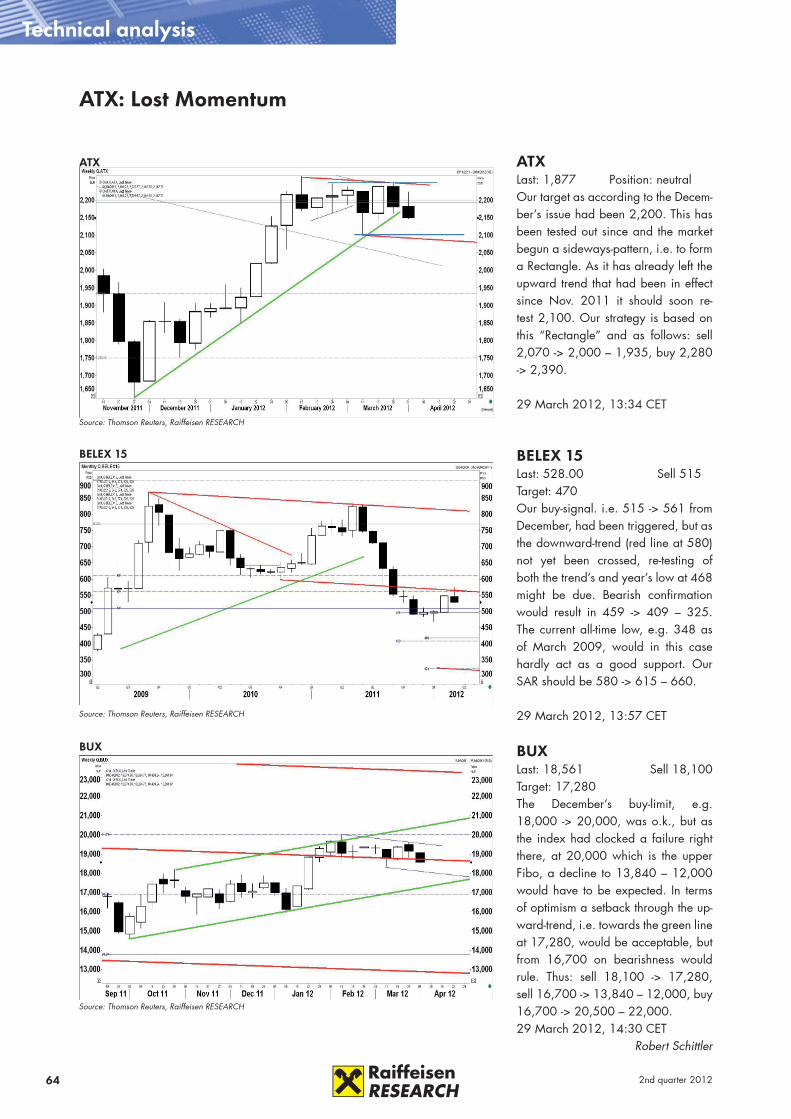
64 2nd quarter 2012
ATX
Source: Thomson Reuters, Raiffeisen RESEARCH
BELEX 15
Source: Thomson Reuters, Raiffeisen RESEARCH
BUX
Source: Thomson Reuters, Raiffeisen RESEARCH
ATX: Lost Momentum
Technical analysis
ATXLast: 1,877 Position: neutralOur target as according to the Decem-ber’s issue had been 2,200. This has been tested out since and the market begun a sideways-pattern, i.e. to form a Rectangle. As it has already left the upward trend that had been in effect since Nov. 2011 it should soon re-test 2,100. Our strategy is based on this “Rectangle” and as follows: sell 2,070 -> 2,000 – 1,935, buy 2,280 -> 2,390.
29 March 2012, 13:34 CET
BELEX 15Last: 528.00 Sell 515 Target: 470Our buy-signal. i.e. 515 -> 561 from December, had been triggered, but as the downward-trend (red line at 580) not yet been crossed, re-testing of both the trend’s and year’s low at 468 might be due. Bearish confirmation would result in 459 -> 409 – 325. The current all-time low, e.g. 348 as of March 2009, would in this case hardly act as a good support. Our SAR should be 580 -> 615 – 660.
29 March 2012, 13:57 CET
BUXLast: 18,561 Sell 18,100 Target: 17,280The December’s buy-limit, e.g. 18,000 -> 20,000, was o.k., but as the index had clocked a failure right there, at 20,000 which is the upper Fibo, a decline to 13,840 – 12,000 would have to be expected. In terms of optimism a setback through the up-ward-trend, i.e. towards the green line at 17,280, would be acceptable, but from 16,700 on bearishness would rule. Thus: sell 18,100 -> 17,280, sell 16,700 -> 13,840 – 12,000, buy 16,700 -> 20,500 – 22,000. 29 March 2012, 14:30 CET
Robert Schittler
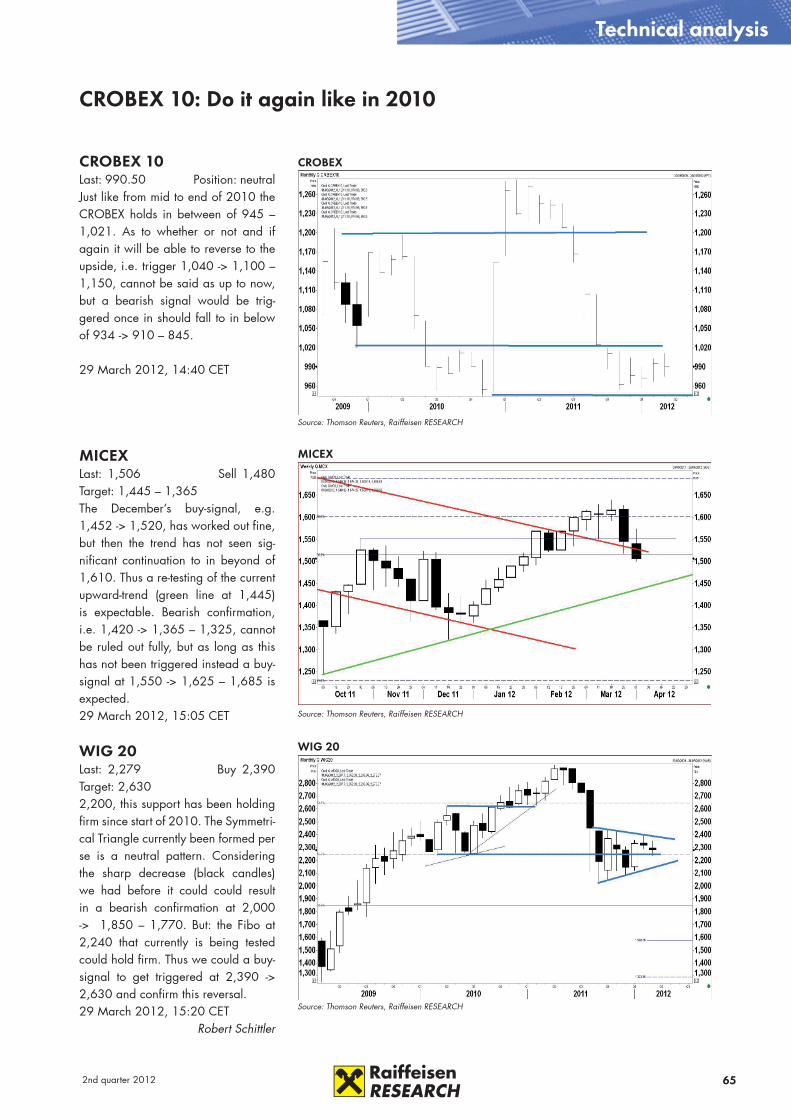
652nd quarter 2012
CROBEX 10: Do it again like in 2010
Technical analysis
CROBEX
Source: Thomson Reuters, Raiffeisen RESEARCH
MICEX
Source: Thomson Reuters, Raiffeisen RESEARCH
WIG 20
Source: Thomson Reuters, Raiffeisen RESEARCH
CROBEX 10Last: 990.50 Position: neutral Just like from mid to end of 2010 the CROBEX holds in between of 945 – 1,021. As to whether or not and if again it will be able to reverse to the upside, i.e. trigger 1,040 -> 1,100 – 1,150, cannot be said as up to now, but a bearish signal would be trig-gered once in should fall to in below of 934 -> 910 – 845.
29 March 2012, 14:40 CET
MICEXLast: 1,506 Sell 1,480 Target: 1,445 – 1,365The December’s buy-signal, e.g. 1,452 -> 1,520, has worked out fine, but then the trend has not seen sig-nificant continuation to in beyond of 1,610. Thus a re-testing of the current upward-trend (green line at 1,445) is expectable. Bearish confirmation, i.e. 1,420 -> 1,365 – 1,325, cannot be ruled out fully, but as long as this has not been triggered instead a buy-signal at 1,550 -> 1,625 – 1,685 is expected. 29 March 2012, 15:05 CET
WIG 20Last: 2,279 Buy 2,390 Target: 2,6302,200, this support has been holding firm since start of 2010. The Symmetri-cal Triangle currently been formed per se is a neutral pattern. Considering the sharp decrease (black candles) we had before it could could result in a bearish confirmation at 2,000 -> 1,850 – 1,770. But: the Fibo at 2,240 that currently is being tested could hold firm. Thus we could a buy-signal to get triggered at 2,390 -> 2,630 and confirm this reversal. 29 March 2012, 15:20 CET
Robert Schittler
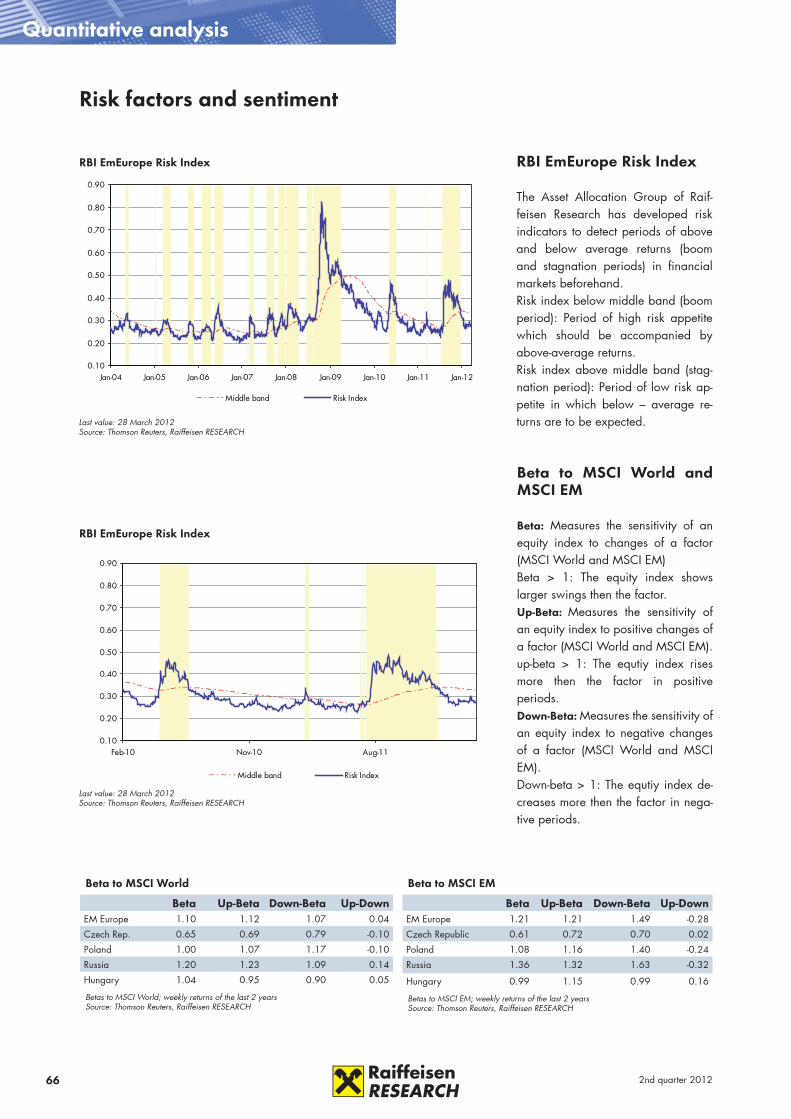
66 2nd quarter 2012
0.10
0.20
0.30
0.40
0.50
0.60
0.70
0.80
0.90
Jan-04 Jan-05 Jan-06 Jan-07 Jan-08 Jan-09 Jan-10 Jan-11 Jan-12
Middle band Risk Index
RBI EmEurope Risk Index
Last value: 28 March 2012Source: Thomson Reuters, Raiffeisen RESEARCH
Risk factors and sentiment
Quantitative analysis
RBI EmEurope Risk Index
The Asset Allocation Group of Raif-feisen Research has developed risk indicators to detect periods of above and below average returns (boom and stagnation periods) in financial markets beforehand. Risk index below middle band (boom period): Period of high risk appetite which should be accompanied by above-average returns.Risk index above middle band (stag-nation period): Period of low risk ap-petite in which below – average re-turns are to be expected.
0.10
0.20
0.30
0.40
0.50
0.60
0.70
0.80
0.90
Feb-10 Nov-10 Aug-11
Middle band Risk Index
RBI EmEurope Risk Index
Last value: 28 March 2012Source: Thomson Reuters, Raiffeisen RESEARCH
Beta to MSCI World and MSCI EM
Beta: Measures the sensitivity of an equity index to changes of a factor (MSCI World and MSCI EM) Beta > 1: The equity index shows larger swings then the factor.Up-Beta: Measures the sensitivity of an equity index to positive changes of a factor (MSCI World and MSCI EM).up-beta > 1: The equtiy index rises more then the factor in positive periods.Down-Beta: Measures the sensitivity of an equity index to negative changes of a factor (MSCI World and MSCI EM).Down-beta > 1: The equtiy index de-creases more then the factor in nega-tive periods.
Beta to MSCI World
Beta Up-Beta Down-Beta Up-DownEM Europe 1.10 1.12 1.07 0.04
Czech Rep. 0.65 0.69 0.79 -0.10
Poland 1.00 1.07 1.17 -0.10
Russia 1.20 1.23 1.09 0.14
Hungary 1.04 0.95 0.90 0.05
Betas to MSCI World; weekly returns of the last 2 yearsSource: Thomson Reuters, Raiffeisen RESEARCH
Beta to MSCI EM
Beta Up-Beta Down-Beta Up-DownEM Europe 1.21 1.21 1.49 -0.28
Czech Republic 0.61 0.72 0.70 0.02
Poland 1.08 1.16 1.40 -0.24
Russia 1.36 1.32 1.63 -0.32
Hungary 0.99 1.15 0.99 0.16
Betas to MSCI EM; weekly returns of the last 2 yearsSource: Thomson Reuters, Raiffeisen RESEARCH
672nd quarter 2012
Cut-off for data: 28 March 2012This report was completed on 2 April 2012
Acknowledgements:Editor: Raiffeisen RESEARCH GmbHA-1030 Vienna, Am Stadtpark 9, Telephone: +43 1 717 07-0, Telefax +43 1 717 07-1848
Published by: Raiffeisen RESEARCH GmbH, 1030 Vi-enna, Am Stadtpark 9. Published and manufacured in ViennaPrinted by: Holzer Druck, 1100 Wien, Buchengasse 79Cover photo: wjarek/panthermediaDesign: Kathrin Korinek, Birgit Bachhofner
Currencies and CountriesALL Albanian lekBAM Bosnian markaBGN Bulgarian levBYR Belarusian roubelCNY Chinese yuanCZK Czech korunaEKK Estonian kroonHUF Hungarian forintHRK Croatian kunaLTL Lithuanian litasLVL Latvian latsPLN Polish zlotyRON Romanian leuRSD Serbian dinarRUB Russian roubleSIT Slovenian tolarSKK Slovak korunaTRY Turkish liraUAH Ukrainian hryvnia
Economic abbreviations %-chg Percentage change (not in percentage points)avg averagebp basis pointsC/A Current AccountCPI Consumer Price IndexFDI Foreign Direct InvestmentsFX Foreign ExchangeFY Full yearGDP Gross Domestic ProductLCY Local Currencymmav month moving averagemom month on monthpp percentage pointsPPI Producer Price Indexqoq quarter on quarterT/B Trade BalanceULC Unit Labour Costsyoy year on yearytd year-to-date
Stock Exchange IndicesBELEX15 Serbian stock indexBET Romanian stock indexBUX Hungarian stock indexCROBEX10 Croatian stock indexPX Czech stock indexMICEX Russian stock indexSASX-10 Bosnian stock indexWIG 20 Polish stock index
Equity relatedDY Dividend yieldEG Earnings growthLTG Long term (earnings) growthP/E Price earnings ratio
RS Recommendation suspendedUR Under Revision
Abbreviations
CE Central European countries - Poland, Hungary, Czech Republic, Slovakia, SloveniaSEE South East European countries - Albania, Bosnia and Herzegovina, Bulgaria, Croatia, Romania, SerbiaCIS European CIS (Commonwealth of Independent States) countries - Russia, Ukraine, BelarusCEE Central and Eastern Europe (CE + SEE + CIS)
This document does not constitute an offer or invitation to subscribe for or purchase any securities and neither this document nor anything contained herein shall form the basis of any contract or commitment whatsoever. This document is being furnished to you solely for your information and may not be reproduced or redistributed to any other person. Any investment decision with respect to any securities of the respective company must be made on the basis of an offering circular or prospectus approved by such company and not on the basis of this document. RBI may have effected an own account transaction in any investment mentioned herein or related investments and or may have a position or holding in such investments as a result. RBI may have been, or might be, acting as a manager or co-manager of a public offering of any securities mentioned in this report or in any related security. Information contained herein is based on sources, including annual reports and other material which might have been made available by the entity which is the subject of this document. RBI believes all the information to be reliable, but no representations are made as to their accuracy and completeness. Unless otherwise stated, all views (including statements and forecasts) are solely those of RBI and are subject to change without notice.Investors in emerging markets need to be aware that settlement and custodial risk may be higher than in markets where there is a long established infrastructure and that stock liquidity may be impacted by the numbers of market makers which may therefore impact upon the reliability of any investments made as a result of acting upon information contained in this document. Special regulations for the Republic of Austria: This document does not constitute either a public offer in the meaning of the Kapitalmarktgesetz („KMG“) nor a prospectus in the meaning of the KMG or of the Börsegesetz. Furthermore this document does not intend to recommend the purchase or the sale of securities or investments in the meaning of the Wertpapieraufsichtsgesetz. This document shall not replace the necessary advice concerning the purchase or the sale of securities or investments. For any advice concerning the purchase or the sale of securities of investments kindly contact your RAIFFEISENBANK. Special regulations for the United Kingdom of Great Britain, Northern Ireland (UK) and Jersey (Channel Islands): this publication has been either approved or issued by Raiffeisen Bank International AG (RBI) in order to promote its investment business. RBI London Branch is authorised by the Austrian Financial Market Authority (FMA) and subject to limited regulation by the Financial Services Authority (FSA). Details on the extent of the London branch‘s regulation by the Financial Services Authority are available on request. This publication is not intended for investors who are Retail Customers within the meaning of the FSA rules and should therefore not be distributed to them. Neither the information nor the opinions expressed herein constitute or are to be construed as an offer or solicitation of an offer to buy (or sell) investments. RBI may have effected an Own Account Transaction within the meaning of FSA rules in any investment mentioned herein or related investments and or may have a position or holding in such investments as a result. RBI may have been, or might be, acting as a manager or co-manager of a public offering of any securities mentioned in this report or in any related security. The RBI Jersey marketing representative office is not regulated by the Jersey Financial Services Commission as it does not perform any financial services activity in Jersey as defined by the Financial Services (Jersey) Law 1998 (FSJL). Special regulations for the United States of America (USA) and Canada: This document or any copy hereof may not be taken or transmitted or distributed, in the USA or Canada or their respective territories or possessions nor may it be distributed to any USA-person or person resident in Canada by any means other than via a U.S. Broker Dealer. Any failure to comply with these restrictions may constitute a violation of USA or Canadian securities laws.
Company: Disclosure:Immofinanz 3AMAG 3, 4, 5Bogdanka -Cyfrowy Polsat -MTS -
Detailed disclosure and disclaimer on the aforementioned companies as well as on the „coverage universe“ of Raiffeisen Centrobank pursuant to § 48 Stock Exchange Act: http://www.rcb.at.
Disclosures under § 25 Mediengesetz (as per 1 January 2012)
Published by: Raiffeisen RESEARCH GmbH, Sitz: 1030 Wien, Am Stadtpark 9Management: Peter Brezinschek, Helge Rechberger, Kurt Kotzegger Raiffeisen Bank International AG. Object of business: Credit institution, Principal place of business: 1030 Wien, Am Stadtpark 9.Board of management: Herbert Stepic (Chairman), Karl Sevelda (Vice Chairman), Aris Bogdaneris, Patrick Butler, Martin Grüll, Peter Lennkh, Johann Strobl.Supervisory board: Walter Rothensteiner (Chairman), Stewart Gager, Kurt Geiger, Erwin Hameseder, Markus Mair, Ludwig Scharinger, Hannes Schmid, Johannes Schuster, Friedrich Sommer, Christian Teufl.Staff council delegates: Martin Prater, Rudolf Kortenhof, Peter Anzeletti-Reikl, Dr. Susanne Unger, Helge Rechberger.Shareholder with a stake exceeding 25 per centRaiffeisen Zentralbank Österreich AG (78.5%); principal business: acquisition, management and controlling of participa-tions, in particular Raiffeisen Bank International.Management: Walter Rothensteiner, Johannes Schuster, Johann Strobl.General direction: Information and forecasts regarding the money and capital markets of Central and Eastern Europe and Austria.
ViennaAaron AlberJörg AngeléMario AnnauEva BauerGunter DeuberWolfgang ErnstChristian HinterwallnerValentin HofstätterChristoph IbserStephan ImreChristoph KlaperIgor KovacicLydia KrannerNina KukicMartin KutnyVeronika LammerJörn LangeHannes LoackerRichard MalzerAndreas MannsparthJohannes MattnerStefan MemmerAlbert MoikJulia NeudorferChristine NowakPeter OnofrejHelge RechbergerMatthias ReithLeopold SalcherAndreas SchillerRobert Schittler
Andreas SchwabeConnie SchümannManuel SchusterGintaras ShlizhyusGleb ShpilevoyAlexander SkleminGottfried SteindlMartin StelzenederMagdalena SzczepanskiJürgen Walter
Albania Joan CanajValbona Gjeka Belarus Oleg LeontevVasily Pirogovsky Natalya Chernogorova
Bosnia & Herzegovina Ivona KristicSrebrenko Fatusic Bulgaria Kaloyan GanevHristiana Vidinova
CroatiaAnton StarcevicZrinka Zivkovic MatijevicIvana Juric Nada HarambasicAna FraninMarijana Cigic
Czech RepublicPavel MertlikVaclav FranceMichal BrozkaAles MichlJindrich Svatek
HungaryZoltán TörökÁdám KeszegLevente Blahó
PolandJacek WisniewskiMarta Petka-ZagajewskaDorota StrauchTomasz RegulskiJacek MielcarekPawe³ RadwañskiMicha³ Krajczewskik
RomaniaIonut DumitruNicolae Covrig Gabriel BobeicaRomulus MirceaIon Gheorghe GutaBogdan CampianuIonut GutisAlexandru CombeiIuliana MocanuGenghiz Curtali
RussiaAnastasia BaykovaDenis PoryvayAnton PletenevMaria PomelnikovaPavel PapinIrina AlizarovskayaKonstantin YuminovSergey Libin
SerbiaLjiljana Grubic
SlovakiaRobert PregaJuraj ValachyBoris Fojtik
SloveniaPrimoz Kovacic
UkraineDmytro SologubLudmila ZagoruykoOlga Nikolaieva
Company ResearchStefan Maxian (Head)
Daniel DamaskaOleg GalburNatalia FreyJakub KrawczykBartlomiej KubickiBernd MaurerDominik NiszczMarkus RemisTeresa SchinwaldBernhard SelingerJovan SikimicArno SupperChristoph ThurnbergerIryna Trygub-Kainz
Global Raiffeisen RESEARCH Team: Peter Brezinschek (Head)
68 2nd quarter 2012
Raiffeisen Bank International AG, Vienna Capital Markets Head: Nicolaus Hagleitner Tel: +43 1 71707 1467Head of Fixed Income Sales: Luca Scalzini Tel: +43 1 71707 3981Head of FX-MM Sales: Wolfgang Kalinka Tel: +43 1 71707 3959Head of Solution Sales: Harald Schönauer Tel: +43 1 71707 1148
Belgrade: Raiffeisenbank a.d. SerbiaContact: Zoran Petrovic Tel: +381 11 2207006
Bratislava: Tatra banka, a.s. Contact: Henrieta Hudecova Tel: +421 2 59191334 Bucharest: Raiffeisen Capital & Investment S.A.Contact: James Stewart Tel: +40 21 302 0082
Budapest: Raiffeisen Bank Zrt.Contact: Lázló Volosinovsky Tel: +36 1 484 4639
Kiev: Raiffeisen Bank AvalContact: Oksana Volchko Tel: +38 044 230 0348
Maribor: Raiffeisen Banka d.d. Contact: Gvido Jemensek Tel: +386 2 229 3111
Minsk: Priorbank JSCContact: Andrey Filazafovich Tel: +375 17 289 9 213
Moscow: ZAO Raiffeisenbank AustriaContact: Sergei Monin Tel: +7 495 721 9922
Tirana: Raiffeisen Bank Sh.a.Contact: Christian Canacaris Tel: +355 4 253 646
Prague: Raiffeisenbank a.s.Contact: Jan Pudil Tel: +420 234 401 863
Sarajevo: Raiffeisen BANK d.d. Bosnia and HerzegovinaContact: Sanja Korene Tel: +387 33 287 122
Sofia: Raiffeisenbank (Bulgaria) EADContact: Evelina Miltenova Tel: +359 2 91985 451
Warsaw: Raiffeisen Bank Polska S.A.Contact: Krystof Lubkiewicz Tel: +48 691 335 510
Zagreb: Raiffeisenbank Austria d.d.Contact: Ivan Zizic Tel: +385 1 45 66 466
Raiffeisen Bank International AG
Investmentbanking units
Institutional Equity Sales, Vienna Head: Wilhelm Celeda Tel: +43 1 515 20 402Sales: Klaus della Torre Tel: +43 1 515 20 472
Raiffeisen Investment AG, ViennaContact: Wolfgang Putschek Tel: +43 1 710 54 00-153Martin Schwedler Tel: +43 1 710 54 00-155
Raiffeisen CENTROBANK AG
Raiffeisen Bank International AG, ViennaAustrian Corp. Customers: Joseph Eberle Tel: +43 1 71707 1487Financial Institutions: Axel Summer Tel: +43 1 71707 1476
RBI London BranchContact: Wladimir Ledochowski Tel: +44 20 7933 8002 Mark Bowles Tel: +44 20 7933 8001
Raiffeisen Malta Bank plc., Sliema Contact: Anthony Schembri Tel: +356 21 320 942
RB International Finance USA, New YorkContact: Dieter Beintrexler Tel: +1 212 845 4100 Stefan Gabriele Tel: +1 212 835 2328
RBI Beijing Branch Contact: Andreas Werner Tel: +86 10 653 233 88
RBI Singapore BranchContact: Stefan Mandl Tel: +65 6305 6100
Commercial banks
Vienna: Raiffeisen Bank International AGContact: Rudolf Lercher Tel: +43 1 71707 3537
Belgrade: Raiffeisen banka a.d.Contact: Sofija Davidovic Tel: +381 11 220 7807
Bratislava: Tatra banka, a.s.Contact: Henrieta Hudecova Tel: +421 2 5919 1849
Bucharest: Raiffeisen Bank S.A.Contact: Reinhard Zeitlberger Tel: +40 21 306 1564
Budapest: Raiffeisen Bank Zrt.Contact: Laszlo Volosinovsky Tel: +36 1 484 4639
Kiev: Raiffeisen Bank AvalContact: Oksana Volchko Tel: +38 044 230 0348
Maribor: Raiffeisen Banka d.d.Contact: Simon Jug Tel: +386 2 2293 276
Minsk: Priorbank JSCContact: Maksim Petrovsky Tel: +375 17 289 92 03
Moscow: ZAO Raiffeisenbank AustriaContact: Maria Maevskaya Tel: +7 495 775 5230
Prague: Raiffeisenbank a.s.Contact: Roman Lagler Tel: +420 234 40 1728
Pristina: Raiffeisen Bank Kosovo J.S.C.Contact: Lirije LLazani-Hoxha Tel: +381 38 22 22 22 184
Sofia: Raiffeisenbank (Bulgaria) EADContact: Irena Krentcheva Tel: +3592 9198 5826
Sarajevo: Raiffeisen Bank d.d. Bosna i HercegovinaContact: Vildana Sijamhodzic Tel: +387 33 287 283
Tirana: Raiffeisen Bank Sh.a. Contact: Jorida Zaimi Tel: +355 4 2381 445 2865
Warsaw: Raiffeisen Bank Polska S.A.Contact: Zuzanna Szatkowska Tel: +48 22 585 2431
Zagreb: Raiffeisenbank Austria d.d.Contact: Wolfgang Wöhry Tel: +385 1 4566 462
International desk


