
CASE STUDY: THE ROI OF COOLING
SYSTEM ENERGY EFFICIENCY
UPGRADES
CONTRIBUTORS:
Tom Brey, IBM
Pamela Lembke, IBM
Joe Prisco, IBM
Ken Abbott, Emerson
Dominic Cortese, Emerson
Kerry Hazelrigg, Disney
Jim Larson, Disney
Stan Shaffer, MSI
Travis North, Chatsworth Products
Tommy Darby, Texas Instruments
WHITE PAPER #39

PAGE 2
2011 The Green Grid. All rights reserved. No part of this publication may be used, reproduced, photocopied,
transmitted, or stored in any retrieval system of any nature without the written permission of the copyright
owner.
Executive Summary
Data center managers and operators want to operate their facilities more efficiently, but struggle to justify the
business return on various energy savings investments. They lack the capability to cite vendor independent
studies that provide the relative importance and savings those changes provide.
The Green Grid and a Green Grid member company (hereinafter referred to as MC) have evaluated a number
of energy efficiency upgrades made by the MC within a production data center. The results of this study should
help data center operators worldwide determine the return on investment (ROI) of specific investments and the
relative value of each upgrade.
The Green Grid-defined PUE™ metric was used as the primary indicator of efficiency and was measured
throughout all phases of the study. The upgrades and order of improvements were as follows:
1. Install OEM variable speed drives (VSDs) in all computer room air handlers (CRAHs).
2. Upgrade older CRAH units with newer more efficient models.
3. Improve rack airflow management by adding baffles and blanking panels, which improve
isolation of hot and cold air aisles.
4. Reposition the CRAH temperature/humidity sensors from the inlets of the CRAHs to the front of
the IT equipment racks.
5. Adjust the temperature setpoints of the CRAH sensors and the chiller units.
The reduction in energy consumption was calculated to be 9.1%, which equates to 300 kW and an
approximate annual utility savings of $300,000. The primary contributors to this savings were the installation
of VSDs and temperature setpoint changes at the CRAHs and chiller plant. Overall, the investment payback
period is just under two years. The team is optimistic that there are more potential savings to be realized and
have developed some next steps recommendations for MC to consider.
The Green Grid would like to thank the MC for allowing us to enter and analyze a production data center for the
express purpose of sharing the results with other Green Grid MCs and publicly with peer data center managers
and operators across the globe.
It must be noted that all vendors names and equipment types were removed for vender neutrality
requirements by The Green Grid. Therefore, it is advised that behaviors of equipment used other than
equipment in this case study might yield different results. Data center operators seeking energy savings

PAGE 3
2011 The Green Grid. All rights reserved. No part of this publication may be used, reproduced, photocopied,
transmitted, or stored in any retrieval system of any nature without the written permission of the copyright
owner.
through cooling system improvements must refer to OEM data to determine behavior of their selected
equipment and the potential associated savings.

PAGE 4
2011 The Green Grid. All rights reserved. No part of this publication may be used, reproduced, photocopied,
transmitted, or stored in any retrieval system of any nature without the written permission of the copyright
owner.
Table of Contents
I. INTRODUCTION ........................................................................................................................ 5
II. DESCRIPTION OF CASE STUDY DATA CENTER ................................................................... 7
III. DATA BASELINE AND ONGOING MEASUREMENT METHODOLOGY ................................ 14
IV. EFFICIENCY IMPROVEMENTS IMPLEMENTED ................................................................. 21
V. RETURN ON INVESTMENT ................................................................................................. 37
VI. ISSUES, LESSONS LEARNED, AND FUTURE WORK ......................................................... 38
VII. SUMMARY AND CONCLUSION ........................................................................................... 39
VIII. REFERENCES .................................................................................................................. 41
IX. ABOUT THE GREEN GRID ................................................................................................... 42

PAGE 5
2011 The Green Grid. All rights reserved. No part of this publication may be used, reproduced, photocopied,
transmitted, or stored in any retrieval system of any nature without the written permission of the copyright
owner.
I. Introduction
Data center managers and operators are responsible for providing an environment which allows information
and communications technology (ICT) equipment to operate reliably and at peak performance levels regardless
of the building's external environment. Power is transformed into voltage ranges needed by ICT equipment, air
is conditioned and exchanged a number of times during the day to make the data center habitable, and water
is used to remove heat from the data center space into the external environment.
Saving energy must not put ICT equipment at risk. It is the intent of this paper to show how a series of
improvements were made to the MC data center without putting the ICT equipment at risk, all while making
measurements of the process. Many operators believe that energy can be saved in the data center with the
proper investment of capital and labor. Providing C-level executives with a proper ROI assessment has
heretofore been a barrier to saving energy.
Energy costs, availability, and sustainability are of concern to many corporations. The MC believed it was in
their best interest to become more energy efficient and that they could quantify that efficiency by opening up
their data center to The Green Grid for a vendor independent study. In turn, The Green Grid and the MC could
share results with other data center operators.
Funding for five energy upgrades had already been secured by the MC. Aware of both the difficulty of getting
additional funding without an ROI study, and that many of their peers in the industry had difficulty obtaining
energy management funding without providing a business case, before proceeding with the upgrades the MC
proposed a joint project in which The Green Grid would provide technical guidance on the implementation of
the upgrades and suggest the measurements needed to prove or disprove the resultant energy savings.
Given that this was a production data center, it was a given that upgrades could only occur if there was no risk
to the ICT equipment. These upgrades were considered to be the first set of low-risk items (low hanging fruit) to
save energy in this data center.
Given the length of the study, the ambient climate, and the large energy consumption of the chillers in this
data center, PUE1 and a PUE normalized to account for outside temperature variations were utilized to
determine data center efficiency. This ensured that the value of the upgrades could be determined and
explained independent of the external ambient conditions. For example, if the outside air temperature
1 PUE definition,
http://thegreengrid.org/~/media/WhitePapers/White_Paper_6_PUE_and_DCiE_Eff_Metrics_30_December_2008.ashx?lang=en

PAGE 6
2011 The Green Grid. All rights reserved. No part of this publication may be used, reproduced, photocopied,
transmitted, or stored in any retrieval system of any nature without the written permission of the copyright
owner.
increased soon after efficiency changes inside the data center were made, the apparent effect of those
changes could be offset by the increased power consumption of the chillers. Normalizing the effects of the
external environment was required in order to measure the savings independent of external conditions.
The study starts out in December of 2009 with a baseline of the data center's state before any upgrades were
made. The basic measurements to be done throughout the study were established and equipment was put in
place to measure, collect, and report the data required to determine the PUE of the data center, along with the
external ambient conditions of the data center. The five upgrades were then made one at a time. The following
chart shows the improvement to PUE as each upgrade was made.
Figure 1: Case Study Timeline

PAGE 7
2011 The Green Grid. All rights reserved. No part of this publication may be used, reproduced, photocopied,
transmitted, or stored in any retrieval system of any nature without the written permission of the copyright
owner.
II. Description of Case Study Data Center
DATA CENTER LAYOUT AND CONTENT
The total raised floor area of the data center is approximately 33,000 ft2 and is comprised of multiple
environmentally isolated areas. The main areas consist of Zone 1 (approximately 16,000 sq. ft.) and Zone 2
(approximately 12,000 sq. ft.). While the ROI in this study is measured against efforts performed within the
entire data center, additional sensors were placed and additional modeling was performed (see Section III) in
Zone 2 as a precaution and a validation mechanism to guide the changes that were made throughout the data
center.
The raised floor to dropped ceiling height of the data center is nine feet and the height of the raised floor
ranges from 24 to 36 inches. There are approximately 900 ICT racks, comprised of approximately 85% ICT
server racks and 15% other floor mounted devices (such as non-standard prepackaged racks or storage
devices) within the data center. The power model for a standard information technology (IT) rack (not including
network/communications racks) is 3 kW per rack, with exceptions up to 6 kW. The average power per ICT rack,
including network/communications racks, is 2.1kW.
The following figures illustrate the computational fluid dynamics models that were built to help The Green Grid
understand the operating points of the data center. These models and the accompanying diagrams were used
to determine the next set of actions or to help understand why a particular change had not yielded the
expected results.

PAGE 8
2011 The Green Grid. All rights reserved. No part of this publication may be used, reproduced, photocopied,
transmitted, or stored in any retrieval system of any nature without the written permission of the copyright
owner.
Figure 2 shows a top down view of Zone 1 and Figure 3 shows a top down view of Zone 2. Both zones are
located in the same building, but are two separate areas, blocked off completely in the under floor and above
floor. Improvements were made to both zones. However, the majority of the analysis work was done on Zone 2.
Figure 2: Zone 1 Floor Plan
Figure 3: Zone 2 Floor Plan

PAGE 9
2011 The Green Grid. All rights reserved. No part of this publication may be used, reproduced, photocopied,
transmitted, or stored in any retrieval system of any nature without the written permission of the copyright
owner.
Figure 4 shows the model prediction of underfloor airflow by direction and speed, as well as static pressure.
Static pressure is represented by color, airflow direction is shown by an arrow, and the length of the arrow
denotes air speed.
Figure 4: Zone 2 underfloor static pressure, airflow direction and speed
Figure 5 predicts which CRAH units supply air to each area of the under floor. In this diagram color represents
the CRAH unit that sources the air plume.
Figure 5: Zone 2: Airflow approximation of CRAH units

PAGE 10
2011 The Green Grid. All rights reserved. No part of this publication may be used, reproduced, photocopied,
transmitted, or stored in any retrieval system of any nature without the written permission of the copyright
owner.
ELECTRICAL AND MECHANICAL INFRASTRUCTURE
As shown in Figure 6, power is provided to the data center by three utility inputs with backup generators
connected via an automatic transfer switch (ATS). Power is distributed to cooling and ICT equipment via power
distribution units (PDUs). The path containing the ICT equipment contains the uninterruptible power supplies
(UPS's) which provide backup power when the utility goes off-line until the generators come on-line.
Figure 6: High-Level Power Diagram
For purposes of this study, the data center PUE is measured using the five meters shown above, where PUE =
(M4 + M5 + M6) / (Ma + Mb) = Total Data Center Power / ICT Equipment Power. M1, M2, and M3 data were
not available in the early baseline calculations, but are now used for the MC‟s PUE reporting. The difference
between the two calculations is less than 1% on average.

PAGE 11
2011 The Green Grid. All rights reserved. No part of this publication may be used, reproduced, photocopied,
transmitted, or stored in any retrieval system of any nature without the written permission of the copyright
owner.
Flow:1. Air is taken in from the cold air aisle, heated within the IT equipment, and then pushed to the hot air aisle.2. VSD fans move air from the hot air aisle over the coil, thus transferring heat to the liquid 3. Valves (temperature, fan speed) 4. Liquid is moved to/from the chiller plant5. Water is cooled using electricity via the refrigeration cycle6. External ambient air is used to remove heat from the compressor
Note: Temperatures listed give readers a sense of heat transfer through the system• Chilled water set point is 46⁰F with return measured at 59⁰F• Remote sensor set point at ICT inlet is 71⁰F
IT Load
Cold air aisle
Hot air aisle
IT Load
Cold air aisle
Hot air aisle
1
2
3
45
6
Air from CRAH at ICT inlet, varies due to mixing ranging from 66 – 75⁰F
Figure 7: Basic cooling diagram of the data center
The following lists basic information about the mechanical and electrical infrastructure of the data center,
shown in Figure 7:
ICT Heat Load: Approximately 900 racks at 2.1kW average = approximately 1,900 kW total power load.
Assuming sensible cooling which accounts for humidity, 3.5 kW requires 1 ton of cooling. Hence, 543 tons
(1,900/3.5) of cooling is required.
CRAH: When the baseline was created at the onset of the study, the data center contained a total of 44 CRAH
units in a room perimeter wall configuration as follows: The ICT area contained 32 CRAH units at 30 tons each
and 6 units at 20 tons. The UPS room contained 6 CRAH units at 30 tons each. Each CRAH unit had static (not
VSD) motors for water valve control and feedback based upon room air temperature and humidity returning to
the unit (the warmer the air the wider the water valve opened). During the study all CRAH units were upgraded
to VSD's and each unit was provided with fan speed control as well as water valve positioning control. In
addition, the temperature and humidity sensor was moved from the return air of the CRAH unit to the air intake
of the ICT equipment to control the temperature at the load where it matters the most. Two additional CRAHs
were added to Zone 2 during the last two weeks of the study.

PAGE 12
2011 The Green Grid. All rights reserved. No part of this publication may be used, reproduced, photocopied,
transmitted, or stored in any retrieval system of any nature without the written permission of the copyright
owner.
Chillers: The data center complex also contains five 225 ton air cooled chillers in an N+1 configuration. Four
chillers normally run. When outside air temperature is low, only three chillers run. Under 95°F ambient
temperature the chiller plant can yield 900 tons.
Climate Zone: Average highs throughout the year range from 72°F to 92°F. Average lows range from 50°F to
73°F with peaks above 100°F.
Backup Generators: Four 1750kW generators in an N+1 configuration, yielding 5250 kW (3 X 1750).
UPS: Four 1200 kW UPS systems, two (N+1) yielding 2160kW for ICT equipment.
Figure 8: Relative Capacities (Dotted line represents sensible cooling for a given IT load)
Figure 8 shows the ICT average load and the power and cooling capacities serving that load. The backup
generator has to serve both the ICT and non-ICT equipment. The UPS capacity offers room for growth. The
CRAH and chiller capacities are greater than the current ICT load, which also allows for room growth. Extremely
hot temperatures (over 95°F) will also reduce the chiller capacity. Although the chart suggests that energy is
being wasted due to overcapacity in the cooling system, the typical data center operator has to be mindful of
the risks incurred in providing only just enough cooling given failure conditions and external operating points.
Utility Shut-down Flow (ride through): UPS backup is provided only to ICT equipment. When power is lost the
CRAH units will gradually spin-down and stop moving air - it is estimated the fans will stop in 15 seconds. This
will lead to a rapid increase in temperature within the data center. The generators will start and will come on-
1900
5250
2160
0 0543
1320900
0
1000
2000
3000
4000
5000
6000
ICT Lo
ad
Backu
p gener
ator c
apacit
y
UPS capca
ity
Sensib
le co
oling f
or IC
T load
CRAH capac
ity
Chiller c
apacit
y
Power(kw)
Cooling (tons)

PAGE 13
2011 The Green Grid. All rights reserved. No part of this publication may be used, reproduced, photocopied,
transmitted, or stored in any retrieval system of any nature without the written permission of the copyright
owner.
line within 40 seconds and are switched in by the ATS. The pumps restart in 30-60 seconds after power failure,
and the chillers between 1 minute 40 seconds and 4 minutes. The fans on the CRAHs return to normal after
about 60 seconds.
During a power failure, the temperature at various rack inlet points increased between 4 and 20 degrees (from
power failure to return of cooling air), depending on the sensor location. Hence, the air temperature in the
room must be low enough so as not to exceed a critical temperature when the mechanical switchover occurs.
Reducing the time in which the generators can bring the CRAH units on-line allows the data center operator to
increase the cold air aisle temperature because the self-heating time (time without CRAH unit fans running) will
be reduced.

PAGE 14
2011 The Green Grid. All rights reserved. No part of this publication may be used, reproduced, photocopied,
transmitted, or stored in any retrieval system of any nature without the written permission of the copyright
owner.
III. Data Baseline and Ongoing Measurement Methodology
DATA CENTER DATA COLLECTION BASELINE
Rationale for establishing a good baseline
The study group created a baseline of the original data center by collecting data, both manually and
electronically, from the ICT equipment and mechanical infrastructure. The baseline data for this study was an
important comparison point not only as preparation for determining return on investment, but also for
providing data for energy comparisons and boundary and operating points to load into the modeling tools after
each of the five energy efficiency upgrades.
Computational fluid dynamics (CFD) modeling is often used to assist data center operators with trouble
shooting hot spots and to predict options for future growth, etc. However, the accuracy of the modeling tools is
not always trusted by end users. Establishing a good set of baseline data, which is input into the model to
create an electronic version of the data center, will allow the model to more accurately predict the changes
that occur because of upgrades. Continuing to take data as the upgrades complete allows the model to be
verified at each efficiency update, thus ensuring that the model reflects the current configuration of the data
center.
Methods of Collecting Baseline Data
Data from the ICT and mechanical infrastructure was collected from the data center the week of December 14,
2009 by a sub group of members.
Figure 9: Persons of interest pictured during the baseline study

PAGE 15
2011 The Green Grid. All rights reserved. No part of this publication may be used, reproduced, photocopied,
transmitted, or stored in any retrieval system of any nature without the written permission of the copyright
owner.
The following lists the tools and methods of collection by hardware type:
Air handling units (AHUs) – airflow through the unit. A velocity matrix was used to measure the
airflow returning to the AHU. The matrix “X” (see below) measures about 12” long and wide. It
was placed in multiple, non-overlapping locations on the return air grille, the airflow at that
location was recorded, and an average velocity of one AHU was obtained.
Air handling units – return and exhaust air temperature. A data logger having six thermocouples
was used to measure return and exhaust air temperature for at least two hours. Three
thermocouples were taped to the AHU return air area and three more were placed in the exhaust
under-floor airstream. At this location, the lifting of perforated tiles was required in order to place
the thermocouple immediately in front of the AHU. The tiles were returned as closely as possible
to their closed position for data collection.
Server temperature. Two methods of measuring server temperature were completed in Zone 2.
First, measurements at the front intake of the racks were taken at the ground level,
approximately three feet and six feet from the floor. These were taken one time only during a
normal business day. Second, thermocouples were set up at the intake of 20 racks,
approximately halfway up, for long term data recording.
ICT power draw. Amperage measurements of every rack were taken at certain intervals. These
measurements were used to calculate heat loads, which were then input into the model.
Perforated tile airflow. Each perforated tile was measured and recorded for airflow. A balometer
with a 2 ft. x 2 ft. hood was used - placed squarely on each tile prior to data collection.
Underfloor static pressure. To obtain a general picture of static pressure under the floor and as
an aid in model validation, static pressure was taken using an Alnor tool that measured static
pressure in inches of water. This was used in seven locations scattered throughout the data
center. The tool was slid into the raised floor through the openings in the perforated panels and
measurements were taken in eight directions under the floor, with the tool pointing north,
northeast, east, etc. The highest measurement was used to verify the model.

PAGE 16
2011 The Green Grid. All rights reserved. No part of this publication may be used, reproduced, photocopied,
transmitted, or stored in any retrieval system of any nature without the written permission of the copyright
owner.
Cable openings. The location and size of cable openings were noted for entry into the model. In
this data center, rack cable openings were all covered by a brush covering. Additionally, openings
under PDUs and other equipment were added to the model.
Initial PUE. Prior to the start of the analysis, the data center was recording PUE, which was being
measured from the output of the UPS. The Green Grid recommended the measurement location
be moved one step further back in the powertrain, to just after the input transformer lines. PUE
was taken consistently every 15 minutes. Additional measurement points were installed, but for
consistency, only the original measurement points were used in this study. The difference
between the two PUE calculations was less than 1%.
Air test and balance. The data center operators routinely performed air test and balance
measurements through a local contractor. This data collection included an update of the
perforated tile locations, static pressure under the floor in multiple locations, rack row by row
temperature readings at 36”, and return air temperatures to the CRAH units. The most recent set
of data was reviewed during the initial baseline and it was agreed to use future test and balance
reports for the ongoing baseline updates.
Challenges
Taking data only when other tiles were not raised from normal daily activities. Even though the data center was
large, raising and removing single or multiple tiles around the room would have an effect on airflow and
temperature that would not mimic steady state. The majority of measurements were taken when no tiles were
lifted or out of place. Whenever possible, data collection was stopped when a tile was removed. However, the
data collection typically started just after the tile was removed as completion time was a factor, so the data
center may not have completely returned to steady state.
Time. Similar to above, time to take and collect measurements was finite. Ideally, some temperature and
power measurements would be taken at varying times of day and days of the week. Zone 1 was not fully
characterized because the case study team was onsite for four full days to perform the baseline
measurements, allowing them only enough time to capture data for Zone 2. However, PUE data was available
over time, which was fully documented and utilized to its highest potential.
Data overload. In many cases, more data is better. However, too much data can be excessive and cause the
user and reviewer more harm than help, unless there is automation in place to help the user digest the data.
Every nuance of the data center may not be revealed when limiting the analysis to one data center with data

PAGE 17
2011 The Green Grid. All rights reserved. No part of this publication may be used, reproduced, photocopied,
transmitted, or stored in any retrieval system of any nature without the written permission of the copyright
owner.
collection only during standard working hours, but this still gives a good picture and allows the drawing of
accurate and meaningful conclusions.
Data underload. Although the study was for the entire data center, only a sample area was examined for
purposes of collecting data for CFD modeling. The CFD model was used to understand behaviors of the CRAHs
and airflow, as well as guiding the implementation of improvements. During the analysis phase of determining
ROI, it was realized that data from Zone 1 would have simplified the analysis. In lieu of that data, assumptions
had to be made on the behavior of the CRAHs in that area. For instance, to determine the power savings
associated with reduction in fan speed, assumptions were made about the fan speed in Zone 1 CRAH units
based on the behavior shown in Zone 2 CRAH units after each improvement.
ONGOING MEASUREMENT METHODOLOGY
Re-baseline after each improvement implemented.
In order to more accurately analyze the changes in the data center after each efficiency improvement was
made, the data center was “re-baselined” after each improvement. While not all of the original measurements
were taken, automated and semi-automated reports were collected for analysis purposes. The data was
collected and analyzed from the time the improvement went into place to anywhere between three days to
several weeks later. The case study team wanted to capture the data resulting from the changes as well as be
able to note when the data center came back to steady state. This data was also used to validate the model.
Data included:
PUE. Perhaps the most important piece of data, the rolling PUE data was collected after each efficiency
iteration. PUE was measured on 15 minute intervals. The measurement points are identified in Figure 6. PUE
changes are shown in

PAGE 18
2011 The Green Grid. All rights reserved. No part of this publication may be used, reproduced, photocopied,
transmitted, or stored in any retrieval system of any nature without the written permission of the copyright
owner.
Figure 1. Additional overall PUE measurements can be found in Section IV.
Fan speed percentage. The new CRAHs contained variable speed drives. Fan speed is related to the speed of
the drive, how much power the drive pulls, as well as the utilization of the CRAH. The fans will be on anywhere
from 60% - 100% of capacity. 60% is the lowest these CRAH unit fans will operate (based on manufacturer
settings) even if that much airflow is not required (unless specifically altered by the user).
Chilled water valve percentage. The chilled water valve percentage is important to know to determine how
much work a CRAH is doing. The chilled water valve also tracks along with the fan speed – 80% fan speed =
80% chilled water valve. Monitoring the chilled water valve along with fan speed and the remote temperature
sensors helps identify problems such as over/under provisioning of CRAH units in a specific location and the
incorrect location of temperature sensors. While a CRAH unit fan will go to 60% fan speed at its lowest, the
chilled water valve will go down all the way to zero percent open. Hence, a CRAH unit running at 60% fan speed
may possibly not be providing much cooling, as the chilled water valve could be anywhere from closed to 60%
open, based on the cooling required. Closed chilled water valves may not offer cooling, but they do offer
redundancy.
Return air temperature of the CRAH unit. The return air temperature on the CRAH units was tracked throughout
the study. Monitoring return air temperature played an important role in determining the optimal placement of
perforated floor tiles as well as the placement of remote temperature sensors. To keep the CRAH units
operating at maximum efficiency, the return air temperature should be as high as possible.
Remote temperature sensors. Monitoring remote temperature sensors allowed the team to identify areas
where inlet temperature was increasing or decreasing more than average, as well as identify locations where
sensors may not have been optimally placed. If a remote sensor temperature reading was increasing more so
than others near it, the placement of the sensor was modified based on chilled water valve percentage, fan
speed, and the sensor locations of the adjacent CRAH units. Temperatures were recorded every 30 minutes.
Overall max, min, mode, and average were reviewed after each efficiency improvement.
Chiller detail. The following information was recorded every 30 minutes from the chillers: outside air
temperature, outside air humidity, chiller kilowatts, chilled water setpoints, chilled water T (difference
between chilled water supply and return temperatures), building tonnage, chilled water flow rate, and the
system‟s differential pressure. For this analysis, outside air temperature, electrical power consumption, and
PAGE 19
2011 The Green Grid. All rights reserved. No part of this publication may be used, reproduced, photocopied,
transmitted, or stored in any retrieval system of any nature without the written permission of the copyright
owner.
chilled water temperatures were the key factors used in the PUE normalization analysis, which will be
discussed later in the paper.
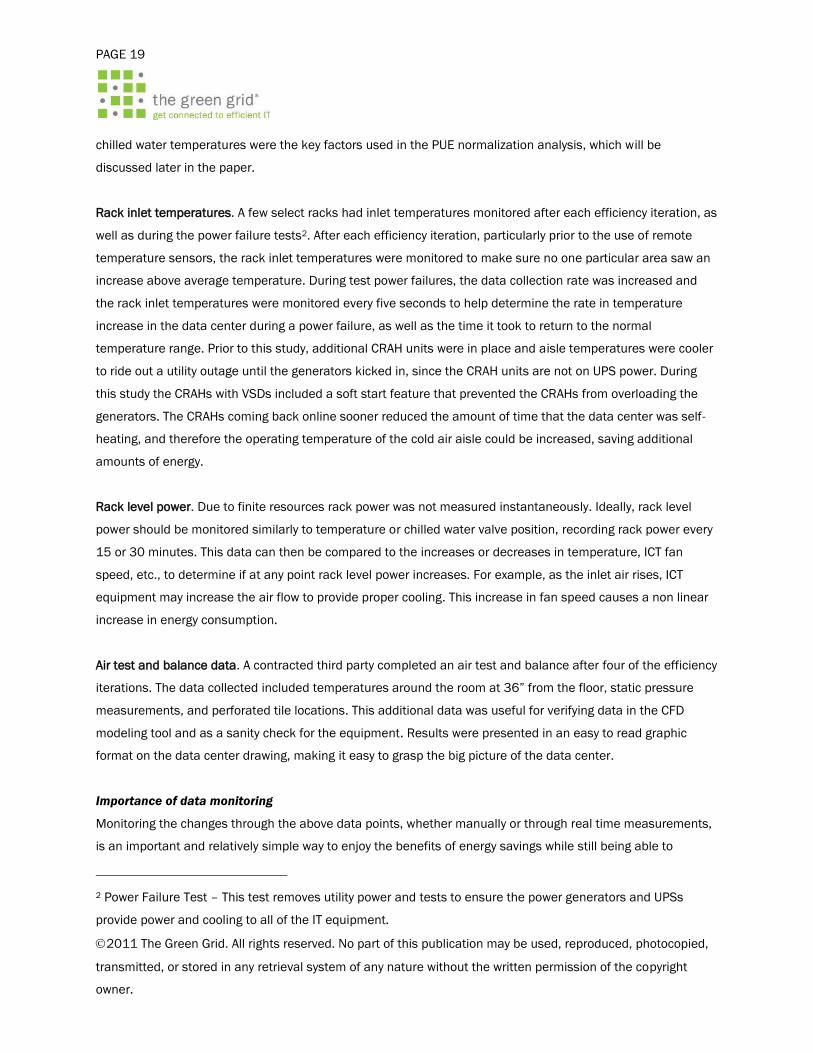
Rack inlet temperatures. A few select racks had inlet temperatures monitored after each efficiency iteration, as
well as during the power failure tests2. After each efficiency iteration, particularly prior to the use of remote
temperature sensors, the rack inlet temperatures were monitored to make sure no one particular area saw an
increase above average temperature. During test power failures, the data collection rate was increased and
the rack inlet temperatures were monitored every five seconds to help determine the rate in temperature
increase in the data center during a power failure, as well as the time it took to return to the normal
temperature range. Prior to this study, additional CRAH units were in place and aisle temperatures were cooler
to ride out a utility outage until the generators kicked in, since the CRAH units are not on UPS power. During
this study the CRAHs with VSDs included a soft start feature that prevented the CRAHs from overloading the
generators. The CRAHs coming back online sooner reduced the amount of time that the data center was self-
heating, and therefore the operating temperature of the cold air aisle could be increased, saving additional
amounts of energy.
Rack level power. Due to finite resources rack power was not measured instantaneously. Ideally, rack level
power should be monitored similarly to temperature or chilled water valve position, recording rack power every
15 or 30 minutes. This data can then be compared to the increases or decreases in temperature, ICT fan
speed, etc., to determine if at any point rack level power increases. For example, as the inlet air rises, ICT
equipment may increase the air flow to provide proper cooling. This increase in fan speed causes a non linear
increase in energy consumption.
Air test and balance data. A contracted third party completed an air test and balance after four of the efficiency
iterations. The data collected included temperatures around the room at 36” from the floor, static pressure
measurements, and perforated tile locations. This additional data was useful for verifying data in the CFD
modeling tool and as a sanity check for the equipment. Results were presented in an easy to read graphic
format on the data center drawing, making it easy to grasp the big picture of the data center.
Importance of data monitoring
Monitoring the changes through the above data points, whether manually or through real time measurements,
is an important and relatively simple way to enjoy the benefits of energy savings while still being able to
2 Power Failure Test – This test removes utility power and tests to ensure the power generators and UPSs
provide power and cooling to all of the IT equipment.

PAGE 20
2011 The Green Grid. All rights reserved. No part of this publication may be used, reproduced, photocopied,
transmitted, or stored in any retrieval system of any nature without the written permission of the copyright
owner.
monitor the room for major changes and mitigate any risk that may be perceived with energy efficiency
upgrades. Monitoring data while slowly making incremental changes and allowing time for the room to adapt
makes it easy to characterize the room. Additionally, having field practitioners who are experienced with the ICT
and mechanical infrastructure (such as vendors or contractors) monitor problematic areas can be a very useful
resource. A close working relationship with these teams is recommended.
ICT inlet temperature. ASHRAE3 guidelines are a good starting point for discussing how high ICT inlet
temperatures can be raised. The ASHRAE guidelines may not be conservative enough for all situations or
business cases. Pick a temperature within the guidelines that all parties are comfortable with. Monitor the
previously described problematic data points while increasing temperature. Work to make sure the inlet
temperatures stay similar across the data center, monitoring and adjusting other parameters (such as location
on the remote sensors, or floor tiles, etc.) to keep them consistent.
CRAH return air temperature. Increasing the change in temperature (ΔT) across the coils of a CRAH unit
improves its efficiency, so an increase in return air temperature is a good data point to monitor. Allowing
relatively cool air to return to the CRAH is very inefficient, as energy is being expended to move the air (high
energy cost) in the data center without any benefit. Problems can be identified when monitoring return air
temperature - significant increases in temperature in one location, which is not occurring in other locations,
may identify an area that needs further analysis. Similarly, when all other return temperatures are changing,
but one area stays the same, further work should be done to determine if the unit is operating at its full
potential. CRAH units running at 100% air flow (fan speed) with cool air returning to the unit and/or CRAH units
running with a water valve setting at zero or near zero is typically an inefficient process.4
3 http://www.ashrae.org/
4 Users may want some amount of redundancy to account for a failure in a CRAH unit so a perfectly optimized
room may not be available. There is a constant tradeoff between efficiency and redundancy.

PAGE 21
2011 The Green Grid. All rights reserved. No part of this publication may be used, reproduced, photocopied,
transmitted, or stored in any retrieval system of any nature without the written permission of the copyright
owner.
IV. Efficiency Improvements Implemented
After each improvement was completed, an analysis of the data center was made to ensure proper operation
and projected energy savings were obtained. If they were not obtained, the „why not‟ was studied. The following
are the key improvements that will be discussed further in this study:
1) Install OEM VSDs in all CRAHs to save energy if the airflow demand is less than 100%.
2) Upgrade older CRAH units with newer more efficient models for the same reasons as above.
3) Improve rack airflow management by adding baffles and blanking panels which improve isolation of
hot and cold air aisles.
4) Reposition the CRAH temperature/humidity sensor from the inlet of the CRAH to the front of the IT
equipment rack (not including network/communications racks).
5) Adjust the temperature setpoints of the CRAH remote air sensors and chiller plant leaving water
temperature (LWT).
1) INCORPORATION OF VARIABLE SPEED DRIVES (VSDS)
The first improvement plan within this study called for use of VSDs to closely match the required ICT airflow to
that supplied by the CRAH. When the data center cooling equipment has excess cooling capacity, the CRAH fan
speed may be reduced so that cooling supply meets ICT cooling demand, ultimately providing energy savings
by reducing fan motor speed. Given the high static pressures under the floor during the original baseline study
it seemed reasonable that many CRAH units would run less than 100% after VSD installation and energy would
indeed be saved.
For the study, all CRAH units were retrofitted with OEM VSD fans capable of ramping from 60% operational
RPM to 100% RPM. Early in this study, control of the CRAHs was based upon the ICT load return temperature
and humidity. This was changed to ICT supply temperature later in the study. To investigate the energy savings
resulting from upgrading to VSDs, a study was completed to determine how varying fan speed would provide
energy savings. The following fan affinity laws provide a guideline to the savings opportunity.
(Eq. 1)
(Eq. 2)
(Eq. 3)

PAGE 22
2011 The Green Grid. All rights reserved. No part of this publication may be used, reproduced, photocopied,
transmitted, or stored in any retrieval system of any nature without the written permission of the copyright
owner.
where:
CFM = cubic feet per minute
RPM = revolutions per minute
P = static pressure
HP = horsepower
It can be seen from Eq. 1 that the relation between CFM and RPM is linear, while Eq. 3 shows that the
relationship between RPM and power is exponential. Thus, as CFM requirements increase for the same cooling
equipment, the cooling fans are becoming much less efficient. For example, doubling the CFM output of the
cooling unit (i.e. doubling the fan speed) requires eight times the original fan power.
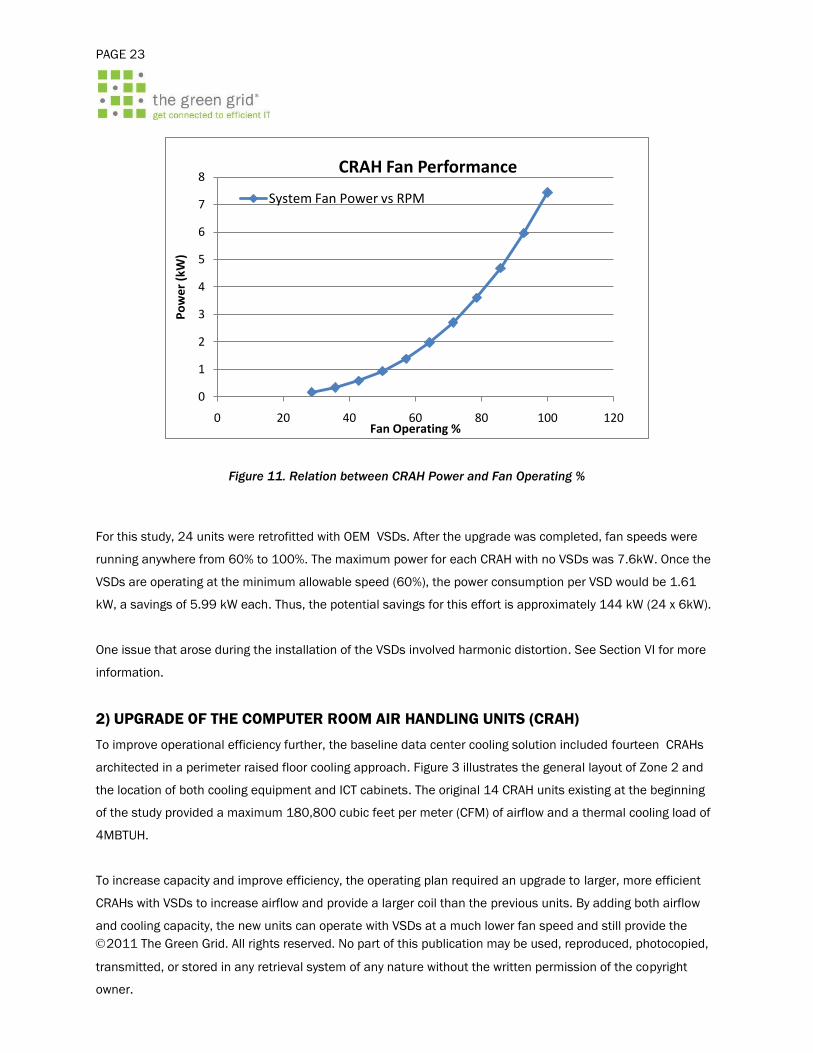
To further demonstrate this phenomenon, Figure 10 and Figure 11 illustrate the relationship between power,
CFM and fan speed for the upgraded CRAH‟s per the OEM specifications. Results for other manufactured
equipment may vary.
Figure 10. Relationship between airflow (CFM) and Fan Operating %
0
2000
4000
6000
8000
10000
12000
14000
16000
18000
0 20 40 60 80 100 120
CFM
Fan Operating %
CRAH Fan PerformanceSystem CFM vs RPM
PAGE 23
2011 The Green Grid. All rights reserved. No part of this publication may be used, reproduced, photocopied,
transmitted, or stored in any retrieval system of any nature without the written permission of the copyright
owner.
Figure 11. Relation between CRAH Power and Fan Operating %
For this study, 24 units were retrofitted with OEM VSDs. After the upgrade was completed, fan speeds were
running anywhere from 60% to 100%. The maximum power for each CRAH with no VSDs was 7.6kW. Once the
VSDs are operating at the minimum allowable speed (60%), the power consumption per VSD would be 1.61
kW, a savings of 5.99 kW each. Thus, the potential savings for this effort is approximately 144 kW (24 x 6kW).
One issue that arose during the installation of the VSDs involved harmonic distortion. See Section VI for more
information.
2) UPGRADE OF THE COMPUTER ROOM AIR HANDLING UNITS (CRAH)
To improve operational efficiency further, the baseline data center cooling solution included fourteen CRAHs
architected in a perimeter raised floor cooling approach. Figure 3 illustrates the general layout of Zone 2 and
the location of both cooling equipment and ICT cabinets. The original 14 CRAH units existing at the beginning
of the study provided a maximum 180,800 cubic feet per meter (CFM) of airflow and a thermal cooling load of
4MBTUH.
To increase capacity and improve efficiency, the operating plan required an upgrade to larger, more efficient
CRAHs with VSDs to increase airflow and provide a larger coil than the previous units. By adding both airflow
and cooling capacity, the new units can operate with VSDs at a much lower fan speed and still provide the
0
1
2
3
4
5
6
7
8
0 20 40 60 80 100 120
Po
we
r (k
W)
Fan Operating %
CRAH Fan Performance
System Fan Power vs RPM

PAGE 24
2011 The Green Grid. All rights reserved. No part of this publication may be used, reproduced, photocopied,
transmitted, or stored in any retrieval system of any nature without the written permission of the copyright
owner.
same cooling load as the previous units. By making use of VSD CRAH units, data center operators can have
excess airflow capacity without wasting energy when that capacity is not needed.
The phenomenon described in the previous section with the nonlinear curve of fan operation vs. power
demonstrates that the most energy efficient arrangement is to run multiple cooling units at lower fan speed,
instead of running fewer units at high speed. To determine the capabilities of the new units fan speed was
adjusted to deliver the same CFM capabilities as the previous system.
Table 1. CFM and power performance of Upgraded CRAH
3 Fans, 30-Ton CRAH Unit
RPM CFM Power (kW) Percentage
1400 17100 7.44 100
1300 15879 5.96 92.9
1200 14657 4.69 85.7
1100 13436 3.61 78.6
1000 12214 2.71 71.4
900 10993 1.98 64.3
800 9771 1.39 57.1
To place this further in perspective, at peak loads, the original 14 CRAHs were projected to provide a total of
180,800 CFM with a total power of 86kW. To support the same load of 180,800 CFM a user might employ 11
30-ton CRAHs running at 100%, or the 14 30-ton CRAHs could provide the same airflow amount at an
individual fan speed of about 75%, see Table 2.
PAGE 25
2011 The Green Grid. All rights reserved. No part of this publication may be used, reproduced, photocopied,
transmitted, or stored in any retrieval system of any nature without the written permission of the copyright
owner.
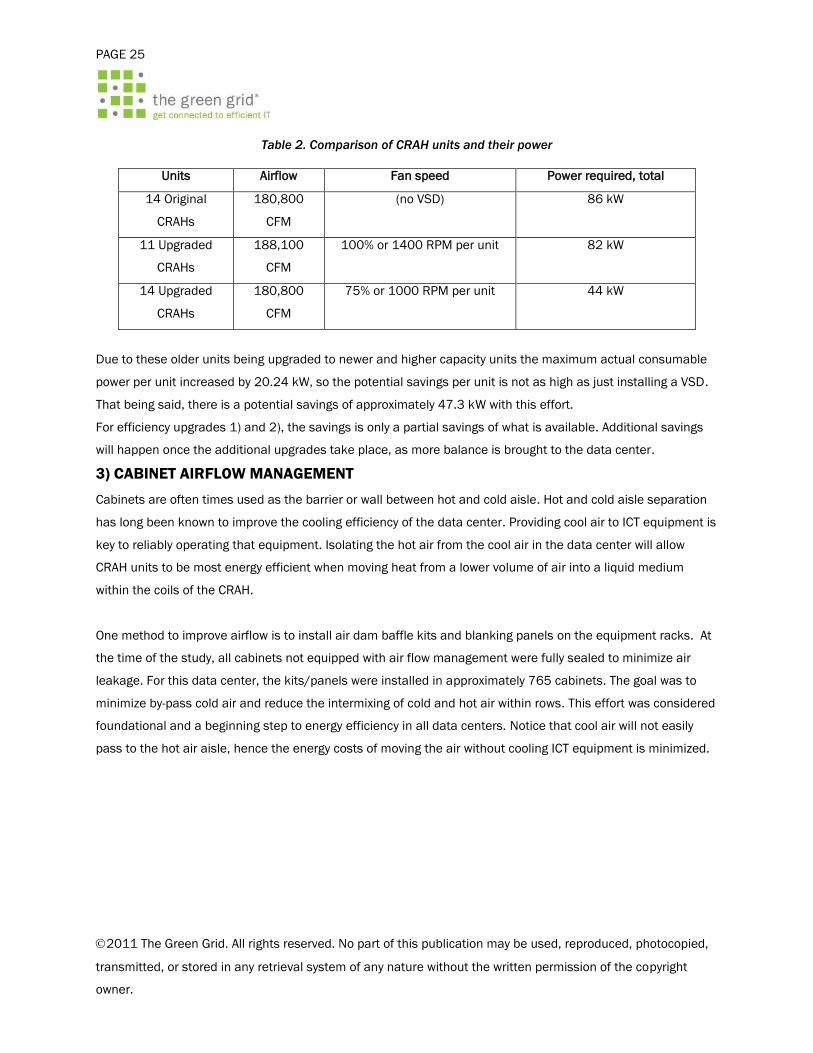
Table 2. Comparison of CRAH units and their power
Units Airflow Fan speed Power required, total
14 Original
CRAHs
180,800
CFM
(no VSD) 86 kW
11 Upgraded
CRAHs
188,100
CFM
100% or 1400 RPM per unit 82 kW
14 Upgraded
CRAHs
180,800
CFM
75% or 1000 RPM per unit 44 kW
Due to these older units being upgraded to newer and higher capacity units the maximum actual consumable
power per unit increased by 20.24 kW, so the potential savings per unit is not as high as just installing a VSD.
That being said, there is a potential savings of approximately 47.3 kW with this effort.
For efficiency upgrades 1) and 2), the savings is only a partial savings of what is available. Additional savings
will happen once the additional upgrades take place, as more balance is brought to the data center.
3) CABINET AIRFLOW MANAGEMENT
Cabinets are often times used as the barrier or wall between hot and cold aisle. Hot and cold aisle separation
has long been known to improve the cooling efficiency of the data center. Providing cool air to ICT equipment is
key to reliably operating that equipment. Isolating the hot air from the cool air in the data center will allow
CRAH units to be most energy efficient when moving heat from a lower volume of air into a liquid medium
within the coils of the CRAH.
One method to improve airflow is to install air dam baffle kits and blanking panels on the equipment racks. At
the time of the study, all cabinets not equipped with air flow management were fully sealed to minimize air
leakage. For this data center, the kits/panels were installed in approximately 765 cabinets. The goal was to
minimize by-pass cold air and reduce the intermixing of cold and hot air within rows. This effort was considered
foundational and a beginning step to energy efficiency in all data centers. Notice that cool air will not easily
pass to the hot air aisle, hence the energy costs of moving the air without cooling ICT equipment is minimized.

PAGE 26
2011 The Green Grid. All rights reserved. No part of this publication may be used, reproduced, photocopied,
transmitted, or stored in any retrieval system of any nature without the written permission of the copyright
owner.
Figure 10. Air Dam Baffle Kit on the front side of empty rack
Once a barrier is in place between the hot and cold aisles, the user will see hotter return temperatures without
a similar rise in ICT inlet air temperatures. As mentioned earlier, hotter return air across the coils of a CRAH
Figure 11: Rack with baffles (arrow on left) and blanking panels (arrow on right) installed

PAGE 27
2011 The Green Grid. All rights reserved. No part of this publication may be used, reproduced, photocopied,
transmitted, or stored in any retrieval system of any nature without the written permission of the copyright
owner.
unit leads to more efficient removal of heat from the data center. In addition, less air needs to be moved
because you are ideally moving only air that has been heated by ICT equipment. The reduction in CFM will
show up as CRAH units spin down to move less air.
One observation when installing baffles and blanking panels - the vendor packed each panel and baffle kit
individually, producing waste and requiring that a portion of the installation time was used to unpack and
discard packing materials. Vendors might want to consider how to reduce this cost. Blanking panels selected
had to be installable on multiple types of rack rail types (round hole, square hole, threaded hole), so as to not
require various panel configurations in inventory. In addition, the baffles had to have the ability to be installed
on a live cabinet. No other alternative was considered.
The efficiency improvement for blanking panels should show an increase in return air temperature back to the
CRAH units. The actual measured temperatures did not show the expected improvement in return air
temperatures on their own. However, the blanking panels and baffles are a structural change to the data
center that must be completed to see improvements, but cannot be measured until the space as a whole is
balanced.
4) REPLACE CRAH TEMP/HUMIDITY SENSOR WITH REMOTE SENSOR
The next upgrade to the data center was to change the way the cooling equipment was wired for monitoring
and control. All ICT equipment providers specify an environmental condition for equipment intake; for example,
32°F to 95°F intake temperature and 5% to 90% non-condensing relative humidity. Historically, facility cooling
solutions have utilized a return temperature/humidity sensor to control the cooling unit. This is controlling the
temperature at the point of origin at the CRAH unit, which gives a level of convenience, but gives a loss of
accuracy, and hence efficiency. It is more accurate and efficient to control where the air is actually being used.
In this data center, it is at the rack level.
The challenge with this upgrade is in how the ICT equipment operates. Its design can significantly change the
external return temperature. This is because each piece of ICT equipment demands a different CFM based
upon its internal vendor specific design decisions. For example, if 21 2U servers were running at 10kW of ICT
load, and the design CFM consumption was 1000 CFM, the temperature rise through the equipment would be
31°F. For the exact same 10kW load, if a secondary server design required 1300CFM, the temperature rise
through the equipment would be 24°F. For the same ICT equipment power, there are very different exhaust
temperatures. Additionally, because the dry bulb temperature is different between the two solutions, the return
relative humidity would be different as well, adding to the control complexity.

PAGE 28
2011 The Green Grid. All rights reserved. No part of this publication may be used, reproduced, photocopied,
transmitted, or stored in any retrieval system of any nature without the written permission of the copyright
owner.
This disconnect between supply temperature limit and return control generates inefficiencies between control
settings and the CRAH, which has driven most operators to overcool the data center. If not carefully evaluated,
this can also lead to unstable operating conditions where one CRAH is dehumidifying while a secondary unit is
humidifying. To overcome this limit, and to conform to the equipment manufacturer‟s suggested installation,
the sensor was relocated to the supply side of the ICT equipment. The expected energy improvements are
dependent on how accurately the sensor can determine the proper supply temperature to meet the ICT
equipment specification.
Achieving a balanced thermal load in the data center space
VSDs were installed on the air handlers knowing that there was excess cooling capacity in the space. VSDs
would allow the operator to „buy back‟ this excess capacity to save it for when it‟s needed, all the while saving
energy.
After installing the VSDs and relocating the sensors to their areas of influence, it became apparent that the
room was in an imbalanced state. Seven out of 12 CRAH units in Zone 2 were still running at 100% capacity
and five out of 12 CRAH units were running at less than 10% capacity. This resulted in only five out of 12 units
seeing a reduction in fan speed to the factory default minimum fan speed of 60% rpm. Although the reduction
in fan speed for five units resulted in an annualized savings of 280,000 kW-hr, the desired savings were twice
this amount or more. Attention was focused on the remaining seven units still running at capacity.
A review of the room indicated two things were occurring:
1) There was excess cooling capacity at the west end of the room, and many of the units there were
not adequately engaged in cooling the room as a whole.
2) There were CRAH units located next to each other where one unit was at maximum cooling while
the other was at minimum cooling. It appeared that the unit running 100% might be affecting its
neighbor‟s „zone of influence‟ enabling the neighbor to run at near zero capacity. This was a
challenge because the goal was to have all units running at a lower capacity to gain optimal
energy savings.
The solution was to add perforated floor tiles to the space, particularly at the east end of the room. The
operator had traditionally run at static pressures of >0.20” inches of water, and the addition of perforated tiles
was not a concern. The result of adding more perforated tiles was an overall migration of cold air from west-to-
east under the floor and a migration of warm air east-to-west in the overhead return air stream.

PAGE 29
2011 The Green Grid. All rights reserved. No part of this publication may be used, reproduced, photocopied,
transmitted, or stored in any retrieval system of any nature without the written permission of the copyright
owner.
The process of adding tiles and the associated re-equilibrating of CRAH zones of influence resulted in a much
more balanced load with remarkable effects:
Prior to the change, the average chilled water valve position was 62% and the average fan
setting was 83%.
Seven units running near 100% chilled water / 100% fan
Five units running near 0% chilled water / 60% fan
After the change, the average chilled water valve position dropped to 37% and the average
fan setting was 63%.
Two units running near 100% chilled water / 100% fan
Ten units running from 5%-60% chilled water / 60% fan
An increase from five units to ten units running at 60% fan speed doubles the energy
savings from 280,000 kW-hr to 560,000 kW-hr per year
The space now ran at an average cooling capacity of 37% of the total available. Fan speeds will not increase
unless the capacity exceeds 60% of the total available. As a secondary effect of the above improvement, the
operator has the opportunity to adjust the chilled water temperature by as much as 4°F without affecting the
fan speed. This allows for significant future savings in the chiller plant that remain to be explored. Additionally,
there is still opportunity for additional rebalancing of heat load between CRAH units that may lead to further
savings.
5) ADJUST TEMPERATURE SET POINTS ON CRAHS AND CHILLERS
Raising the inlet air temperature to ICT equipment saves energy because the chilled water temperature into
the data center is increased. This in turn allows the chiller plant to run more efficiently because the
temperature of the water does not have to be reduced as much. Hence, the final task of the upgrade plan was
to elevate the CRAH supply air temperature and the chilled water temperature to minimize energy
consumption. All of the previous mentioned upgrades had now made it possible to increase both the supply air
temperature and chilled water temperature while still maintaining the ASHRAE maximum recommended intake
temperature of 80.6°F.
The approach to increasing both supply temperatures was a methodical approach that focused on maintaining
data center stability while evaluating each step in increasing energy efficiency. The changes within the data
center were executed to the following schedule, all in 2010:
Monday 8/30 9:45 a.m. Increase the chiller plant setpoint 2°F from 44°F to 46°F

PAGE 30
2011 The Green Grid. All rights reserved. No part of this publication may be used, reproduced, photocopied,
transmitted, or stored in any retrieval system of any nature without the written permission of the copyright
owner.
Thursday 9/2 8:45 a.m. Increase CRAH remote temperature setpoints 1°F from 68°F to 69°F
Monday 9/13 Optimize locations of CRAH remote sensors
Tuesday 9/14 8:00 a.m. Increase CRAH remote temperature setpoints 1°F from 69°F to 70°F
Monday 9/27 11:30 a.m. Increase CRAH remote temperature setpoints 1°F from 70°F to 71°F
Thursday 10/5 – 10/7 Increase quantity and optimize locations of perforated tiles
As a data center operator, it is important to consider the process of how to increase the supply temperatures of
the data center. A recommended first step to understand which equipment has the highest potential energy
savings is to evaluate the coefficient of performance (COP) of each piece of equipment (chiller plant, pumps,
and CRAH‟s). The COP for refrigeration equipment is defined as the thermal energy removed, divided by the
work into the device.
Figure 14 illustrates the COP of the test case chiller plant as a function of temperature difference from external
air temperature to chilled water temperature. You can see from the figure that as the temperature delta
decreases, the COP increases. For example, if the chilled LWT from the chiller plant was 44°F and the external
ambient temperature was 94°F, the COP of the chiller plant would be 2.8kW/kW, as compared to the case
when the LWT was 46°F the COP would be 2.94kW/kW. A 2°F increase would provide a substantial energy
savings of 5% from one of the largest consumers of energy in the data center.
Figure 124. Chiller Plant Coefficient of Performance (COP)

PAGE 31
2011 The Green Grid. All rights reserved. No part of this publication may be used, reproduced, photocopied,
transmitted, or stored in any retrieval system of any nature without the written permission of the copyright
owner.
Figure 124 also illustrates how sensitive the chiller plant is to external ambient temperature. A 20°F change in
external temperature can change energy consumption by up to 50%. Often, when using PUE as an efficiency
metric, changes in the external temperature coincident with other changes in the data center might lead the
operator to the wrong conclusion from an energy savings perspective.
The chiller plant is only one portion of the cooling network. The other portion includes both the CRAHs and the
system pumps. An investigation of the CRAHs used in this study illustrate that at 80°F dry bulb, 67°F wet bulb,
the maximum sensible cooling capacity of the CRAH is 119.3kW (119/3.5 = 34 tons of cooling), while the
power consumption of the CRAH due to the fan is close to 7.6kW. At this return air condition, the COP of the
CRAH is 15.7kW/kW (119/7.57). From an energy efficiency point of view, operating a data center in such a
way that the data center can tolerate higher temperature water into the CRAH units saves large amounts of
energy because the chillers are typically running more efficiently.
Similarly, for a 50% loading condition (54kW - approximately half of the 119.3kW), the fan power consumed
would be 1.39kW, providing a COP of 39 kW/kW (54/1.39). As you can see, if the CFM consumption and
thermal loading is less than the unit‟s maximum capacity, significant energy savings can be obtained. Running
the CRAH units at lower fans speeds is key to saving energy in a data center.
From this study it was determined that a risk averse, tiered approach would be taken to increase the
temperature setpoints. The LWT setpoint was increased by 2°F, and then the supply air temperature was
increased until the worst case intake temperature reached 80.6°F, ultimately this was a 3°F setpoint
increase. To determine the impacts of raising the LWT and the supply air temperature, the entire data center
power profile was measured before improvements and after improvements, as shown below in Figure 15.
Figure 135. Daily external service utility power
PAGE 32
2011 The Green Grid. All rights reserved. No part of this publication may be used, reproduced, photocopied,
transmitted, or stored in any retrieval system of any nature without the written permission of the copyright
owner.
The first key piece of information observed from the data was that the power consumption profile changes
throughout the day. It was observed that highest power consumption was occurring at the peak temperature of
the day. This is understandable given the external climate of the data center.
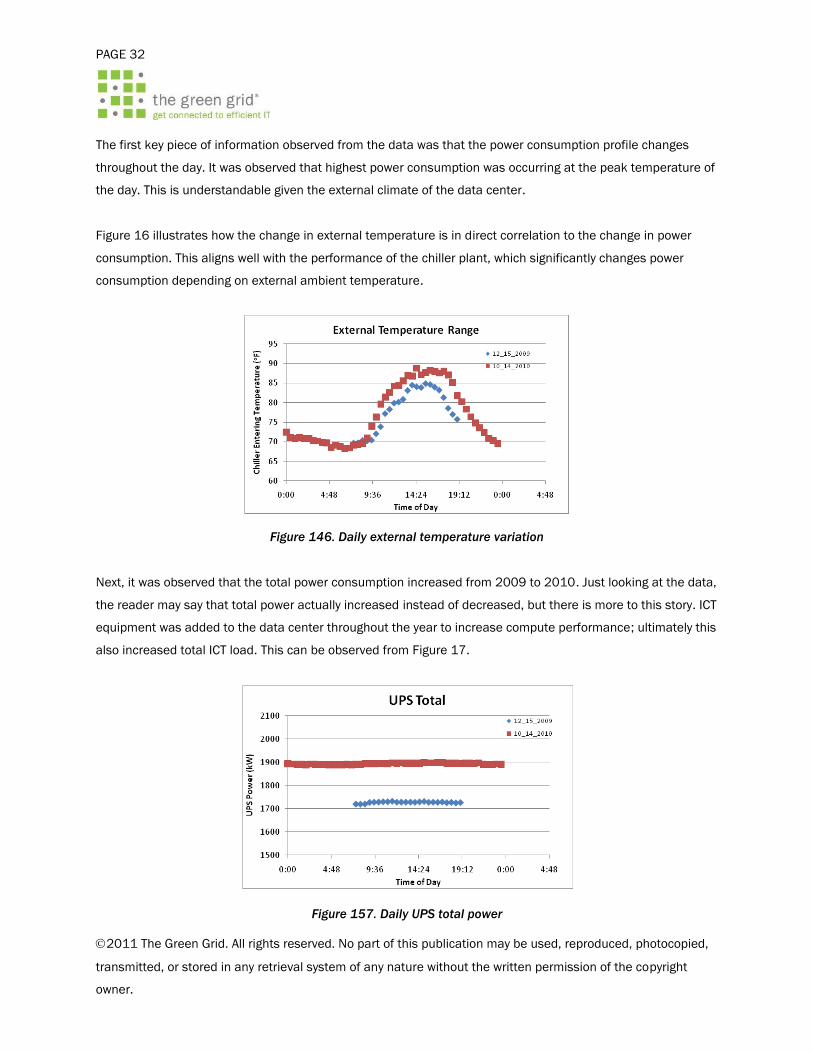
Figure 16 illustrates how the change in external temperature is in direct correlation to the change in power
consumption. This aligns well with the performance of the chiller plant, which significantly changes power
consumption depending on external ambient temperature.
Figure 146. Daily external temperature variation
Next, it was observed that the total power consumption increased from 2009 to 2010. Just looking at the data,
the reader may say that total power actually increased instead of decreased, but there is more to this story. ICT
equipment was added to the data center throughout the year to increase compute performance; ultimately this
also increased total ICT load. This can be observed from Figure 17.
Figure 157. Daily UPS total power

PAGE 33
2011 The Green Grid. All rights reserved. No part of this publication may be used, reproduced, photocopied,
transmitted, or stored in any retrieval system of any nature without the written permission of the copyright
owner.
ICT power consumption (measured at the UPS load) was 1720kW in 2009 compared to 1900kW in 2010, a
total ICT power increase of over 180kW. You can see that if the ICT load was normalized (a difference of
180kW from 2009 to 2010) at an assumed 2009 data center PUE of 1.7 for the original data center, an
additional 306kW of load would need to be added to the 2009 data in Figure 15Error! Reference source not
found.. For example, at the peak loading, at 1600 hours, the total utility power for 2009 would increase from
3050kW to a normalized value of 3356kW, compared to the 2010 figure of 3145kW.
Removing the effects of outside temperature
As mentioned earlier, energy consumption (as well as PUE) changes as fast as the weather, which can confuse
or muddle the results of energy efficiency activity in the data center. The following contains an attempt to show
how normalizing the effects of the outside temperatures can allow operators to continue to accurately account
for the changes in energy efficiency in the data center.
A key piece of information is the external temperature difference between the two test days. As shown in Figure
14, the COP chart of the chiller plant, a 2°F change in temperature difference between the chilled water
temperature and the external ambient temperature can generate up to a 5% change in total chiller plant power
consumption. To understand how much of the total power consumption is due to external ambient
temperature, the power consumption of the chiller plant due to the difference in temperature between the two
test days needs to be correlated and normalized so an accurate comparison can be made. This difference per
hour can be seen in Figure 18. It is seen from the data that the maximum hourly temperature difference was
as high as 8°F and as low as -1°F.
Figure 18. Difference in external temperature: Oct 14 2010 compared to Dec 15 2009

PAGE 34
2011 The Green Grid. All rights reserved. No part of this publication may be used, reproduced, photocopied,
transmitted, or stored in any retrieval system of any nature without the written permission of the copyright
owner.
Ultimately this difference in external temperature between the two days generated an additional 49kW of
power consumption in 2010. This was solely due to the external ambient temperature being higher on 10-14-
2010 than on 12-15-2009, at the beginning and end of this study. To fairly compare the operational
efficiencies of the two days, this should be normalized so that the data compares data center performance
without variation between external ambient temperatures. From the analysis it was found that PUE was
ultimately the best way to capture the various improvements in energy efficiency.
Error! Reference source not found.Figure 1519 illustrates the PUE per hour of the day before the efficiency
improvements on 12-15-2009, and after the efficiency improvements on 10-14-2010. The first interesting fact
from the data was that the change in PUE correlated well to the external temperature data from Figure 18. This
was directly related to the increasing power consumption of the chiller plant throughout the daily temperature
change.
Next, it was noted that the raw PUE data before adjusting for ambient was on average 1.63, for a sample from
the peak 14:00 to 16:00 hours, and the original data center, before improvements, had an average PUE for
the same time frame of 1.76. When the PUE was adjusted for the hourly change in external temperature
difference between the two days, the average PUE on 10-14-2010 was reduced to 1.6. Figure 19 illustrates
the PUE per hour on 12-15-2009, the day before the efficiency improvements, and again on 10-14-2010, after
the improvements had been made. PUE is also shown on 10-14-2010 after being adjusted for the effects of
ambient temperatures.

PAGE 35
2011 The Green Grid. All rights reserved. No part of this publication may be used, reproduced, photocopied,
transmitted, or stored in any retrieval system of any nature without the written permission of the copyright
owner.
1.600
1.650
1.700
1.750
1.800
1.850
1.900
22-Jan 16-Feb 13-Mar 7-Apr 2-May 27-May 21-Jun 16-Jul 10-Aug 4-Sep 29-Sep 24-Oct
Date
PU
E
PUE
Estimated Adjusted PUE
VFD Install
Line Reactor Install
Final VFD Install
Upgrade CRAH
Add CRAH capacity
Add baffles and panels
Add Remove CRAH Sensors
Increase chiller setpoint
Increase CRAH setpoints
and adjust perforated panels
Figure 19. PUE comparison, including adjusted PUE; 15 Dec 2009 to 14 Oct 2010
Ultimately, the overall improvement to the data center from all the changes was 9.1% of total power
consumption. This is a significant savings in total power consumed and avoided. Using the final PUE value, an
evaluation can be made of what would have happened without the improvements to the data center. Without
improvements, total power consumption per hour on average would have been 3.3MW. With the improvements
this was reduced to near 3MW.
SUMMARY OF UPGRADE ENERGY SAVINGS MEASURED
Figure 160 shows the variation of PUE by upgrade. The blue line is the measured PUE. External temperature
variations overwhelm the energy efficiency improvements. A means to remove the variation of temperature
was needed. The pink line represents the normalized PUE that removes the outside air temperature variable
and allows for the reader to immediately obtain the PUE improvement for each phase of the study.
Figure 160. Overall PUE change by each upgrade

PAGE 36
2011 The Green Grid. All rights reserved. No part of this publication may be used, reproduced, photocopied,
transmitted, or stored in any retrieval system of any nature without the written permission of the copyright
owner.
UPS Load and Outside Air Temperature
1760
1770
1780
1790
1800
1810
1820
1830
1840
1850
1860
1870
1880
3/1
/2010
3/8
/2010
3/1
5/2
010
3/2
2/2
010
3/2
9/2
010
4/5
/2010
4/1
2/2
010
4/1
9/2
010
4/2
6/2
010
5/3
/2010
5/1
0/2
010
5/1
7/2
010
5/2
4/2
010
5/3
1/2
010
6/7
/2010
6/1
4/2
010
6/2
1/2
010
6/2
8/2
010
7/5
/2010
7/1
2/2
010
7/1
9/2
010
7/2
6/2
010
8/2
/2010
8/9
/2010
8/1
6/2
010
8/2
3/2
010
8/3
0/2
010
9/6
/2010
9/1
3/2
010
9/2
0/2
010
9/2
7/2
010
Date
UP
S L
oad
(kW
)
0
20
40
60
80
100
120
Te
mp
era
ture
(F
)
UPS maximum load
Temperature at 2pm
Figure 171 shows how the data center increased IT loads (UPS) and how temperature changed over time
during the study. Both affected PUE. The external temperature increased the PUE because more energy is
consumed by the chillers. However, the normalized PUE was decreasing, even though the IT load was
increasing.
Figure 171. UPS load and outside air temperature

PAGE 37
2011 The Green Grid. All rights reserved. No part of this publication may be used, reproduced, photocopied,
transmitted, or stored in any retrieval system of any nature without the written permission of the copyright
owner.
V. Return on Investment
As stated in the previous section, the overall energy savings was 300 kW for all of the efforts combined. In one
year‟s time, that equates to over $300,000 in savings at current energy rates. Table 3 shows a spreadsheet
detailing the savings of each effort. It must be stated that had the efforts been performed in a different order,
the returns would have been different per effort.
Table 3: Spreadsheet showing savings by upgrade
Green Grid Operations Case study Simple ROICapital ExpendituresDescription List Price Per Unit Unit Quantity Total Price Comments
VSD 6000 VSD 24 144,000$ 3.5K to 6K depending on size and including installation
CRAH* 6000 CRAH 14 84,000$ 3.5K to 6K depending on size and including installation
Airflow Management Baffle 175 Cabinet 765 133,875$ Individual list price / bulk order can save
Airflow Management Panels ** 150 Cabinet 765 114,750$ Different materials could be less
Remote THS 525 THS 47 24,675$ List price and includes installation
Perfed Tiles 150 Tile 30 4,500$ List price for a pallet of 30
505,800$
* CRAH upgrades were justified based on equipment end-of life; only incremental VSD costs utilized as energy efficiency improvement
** Quantity will vary per operator by average RU utilized per cabinet. Less costly options have since been discovered.
Savings
Description Savings in kW
kW Hrs
Savings per
Year
Total Savings
per Year***
Payback
Period in
months Comments
VSD Installation 110 963,600 $108,887 16
CRAH Upgrade (VSD) 22 192,720 $21,777 46 Larger motor sizes increased max power consumption by 20 kW overall
Set Point Changes/Airflow Management/Remote
Sensors 115 1007400 $ 113,836 29 Reflective of combined activities below in framed area
Airflow Management 11 96,360 $10,889 274
Deceiving; this effort was foundational & allowed comfort for the temperature set
point changes and CRAH sensor relocations
Move CRAH THS to remote 2 17,520 $1,980 150 Savings not realized until after final rebalance
Temperature Set Point Changes Chiller Plant 102 893,520 $100,968 0 Savings not realized until after final rebalance at end of study
Temperature Set Point Changes CRAH 0 0 $0 0 This set point change was achievable after prior two activities were performed
Rebalance Improvements **** 53 464,280 $52,464 1
This effort realized the remaining potential in CRAH and/or Chiller plant fan and pump
speeds
415 410,800$
*** using a blended rate including demand
**** not considered an improvement but a normal ongoing activity
Simple PaybackReturn on Investment per year 410,800$
Investment 505,800$
Payback 15 months
Operational/Labor Expenditures (not included in ROI figures)Description Man-hours Per Unit Unit Quantity Total Man-hoursCraft type
Thermocouple Installation 1 sensor 20 20 Mechanical/HVAC
Thermocouple Reporting 0.125 month 6 0.75 Mechanical/HVAC
THS Installation 2.25 CRAC 44 99 Mechanical/HVAC
Chiller Reporting 30 month 6 180 Mechanical/HVAC
VFD Installation 10 VFD 27 270 Mechanical/HVAC
VFD Installation 10 VFD 27 270 Electrician
CRAC Installation 50 CRAC 14 700 Electrician
T&B Data Collection and Report 50 T&B 4 200 Mechanical/HVAC
Airflow Management Installation 0.5 Cabinet 765 382.5 General Labor
Report Generation/Distribution 2 Month 6 12 Professional
Analysis 80 Professional
Analysis (Harmonics) 160 Professional
Project (Admin/PAR) 160 Management
Project (Admin/purchase) 20 Professional
2,554

PAGE 38
2011 The Green Grid. All rights reserved. No part of this publication may be used, reproduced, photocopied,
transmitted, or stored in any retrieval system of any nature without the written permission of the copyright
owner.
VI. Issues, lessons learned, and future work
VSDS AND HARMONICS
Variable speed drives are one of many electrical devices that introduce harmonic distortion that can cause
complications with other electrical systems. These complications and their causes and effects are outside the
scope of this paper. However, the requirements are detailed in industry specification IEEE 519. An over-
simplified interpretation of these requirements is that the percent of electrical harmonic distortion outside the
four walls of a facility should be limited to no more than 5%, so as to not 'pollute' a neighbor's power. VSDs and
other harmonics-producing devices can produce much more than 5%. However, the distortion is diluted by
other electrical loads that do not introduce harmonics.
During the process of retrofitting older units with VSDs, it was identified that the total harmonics of the facility
exceeded the 5% threshold. It was acknowledged that there were many harmonics-introducing devices creating
the total distortion. However, it was determined to be the VSDs on the air handling units that incrementally
exceeded the threshold.
The corrective action to reduce the total harmonics back below the threshold was to install OEM line reactors
electrically upstream of each VSD. These were 3% inductance line reactors that typically reduce harmonics by
half. The resulting harmonics from any given device was not brought below the 5% level. However, the
composite distortion level for the site was successfully reduced below the 5% level after the line reactors were
installed. This is an excellent example of why efficiency retrofits should be done in conjunction with the OEM.
The OEM is uniquely postured to respond to technical issues such as this.
CRAH REFRESH
Controls associated with the newer CRAH units are much more complicated than the older units, and not
intuitive. Working with the OEM is key to optimizing the efficiency of the units and their control.
Communications with the data center monitoring equipment was critical and required installation of
communication interface modules to obtain all available monitoring information from the units.
RIDE THROUGH TIME
An important issue that arose during discussions with the end user during the analysis involved ride through
time. While out of the scope of this paper, a risk assessment of energy efficiency (such as having higher inlet
temperatures) versus using lower temperatures for better ride through of power outages is suggested.

PAGE 39
2011 The Green Grid. All rights reserved. No part of this publication may be used, reproduced, photocopied,
transmitted, or stored in any retrieval system of any nature without the written permission of the copyright
owner.
VII. Summary and Conclusion
This case study reviewed the effects on PUE and ROI of five types of energy efficiency initiatives in the data
center - installing OEM VSDs, upgrading CRAH units, implementing rack airflow management, moving the CRAH
control from the return air temperature to the rack inlet, and increasing the temperature setpoints of the CRAH
and chiller units.
Total implementation time for this study was about eight months - from mid-February through mid-October of
2010. This included time for installation, equilibration, data collection and review at each iteration, allowing
both The Green Grid team and data center operators time for verifying the stability of the data center. Total
man hours of work time for the installations, data collection and review, etc. was just under 160 hours.
While each improvement had some effect on the efficiency of the data center, the clear winner was the final
improvement - increasing the CRAH and chiller setpoints (which had no financial outlay). However, those
changes could not have been comfortably made without completing the other improvements. Additionally,
none of these changes were possible without a system for measuring and controlling the changes. A well
thought-out monitoring and control plan is essential to managing changes such as these. The set point
changes allowed the realization of potential savings due to the other improvements, such as the installation of
VSDs which reduced fan speeds. Overall, the data center is operating with more capacity and flexibility than
previously.
Similarly, each efficiency improvement affects the overall return on investment. The next highest ROI for the
project was the VSD installations, due to the highest energy savings, a high financial return, and a quick
payback period (16 months).
The effect of each efficiency improvement ROI at the time the improvement was made was a function of the
order of the improvements. While certain changes had a small effect when they were made, they may have had
a larger effect if performed in a different order, albeit the end result would be the same.
In conclusion, the implemented energy efficiency solutions provided some kind of savings, were all relevantly
low risk to the data center‟s reliability, and did not bring up many unforeseen issues that caused problems or
downtime.

PAGE 40
2011 The Green Grid. All rights reserved. No part of this publication may be used, reproduced, photocopied,
transmitted, or stored in any retrieval system of any nature without the written permission of the copyright
owner.
Like many similar projects, there remain opportunities for further efficiency improvements. The PUE gains
documented herein should not be considered as “final”. Ongoing investigation into the following areas will
continue to yield worthwhile results:
Teamwork of CRAH units to further balance the thermal load
Raising chilled water temperature to optimize the efficiency of the chiller plant
Further reduction of CRAH fan speeds to reduce energy consumption
Airflow containment to increase return air temperatures to the CRAH units

PAGE 41
2011 The Green Grid. All rights reserved. No part of this publication may be used, reproduced, photocopied,
transmitted, or stored in any retrieval system of any nature without the written permission of the copyright
owner.
VIII. References
ASHRAE 90427, Datacom Equipment Power Trends and Cooling Applications (2005)
https://eweb.ashrae.org/eweb/DynamicPage.aspx?Site=ASHRAE&WebKey=69c74d61-facd-4ca4-ad83-
8063ea2de20a&listwhere=(prd_etab_ext%20LIKE%20'%25datacom%25').
The Green Grid, Quantitative Analysis of Power Distribution Configurations for Data Centers (2008)
http://www.thegreengrid.org/en/Global/Content/white-papers/Quantitative-Efficiency-Analysis.
The Green Grid, Green Grid Data Center Power Efficiency Metrics: PUE and DCIE
http://thegreengrid.org/~/media/WhitePapers/White_Paper_6_PUE_and_DCiE_Eff_Metrics_30_December_2008.ashx?lang=en

PAGE 42
2011 The Green Grid. All rights reserved. No part of this publication may be used, reproduced, photocopied,
transmitted, or stored in any retrieval system of any nature without the written permission of the copyright
owner.
IX. About The Green Grid
The Green Grid is a global consortium of companies, government agencies and educational institutions
dedicated to advancing resource efficiency in data centers and business computing ecosystems. The Green
Grid does not endorse vendor-specific products or solutions, and instead seeks to provide industry-wide
recommendations on best practices, metrics and technologies that will improve overall data center resource
efficiencies. Membership is open to organizations interested in data center operational efficiency at the
Contributor, General or Associate member level. Additional information is available at www.thegreengrid.org.
www.thegreengrid.org.


