Download - CAMS GA Regional Performance

Copernicus Atmosphere Monitoring Service
CAMS General Assembly, Athens, 14-16 June 2016
Matthieu Plu (Météo-France) and colleagues from Météo-France, INERIS, KNMI, CNRS-LA and IUP-Bremen
How do regional products perform?

2
Plan
How are regional products evaluated?How do regional forecasts perform?How do regional analyses perform?How do regional re-analyses perform?Additional validation of regional products: columns and profiles

3
How are regional products evaluated?
MonitoringFiltering
Verificationof regional CAMS products(NRT forecasts, analyses,re-analyses)
Surface observations from EIONET- « Near-Real time » (NRT) dataflow- A posteriori validated dataflow Data assimilation
in regional models(NRT analyses,re-analyses)
OzoneNO2SO2CO
PM10PM2.5
4
How are regional products evaluated?
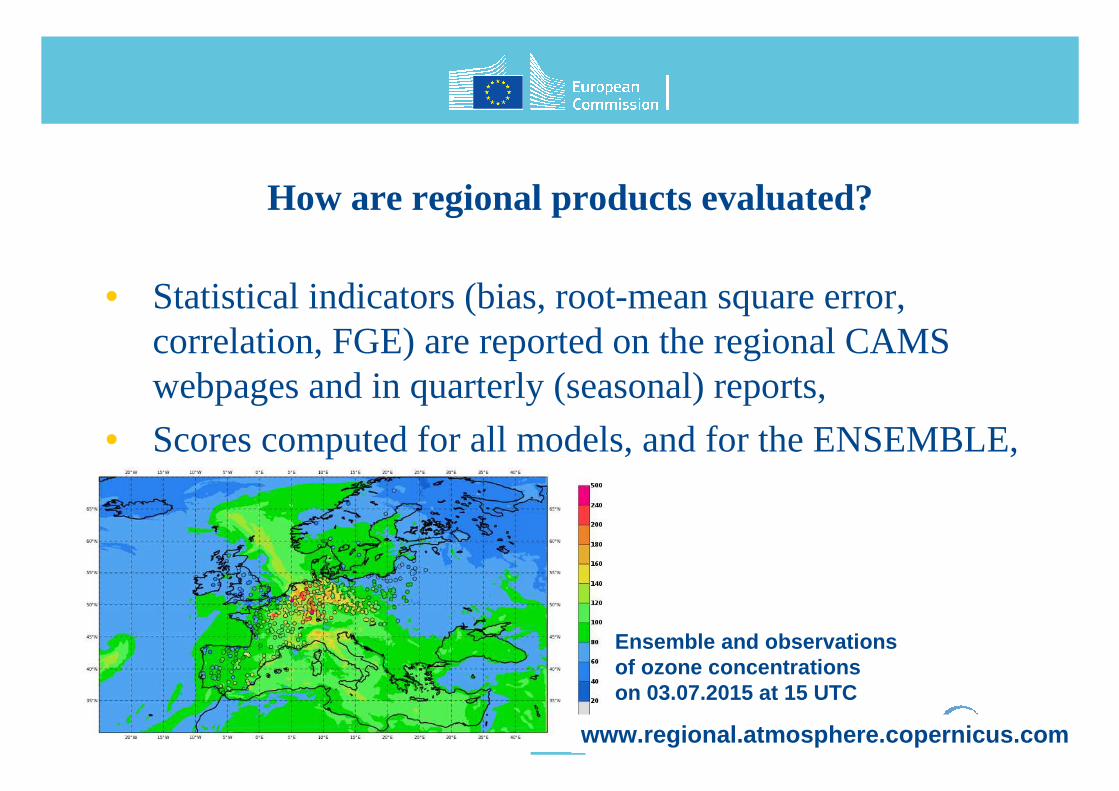
• Statistical indicators (bias, root-mean square error, correlation, FGE) are reported on the regional CAMS webpages and in quarterly (seasonal) reports,
• Scores computed for all models, and for the ENSEMBLE,
www.regional.atmosphere.copernicus.com
Ensemble and observationsof ozone concentrationson 03.07.2015 at 15 UTC
5
How do regional forecasts perform?
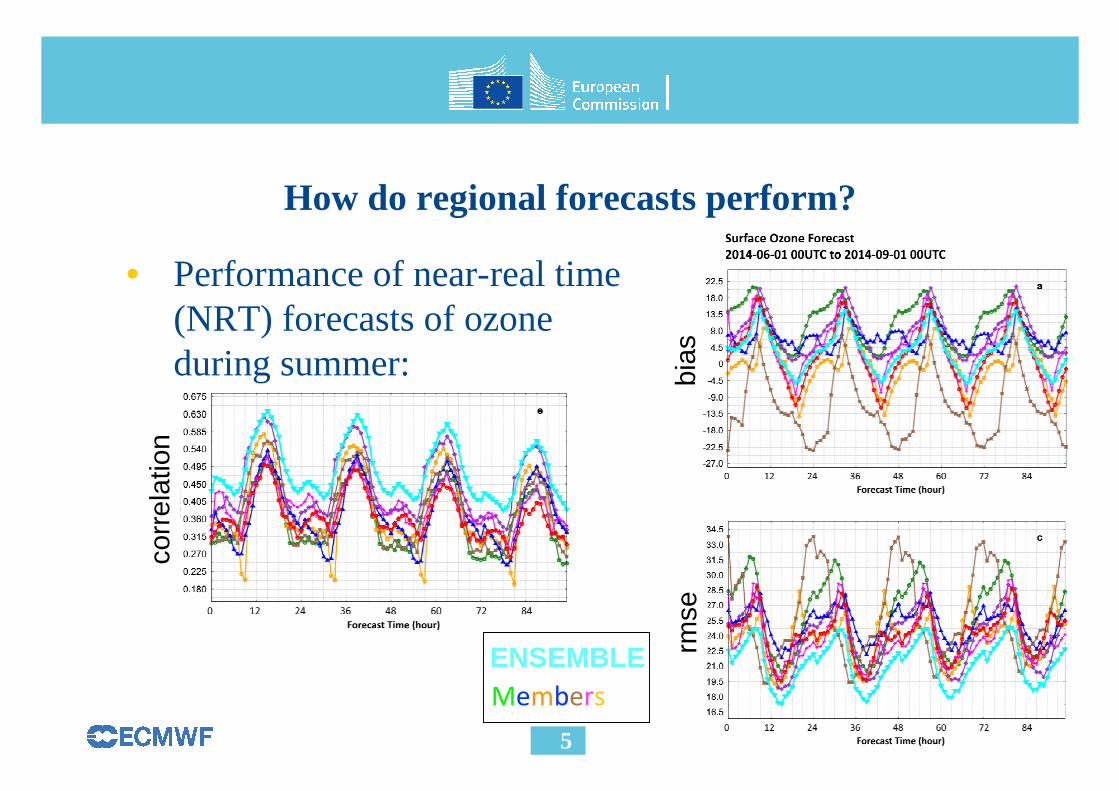
• Performance of near-real time (NRT) forecasts of ozone during summer:
ENSEMBLEbi
asrm
se
corr
elat
ion
Members

6
How do regional forecasts perform?
mod
ified
bia
s
rmse
corr
elat
ion
• Performance of NRT ensemble forecasts of PM10 during winter:
7
How do regional analyses perform?
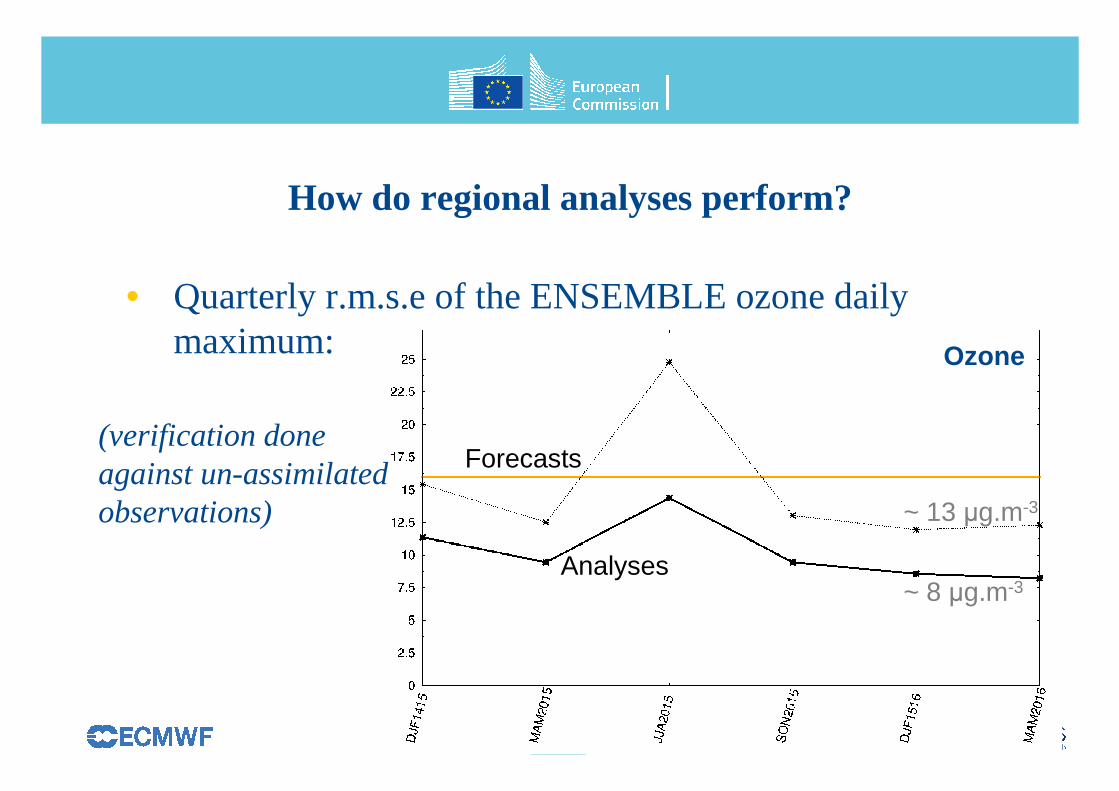
• Quarterly r.m.s.e of the ENSEMBLE ozone daily maximum: Ozone
Forecasts
~ 13 µg.m-3
Analyses~ 8 µg.m-3
(verification done against un-assimilated observations)
8
Plan
How are regional products evaluated?How do regional forecasts perform?How do regional analyses perform?How do regional re-analyses perform?Additional validation of regional products: columns and profiles

9
How do regional re-analyses perform?• ~2/3 observations for assimilation + ~1/3 observations for evaluation,• Evaluation of individual and Ensemble outputs is systematically performed with
statistical indicators (RMSE, bias, correlation) with European mapping over 3 categories of stations (rural, suburban and urban).
Ozone

10
How do regional re-analyses perform?• ~2/3 observations for assimilation + ~1/3 observations for evaluation,• Evaluation of individual and Ensemble outputs is systematically performed with
statistical indicators (RMSE, bias, correlation) with European mapping over 3 categories of stations (rural, suburban and urban).
PM10

11
How do regional re-analyses perform?
• Scores are also described over 5 main European sub-regions:• EUW (western), EUC (central), EUN (Northern), EUE
(Eastern), EUS (Southern)

12
How do regional re-analyses perform?
• Assessment of the ability to detect threshold (daily exceedances for ozone and PM10)

13
Plan
How are regional products evaluated?How do regional forecasts perform?How do regional analyses perform?How do regional re-analyses perform?Additional validation of regional products: columns and profiles

14
Additional validation of regional products: columns and profiles
Observations considered:IAGOS aircraft O3, COOzone sondesMAX-DOAS NO2 (SO2, HCHO, Aerosol)Lidar and Ceilometer aerosol profilesTotal AODHigh-altitude in-situ observations
Satellite NO2, CO, O3Comparisons between global & regional analyses
15
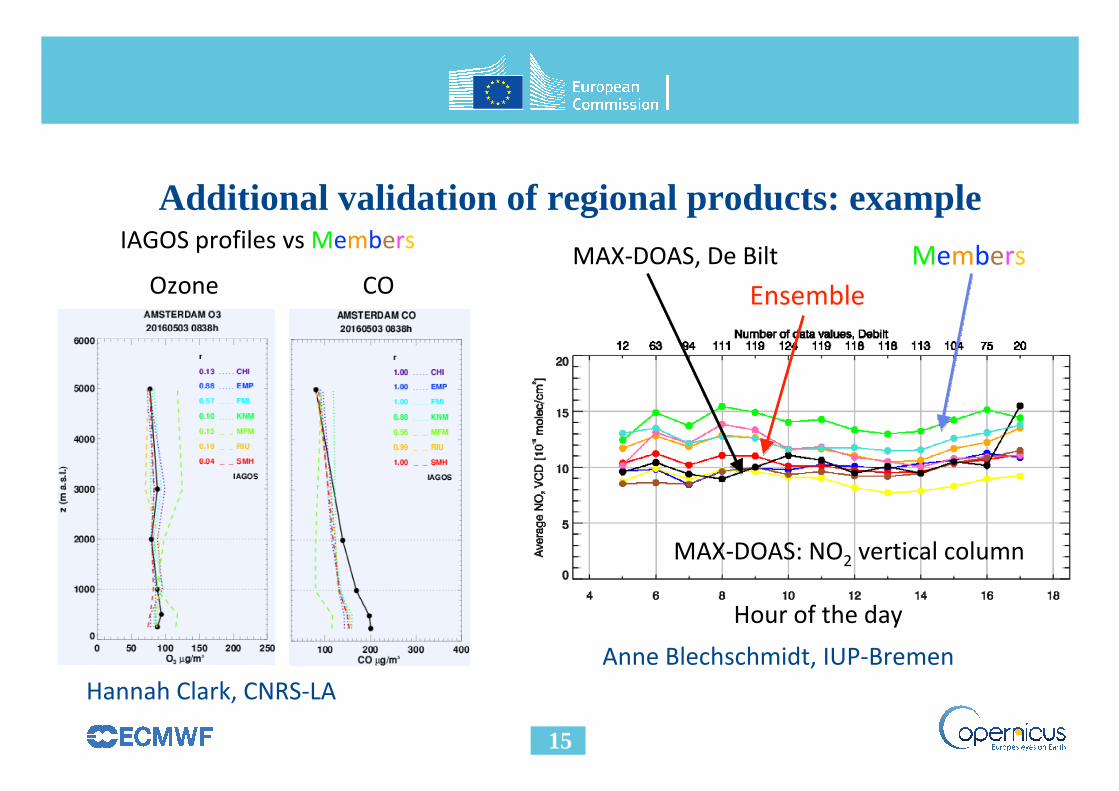
Additional validation of regional products: example
Anne Blechschmidt, IUP-Bremen
MAX-DOAS, De Bilt
MAX-DOAS: NO2 vertical column
Ensemble
Members
Hannah Clark, CNRS-LA
IAGOS profiles vs Members
Ozone CO
Hour of the day
16
Conclusion
• Validation of all regional products publicly available in reports and website: www.regional.atmosphere.copernicus.com
• New: validation of regional products above the surface,
• Evaluation is important for users,
• Evaluation is also important for the service providers to to identify shortcomings and improve their products.


