
5079478/Callington Link Options Assessment v2.doc
Option Assessment for Callington Road Link
Final Report
31st July 2009
Notice
This report was produced by Atkins Limited for Bristol City Council for the specific purpose of Option Assessment for Callington Road Link. This report may not be used by any person other than Bristol City Council without Bristol City Council's express permission. In any event, Atkins accepts no liability for any costs, liabilities or losses arising as a result of the use of or reliance upon the contents of this report by any person other than Bristol City Council.
Document History
JOB NUMBER: 5079478 DOCUMENT REF: Callington Link Options Assessment v2.doc
Revision Purpose Description Originated Checked Reviewed Authorised Date
1 Draft to client JC GB IW GB 3/07/09
2 Final Report JC GB IW TM 31/07/09
Final Report
5079478/Callington Link Options Assessment v2.doc 2
Contents Section Page
1. Introduction 4
Background 4
Study Objectives 4
Forecasting Approach 4
The Scheme Options 5
Scope of Report 5
2. Scheme Description 6
Introduction 6
Do-Minimum Option 6
Scheme Options 7
3. Results 12
Introduction 12
Transport Demand 12
Highway Model Outputs 15
Commentary on Highway Performance 33
Public Transport Performance 36
4. Economic Appraisal 41
Introduction 41
Scheme Costs 41
Risk Assessment and Optimism Bias 43
Transport Economic Efficiency (TEE) Results 44
Concluding thoughts 44
5. Conclusions and Recommendations 46
Conclusion 46
Recommendations 46
Final Report
5079478/Callington Link Options Assessment v2.doc 3
List of Tables
Table 2.1 – Summary of Callington Road Link Options 7
Table 3.1 - Network-Wide Morning Peak Mode Split 13
Table 3.2 - Network-Wide Inter-Peak Mode Split 13
Table 3.3 – Network-Wide Evening Peak Mode Split 13
Table 3.4 – Summary Statistics for the Highway Network in the AM Peak 16
Table 3.5 - Summary Statistics for the Highway Network in the Inter-Peak 17
Table 3.6 - Summary Statistics for the Highway Network in the PM Peak 18
Table 3.7 – Morning Peak Select Area Summary Statistics 19
Table 3.8 – Inter-Peak Select Area Summary Statistics 20
Table 3.9 – Evening Peak Select Area Summary Statistics 20
Table 3.10 – Screenline Flow Comparison AM Peak 22
Table 3.11 - Screenline Flow Comparison Inter-Peak 24
Table 3.12 - Screenline Flow Comparison PM Peak 26
Table 3.13 – Morning Peak Journey Time Data for All Vehicles (seconds) 31
Table 3.14 – Inter-Peak Journey Time Data for All Vehicles (seconds) 31
Table 3.15 – Evening Peak Journey Time Data for All Vehicles (seconds) 32
Table 3.16 – Morning Peak Bus Corridor Patronage 38
Table 3.17 – Inter-Peak Bus Corridor Patronage (pax/hr) 39
Table 3.18 – Evening Peak Bus Corridor Patronage (pax/hr) 40
Table 4.1 – Scheme Costs in 2009 Prices (£000) 41
Table 4.2 – Optimism Bias Uplift 44
Table 4.3 – Summary of Economic Assessment (£000) 45
List of Figures
Figure 1.1 – Callington Road Link Study Area 4
Figure 2.1 – Callington Road Link: Study Area 6
Figure 2.2 – Option A: Highway Dual Carriageway Scheme 8
Figure 2.3 – Option B1 Highway Scheme 9
Figure 2.4 – Option B2 Highway Scheme 9
Figure 2.5 – Option D Hybrid Scheme 10
Figure 2.6 – Option E Public Transport Scheme 11
Figure 3.1 – Standard Reporting Sector System 14
Figure 3.2 – Select Area Summary Statistics Cordon 19
Figure 3.3 – Location of Screenlines for Modelled Flow Analysis 21
Figure 3.4 – Journey Time Analysis Routes 30
Figure 3.5 – Location of Do-Minimum Delays 33
Figure 3.6 - Bus Patronage Corridors 36
Appendices
Appendix A - Sectored Demand 47
Appendix B - Traffic Flow Difference Plots 84
Appendix C - Risk Assessment 91
Appendix D - Optimism Bias 125
Appendix E - TEE Tables 129
Final Report
5079478/Callington Link Options Assessment v2.doc 4
1. Introduction
Background
1.1 Atkins have been commissioned by Bristol City Council, under the Greater Bristol Modelling
Framework (GBMF) contract (PON M/RE/TR/99338), to model and appraise five options for the
Callington Road Link that cover a range of highway and public transport interventions. The
outputs of the modelling and economic appraisal will be used by Bristol City Council (BCC) to
assess the five options and consider which, if any, they wish to take forward as part of a major
scheme business case (with or without modifications).
Study Objectives
1.2 The key objective of the Callington Road Link project is to reduce congestion on the A4 Bath
Road in the Brislington area. A shortlist of five alternative options was developed by BCC. The
five alternatives comprise two highway scheme options, one public transport option and two hybrid
options. Appraisal of these five options will assist definition of the ‘preferred’, ‘next best’ and ‘low
cost’ options but this commission is not required to identify what these may be.
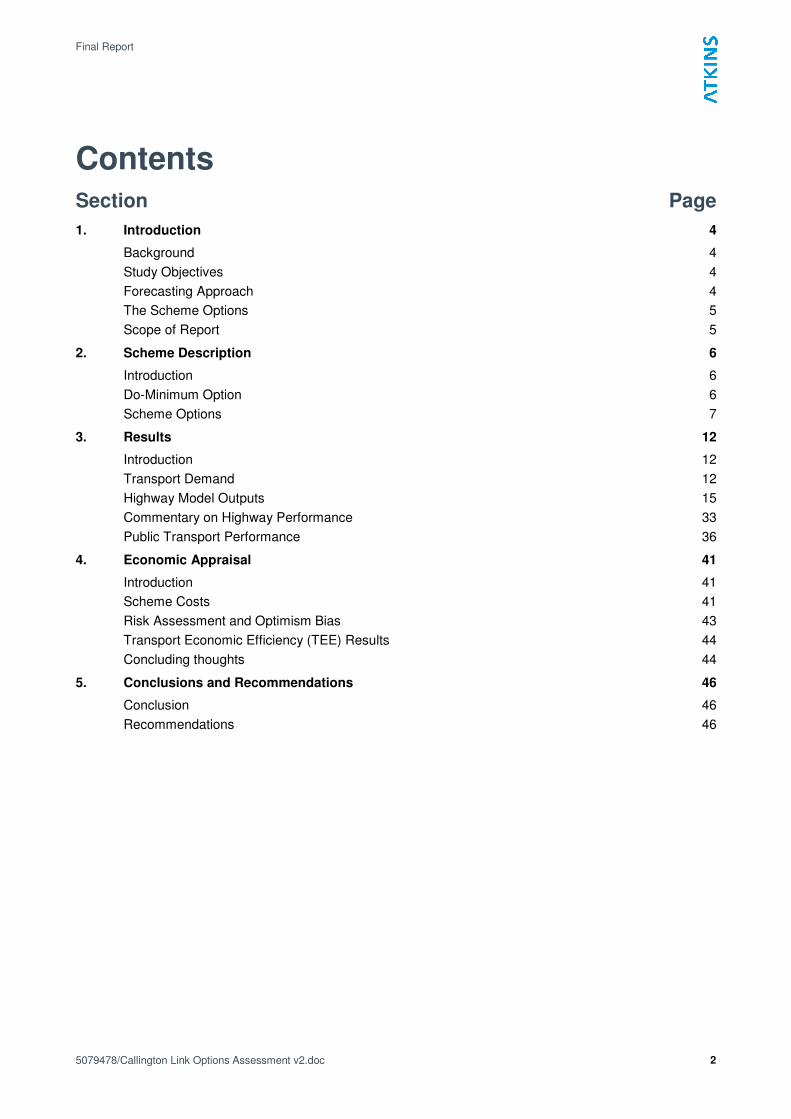
1.3 The study area is shown in Figure 1.1 and includes the A4 Bath Road and A37 Wells Road, with
Callington Road forming the southern boundary and St Philip’s Causeway to the north.
Figure 1.1 – Callington Road Link Study Area
A4 B
ath R
oad
A4 B
ath R
oad
A4 B
ath R
oad
A4 B
ath R
oad
A4 B
ath R
oad
A4 B
ath R
oad
A4 B
ath R
oad
A4 B
ath R
oad
A4 B
ath R
oad
A4 B
ath R
oad
A4 B
ath R
oad
A4 B
ath R
oad
A4 B
ath R
oad
A4 B
ath R
oad
A4 B
ath R
oad
A4 B
ath R
oad
A4 B
ath R
oad
A4 B
ath R
oad
A4 B
ath R
oad
A4 B
ath R
oad
A4 B
ath R
oad
A4 B
ath R
oad
A4 B
ath R
oad
A4 B
ath R
oad
A4 B
ath R
oad
Brislington Village
Bristol City
Centre
A4174 Callin
gton Road
A4174 Callin
gton Road
A4174 Callin
gton Road
A4174 Callin
gton Road
A4174 Callin
gton Road
A4174 Callin
gton Road
A4174 Callin
gton Road
A4174 Callin
gton Road
A4174 Callin
gton Road
A4174 Callin
gton Road
A4174 Callin
gton Road
A4174 Callin
gton Road
A4174 Callin
gton Road
A4174 Callin
gton Road
A4174 Callin
gton Road
A4174 Callin
gton Road
A4174 Callin
gton Road
A4174 Callin
gton Road
A4174 Callin
gton Road
A4174 Callin
gton Road
A4174 Callin
gton Road
A4174 Callin
gton Road
A4174 Callin
gton Road
A4174 Callin
gton Road
A4174 Callin
gton Road
A37 W
ells Road
A37 W
ells Road
A37 W
ells Road
A37 W
ells Road
A37 W
ells Road
A37 W
ells Road
A37 W
ells Road
A37 W
ells Road
A37 W
ells Road
A37 W
ells Road
A37 W
ells Road
A37 W
ells Road
A37 W
ells Road
A37 W
ells Road
A37 W
ells Road
A37 W
ells Road
A37 W
ells Road
A37 W
ells Road
A37 W
ells Road
A37 W
ells Road
A37 W
ells Road
A37 W
ells Road
A37 W
ells Road
A37 W
ells Road
A37 W
ells Road
A4320 St Philip'sA4320 St Philip'sA4320 St Philip'sA4320 St Philip'sA4320 St Philip'sA4320 St Philip'sA4320 St Philip'sA4320 St Philip'sA4320 St Philip'sA4320 St Philip'sA4320 St Philip'sA4320 St Philip'sA4320 St Philip'sA4320 St Philip'sA4320 St Philip'sA4320 St Philip'sA4320 St Philip'sA4320 St Philip'sA4320 St Philip'sA4320 St Philip'sA4320 St Philip'sA4320 St Philip'sA4320 St Philip'sA4320 St Philip'sA4320 St Philip's
CausewayCausewayCausewayCausewayCausewayCausewayCausewayCausewayCausewayCausewayCausewayCausewayCausewayCausewayCausewayCausewayCausewayCausewayCausewayCausewayCausewayCausewayCausewayCausewayCauseway
Callington Link Road: Study Area
Major Routes in Study Area
Proposed Callington Link Road
© Crown Copyright. All rights reserved.
Bristol City Council. 100023406. 2007.
Forecasting Approach
1.4 The G-BATS 3 modelling framework has been developed to represent a 2006 Base Year to which
the model has been calibrated and validated. In this instance the study utilises the 2031 forecast
year.
Final Report
5079478/Callington Link Options Assessment v2.doc 5
1.5 TEMPRO projections of population, employment and trip ends were used in the model to forecast
travel growth across the whole of the sub-region for the G-BATS3 Model, however in order to
more realistically reflect projected land use changes, travel demand growth has been distributed
throughout the area using more detailed local planning data supplied by the West of England
Partnership.
1.6 Details of this standard forecast can be found the in the Atkins G-BATS3 Forecasting Report.
The Scheme Options
1.7 This commission involved the coding, enhancing and testing of four main scheme options plus two
sub-options. The options focus upon the scale and use of Callington Road Link between
Callington Road and St Phillip’s Causeway. The options include:
• Option A – a full length dual carriageway link with access for all vehicles;
• Option B1 – a full length single carriageway link with access for all vehicles;
• Option B2 - a full length single carriageway link with access for all vehicles and a modified
Callington Road / Wells Road junction;
• Option D1 (bus) – a single carriageway link from Callington Road to Tramway Road junction
for all vehicles and bus only to St Phillip’s Causeway and a dedicated bus service using the
link from Brislington Park and Ride to Temple Meads;
• Option D2 (BRT) – a single carriageway link from Callington Road to Tramway Road junction
for all vehicles and bus only to St Phillip’s Causeway and a dedicated BRT service using the
link from Brislington Park and Ride to Temple Meads; and
• Option E - a full length single carriageway link with access for BRT only, with a dedicated
BRT service using the link from Brislington Park and Ride to Temple Meads and around the
city centre (following the BRT 2 loop).
1.8 Option C was dropped on the instruction of BCC and replaced by Option B2.
Scope of Report
1.9 This report compares shortlist of the alternative options for the Callington Road Link, comprising
two highway scheme options, one public transport option and two hybrid options as follows:
• Chapter Two describes the options;
• Chapter Three presents the impacts of each option; and
• Chapter Four provides conclusions about the work and makes recommendations about
further tests when next undertaken.
1.10 It is understood that funding for further work on the Callington Road Link means that there will be
a delay before that next phase of work and this report hopes to provide a full picture of work done
to date and thus enable a rapid restart at some point in the future.
Final Report
5079478/Callington Link Options Assessment v2.doc 6
2. Scheme Description
Introduction
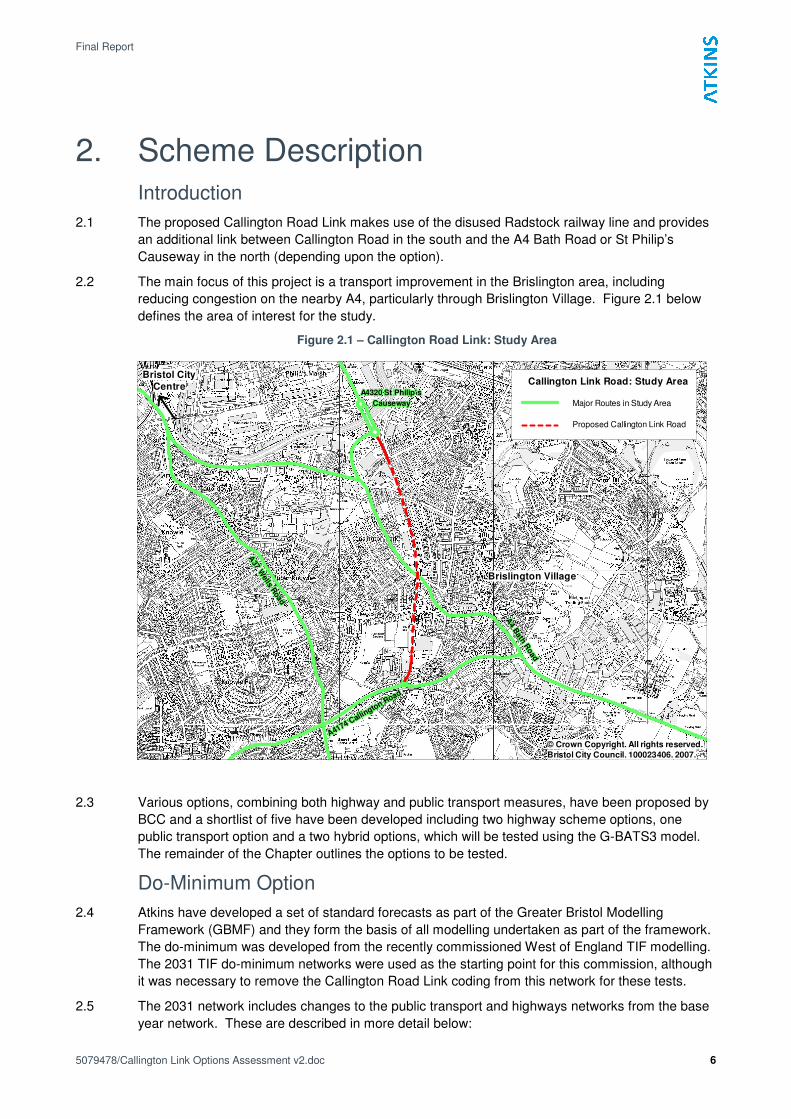
2.1 The proposed Callington Road Link makes use of the disused Radstock railway line and provides
an additional link between Callington Road in the south and the A4 Bath Road or St Philip’s
Causeway in the north (depending upon the option).
2.2 The main focus of this project is a transport improvement in the Brislington area, including
reducing congestion on the nearby A4, particularly through Brislington Village. Figure 2.1 below
defines the area of interest for the study.
Figure 2.1 – Callington Road Link: Study Area
A4 B
ath R
oad
A4 B
ath R
oad
A4 B
ath R
oad
A4 B
ath R
oad
A4 B
ath R
oad
A4 B
ath R
oad
A4 B
ath R
oad
A4 B
ath R
oad
A4 B
ath R
oad
A4 B
ath R
oad
A4 B
ath R
oad
A4 B
ath R
oad
A4 B
ath R
oad
A4 B
ath R
oad
A4 B
ath R
oad
A4 B
ath R
oad
A4 B
ath R
oad
A4 B
ath R
oad
A4 B
ath R
oad
A4 B
ath R
oad
A4 B
ath R
oad
A4 B
ath R
oad
A4 B
ath R
oad
A4 B
ath R
oad
A4 B
ath R
oad
Brislington Village
Bristol City
Centre
A4174 Callin
gton Road
A4174 Callin
gton Road
A4174 Callin
gton Road
A4174 Callin
gton Road
A4174 Callin
gton Road
A4174 Callin
gton Road
A4174 Callin
gton Road
A4174 Callin
gton Road
A4174 Callin
gton Road
A4174 Callin
gton Road
A4174 Callin
gton Road
A4174 Callin
gton Road
A4174 Callin
gton Road
A4174 Callin
gton Road
A4174 Callin
gton Road
A4174 Callin
gton Road
A4174 Callin
gton Road
A4174 Callin
gton Road
A4174 Callin
gton Road
A4174 Callin
gton Road
A4174 Callin
gton Road
A4174 Callin
gton Road
A4174 Callin
gton Road
A4174 Callin
gton Road
A4174 Callin
gton Road
A37 W
ells Road
A37 W
ells Road
A37 W
ells Road
A37 W
ells Road
A37 W
ells Road
A37 W
ells Road
A37 W
ells Road
A37 W
ells Road
A37 W
ells Road
A37 W
ells Road
A37 W
ells Road
A37 W
ells Road
A37 W
ells Road
A37 W
ells Road
A37 W
ells Road
A37 W
ells Road
A37 W
ells Road
A37 W
ells Road
A37 W
ells Road
A37 W
ells Road
A37 W
ells Road
A37 W
ells Road
A37 W
ells Road
A37 W
ells Road
A37 W
ells Road
A4320 St Philip'sA4320 St Philip'sA4320 St Philip'sA4320 St Philip'sA4320 St Philip'sA4320 St Philip'sA4320 St Philip'sA4320 St Philip'sA4320 St Philip'sA4320 St Philip'sA4320 St Philip'sA4320 St Philip'sA4320 St Philip'sA4320 St Philip'sA4320 St Philip'sA4320 St Philip'sA4320 St Philip'sA4320 St Philip'sA4320 St Philip'sA4320 St Philip'sA4320 St Philip'sA4320 St Philip'sA4320 St Philip'sA4320 St Philip'sA4320 St Philip's
CausewayCausewayCausewayCausewayCausewayCausewayCausewayCausewayCausewayCausewayCausewayCausewayCausewayCausewayCausewayCausewayCausewayCausewayCausewayCausewayCausewayCausewayCausewayCausewayCauseway
Callington Link Road: Study Area
Major Routes in Study Area
Proposed Callington Link Road
© Crown Copyright. All rights reserved.
Bristol City Council. 100023406. 2007.
2.3 Various options, combining both highway and public transport measures, have been proposed by
BCC and a shortlist of five have been developed including two highway scheme options, one
public transport option and a two hybrid options, which will be tested using the G-BATS3 model.
The remainder of the Chapter outlines the options to be tested.
Do-Minimum Option
2.4 Atkins have developed a set of standard forecasts as part of the Greater Bristol Modelling
Framework (GBMF) and they form the basis of all modelling undertaken as part of the framework.
The do-minimum was developed from the recently commissioned West of England TIF modelling.
The 2031 TIF do-minimum networks were used as the starting point for this commission, although
it was necessary to remove the Callington Road Link coding from this network for these tests.
2.5 The 2031 network includes changes to the public transport and highways networks from the base
year network. These are described in more detail below:
Final Report
5079478/Callington Link Options Assessment v2.doc 7
• public transport improvements:
- Greater Bristol Bus Network - 10 Showcase Bus Corridors plus new bus services in North
Fringe;
- Bristol to Avonmouth Rail - Increased frequency from hourly to every 40 minutes;
- Portishead to Bristol Rail Line;
- Ashton Vale Infrastructure – supporting bus services for the South West Urban Extension
Development;
- BRT Line 2 (Ashton Vale to City Centre); and
- BRT Line 3 (Hengrove to North Fringe).
• highway improvements:
- Cabot Circus – Completion of the new gyratory;
- Jacob’s Well Roundabout – signalisation;
- A38-Cribbs Causeway Distributor - New road as part of Filton Northfield development;
- Harry Stoke / A4174 - New junction and roads (including PT link) as part of Harry Stoke
development;
- SBLR Phase 1 & 2 - A38-A370 link road & A38 to Hengrove;
- Ashton Vale Infrastructure - supporting infrastructure for the South West Urban Extension
Development; and
- Barrow Gurney Bypass - Road linking A37 and A370.
Scheme Options
2.6 Bristol City Council has specified the options for testing as part of this commission. The options
include a range of highway only, public transport only and hybrid options. The options are
summarised in Table 2.1 and described in more detail below.
Table 2.1 – Summary of Callington Road Link Options
Option Highway Changes Public Transport Changes
Option A Dual carriageway link from Callington Road to St Phillip’s Causeway
Option B1 Single carriageway link from Callington Road to St Phillip’s Causeway
Option B2 Single carriageway link from Callington Road to St Phillip’s Causeway with improvements to Callington Road / Wells Road junction
Option D1 Single carriageway link from Callington Road to Bath Road
Bus from Brislington Park and Ride to Temple Meads
Option D2 Single carriageway link from Callington Road to Bath Road
BRT from Brislington Park and Ride to Temple Meads
Option E BRT from Brislington Park and Ride to Temple Meads and into the City Centre along BRT route
Final Report
5079478/Callington Link Options Assessment v2.doc 8
Option A: Highway – Dual Carriageway
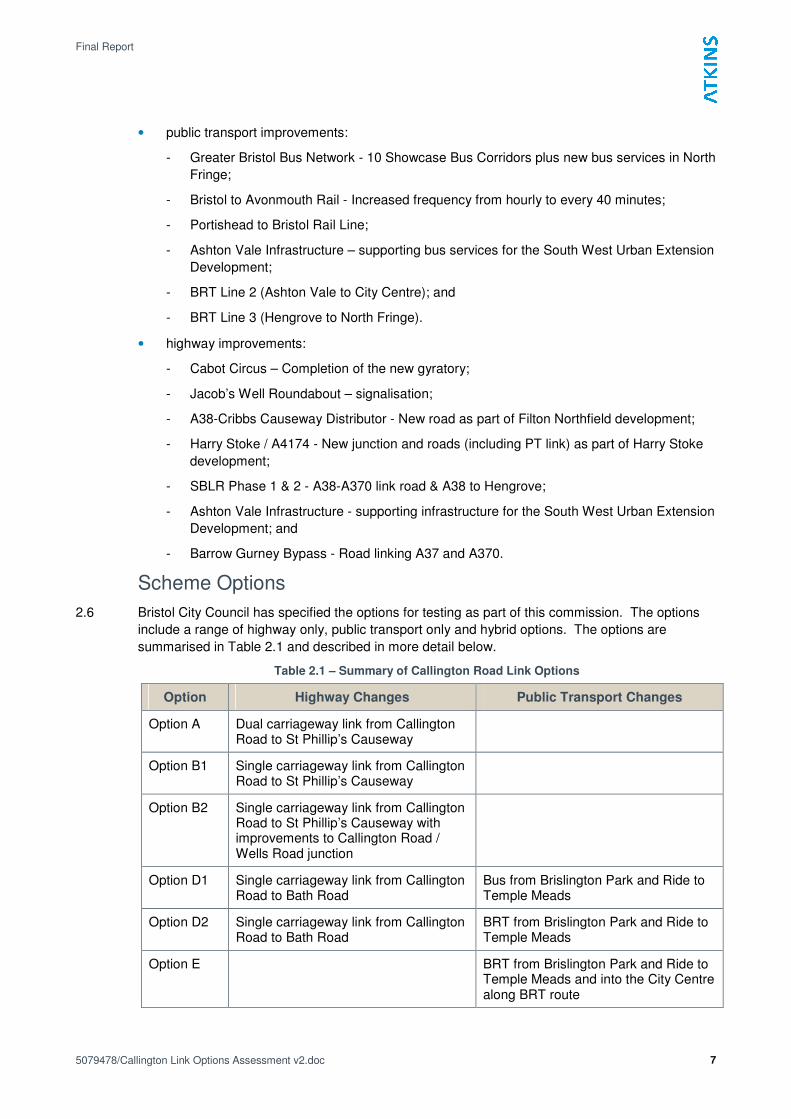
2.7 Option A (Figure 2.2) comprises a dual carriageway on the full length of the proposed link road,
with an intermediate junction attaching it to the A4 Bath Road via the Tramway Road junction.
This option also includes traffic calming at Brislington Village to encourage usage of the link road
as an alternative to the A4. In the model this is represented by a set of traffic signals in close
proximity to the Tramway Road Junction which acts to reduce capacity to the A4 Bath Road Link.
2.8 Other changes made to this option during the modelling phase included three lane approaches on
the Callington Road Link to the junctions to the north and south of the link to aid egress from the
link.
Figure 2.2 – Option A: Highway Dual Carriageway Scheme
A4A4A4A4A4A4A4A4A4A4A4A4A4A4A4A4A4A4A4A4A4A4A4A4A4
A3
7A
37
A37
A37
A37
A3
7A
37
A37
A37
A37
A3
7A
37
A37
A37
A3
7A
37
A37
A37
A37
A3
7A
37
A37
A37
A37
A37
A41
74
A41
74
A41
74
A41
74
A41
74
A41
74
A41
74
A41
74
A41
74
A41
74
A41
74
A41
74
A41
74
A41
74
A41
74
A41
74
A41
74
A41
74
A41
74
A41
74
A41
74
A41
74
A41
74
A41
74
A41
74
© Crown Copyright. All rights reserved.
Bristol City Council. 100023406. 2007.
Option A: Dual CarriagewayNorthern access via
St Philip's Causeway
Access to Sainsbury's andBloomfield Road altered
Intermediate junction withA4 at Tramway Road
New signalised junctions onexisting Station Road to allowaccess to Hospital and Tesco
Southern access viaCallington Road Junction
To Bristol
City Centre
Brislington
Village
Reduction in carriageway width to accomodateexisting bridge crossings. Alternatives include
new bridges, at grade junctions orsevering access on minor routes
Callington Link
Option B: Highway – Single Carriageway
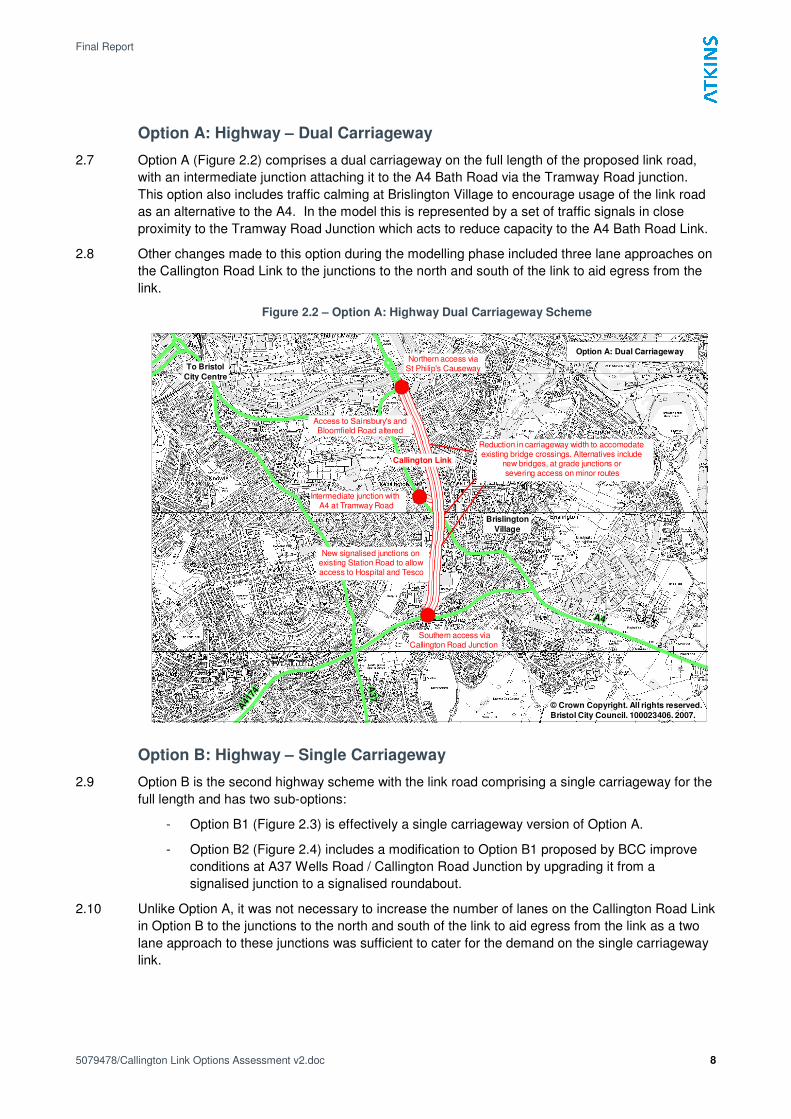
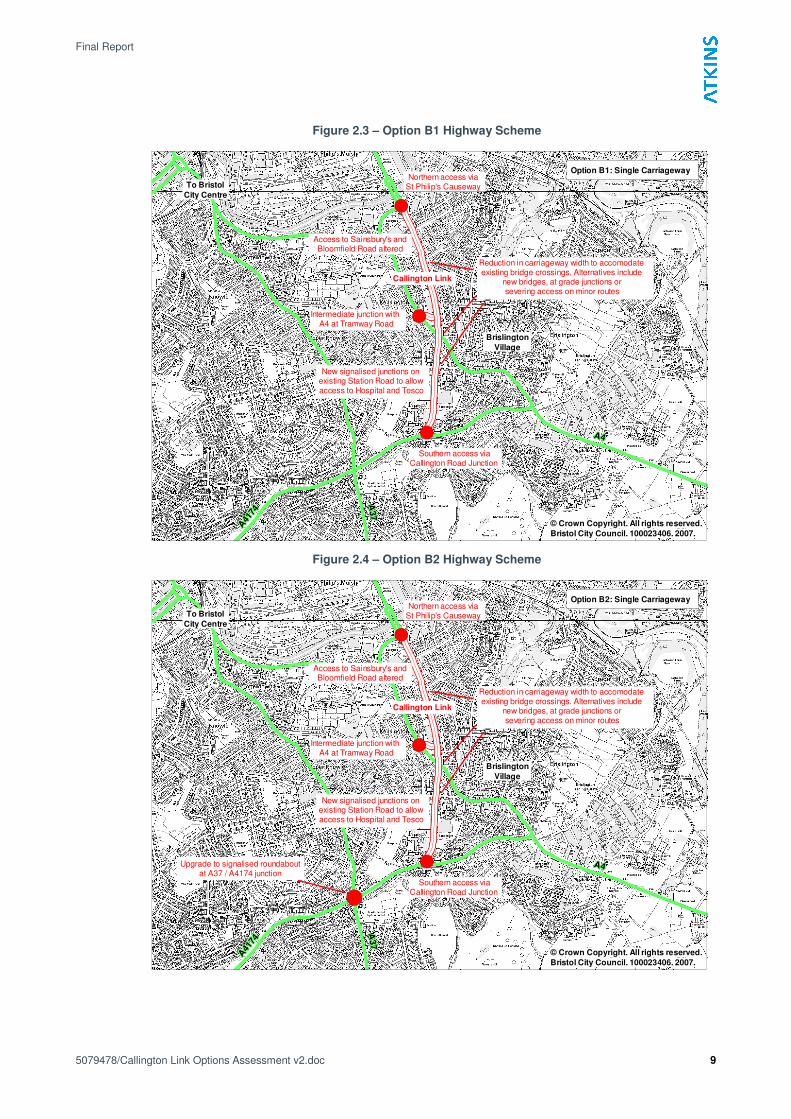
2.9 Option B is the second highway scheme with the link road comprising a single carriageway for the
full length and has two sub-options:
- Option B1 (Figure 2.3) is effectively a single carriageway version of Option A.
- Option B2 (Figure 2.4) includes a modification to Option B1 proposed by BCC improve
conditions at A37 Wells Road / Callington Road Junction by upgrading it from a
signalised junction to a signalised roundabout.
2.10 Unlike Option A, it was not necessary to increase the number of lanes on the Callington Road Link
in Option B to the junctions to the north and south of the link to aid egress from the link as a two
lane approach to these junctions was sufficient to cater for the demand on the single carriageway
link.
Final Report
5079478/Callington Link Options Assessment v2.doc 9
Figure 2.3 – Option B1 Highway Scheme
A4A4A4A4A4A4A4A4A4A4A4A4A4A4A4A4A4A4A4A4A4A4A4A4A4
A3
7A
37
A37
A37
A37
A3
7A
37
A37
A37
A37
A3
7A
37
A37
A37
A3
7A
37
A37
A37
A37
A3
7A
37
A37
A37
A37
A37
A41
74
A41
74
A41
74
A41
74
A41
74
A41
74
A41
74
A41
74
A41
74
A41
74
A41
74
A41
74
A41
74
A41
74
A41
74
A41
74
A41
74
A41
74
A41
74
A41
74
A41
74
A41
74
A41
74
A41
74
A41
74
© Crown Copyright. All rights reserved.
Bristol City Council. 100023406. 2007.
Option B1: Single CarriagewayNorthern access via
St Philip's Causeway
Access to Sainsbury's andBloomfield Road altered
Intermediate junction withA4 at Tramway Road
New signalised junctions onexisting Station Road to allowaccess to Hospital and Tesco
Southern access viaCallington Road Junction
To Bristol
City Centre
Brislington
Village
Reduction in carriageway width to accomodateexisting bridge crossings. Alternatives include
new bridges, at grade junctions orsevering access on minor routes
Callington Link
Figure 2.4 – Option B2 Highway Scheme
A4A4A4A4A4A4A4A4A4A4A4A4A4A4A4A4A4A4A4A4A4A4A4A4A4
A3
7A
37
A37
A37
A37
A3
7A
37
A37
A37
A37
A3
7A
37
A37
A37
A3
7A
37
A37
A37
A37
A3
7A
37
A37
A37
A37
A37
A41
74
A41
74
A41
74
A41
74
A41
74
A41
74
A41
74
A41
74
A41
74
A41
74
A41
74
A41
74
A41
74
A41
74
A41
74
A41
74
A41
74
A41
74
A41
74
A41
74
A41
74
A41
74
A41
74
A41
74
A41
74
© Crown Copyright. All rights reserved.
Bristol City Council. 100023406. 2007.
Option B2: Single CarriagewayNorthern access via
St Philip's Causeway
Access to Sainsbury's andBloomfield Road altered
Intermediate junction withA4 at Tramway Road
New signalised junctions onexisting Station Road to allowaccess to Hospital and Tesco
Southern access viaCallington Road Junction
To Bristol
City Centre
Brislington
Village
Reduction in carriageway width to accomodateexisting bridge crossings. Alternatives include
new bridges, at grade junctions orsevering access on minor routes
Callington Link
Upgrade to signalised roundaboutat A37 / A4174 junction
Final Report
5079478/Callington Link Options Assessment v2.doc 10
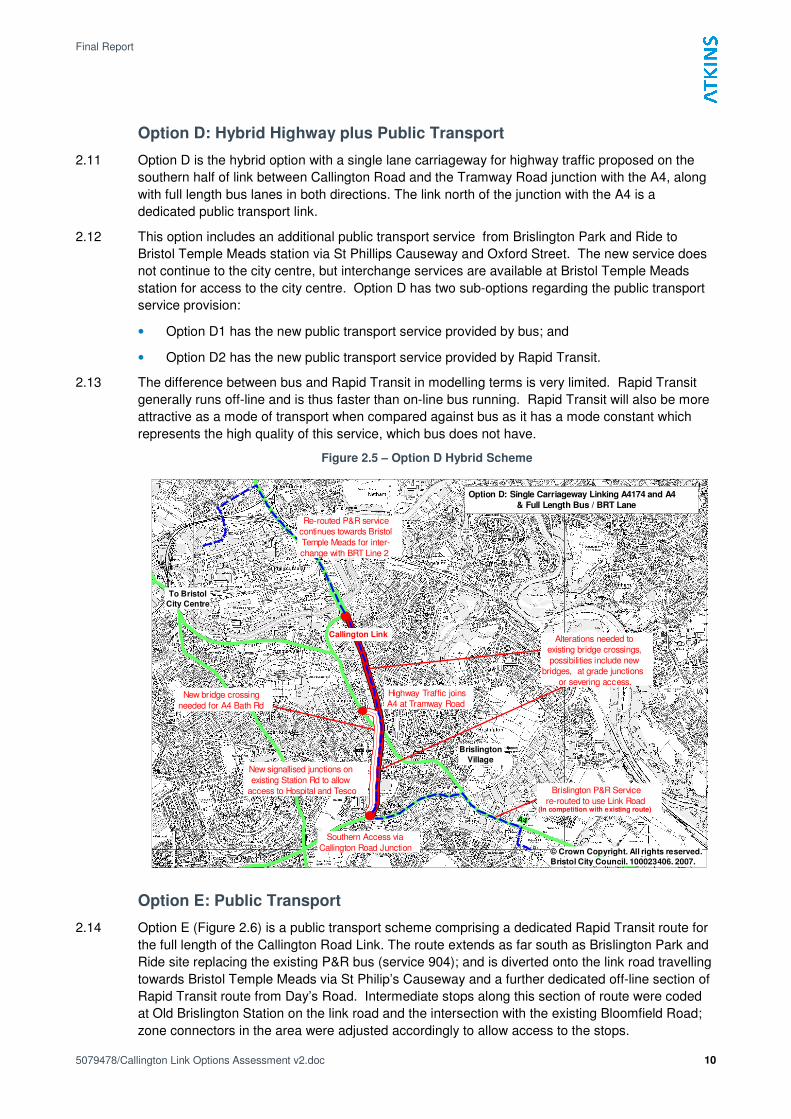
Option D: Hybrid Highway plus Public Transport
2.11 Option D is the hybrid option with a single lane carriageway for highway traffic proposed on the
southern half of link between Callington Road and the Tramway Road junction with the A4, along
with full length bus lanes in both directions. The link north of the junction with the A4 is a
dedicated public transport link.
2.12 This option includes an additional public transport service from Brislington Park and Ride to
Bristol Temple Meads station via St Phillips Causeway and Oxford Street. The new service does
not continue to the city centre, but interchange services are available at Bristol Temple Meads
station for access to the city centre. Option D has two sub-options regarding the public transport
service provision:
• Option D1 has the new public transport service provided by bus; and
• Option D2 has the new public transport service provided by Rapid Transit.
2.13 The difference between bus and Rapid Transit in modelling terms is very limited. Rapid Transit
generally runs off-line and is thus faster than on-line bus running. Rapid Transit will also be more
attractive as a mode of transport when compared against bus as it has a mode constant which
represents the high quality of this service, which bus does not have.
Figure 2.5 – Option D Hybrid Scheme
A4A4A4A4A4A4A4A4A4A4A4A4A4A4A4A4A4A4A4A4A4A4A4A4A4
Option D: Single Carriageway Linking A4174 and A4
& Full Length Bus / BRT Lane
New signallised junctions on
existing Station Rd to allow
access to Hospital and Tesco
Highway Traffic joins
A4 at Tramway Road
Southern Access via
Callington Road Junction
New bridge crossing
needed for A4 Bath Rd
Callington Link
© Crown Copyright. All rights reserved.
Bristol City Council. 100023406. 2007.
Alterations needed to
existing bridge crossings,
possibilities include new
bridges, at grade junctions
or severing access.
Brislington
Village
To Bristol
City Centre
Re-routed P&R service
continues towards Bristol
Temple Meads for inter-
change with BRT Line 2
Brislington P&R Service
re-routed to use Link Road(In competition with existing route)
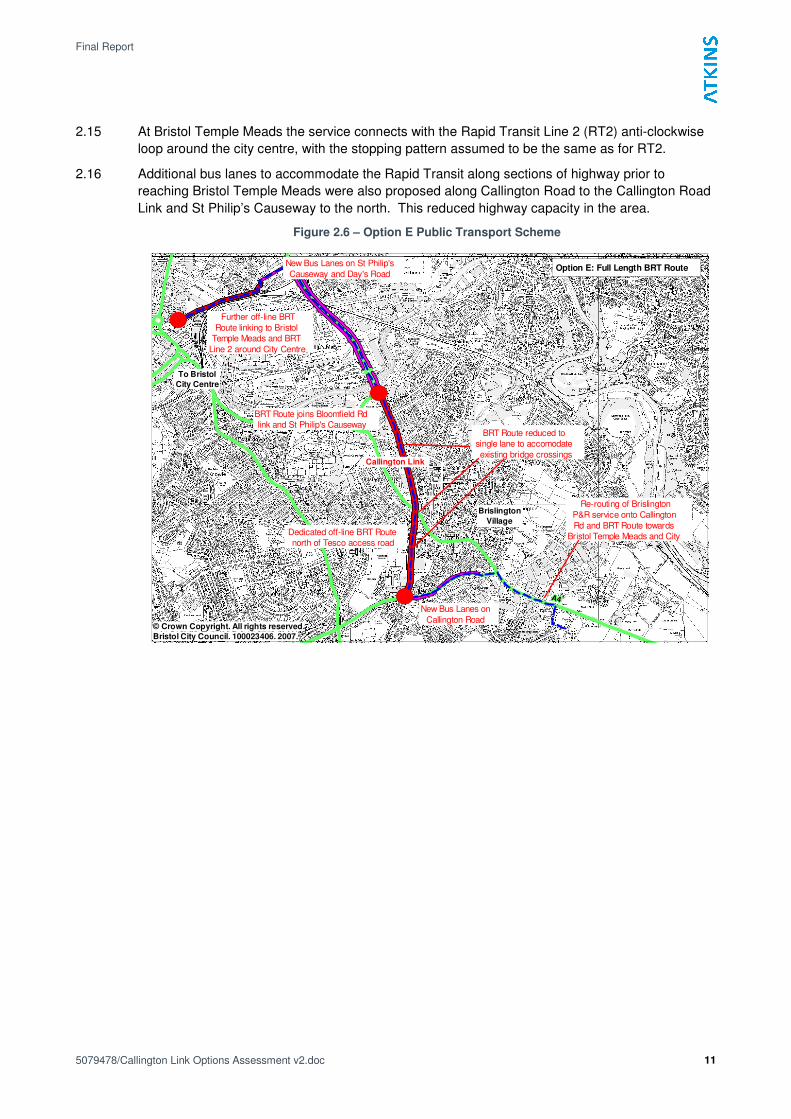
Option E: Public Transport
2.14 Option E (Figure 2.6) is a public transport scheme comprising a dedicated Rapid Transit route for
the full length of the Callington Road Link. The route extends as far south as Brislington Park and
Ride site replacing the existing P&R bus (service 904); and is diverted onto the link road travelling
towards Bristol Temple Meads via St Philip’s Causeway and a further dedicated off-line section of
Rapid Transit route from Day’s Road. Intermediate stops along this section of route were coded
at Old Brislington Station on the link road and the intersection with the existing Bloomfield Road;
zone connectors in the area were adjusted accordingly to allow access to the stops.
Final Report
5079478/Callington Link Options Assessment v2.doc 11
2.15 At Bristol Temple Meads the service connects with the Rapid Transit Line 2 (RT2) anti-clockwise
loop around the city centre, with the stopping pattern assumed to be the same as for RT2.
2.16 Additional bus lanes to accommodate the Rapid Transit along sections of highway prior to
reaching Bristol Temple Meads were also proposed along Callington Road to the Callington Road
Link and St Philip’s Causeway to the north. This reduced highway capacity in the area.
Figure 2.6 – Option E Public Transport Scheme
A4A4A4A4A4A4A4A4A4A4A4A4A4A4A4A4A4A4A4A4A4A4A4A4A4
Option E: Full Length BRT Route
Re-routing of Brislington
P&R service onto Callington
Rd and BRT Route towards
Bristol Temple Meads and City
New Bus Lanes on
Callington Road
Dedicated off-line BRT Route
north of Tesco access road
BRT Route reduced to
single lane to accomodate
existing bridge crossings
BRT Route joins Bloomfield Rd
link and St Philip's Causeway
New Bus Lanes on St Philip's
Causeway and Day's Road
Further off-line BRT
Route linking to Bristol
Temple Meads and BRT
Line 2 around City Centre
© Crown Copyright. All rights reserved.
Bristol City Council. 100023406. 2007.
Callington Link
To Bristol
City Centre
Brislington
Village
Final Report
5079478/Callington Link Options Assessment v2.doc 12
3. Results
Introduction
3.1 This chapter presents the outputs from the various model runs for each of the options that were
tested for the 2031 forecast year. The analysis considers:
• network-wide transport demand by mode;
• transport demand by area;
• network-wide highway model statistics;
• highway model screenline flows and journey times; and
• public transport demand.
3.2 The analysis is divided into the following three categories:
• Highway based options - Options A, B1 and B2 provide full length highway access along the
Callington Road Link and exclude any public transport changes;
• Hybrid options – Options D1 and D2 provide half-length highway access along the Callington
Road Link but full length public transport access and a new public transport service on the
link; and
• Public transport option – Option E provides full length public transport access along the
Callington Road Link and a new public transport service on the link.
Transport Demand
Changes in Network-Wide Transport Demand by Mode
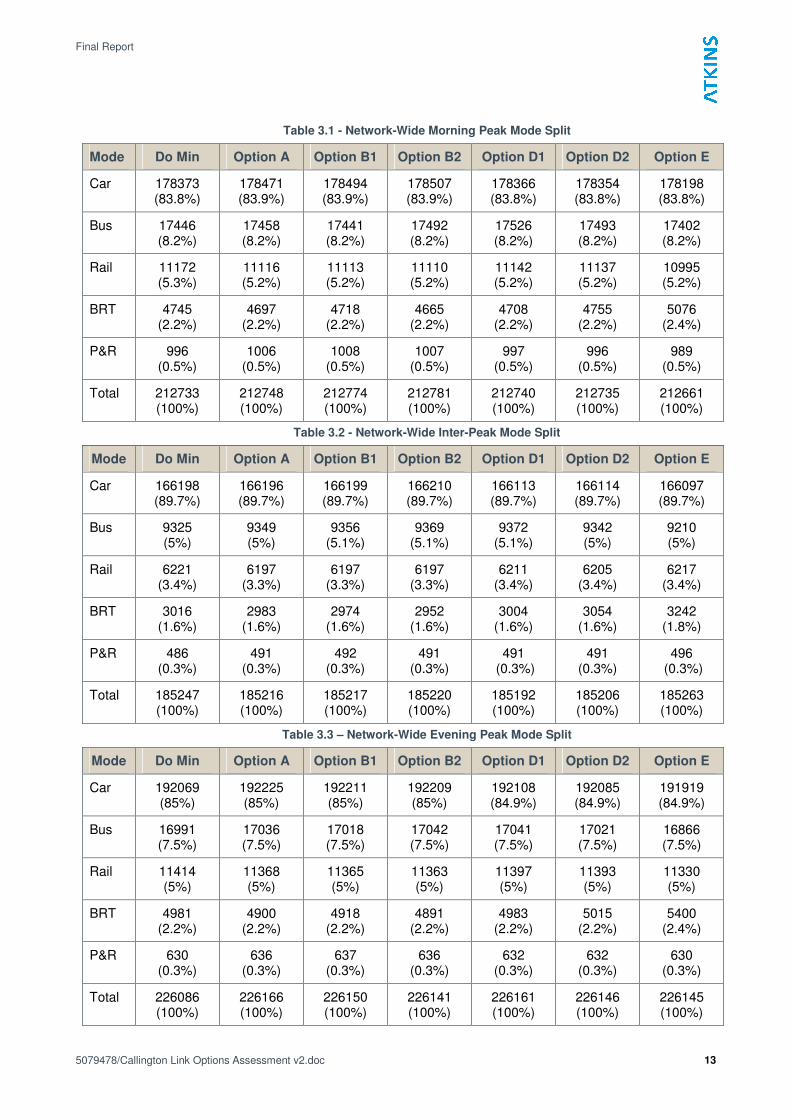
3.3 The changes in overall transport demand and mode split for the do minimum and each of the
option are shown in Table 3.1 to Table 3.3. Overall, the options have a limited impact on overall
demand and mode split when compared to the do-minimum. This is largely to be expected given
the size of the scheme in relation to the rest of the modelled network.
3.4 The highway options (A, B1 and B2) gain an additional 100 car trips in the morning peak and 150
car trips in the evening peak, although the car demand does not change in the inter-peak. The
highway options have very little impact on bus demand or other forms of public transport
throughout the day. The highway options each attract slightly more park and ride than the do-
minimum as the transfer of traffic from the A4 to the Callington Road Link results in slight
increases in bus speeds along the A4 and makes park and ride more attractive.
3.5 The hybrid options (D1 and D2) provide improvements for highway and public transport users. In
the morning peak there is a marginal decrease in car demand and slight increases in bus and
Rapid Transit demand for the respective bus and Rapid Transit hybrid options. This pattern is
repeated throughout the day.
3.6 The public transport option (E) has the largest impact on demand of all of the options. In the
morning peak car and rail demand decreases by approximately 170 trips but BRT demand
increases by over 300 trips. The improved public transport and slight reductions in highway
capacity results in a switch for car trips to Rapid Transit, whilst this also attracts demand from rail
to BRT. In the inter-peak there is again a switch from car travel to Rapid Transit, although this
time there is no impact on rail.
Final Report
5079478/Callington Link Options Assessment v2.doc 13
Table 3.1 - Network-Wide Morning Peak Mode Split
Mode Do Min Option A Option B1 Option B2 Option D1 Option D2 Option E
Car 178373 (83.8%)
178471 (83.9%)
178494 (83.9%)
178507 (83.9%)
178366 (83.8%)
178354 (83.8%)
178198 (83.8%)
Bus 17446 (8.2%)
17458 (8.2%)
17441 (8.2%)
17492 (8.2%)
17526 (8.2%)
17493 (8.2%)
17402 (8.2%)
Rail 11172 (5.3%)
11116 (5.2%)
11113 (5.2%)
11110 (5.2%)
11142 (5.2%)
11137 (5.2%)
10995 (5.2%)
BRT 4745 (2.2%)
4697 (2.2%)
4718 (2.2%)
4665 (2.2%)
4708 (2.2%)
4755 (2.2%)
5076 (2.4%)
P&R 996 (0.5%)
1006 (0.5%)
1008 (0.5%)
1007 (0.5%)
997 (0.5%)
996 (0.5%)
989 (0.5%)
Total 212733 (100%)
212748 (100%)
212774 (100%)
212781 (100%)
212740 (100%)
212735 (100%)
212661 (100%)
Table 3.2 - Network-Wide Inter-Peak Mode Split
Mode Do Min Option A Option B1 Option B2 Option D1 Option D2 Option E
Car 166198 (89.7%)
166196 (89.7%)
166199 (89.7%)
166210 (89.7%)
166113 (89.7%)
166114 (89.7%)
166097 (89.7%)
Bus 9325 (5%)
9349 (5%)
9356 (5.1%)
9369 (5.1%)
9372 (5.1%)
9342 (5%)
9210 (5%)
Rail 6221 (3.4%)
6197 (3.3%)
6197 (3.3%)
6197 (3.3%)
6211 (3.4%)
6205 (3.4%)
6217 (3.4%)
BRT 3016 (1.6%)
2983 (1.6%)
2974 (1.6%)
2952 (1.6%)
3004 (1.6%)
3054 (1.6%)
3242 (1.8%)
P&R 486 (0.3%)
491 (0.3%)
492 (0.3%)
491 (0.3%)
491 (0.3%)
491 (0.3%)
496 (0.3%)
Total 185247 (100%)
185216 (100%)
185217 (100%)
185220 (100%)
185192 (100%)
185206 (100%)
185263 (100%)
Table 3.3 – Network-Wide Evening Peak Mode Split
Mode Do Min Option A Option B1 Option B2 Option D1 Option D2 Option E
Car 192069 (85%)
192225 (85%)
192211 (85%)
192209 (85%)
192108 (84.9%)
192085 (84.9%)
191919 (84.9%)
Bus 16991 (7.5%)
17036 (7.5%)
17018 (7.5%)
17042 (7.5%)
17041 (7.5%)
17021 (7.5%)
16866 (7.5%)
Rail 11414 (5%)
11368 (5%)
11365 (5%)
11363 (5%)
11397 (5%)
11393 (5%)
11330 (5%)
BRT 4981 (2.2%)
4900 (2.2%)
4918 (2.2%)
4891 (2.2%)
4983 (2.2%)
5015 (2.2%)
5400 (2.4%)
P&R 630 (0.3%)
636 (0.3%)
637 (0.3%)
636 (0.3%)
632 (0.3%)
632 (0.3%)
630 (0.3%)
Total 226086 (100%)
226166 (100%)
226150 (100%)
226141 (100%)
226161 (100%)
226146 (100%)
226145 (100%)
Final Report
5079478/Callington Link Options Assessment v2.doc 14
Changes in Transport Demand by Location
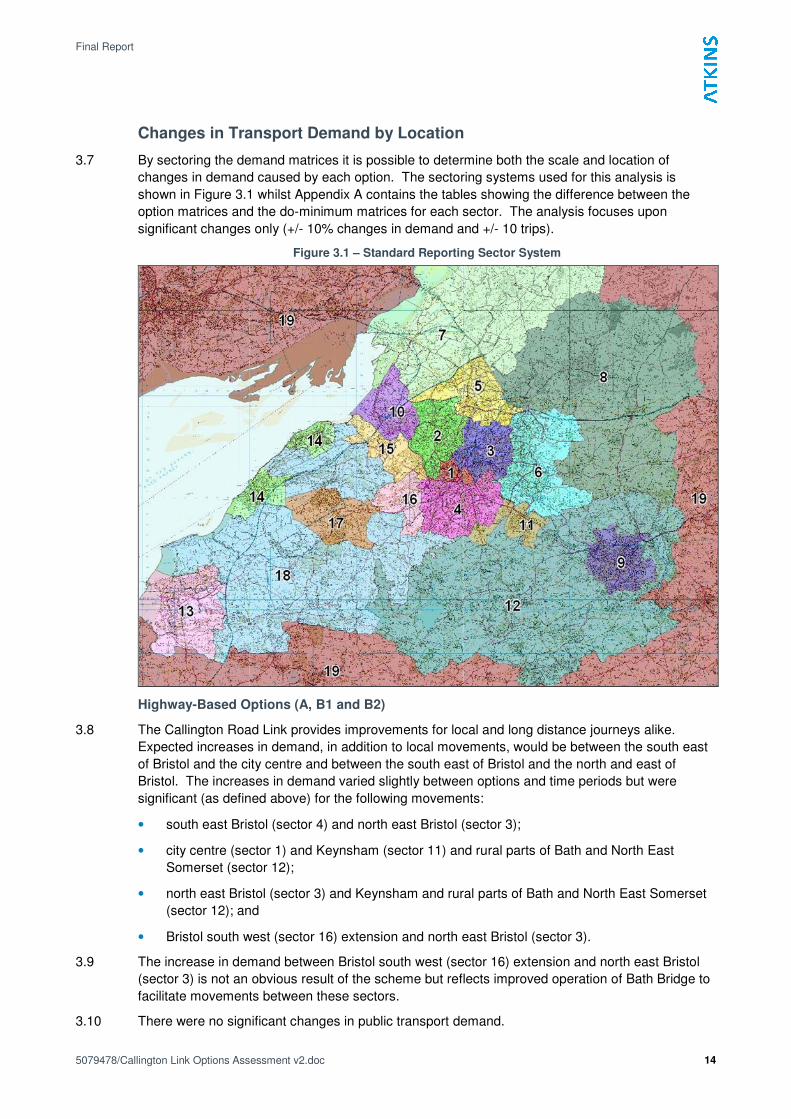
3.7 By sectoring the demand matrices it is possible to determine both the scale and location of
changes in demand caused by each option. The sectoring systems used for this analysis is
shown in Figure 3.1 whilst Appendix A contains the tables showing the difference between the
option matrices and the do-minimum matrices for each sector. The analysis focuses upon
significant changes only (+/- 10% changes in demand and +/- 10 trips).
Figure 3.1 – Standard Reporting Sector System
Highway-Based Options (A, B1 and B2)
3.8 The Callington Road Link provides improvements for local and long distance journeys alike.
Expected increases in demand, in addition to local movements, would be between the south east
of Bristol and the city centre and between the south east of Bristol and the north and east of
Bristol. The increases in demand varied slightly between options and time periods but were
significant (as defined above) for the following movements:
• south east Bristol (sector 4) and north east Bristol (sector 3);
• city centre (sector 1) and Keynsham (sector 11) and rural parts of Bath and North East
Somerset (sector 12);
• north east Bristol (sector 3) and Keynsham and rural parts of Bath and North East Somerset
(sector 12); and
• Bristol south west (sector 16) extension and north east Bristol (sector 3).
3.9 The increase in demand between Bristol south west (sector 16) extension and north east Bristol
(sector 3) is not an obvious result of the scheme but reflects improved operation of Bath Bridge to
facilitate movements between these sectors.
3.10 There were no significant changes in public transport demand.
Final Report
5079478/Callington Link Options Assessment v2.doc 15
Hybrid Options (D1 and D2)
3.11 In the hybrid options the Callington Road Link provides a full length public transport option with
other vehicular traffic permitted to travel between Callington Road and Tramway Road Junction.
3.12 There were no significant changes in either highway or public transport demand for Options D1
and D2. This is consistent with the relatively small changes in demand described above.
Public Transport Option (E)
3.13 In the public transport option the Callington Road Link provides a full length public transport option
with no access for other vehicles. Despite the slight reduction in highway demand shown in
Tables 3.1 to 3.3, this resulted in no significant change in highway demand by location. However,
this options did produce some decrease in rail demand and increased Rapid Transit demand
between:
• south east Bristol (sector 4) and the city centre (sector 1);
• north east Bristol (sector 3) and the city centre (sector 1); and
• south east Bristol (sector 4) and north east Bristol (sector 3).
3.14 Whilst the increase in demand between north east Bristol (sector 3) and the city centre (sector 1)
is not an obvious result of the scheme it reflects increased park and ride demand from sector 3
that uses the new service in Option E.
Highway Model Outputs
Network-Wide Summary Statistics
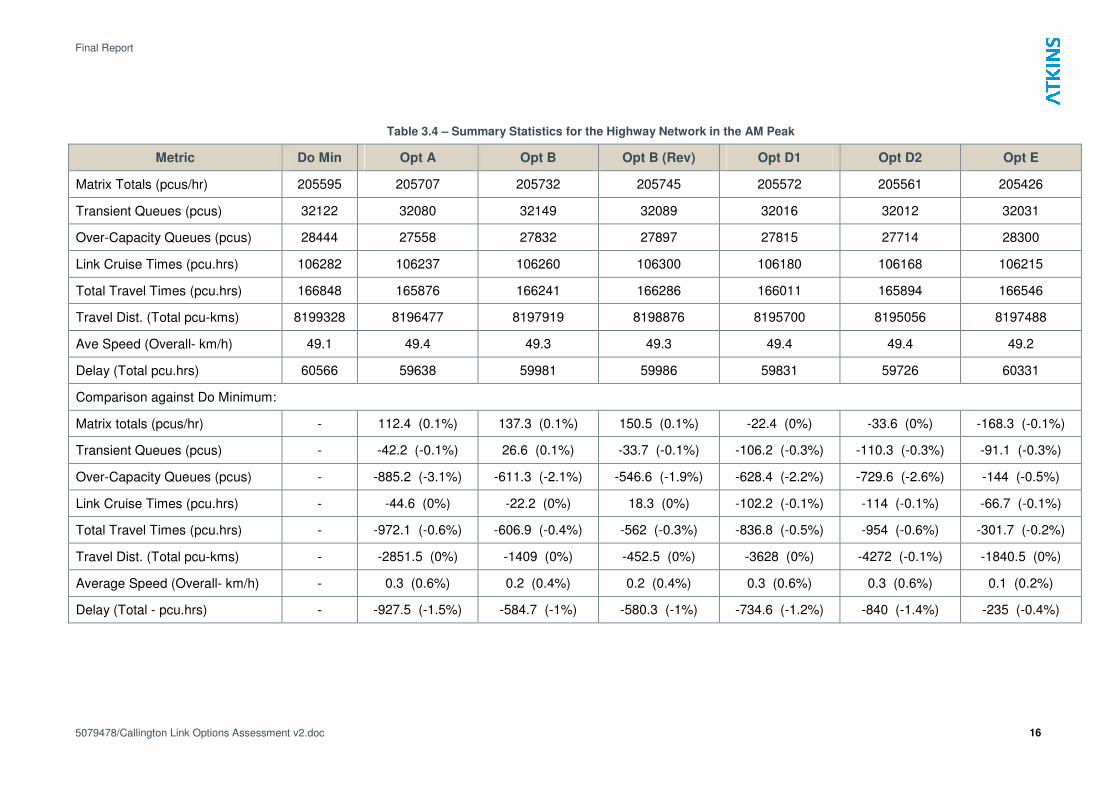
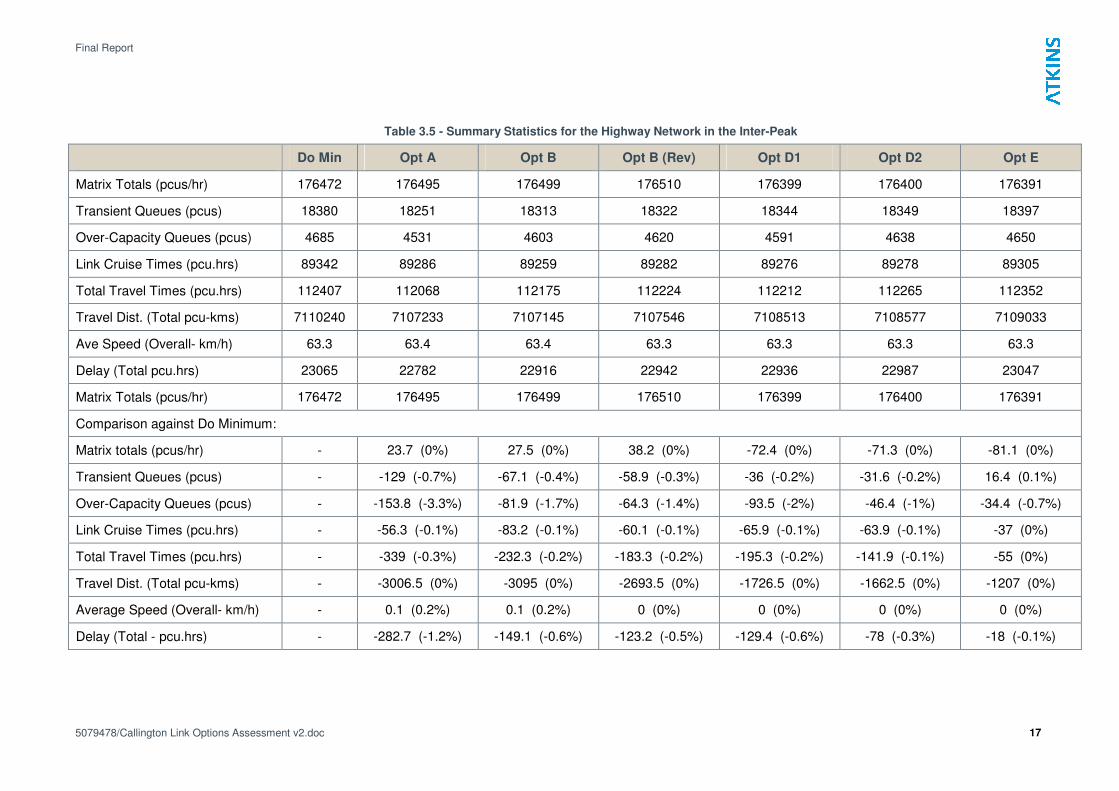
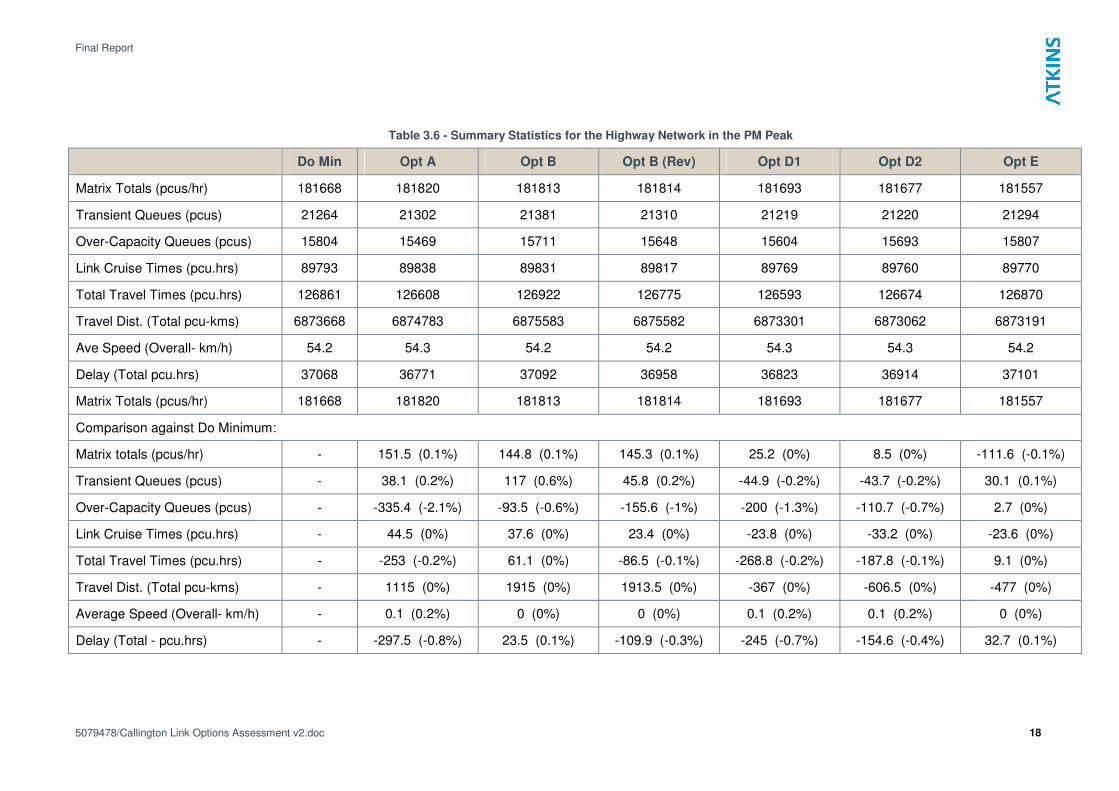
3.15 Standard highway network summary statistics are readily produced by the assignment model.
The statistics include the following items and are shown in Table 3.4 to 3.6:
• Matrix Total (pcus/hr) number of trips assigned to the network in one hour;
• Transient Queues (pcus) queues below capacity (typically waiting at traffic lights etc);
• Over-Capacity Queues (pcus) queues above capacity (at all locations);
• Link Cruise Times (pcu.hrs) sum of all free flow travel time;
• Delay (Total pcu.hrs) sum of all time taken below free flow speed
• Total Travel Times (pcu.hrs) sum of all link cruise time plus delay time
• Travel Dist. (Total pcu-kms) sum of all distance travelled
• Ave Speed (Overall- km/h) average speed across the network
3.16 One of the main indicators of congested network performance is delay. In the do-minimum 36%
of network time is spent delayed in the morning peak, 21% in the inter-peak and 29% in the
evening peak.
3.17 With the exception of Option E in the evening peak, all of the options reduce delay in all time
periods. Delay is typically reduced by 1-2%.
3.18 The options generally reduce total distance travelled, indicating that the Callington Road Link
enables more direct trips to be made. The increase in the total distance travelled in the highway
options in the evening peak mirrors the modest reduction in delay.
3.19 None of the options cause the average network speed to fall below that of the do-minimum. This
indicates that the scheme is likely to have a beneficial effect in economic appraisal and
environmental appraisal.
Final Report
5079478/Callington Link Options Assessment v2.doc 16
Table 3.4 – Summary Statistics for the Highway Network in the AM Peak
Metric Do Min Opt A Opt B Opt B (Rev) Opt D1 Opt D2 Opt E
Matrix Totals (pcus/hr) 205595 205707 205732 205745 205572 205561 205426
Transient Queues (pcus) 32122 32080 32149 32089 32016 32012 32031
Over-Capacity Queues (pcus) 28444 27558 27832 27897 27815 27714 28300
Link Cruise Times (pcu.hrs) 106282 106237 106260 106300 106180 106168 106215
Total Travel Times (pcu.hrs) 166848 165876 166241 166286 166011 165894 166546
Travel Dist. (Total pcu-kms) 8199328 8196477 8197919 8198876 8195700 8195056 8197488
Ave Speed (Overall- km/h) 49.1 49.4 49.3 49.3 49.4 49.4 49.2
Delay (Total pcu.hrs) 60566 59638 59981 59986 59831 59726 60331
Comparison against Do Minimum:
Matrix totals (pcus/hr) - 112.4 (0.1%) 137.3 (0.1%) 150.5 (0.1%) -22.4 (0%) -33.6 (0%) -168.3 (-0.1%)
Transient Queues (pcus) - -42.2 (-0.1%) 26.6 (0.1%) -33.7 (-0.1%) -106.2 (-0.3%) -110.3 (-0.3%) -91.1 (-0.3%)
Over-Capacity Queues (pcus) - -885.2 (-3.1%) -611.3 (-2.1%) -546.6 (-1.9%) -628.4 (-2.2%) -729.6 (-2.6%) -144 (-0.5%)
Link Cruise Times (pcu.hrs) - -44.6 (0%) -22.2 (0%) 18.3 (0%) -102.2 (-0.1%) -114 (-0.1%) -66.7 (-0.1%)
Total Travel Times (pcu.hrs) - -972.1 (-0.6%) -606.9 (-0.4%) -562 (-0.3%) -836.8 (-0.5%) -954 (-0.6%) -301.7 (-0.2%)
Travel Dist. (Total pcu-kms) - -2851.5 (0%) -1409 (0%) -452.5 (0%) -3628 (0%) -4272 (-0.1%) -1840.5 (0%)
Average Speed (Overall- km/h) - 0.3 (0.6%) 0.2 (0.4%) 0.2 (0.4%) 0.3 (0.6%) 0.3 (0.6%) 0.1 (0.2%)
Delay (Total - pcu.hrs) - -927.5 (-1.5%) -584.7 (-1%) -580.3 (-1%) -734.6 (-1.2%) -840 (-1.4%) -235 (-0.4%)
Final Report
5079478/Callington Link Options Assessment v2.doc 17
Table 3.5 - Summary Statistics for the Highway Network in the Inter-Peak
Do Min Opt A Opt B Opt B (Rev) Opt D1 Opt D2 Opt E
Matrix Totals (pcus/hr) 176472 176495 176499 176510 176399 176400 176391
Transient Queues (pcus) 18380 18251 18313 18322 18344 18349 18397
Over-Capacity Queues (pcus) 4685 4531 4603 4620 4591 4638 4650
Link Cruise Times (pcu.hrs) 89342 89286 89259 89282 89276 89278 89305
Total Travel Times (pcu.hrs) 112407 112068 112175 112224 112212 112265 112352
Travel Dist. (Total pcu-kms) 7110240 7107233 7107145 7107546 7108513 7108577 7109033
Ave Speed (Overall- km/h) 63.3 63.4 63.4 63.3 63.3 63.3 63.3
Delay (Total pcu.hrs) 23065 22782 22916 22942 22936 22987 23047
Matrix Totals (pcus/hr) 176472 176495 176499 176510 176399 176400 176391
Comparison against Do Minimum:
Matrix totals (pcus/hr) - 23.7 (0%) 27.5 (0%) 38.2 (0%) -72.4 (0%) -71.3 (0%) -81.1 (0%)
Transient Queues (pcus) - -129 (-0.7%) -67.1 (-0.4%) -58.9 (-0.3%) -36 (-0.2%) -31.6 (-0.2%) 16.4 (0.1%)
Over-Capacity Queues (pcus) - -153.8 (-3.3%) -81.9 (-1.7%) -64.3 (-1.4%) -93.5 (-2%) -46.4 (-1%) -34.4 (-0.7%)
Link Cruise Times (pcu.hrs) - -56.3 (-0.1%) -83.2 (-0.1%) -60.1 (-0.1%) -65.9 (-0.1%) -63.9 (-0.1%) -37 (0%)
Total Travel Times (pcu.hrs) - -339 (-0.3%) -232.3 (-0.2%) -183.3 (-0.2%) -195.3 (-0.2%) -141.9 (-0.1%) -55 (0%)
Travel Dist. (Total pcu-kms) - -3006.5 (0%) -3095 (0%) -2693.5 (0%) -1726.5 (0%) -1662.5 (0%) -1207 (0%)
Average Speed (Overall- km/h) - 0.1 (0.2%) 0.1 (0.2%) 0 (0%) 0 (0%) 0 (0%) 0 (0%)
Delay (Total - pcu.hrs) - -282.7 (-1.2%) -149.1 (-0.6%) -123.2 (-0.5%) -129.4 (-0.6%) -78 (-0.3%) -18 (-0.1%)
Final Report
5079478/Callington Link Options Assessment v2.doc 18
Table 3.6 - Summary Statistics for the Highway Network in the PM Peak
Do Min Opt A Opt B Opt B (Rev) Opt D1 Opt D2 Opt E
Matrix Totals (pcus/hr) 181668 181820 181813 181814 181693 181677 181557
Transient Queues (pcus) 21264 21302 21381 21310 21219 21220 21294
Over-Capacity Queues (pcus) 15804 15469 15711 15648 15604 15693 15807
Link Cruise Times (pcu.hrs) 89793 89838 89831 89817 89769 89760 89770
Total Travel Times (pcu.hrs) 126861 126608 126922 126775 126593 126674 126870
Travel Dist. (Total pcu-kms) 6873668 6874783 6875583 6875582 6873301 6873062 6873191
Ave Speed (Overall- km/h) 54.2 54.3 54.2 54.2 54.3 54.3 54.2
Delay (Total pcu.hrs) 37068 36771 37092 36958 36823 36914 37101
Matrix Totals (pcus/hr) 181668 181820 181813 181814 181693 181677 181557
Comparison against Do Minimum:
Matrix totals (pcus/hr) - 151.5 (0.1%) 144.8 (0.1%) 145.3 (0.1%) 25.2 (0%) 8.5 (0%) -111.6 (-0.1%)
Transient Queues (pcus) - 38.1 (0.2%) 117 (0.6%) 45.8 (0.2%) -44.9 (-0.2%) -43.7 (-0.2%) 30.1 (0.1%)
Over-Capacity Queues (pcus) - -335.4 (-2.1%) -93.5 (-0.6%) -155.6 (-1%) -200 (-1.3%) -110.7 (-0.7%) 2.7 (0%)
Link Cruise Times (pcu.hrs) - 44.5 (0%) 37.6 (0%) 23.4 (0%) -23.8 (0%) -33.2 (0%) -23.6 (0%)
Total Travel Times (pcu.hrs) - -253 (-0.2%) 61.1 (0%) -86.5 (-0.1%) -268.8 (-0.2%) -187.8 (-0.1%) 9.1 (0%)
Travel Dist. (Total pcu-kms) - 1115 (0%) 1915 (0%) 1913.5 (0%) -367 (0%) -606.5 (0%) -477 (0%)
Average Speed (Overall- km/h) - 0.1 (0.2%) 0 (0%) 0 (0%) 0.1 (0.2%) 0.1 (0.2%) 0 (0%)
Delay (Total - pcu.hrs) - -297.5 (-0.8%) 23.5 (0.1%) -109.9 (-0.3%) -245 (-0.7%) -154.6 (-0.4%) 32.7 (0.1%)
Final Report
5079478/Callington Link Options Assessment v2.doc 19
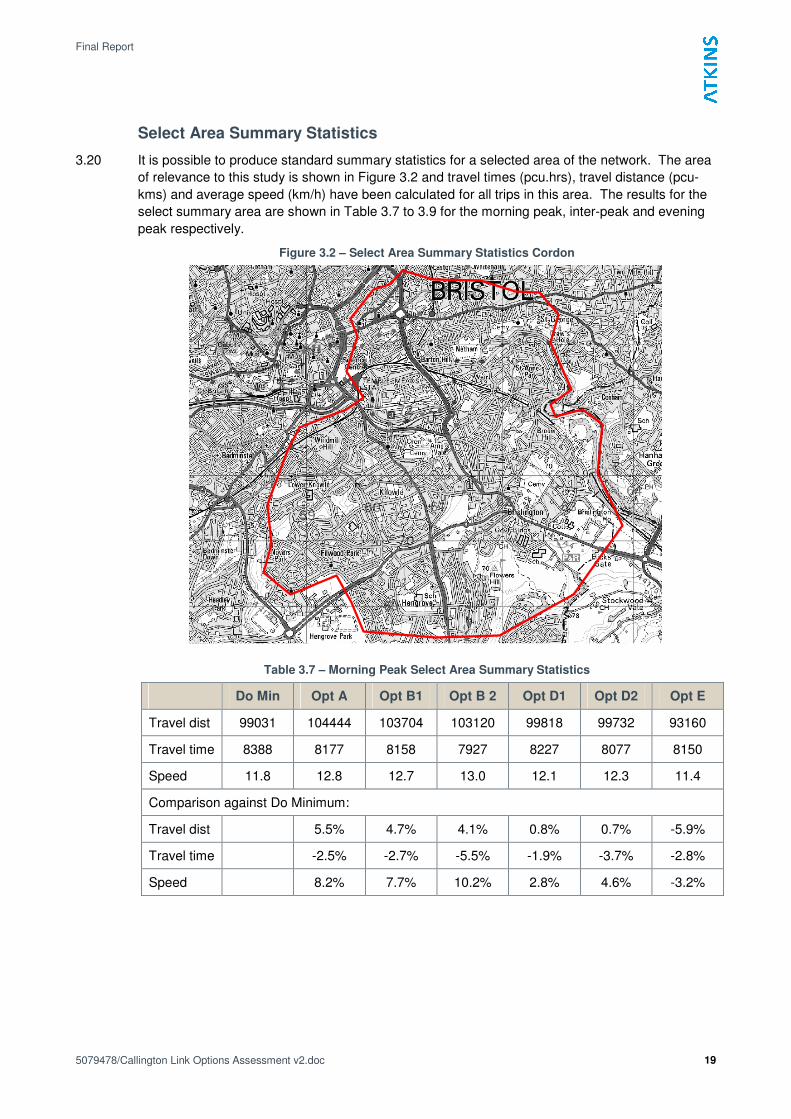
Select Area Summary Statistics
3.20 It is possible to produce standard summary statistics for a selected area of the network. The area
of relevance to this study is shown in Figure 3.2 and travel times (pcu.hrs), travel distance (pcu-
kms) and average speed (km/h) have been calculated for all trips in this area. The results for the
select summary area are shown in Table 3.7 to 3.9 for the morning peak, inter-peak and evening
peak respectively.
Figure 3.2 – Select Area Summary Statistics Cordon
Table 3.7 – Morning Peak Select Area Summary Statistics
Do Min Opt A Opt B1 Opt B 2 Opt D1 Opt D2 Opt E
Travel dist 99031 104444 103704 103120 99818 99732 93160
Travel time 8388 8177 8158 7927 8227 8077 8150
Speed 11.8 12.8 12.7 13.0 12.1 12.3 11.4
Comparison against Do Minimum:
Travel dist 5.5% 4.7% 4.1% 0.8% 0.7% -5.9%
Travel time -2.5% -2.7% -5.5% -1.9% -3.7% -2.8%
Speed 8.2% 7.7% 10.2% 2.8% 4.6% -3.2%

Final Report
5079478/Callington Link Options Assessment v2.doc 20
Table 3.8 – Inter-Peak Select Area Summary Statistics
Do Min Opt A Opt B1 Opt B 2 Opt D1 Opt D2 Opt E
Travel dist 87693 91761 90986 90518 87988 88033 82515
Travel time 4341 4371 4380 4315 4296 4340 4189
Speed 20.2 21.0 20.8 21.0 20.5 20.3 19.7
Comparison against Do Minimum:
Travel dist 4.6% 3.8% 3.2% 0.3% 0.4% -5.9%
Travel time 0.7% 0.9% -0.6% -1.0% 0.0% -3.5%
Speed 3.9% 2.8% 3.8% 1.4% 0.4% -2.5%
Table 3.9 – Evening Peak Select Area Summary Statistics
Do Min Opt A Opt B1 Opt B 2 Opt D1 Opt D2 Opt E
Travel dist 96705 101482 100776 100172 97641 97514 90921
Travel time 6225 6265 6261 6097 6083 6100 6008
Speed 15.5 16.2 16.1 16.4 16.1 16.0 15.1
Comparison against Do Minimum:
Travel dist 4.9% 4.2% 3.6% 1.0% 0.8% -6.0%
Travel time 0.6% 0.6% -2.1% -2.3% -2.0% -3.5%
Speed 4.3% 3.6% 5.8% 3.3% 2.9% -2.6%
3.21 The statistics show that travel distance increases for all of the highway and hybrid options when
compared against the do-minimum in all time periods. Similarly, travel time decreases for all of
the highway and hybrid options when compared against the do-minimum in all time periods. The
public transport option shows decreases in travel distance (traffic) with decreases in travel time
but this does not result in an increase in speed.
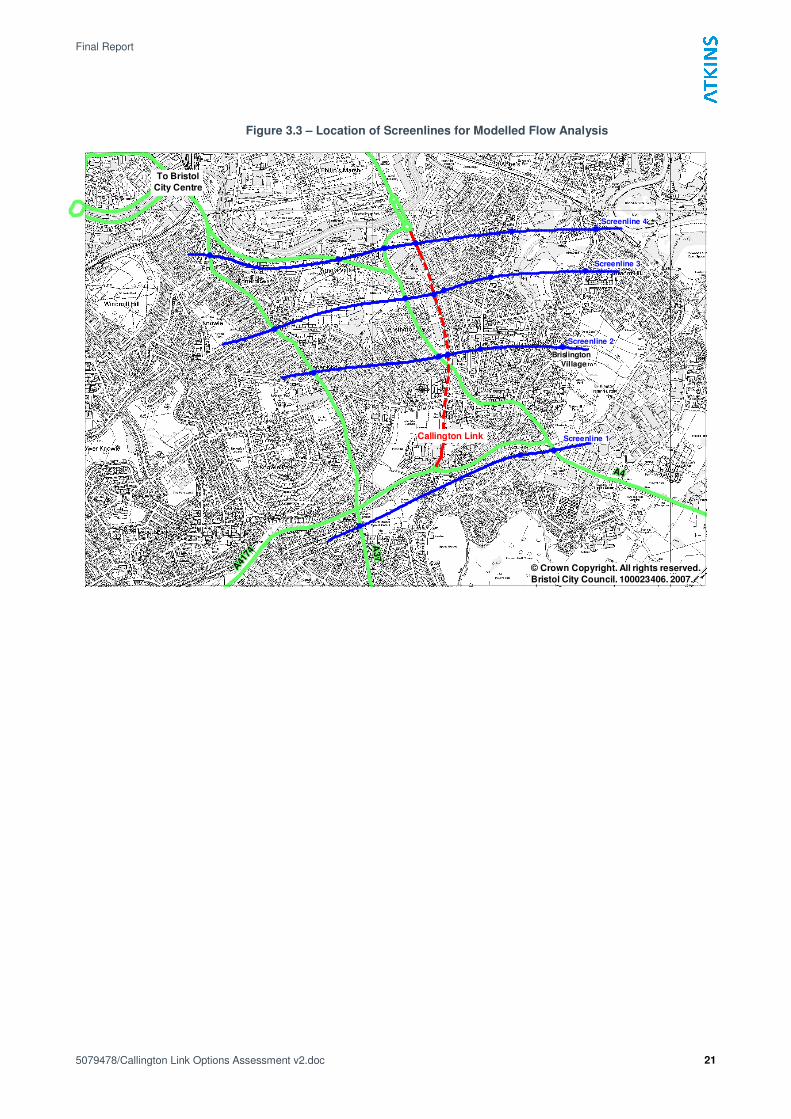
Screenline Flow Analysis
3.22 To aid the analysis of traffic flow, screenlines have been formed across the A37, Callington Road
Link (where applicable), A4 and adjoining roads to the east of the A4 to reflect ‘rat-running’. By
comparing the flow on each road and across the screenline in total it is possible to highlight the
impact that the Callington Road Link has on each of the selected roads. The screenlines are
shown in Figure 3.2 and results in Table 3.7 to 3.9.
3.23 In a northbound direction:
• Screenline 1, to the south of Callington Road, provides an indication of traffic approaching
the Callington Road Link;
• Screenline 2 provides an indication of the effect of the Callington Road Link on traffic in
Brislington Village;
• Screenline 3 provides an indication of traffic to the north of Tramway Road Junction; and
• Screenline 4 provides an indication of traffic either heading towards the city centre or
bypassing the city centre on Saint Phillip’s Causeway.
Final Report
5079478/Callington Link Options Assessment v2.doc 21
Figure 3.3 – Location of Screenlines for Modelled Flow Analysis
A4A4A4A4A4A4A4A4A4A4A4A4A4A4A4A4A4A4A4A4A4A4A4A4A4
Brislington
Village
A3
7A
37
A37
A3
7A
37
A3
7A
37
A37
A3
7A
37
A3
7A
37
A3
7A
37
A3
7A
37
A37
A3
7A
37
A3
7A
37
A37
A3
7A
37
A37
A41
74
A41
74
A41
74
A41
74
A41
74
A41
74
A41
74
A41
74
A41
74
A41
74
A41
74
A41
74
A41
74
A41
74
A41
74
A41
74
A41
74
A41
74
A41
74
A41
74
A41
74
A41
74
A41
74
A41
74
A41
74
Screenline 3
Screenline 4
Screenline 2
Screenline 1
To Bristol
City Centre
Callington Link
© Crown Copyright. All rights reserved.
Bristol City Council. 100023406. 2007.
Final Report
5079478/Callington Link Options Assessment v2.doc 22
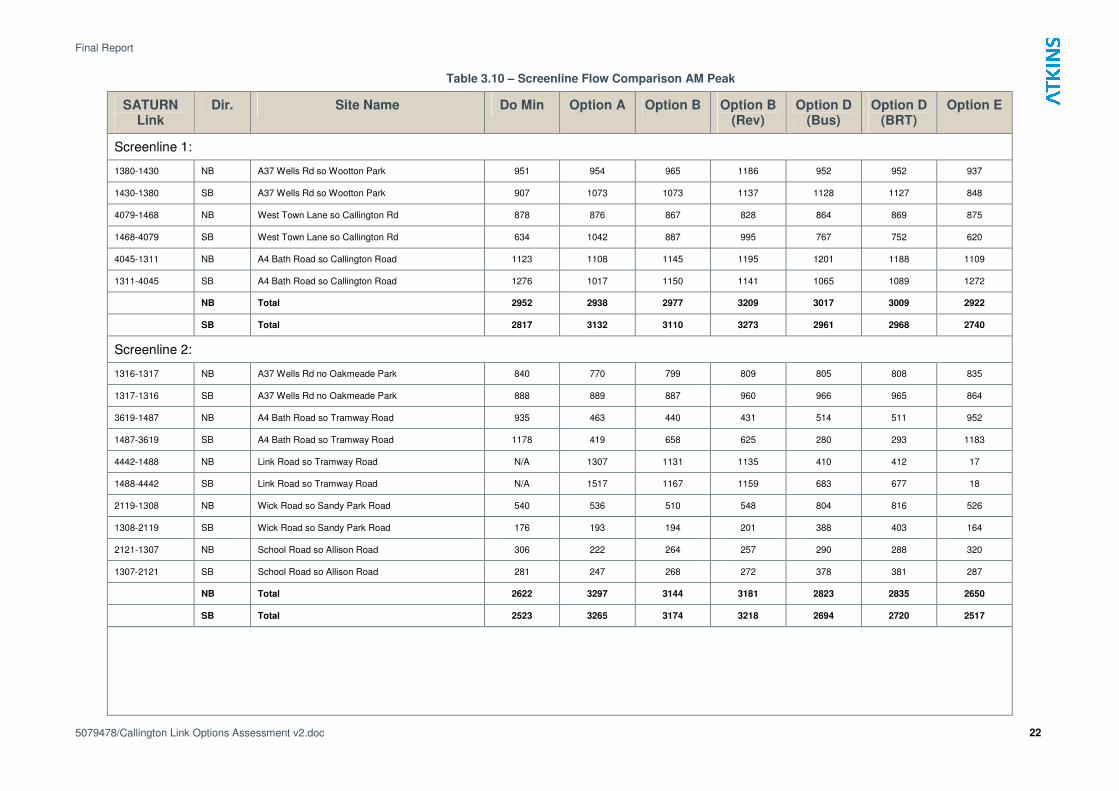
Table 3.10 – Screenline Flow Comparison AM Peak
SATURN Link
Dir. Site Name Do Min Option A Option B Option B (Rev)
Option D (Bus)
Option D (BRT)
Option E
Screenline 1:
1380-1430 NB A37 Wells Rd so Wootton Park 951 954 965 1186 952 952 937
1430-1380 SB A37 Wells Rd so Wootton Park 907 1073 1073 1137 1128 1127 848
4079-1468 NB West Town Lane so Callington Rd 878 876 867 828 864 869 875
1468-4079 SB West Town Lane so Callington Rd 634 1042 887 995 767 752 620
4045-1311 NB A4 Bath Road so Callington Road 1123 1108 1145 1195 1201 1188 1109
1311-4045 SB A4 Bath Road so Callington Road 1276 1017 1150 1141 1065 1089 1272
NB Total 2952 2938 2977 3209 3017 3009 2922
SB Total 2817 3132 3110 3273 2961 2968 2740
Screenline 2:
1316-1317 NB A37 Wells Rd no Oakmeade Park 840 770 799 809 805 808 835
1317-1316 SB A37 Wells Rd no Oakmeade Park 888 889 887 960 966 965 864
3619-1487 NB A4 Bath Road so Tramway Road 935 463 440 431 514 511 952
1487-3619 SB A4 Bath Road so Tramway Road 1178 419 658 625 280 293 1183
4442-1488 NB Link Road so Tramway Road N/A 1307 1131 1135 410 412 17
1488-4442 SB Link Road so Tramway Road N/A 1517 1167 1159 683 677 18
2119-1308 NB Wick Road so Sandy Park Road 540 536 510 548 804 816 526
1308-2119 SB Wick Road so Sandy Park Road 176 193 194 201 388 403 164
2121-1307 NB School Road so Allison Road 306 222 264 257 290 288 320
1307-2121 SB School Road so Allison Road 281 247 268 272 378 381 287
NB Total 2622 3297 3144 3181 2823 2835 2650
SB Total 2523 3265 3174 3218 2694 2720 2517
Final Report
5079478/Callington Link Options Assessment v2.doc 23
SATURN Link
Dir. Site Name Do Min Option A Option B Option B (Rev)
Option D (Bus)
Option D (BRT)
Option E
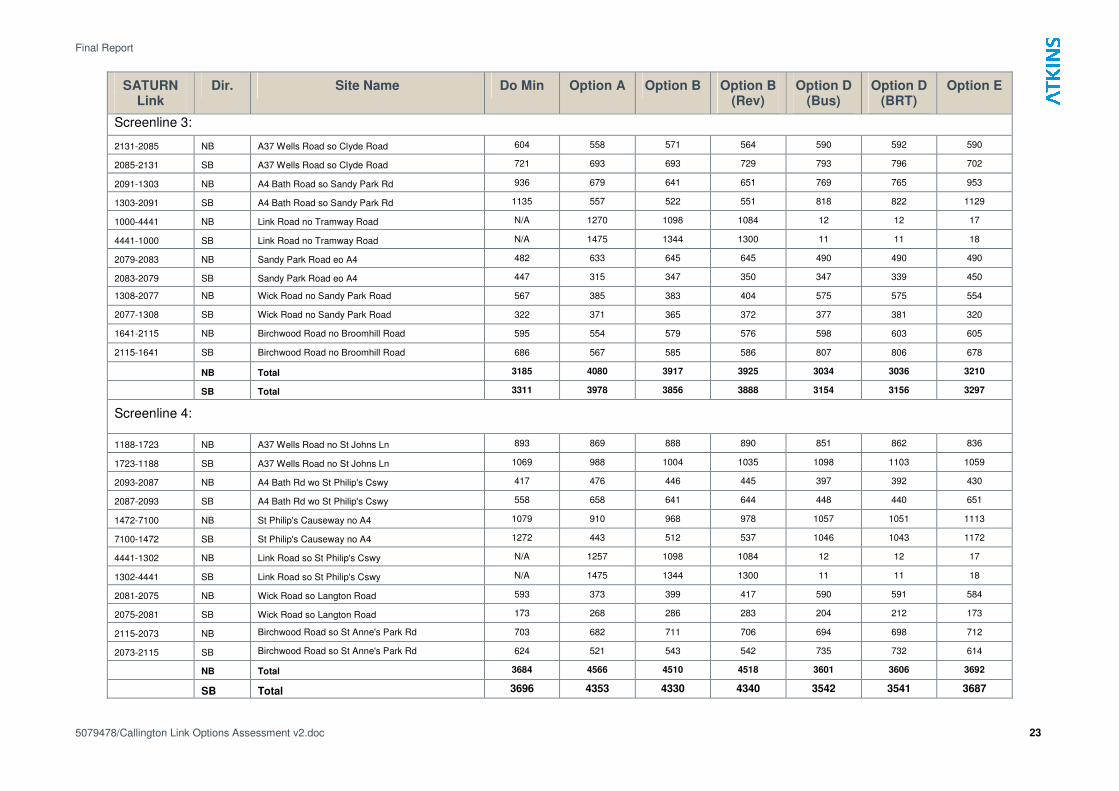
Screenline 3:
2131-2085 NB A37 Wells Road so Clyde Road 604 558 571 564 590 592 590
2085-2131 SB A37 Wells Road so Clyde Road 721 693 693 729 793 796 702
2091-1303 NB A4 Bath Road so Sandy Park Rd 936 679 641 651 769 765 953
1303-2091 SB A4 Bath Road so Sandy Park Rd 1135 557 522 551 818 822 1129
1000-4441 NB Link Road no Tramway Road N/A 1270 1098 1084 12 12 17
4441-1000 SB Link Road no Tramway Road N/A 1475 1344 1300 11 11 18
2079-2083 NB Sandy Park Road eo A4 482 633 645 645 490 490 490
2083-2079 SB Sandy Park Road eo A4 447 315 347 350 347 339 450
1308-2077 NB Wick Road no Sandy Park Road 567 385 383 404 575 575 554
2077-1308 SB Wick Road no Sandy Park Road 322 371 365 372 377 381 320
1641-2115 NB Birchwood Road no Broomhill Road 595 554 579 576 598 603 605
2115-1641 SB Birchwood Road no Broomhill Road 686 567 585 586 807 806 678
NB Total 3185 4080 3917 3925 3034 3036 3210
SB Total 3311 3978 3856 3888 3154 3156 3297
Screenline 4:
1188-1723 NB A37 Wells Road no St Johns Ln 893 869 888 890 851 862 836
1723-1188 SB A37 Wells Road no St Johns Ln 1069 988 1004 1035 1098 1103 1059
2093-2087 NB A4 Bath Rd wo St Philip's Cswy 417 476 446 445 397 392 430
2087-2093 SB A4 Bath Rd wo St Philip's Cswy 558 658 641 644 448 440 651
1472-7100 NB St Philip's Causeway no A4 1079 910 968 978 1057 1051 1113
7100-1472 SB St Philip's Causeway no A4 1272 443 512 537 1046 1043 1172
4441-1302 NB Link Road so St Philip's Cswy N/A 1257 1098 1084 12 12 17
1302-4441 SB Link Road so St Philip's Cswy N/A 1475 1344 1300 11 11 18
2081-2075 NB Wick Road so Langton Road 593 373 399 417 590 591 584
2075-2081 SB Wick Road so Langton Road 173 268 286 283 204 212 173
2115-2073 NB Birchwood Road so St Anne's Park Rd 703 682 711 706 694 698 712
2073-2115 SB Birchwood Road so St Anne's Park Rd 624 521 543 542 735 732 614
NB Total 3684 4566 4510 4518 3601 3606 3692
SB Total 3696 4353 4330 4340 3542 3541 3687
Final Report
5079478/Callington Link Options Assessment v2.doc 24
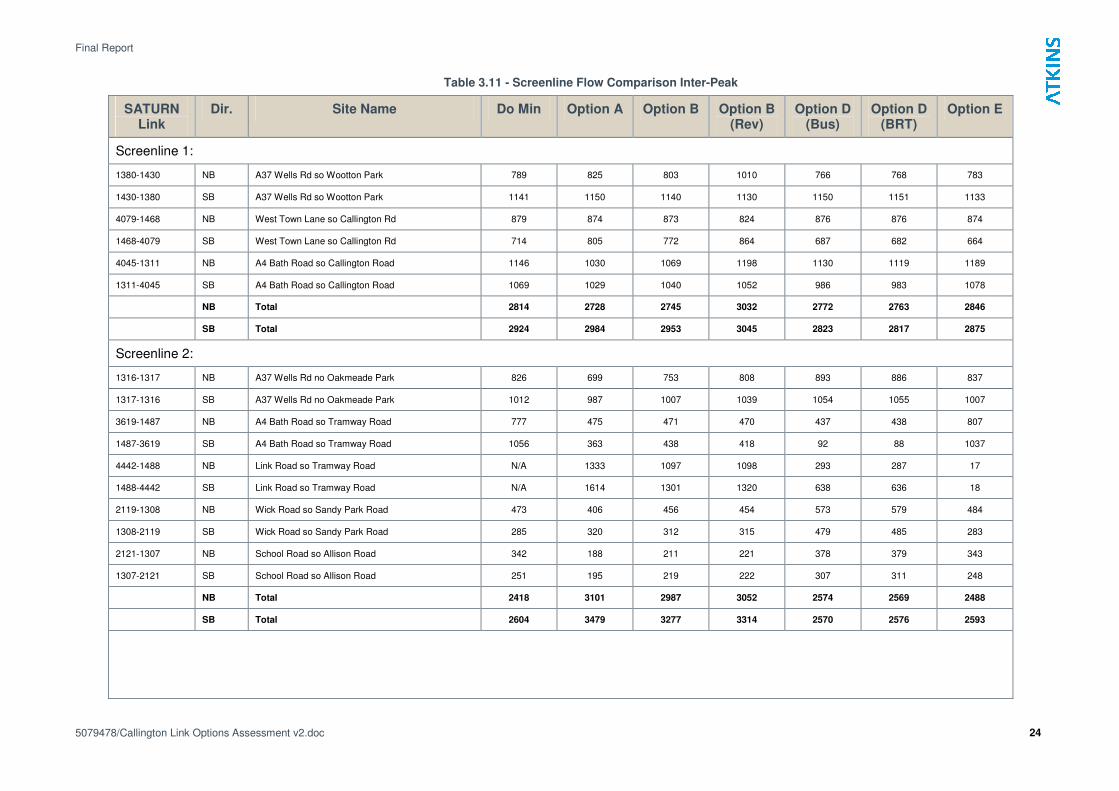
Table 3.11 - Screenline Flow Comparison Inter-Peak
SATURN Link
Dir. Site Name Do Min Option A Option B Option B (Rev)
Option D (Bus)
Option D (BRT)
Option E
Screenline 1:
1380-1430 NB A37 Wells Rd so Wootton Park 789 825 803 1010 766 768 783
1430-1380 SB A37 Wells Rd so Wootton Park 1141 1150 1140 1130 1150 1151 1133
4079-1468 NB West Town Lane so Callington Rd 879 874 873 824 876 876 874
1468-4079 SB West Town Lane so Callington Rd 714 805 772 864 687 682 664
4045-1311 NB A4 Bath Road so Callington Road 1146 1030 1069 1198 1130 1119 1189
1311-4045 SB A4 Bath Road so Callington Road 1069 1029 1040 1052 986 983 1078
NB Total 2814 2728 2745 3032 2772 2763 2846
SB Total 2924 2984 2953 3045 2823 2817 2875
Screenline 2:
1316-1317 NB A37 Wells Rd no Oakmeade Park 826 699 753 808 893 886 837
1317-1316 SB A37 Wells Rd no Oakmeade Park 1012 987 1007 1039 1054 1055 1007
3619-1487 NB A4 Bath Road so Tramway Road 777 475 471 470 437 438 807
1487-3619 SB A4 Bath Road so Tramway Road 1056 363 438 418 92 88 1037
4442-1488 NB Link Road so Tramway Road N/A 1333 1097 1098 293 287 17
1488-4442 SB Link Road so Tramway Road N/A 1614 1301 1320 638 636 18
2119-1308 NB Wick Road so Sandy Park Road 473 406 456 454 573 579 484
1308-2119 SB Wick Road so Sandy Park Road 285 320 312 315 479 485 283
2121-1307 NB School Road so Allison Road 342 188 211 221 378 379 343
1307-2121 SB School Road so Allison Road 251 195 219 222 307 311 248
NB Total 2418 3101 2987 3052 2574 2569 2488
SB Total 2604 3479 3277 3314 2570 2576 2593
Final Report
5079478/Callington Link Options Assessment v2.doc 25
SATURN Link
Dir. Site Name Do Min Option A Option B Option B (Rev)
Option D (Bus)
Option D (BRT)
Option E
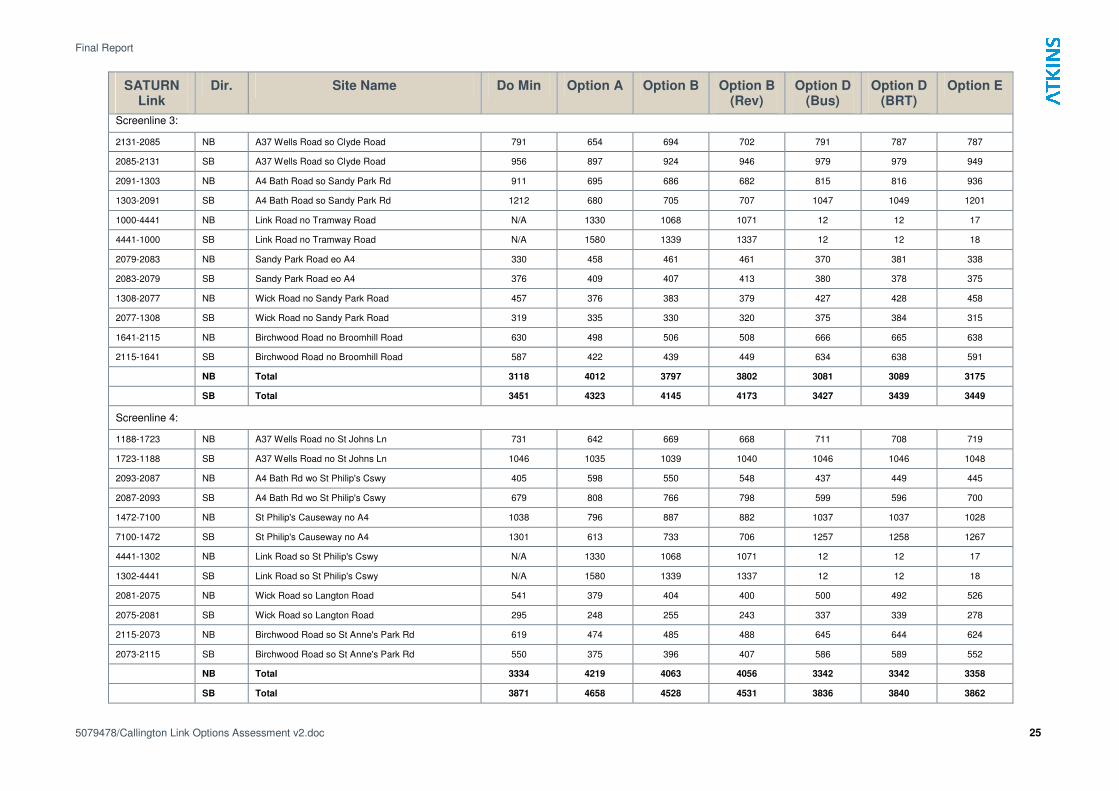
Screenline 3:
2131-2085 NB A37 Wells Road so Clyde Road 791 654 694 702 791 787 787
2085-2131 SB A37 Wells Road so Clyde Road 956 897 924 946 979 979 949
2091-1303 NB A4 Bath Road so Sandy Park Rd 911 695 686 682 815 816 936
1303-2091 SB A4 Bath Road so Sandy Park Rd 1212 680 705 707 1047 1049 1201
1000-4441 NB Link Road no Tramway Road N/A 1330 1068 1071 12 12 17
4441-1000 SB Link Road no Tramway Road N/A 1580 1339 1337 12 12 18
2079-2083 NB Sandy Park Road eo A4 330 458 461 461 370 381 338
2083-2079 SB Sandy Park Road eo A4 376 409 407 413 380 378 375
1308-2077 NB Wick Road no Sandy Park Road 457 376 383 379 427 428 458
2077-1308 SB Wick Road no Sandy Park Road 319 335 330 320 375 384 315
1641-2115 NB Birchwood Road no Broomhill Road 630 498 506 508 666 665 638
2115-1641 SB Birchwood Road no Broomhill Road 587 422 439 449 634 638 591
NB Total 3118 4012 3797 3802 3081 3089 3175
SB Total 3451 4323 4145 4173 3427 3439 3449
Screenline 4:
1188-1723 NB A37 Wells Road no St Johns Ln 731 642 669 668 711 708 719
1723-1188 SB A37 Wells Road no St Johns Ln 1046 1035 1039 1040 1046 1046 1048
2093-2087 NB A4 Bath Rd wo St Philip's Cswy 405 598 550 548 437 449 445
2087-2093 SB A4 Bath Rd wo St Philip's Cswy 679 808 766 798 599 596 700
1472-7100 NB St Philip's Causeway no A4 1038 796 887 882 1037 1037 1028
7100-1472 SB St Philip's Causeway no A4 1301 613 733 706 1257 1258 1267
4441-1302 NB Link Road so St Philip's Cswy N/A 1330 1068 1071 12 12 17
1302-4441 SB Link Road so St Philip's Cswy N/A 1580 1339 1337 12 12 18
2081-2075 NB Wick Road so Langton Road 541 379 404 400 500 492 526
2075-2081 SB Wick Road so Langton Road 295 248 255 243 337 339 278
2115-2073 NB Birchwood Road so St Anne's Park Rd 619 474 485 488 645 644 624
2073-2115 SB Birchwood Road so St Anne's Park Rd 550 375 396 407 586 589 552
NB Total 3334 4219 4063 4056 3342 3342 3358
SB Total 3871 4658 4528 4531 3836 3840 3862
Final Report
5079478/Callington Link Options Assessment v2.doc 26
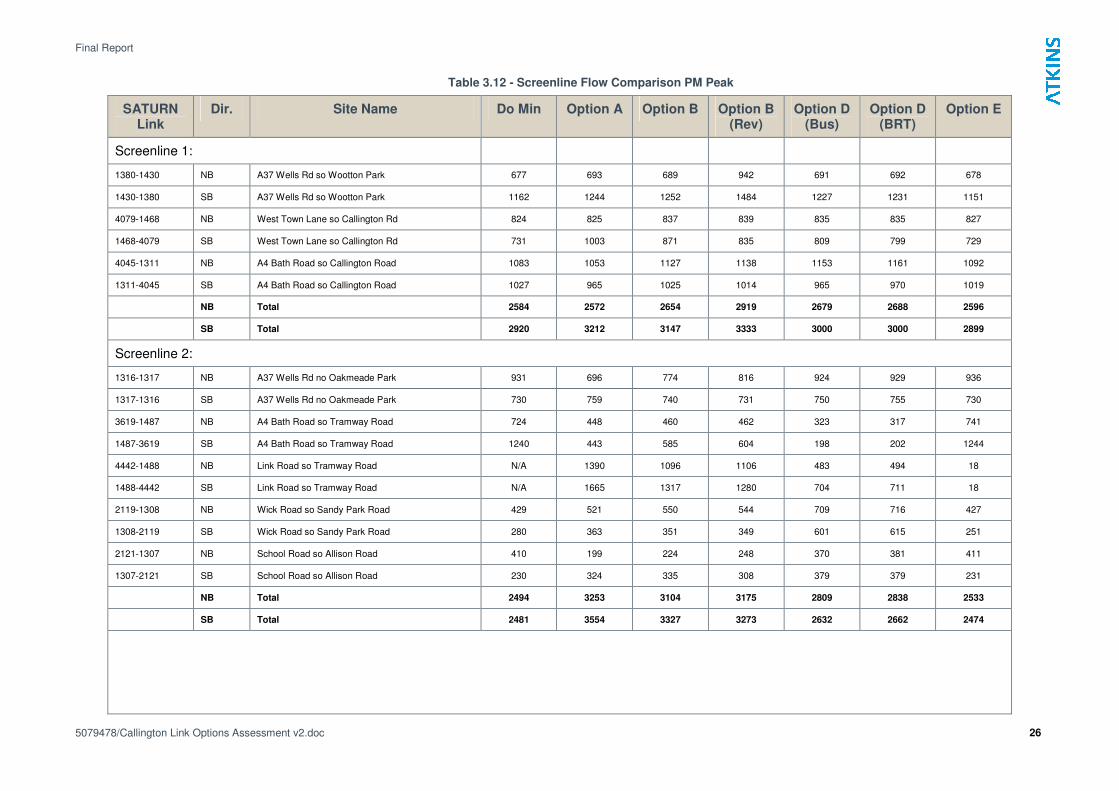
Table 3.12 - Screenline Flow Comparison PM Peak
SATURN Link
Dir. Site Name Do Min Option A Option B Option B (Rev)
Option D (Bus)
Option D (BRT)
Option E
Screenline 1:
1380-1430 NB A37 Wells Rd so Wootton Park 677 693 689 942 691 692 678
1430-1380 SB A37 Wells Rd so Wootton Park 1162 1244 1252 1484 1227 1231 1151
4079-1468 NB West Town Lane so Callington Rd 824 825 837 839 835 835 827
1468-4079 SB West Town Lane so Callington Rd 731 1003 871 835 809 799 729
4045-1311 NB A4 Bath Road so Callington Road 1083 1053 1127 1138 1153 1161 1092
1311-4045 SB A4 Bath Road so Callington Road 1027 965 1025 1014 965 970 1019
NB Total 2584 2572 2654 2919 2679 2688 2596
SB Total 2920 3212 3147 3333 3000 3000 2899
Screenline 2:
1316-1317 NB A37 Wells Rd no Oakmeade Park 931 696 774 816 924 929 936
1317-1316 SB A37 Wells Rd no Oakmeade Park 730 759 740 731 750 755 730
3619-1487 NB A4 Bath Road so Tramway Road 724 448 460 462 323 317 741
1487-3619 SB A4 Bath Road so Tramway Road 1240 443 585 604 198 202 1244
4442-1488 NB Link Road so Tramway Road N/A 1390 1096 1106 483 494 18
1488-4442 SB Link Road so Tramway Road N/A 1665 1317 1280 704 711 18
2119-1308 NB Wick Road so Sandy Park Road 429 521 550 544 709 716 427
1308-2119 SB Wick Road so Sandy Park Road 280 363 351 349 601 615 251
2121-1307 NB School Road so Allison Road 410 199 224 248 370 381 411
1307-2121 SB School Road so Allison Road 230 324 335 308 379 379 231
NB Total 2494 3253 3104 3175 2809 2838 2533
SB Total 2481 3554 3327 3273 2632 2662 2474
Final Report
5079478/Callington Link Options Assessment v2.doc 27
SATURN Link
Dir. Site Name Do Min Option A Option B Option B (Rev)
Option D (Bus)
Option D (BRT)
Option E
Screenline 3:
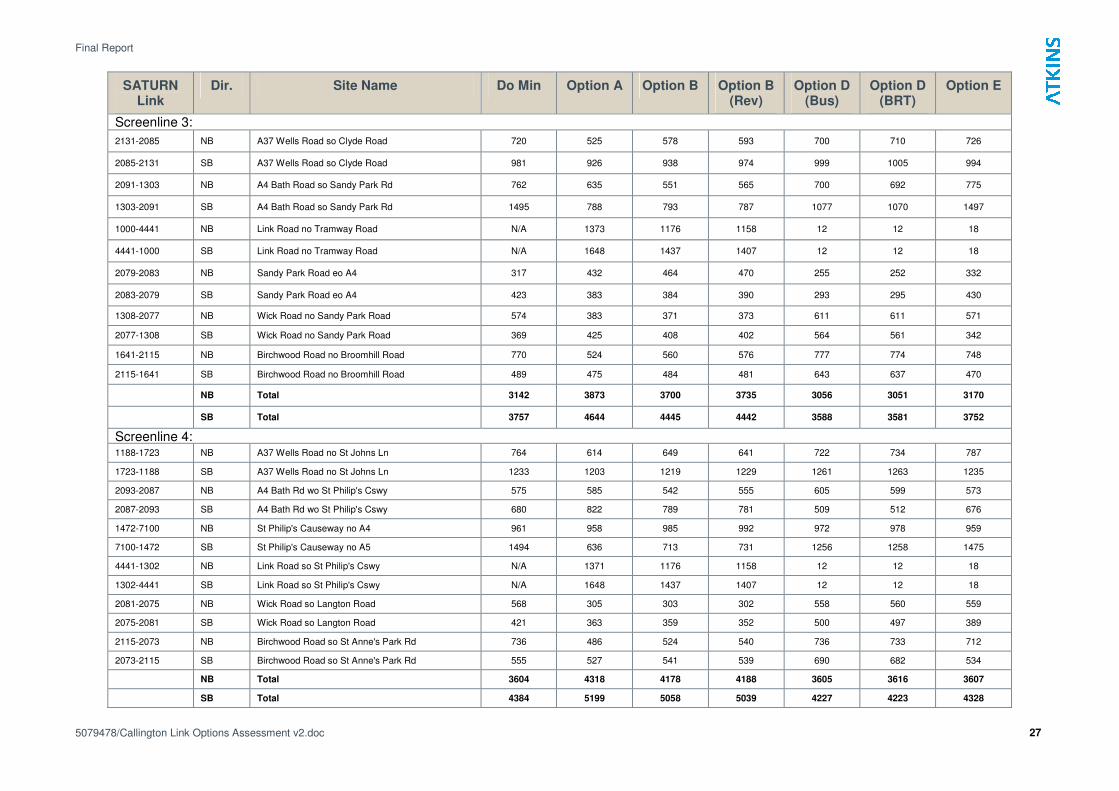
2131-2085 NB A37 Wells Road so Clyde Road 720 525 578 593 700 710 726
2085-2131 SB A37 Wells Road so Clyde Road 981 926 938 974 999 1005 994
2091-1303 NB A4 Bath Road so Sandy Park Rd 762 635 551 565 700 692 775
1303-2091 SB A4 Bath Road so Sandy Park Rd 1495 788 793 787 1077 1070 1497
1000-4441 NB Link Road no Tramway Road N/A 1373 1176 1158 12 12 18
4441-1000 SB Link Road no Tramway Road N/A 1648 1437 1407 12 12 18
2079-2083 NB Sandy Park Road eo A4 317 432 464 470 255 252 332
2083-2079 SB Sandy Park Road eo A4 423 383 384 390 293 295 430
1308-2077 NB Wick Road no Sandy Park Road 574 383 371 373 611 611 571
2077-1308 SB Wick Road no Sandy Park Road 369 425 408 402 564 561 342
1641-2115 NB Birchwood Road no Broomhill Road 770 524 560 576 777 774 748
2115-1641 SB Birchwood Road no Broomhill Road 489 475 484 481 643 637 470
NB Total 3142 3873 3700 3735 3056 3051 3170
SB Total 3757 4644 4445 4442 3588 3581 3752
Screenline 4: 1188-1723 NB A37 Wells Road no St Johns Ln 764 614 649 641 722 734 787
1723-1188 SB A37 Wells Road no St Johns Ln 1233 1203 1219 1229 1261 1263 1235
2093-2087 NB A4 Bath Rd wo St Philip's Cswy 575 585 542 555 605 599 573
2087-2093 SB A4 Bath Rd wo St Philip's Cswy 680 822 789 781 509 512 676
1472-7100 NB St Philip's Causeway no A4 961 958 985 992 972 978 959
7100-1472 SB St Philip's Causeway no A5 1494 636 713 731 1256 1258 1475
4441-1302 NB Link Road so St Philip's Cswy N/A 1371 1176 1158 12 12 18
1302-4441 SB Link Road so St Philip's Cswy N/A 1648 1437 1407 12 12 18
2081-2075 NB Wick Road so Langton Road 568 305 303 302 558 560 559
2075-2081 SB Wick Road so Langton Road 421 363 359 352 500 497 389
2115-2073 NB Birchwood Road so St Anne's Park Rd 736 486 524 540 736 733 712
2073-2115 SB Birchwood Road so St Anne's Park Rd 555 527 541 539 690 682 534
NB Total 3604 4318 4178 4188 3605 3616 3607
SB Total 4384 5199 5058 5039 4227 4223 4328
Final Report
5079478/Callington Link Options Assessment v2.doc 28
Morning Peak
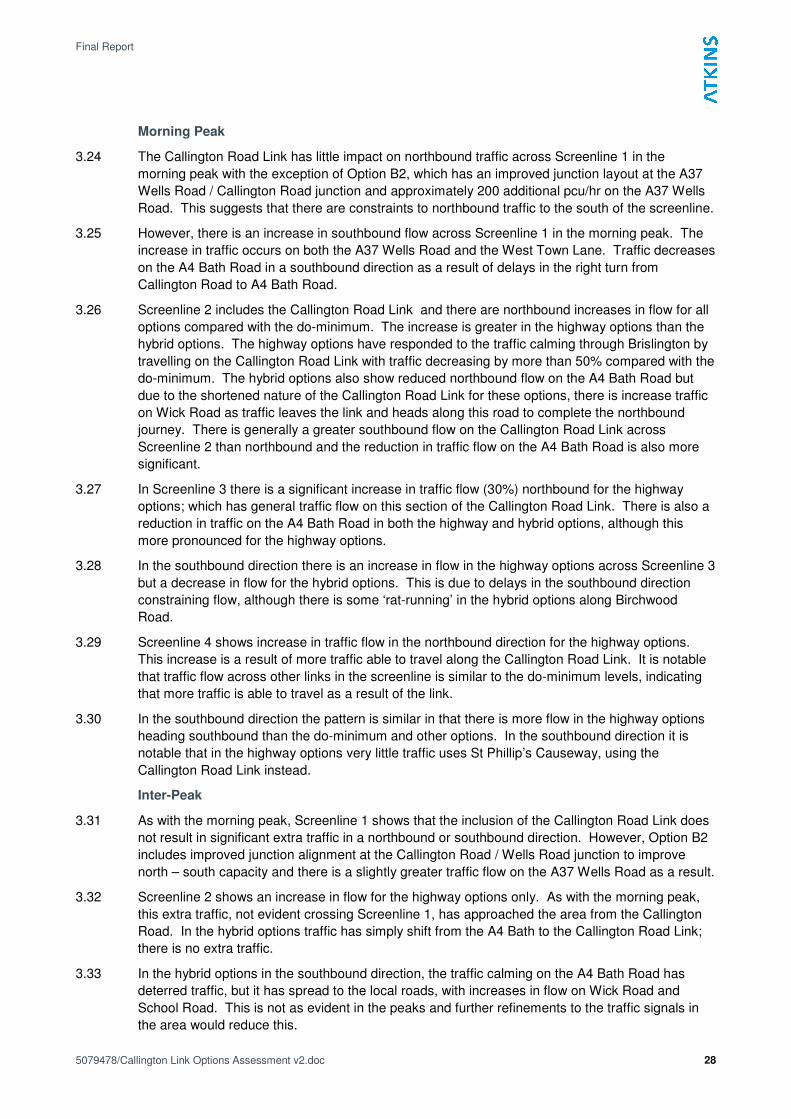
3.24 The Callington Road Link has little impact on northbound traffic across Screenline 1 in the
morning peak with the exception of Option B2, which has an improved junction layout at the A37
Wells Road / Callington Road junction and approximately 200 additional pcu/hr on the A37 Wells
Road. This suggests that there are constraints to northbound traffic to the south of the screenline.
3.25 However, there is an increase in southbound flow across Screenline 1 in the morning peak. The
increase in traffic occurs on both the A37 Wells Road and the West Town Lane. Traffic decreases
on the A4 Bath Road in a southbound direction as a result of delays in the right turn from
Callington Road to A4 Bath Road.
3.26 Screenline 2 includes the Callington Road Link and there are northbound increases in flow for all
options compared with the do-minimum. The increase is greater in the highway options than the
hybrid options. The highway options have responded to the traffic calming through Brislington by
travelling on the Callington Road Link with traffic decreasing by more than 50% compared with the
do-minimum. The hybrid options also show reduced northbound flow on the A4 Bath Road but
due to the shortened nature of the Callington Road Link for these options, there is increase traffic
on Wick Road as traffic leaves the link and heads along this road to complete the northbound
journey. There is generally a greater southbound flow on the Callington Road Link across
Screenline 2 than northbound and the reduction in traffic flow on the A4 Bath Road is also more
significant.
3.27 In Screenline 3 there is a significant increase in traffic flow (30%) northbound for the highway
options; which has general traffic flow on this section of the Callington Road Link. There is also a
reduction in traffic on the A4 Bath Road in both the highway and hybrid options, although this
more pronounced for the highway options.
3.28 In the southbound direction there is an increase in flow in the highway options across Screenline 3
but a decrease in flow for the hybrid options. This is due to delays in the southbound direction
constraining flow, although there is some ‘rat-running’ in the hybrid options along Birchwood
Road.
3.29 Screenline 4 shows increase in traffic flow in the northbound direction for the highway options.
This increase is a result of more traffic able to travel along the Callington Road Link. It is notable
that traffic flow across other links in the screenline is similar to the do-minimum levels, indicating
that more traffic is able to travel as a result of the link.
3.30 In the southbound direction the pattern is similar in that there is more flow in the highway options
heading southbound than the do-minimum and other options. In the southbound direction it is
notable that in the highway options very little traffic uses St Phillip’s Causeway, using the
Callington Road Link instead.
Inter-Peak
3.31 As with the morning peak, Screenline 1 shows that the inclusion of the Callington Road Link does
not result in significant extra traffic in a northbound or southbound direction. However, Option B2
includes improved junction alignment at the Callington Road / Wells Road junction to improve
north – south capacity and there is a slightly greater traffic flow on the A37 Wells Road as a result.
3.32 Screenline 2 shows an increase in flow for the highway options only. As with the morning peak,
this extra traffic, not evident crossing Screenline 1, has approached the area from the Callington
Road. In the hybrid options traffic has simply shift from the A4 Bath to the Callington Road Link;
there is no extra traffic.
3.33 In the hybrid options in the southbound direction, the traffic calming on the A4 Bath Road has
deterred traffic, but it has spread to the local roads, with increases in flow on Wick Road and
School Road. This is not as evident in the peaks and further refinements to the traffic signals in
the area would reduce this.
Final Report
5079478/Callington Link Options Assessment v2.doc 29
3.34 Screenline 3 shows approximately 30% more flow in the highway options than the do-minimum
and Options D and E. Again, there is little change in the traffic flow on the A37 Wells Road but
still a significant decrease in flow on the A4 Bath Road, especially southbound where the traffic
signals at Tramway Road junction deter traffic.
3.35 Screenline 4 also shows a 40%-50% increase in traffic flow in southbound and northbound
directions respectively for the highway options when compared against the do-minimum. This is
largely due to extra traffic on the link whilst flows on other roads remain at roughly do-minimum
levels, although flow does increase in the A4 Bath Road slightly. It is noticeable however, that
traffic flow is lower on Wick Road and Birchwood Road for the highway options than the hybrid
and public transport options.
Evening Peak
3.36 In the evening peak, Screenline 1 again shows that, with the exception of Option B, the presence
of the Callington Road Link does not result in significant extra traffic in a northbound direction.
The southbound flow remains the dominant movement throughout the day and there are slight
increases in flow on the A37 Wells Road and West Town Lane in the highway and hybrid options
in the southbound direction.
3.37 Screenline 2 shows significant increase in flow for the highway options but only a marginal
increase in flow in the hybrid options. Traffic flow reduces on the A37 Wells Road in the highway
options in the northbound direction but not the other options. Again, Screenline 2 shows that
there are notable decreases in northbound and southbound traffic A4 Bath Road. There is a
notable increase in flow on Wick Road in the hybrid options in both directions.
3.38 Again, Screenline 3 shows more flow in the highway options than the do-minimum and Options D
and E in both directions. There is a slight increase in northbound traffic on Sandy Park Road in
the highway options.
3.39 Screenline 4 also similar results to the morning peak, with more traffic in the highway options and
no change in the hybrid options. The principle difference between the morning peak and evening
peak is that more traffic uses St Phillip’s Causeway in the evening peak.
Screenline Summary
3.40 This analysis shows that the Callington Road Link is providing additional capacity for movements
in the south east of Bristol and thus facilitating more traffic flowing through the area. The link
removes pressure on A4 Bath Road / Sandy Park Road Junction and generally encourages traffic
on to more appropriate routes.
3.41 The full length Callington Road Link relieves some pressure off the A4 Bath Road where traffic
signals are set at Tramway Road Junction and also some pressure off distributor roads to the east
of the A4.
3.42 The hybrid and public transport options do not provide the same capacity benefits as the highway
options, and they do not provide as much relief to the roads to the east of the A4.
3.43 It is evident that the settings of various traffic signals in the study area significantly affects traffic
flow and routing. The traffic signals on Tramway Junction is typical of how sensitive the setting of
signals are to delays and routeing. These signals have been used to deter traffic from the A4
through Brislington but do result in additional delays; although further optimisation of the traffic
signals and existing junction layouts will affect the network performance and economic appraisal.
Journey Time Analysis
3.44 A review of journey times on the key routes in the study area is another way of identifying the
impact of the scheme, particularly benefits to road users and potential reductions in public
transport journey times. Three routes were specified by BCC and are shown in Figure 3.3:
Final Report
5079478/Callington Link Options Assessment v2.doc 30
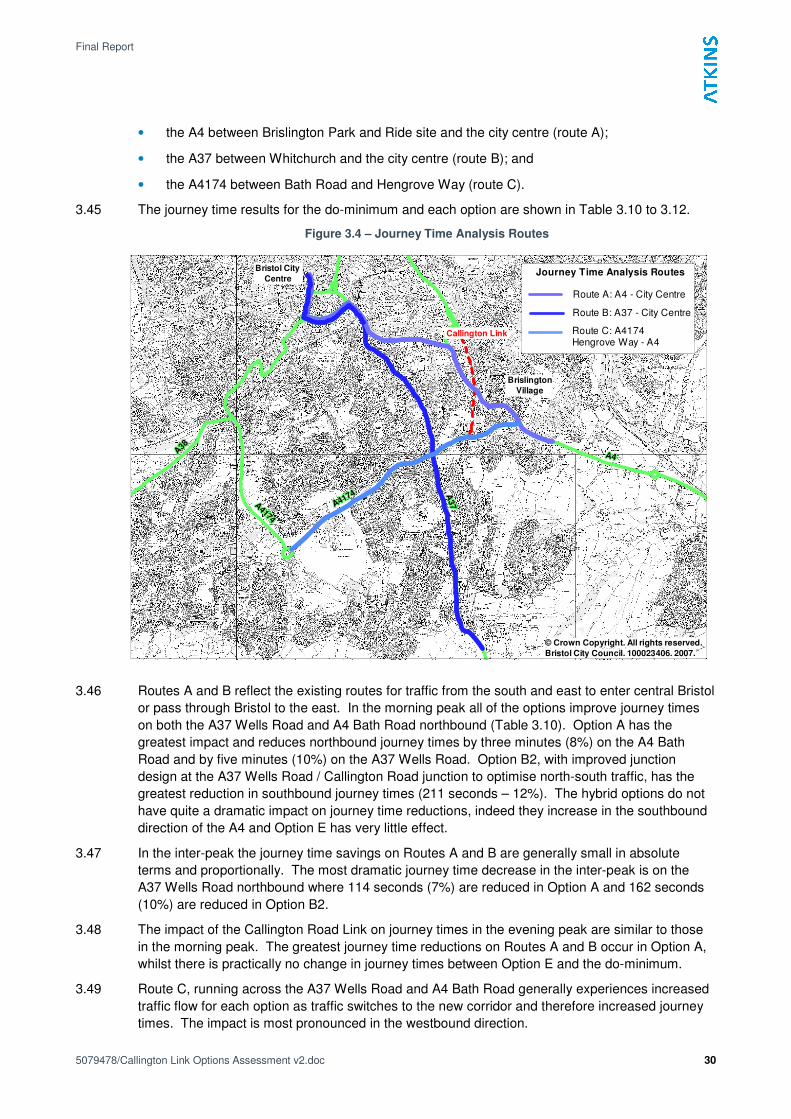
• the A4 between Brislington Park and Ride site and the city centre (route A);
• the A37 between Whitchurch and the city centre (route B); and
• the A4174 between Bath Road and Hengrove Way (route C).
3.45 The journey time results for the do-minimum and each option are shown in Table 3.10 to 3.12.
Figure 3.4 – Journey Time Analysis Routes
A4A4A4A4A4A4A4A4A4A4A4A4A4A4A4A4A4A4A4A4A4A4A4A4A4
Brislington Vill age
A37
A37
A37
A37
A37
A37
A37
A37
A37
A37
A37
A37
A37
A37
A37
A37
A37
A37
A37
A37
A37
A37
A37
A37
A37A4174
A4174
A4174
A4174
A4174A4174
A4174
A4174
A4174
A4174A4174
A4174
A4174
A4174A4174
A4174
A4174
A4174
A4174A4174
A4174
A4174
A4174
A4174A4174
A4174
A4174
A4174
A4174
A4174
A4174
A4174
A4174
A4174
A4174
A4174
A4174
A4174
A4174
A4174
A4174
A4174
A4174
A4174
A4174
A4174
A4174
A4174
A4174
A4174
A38
A38
A38
A38
A38A38
A38
A38
A38
A38A38
A38
A38
A38A38
A38
A38
A38
A38A38
A38
A38
A38
A38A38
Journey Time Analysis Routes
Route A: A4 - City Centre
Route C: A4174Hengrove Way - A4
Route B: A37 - City Centre
© Crown Copyright. All rights reserved.
Bristol City Council. 100023406. 2007.
Callington Link
Bristol City
Centre
Brislington
Village
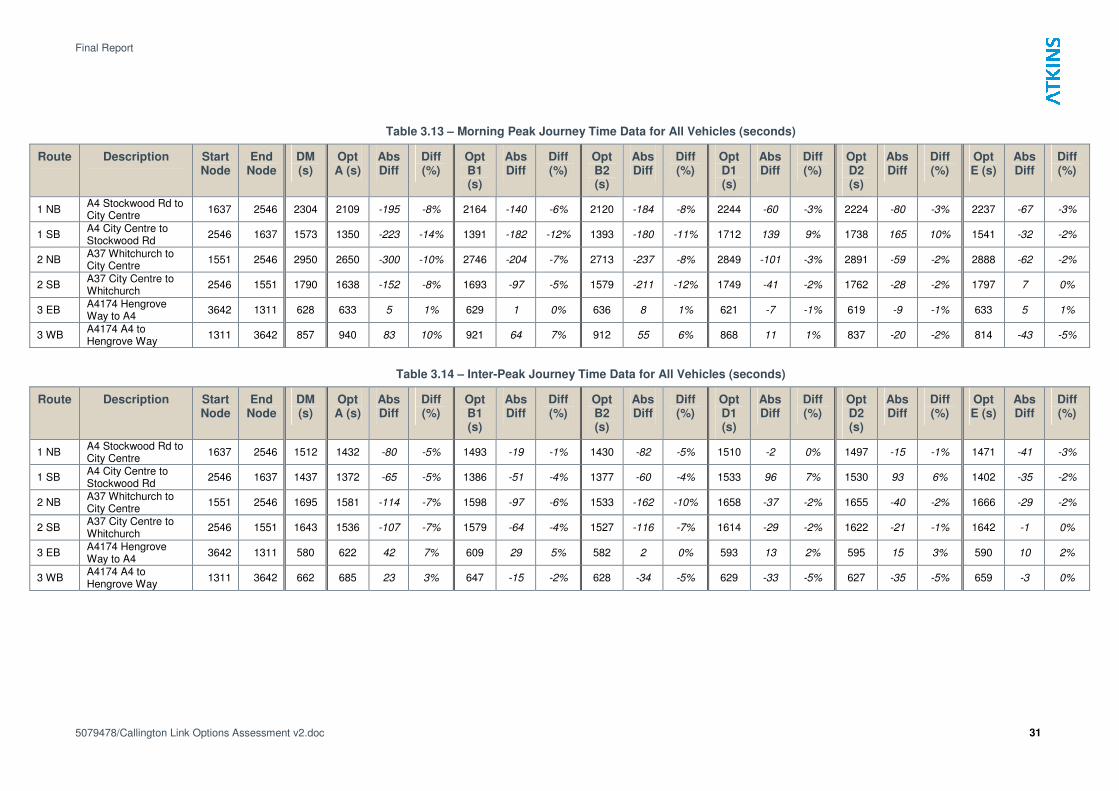
3.46 Routes A and B reflect the existing routes for traffic from the south and east to enter central Bristol
or pass through Bristol to the east. In the morning peak all of the options improve journey times
on both the A37 Wells Road and A4 Bath Road northbound (Table 3.10). Option A has the
greatest impact and reduces northbound journey times by three minutes (8%) on the A4 Bath
Road and by five minutes (10%) on the A37 Wells Road. Option B2, with improved junction
design at the A37 Wells Road / Callington Road junction to optimise north-south traffic, has the
greatest reduction in southbound journey times (211 seconds – 12%). The hybrid options do not
have quite a dramatic impact on journey time reductions, indeed they increase in the southbound
direction of the A4 and Option E has very little effect.
3.47 In the inter-peak the journey time savings on Routes A and B are generally small in absolute
terms and proportionally. The most dramatic journey time decrease in the inter-peak is on the
A37 Wells Road northbound where 114 seconds (7%) are reduced in Option A and 162 seconds
(10%) are reduced in Option B2.
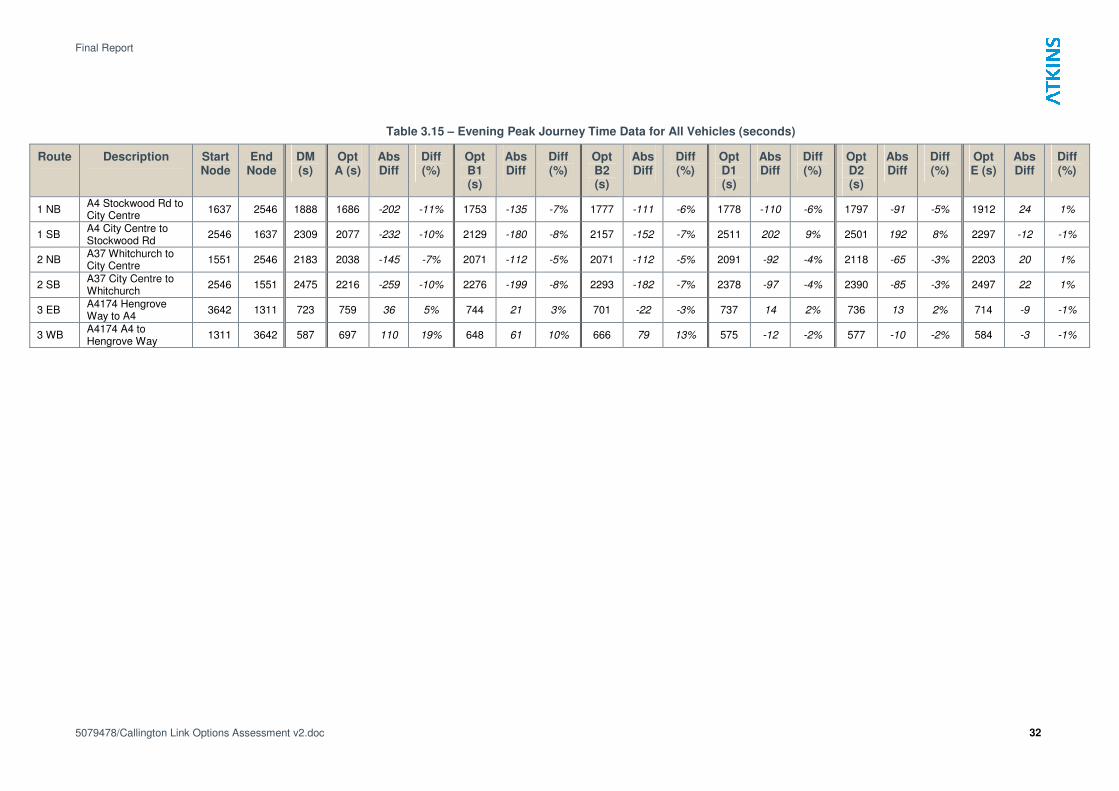
3.48 The impact of the Callington Road Link on journey times in the evening peak are similar to those
in the morning peak. The greatest journey time reductions on Routes A and B occur in Option A,
whilst there is practically no change in journey times between Option E and the do-minimum.
3.49 Route C, running across the A37 Wells Road and A4 Bath Road generally experiences increased
traffic flow for each option as traffic switches to the new corridor and therefore increased journey
times. The impact is most pronounced in the westbound direction.
Final Report
5079478/Callington Link Options Assessment v2.doc 31
Table 3.13 – Morning Peak Journey Time Data for All Vehicles (seconds)
Route Description Start Node
End Node
DM (s)
Opt A (s)
Abs Diff
Diff (%)
Opt B1 (s)
Abs Diff
Diff (%)
Opt B2 (s)
Abs Diff
Diff (%)
Opt D1 (s)
Abs Diff
Diff (%)
Opt D2 (s)
Abs Diff
Diff (%)
Opt E (s)
Abs Diff
Diff (%)
1 NB A4 Stockwood Rd to City Centre
1637 2546 2304 2109 -195 -8% 2164 -140 -6% 2120 -184 -8% 2244 -60 -3% 2224 -80 -3% 2237 -67 -3%
1 SB A4 City Centre to Stockwood Rd
2546 1637 1573 1350 -223 -14% 1391 -182 -12% 1393 -180 -11% 1712 139 9% 1738 165 10% 1541 -32 -2%
2 NB A37 Whitchurch to City Centre
1551 2546 2950 2650 -300 -10% 2746 -204 -7% 2713 -237 -8% 2849 -101 -3% 2891 -59 -2% 2888 -62 -2%
2 SB A37 City Centre to Whitchurch
2546 1551 1790 1638 -152 -8% 1693 -97 -5% 1579 -211 -12% 1749 -41 -2% 1762 -28 -2% 1797 7 0%
3 EB A4174 Hengrove Way to A4
3642 1311 628 633 5 1% 629 1 0% 636 8 1% 621 -7 -1% 619 -9 -1% 633 5 1%
3 WB A4174 A4 to Hengrove Way
1311 3642 857 940 83 10% 921 64 7% 912 55 6% 868 11 1% 837 -20 -2% 814 -43 -5%
Table 3.14 – Inter-Peak Journey Time Data for All Vehicles (seconds)
Route Description Start Node
End Node
DM (s)
Opt A (s)
Abs Diff
Diff (%)
Opt B1 (s)
Abs Diff
Diff (%)
Opt B2 (s)
Abs Diff
Diff (%)
Opt D1 (s)
Abs Diff
Diff (%)
Opt D2 (s)
Abs Diff
Diff (%)
Opt E (s)
Abs Diff
Diff (%)
1 NB A4 Stockwood Rd to City Centre
1637 2546 1512 1432 -80 -5% 1493 -19 -1% 1430 -82 -5% 1510 -2 0% 1497 -15 -1% 1471 -41 -3%
1 SB A4 City Centre to Stockwood Rd
2546 1637 1437 1372 -65 -5% 1386 -51 -4% 1377 -60 -4% 1533 96 7% 1530 93 6% 1402 -35 -2%
2 NB A37 Whitchurch to City Centre
1551 2546 1695 1581 -114 -7% 1598 -97 -6% 1533 -162 -10% 1658 -37 -2% 1655 -40 -2% 1666 -29 -2%
2 SB A37 City Centre to Whitchurch
2546 1551 1643 1536 -107 -7% 1579 -64 -4% 1527 -116 -7% 1614 -29 -2% 1622 -21 -1% 1642 -1 0%
3 EB A4174 Hengrove Way to A4
3642 1311 580 622 42 7% 609 29 5% 582 2 0% 593 13 2% 595 15 3% 590 10 2%
3 WB A4174 A4 to Hengrove Way
1311 3642 662 685 23 3% 647 -15 -2% 628 -34 -5% 629 -33 -5% 627 -35 -5% 659 -3 0%
Final Report
5079478/Callington Link Options Assessment v2.doc 32
Table 3.15 – Evening Peak Journey Time Data for All Vehicles (seconds)
Route Description Start Node
End Node
DM (s)
Opt A (s)
Abs Diff
Diff (%)
Opt B1 (s)
Abs Diff
Diff (%)
Opt B2 (s)
Abs Diff
Diff (%)
Opt D1 (s)
Abs Diff
Diff (%)
Opt D2 (s)
Abs Diff
Diff (%)
Opt E (s)
Abs Diff
Diff (%)
1 NB A4 Stockwood Rd to City Centre
1637 2546 1888 1686 -202 -11% 1753 -135 -7% 1777 -111 -6% 1778 -110 -6% 1797 -91 -5% 1912 24 1%
1 SB A4 City Centre to Stockwood Rd
2546 1637 2309 2077 -232 -10% 2129 -180 -8% 2157 -152 -7% 2511 202 9% 2501 192 8% 2297 -12 -1%
2 NB A37 Whitchurch to City Centre
1551 2546 2183 2038 -145 -7% 2071 -112 -5% 2071 -112 -5% 2091 -92 -4% 2118 -65 -3% 2203 20 1%
2 SB A37 City Centre to Whitchurch
2546 1551 2475 2216 -259 -10% 2276 -199 -8% 2293 -182 -7% 2378 -97 -4% 2390 -85 -3% 2497 22 1%
3 EB A4174 Hengrove Way to A4
3642 1311 723 759 36 5% 744 21 3% 701 -22 -3% 737 14 2% 736 13 2% 714 -9 -1%
3 WB A4174 A4 to Hengrove Way
1311 3642 587 697 110 19% 648 61 10% 666 79 13% 575 -12 -2% 577 -10 -2% 584 -3 -1%
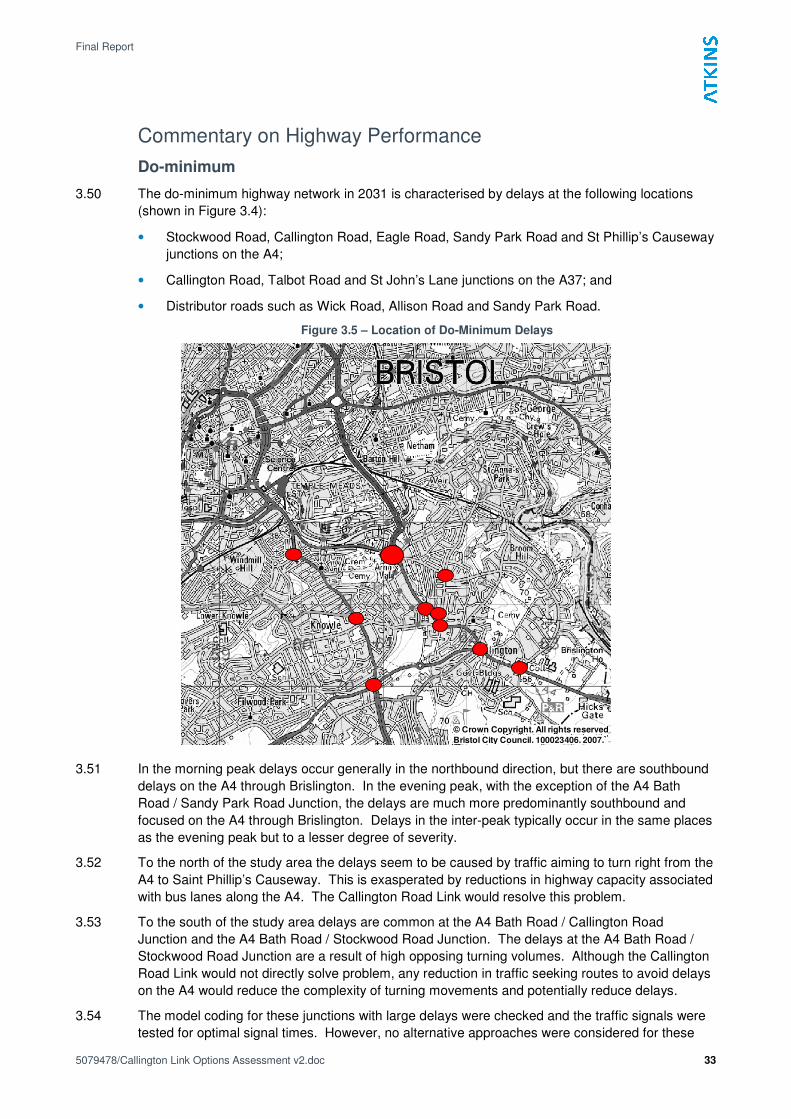
Final Report
5079478/Callington Link Options Assessment v2.doc 33
Commentary on Highway Performance
Do-minimum
3.50 The do-minimum highway network in 2031 is characterised by delays at the following locations
(shown in Figure 3.4):
• Stockwood Road, Callington Road, Eagle Road, Sandy Park Road and St Phillip’s Causeway
junctions on the A4;
• Callington Road, Talbot Road and St John’s Lane junctions on the A37; and
• Distributor roads such as Wick Road, Allison Road and Sandy Park Road.
Figure 3.5 – Location of Do-Minimum Delays
© Crown Copyright. All rights reserved.
Bristol City Council. 100023406. 2007.
3.51 In the morning peak delays occur generally in the northbound direction, but there are southbound
delays on the A4 through Brislington. In the evening peak, with the exception of the A4 Bath
Road / Sandy Park Road Junction, the delays are much more predominantly southbound and
focused on the A4 through Brislington. Delays in the inter-peak typically occur in the same places
as the evening peak but to a lesser degree of severity.
3.52 To the north of the study area the delays seem to be caused by traffic aiming to turn right from the
A4 to Saint Phillip’s Causeway. This is exasperated by reductions in highway capacity associated
with bus lanes along the A4. The Callington Road Link would resolve this problem.
3.53 To the south of the study area delays are common at the A4 Bath Road / Callington Road
Junction and the A4 Bath Road / Stockwood Road Junction. The delays at the A4 Bath Road /
Stockwood Road Junction are a result of high opposing turning volumes. Although the Callington
Road Link would not directly solve problem, any reduction in traffic seeking routes to avoid delays
on the A4 would reduce the complexity of turning movements and potentially reduce delays.
3.54 The model coding for these junctions with large delays were checked and the traffic signals were
tested for optimal signal times. However, no alternative approaches were considered for these

Final Report
5079478/Callington Link Options Assessment v2.doc 34
junctions and whilst it may be possible to reduce some or all of the delays at these junctions
without the addition of the Callington Road Link. It was outside of the scope of this commission to
investigate this.
Highway Options (A, B1 & B2)
3.55 The analysis above, and plots showing the difference between each option and the do-minimum
(Appendix B) demonstrates that the highway options make a significant contribution towards
reducing delays at the A4 Bath Road / Sandy Park Road Junction, reducing congestion through
Brislington and also reducing traffic levels on distributor roads to the east of the A4.
3.56 The introduction of the Callington Road Link as an option for traffic travelling north or south via St
Phillip’s Causeway reduced delays at the A4 Bath Road / Sandy Park Road Junction.
3.57 To control congestion / flow through Brislington, traffic signals were set at the Callington Road
Link / Tramway Road Junction. The operation of the signal timings showed that the performance
of the junction was sensitive to the settings selected . The signals were set with the aim of
reducing traffic on the A4 south of Tramway Road junction to approximately half of the do-
minimum level. The junction is currently operating at capacity and any increase in green time will
result in extra traffic being drawn to this link.
3.58 Further refinement of the traffic signals in the corridor to control traffic on the Callington Road Link
and minimise traffic on other routes is recommended once a policy or more detailed objectives for
the corridor are determined.
3.59 The highway options principally differ only by the number of lanes on the Callington Road Link,
with Option A being dual carriageway and Option B being single carriageway. In order to attract
the maximum amount of users on to the Callington Road Link in Option A an additional dedicated
turning lane at each of the junctions along the stretch of the link (Callington Road, Tramway Road
and St Philip’s Causeway) was coded. However, the analysis has shown that there is not a
significant increase in demand along the link road as a result and that there may only be a finite
amount of demand for the link.
3.60 Both ends of the Callington Road have a significant impact upon the performance of the
Callington Road Link, particularly for southbound traffic. The performance of the Callington Road
Link in the southbound direction is sensitive to the performance of the Callington Road Link /
Callington Road Junction and ultimately the operation of the Callington Road junctions with the A4
and A37.
3.61 Option B2 includes an improved junction with the A37 Wells Road and Callington Road. The
operation of this improved junction in Option B2 was found to have a significant impact on the
usage of the link road. Designed to improve north-south movement along the A37 in option B2, it
slightly reduces traffic flow on the Callington Road Link due to the improved performance of the
A37 as a competing route. In a further test, with the signals at this junction were optimised to
reduce overall delay; and subsequently encourage east-west movement through this junction. It
was initially thought that the reduced delay to east-west traffic would encourage more flow onto
the Callington Road Link. However the flow on Callington Road Link decreased further
(particularly southbound) as the increase in flow on Callington Road across the Callington Road /
Callington Road Link junction increased delay for the flow exiting the link road at this point.
3.62 The Callington Road Link / St Philip’s Causeway Junction also experiences delay. In Option A
this junction was increased to three lanes for the Callington Road Link and St Phillip’s Causeway
arms to reduce delays but this was not necessary for Option B. Controlling flow on the Callington
Road Link will reduce the need for additional lanes at this location but may result in increased
delays elsewhere or increased flow on the A4.
3.63 Tests have been undertaken that considered closing access to the link via Bath Road, and also to
test the impact of demolishing Talbot Road bridge on the local network. These fixed demand
Final Report
5079478/Callington Link Options Assessment v2.doc 35
assignments were completed for the morning peak period only and have been compared against
the option B assignment. The effects are discussed below.
Removing the Tramway Road Junction
3.64 The closure of the intermediate junction at Tramway Road results in a reduction of flow on the
Link of 100 pcu/hour northbound and 165 pcu/hour southbound. This indicates that not all traffic
on the Link travels from one end to the other.
3.65 The removal of the Tramway Road junction also increases traffic flow on the A4 to approximately
300 pcu/hr northbound and 250 pcu/hr southbound. This is greater than the traffic displaced from
the link and is balanced by decreases in flows on ‘rat-running’ links such as Wick Road to the east
of the link road. This increase in the attractiveness of the A4 over other competing routes is due to
the reduction in delay caused by the removal of the Tramway road junction and its restrictive
signal settings.
3.66 Removing the junction at Tramway Road has the effect of slightly decreasing network travel time
and thus increasing network speed by 0.8%, although this may be as much a result of reducing
the restrictive signal settings on the A4 rather than a removing the Tramway Road junction.
Removing the Talbot Road Bridge
3.67 When the Talbot Road bridge link is removed from the network, those trips that exited the A4 onto
this link in the original option B assignment are now continuing along the A4 and exiting at
Kensington Park road and then onto Talbot road via Hampstead road to maintain their previous
route. This adds a lot of traffic on to this residential route.
3.68 The reverse – using Hampstead road to access the A4 from Talbot road – is also happening, but
to a lesser degree due to the Kensington Park road/Bath road junction being a ‘left in, left out’
junction. As a result there is increased flow on Callington Road heading east (to access the A4)
and also on the southern section of the northbound link road with trips exiting at Tramway road to
head south and subsequently use Wick road and other minor routes to the east of the link road.
3.69 Furthermore, there is a small reduction in flow on all other sections of the link road. For the
southbound trips this is most likely caused by an increase in delay at the exit onto Callington Road
due to the increase in eastbound flow on Callington road across the roundabout.
3.70 Removing the Talbot Road bridge has the effect of slightly increasing network travel time and
distance and thus reducing network speed by 0.8%.
Hybrid Options (D1 & D2)
3.71 The hybrid options (D1 and D2) do not provide direct highway comparisons between the highway
options (A1, B1 and B2) nor the public transport option (E) as they contain a different highway
network to the highway options and a different public transport service to the public transport
option. Therefore direct comparisons cannot be made between the different aspects of the hybrid
options and highway and public transport options.
3.72 The hybrid options provide some additional relief to traffic in the study area but the impact is not
as significant as the highway options and is focused to the southern end of the study area. In
effect, the hybrid options provide some small amount of additional capacity between Callington
Road and Tramway Road, thus resulting in more traffic arriving at the already congested A4 Bath
Road / Sandy Park junction.
3.73 However, improvements could be made to the A4 Bath Road / Callington Road junction to
encourage traffic on to the link and thus reduce traffic on the A4 through Brislington.
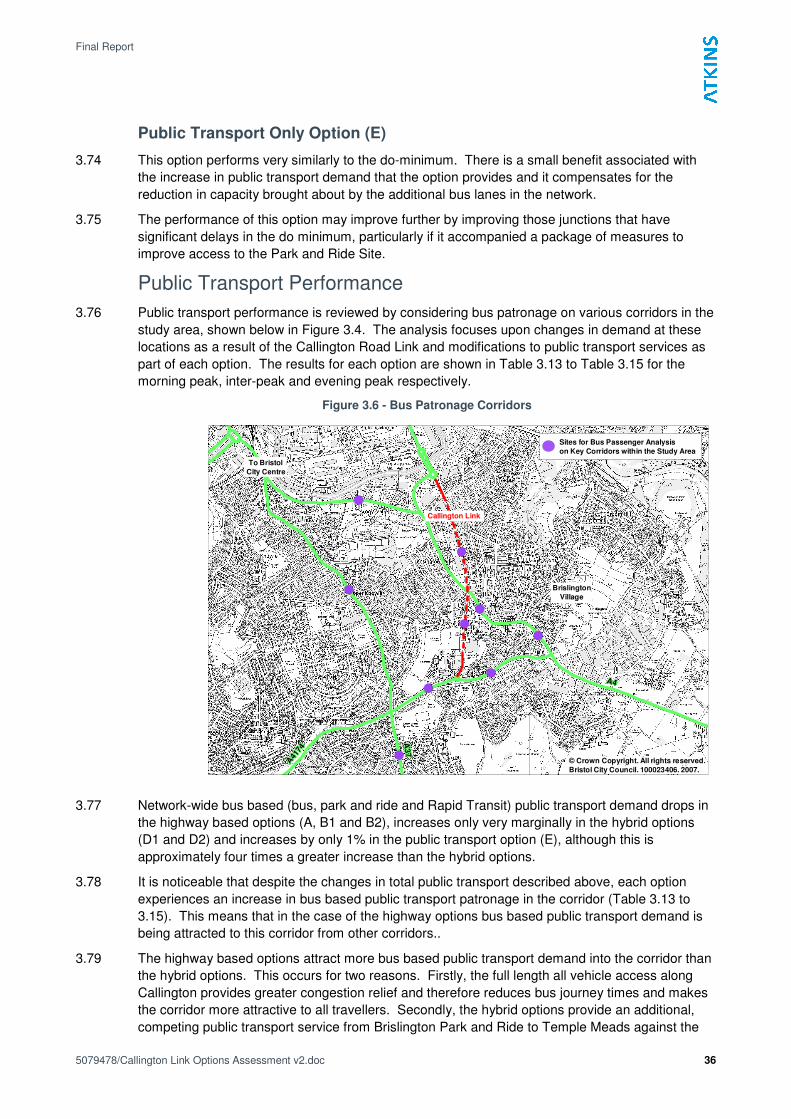
Final Report
5079478/Callington Link Options Assessment v2.doc 36
Public Transport Only Option (E)
3.74 This option performs very similarly to the do-minimum. There is a small benefit associated with
the increase in public transport demand that the option provides and it compensates for the
reduction in capacity brought about by the additional bus lanes in the network.
3.75 The performance of this option may improve further by improving those junctions that have
significant delays in the do minimum, particularly if it accompanied a package of measures to
improve access to the Park and Ride Site.
Public Transport Performance
3.76 Public transport performance is reviewed by considering bus patronage on various corridors in the
study area, shown below in Figure 3.4. The analysis focuses upon changes in demand at these
locations as a result of the Callington Road Link and modifications to public transport services as
part of each option. The results for each option are shown in Table 3.13 to Table 3.15 for the
morning peak, inter-peak and evening peak respectively.
Figure 3.6 - Bus Patronage Corridors
A4A4A4A4A4A4A4A4A4A4A4A4A4A4A4A4A4A4A4A4A4A4A4A4A4
A37
A37
A37
A37
A37
A37
A37
A37
A37
A37
A37
A37
A37
A37
A37
A37
A37
A37
A37
A37
A37
A37
A37
A37
A37
A41
74
A41
74
A41
74
A41
74
A41
74
A41
74
A41
74
A41
74
A41
74
A41
74
A41
74
A41
74
A41
74
A41
74
A41
74
A41
74
A41
74
A41
74
A41
74
A41
74
A41
74
A41
74
A41
74
A41
74
A41
74
© Crown Copyright. All rights reserved.
Bristol City Council. 100023406. 2007.
Sites for Bus Passenger Analysis
on Key Corridors within the Study Area
To Bristol
City Centre
Brislington
Village
Callington Link
3.77 Network-wide bus based (bus, park and ride and Rapid Transit) public transport demand drops in
the highway based options (A, B1 and B2), increases only very marginally in the hybrid options
(D1 and D2) and increases by only 1% in the public transport option (E), although this is
approximately four times a greater increase than the hybrid options.
3.78 It is noticeable that despite the changes in total public transport described above, each option
experiences an increase in bus based public transport patronage in the corridor (Table 3.13 to
3.15). This means that in the case of the highway options bus based public transport demand is
being attracted to this corridor from other corridors..
3.79 The highway based options attract more bus based public transport demand into the corridor than
the hybrid options. This occurs for two reasons. Firstly, the full length all vehicle access along
Callington provides greater congestion relief and therefore reduces bus journey times and makes
the corridor more attractive to all travellers. Secondly, the hybrid options provide an additional,
competing public transport service from Brislington Park and Ride to Temple Meads against the
Final Report
5079478/Callington Link Options Assessment v2.doc 37
existing service. The analysis shows that any advantage provide by the dedicated use of the
northern end of Callington Road Link is substantially reduced because the services terminates at
Temple Meads rather than the city centre.
3.80 Option E generates the most bus based public transport demand into the corridor. As discussed
above, some of this increase is due to more people travelling by bus based public transport
demand in this option coupled with the provision of an attractive BRT service bringing demand into
this corridor from other corridors. The hybrid options suffer from a public transport service that
does not go to the city centre.
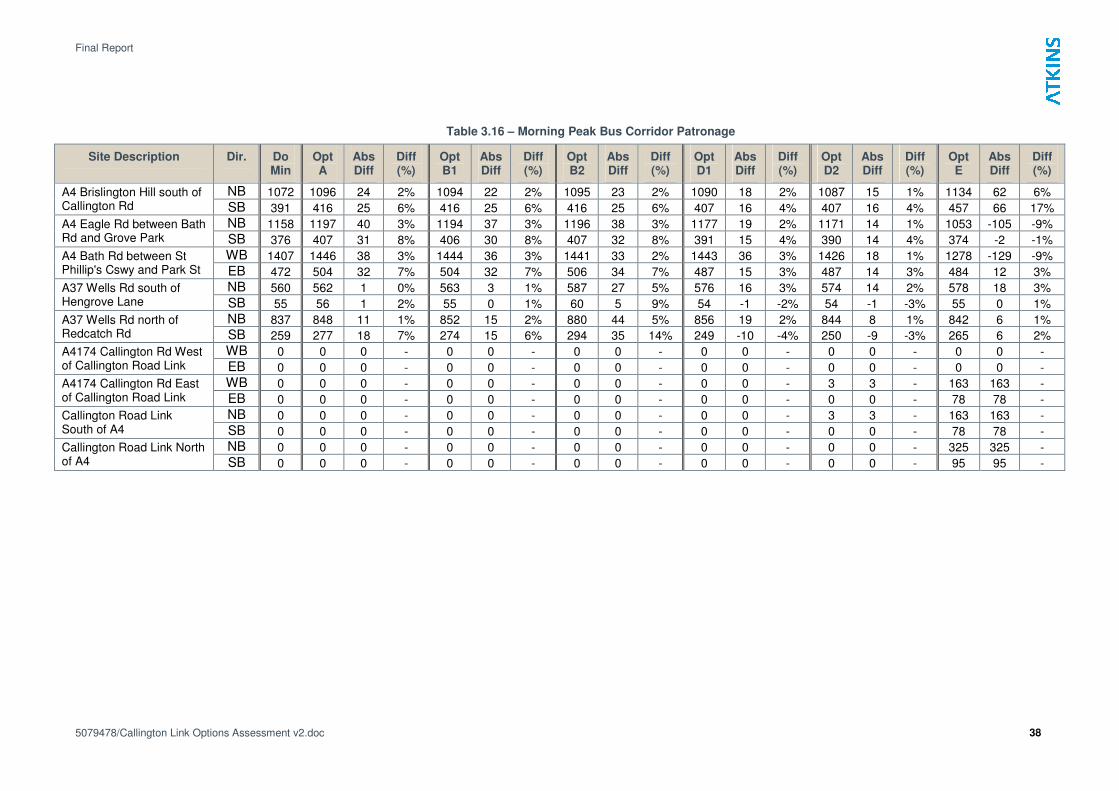
Final Report
5079478/Callington Link Options Assessment v2.doc 38
Table 3.16 – Morning Peak Bus Corridor Patronage
Site Description Dir. Do Min
Opt A
Abs Diff
Diff (%)
Opt B1
Abs Diff
Diff (%)
Opt B2
Abs Diff
Diff (%)
Opt D1
Abs Diff
Diff (%)
Opt D2
Abs Diff
Diff (%)
Opt E
Abs Diff
Diff (%)
NB 1072 1096 24 2% 1094 22 2% 1095 23 2% 1090 18 2% 1087 15 1% 1134 62 6% A4 Brislington Hill south of Callington Rd SB 391 416 25 6% 416 25 6% 416 25 6% 407 16 4% 407 16 4% 457 66 17%
NB 1158 1197 40 3% 1194 37 3% 1196 38 3% 1177 19 2% 1171 14 1% 1053 -105 -9% A4 Eagle Rd between Bath Rd and Grove Park SB 376 407 31 8% 406 30 8% 407 32 8% 391 15 4% 390 14 4% 374 -2 -1%
WB 1407 1446 38 3% 1444 36 3% 1441 33 2% 1443 36 3% 1426 18 1% 1278 -129 -9% A4 Bath Rd between St Phillip's Cswy and Park St EB 472 504 32 7% 504 32 7% 506 34 7% 487 15 3% 487 14 3% 484 12 3%
NB 560 562 1 0% 563 3 1% 587 27 5% 576 16 3% 574 14 2% 578 18 3% A37 Wells Rd south of Hengrove Lane SB 55 56 1 2% 55 0 1% 60 5 9% 54 -1 -2% 54 -1 -3% 55 0 1%
NB 837 848 11 1% 852 15 2% 880 44 5% 856 19 2% 844 8 1% 842 6 1% A37 Wells Rd north of Redcatch Rd SB 259 277 18 7% 274 15 6% 294 35 14% 249 -10 -4% 250 -9 -3% 265 6 2%
WB 0 0 0 - 0 0 - 0 0 - 0 0 - 0 0 - 0 0 - A4174 Callington Rd West of Callington Road Link EB 0 0 0 - 0 0 - 0 0 - 0 0 - 0 0 - 0 0 -
WB 0 0 0 - 0 0 - 0 0 - 0 0 - 3 3 - 163 163 - A4174 Callington Rd East of Callington Road Link EB 0 0 0 - 0 0 - 0 0 - 0 0 - 0 0 - 78 78 -
NB 0 0 0 - 0 0 - 0 0 - 0 0 - 3 3 - 163 163 - Callington Road Link South of A4 SB 0 0 0 - 0 0 - 0 0 - 0 0 - 0 0 - 78 78 -
NB 0 0 0 - 0 0 - 0 0 - 0 0 - 0 0 - 325 325 - Callington Road Link North of A4 SB 0 0 0 - 0 0 - 0 0 - 0 0 - 0 0 - 95 95 -
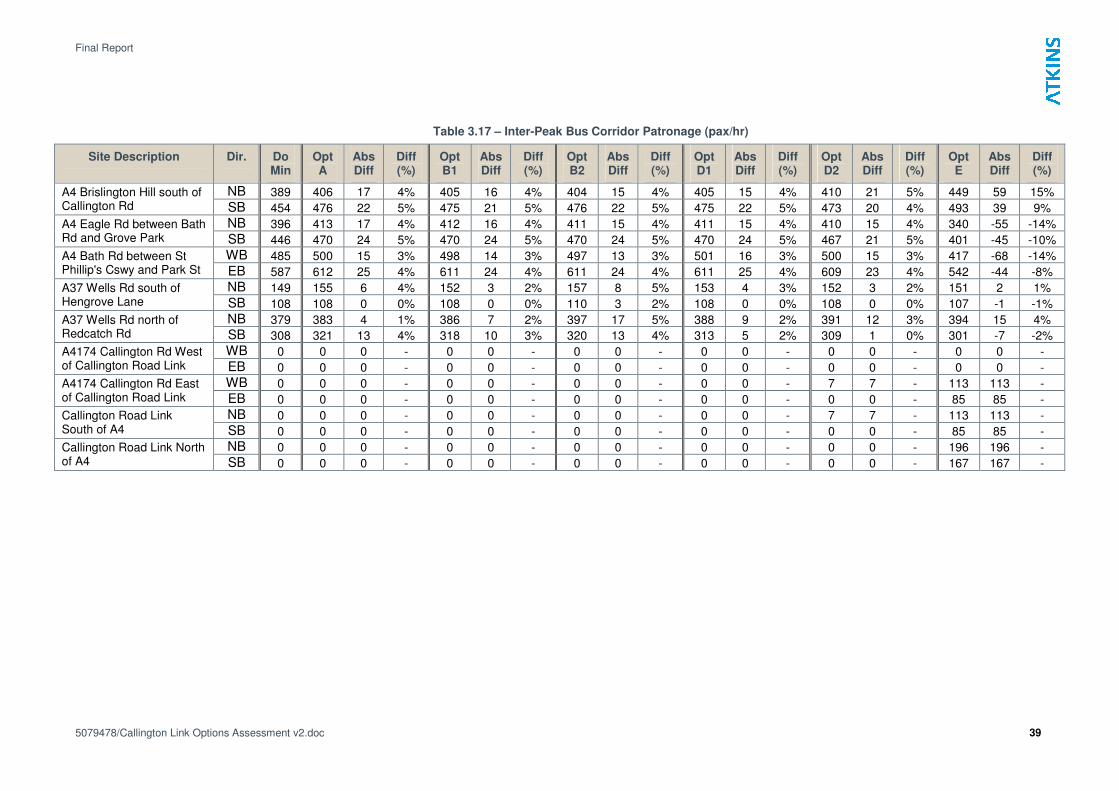
Final Report
5079478/Callington Link Options Assessment v2.doc 39
Table 3.17 – Inter-Peak Bus Corridor Patronage (pax/hr)
Site Description Dir. Do Min
Opt A
Abs Diff
Diff (%)
Opt B1
Abs Diff
Diff (%)
Opt B2
Abs Diff
Diff (%)
Opt D1
Abs Diff
Diff (%)
Opt D2
Abs Diff
Diff (%)
Opt E
Abs Diff
Diff (%)
NB 389 406 17 4% 405 16 4% 404 15 4% 405 15 4% 410 21 5% 449 59 15% A4 Brislington Hill south of Callington Rd SB 454 476 22 5% 475 21 5% 476 22 5% 475 22 5% 473 20 4% 493 39 9%
NB 396 413 17 4% 412 16 4% 411 15 4% 411 15 4% 410 15 4% 340 -55 -14% A4 Eagle Rd between Bath Rd and Grove Park SB 446 470 24 5% 470 24 5% 470 24 5% 470 24 5% 467 21 5% 401 -45 -10%
WB 485 500 15 3% 498 14 3% 497 13 3% 501 16 3% 500 15 3% 417 -68 -14% A4 Bath Rd between St Phillip's Cswy and Park St EB 587 612 25 4% 611 24 4% 611 24 4% 611 25 4% 609 23 4% 542 -44 -8%
NB 149 155 6 4% 152 3 2% 157 8 5% 153 4 3% 152 3 2% 151 2 1% A37 Wells Rd south of Hengrove Lane SB 108 108 0 0% 108 0 0% 110 3 2% 108 0 0% 108 0 0% 107 -1 -1%
NB 379 383 4 1% 386 7 2% 397 17 5% 388 9 2% 391 12 3% 394 15 4% A37 Wells Rd north of Redcatch Rd SB 308 321 13 4% 318 10 3% 320 13 4% 313 5 2% 309 1 0% 301 -7 -2%
WB 0 0 0 - 0 0 - 0 0 - 0 0 - 0 0 - 0 0 - A4174 Callington Rd West of Callington Road Link EB 0 0 0 - 0 0 - 0 0 - 0 0 - 0 0 - 0 0 -
WB 0 0 0 - 0 0 - 0 0 - 0 0 - 7 7 - 113 113 - A4174 Callington Rd East of Callington Road Link EB 0 0 0 - 0 0 - 0 0 - 0 0 - 0 0 - 85 85 -
NB 0 0 0 - 0 0 - 0 0 - 0 0 - 7 7 - 113 113 - Callington Road Link South of A4 SB 0 0 0 - 0 0 - 0 0 - 0 0 - 0 0 - 85 85 -
NB 0 0 0 - 0 0 - 0 0 - 0 0 - 0 0 - 196 196 - Callington Road Link North of A4 SB 0 0 0 - 0 0 - 0 0 - 0 0 - 0 0 - 167 167 -
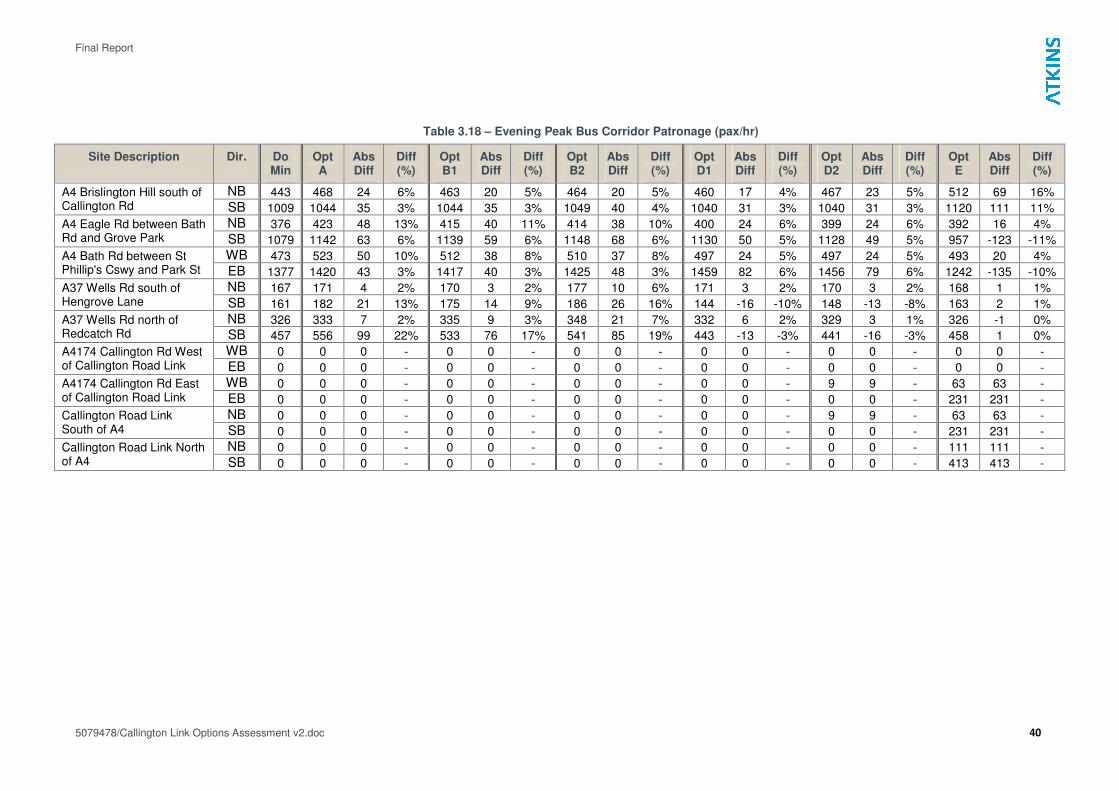
Final Report
5079478/Callington Link Options Assessment v2.doc 40
Table 3.18 – Evening Peak Bus Corridor Patronage (pax/hr)
Site Description Dir. Do Min
Opt A
Abs Diff
Diff (%)
Opt B1
Abs Diff
Diff (%)
Opt B2
Abs Diff
Diff (%)
Opt D1
Abs Diff
Diff (%)
Opt D2
Abs Diff
Diff (%)
Opt E
Abs Diff
Diff (%)
NB 443 468 24 6% 463 20 5% 464 20 5% 460 17 4% 467 23 5% 512 69 16% A4 Brislington Hill south of Callington Rd SB 1009 1044 35 3% 1044 35 3% 1049 40 4% 1040 31 3% 1040 31 3% 1120 111 11%
NB 376 423 48 13% 415 40 11% 414 38 10% 400 24 6% 399 24 6% 392 16 4% A4 Eagle Rd between Bath Rd and Grove Park SB 1079 1142 63 6% 1139 59 6% 1148 68 6% 1130 50 5% 1128 49 5% 957 -123 -11%
WB 473 523 50 10% 512 38 8% 510 37 8% 497 24 5% 497 24 5% 493 20 4% A4 Bath Rd between St Phillip's Cswy and Park St EB 1377 1420 43 3% 1417 40 3% 1425 48 3% 1459 82 6% 1456 79 6% 1242 -135 -10%
NB 167 171 4 2% 170 3 2% 177 10 6% 171 3 2% 170 3 2% 168 1 1% A37 Wells Rd south of Hengrove Lane SB 161 182 21 13% 175 14 9% 186 26 16% 144 -16 -10% 148 -13 -8% 163 2 1%
NB 326 333 7 2% 335 9 3% 348 21 7% 332 6 2% 329 3 1% 326 -1 0% A37 Wells Rd north of Redcatch Rd SB 457 556 99 22% 533 76 17% 541 85 19% 443 -13 -3% 441 -16 -3% 458 1 0%
WB 0 0 0 - 0 0 - 0 0 - 0 0 - 0 0 - 0 0 - A4174 Callington Rd West of Callington Road Link EB 0 0 0 - 0 0 - 0 0 - 0 0 - 0 0 - 0 0 -
WB 0 0 0 - 0 0 - 0 0 - 0 0 - 9 9 - 63 63 - A4174 Callington Rd East of Callington Road Link EB 0 0 0 - 0 0 - 0 0 - 0 0 - 0 0 - 231 231 -
NB 0 0 0 - 0 0 - 0 0 - 0 0 - 9 9 - 63 63 - Callington Road Link South of A4 SB 0 0 0 - 0 0 - 0 0 - 0 0 - 0 0 - 231 231 -
NB 0 0 0 - 0 0 - 0 0 - 0 0 - 0 0 - 111 111 - Callington Road Link North of A4 SB 0 0 0 - 0 0 - 0 0 - 0 0 - 0 0 - 413 413 -
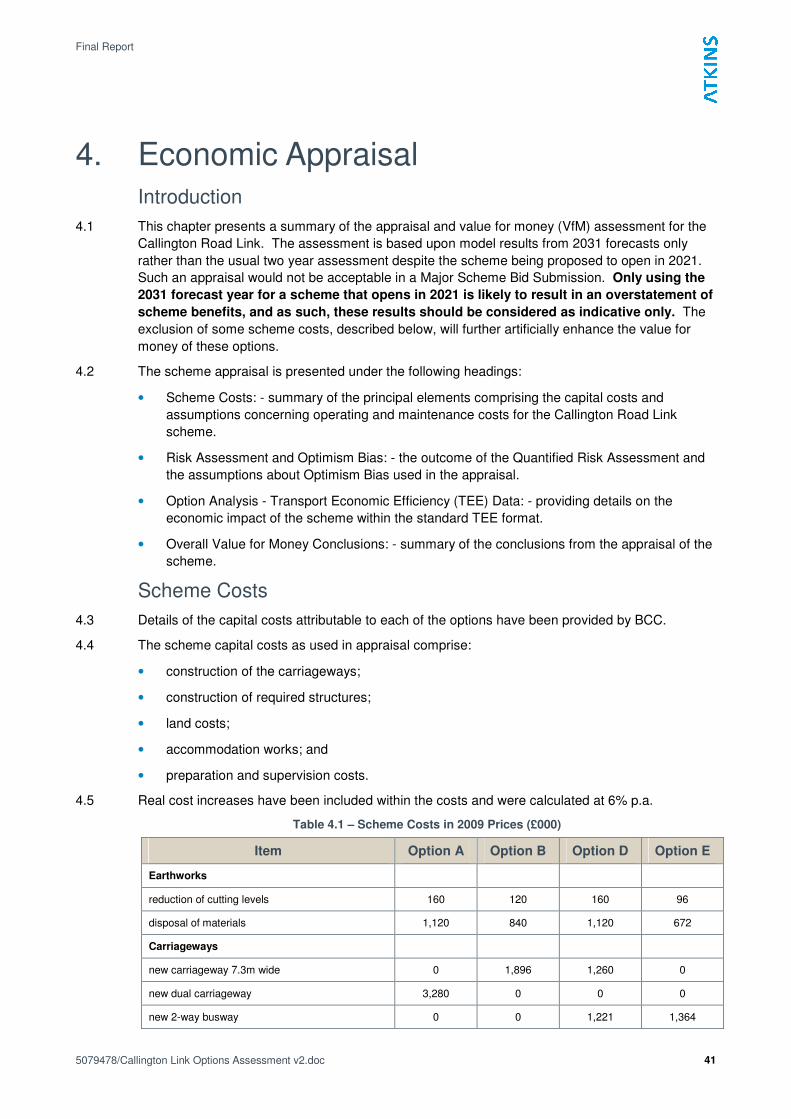
Final Report
5079478/Callington Link Options Assessment v2.doc 41
4. Economic Appraisal
Introduction
4.1 This chapter presents a summary of the appraisal and value for money (VfM) assessment for the
Callington Road Link. The assessment is based upon model results from 2031 forecasts only
rather than the usual two year assessment despite the scheme being proposed to open in 2021.
Such an appraisal would not be acceptable in a Major Scheme Bid Submission. Only using the
2031 forecast year for a scheme that opens in 2021 is likely to result in an overstatement of
scheme benefits, and as such, these results should be considered as indicative only. The
exclusion of some scheme costs, described below, will further artificially enhance the value for
money of these options.
4.2 The scheme appraisal is presented under the following headings:
• Scheme Costs: - summary of the principal elements comprising the capital costs and
assumptions concerning operating and maintenance costs for the Callington Road Link
scheme.
• Risk Assessment and Optimism Bias: - the outcome of the Quantified Risk Assessment and
the assumptions about Optimism Bias used in the appraisal.
• Option Analysis - Transport Economic Efficiency (TEE) Data: - providing details on the
economic impact of the scheme within the standard TEE format.
• Overall Value for Money Conclusions: - summary of the conclusions from the appraisal of the
scheme.
Scheme Costs
4.3 Details of the capital costs attributable to each of the options have been provided by BCC.
4.4 The scheme capital costs as used in appraisal comprise:
• construction of the carriageways;
• construction of required structures;
• land costs;
• accommodation works; and
• preparation and supervision costs.
4.5 Real cost increases have been included within the costs and were calculated at 6% p.a.
Table 4.1 – Scheme Costs in 2009 Prices (£000)
Item Option A Option B Option D Option E
Earthworks
reduction of cutting levels 160 120 160 96
disposal of materials 1,120 840 1,120 672
Carriageways
new carriageway 7.3m wide 0 1,896 1,260 0
new dual carriageway 3,280 0 0 0
new 2-way busway 0 0 1,221 1,364

Final Report
5079478/Callington Link Options Assessment v2.doc 42
Item Option A Option B Option D Option E
new footway/cycleway 4m wide 590 590 563 490
north junction 200 100 0 0
south junction 1,000 500 500 0
Bath Rd/Causeway junction 300 300 300 0
traffic calming 400 0 0 0
works for temporary diversion of Bath Rd 700 700 700 700
Tramway junction 100 100 100 100
Road works for severance of Talbot Rd 0 0 0 70
Structures
retaining walls 1,236 824 824 824
demolition of bridges 70 70 70 70
new Sandy Park bridge 500 500 0 500
new Bath Rd bridge 1,000 1,000 1,000 1,000
new Talbot Rd bridge 400 400 400 400
demolition & make good bus depot 1,000 0 1,000 0
demolish and make good others 1,000 0 1,000 0
Accommodation works
Tesco 500 500 500 100
Tesco petrol station 1,500 100 1,500 0
Sainsbury 700 500 0 0
Bath Rd 100 100 100 0
Repton Rd 150 150 150 0
Churchill Rd 54 54 54 0
Whitby Rd 30 30 30 0
Utility diversions 2,000 2,000 2,000 2,000
Subtotal 18,090 11,374 14,552 8,386
Prelims & minor items 2,714 1,706 2,183 1,258
Construction total 20,804 13,080 16,734 9,644
Land purchase
Brethren 3,000 2,500 2,500 500
Tesco 0 0 0 50
Land total 3,000 2,500 2,500 550
Other items
Public inquiry 200 200 200 200
Blight 2,400 1,200 1,200 0
Noise insulation 1,000 1,000 500 0
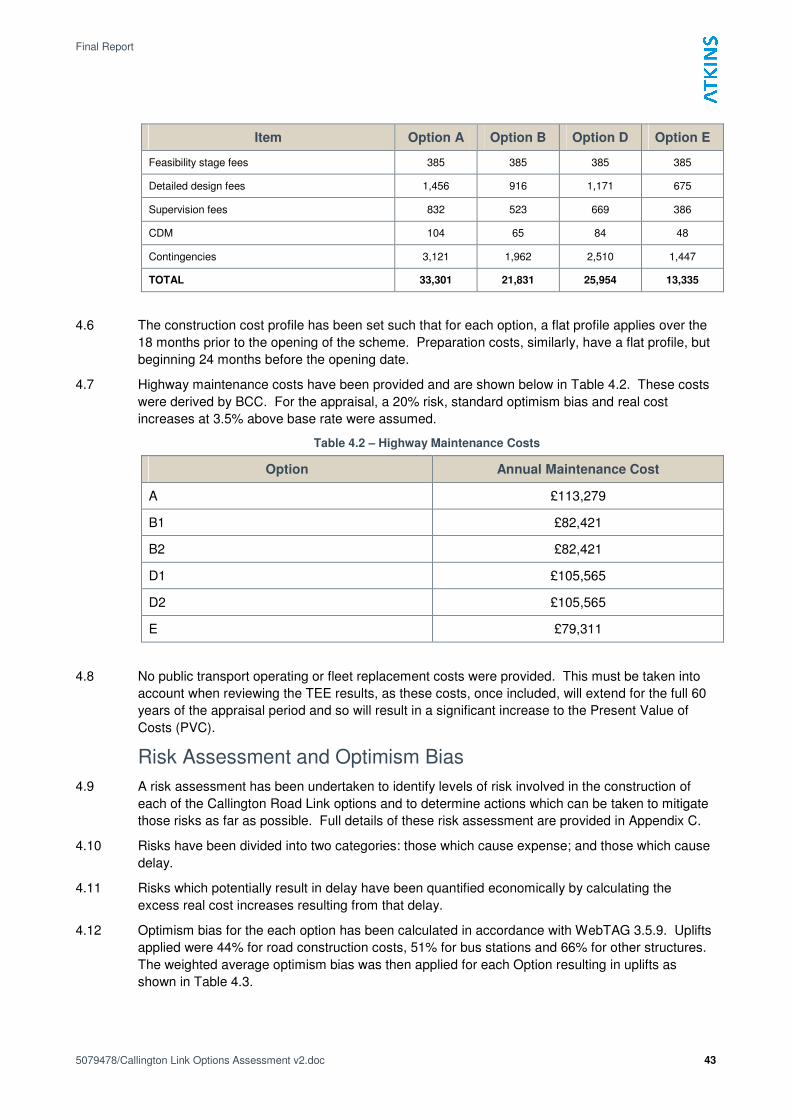
Final Report
5079478/Callington Link Options Assessment v2.doc 43
Item Option A Option B Option D Option E
Feasibility stage fees 385 385 385 385
Detailed design fees 1,456 916 1,171 675
Supervision fees 832 523 669 386
CDM 104 65 84 48
Contingencies 3,121 1,962 2,510 1,447
TOTAL 33,301 21,831 25,954 13,335
4.6 The construction cost profile has been set such that for each option, a flat profile applies over the
18 months prior to the opening of the scheme. Preparation costs, similarly, have a flat profile, but
beginning 24 months before the opening date.
4.7 Highway maintenance costs have been provided and are shown below in Table 4.2. These costs
were derived by BCC. For the appraisal, a 20% risk, standard optimism bias and real cost
increases at 3.5% above base rate were assumed.
Table 4.2 – Highway Maintenance Costs
Option Annual Maintenance Cost
A £113,279
B1 £82,421
B2 £82,421
D1 £105,565
D2 £105,565
E £79,311
4.8 No public transport operating or fleet replacement costs were provided. This must be taken into
account when reviewing the TEE results, as these costs, once included, will extend for the full 60
years of the appraisal period and so will result in a significant increase to the Present Value of
Costs (PVC).
Risk Assessment and Optimism Bias
4.9 A risk assessment has been undertaken to identify levels of risk involved in the construction of
each of the Callington Road Link options and to determine actions which can be taken to mitigate
those risks as far as possible. Full details of these risk assessment are provided in Appendix C.
4.10 Risks have been divided into two categories: those which cause expense; and those which cause
delay.
4.11 Risks which potentially result in delay have been quantified economically by calculating the
excess real cost increases resulting from that delay.
4.12 Optimism bias for the each option has been calculated in accordance with WebTAG 3.5.9. Uplifts
applied were 44% for road construction costs, 51% for bus stations and 66% for other structures.
The weighted average optimism bias was then applied for each Option resulting in uplifts as
shown in Table 4.3.
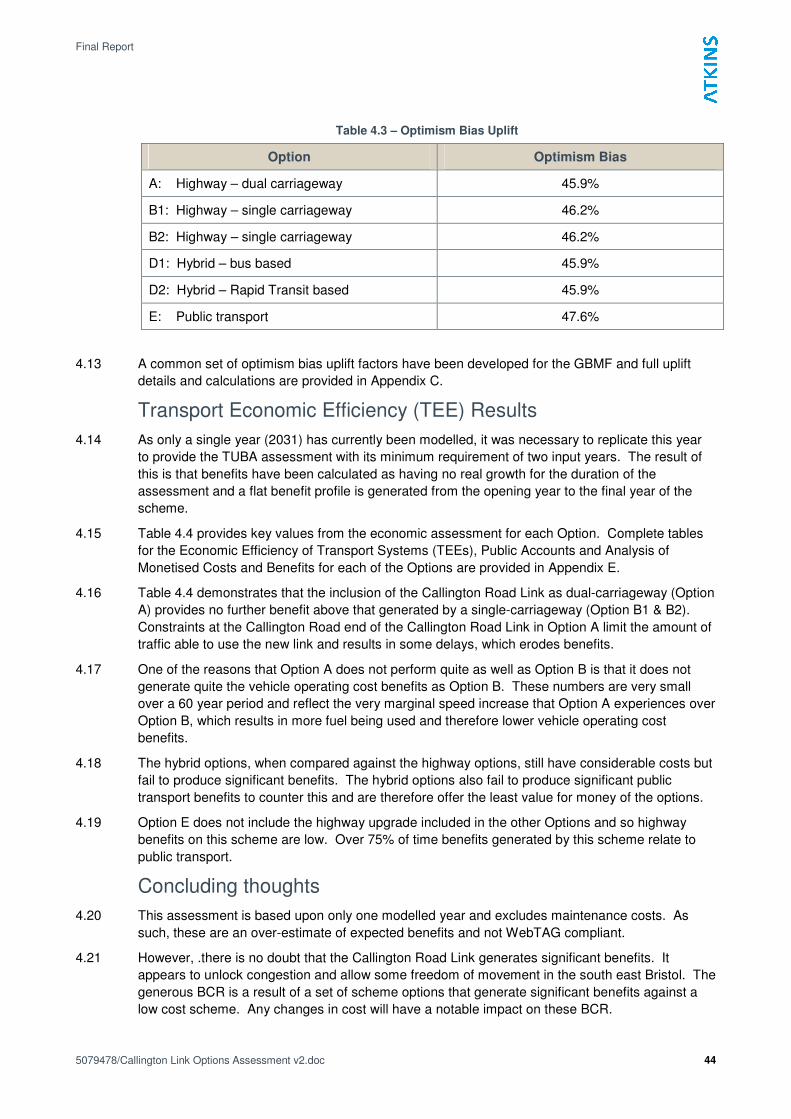
Final Report
5079478/Callington Link Options Assessment v2.doc 44
Table 4.3 – Optimism Bias Uplift
Option Optimism Bias
A: Highway – dual carriageway 45.9%
B1: Highway – single carriageway 46.2%
B2: Highway – single carriageway 46.2%
D1: Hybrid – bus based 45.9%
D2: Hybrid – Rapid Transit based 45.9%
E: Public transport 47.6%
4.13 A common set of optimism bias uplift factors have been developed for the GBMF and full uplift
details and calculations are provided in Appendix C.
Transport Economic Efficiency (TEE) Results
4.14 As only a single year (2031) has currently been modelled, it was necessary to replicate this year
to provide the TUBA assessment with its minimum requirement of two input years. The result of
this is that benefits have been calculated as having no real growth for the duration of the
assessment and a flat benefit profile is generated from the opening year to the final year of the
scheme.
4.15 Table 4.4 provides key values from the economic assessment for each Option. Complete tables
for the Economic Efficiency of Transport Systems (TEEs), Public Accounts and Analysis of
Monetised Costs and Benefits for each of the Options are provided in Appendix E.
4.16 Table 4.4 demonstrates that the inclusion of the Callington Road Link as dual-carriageway (Option
A) provides no further benefit above that generated by a single-carriageway (Option B1 & B2).
Constraints at the Callington Road end of the Callington Road Link in Option A limit the amount of
traffic able to use the new link and results in some delays, which erodes benefits.
4.17 One of the reasons that Option A does not perform quite as well as Option B is that it does not
generate quite the vehicle operating cost benefits as Option B. These numbers are very small
over a 60 year period and reflect the very marginal speed increase that Option A experiences over
Option B, which results in more fuel being used and therefore lower vehicle operating cost
benefits.
4.18 The hybrid options, when compared against the highway options, still have considerable costs but
fail to produce significant benefits. The hybrid options also fail to produce significant public
transport benefits to counter this and are therefore offer the least value for money of the options.
4.19 Option E does not include the highway upgrade included in the other Options and so highway
benefits on this scheme are low. Over 75% of time benefits generated by this scheme relate to
public transport.
Concluding thoughts
4.20 This assessment is based upon only one modelled year and excludes maintenance costs. As
such, these are an over-estimate of expected benefits and not WebTAG compliant.
4.21 However, .there is no doubt that the Callington Road Link generates significant benefits. It
appears to unlock congestion and allow some freedom of movement in the south east Bristol. The
generous BCR is a result of a set of scheme options that generate significant benefits against a
low cost scheme. Any changes in cost will have a notable impact on these BCR.
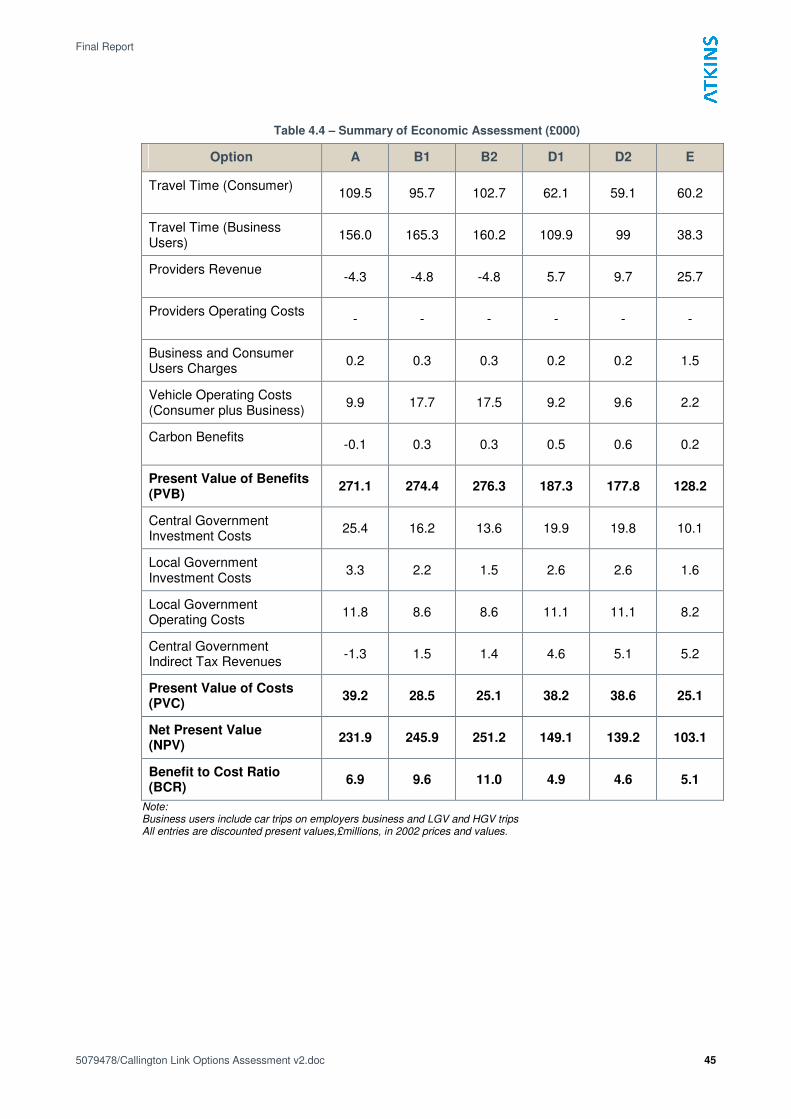
Final Report
5079478/Callington Link Options Assessment v2.doc 45
Table 4.4 – Summary of Economic Assessment (£000)
Option A B1 B2 D1 D2 E
Travel Time (Consumer)
109.5 95.7 102.7 62.1 59.1 60.2
Travel Time (Business Users)
156.0 165.3 160.2 109.9 99 38.3
Providers Revenue
-4.3 -4.8 -4.8 5.7 9.7 25.7
Providers Operating Costs
- - - - - -
Business and Consumer Users Charges
0.2 0.3 0.3 0.2 0.2 1.5
Vehicle Operating Costs (Consumer plus Business)
9.9 17.7 17.5 9.2 9.6 2.2
Carbon Benefits
-0.1 0.3 0.3 0.5 0.6 0.2
Present Value of Benefits (PVB)
271.1 274.4 276.3 187.3 177.8 128.2
Central Government Investment Costs
25.4 16.2 13.6 19.9 19.8 10.1
Local Government Investment Costs
3.3 2.2 1.5 2.6 2.6 1.6
Local Government Operating Costs
11.8 8.6 8.6 11.1 11.1 8.2
Central Government Indirect Tax Revenues
-1.3 1.5 1.4 4.6 5.1 5.2
Present Value of Costs (PVC)
39.2 28.5 25.1 38.2 38.6 25.1
Net Present Value (NPV)
231.9 245.9 251.2 149.1 139.2 103.1
Benefit to Cost Ratio (BCR)
6.9 9.6 11.0 4.9 4.6 5.1
Note: Business users include car trips on employers business and LGV and HGV trips All entries are discounted present values,£millions, in 2002 prices and values.
Final Report
5079478/Callington Link Options Assessment v2.doc 46
5. Conclusions and Recommendations
Conclusion
5.1 The key objective of the Callington Road Link project is to reduce congestion on the A4 Bath
Road in the Brislington area. A shortlist of five alternative options was developed by BCC. The
alternatives comprise two highway scheme options, one public transport option and two hybrid
options. Appraisal of these options will assist definition of the ‘preferred’, ‘next best’ and ‘low cost’
options but this commission is not required to identify what these may be.
5.2 In highway performance in 2031 is characterised by increasing congestion arising from significant
development and consequent traffic growth in the study area. A number of junctions in the south
and east of Bristol are forecast to be over capacity and as a result, vehicles are estimated to take
a wide range of routes to reach their destinations; often on residential roads.
5.3 Each option was modelled and compared against a do-minimum option for 2031. The evidence
presented in this report suggests that the Callington Road Link eases congestion in the south and
east of Bristol, particularly when all vehicle access is provided from Callington Road to St Phillip’s
Causeway. In the instances of all vehicle access along its entire length, there is evidence to
suggest that traffic reduces on local distributor roads and thus reducing traffic adjacent to the A4.
However, these tests also highlight the complex interactions between competing routes and the
role that traffic signals play in influencing / determining route choice in 2031.
5.4 An indicative economic appraisal was undertaken for all options and generous benefits to cost
ratios were generated as a result of the considerable benefits and relatively low costs of the
options. However, at this early stage a fully WebTAG compliant appraisal was not undertaken.
The assessment was focused on a single forecast year and the use of the 2031 forecast year as a
proxy for the 2021 opening year. The approach was adopted as requested by BCC.
Recommendations
5.5 The following recommendations should be considered upon taking the study further:
• Determine the intended road hierarchy with the Callington Road Link included in the network
as this additional link has a broad impact on the network;
• Once the hierarchy is established, devise route strategies that considers the priorities along
the routes and designs junctions / signals accordingly.
• Undertake a fully WebTAG compliant economic appraisal would be essential to
understanding the extent of scheme benefits and costs;
• Further refinement of the hybrid option to provide greater synergy between the highway and
public transport options.

Final Report
5079478/Callington Link Options Assessment v2.doc 47
Appendix A - Sectored Demand
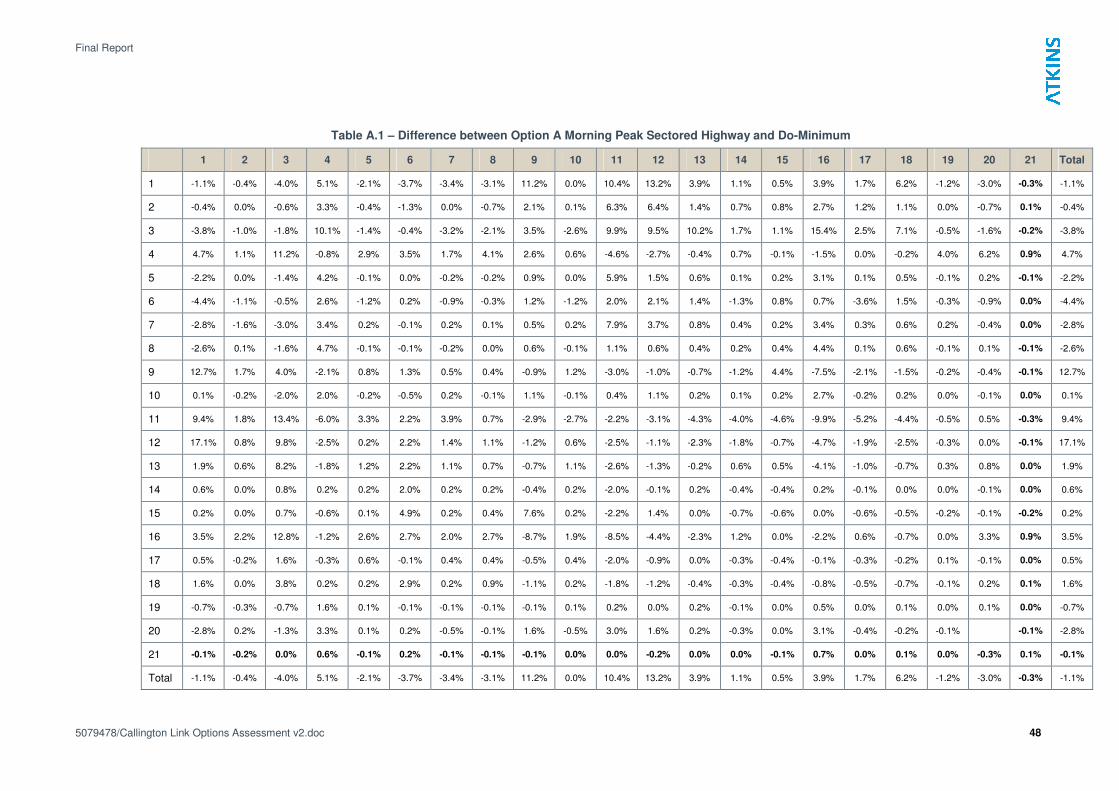
Final Report
5079478/Callington Link Options Assessment v2.doc 48
Table A.1 – Difference between Option A Morning Peak Sectored Highway and Do-Minimum
1 2 3 4 5 6 7 8 9 10 11 12 13 14 15 16 17 18 19 20 21 Total
1 -1.1% -0.4% -4.0% 5.1% -2.1% -3.7% -3.4% -3.1% 11.2% 0.0% 10.4% 13.2% 3.9% 1.1% 0.5% 3.9% 1.7% 6.2% -1.2% -3.0% -0.3% -1.1%
2 -0.4% 0.0% -0.6% 3.3% -0.4% -1.3% 0.0% -0.7% 2.1% 0.1% 6.3% 6.4% 1.4% 0.7% 0.8% 2.7% 1.2% 1.1% 0.0% -0.7% 0.1% -0.4%
3 -3.8% -1.0% -1.8% 10.1% -1.4% -0.4% -3.2% -2.1% 3.5% -2.6% 9.9% 9.5% 10.2% 1.7% 1.1% 15.4% 2.5% 7.1% -0.5% -1.6% -0.2% -3.8%
4 4.7% 1.1% 11.2% -0.8% 2.9% 3.5% 1.7% 4.1% 2.6% 0.6% -4.6% -2.7% -0.4% 0.7% -0.1% -1.5% 0.0% -0.2% 4.0% 6.2% 0.9% 4.7%
5 -2.2% 0.0% -1.4% 4.2% -0.1% 0.0% -0.2% -0.2% 0.9% 0.0% 5.9% 1.5% 0.6% 0.1% 0.2% 3.1% 0.1% 0.5% -0.1% 0.2% -0.1% -2.2%
6 -4.4% -1.1% -0.5% 2.6% -1.2% 0.2% -0.9% -0.3% 1.2% -1.2% 2.0% 2.1% 1.4% -1.3% 0.8% 0.7% -3.6% 1.5% -0.3% -0.9% 0.0% -4.4%
7 -2.8% -1.6% -3.0% 3.4% 0.2% -0.1% 0.2% 0.1% 0.5% 0.2% 7.9% 3.7% 0.8% 0.4% 0.2% 3.4% 0.3% 0.6% 0.2% -0.4% 0.0% -2.8%
8 -2.6% 0.1% -1.6% 4.7% -0.1% -0.1% -0.2% 0.0% 0.6% -0.1% 1.1% 0.6% 0.4% 0.2% 0.4% 4.4% 0.1% 0.6% -0.1% 0.1% -0.1% -2.6%
9 12.7% 1.7% 4.0% -2.1% 0.8% 1.3% 0.5% 0.4% -0.9% 1.2% -3.0% -1.0% -0.7% -1.2% 4.4% -7.5% -2.1% -1.5% -0.2% -0.4% -0.1% 12.7%
10 0.1% -0.2% -2.0% 2.0% -0.2% -0.5% 0.2% -0.1% 1.1% -0.1% 0.4% 1.1% 0.2% 0.1% 0.2% 2.7% -0.2% 0.2% 0.0% -0.1% 0.0% 0.1%
11 9.4% 1.8% 13.4% -6.0% 3.3% 2.2% 3.9% 0.7% -2.9% -2.7% -2.2% -3.1% -4.3% -4.0% -4.6% -9.9% -5.2% -4.4% -0.5% 0.5% -0.3% 9.4%
12 17.1% 0.8% 9.8% -2.5% 0.2% 2.2% 1.4% 1.1% -1.2% 0.6% -2.5% -1.1% -2.3% -1.8% -0.7% -4.7% -1.9% -2.5% -0.3% 0.0% -0.1% 17.1%
13 1.9% 0.6% 8.2% -1.8% 1.2% 2.2% 1.1% 0.7% -0.7% 1.1% -2.6% -1.3% -0.2% 0.6% 0.5% -4.1% -1.0% -0.7% 0.3% 0.8% 0.0% 1.9%
14 0.6% 0.0% 0.8% 0.2% 0.2% 2.0% 0.2% 0.2% -0.4% 0.2% -2.0% -0.1% 0.2% -0.4% -0.4% 0.2% -0.1% 0.0% 0.0% -0.1% 0.0% 0.6%
15 0.2% 0.0% 0.7% -0.6% 0.1% 4.9% 0.2% 0.4% 7.6% 0.2% -2.2% 1.4% 0.0% -0.7% -0.6% 0.0% -0.6% -0.5% -0.2% -0.1% -0.2% 0.2%
16 3.5% 2.2% 12.8% -1.2% 2.6% 2.7% 2.0% 2.7% -8.7% 1.9% -8.5% -4.4% -2.3% 1.2% 0.0% -2.2% 0.6% -0.7% 0.0% 3.3% 0.9% 3.5%
17 0.5% -0.2% 1.6% -0.3% 0.6% -0.1% 0.4% 0.4% -0.5% 0.4% -2.0% -0.9% 0.0% -0.3% -0.4% -0.1% -0.3% -0.2% 0.1% -0.1% 0.0% 0.5%
18 1.6% 0.0% 3.8% 0.2% 0.2% 2.9% 0.2% 0.9% -1.1% 0.2% -1.8% -1.2% -0.4% -0.3% -0.4% -0.8% -0.5% -0.7% -0.1% 0.2% 0.1% 1.6%
19 -0.7% -0.3% -0.7% 1.6% 0.1% -0.1% -0.1% -0.1% -0.1% 0.1% 0.2% 0.0% 0.2% -0.1% 0.0% 0.5% 0.0% 0.1% 0.0% 0.1% 0.0% -0.7%
20 -2.8% 0.2% -1.3% 3.3% 0.1% 0.2% -0.5% -0.1% 1.6% -0.5% 3.0% 1.6% 0.2% -0.3% 0.0% 3.1% -0.4% -0.2% -0.1% -0.1% -2.8%
21 -0.1% -0.2% 0.0% 0.6% -0.1% 0.2% -0.1% -0.1% -0.1% 0.0% 0.0% -0.2% 0.0% 0.0% -0.1% 0.7% 0.0% 0.1% 0.0% -0.3% 0.1% -0.1%
Total -1.1% -0.4% -4.0% 5.1% -2.1% -3.7% -3.4% -3.1% 11.2% 0.0% 10.4% 13.2% 3.9% 1.1% 0.5% 3.9% 1.7% 6.2% -1.2% -3.0% -0.3% -1.1%
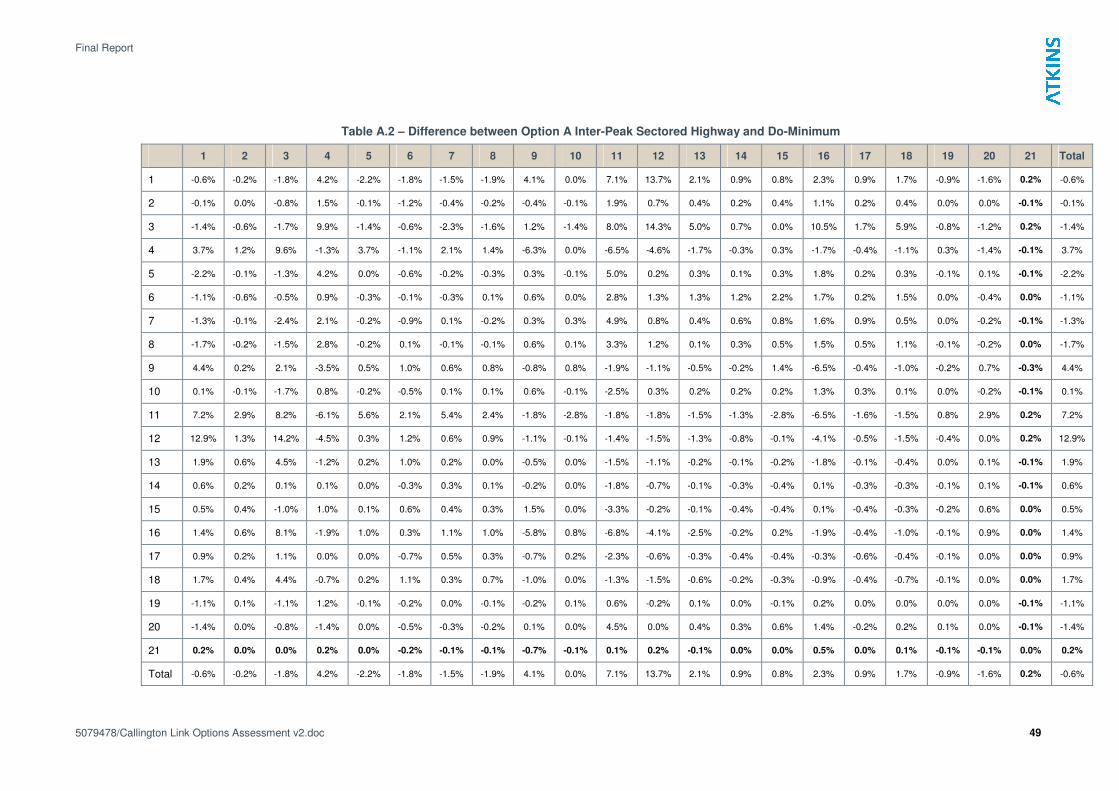
Final Report
5079478/Callington Link Options Assessment v2.doc 49
Table A.2 – Difference between Option A Inter-Peak Sectored Highway and Do-Minimum
1 2 3 4 5 6 7 8 9 10 11 12 13 14 15 16 17 18 19 20 21 Total
1 -0.6% -0.2% -1.8% 4.2% -2.2% -1.8% -1.5% -1.9% 4.1% 0.0% 7.1% 13.7% 2.1% 0.9% 0.8% 2.3% 0.9% 1.7% -0.9% -1.6% 0.2% -0.6%
2 -0.1% 0.0% -0.8% 1.5% -0.1% -1.2% -0.4% -0.2% -0.4% -0.1% 1.9% 0.7% 0.4% 0.2% 0.4% 1.1% 0.2% 0.4% 0.0% 0.0% -0.1% -0.1%
3 -1.4% -0.6% -1.7% 9.9% -1.4% -0.6% -2.3% -1.6% 1.2% -1.4% 8.0% 14.3% 5.0% 0.7% 0.0% 10.5% 1.7% 5.9% -0.8% -1.2% 0.2% -1.4%
4 3.7% 1.2% 9.6% -1.3% 3.7% -1.1% 2.1% 1.4% -6.3% 0.0% -6.5% -4.6% -1.7% -0.3% 0.3% -1.7% -0.4% -1.1% 0.3% -1.4% -0.1% 3.7%
5 -2.2% -0.1% -1.3% 4.2% 0.0% -0.6% -0.2% -0.3% 0.3% -0.1% 5.0% 0.2% 0.3% 0.1% 0.3% 1.8% 0.2% 0.3% -0.1% 0.1% -0.1% -2.2%
6 -1.1% -0.6% -0.5% 0.9% -0.3% -0.1% -0.3% 0.1% 0.6% 0.0% 2.8% 1.3% 1.3% 1.2% 2.2% 1.7% 0.2% 1.5% 0.0% -0.4% 0.0% -1.1%
7 -1.3% -0.1% -2.4% 2.1% -0.2% -0.9% 0.1% -0.2% 0.3% 0.3% 4.9% 0.8% 0.4% 0.6% 0.8% 1.6% 0.9% 0.5% 0.0% -0.2% -0.1% -1.3%
8 -1.7% -0.2% -1.5% 2.8% -0.2% 0.1% -0.1% -0.1% 0.6% 0.1% 3.3% 1.2% 0.1% 0.3% 0.5% 1.5% 0.5% 1.1% -0.1% -0.2% 0.0% -1.7%
9 4.4% 0.2% 2.1% -3.5% 0.5% 1.0% 0.6% 0.8% -0.8% 0.8% -1.9% -1.1% -0.5% -0.2% 1.4% -6.5% -0.4% -1.0% -0.2% 0.7% -0.3% 4.4%
10 0.1% -0.1% -1.7% 0.8% -0.2% -0.5% 0.1% 0.1% 0.6% -0.1% -2.5% 0.3% 0.2% 0.2% 0.2% 1.3% 0.3% 0.1% 0.0% -0.2% -0.1% 0.1%
11 7.2% 2.9% 8.2% -6.1% 5.6% 2.1% 5.4% 2.4% -1.8% -2.8% -1.8% -1.8% -1.5% -1.3% -2.8% -6.5% -1.6% -1.5% 0.8% 2.9% 0.2% 7.2%
12 12.9% 1.3% 14.2% -4.5% 0.3% 1.2% 0.6% 0.9% -1.1% -0.1% -1.4% -1.5% -1.3% -0.8% -0.1% -4.1% -0.5% -1.5% -0.4% 0.0% 0.2% 12.9%
13 1.9% 0.6% 4.5% -1.2% 0.2% 1.0% 0.2% 0.0% -0.5% 0.0% -1.5% -1.1% -0.2% -0.1% -0.2% -1.8% -0.1% -0.4% 0.0% 0.1% -0.1% 1.9%
14 0.6% 0.2% 0.1% 0.1% 0.0% -0.3% 0.3% 0.1% -0.2% 0.0% -1.8% -0.7% -0.1% -0.3% -0.4% 0.1% -0.3% -0.3% -0.1% 0.1% -0.1% 0.6%
15 0.5% 0.4% -1.0% 1.0% 0.1% 0.6% 0.4% 0.3% 1.5% 0.0% -3.3% -0.2% -0.1% -0.4% -0.4% 0.1% -0.4% -0.3% -0.2% 0.6% 0.0% 0.5%
16 1.4% 0.6% 8.1% -1.9% 1.0% 0.3% 1.1% 1.0% -5.8% 0.8% -6.8% -4.1% -2.5% -0.2% 0.2% -1.9% -0.4% -1.0% -0.1% 0.9% 0.0% 1.4%
17 0.9% 0.2% 1.1% 0.0% 0.0% -0.7% 0.5% 0.3% -0.7% 0.2% -2.3% -0.6% -0.3% -0.4% -0.4% -0.3% -0.6% -0.4% -0.1% 0.0% 0.0% 0.9%
18 1.7% 0.4% 4.4% -0.7% 0.2% 1.1% 0.3% 0.7% -1.0% 0.0% -1.3% -1.5% -0.6% -0.2% -0.3% -0.9% -0.4% -0.7% -0.1% 0.0% 0.0% 1.7%
19 -1.1% 0.1% -1.1% 1.2% -0.1% -0.2% 0.0% -0.1% -0.2% 0.1% 0.6% -0.2% 0.1% 0.0% -0.1% 0.2% 0.0% 0.0% 0.0% 0.0% -0.1% -1.1%
20 -1.4% 0.0% -0.8% -1.4% 0.0% -0.5% -0.3% -0.2% 0.1% 0.0% 4.5% 0.0% 0.4% 0.3% 0.6% 1.4% -0.2% 0.2% 0.1% 0.0% -0.1% -1.4%
21 0.2% 0.0% 0.0% 0.2% 0.0% -0.2% -0.1% -0.1% -0.7% -0.1% 0.1% 0.2% -0.1% 0.0% 0.0% 0.5% 0.0% 0.1% -0.1% -0.1% 0.0% 0.2%
Total -0.6% -0.2% -1.8% 4.2% -2.2% -1.8% -1.5% -1.9% 4.1% 0.0% 7.1% 13.7% 2.1% 0.9% 0.8% 2.3% 0.9% 1.7% -0.9% -1.6% 0.2% -0.6%

Final Report
5079478/Callington Link Options Assessment v2.doc 50
Table A.3 – Difference between Option A Evening Peak Sectored Highway and Do-Minimum
1 2 3 4 5 6 7 8 9 10 11 12 13 14 15 16 17 18 19 20 21 Total
1 -0.8% -0.5% -2.9% 4.4% -2.4% -3.1% -2.2% -2.3% 9.8% 0.1% 7.0% 15.8% 2.5% 1.7% 1.2% 3.3% 1.5% 2.3% -0.7% -2.3% 0.0% -0.8%
2 -0.3% -0.1% -0.5% 1.2% -0.3% 0.1% -2.5% 0.3% 2.4% -0.2% 3.7% 2.9% 1.1% 0.5% 0.6% 1.6% -0.1% 0.5% 0.0% 0.2% -0.1% -0.3%
3 -2.9% -0.8% -1.8% 9.9% -1.6% -0.2% -2.8% -1.5% 3.3% -2.1% 8.9% 10.6% 8.9% 3.4% 1.1% 14.3% 4.0% 5.9% -0.9% -1.0% 0.0% -2.9%
4 5.5% 2.4% 10.9% -1.0% 4.5% 3.5% 3.1% 4.6% -1.5% 1.3% -5.6% -3.2% -1.6% -0.1% 0.2% -1.6% -0.5% -0.5% 1.6% 4.5% 0.7% 5.5%
5 -1.9% -0.7% -1.4% 3.2% 0.0% 0.0% 0.1% -0.1% 1.1% -0.5% 6.0% 2.1% 0.8% 0.4% 0.4% 2.6% 1.2% 0.6% 0.2% 0.1% 0.0% -1.9%
6 -2.3% -1.0% -0.4% 0.5% 0.1% 0.0% -0.1% 0.0% 0.8% -0.3% 2.5% 1.4% 1.4% 3.2% 4.4% 0.1% -0.4% 2.0% 0.0% 0.3% 0.0% -2.3%
7 -2.2% -0.2% -2.5% 1.3% -0.1% 0.2% 0.2% -0.2% 0.8% 0.2% 6.2% 1.4% 1.0% 1.0% 0.8% 1.7% 1.2% 0.8% 0.1% -0.2% 0.0% -2.2%
8 -2.7% -0.7% -1.8% 1.8% -0.3% 0.2% 0.1% -0.1% 0.6% 0.0% 2.7% 1.3% 0.7% 0.9% 0.7% 1.3% 1.4% 1.2% 0.0% -0.2% -0.1% -2.7%
9 9.5% 1.2% 4.6% -3.5% 0.8% 1.3% 0.5% 0.6% -0.8% 0.7% -1.9% -1.0% -0.5% 0.6% 0.3% -
11.3% 0.8% -0.7% -0.1% 1.4% -0.1% 9.5%
10 -0.1% 0.2% -1.6% 0.7% -0.3% 0.3% 0.2% -0.2% 1.1% -0.1% -1.2% 0.8% 0.9% 0.5% 0.4% 1.6% 0.9% 0.6% 0.1% -0.3% 0.0% -0.1%
11 10.7% 3.8% 10.4% -5.8% 5.4% 2.5% 6.0% 2.4% -1.8% -2.3% -1.4% -1.9% -2.0% -3.2% -4.1% -9.0% -3.2% -2.1% 0.0% 3.9% 0.2% 10.7%
12 13.2% 9.3% 13.3% -5.5% 2.0% 2.0% 2.1% 0.9% -0.8% 1.0% -1.5% -1.0% -0.8% -0.3% 0.3% -4.8% -0.3% -1.4% 0.0% 2.3% -0.3% 13.2%
13 3.3% 1.5% 9.1% -1.7% 0.6% 1.8% 0.9% 0.4% -0.5% 0.5% -2.2% -1.7% -0.2% 0.2% 0.1% -2.3% 0.2% -0.4% 0.2% 0.3% 0.0% 3.3%
14 1.0% 0.5% 2.2% -0.2% 0.0% 0.4% 0.5% 0.1% -0.1% 0.1% -2.4% -0.9% 0.0% -0.4% -0.5% 0.3% -0.4% -0.4% 0.0% -0.1% 0.1% 1.0%
15 0.9% 0.7% 1.4% -0.1% 0.1% 1.7% 0.4% 0.2% 2.3% 0.3% -3.3% -0.3% -0.3% -0.4% -0.5% 0.0% -0.3% -0.4% -0.1% 0.1% 0.0% 0.9%
16 2.9% 1.7% 12.7% -2.0% 2.4% 2.3% 1.9% 3.4% -5.9% 1.8% -7.3% -4.1% -3.0% 0.3% 0.4% -2.3% -0.2% -0.9% 0.2% 2.4% 0.7% 2.9%
17 1.4% 0.6% 2.6% -0.7% 0.4% -0.6% 0.6% 0.4% -0.7% 0.2% -2.9% -1.2% -0.6% -0.2% -0.5% -0.3% -0.5% -0.5% 0.0% 0.0% 0.0% 1.4%
18 3.4% 0.8% 5.8% -1.4% 0.4% 2.1% 0.8% 0.8% -0.8% 0.4% -2.7% -2.0% -0.6% 0.0% -0.2% -1.1% -0.2% -0.8% 0.1% 0.0% 0.0% 3.4%
19 -0.9% 0.0% -0.5% 1.3% -0.2% 0.2% 0.1% -0.2% -0.1% 0.1% 0.5% 0.1% 0.1% 0.1% -0.1% -0.2% 0.2% 0.0% 0.0% 0.0% 0.0% -0.9%
20 -2.6% -0.8% -0.7% -0.1% 0.1% 0.0% 0.1% -0.1% -0.1% 0.0% 3.2% 0.8% 0.8% 0.3% 0.7% 2.5% 0.2% 0.7% 0.2% 0.3% 0.0% -2.6%
21 0.2% -0.1% 0.0% 0.3% -0.1% 0.2% -0.1% 0.0% 0.2% -0.1% 0.3% 0.0% 0.0% 0.3% 0.1% 0.5% 0.3% 0.1% 0.0% 0.0% 0.1% 0.2%
Total -0.8% -0.5% -2.9% 4.4% -2.4% -3.1% -2.2% -2.3% 9.8% 0.1% 7.0% 15.8% 2.5% 1.7% 1.2% 3.3% 1.5% 2.3% -0.7% -2.3% 0.0% -0.8%
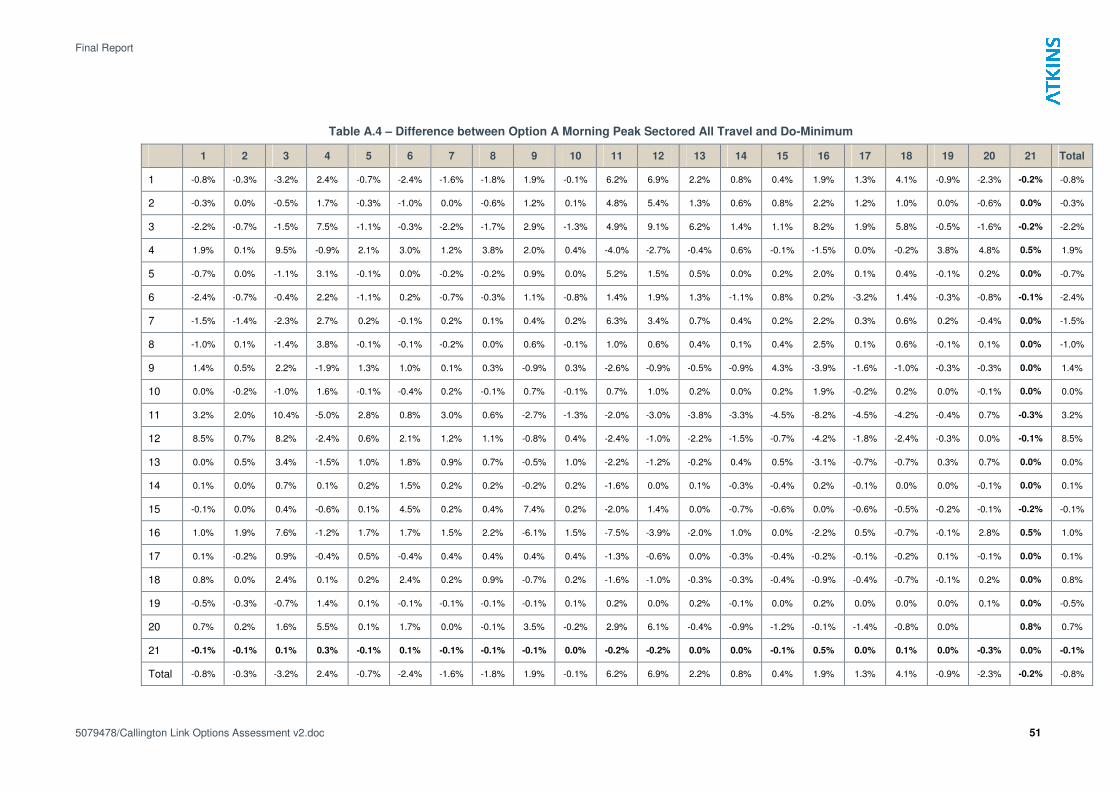
Final Report
5079478/Callington Link Options Assessment v2.doc 51
Table A.4 – Difference between Option A Morning Peak Sectored All Travel and Do-Minimum
1 2 3 4 5 6 7 8 9 10 11 12 13 14 15 16 17 18 19 20 21 Total
1 -0.8% -0.3% -3.2% 2.4% -0.7% -2.4% -1.6% -1.8% 1.9% -0.1% 6.2% 6.9% 2.2% 0.8% 0.4% 1.9% 1.3% 4.1% -0.9% -2.3% -0.2% -0.8%
2 -0.3% 0.0% -0.5% 1.7% -0.3% -1.0% 0.0% -0.6% 1.2% 0.1% 4.8% 5.4% 1.3% 0.6% 0.8% 2.2% 1.2% 1.0% 0.0% -0.6% 0.0% -0.3%
3 -2.2% -0.7% -1.5% 7.5% -1.1% -0.3% -2.2% -1.7% 2.9% -1.3% 4.9% 9.1% 6.2% 1.4% 1.1% 8.2% 1.9% 5.8% -0.5% -1.6% -0.2% -2.2%
4 1.9% 0.1% 9.5% -0.9% 2.1% 3.0% 1.2% 3.8% 2.0% 0.4% -4.0% -2.7% -0.4% 0.6% -0.1% -1.5% 0.0% -0.2% 3.8% 4.8% 0.5% 1.9%
5 -0.7% 0.0% -1.1% 3.1% -0.1% 0.0% -0.2% -0.2% 0.9% 0.0% 5.2% 1.5% 0.5% 0.0% 0.2% 2.0% 0.1% 0.4% -0.1% 0.2% 0.0% -0.7%
6 -2.4% -0.7% -0.4% 2.2% -1.1% 0.2% -0.7% -0.3% 1.1% -0.8% 1.4% 1.9% 1.3% -1.1% 0.8% 0.2% -3.2% 1.4% -0.3% -0.8% -0.1% -2.4%
7 -1.5% -1.4% -2.3% 2.7% 0.2% -0.1% 0.2% 0.1% 0.4% 0.2% 6.3% 3.4% 0.7% 0.4% 0.2% 2.2% 0.3% 0.6% 0.2% -0.4% 0.0% -1.5%
8 -1.0% 0.1% -1.4% 3.8% -0.1% -0.1% -0.2% 0.0% 0.6% -0.1% 1.0% 0.6% 0.4% 0.1% 0.4% 2.5% 0.1% 0.6% -0.1% 0.1% 0.0% -1.0%
9 1.4% 0.5% 2.2% -1.9% 1.3% 1.0% 0.1% 0.3% -0.9% 0.3% -2.6% -0.9% -0.5% -0.9% 4.3% -3.9% -1.6% -1.0% -0.3% -0.3% 0.0% 1.4%
10 0.0% -0.2% -1.0% 1.6% -0.1% -0.4% 0.2% -0.1% 0.7% -0.1% 0.7% 1.0% 0.2% 0.0% 0.2% 1.9% -0.2% 0.2% 0.0% -0.1% 0.0% 0.0%
11 3.2% 2.0% 10.4% -5.0% 2.8% 0.8% 3.0% 0.6% -2.7% -1.3% -2.0% -3.0% -3.8% -3.3% -4.5% -8.2% -4.5% -4.2% -0.4% 0.7% -0.3% 3.2%
12 8.5% 0.7% 8.2% -2.4% 0.6% 2.1% 1.2% 1.1% -0.8% 0.4% -2.4% -1.0% -2.2% -1.5% -0.7% -4.2% -1.8% -2.4% -0.3% 0.0% -0.1% 8.5%
13 0.0% 0.5% 3.4% -1.5% 1.0% 1.8% 0.9% 0.7% -0.5% 1.0% -2.2% -1.2% -0.2% 0.4% 0.5% -3.1% -0.7% -0.7% 0.3% 0.7% 0.0% 0.0%
14 0.1% 0.0% 0.7% 0.1% 0.2% 1.5% 0.2% 0.2% -0.2% 0.2% -1.6% 0.0% 0.1% -0.3% -0.4% 0.2% -0.1% 0.0% 0.0% -0.1% 0.0% 0.1%
15 -0.1% 0.0% 0.4% -0.6% 0.1% 4.5% 0.2% 0.4% 7.4% 0.2% -2.0% 1.4% 0.0% -0.7% -0.6% 0.0% -0.6% -0.5% -0.2% -0.1% -0.2% -0.1%
16 1.0% 1.9% 7.6% -1.2% 1.7% 1.7% 1.5% 2.2% -6.1% 1.5% -7.5% -3.9% -2.0% 1.0% 0.0% -2.2% 0.5% -0.7% -0.1% 2.8% 0.5% 1.0%
17 0.1% -0.2% 0.9% -0.4% 0.5% -0.4% 0.4% 0.4% 0.4% 0.4% -1.3% -0.6% 0.0% -0.3% -0.4% -0.2% -0.1% -0.2% 0.1% -0.1% 0.0% 0.1%
18 0.8% 0.0% 2.4% 0.1% 0.2% 2.4% 0.2% 0.9% -0.7% 0.2% -1.6% -1.0% -0.3% -0.3% -0.4% -0.9% -0.4% -0.7% -0.1% 0.2% 0.0% 0.8%
19 -0.5% -0.3% -0.7% 1.4% 0.1% -0.1% -0.1% -0.1% -0.1% 0.1% 0.2% 0.0% 0.2% -0.1% 0.0% 0.2% 0.0% 0.0% 0.0% 0.1% 0.0% -0.5%
20 0.7% 0.2% 1.6% 5.5% 0.1% 1.7% 0.0% -0.1% 3.5% -0.2% 2.9% 6.1% -0.4% -0.9% -1.2% -0.1% -1.4% -0.8% 0.0% 0.8% 0.7%
21 -0.1% -0.1% 0.1% 0.3% -0.1% 0.1% -0.1% -0.1% -0.1% 0.0% -0.2% -0.2% 0.0% 0.0% -0.1% 0.5% 0.0% 0.1% 0.0% -0.3% 0.0% -0.1%
Total -0.8% -0.3% -3.2% 2.4% -0.7% -2.4% -1.6% -1.8% 1.9% -0.1% 6.2% 6.9% 2.2% 0.8% 0.4% 1.9% 1.3% 4.1% -0.9% -2.3% -0.2% -0.8%
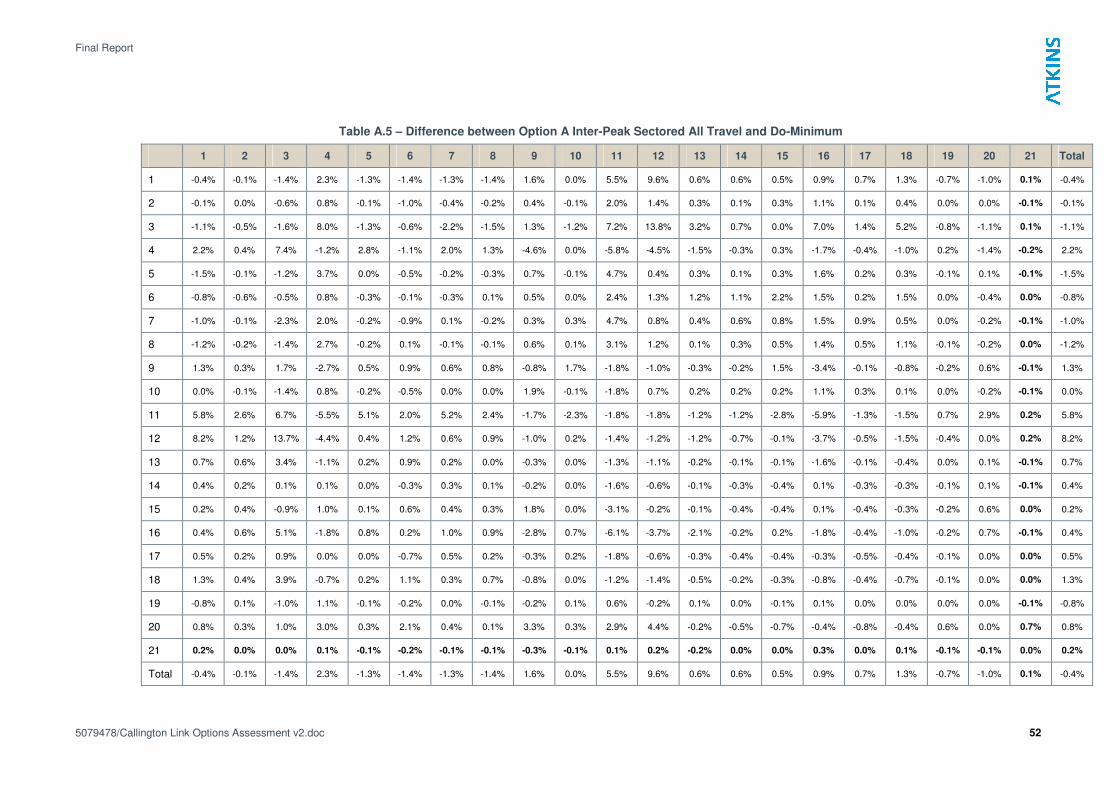
Final Report
5079478/Callington Link Options Assessment v2.doc 52
Table A.5 – Difference between Option A Inter-Peak Sectored All Travel and Do-Minimum
1 2 3 4 5 6 7 8 9 10 11 12 13 14 15 16 17 18 19 20 21 Total
1 -0.4% -0.1% -1.4% 2.3% -1.3% -1.4% -1.3% -1.4% 1.6% 0.0% 5.5% 9.6% 0.6% 0.6% 0.5% 0.9% 0.7% 1.3% -0.7% -1.0% 0.1% -0.4%
2 -0.1% 0.0% -0.6% 0.8% -0.1% -1.0% -0.4% -0.2% 0.4% -0.1% 2.0% 1.4% 0.3% 0.1% 0.3% 1.1% 0.1% 0.4% 0.0% 0.0% -0.1% -0.1%
3 -1.1% -0.5% -1.6% 8.0% -1.3% -0.6% -2.2% -1.5% 1.3% -1.2% 7.2% 13.8% 3.2% 0.7% 0.0% 7.0% 1.4% 5.2% -0.8% -1.1% 0.1% -1.1%
4 2.2% 0.4% 7.4% -1.2% 2.8% -1.1% 2.0% 1.3% -4.6% 0.0% -5.8% -4.5% -1.5% -0.3% 0.3% -1.7% -0.4% -1.0% 0.2% -1.4% -0.2% 2.2%
5 -1.5% -0.1% -1.2% 3.7% 0.0% -0.5% -0.2% -0.3% 0.7% -0.1% 4.7% 0.4% 0.3% 0.1% 0.3% 1.6% 0.2% 0.3% -0.1% 0.1% -0.1% -1.5%
6 -0.8% -0.6% -0.5% 0.8% -0.3% -0.1% -0.3% 0.1% 0.5% 0.0% 2.4% 1.3% 1.2% 1.1% 2.2% 1.5% 0.2% 1.5% 0.0% -0.4% 0.0% -0.8%
7 -1.0% -0.1% -2.3% 2.0% -0.2% -0.9% 0.1% -0.2% 0.3% 0.3% 4.7% 0.8% 0.4% 0.6% 0.8% 1.5% 0.9% 0.5% 0.0% -0.2% -0.1% -1.0%
8 -1.2% -0.2% -1.4% 2.7% -0.2% 0.1% -0.1% -0.1% 0.6% 0.1% 3.1% 1.2% 0.1% 0.3% 0.5% 1.4% 0.5% 1.1% -0.1% -0.2% 0.0% -1.2%
9 1.3% 0.3% 1.7% -2.7% 0.5% 0.9% 0.6% 0.8% -0.8% 1.7% -1.8% -1.0% -0.3% -0.2% 1.5% -3.4% -0.1% -0.8% -0.2% 0.6% -0.1% 1.3%
10 0.0% -0.1% -1.4% 0.8% -0.2% -0.5% 0.0% 0.0% 1.9% -0.1% -1.8% 0.7% 0.2% 0.2% 0.2% 1.1% 0.3% 0.1% 0.0% -0.2% -0.1% 0.0%
11 5.8% 2.6% 6.7% -5.5% 5.1% 2.0% 5.2% 2.4% -1.7% -2.3% -1.8% -1.8% -1.2% -1.2% -2.8% -5.9% -1.3% -1.5% 0.7% 2.9% 0.2% 5.8%
12 8.2% 1.2% 13.7% -4.4% 0.4% 1.2% 0.6% 0.9% -1.0% 0.2% -1.4% -1.2% -1.2% -0.7% -0.1% -3.7% -0.5% -1.5% -0.4% 0.0% 0.2% 8.2%
13 0.7% 0.6% 3.4% -1.1% 0.2% 0.9% 0.2% 0.0% -0.3% 0.0% -1.3% -1.1% -0.2% -0.1% -0.1% -1.6% -0.1% -0.4% 0.0% 0.1% -0.1% 0.7%
14 0.4% 0.2% 0.1% 0.1% 0.0% -0.3% 0.3% 0.1% -0.2% 0.0% -1.6% -0.6% -0.1% -0.3% -0.4% 0.1% -0.3% -0.3% -0.1% 0.1% -0.1% 0.4%
15 0.2% 0.4% -0.9% 1.0% 0.1% 0.6% 0.4% 0.3% 1.8% 0.0% -3.1% -0.2% -0.1% -0.4% -0.4% 0.1% -0.4% -0.3% -0.2% 0.6% 0.0% 0.2%
16 0.4% 0.6% 5.1% -1.8% 0.8% 0.2% 1.0% 0.9% -2.8% 0.7% -6.1% -3.7% -2.1% -0.2% 0.2% -1.8% -0.4% -1.0% -0.2% 0.7% -0.1% 0.4%
17 0.5% 0.2% 0.9% 0.0% 0.0% -0.7% 0.5% 0.2% -0.3% 0.2% -1.8% -0.6% -0.3% -0.4% -0.4% -0.3% -0.5% -0.4% -0.1% 0.0% 0.0% 0.5%
18 1.3% 0.4% 3.9% -0.7% 0.2% 1.1% 0.3% 0.7% -0.8% 0.0% -1.2% -1.4% -0.5% -0.2% -0.3% -0.8% -0.4% -0.7% -0.1% 0.0% 0.0% 1.3%
19 -0.8% 0.1% -1.0% 1.1% -0.1% -0.2% 0.0% -0.1% -0.2% 0.1% 0.6% -0.2% 0.1% 0.0% -0.1% 0.1% 0.0% 0.0% 0.0% 0.0% -0.1% -0.8%
20 0.8% 0.3% 1.0% 3.0% 0.3% 2.1% 0.4% 0.1% 3.3% 0.3% 2.9% 4.4% -0.2% -0.5% -0.7% -0.4% -0.8% -0.4% 0.6% 0.0% 0.7% 0.8%
21 0.2% 0.0% 0.0% 0.1% -0.1% -0.2% -0.1% -0.1% -0.3% -0.1% 0.1% 0.2% -0.2% 0.0% 0.0% 0.3% 0.0% 0.1% -0.1% -0.1% 0.0% 0.2%
Total -0.4% -0.1% -1.4% 2.3% -1.3% -1.4% -1.3% -1.4% 1.6% 0.0% 5.5% 9.6% 0.6% 0.6% 0.5% 0.9% 0.7% 1.3% -0.7% -1.0% 0.1% -0.4%
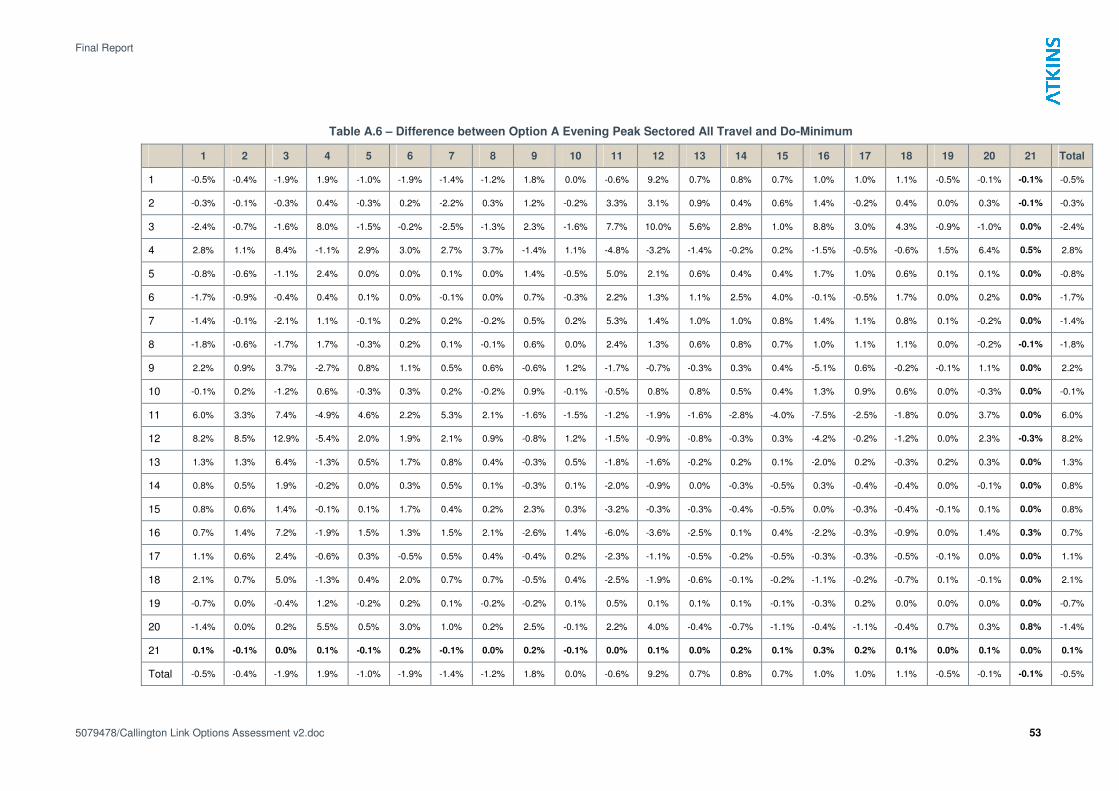
Final Report
5079478/Callington Link Options Assessment v2.doc 53
Table A.6 – Difference between Option A Evening Peak Sectored All Travel and Do-Minimum
1 2 3 4 5 6 7 8 9 10 11 12 13 14 15 16 17 18 19 20 21 Total
1 -0.5% -0.4% -1.9% 1.9% -1.0% -1.9% -1.4% -1.2% 1.8% 0.0% -0.6% 9.2% 0.7% 0.8% 0.7% 1.0% 1.0% 1.1% -0.5% -0.1% -0.1% -0.5%
2 -0.3% -0.1% -0.3% 0.4% -0.3% 0.2% -2.2% 0.3% 1.2% -0.2% 3.3% 3.1% 0.9% 0.4% 0.6% 1.4% -0.2% 0.4% 0.0% 0.3% -0.1% -0.3%
3 -2.4% -0.7% -1.6% 8.0% -1.5% -0.2% -2.5% -1.3% 2.3% -1.6% 7.7% 10.0% 5.6% 2.8% 1.0% 8.8% 3.0% 4.3% -0.9% -1.0% 0.0% -2.4%
4 2.8% 1.1% 8.4% -1.1% 2.9% 3.0% 2.7% 3.7% -1.4% 1.1% -4.8% -3.2% -1.4% -0.2% 0.2% -1.5% -0.5% -0.6% 1.5% 6.4% 0.5% 2.8%
5 -0.8% -0.6% -1.1% 2.4% 0.0% 0.0% 0.1% 0.0% 1.4% -0.5% 5.0% 2.1% 0.6% 0.4% 0.4% 1.7% 1.0% 0.6% 0.1% 0.1% 0.0% -0.8%
6 -1.7% -0.9% -0.4% 0.4% 0.1% 0.0% -0.1% 0.0% 0.7% -0.3% 2.2% 1.3% 1.1% 2.5% 4.0% -0.1% -0.5% 1.7% 0.0% 0.2% 0.0% -1.7%
7 -1.4% -0.1% -2.1% 1.1% -0.1% 0.2% 0.2% -0.2% 0.5% 0.2% 5.3% 1.4% 1.0% 1.0% 0.8% 1.4% 1.1% 0.8% 0.1% -0.2% 0.0% -1.4%
8 -1.8% -0.6% -1.7% 1.7% -0.3% 0.2% 0.1% -0.1% 0.6% 0.0% 2.4% 1.3% 0.6% 0.8% 0.7% 1.0% 1.1% 1.1% 0.0% -0.2% -0.1% -1.8%
9 2.2% 0.9% 3.7% -2.7% 0.8% 1.1% 0.5% 0.6% -0.6% 1.2% -1.7% -0.7% -0.3% 0.3% 0.4% -5.1% 0.6% -0.2% -0.1% 1.1% 0.0% 2.2%
10 -0.1% 0.2% -1.2% 0.6% -0.3% 0.3% 0.2% -0.2% 0.9% -0.1% -0.5% 0.8% 0.8% 0.5% 0.4% 1.3% 0.9% 0.6% 0.0% -0.3% 0.0% -0.1%
11 6.0% 3.3% 7.4% -4.9% 4.6% 2.2% 5.3% 2.1% -1.6% -1.5% -1.2% -1.9% -1.6% -2.8% -4.0% -7.5% -2.5% -1.8% 0.0% 3.7% 0.0% 6.0%
12 8.2% 8.5% 12.9% -5.4% 2.0% 1.9% 2.1% 0.9% -0.8% 1.2% -1.5% -0.9% -0.8% -0.3% 0.3% -4.2% -0.2% -1.2% 0.0% 2.3% -0.3% 8.2%
13 1.3% 1.3% 6.4% -1.3% 0.5% 1.7% 0.8% 0.4% -0.3% 0.5% -1.8% -1.6% -0.2% 0.2% 0.1% -2.0% 0.2% -0.3% 0.2% 0.3% 0.0% 1.3%
14 0.8% 0.5% 1.9% -0.2% 0.0% 0.3% 0.5% 0.1% -0.3% 0.1% -2.0% -0.9% 0.0% -0.3% -0.5% 0.3% -0.4% -0.4% 0.0% -0.1% 0.0% 0.8%
15 0.8% 0.6% 1.4% -0.1% 0.1% 1.7% 0.4% 0.2% 2.3% 0.3% -3.2% -0.3% -0.3% -0.4% -0.5% 0.0% -0.3% -0.4% -0.1% 0.1% 0.0% 0.8%
16 0.7% 1.4% 7.2% -1.9% 1.5% 1.3% 1.5% 2.1% -2.6% 1.4% -6.0% -3.6% -2.5% 0.1% 0.4% -2.2% -0.3% -0.9% 0.0% 1.4% 0.3% 0.7%
17 1.1% 0.6% 2.4% -0.6% 0.3% -0.5% 0.5% 0.4% -0.4% 0.2% -2.3% -1.1% -0.5% -0.2% -0.5% -0.3% -0.3% -0.5% -0.1% 0.0% 0.0% 1.1%
18 2.1% 0.7% 5.0% -1.3% 0.4% 2.0% 0.7% 0.7% -0.5% 0.4% -2.5% -1.9% -0.6% -0.1% -0.2% -1.1% -0.2% -0.7% 0.1% -0.1% 0.0% 2.1%
19 -0.7% 0.0% -0.4% 1.2% -0.2% 0.2% 0.1% -0.2% -0.2% 0.1% 0.5% 0.1% 0.1% 0.1% -0.1% -0.3% 0.2% 0.0% 0.0% 0.0% 0.0% -0.7%
20 -1.4% 0.0% 0.2% 5.5% 0.5% 3.0% 1.0% 0.2% 2.5% -0.1% 2.2% 4.0% -0.4% -0.7% -1.1% -0.4% -1.1% -0.4% 0.7% 0.3% 0.8% -1.4%
21 0.1% -0.1% 0.0% 0.1% -0.1% 0.2% -0.1% 0.0% 0.2% -0.1% 0.0% 0.1% 0.0% 0.2% 0.1% 0.3% 0.2% 0.1% 0.0% 0.1% 0.0% 0.1%
Total -0.5% -0.4% -1.9% 1.9% -1.0% -1.9% -1.4% -1.2% 1.8% 0.0% -0.6% 9.2% 0.7% 0.8% 0.7% 1.0% 1.0% 1.1% -0.5% -0.1% -0.1% -0.5%
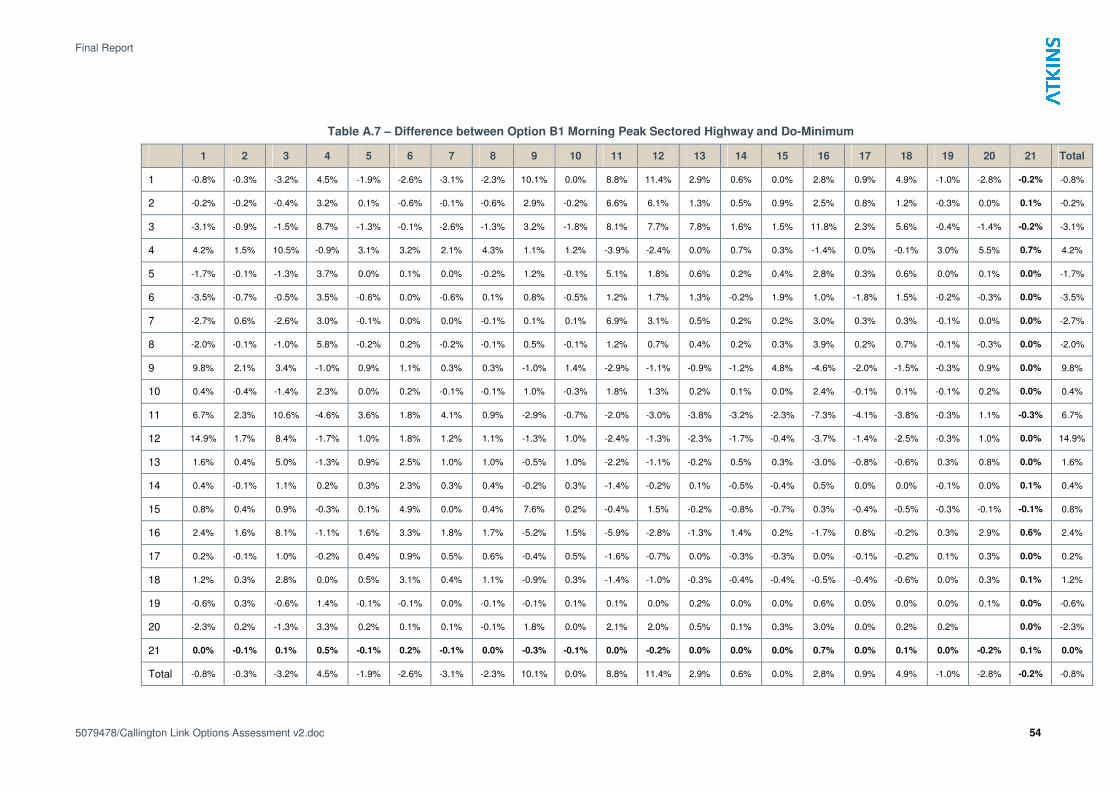
Final Report
5079478/Callington Link Options Assessment v2.doc 54
Table A.7 – Difference between Option B1 Morning Peak Sectored Highway and Do-Minimum
1 2 3 4 5 6 7 8 9 10 11 12 13 14 15 16 17 18 19 20 21 Total
1 -0.8% -0.3% -3.2% 4.5% -1.9% -2.6% -3.1% -2.3% 10.1% 0.0% 8.8% 11.4% 2.9% 0.6% 0.0% 2.8% 0.9% 4.9% -1.0% -2.8% -0.2% -0.8%
2 -0.2% -0.2% -0.4% 3.2% 0.1% -0.6% -0.1% -0.6% 2.9% -0.2% 6.6% 6.1% 1.3% 0.5% 0.9% 2.5% 0.8% 1.2% -0.3% 0.0% 0.1% -0.2%
3 -3.1% -0.9% -1.5% 8.7% -1.3% -0.1% -2.6% -1.3% 3.2% -1.8% 8.1% 7.7% 7.8% 1.6% 1.5% 11.8% 2.3% 5.6% -0.4% -1.4% -0.2% -3.1%
4 4.2% 1.5% 10.5% -0.9% 3.1% 3.2% 2.1% 4.3% 1.1% 1.2% -3.9% -2.4% 0.0% 0.7% 0.3% -1.4% 0.0% -0.1% 3.0% 5.5% 0.7% 4.2%
5 -1.7% -0.1% -1.3% 3.7% 0.0% 0.1% 0.0% -0.2% 1.2% -0.1% 5.1% 1.8% 0.6% 0.2% 0.4% 2.8% 0.3% 0.6% 0.0% 0.1% 0.0% -1.7%
6 -3.5% -0.7% -0.5% 3.5% -0.6% 0.0% -0.6% 0.1% 0.8% -0.5% 1.2% 1.7% 1.3% -0.2% 1.9% 1.0% -1.8% 1.5% -0.2% -0.3% 0.0% -3.5%
7 -2.7% 0.6% -2.6% 3.0% -0.1% 0.0% 0.0% -0.1% 0.1% 0.1% 6.9% 3.1% 0.5% 0.2% 0.2% 3.0% 0.3% 0.3% -0.1% 0.0% 0.0% -2.7%
8 -2.0% -0.1% -1.0% 5.8% -0.2% 0.2% -0.2% -0.1% 0.5% -0.1% 1.2% 0.7% 0.4% 0.2% 0.3% 3.9% 0.2% 0.7% -0.1% -0.3% 0.0% -2.0%
9 9.8% 2.1% 3.4% -1.0% 0.9% 1.1% 0.3% 0.3% -1.0% 1.4% -2.9% -1.1% -0.9% -1.2% 4.8% -4.6% -2.0% -1.5% -0.3% 0.9% 0.0% 9.8%
10 0.4% -0.4% -1.4% 2.3% 0.0% 0.2% -0.1% -0.1% 1.0% -0.3% 1.8% 1.3% 0.2% 0.1% 0.0% 2.4% -0.1% 0.1% -0.1% 0.2% 0.0% 0.4%
11 6.7% 2.3% 10.6% -4.6% 3.6% 1.8% 4.1% 0.9% -2.9% -0.7% -2.0% -3.0% -3.8% -3.2% -2.3% -7.3% -4.1% -3.8% -0.3% 1.1% -0.3% 6.7%
12 14.9% 1.7% 8.4% -1.7% 1.0% 1.8% 1.2% 1.1% -1.3% 1.0% -2.4% -1.3% -2.3% -1.7% -0.4% -3.7% -1.4% -2.5% -0.3% 1.0% 0.0% 14.9%
13 1.6% 0.4% 5.0% -1.3% 0.9% 2.5% 1.0% 1.0% -0.5% 1.0% -2.2% -1.1% -0.2% 0.5% 0.3% -3.0% -0.8% -0.6% 0.3% 0.8% 0.0% 1.6%
14 0.4% -0.1% 1.1% 0.2% 0.3% 2.3% 0.3% 0.4% -0.2% 0.3% -1.4% -0.2% 0.1% -0.5% -0.4% 0.5% 0.0% 0.0% -0.1% 0.0% 0.1% 0.4%
15 0.8% 0.4% 0.9% -0.3% 0.1% 4.9% 0.0% 0.4% 7.6% 0.2% -0.4% 1.5% -0.2% -0.8% -0.7% 0.3% -0.4% -0.5% -0.3% -0.1% -0.1% 0.8%
16 2.4% 1.6% 8.1% -1.1% 1.6% 3.3% 1.8% 1.7% -5.2% 1.5% -5.9% -2.8% -1.3% 1.4% 0.2% -1.7% 0.8% -0.2% 0.3% 2.9% 0.6% 2.4%
17 0.2% -0.1% 1.0% -0.2% 0.4% 0.9% 0.5% 0.6% -0.4% 0.5% -1.6% -0.7% 0.0% -0.3% -0.3% 0.0% -0.1% -0.2% 0.1% 0.3% 0.0% 0.2%
18 1.2% 0.3% 2.8% 0.0% 0.5% 3.1% 0.4% 1.1% -0.9% 0.3% -1.4% -1.0% -0.3% -0.4% -0.4% -0.5% -0.4% -0.6% 0.0% 0.3% 0.1% 1.2%
19 -0.6% 0.3% -0.6% 1.4% -0.1% -0.1% 0.0% -0.1% -0.1% 0.1% 0.1% 0.0% 0.2% 0.0% 0.0% 0.6% 0.0% 0.0% 0.0% 0.1% 0.0% -0.6%
20 -2.3% 0.2% -1.3% 3.3% 0.2% 0.1% 0.1% -0.1% 1.8% 0.0% 2.1% 2.0% 0.5% 0.1% 0.3% 3.0% 0.0% 0.2% 0.2% 0.0% -2.3%
21 0.0% -0.1% 0.1% 0.5% -0.1% 0.2% -0.1% 0.0% -0.3% -0.1% 0.0% -0.2% 0.0% 0.0% 0.0% 0.7% 0.0% 0.1% 0.0% -0.2% 0.1% 0.0%
Total -0.8% -0.3% -3.2% 4.5% -1.9% -2.6% -3.1% -2.3% 10.1% 0.0% 8.8% 11.4% 2.9% 0.6% 0.0% 2.8% 0.9% 4.9% -1.0% -2.8% -0.2% -0.8%
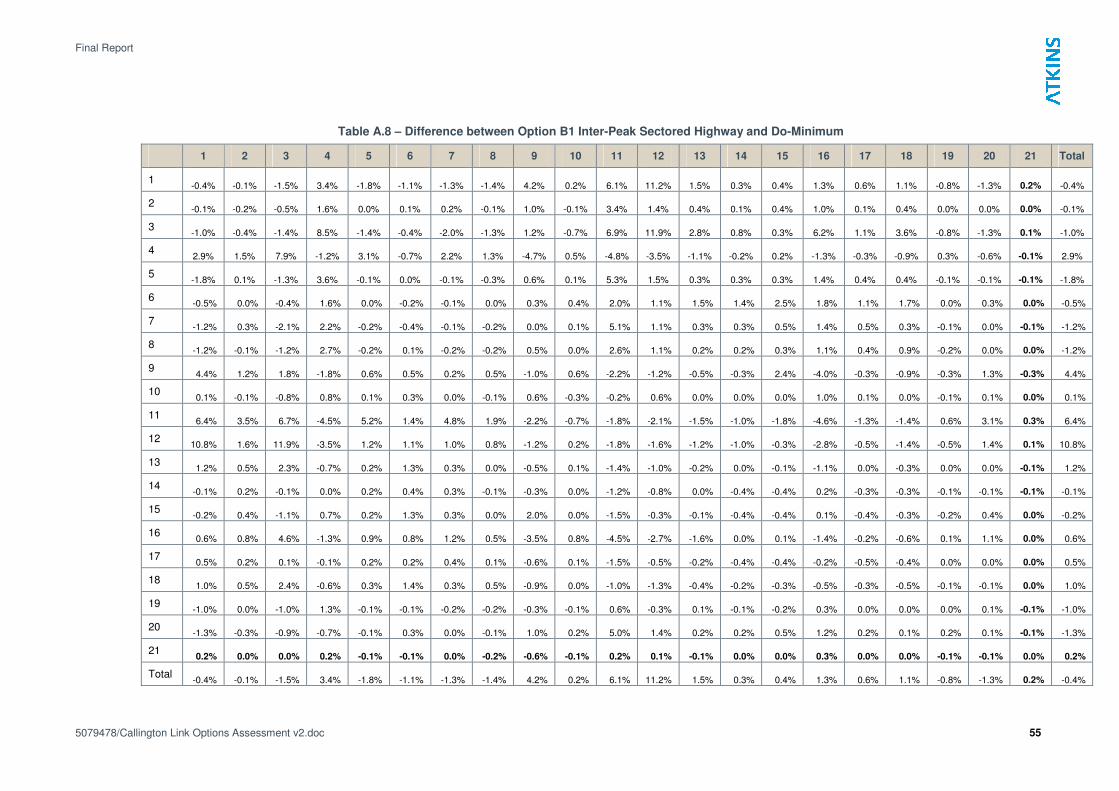
Final Report
5079478/Callington Link Options Assessment v2.doc 55
Table A.8 – Difference between Option B1 Inter-Peak Sectored Highway and Do-Minimum
1 2 3 4 5 6 7 8 9 10 11 12 13 14 15 16 17 18 19 20 21 Total
1 -0.4% -0.1% -1.5% 3.4% -1.8% -1.1% -1.3% -1.4% 4.2% 0.2% 6.1% 11.2% 1.5% 0.3% 0.4% 1.3% 0.6% 1.1% -0.8% -1.3% 0.2% -0.4%
2 -0.1% -0.2% -0.5% 1.6% 0.0% 0.1% 0.2% -0.1% 1.0% -0.1% 3.4% 1.4% 0.4% 0.1% 0.4% 1.0% 0.1% 0.4% 0.0% 0.0% 0.0% -0.1%
3 -1.0% -0.4% -1.4% 8.5% -1.4% -0.4% -2.0% -1.3% 1.2% -0.7% 6.9% 11.9% 2.8% 0.8% 0.3% 6.2% 1.1% 3.6% -0.8% -1.3% 0.1% -1.0%
4 2.9% 1.5% 7.9% -1.2% 3.1% -0.7% 2.2% 1.3% -4.7% 0.5% -4.8% -3.5% -1.1% -0.2% 0.2% -1.3% -0.3% -0.9% 0.3% -0.6% -0.1% 2.9%
5 -1.8% 0.1% -1.3% 3.6% -0.1% 0.0% -0.1% -0.3% 0.6% 0.1% 5.3% 1.5% 0.3% 0.3% 0.3% 1.4% 0.4% 0.4% -0.1% -0.1% -0.1% -1.8%
6 -0.5% 0.0% -0.4% 1.6% 0.0% -0.2% -0.1% 0.0% 0.3% 0.4% 2.0% 1.1% 1.5% 1.4% 2.5% 1.8% 1.1% 1.7% 0.0% 0.3% 0.0% -0.5%
7 -1.2% 0.3% -2.1% 2.2% -0.2% -0.4% -0.1% -0.2% 0.0% 0.1% 5.1% 1.1% 0.3% 0.3% 0.5% 1.4% 0.5% 0.3% -0.1% 0.0% -0.1% -1.2%
8 -1.2% -0.1% -1.2% 2.7% -0.2% 0.1% -0.2% -0.2% 0.5% 0.0% 2.6% 1.1% 0.2% 0.2% 0.3% 1.1% 0.4% 0.9% -0.2% 0.0% 0.0% -1.2%
9 4.4% 1.2% 1.8% -1.8% 0.6% 0.5% 0.2% 0.5% -1.0% 0.6% -2.2% -1.2% -0.5% -0.3% 2.4% -4.0% -0.3% -0.9% -0.3% 1.3% -0.3% 4.4%
10 0.1% -0.1% -0.8% 0.8% 0.1% 0.3% 0.0% -0.1% 0.6% -0.3% -0.2% 0.6% 0.0% 0.0% 0.0% 1.0% 0.1% 0.0% -0.1% 0.1% 0.0% 0.1%
11 6.4% 3.5% 6.7% -4.5% 5.2% 1.4% 4.8% 1.9% -2.2% -0.7% -1.8% -2.1% -1.5% -1.0% -1.8% -4.6% -1.3% -1.4% 0.6% 3.1% 0.3% 6.4%
12 10.8% 1.6% 11.9% -3.5% 1.2% 1.1% 1.0% 0.8% -1.2% 0.2% -1.8% -1.6% -1.2% -1.0% -0.3% -2.8% -0.5% -1.4% -0.5% 1.4% 0.1% 10.8%
13 1.2% 0.5% 2.3% -0.7% 0.2% 1.3% 0.3% 0.0% -0.5% 0.1% -1.4% -1.0% -0.2% 0.0% -0.1% -1.1% 0.0% -0.3% 0.0% 0.0% -0.1% 1.2%
14 -0.1% 0.2% -0.1% 0.0% 0.2% 0.4% 0.3% -0.1% -0.3% 0.0% -1.2% -0.8% 0.0% -0.4% -0.4% 0.2% -0.3% -0.3% -0.1% -0.1% -0.1% -0.1%
15 -0.2% 0.4% -1.1% 0.7% 0.2% 1.3% 0.3% 0.0% 2.0% 0.0% -1.5% -0.3% -0.1% -0.4% -0.4% 0.1% -0.4% -0.3% -0.2% 0.4% 0.0% -0.2%
16 0.6% 0.8% 4.6% -1.3% 0.9% 0.8% 1.2% 0.5% -3.5% 0.8% -4.5% -2.7% -1.6% 0.0% 0.1% -1.4% -0.2% -0.6% 0.1% 1.1% 0.0% 0.6%
17 0.5% 0.2% 0.1% -0.1% 0.2% 0.2% 0.4% 0.1% -0.6% 0.1% -1.5% -0.5% -0.2% -0.4% -0.4% -0.2% -0.5% -0.4% 0.0% 0.0% 0.0% 0.5%
18 1.0% 0.5% 2.4% -0.6% 0.3% 1.4% 0.3% 0.5% -0.9% 0.0% -1.0% -1.3% -0.4% -0.2% -0.3% -0.5% -0.3% -0.5% -0.1% -0.1% 0.0% 1.0%
19 -1.0% 0.0% -1.0% 1.3% -0.1% -0.1% -0.2% -0.2% -0.3% -0.1% 0.6% -0.3% 0.1% -0.1% -0.2% 0.3% 0.0% 0.0% 0.0% 0.1% -0.1% -1.0%
20 -1.3% -0.3% -0.9% -0.7% -0.1% 0.3% 0.0% -0.1% 1.0% 0.2% 5.0% 1.4% 0.2% 0.2% 0.5% 1.2% 0.2% 0.1% 0.2% 0.1% -0.1% -1.3%
21 0.2% 0.0% 0.0% 0.2% -0.1% -0.1% 0.0% -0.2% -0.6% -0.1% 0.2% 0.1% -0.1% 0.0% 0.0% 0.3% 0.0% 0.0% -0.1% -0.1% 0.0% 0.2%
Total -0.4% -0.1% -1.5% 3.4% -1.8% -1.1% -1.3% -1.4% 4.2% 0.2% 6.1% 11.2% 1.5% 0.3% 0.4% 1.3% 0.6% 1.1% -0.8% -1.3% 0.2% -0.4%

Final Report
5079478/Callington Link Options Assessment v2.doc 56
Table A.9 – Difference between Option B1 Evening Peak Sectored Highway and Do-Minimum
1 2 3 4 5 6 7 8 9 10 11 12 13 14 15 16 17 18 19 20 21 Total
1 -0.6% -0.3% -2.3% 3.8% -2.2% -2.5% -2.3% -2.2% 8.1% 0.2% 4.5% 14.0% 2.0% 0.9% 1.2% 2.4% 1.1% 1.7% -0.8% -1.9% 0.0% -0.6%
2 -0.4% -0.2% -0.6% 1.1% 0.0% 0.1% 0.8% -0.1% 2.1% -0.3% 3.2% 2.8% 0.6% 0.2% 0.7% 1.0% -0.5% 0.6% 0.1% 0.1% -0.1% -0.4%
3 -2.5% -0.6% -1.4% 8.9% -1.4% -0.4% -2.3% -1.4% 3.1% -1.3% 6.0% 8.5% 5.4% 1.9% 0.4% 9.3% 2.2% 3.8% -1.0% -1.2% -0.1% -2.5%
4 4.5% 2.1% 9.1% -1.2% 3.6% 6.9% 2.7% 7.4% 0.3% 1.2% -4.3% -2.5% -1.3% -0.2% 0.1% -1.4% -0.4% -0.7% 1.5% 3.8% 0.7% 4.5%
5 -2.1% 0.2% -1.2% 3.0% -0.1% 0.0% -0.1% -0.3% 0.7% 0.6% 5.2% 1.7% 1.6% 1.5% 1.1% 1.4% 0.9% 1.1% 0.0% 0.1% 0.0% -2.1%
6 -1.8% 0.1% -0.3% 1.9% 0.2% -0.1% -0.1% 0.0% 0.5% 0.6% 2.0% 1.1% 1.7% 2.9% 3.8% 1.4% 0.7% 2.0% 0.0% 0.4% 0.0% -1.8%
7 -2.4% -0.4% -2.1% 1.7% 0.0% 0.0% 0.0% -0.1% 0.3% 0.0% 5.3% 1.3% 1.0% 1.0% 0.6% 1.4% 1.2% 0.8% 0.0% 0.4% -0.1% -2.4%
8 -2.2% -0.6% -1.3% 2.6% -0.5% 0.3% -0.1% -0.2% 0.3% -0.1% 2.3% 1.0% 0.7% 0.8% 0.6% 0.9% 1.3% 1.1% -0.1% -0.2% -0.1% -2.2%
9 7.7% 1.3% 3.8% -1.6% 0.8% 0.7% 0.1% 0.4% -0.9% 0.5% -1.9% -1.1% -0.4% 0.3% 0.4% -6.3% 0.4% -0.6% -0.2% 1.6% -0.1% 7.7%
10 -0.2% -0.2% -1.2% 0.9% -0.1% 0.3% 0.0% -0.1% 1.0% -0.3% 0.2% 1.0% 0.9% 0.6% 0.4% 1.4% 0.9% 0.6% 0.1% -0.1% 0.0% -0.2%
11 8.8% 4.0% 8.6% -4.3% 4.6% 1.7% 5.1% 2.0% -2.0% -0.6% -1.4% -2.0% -1.6% -2.4% -2.1% -6.0% -2.6% -1.8% -0.1% 3.3% 0.1% 8.8%
12 11.5% 8.4% 11.1% -4.3% 1.9% 1.5% 1.7% 0.7% -1.0% 1.0% -1.7% -1.2% -0.7% -0.2% 0.5% -2.9% 0.0% -1.0% -0.2% 2.6% -0.3% 11.5%
13 2.4% 1.1% 6.7% -1.1% 0.8% 1.7% 0.6% 0.4% -0.6% 0.4% -1.9% -1.6% -0.2% 0.2% 0.0% -1.4% 0.2% -0.3% 0.2% 0.4% 0.0% 2.4%
14 0.5% 0.4% 1.9% -0.3% 0.3% 0.5% 0.2% 0.1% -0.2% 0.0% -1.8% -0.8% -0.1% -0.4% -0.6% 0.4% -0.4% -0.4% 0.0% 0.0% 0.0% 0.5%
15 0.5% 0.5% 1.6% -0.2% 0.2% 1.8% 0.3% 0.1% 1.3% 0.1% -1.9% -0.5% -0.3% -0.4% -0.6% 0.0% -0.3% -0.4% -0.1% 0.1% 0.0% 0.5%
16 2.1% 1.3% 9.3% -1.7% 1.9% 1.8% 1.6% 3.0% -3.5% 1.4% -5.2% -3.0% -2.2% 0.4% 0.4% -1.8% -0.1% -0.6% 0.3% 2.2% 0.5% 2.1%
17 0.9% 0.3% 2.1% -0.6% 0.3% 0.2% 0.4% 0.4% -0.7% 0.1% -2.2% -0.7% -0.5% -0.2% -0.4% -0.1% -0.4% -0.5% 0.0% 0.8% 0.0% 0.9%
18 2.6% 0.6% 4.3% -1.2% 0.5% 1.8% 0.4% 0.7% -0.8% 0.2% -2.3% -1.8% -0.5% -0.1% -0.3% -0.6% -0.2% -0.6% 0.1% 0.0% 0.0% 2.6%
19 -0.9% -0.3% -0.4% 1.5% -0.2% 0.1% -0.1% -0.2% -0.3% -0.1% 0.5% -0.1% 0.1% 0.1% -0.2% 0.1% 0.2% 0.0% 0.0% 0.2% 0.0% -0.9%
20 -2.3% 0.3% -0.6% 0.3% 0.0% 0.2% 0.0% -0.3% 0.2% 0.5% 2.8% 0.9% 0.5% 0.2% 0.5% 2.4% 0.5% 0.5% 0.1% 0.2% 0.0% -2.3%
21 0.0% 0.0% 0.1% 0.3% -0.1% 0.3% 0.0% 0.0% 0.3% 0.0% 0.1% -0.1% 0.0% 0.3% 0.2% 0.4% 0.2% 0.1% 0.0% 0.0% 0.1% 0.0%
Total -0.6% -0.3% -2.3% 3.8% -2.2% -2.5% -2.3% -2.2% 8.1% 0.2% 4.5% 14.0% 2.0% 0.9% 1.2% 2.4% 1.1% 1.7% -0.8% -1.9% 0.0% -0.6%
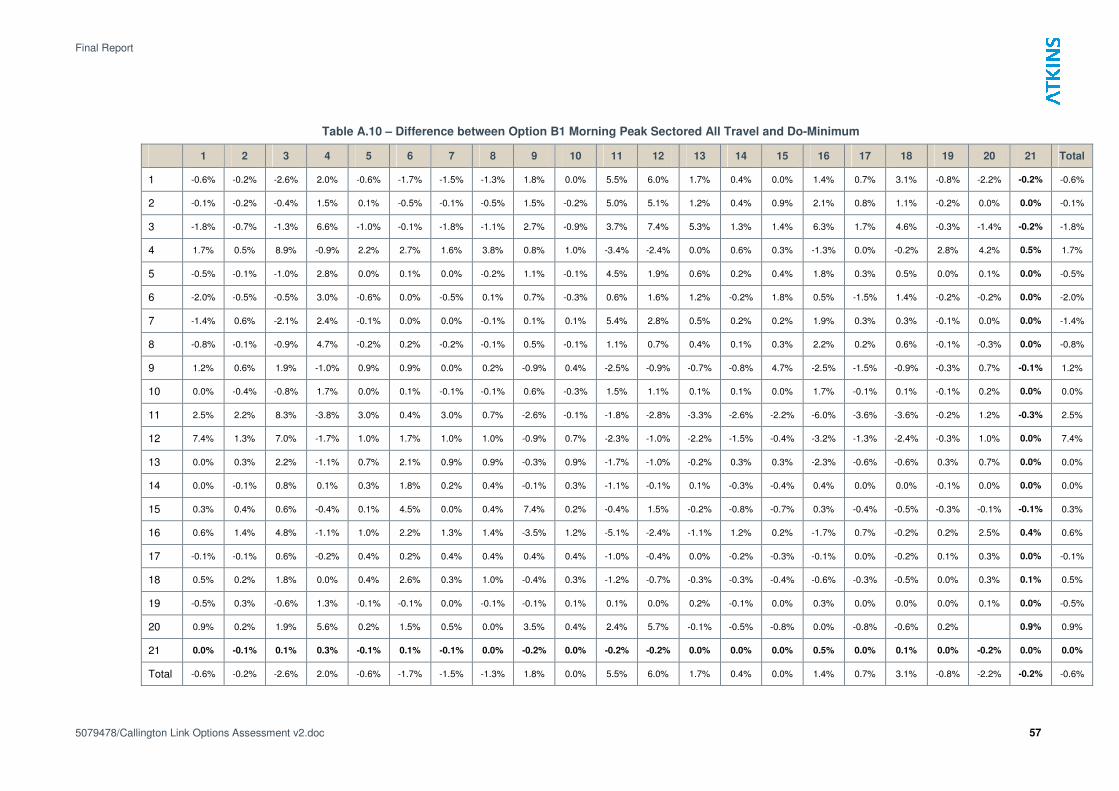
Final Report
5079478/Callington Link Options Assessment v2.doc 57
Table A.10 – Difference between Option B1 Morning Peak Sectored All Travel and Do-Minimum
1 2 3 4 5 6 7 8 9 10 11 12 13 14 15 16 17 18 19 20 21 Total
1 -0.6% -0.2% -2.6% 2.0% -0.6% -1.7% -1.5% -1.3% 1.8% 0.0% 5.5% 6.0% 1.7% 0.4% 0.0% 1.4% 0.7% 3.1% -0.8% -2.2% -0.2% -0.6%
2 -0.1% -0.2% -0.4% 1.5% 0.1% -0.5% -0.1% -0.5% 1.5% -0.2% 5.0% 5.1% 1.2% 0.4% 0.9% 2.1% 0.8% 1.1% -0.2% 0.0% 0.0% -0.1%
3 -1.8% -0.7% -1.3% 6.6% -1.0% -0.1% -1.8% -1.1% 2.7% -0.9% 3.7% 7.4% 5.3% 1.3% 1.4% 6.3% 1.7% 4.6% -0.3% -1.4% -0.2% -1.8%
4 1.7% 0.5% 8.9% -0.9% 2.2% 2.7% 1.6% 3.8% 0.8% 1.0% -3.4% -2.4% 0.0% 0.6% 0.3% -1.3% 0.0% -0.2% 2.8% 4.2% 0.5% 1.7%
5 -0.5% -0.1% -1.0% 2.8% 0.0% 0.1% 0.0% -0.2% 1.1% -0.1% 4.5% 1.9% 0.6% 0.2% 0.4% 1.8% 0.3% 0.5% 0.0% 0.1% 0.0% -0.5%
6 -2.0% -0.5% -0.5% 3.0% -0.6% 0.0% -0.5% 0.1% 0.7% -0.3% 0.6% 1.6% 1.2% -0.2% 1.8% 0.5% -1.5% 1.4% -0.2% -0.2% 0.0% -2.0%
7 -1.4% 0.6% -2.1% 2.4% -0.1% 0.0% 0.0% -0.1% 0.1% 0.1% 5.4% 2.8% 0.5% 0.2% 0.2% 1.9% 0.3% 0.3% -0.1% 0.0% 0.0% -1.4%
8 -0.8% -0.1% -0.9% 4.7% -0.2% 0.2% -0.2% -0.1% 0.5% -0.1% 1.1% 0.7% 0.4% 0.1% 0.3% 2.2% 0.2% 0.6% -0.1% -0.3% 0.0% -0.8%
9 1.2% 0.6% 1.9% -1.0% 0.9% 0.9% 0.0% 0.2% -0.9% 0.4% -2.5% -0.9% -0.7% -0.8% 4.7% -2.5% -1.5% -0.9% -0.3% 0.7% -0.1% 1.2%
10 0.0% -0.4% -0.8% 1.7% 0.0% 0.1% -0.1% -0.1% 0.6% -0.3% 1.5% 1.1% 0.1% 0.1% 0.0% 1.7% -0.1% 0.1% -0.1% 0.2% 0.0% 0.0%
11 2.5% 2.2% 8.3% -3.8% 3.0% 0.4% 3.0% 0.7% -2.6% -0.1% -1.8% -2.8% -3.3% -2.6% -2.2% -6.0% -3.6% -3.6% -0.2% 1.2% -0.3% 2.5%
12 7.4% 1.3% 7.0% -1.7% 1.0% 1.7% 1.0% 1.0% -0.9% 0.7% -2.3% -1.0% -2.2% -1.5% -0.4% -3.2% -1.3% -2.4% -0.3% 1.0% 0.0% 7.4%
13 0.0% 0.3% 2.2% -1.1% 0.7% 2.1% 0.9% 0.9% -0.3% 0.9% -1.7% -1.0% -0.2% 0.3% 0.3% -2.3% -0.6% -0.6% 0.3% 0.7% 0.0% 0.0%
14 0.0% -0.1% 0.8% 0.1% 0.3% 1.8% 0.2% 0.4% -0.1% 0.3% -1.1% -0.1% 0.1% -0.3% -0.4% 0.4% 0.0% 0.0% -0.1% 0.0% 0.0% 0.0%
15 0.3% 0.4% 0.6% -0.4% 0.1% 4.5% 0.0% 0.4% 7.4% 0.2% -0.4% 1.5% -0.2% -0.8% -0.7% 0.3% -0.4% -0.5% -0.3% -0.1% -0.1% 0.3%
16 0.6% 1.4% 4.8% -1.1% 1.0% 2.2% 1.3% 1.4% -3.5% 1.2% -5.1% -2.4% -1.1% 1.2% 0.2% -1.7% 0.7% -0.2% 0.2% 2.5% 0.4% 0.6%
17 -0.1% -0.1% 0.6% -0.2% 0.4% 0.2% 0.4% 0.4% 0.4% 0.4% -1.0% -0.4% 0.0% -0.2% -0.3% -0.1% 0.0% -0.2% 0.1% 0.3% 0.0% -0.1%
18 0.5% 0.2% 1.8% 0.0% 0.4% 2.6% 0.3% 1.0% -0.4% 0.3% -1.2% -0.7% -0.3% -0.3% -0.4% -0.6% -0.3% -0.5% 0.0% 0.3% 0.1% 0.5%
19 -0.5% 0.3% -0.6% 1.3% -0.1% -0.1% 0.0% -0.1% -0.1% 0.1% 0.1% 0.0% 0.2% -0.1% 0.0% 0.3% 0.0% 0.0% 0.0% 0.1% 0.0% -0.5%
20 0.9% 0.2% 1.9% 5.6% 0.2% 1.5% 0.5% 0.0% 3.5% 0.4% 2.4% 5.7% -0.1% -0.5% -0.8% 0.0% -0.8% -0.6% 0.2% 0.9% 0.9%
21 0.0% -0.1% 0.1% 0.3% -0.1% 0.1% -0.1% 0.0% -0.2% 0.0% -0.2% -0.2% 0.0% 0.0% 0.0% 0.5% 0.0% 0.1% 0.0% -0.2% 0.0% 0.0%
Total -0.6% -0.2% -2.6% 2.0% -0.6% -1.7% -1.5% -1.3% 1.8% 0.0% 5.5% 6.0% 1.7% 0.4% 0.0% 1.4% 0.7% 3.1% -0.8% -2.2% -0.2% -0.6%
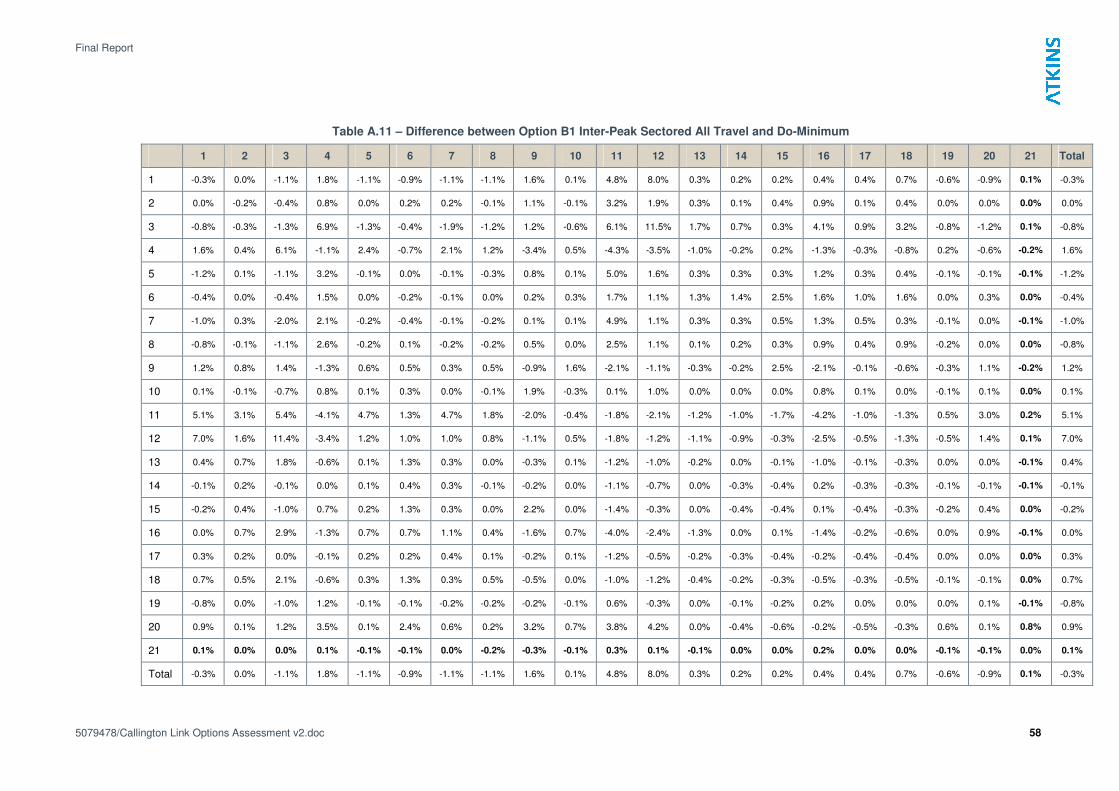
Final Report
5079478/Callington Link Options Assessment v2.doc 58
Table A.11 – Difference between Option B1 Inter-Peak Sectored All Travel and Do-Minimum
1 2 3 4 5 6 7 8 9 10 11 12 13 14 15 16 17 18 19 20 21 Total
1 -0.3% 0.0% -1.1% 1.8% -1.1% -0.9% -1.1% -1.1% 1.6% 0.1% 4.8% 8.0% 0.3% 0.2% 0.2% 0.4% 0.4% 0.7% -0.6% -0.9% 0.1% -0.3%
2 0.0% -0.2% -0.4% 0.8% 0.0% 0.2% 0.2% -0.1% 1.1% -0.1% 3.2% 1.9% 0.3% 0.1% 0.4% 0.9% 0.1% 0.4% 0.0% 0.0% 0.0% 0.0%
3 -0.8% -0.3% -1.3% 6.9% -1.3% -0.4% -1.9% -1.2% 1.2% -0.6% 6.1% 11.5% 1.7% 0.7% 0.3% 4.1% 0.9% 3.2% -0.8% -1.2% 0.1% -0.8%
4 1.6% 0.4% 6.1% -1.1% 2.4% -0.7% 2.1% 1.2% -3.4% 0.5% -4.3% -3.5% -1.0% -0.2% 0.2% -1.3% -0.3% -0.8% 0.2% -0.6% -0.2% 1.6%
5 -1.2% 0.1% -1.1% 3.2% -0.1% 0.0% -0.1% -0.3% 0.8% 0.1% 5.0% 1.6% 0.3% 0.3% 0.3% 1.2% 0.3% 0.4% -0.1% -0.1% -0.1% -1.2%
6 -0.4% 0.0% -0.4% 1.5% 0.0% -0.2% -0.1% 0.0% 0.2% 0.3% 1.7% 1.1% 1.3% 1.4% 2.5% 1.6% 1.0% 1.6% 0.0% 0.3% 0.0% -0.4%
7 -1.0% 0.3% -2.0% 2.1% -0.2% -0.4% -0.1% -0.2% 0.1% 0.1% 4.9% 1.1% 0.3% 0.3% 0.5% 1.3% 0.5% 0.3% -0.1% 0.0% -0.1% -1.0%
8 -0.8% -0.1% -1.1% 2.6% -0.2% 0.1% -0.2% -0.2% 0.5% 0.0% 2.5% 1.1% 0.1% 0.2% 0.3% 0.9% 0.4% 0.9% -0.2% 0.0% 0.0% -0.8%
9 1.2% 0.8% 1.4% -1.3% 0.6% 0.5% 0.3% 0.5% -0.9% 1.6% -2.1% -1.1% -0.3% -0.2% 2.5% -2.1% -0.1% -0.6% -0.3% 1.1% -0.2% 1.2%
10 0.1% -0.1% -0.7% 0.8% 0.1% 0.3% 0.0% -0.1% 1.9% -0.3% 0.1% 1.0% 0.0% 0.0% 0.0% 0.8% 0.1% 0.0% -0.1% 0.1% 0.0% 0.1%
11 5.1% 3.1% 5.4% -4.1% 4.7% 1.3% 4.7% 1.8% -2.0% -0.4% -1.8% -2.1% -1.2% -1.0% -1.7% -4.2% -1.0% -1.3% 0.5% 3.0% 0.2% 5.1%
12 7.0% 1.6% 11.4% -3.4% 1.2% 1.0% 1.0% 0.8% -1.1% 0.5% -1.8% -1.2% -1.1% -0.9% -0.3% -2.5% -0.5% -1.3% -0.5% 1.4% 0.1% 7.0%
13 0.4% 0.7% 1.8% -0.6% 0.1% 1.3% 0.3% 0.0% -0.3% 0.1% -1.2% -1.0% -0.2% 0.0% -0.1% -1.0% -0.1% -0.3% 0.0% 0.0% -0.1% 0.4%
14 -0.1% 0.2% -0.1% 0.0% 0.1% 0.4% 0.3% -0.1% -0.2% 0.0% -1.1% -0.7% 0.0% -0.3% -0.4% 0.2% -0.3% -0.3% -0.1% -0.1% -0.1% -0.1%
15 -0.2% 0.4% -1.0% 0.7% 0.2% 1.3% 0.3% 0.0% 2.2% 0.0% -1.4% -0.3% 0.0% -0.4% -0.4% 0.1% -0.4% -0.3% -0.2% 0.4% 0.0% -0.2%
16 0.0% 0.7% 2.9% -1.3% 0.7% 0.7% 1.1% 0.4% -1.6% 0.7% -4.0% -2.4% -1.3% 0.0% 0.1% -1.4% -0.2% -0.6% 0.0% 0.9% -0.1% 0.0%
17 0.3% 0.2% 0.0% -0.1% 0.2% 0.2% 0.4% 0.1% -0.2% 0.1% -1.2% -0.5% -0.2% -0.3% -0.4% -0.2% -0.4% -0.4% 0.0% 0.0% 0.0% 0.3%
18 0.7% 0.5% 2.1% -0.6% 0.3% 1.3% 0.3% 0.5% -0.5% 0.0% -1.0% -1.2% -0.4% -0.2% -0.3% -0.5% -0.3% -0.5% -0.1% -0.1% 0.0% 0.7%
19 -0.8% 0.0% -1.0% 1.2% -0.1% -0.1% -0.2% -0.2% -0.2% -0.1% 0.6% -0.3% 0.0% -0.1% -0.2% 0.2% 0.0% 0.0% 0.0% 0.1% -0.1% -0.8%
20 0.9% 0.1% 1.2% 3.5% 0.1% 2.4% 0.6% 0.2% 3.2% 0.7% 3.8% 4.2% 0.0% -0.4% -0.6% -0.2% -0.5% -0.3% 0.6% 0.1% 0.8% 0.9%
21 0.1% 0.0% 0.0% 0.1% -0.1% -0.1% 0.0% -0.2% -0.3% -0.1% 0.3% 0.1% -0.1% 0.0% 0.0% 0.2% 0.0% 0.0% -0.1% -0.1% 0.0% 0.1%
Total -0.3% 0.0% -1.1% 1.8% -1.1% -0.9% -1.1% -1.1% 1.6% 0.1% 4.8% 8.0% 0.3% 0.2% 0.2% 0.4% 0.4% 0.7% -0.6% -0.9% 0.1% -0.3%
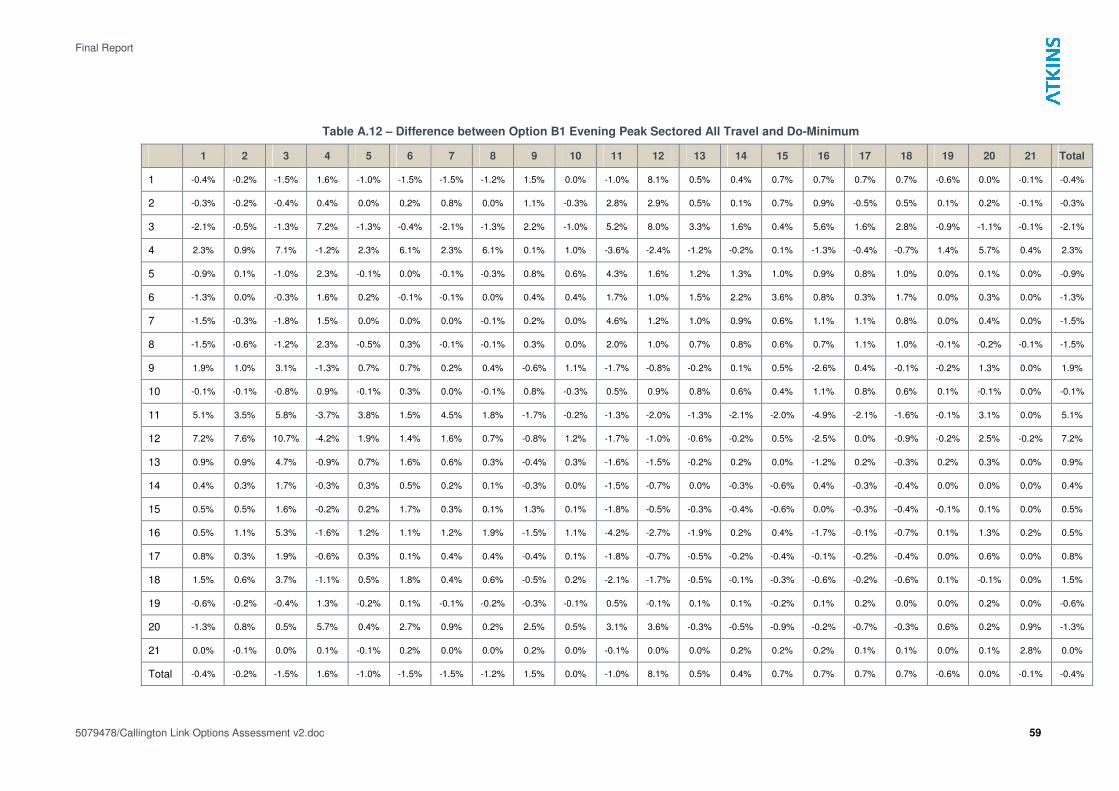
Final Report
5079478/Callington Link Options Assessment v2.doc 59
Table A.12 – Difference between Option B1 Evening Peak Sectored All Travel and Do-Minimum
1 2 3 4 5 6 7 8 9 10 11 12 13 14 15 16 17 18 19 20 21 Total
1 -0.4% -0.2% -1.5% 1.6% -1.0% -1.5% -1.5% -1.2% 1.5% 0.0% -1.0% 8.1% 0.5% 0.4% 0.7% 0.7% 0.7% 0.7% -0.6% 0.0% -0.1% -0.4%
2 -0.3% -0.2% -0.4% 0.4% 0.0% 0.2% 0.8% 0.0% 1.1% -0.3% 2.8% 2.9% 0.5% 0.1% 0.7% 0.9% -0.5% 0.5% 0.1% 0.2% -0.1% -0.3%
3 -2.1% -0.5% -1.3% 7.2% -1.3% -0.4% -2.1% -1.3% 2.2% -1.0% 5.2% 8.0% 3.3% 1.6% 0.4% 5.6% 1.6% 2.8% -0.9% -1.1% -0.1% -2.1%
4 2.3% 0.9% 7.1% -1.2% 2.3% 6.1% 2.3% 6.1% 0.1% 1.0% -3.6% -2.4% -1.2% -0.2% 0.1% -1.3% -0.4% -0.7% 1.4% 5.7% 0.4% 2.3%
5 -0.9% 0.1% -1.0% 2.3% -0.1% 0.0% -0.1% -0.3% 0.8% 0.6% 4.3% 1.6% 1.2% 1.3% 1.0% 0.9% 0.8% 1.0% 0.0% 0.1% 0.0% -0.9%
6 -1.3% 0.0% -0.3% 1.6% 0.2% -0.1% -0.1% 0.0% 0.4% 0.4% 1.7% 1.0% 1.5% 2.2% 3.6% 0.8% 0.3% 1.7% 0.0% 0.3% 0.0% -1.3%
7 -1.5% -0.3% -1.8% 1.5% 0.0% 0.0% 0.0% -0.1% 0.2% 0.0% 4.6% 1.2% 1.0% 0.9% 0.6% 1.1% 1.1% 0.8% 0.0% 0.4% 0.0% -1.5%
8 -1.5% -0.6% -1.2% 2.3% -0.5% 0.3% -0.1% -0.1% 0.3% 0.0% 2.0% 1.0% 0.7% 0.8% 0.6% 0.7% 1.1% 1.0% -0.1% -0.2% -0.1% -1.5%
9 1.9% 1.0% 3.1% -1.3% 0.7% 0.7% 0.2% 0.4% -0.6% 1.1% -1.7% -0.8% -0.2% 0.1% 0.5% -2.6% 0.4% -0.1% -0.2% 1.3% 0.0% 1.9%
10 -0.1% -0.1% -0.8% 0.9% -0.1% 0.3% 0.0% -0.1% 0.8% -0.3% 0.5% 0.9% 0.8% 0.6% 0.4% 1.1% 0.8% 0.6% 0.1% -0.1% 0.0% -0.1%
11 5.1% 3.5% 5.8% -3.7% 3.8% 1.5% 4.5% 1.8% -1.7% -0.2% -1.3% -2.0% -1.3% -2.1% -2.0% -4.9% -2.1% -1.6% -0.1% 3.1% 0.0% 5.1%
12 7.2% 7.6% 10.7% -4.2% 1.9% 1.4% 1.6% 0.7% -0.8% 1.2% -1.7% -1.0% -0.6% -0.2% 0.5% -2.5% 0.0% -0.9% -0.2% 2.5% -0.2% 7.2%
13 0.9% 0.9% 4.7% -0.9% 0.7% 1.6% 0.6% 0.3% -0.4% 0.3% -1.6% -1.5% -0.2% 0.2% 0.0% -1.2% 0.2% -0.3% 0.2% 0.3% 0.0% 0.9%
14 0.4% 0.3% 1.7% -0.3% 0.3% 0.5% 0.2% 0.1% -0.3% 0.0% -1.5% -0.7% 0.0% -0.3% -0.6% 0.4% -0.3% -0.4% 0.0% 0.0% 0.0% 0.4%
15 0.5% 0.5% 1.6% -0.2% 0.2% 1.7% 0.3% 0.1% 1.3% 0.1% -1.8% -0.5% -0.3% -0.4% -0.6% 0.0% -0.3% -0.4% -0.1% 0.1% 0.0% 0.5%
16 0.5% 1.1% 5.3% -1.6% 1.2% 1.1% 1.2% 1.9% -1.5% 1.1% -4.2% -2.7% -1.9% 0.2% 0.4% -1.7% -0.1% -0.7% 0.1% 1.3% 0.2% 0.5%
17 0.8% 0.3% 1.9% -0.6% 0.3% 0.1% 0.4% 0.4% -0.4% 0.1% -1.8% -0.7% -0.5% -0.2% -0.4% -0.1% -0.2% -0.4% 0.0% 0.6% 0.0% 0.8%
18 1.5% 0.6% 3.7% -1.1% 0.5% 1.8% 0.4% 0.6% -0.5% 0.2% -2.1% -1.7% -0.5% -0.1% -0.3% -0.6% -0.2% -0.6% 0.1% -0.1% 0.0% 1.5%
19 -0.6% -0.2% -0.4% 1.3% -0.2% 0.1% -0.1% -0.2% -0.3% -0.1% 0.5% -0.1% 0.1% 0.1% -0.2% 0.1% 0.2% 0.0% 0.0% 0.2% 0.0% -0.6%
20 -1.3% 0.8% 0.5% 5.7% 0.4% 2.7% 0.9% 0.2% 2.5% 0.5% 3.1% 3.6% -0.3% -0.5% -0.9% -0.2% -0.7% -0.3% 0.6% 0.2% 0.9% -1.3%
21 0.0% -0.1% 0.0% 0.1% -0.1% 0.2% 0.0% 0.0% 0.2% 0.0% -0.1% 0.0% 0.0% 0.2% 0.2% 0.2% 0.1% 0.1% 0.0% 0.1% 2.8% 0.0%
Total -0.4% -0.2% -1.5% 1.6% -1.0% -1.5% -1.5% -1.2% 1.5% 0.0% -1.0% 8.1% 0.5% 0.4% 0.7% 0.7% 0.7% 0.7% -0.6% 0.0% -0.1% -0.4%
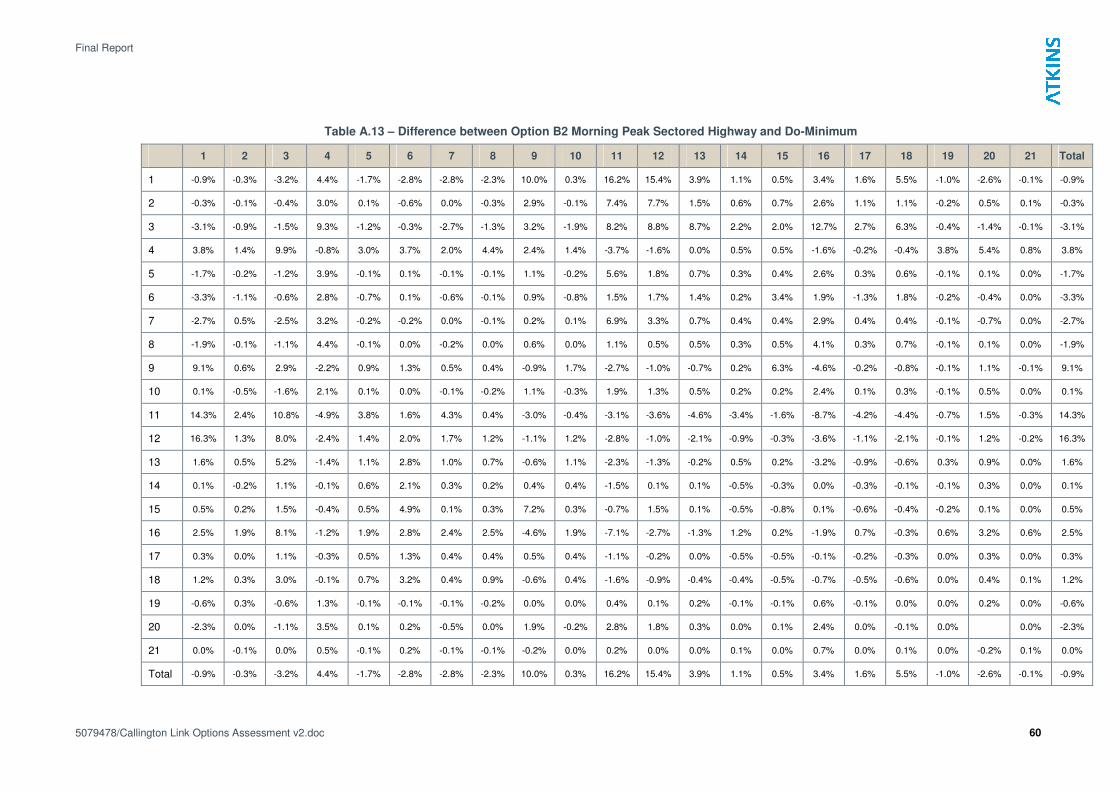
Final Report
5079478/Callington Link Options Assessment v2.doc 60
Table A.13 – Difference between Option B2 Morning Peak Sectored Highway and Do-Minimum
1 2 3 4 5 6 7 8 9 10 11 12 13 14 15 16 17 18 19 20 21 Total
1 -0.9% -0.3% -3.2% 4.4% -1.7% -2.8% -2.8% -2.3% 10.0% 0.3% 16.2% 15.4% 3.9% 1.1% 0.5% 3.4% 1.6% 5.5% -1.0% -2.6% -0.1% -0.9%
2 -0.3% -0.1% -0.4% 3.0% 0.1% -0.6% 0.0% -0.3% 2.9% -0.1% 7.4% 7.7% 1.5% 0.6% 0.7% 2.6% 1.1% 1.1% -0.2% 0.5% 0.1% -0.3%
3 -3.1% -0.9% -1.5% 9.3% -1.2% -0.3% -2.7% -1.3% 3.2% -1.9% 8.2% 8.8% 8.7% 2.2% 2.0% 12.7% 2.7% 6.3% -0.4% -1.4% -0.1% -3.1%
4 3.8% 1.4% 9.9% -0.8% 3.0% 3.7% 2.0% 4.4% 2.4% 1.4% -3.7% -1.6% 0.0% 0.5% 0.5% -1.6% -0.2% -0.4% 3.8% 5.4% 0.8% 3.8%
5 -1.7% -0.2% -1.2% 3.9% -0.1% 0.1% -0.1% -0.1% 1.1% -0.2% 5.6% 1.8% 0.7% 0.3% 0.4% 2.6% 0.3% 0.6% -0.1% 0.1% 0.0% -1.7%
6 -3.3% -1.1% -0.6% 2.8% -0.7% 0.1% -0.6% -0.1% 0.9% -0.8% 1.5% 1.7% 1.4% 0.2% 3.4% 1.9% -1.3% 1.8% -0.2% -0.4% 0.0% -3.3%
7 -2.7% 0.5% -2.5% 3.2% -0.2% -0.2% 0.0% -0.1% 0.2% 0.1% 6.9% 3.3% 0.7% 0.4% 0.4% 2.9% 0.4% 0.4% -0.1% -0.7% 0.0% -2.7%
8 -1.9% -0.1% -1.1% 4.4% -0.1% 0.0% -0.2% 0.0% 0.6% 0.0% 1.1% 0.5% 0.5% 0.3% 0.5% 4.1% 0.3% 0.7% -0.1% 0.1% 0.0% -1.9%
9 9.1% 0.6% 2.9% -2.2% 0.9% 1.3% 0.5% 0.4% -0.9% 1.7% -2.7% -1.0% -0.7% 0.2% 6.3% -4.6% -0.2% -0.8% -0.1% 1.1% -0.1% 9.1%
10 0.1% -0.5% -1.6% 2.1% 0.1% 0.0% -0.1% -0.2% 1.1% -0.3% 1.9% 1.3% 0.5% 0.2% 0.2% 2.4% 0.1% 0.3% -0.1% 0.5% 0.0% 0.1%
11 14.3% 2.4% 10.8% -4.9% 3.8% 1.6% 4.3% 0.4% -3.0% -0.4% -3.1% -3.6% -4.6% -3.4% -1.6% -8.7% -4.2% -4.4% -0.7% 1.5% -0.3% 14.3%
12 16.3% 1.3% 8.0% -2.4% 1.4% 2.0% 1.7% 1.2% -1.1% 1.2% -2.8% -1.0% -2.1% -0.9% -0.3% -3.6% -1.1% -2.1% -0.1% 1.2% -0.2% 16.3%
13 1.6% 0.5% 5.2% -1.4% 1.1% 2.8% 1.0% 0.7% -0.6% 1.1% -2.3% -1.3% -0.2% 0.5% 0.2% -3.2% -0.9% -0.6% 0.3% 0.9% 0.0% 1.6%
14 0.1% -0.2% 1.1% -0.1% 0.6% 2.1% 0.3% 0.2% 0.4% 0.4% -1.5% 0.1% 0.1% -0.5% -0.3% 0.0% -0.3% -0.1% -0.1% 0.3% 0.0% 0.1%
15 0.5% 0.2% 1.5% -0.4% 0.5% 4.9% 0.1% 0.3% 7.2% 0.3% -0.7% 1.5% 0.1% -0.5% -0.8% 0.1% -0.6% -0.4% -0.2% 0.1% 0.0% 0.5%
16 2.5% 1.9% 8.1% -1.2% 1.9% 2.8% 2.4% 2.5% -4.6% 1.9% -7.1% -2.7% -1.3% 1.2% 0.2% -1.9% 0.7% -0.3% 0.6% 3.2% 0.6% 2.5%
17 0.3% 0.0% 1.1% -0.3% 0.5% 1.3% 0.4% 0.4% 0.5% 0.4% -1.1% -0.2% 0.0% -0.5% -0.5% -0.1% -0.2% -0.3% 0.0% 0.3% 0.0% 0.3%
18 1.2% 0.3% 3.0% -0.1% 0.7% 3.2% 0.4% 0.9% -0.6% 0.4% -1.6% -0.9% -0.4% -0.4% -0.5% -0.7% -0.5% -0.6% 0.0% 0.4% 0.1% 1.2%
19 -0.6% 0.3% -0.6% 1.3% -0.1% -0.1% -0.1% -0.2% 0.0% 0.0% 0.4% 0.1% 0.2% -0.1% -0.1% 0.6% -0.1% 0.0% 0.0% 0.2% 0.0% -0.6%
20 -2.3% 0.0% -1.1% 3.5% 0.1% 0.2% -0.5% 0.0% 1.9% -0.2% 2.8% 1.8% 0.3% 0.0% 0.1% 2.4% 0.0% -0.1% 0.0% 0.0% -2.3%
21 0.0% -0.1% 0.0% 0.5% -0.1% 0.2% -0.1% -0.1% -0.2% 0.0% 0.2% 0.0% 0.0% 0.1% 0.0% 0.7% 0.0% 0.1% 0.0% -0.2% 0.1% 0.0%
Total -0.9% -0.3% -3.2% 4.4% -1.7% -2.8% -2.8% -2.3% 10.0% 0.3% 16.2% 15.4% 3.9% 1.1% 0.5% 3.4% 1.6% 5.5% -1.0% -2.6% -0.1% -0.9%
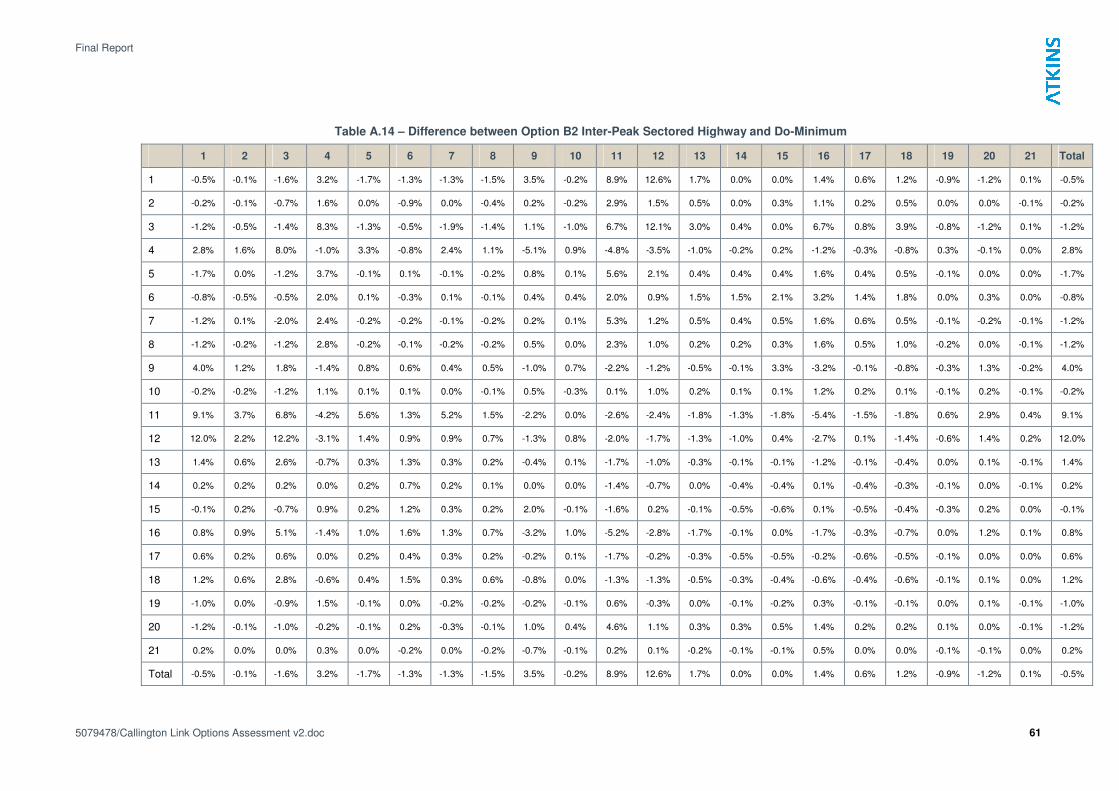
Final Report
5079478/Callington Link Options Assessment v2.doc 61
Table A.14 – Difference between Option B2 Inter-Peak Sectored Highway and Do-Minimum
1 2 3 4 5 6 7 8 9 10 11 12 13 14 15 16 17 18 19 20 21 Total
1 -0.5% -0.1% -1.6% 3.2% -1.7% -1.3% -1.3% -1.5% 3.5% -0.2% 8.9% 12.6% 1.7% 0.0% 0.0% 1.4% 0.6% 1.2% -0.9% -1.2% 0.1% -0.5%
2 -0.2% -0.1% -0.7% 1.6% 0.0% -0.9% 0.0% -0.4% 0.2% -0.2% 2.9% 1.5% 0.5% 0.0% 0.3% 1.1% 0.2% 0.5% 0.0% 0.0% -0.1% -0.2%
3 -1.2% -0.5% -1.4% 8.3% -1.3% -0.5% -1.9% -1.4% 1.1% -1.0% 6.7% 12.1% 3.0% 0.4% 0.0% 6.7% 0.8% 3.9% -0.8% -1.2% 0.1% -1.2%
4 2.8% 1.6% 8.0% -1.0% 3.3% -0.8% 2.4% 1.1% -5.1% 0.9% -4.8% -3.5% -1.0% -0.2% 0.2% -1.2% -0.3% -0.8% 0.3% -0.1% 0.0% 2.8%
5 -1.7% 0.0% -1.2% 3.7% -0.1% 0.1% -0.1% -0.2% 0.8% 0.1% 5.6% 2.1% 0.4% 0.4% 0.4% 1.6% 0.4% 0.5% -0.1% 0.0% 0.0% -1.7%
6 -0.8% -0.5% -0.5% 2.0% 0.1% -0.3% 0.1% -0.1% 0.4% 0.4% 2.0% 0.9% 1.5% 1.5% 2.1% 3.2% 1.4% 1.8% 0.0% 0.3% 0.0% -0.8%
7 -1.2% 0.1% -2.0% 2.4% -0.2% -0.2% -0.1% -0.2% 0.2% 0.1% 5.3% 1.2% 0.5% 0.4% 0.5% 1.6% 0.6% 0.5% -0.1% -0.2% -0.1% -1.2%
8 -1.2% -0.2% -1.2% 2.8% -0.2% -0.1% -0.2% -0.2% 0.5% 0.0% 2.3% 1.0% 0.2% 0.2% 0.3% 1.6% 0.5% 1.0% -0.2% 0.0% -0.1% -1.2%
9 4.0% 1.2% 1.8% -1.4% 0.8% 0.6% 0.4% 0.5% -1.0% 0.7% -2.2% -1.2% -0.5% -0.1% 3.3% -3.2% -0.1% -0.8% -0.3% 1.3% -0.2% 4.0%
10 -0.2% -0.2% -1.2% 1.1% 0.1% 0.1% 0.0% -0.1% 0.5% -0.3% 0.1% 1.0% 0.2% 0.1% 0.1% 1.2% 0.2% 0.1% -0.1% 0.2% -0.1% -0.2%
11 9.1% 3.7% 6.8% -4.2% 5.6% 1.3% 5.2% 1.5% -2.2% 0.0% -2.6% -2.4% -1.8% -1.3% -1.8% -5.4% -1.5% -1.8% 0.6% 2.9% 0.4% 9.1%
12 12.0% 2.2% 12.2% -3.1% 1.4% 0.9% 0.9% 0.7% -1.3% 0.8% -2.0% -1.7% -1.3% -1.0% 0.4% -2.7% 0.1% -1.4% -0.6% 1.4% 0.2% 12.0%
13 1.4% 0.6% 2.6% -0.7% 0.3% 1.3% 0.3% 0.2% -0.4% 0.1% -1.7% -1.0% -0.3% -0.1% -0.1% -1.2% -0.1% -0.4% 0.0% 0.1% -0.1% 1.4%
14 0.2% 0.2% 0.2% 0.0% 0.2% 0.7% 0.2% 0.1% 0.0% 0.0% -1.4% -0.7% 0.0% -0.4% -0.4% 0.1% -0.4% -0.3% -0.1% 0.0% -0.1% 0.2%
15 -0.1% 0.2% -0.7% 0.9% 0.2% 1.2% 0.3% 0.2% 2.0% -0.1% -1.6% 0.2% -0.1% -0.5% -0.6% 0.1% -0.5% -0.4% -0.3% 0.2% 0.0% -0.1%
16 0.8% 0.9% 5.1% -1.4% 1.0% 1.6% 1.3% 0.7% -3.2% 1.0% -5.2% -2.8% -1.7% -0.1% 0.0% -1.7% -0.3% -0.7% 0.0% 1.2% 0.1% 0.8%
17 0.6% 0.2% 0.6% 0.0% 0.2% 0.4% 0.3% 0.2% -0.2% 0.1% -1.7% -0.2% -0.3% -0.5% -0.5% -0.2% -0.6% -0.5% -0.1% 0.0% 0.0% 0.6%
18 1.2% 0.6% 2.8% -0.6% 0.4% 1.5% 0.3% 0.6% -0.8% 0.0% -1.3% -1.3% -0.5% -0.3% -0.4% -0.6% -0.4% -0.6% -0.1% 0.1% 0.0% 1.2%
19 -1.0% 0.0% -0.9% 1.5% -0.1% 0.0% -0.2% -0.2% -0.2% -0.1% 0.6% -0.3% 0.0% -0.1% -0.2% 0.3% -0.1% -0.1% 0.0% 0.1% -0.1% -1.0%
20 -1.2% -0.1% -1.0% -0.2% -0.1% 0.2% -0.3% -0.1% 1.0% 0.4% 4.6% 1.1% 0.3% 0.3% 0.5% 1.4% 0.2% 0.2% 0.1% 0.0% -0.1% -1.2%
21 0.2% 0.0% 0.0% 0.3% 0.0% -0.2% 0.0% -0.2% -0.7% -0.1% 0.2% 0.1% -0.2% -0.1% -0.1% 0.5% 0.0% 0.0% -0.1% -0.1% 0.0% 0.2%
Total -0.5% -0.1% -1.6% 3.2% -1.7% -1.3% -1.3% -1.5% 3.5% -0.2% 8.9% 12.6% 1.7% 0.0% 0.0% 1.4% 0.6% 1.2% -0.9% -1.2% 0.1% -0.5%
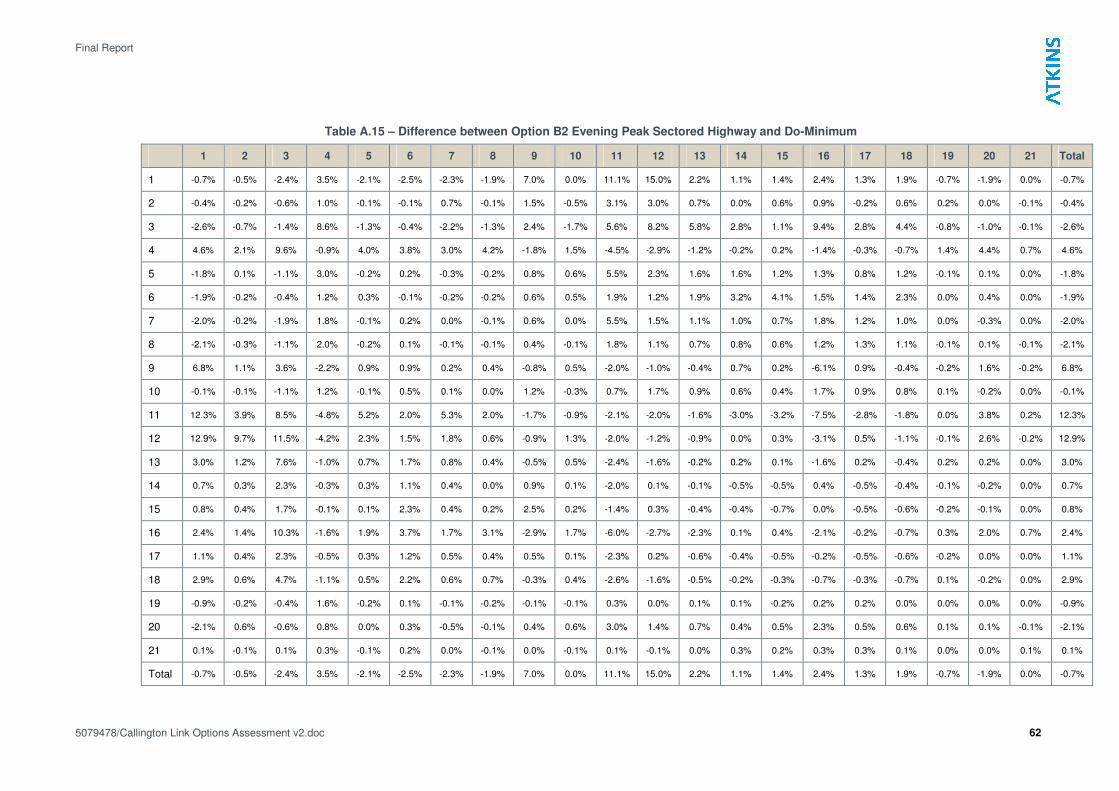
Final Report
5079478/Callington Link Options Assessment v2.doc 62
Table A.15 – Difference between Option B2 Evening Peak Sectored Highway and Do-Minimum
1 2 3 4 5 6 7 8 9 10 11 12 13 14 15 16 17 18 19 20 21 Total
1 -0.7% -0.5% -2.4% 3.5% -2.1% -2.5% -2.3% -1.9% 7.0% 0.0% 11.1% 15.0% 2.2% 1.1% 1.4% 2.4% 1.3% 1.9% -0.7% -1.9% 0.0% -0.7%
2 -0.4% -0.2% -0.6% 1.0% -0.1% -0.1% 0.7% -0.1% 1.5% -0.5% 3.1% 3.0% 0.7% 0.0% 0.6% 0.9% -0.2% 0.6% 0.2% 0.0% -0.1% -0.4%
3 -2.6% -0.7% -1.4% 8.6% -1.3% -0.4% -2.2% -1.3% 2.4% -1.7% 5.6% 8.2% 5.8% 2.8% 1.1% 9.4% 2.8% 4.4% -0.8% -1.0% -0.1% -2.6%
4 4.6% 2.1% 9.6% -0.9% 4.0% 3.8% 3.0% 4.2% -1.8% 1.5% -4.5% -2.9% -1.2% -0.2% 0.2% -1.4% -0.3% -0.7% 1.4% 4.4% 0.7% 4.6%
5 -1.8% 0.1% -1.1% 3.0% -0.2% 0.2% -0.3% -0.2% 0.8% 0.6% 5.5% 2.3% 1.6% 1.6% 1.2% 1.3% 0.8% 1.2% -0.1% 0.1% 0.0% -1.8%
6 -1.9% -0.2% -0.4% 1.2% 0.3% -0.1% -0.2% -0.2% 0.6% 0.5% 1.9% 1.2% 1.9% 3.2% 4.1% 1.5% 1.4% 2.3% 0.0% 0.4% 0.0% -1.9%
7 -2.0% -0.2% -1.9% 1.8% -0.1% 0.2% 0.0% -0.1% 0.6% 0.0% 5.5% 1.5% 1.1% 1.0% 0.7% 1.8% 1.2% 1.0% 0.0% -0.3% 0.0% -2.0%
8 -2.1% -0.3% -1.1% 2.0% -0.2% 0.1% -0.1% -0.1% 0.4% -0.1% 1.8% 1.1% 0.7% 0.8% 0.6% 1.2% 1.3% 1.1% -0.1% 0.1% -0.1% -2.1%
9 6.8% 1.1% 3.6% -2.2% 0.9% 0.9% 0.2% 0.4% -0.8% 0.5% -2.0% -1.0% -0.4% 0.7% 0.2% -6.1% 0.9% -0.4% -0.2% 1.6% -0.2% 6.8%
10 -0.1% -0.1% -1.1% 1.2% -0.1% 0.5% 0.1% 0.0% 1.2% -0.3% 0.7% 1.7% 0.9% 0.6% 0.4% 1.7% 0.9% 0.8% 0.1% -0.2% 0.0% -0.1%
11 12.3% 3.9% 8.5% -4.8% 5.2% 2.0% 5.3% 2.0% -1.7% -0.9% -2.1% -2.0% -1.6% -3.0% -3.2% -7.5% -2.8% -1.8% 0.0% 3.8% 0.2% 12.3%
12 12.9% 9.7% 11.5% -4.2% 2.3% 1.5% 1.8% 0.6% -0.9% 1.3% -2.0% -1.2% -0.9% 0.0% 0.3% -3.1% 0.5% -1.1% -0.1% 2.6% -0.2% 12.9%
13 3.0% 1.2% 7.6% -1.0% 0.7% 1.7% 0.8% 0.4% -0.5% 0.5% -2.4% -1.6% -0.2% 0.2% 0.1% -1.6% 0.2% -0.4% 0.2% 0.2% 0.0% 3.0%
14 0.7% 0.3% 2.3% -0.3% 0.3% 1.1% 0.4% 0.0% 0.9% 0.1% -2.0% 0.1% -0.1% -0.5% -0.5% 0.4% -0.5% -0.4% -0.1% -0.2% 0.0% 0.7%
15 0.8% 0.4% 1.7% -0.1% 0.1% 2.3% 0.4% 0.2% 2.5% 0.2% -1.4% 0.3% -0.4% -0.4% -0.7% 0.0% -0.5% -0.6% -0.2% -0.1% 0.0% 0.8%
16 2.4% 1.4% 10.3% -1.6% 1.9% 3.7% 1.7% 3.1% -2.9% 1.7% -6.0% -2.7% -2.3% 0.1% 0.4% -2.1% -0.2% -0.7% 0.3% 2.0% 0.7% 2.4%
17 1.1% 0.4% 2.3% -0.5% 0.3% 1.2% 0.5% 0.4% 0.5% 0.1% -2.3% 0.2% -0.6% -0.4% -0.5% -0.2% -0.5% -0.6% -0.2% 0.0% 0.0% 1.1%
18 2.9% 0.6% 4.7% -1.1% 0.5% 2.2% 0.6% 0.7% -0.3% 0.4% -2.6% -1.6% -0.5% -0.2% -0.3% -0.7% -0.3% -0.7% 0.1% -0.2% 0.0% 2.9%
19 -0.9% -0.2% -0.4% 1.6% -0.2% 0.1% -0.1% -0.2% -0.1% -0.1% 0.3% 0.0% 0.1% 0.1% -0.2% 0.2% 0.2% 0.0% 0.0% 0.0% 0.0% -0.9%
20 -2.1% 0.6% -0.6% 0.8% 0.0% 0.3% -0.5% -0.1% 0.4% 0.6% 3.0% 1.4% 0.7% 0.4% 0.5% 2.3% 0.5% 0.6% 0.1% 0.1% -0.1% -2.1%
21 0.1% -0.1% 0.1% 0.3% -0.1% 0.2% 0.0% -0.1% 0.0% -0.1% 0.1% -0.1% 0.0% 0.3% 0.2% 0.3% 0.3% 0.1% 0.0% 0.0% 0.1% 0.1%
Total -0.7% -0.5% -2.4% 3.5% -2.1% -2.5% -2.3% -1.9% 7.0% 0.0% 11.1% 15.0% 2.2% 1.1% 1.4% 2.4% 1.3% 1.9% -0.7% -1.9% 0.0% -0.7%
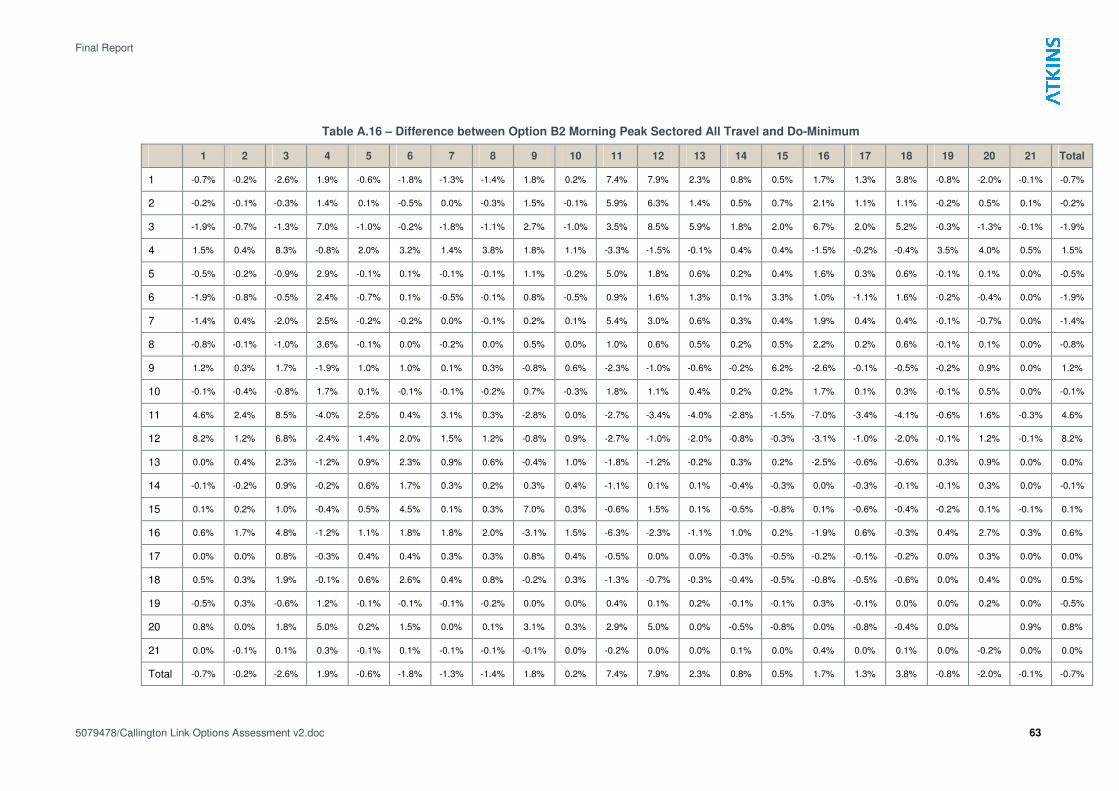
Final Report
5079478/Callington Link Options Assessment v2.doc 63
Table A.16 – Difference between Option B2 Morning Peak Sectored All Travel and Do-Minimum
1 2 3 4 5 6 7 8 9 10 11 12 13 14 15 16 17 18 19 20 21 Total
1 -0.7% -0.2% -2.6% 1.9% -0.6% -1.8% -1.3% -1.4% 1.8% 0.2% 7.4% 7.9% 2.3% 0.8% 0.5% 1.7% 1.3% 3.8% -0.8% -2.0% -0.1% -0.7%
2 -0.2% -0.1% -0.3% 1.4% 0.1% -0.5% 0.0% -0.3% 1.5% -0.1% 5.9% 6.3% 1.4% 0.5% 0.7% 2.1% 1.1% 1.1% -0.2% 0.5% 0.1% -0.2%
3 -1.9% -0.7% -1.3% 7.0% -1.0% -0.2% -1.8% -1.1% 2.7% -1.0% 3.5% 8.5% 5.9% 1.8% 2.0% 6.7% 2.0% 5.2% -0.3% -1.3% -0.1% -1.9%
4 1.5% 0.4% 8.3% -0.8% 2.0% 3.2% 1.4% 3.8% 1.8% 1.1% -3.3% -1.5% -0.1% 0.4% 0.4% -1.5% -0.2% -0.4% 3.5% 4.0% 0.5% 1.5%
5 -0.5% -0.2% -0.9% 2.9% -0.1% 0.1% -0.1% -0.1% 1.1% -0.2% 5.0% 1.8% 0.6% 0.2% 0.4% 1.6% 0.3% 0.6% -0.1% 0.1% 0.0% -0.5%
6 -1.9% -0.8% -0.5% 2.4% -0.7% 0.1% -0.5% -0.1% 0.8% -0.5% 0.9% 1.6% 1.3% 0.1% 3.3% 1.0% -1.1% 1.6% -0.2% -0.4% 0.0% -1.9%
7 -1.4% 0.4% -2.0% 2.5% -0.2% -0.2% 0.0% -0.1% 0.2% 0.1% 5.4% 3.0% 0.6% 0.3% 0.4% 1.9% 0.4% 0.4% -0.1% -0.7% 0.0% -1.4%
8 -0.8% -0.1% -1.0% 3.6% -0.1% 0.0% -0.2% 0.0% 0.5% 0.0% 1.0% 0.6% 0.5% 0.2% 0.5% 2.2% 0.2% 0.6% -0.1% 0.1% 0.0% -0.8%
9 1.2% 0.3% 1.7% -1.9% 1.0% 1.0% 0.1% 0.3% -0.8% 0.6% -2.3% -1.0% -0.6% -0.2% 6.2% -2.6% -0.1% -0.5% -0.2% 0.9% 0.0% 1.2%
10 -0.1% -0.4% -0.8% 1.7% 0.1% -0.1% -0.1% -0.2% 0.7% -0.3% 1.8% 1.1% 0.4% 0.2% 0.2% 1.7% 0.1% 0.3% -0.1% 0.5% 0.0% -0.1%
11 4.6% 2.4% 8.5% -4.0% 2.5% 0.4% 3.1% 0.3% -2.8% 0.0% -2.7% -3.4% -4.0% -2.8% -1.5% -7.0% -3.4% -4.1% -0.6% 1.6% -0.3% 4.6%
12 8.2% 1.2% 6.8% -2.4% 1.4% 2.0% 1.5% 1.2% -0.8% 0.9% -2.7% -1.0% -2.0% -0.8% -0.3% -3.1% -1.0% -2.0% -0.1% 1.2% -0.1% 8.2%
13 0.0% 0.4% 2.3% -1.2% 0.9% 2.3% 0.9% 0.6% -0.4% 1.0% -1.8% -1.2% -0.2% 0.3% 0.2% -2.5% -0.6% -0.6% 0.3% 0.9% 0.0% 0.0%
14 -0.1% -0.2% 0.9% -0.2% 0.6% 1.7% 0.3% 0.2% 0.3% 0.4% -1.1% 0.1% 0.1% -0.4% -0.3% 0.0% -0.3% -0.1% -0.1% 0.3% 0.0% -0.1%
15 0.1% 0.2% 1.0% -0.4% 0.5% 4.5% 0.1% 0.3% 7.0% 0.3% -0.6% 1.5% 0.1% -0.5% -0.8% 0.1% -0.6% -0.4% -0.2% 0.1% -0.1% 0.1%
16 0.6% 1.7% 4.8% -1.2% 1.1% 1.8% 1.8% 2.0% -3.1% 1.5% -6.3% -2.3% -1.1% 1.0% 0.2% -1.9% 0.6% -0.3% 0.4% 2.7% 0.3% 0.6%
17 0.0% 0.0% 0.8% -0.3% 0.4% 0.4% 0.3% 0.3% 0.8% 0.4% -0.5% 0.0% 0.0% -0.3% -0.5% -0.2% -0.1% -0.2% 0.0% 0.3% 0.0% 0.0%
18 0.5% 0.3% 1.9% -0.1% 0.6% 2.6% 0.4% 0.8% -0.2% 0.3% -1.3% -0.7% -0.3% -0.4% -0.5% -0.8% -0.5% -0.6% 0.0% 0.4% 0.0% 0.5%
19 -0.5% 0.3% -0.6% 1.2% -0.1% -0.1% -0.1% -0.2% 0.0% 0.0% 0.4% 0.1% 0.2% -0.1% -0.1% 0.3% -0.1% 0.0% 0.0% 0.2% 0.0% -0.5%
20 0.8% 0.0% 1.8% 5.0% 0.2% 1.5% 0.0% 0.1% 3.1% 0.3% 2.9% 5.0% 0.0% -0.5% -0.8% 0.0% -0.8% -0.4% 0.0% 0.9% 0.8%
21 0.0% -0.1% 0.1% 0.3% -0.1% 0.1% -0.1% -0.1% -0.1% 0.0% -0.2% 0.0% 0.0% 0.1% 0.0% 0.4% 0.0% 0.1% 0.0% -0.2% 0.0% 0.0%
Total -0.7% -0.2% -2.6% 1.9% -0.6% -1.8% -1.3% -1.4% 1.8% 0.2% 7.4% 7.9% 2.3% 0.8% 0.5% 1.7% 1.3% 3.8% -0.8% -2.0% -0.1% -0.7%
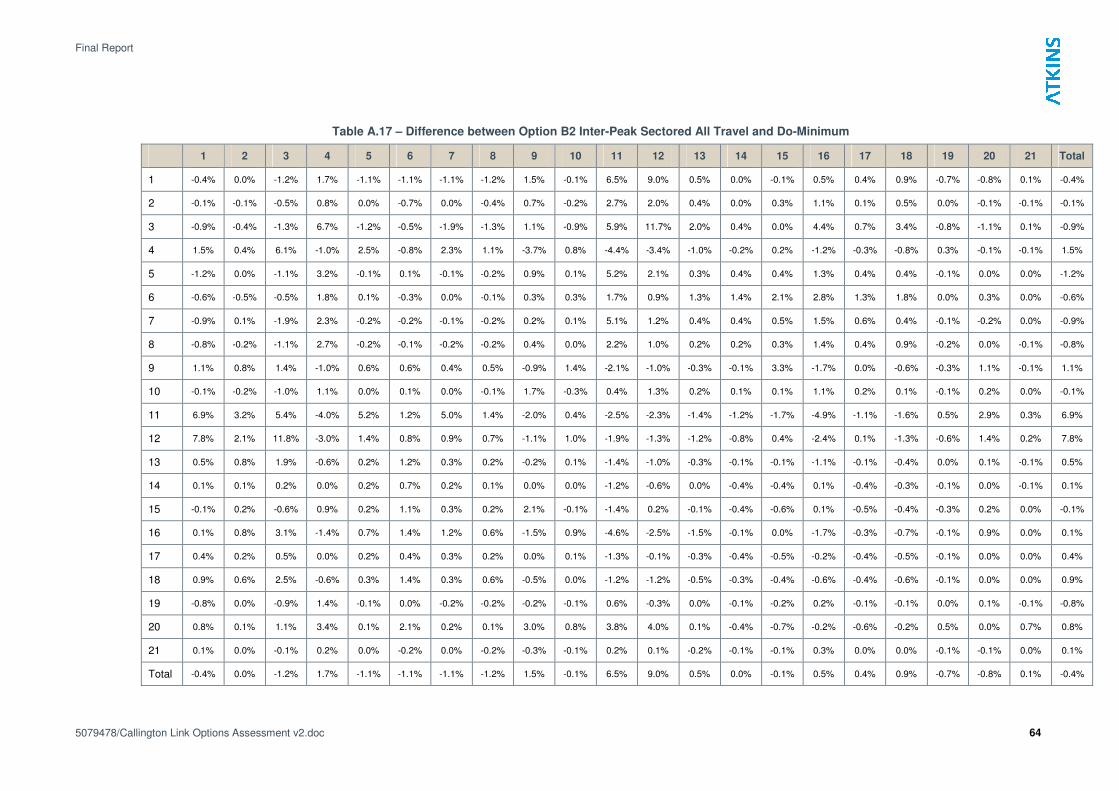
Final Report
5079478/Callington Link Options Assessment v2.doc 64
Table A.17 – Difference between Option B2 Inter-Peak Sectored All Travel and Do-Minimum
1 2 3 4 5 6 7 8 9 10 11 12 13 14 15 16 17 18 19 20 21 Total
1 -0.4% 0.0% -1.2% 1.7% -1.1% -1.1% -1.1% -1.2% 1.5% -0.1% 6.5% 9.0% 0.5% 0.0% -0.1% 0.5% 0.4% 0.9% -0.7% -0.8% 0.1% -0.4%
2 -0.1% -0.1% -0.5% 0.8% 0.0% -0.7% 0.0% -0.4% 0.7% -0.2% 2.7% 2.0% 0.4% 0.0% 0.3% 1.1% 0.1% 0.5% 0.0% -0.1% -0.1% -0.1%
3 -0.9% -0.4% -1.3% 6.7% -1.2% -0.5% -1.9% -1.3% 1.1% -0.9% 5.9% 11.7% 2.0% 0.4% 0.0% 4.4% 0.7% 3.4% -0.8% -1.1% 0.1% -0.9%
4 1.5% 0.4% 6.1% -1.0% 2.5% -0.8% 2.3% 1.1% -3.7% 0.8% -4.4% -3.4% -1.0% -0.2% 0.2% -1.2% -0.3% -0.8% 0.3% -0.1% -0.1% 1.5%
5 -1.2% 0.0% -1.1% 3.2% -0.1% 0.1% -0.1% -0.2% 0.9% 0.1% 5.2% 2.1% 0.3% 0.4% 0.4% 1.3% 0.4% 0.4% -0.1% 0.0% 0.0% -1.2%
6 -0.6% -0.5% -0.5% 1.8% 0.1% -0.3% 0.0% -0.1% 0.3% 0.3% 1.7% 0.9% 1.3% 1.4% 2.1% 2.8% 1.3% 1.8% 0.0% 0.3% 0.0% -0.6%
7 -0.9% 0.1% -1.9% 2.3% -0.2% -0.2% -0.1% -0.2% 0.2% 0.1% 5.1% 1.2% 0.4% 0.4% 0.5% 1.5% 0.6% 0.4% -0.1% -0.2% 0.0% -0.9%
8 -0.8% -0.2% -1.1% 2.7% -0.2% -0.1% -0.2% -0.2% 0.4% 0.0% 2.2% 1.0% 0.2% 0.2% 0.3% 1.4% 0.4% 0.9% -0.2% 0.0% -0.1% -0.8%
9 1.1% 0.8% 1.4% -1.0% 0.6% 0.6% 0.4% 0.5% -0.9% 1.4% -2.1% -1.0% -0.3% -0.1% 3.3% -1.7% 0.0% -0.6% -0.3% 1.1% -0.1% 1.1%
10 -0.1% -0.2% -1.0% 1.1% 0.0% 0.1% 0.0% -0.1% 1.7% -0.3% 0.4% 1.3% 0.2% 0.1% 0.1% 1.1% 0.2% 0.1% -0.1% 0.2% 0.0% -0.1%
11 6.9% 3.2% 5.4% -4.0% 5.2% 1.2% 5.0% 1.4% -2.0% 0.4% -2.5% -2.3% -1.4% -1.2% -1.7% -4.9% -1.1% -1.6% 0.5% 2.9% 0.3% 6.9%
12 7.8% 2.1% 11.8% -3.0% 1.4% 0.8% 0.9% 0.7% -1.1% 1.0% -1.9% -1.3% -1.2% -0.8% 0.4% -2.4% 0.1% -1.3% -0.6% 1.4% 0.2% 7.8%
13 0.5% 0.8% 1.9% -0.6% 0.2% 1.2% 0.3% 0.2% -0.2% 0.1% -1.4% -1.0% -0.3% -0.1% -0.1% -1.1% -0.1% -0.4% 0.0% 0.1% -0.1% 0.5%
14 0.1% 0.1% 0.2% 0.0% 0.2% 0.7% 0.2% 0.1% 0.0% 0.0% -1.2% -0.6% 0.0% -0.4% -0.4% 0.1% -0.4% -0.3% -0.1% 0.0% -0.1% 0.1%
15 -0.1% 0.2% -0.6% 0.9% 0.2% 1.1% 0.3% 0.2% 2.1% -0.1% -1.4% 0.2% -0.1% -0.4% -0.6% 0.1% -0.5% -0.4% -0.3% 0.2% 0.0% -0.1%
16 0.1% 0.8% 3.1% -1.4% 0.7% 1.4% 1.2% 0.6% -1.5% 0.9% -4.6% -2.5% -1.5% -0.1% 0.0% -1.7% -0.3% -0.7% -0.1% 0.9% 0.0% 0.1%
17 0.4% 0.2% 0.5% 0.0% 0.2% 0.4% 0.3% 0.2% 0.0% 0.1% -1.3% -0.1% -0.3% -0.4% -0.5% -0.2% -0.4% -0.5% -0.1% 0.0% 0.0% 0.4%
18 0.9% 0.6% 2.5% -0.6% 0.3% 1.4% 0.3% 0.6% -0.5% 0.0% -1.2% -1.2% -0.5% -0.3% -0.4% -0.6% -0.4% -0.6% -0.1% 0.0% 0.0% 0.9%
19 -0.8% 0.0% -0.9% 1.4% -0.1% 0.0% -0.2% -0.2% -0.2% -0.1% 0.6% -0.3% 0.0% -0.1% -0.2% 0.2% -0.1% -0.1% 0.0% 0.1% -0.1% -0.8%
20 0.8% 0.1% 1.1% 3.4% 0.1% 2.1% 0.2% 0.1% 3.0% 0.8% 3.8% 4.0% 0.1% -0.4% -0.7% -0.2% -0.6% -0.2% 0.5% 0.0% 0.7% 0.8%
21 0.1% 0.0% -0.1% 0.2% 0.0% -0.2% 0.0% -0.2% -0.3% -0.1% 0.2% 0.1% -0.2% -0.1% -0.1% 0.3% 0.0% 0.0% -0.1% -0.1% 0.0% 0.1%
Total -0.4% 0.0% -1.2% 1.7% -1.1% -1.1% -1.1% -1.2% 1.5% -0.1% 6.5% 9.0% 0.5% 0.0% -0.1% 0.5% 0.4% 0.9% -0.7% -0.8% 0.1% -0.4%

Final Report
5079478/Callington Link Options Assessment v2.doc 65
Table A.18 – Difference between Option B2 Evening Peak Sectored All Travel and Do-Minimum
1 2 3 4 5 6 7 8 9 10 11 12 13 14 15 16 17 18 19 20 21 Total
1 -0.5% -0.4% -1.6% 1.5% -0.9% -1.6% -1.5% -1.1% 1.4% -0.1% 0.9% 9.0% 0.6% 0.6% 0.8% 0.8% 0.9% 1.0% -0.5% -0.3% -0.1% -0.5%
2 -0.3% -0.2% -0.4% 0.3% 0.0% 0.0% 0.7% 0.0% 0.9% -0.4% 2.8% 3.0% 0.6% 0.1% 0.6% 0.8% -0.3% 0.6% 0.2% 0.1% -0.1% -0.3%
3 -2.1% -0.6% -1.3% 6.9% -1.1% -0.3% -2.0% -1.2% 1.7% -1.3% 4.8% 7.7% 3.7% 2.4% 1.0% 5.7% 2.1% 3.3% -0.8% -0.9% -0.1% -2.1%
4 2.3% 0.8% 7.4% -0.9% 2.6% 3.3% 2.6% 3.4% -1.6% 1.2% -3.8% -2.9% -1.1% -0.3% 0.2% -1.3% -0.3% -0.6% 1.2% 3.9% 0.4% 2.3%
5 -0.9% 0.1% -0.9% 2.3% -0.1% 0.2% -0.3% -0.2% 0.9% 0.5% 4.5% 2.2% 1.2% 1.4% 1.2% 0.8% 0.7% 1.0% -0.1% 0.1% 0.0% -0.9%
6 -1.4% -0.2% -0.3% 1.0% 0.2% -0.1% -0.1% -0.2% 0.5% 0.4% 1.6% 1.2% 1.6% 2.5% 3.8% 0.9% 0.8% 1.9% 0.0% 0.3% 0.0% -1.4%
7 -1.2% -0.2% -1.6% 1.6% -0.1% 0.2% 0.0% -0.1% 0.4% 0.0% 4.6% 1.5% 1.0% 1.0% 0.6% 1.5% 1.1% 1.0% 0.0% -0.3% 0.0% -1.2%
8 -1.4% -0.3% -1.0% 1.8% -0.2% 0.1% -0.1% -0.1% 0.3% -0.1% 1.5% 1.1% 0.6% 0.8% 0.6% 0.9% 1.1% 1.0% -0.1% 0.1% -0.1% -1.4%
9 1.7% 0.8% 2.9% -1.7% 0.8% 0.8% 0.2% 0.4% -0.6% 1.0% -1.8% -0.7% -0.2% 0.4% 0.3% -2.5% 0.6% 0.0% -0.1% 1.3% -0.1% 1.7%
10 -0.1% -0.1% -0.8% 1.1% -0.1% 0.4% 0.1% 0.0% 0.9% -0.3% 0.8% 1.6% 0.9% 0.6% 0.4% 1.4% 0.9% 0.7% 0.1% -0.2% 0.0% -0.1%
11 5.9% 3.4% 5.7% -4.2% 4.3% 1.8% 4.6% 1.8% -1.5% -0.3% -1.8% -2.0% -1.3% -2.6% -3.1% -6.3% -2.1% -1.5% 0.0% 3.6% -0.1% 5.9%
12 8.1% 8.8% 11.1% -4.1% 2.2% 1.4% 1.8% 0.6% -0.9% 1.4% -1.9% -1.1% -0.8% 0.0% 0.3% -2.6% 0.4% -0.9% -0.1% 2.5% -0.2% 8.1%
13 1.2% 1.0% 5.4% -0.8% 0.7% 1.6% 0.7% 0.4% -0.3% 0.5% -1.9% -1.5% -0.2% 0.2% 0.1% -1.3% 0.1% -0.3% 0.2% 0.2% 0.0% 1.2%
14 0.6% 0.2% 2.0% -0.3% 0.2% 0.9% 0.3% 0.0% 0.3% 0.1% -1.7% 0.1% -0.1% -0.4% -0.5% 0.3% -0.4% -0.4% -0.1% -0.2% 0.0% 0.6%
15 0.7% 0.4% 1.6% -0.1% 0.1% 2.3% 0.4% 0.2% 2.4% 0.2% -1.4% 0.3% -0.4% -0.4% -0.7% 0.0% -0.5% -0.5% -0.2% -0.1% 0.0% 0.7%
16 0.5% 1.1% 5.8% -1.6% 1.2% 2.3% 1.4% 1.9% -1.3% 1.4% -4.8% -2.4% -1.9% 0.0% 0.3% -2.0% -0.3% -0.8% 0.1% 1.1% 0.3% 0.5%
17 0.9% 0.4% 2.0% -0.4% 0.2% 0.9% 0.4% 0.4% 0.2% 0.1% -1.8% 0.2% -0.5% -0.3% -0.5% -0.2% -0.3% -0.5% -0.1% 0.0% 0.0% 0.9%
18 1.8% 0.6% 4.1% -1.1% 0.4% 2.1% 0.5% 0.6% -0.2% 0.4% -2.4% -1.6% -0.5% -0.1% -0.3% -0.7% -0.2% -0.7% 0.1% -0.2% 0.0% 1.8%
19 -0.6% -0.2% -0.4% 1.4% -0.2% 0.1% -0.1% -0.2% -0.2% -0.1% 0.2% 0.0% 0.1% 0.1% -0.2% 0.1% 0.2% 0.0% 0.0% 0.0% 0.0% -0.6%
20 -1.3% 0.9% 0.4% 5.3% 0.4% 2.6% 0.5% 0.1% 2.3% 0.5% 3.3% 3.4% 0.0% -0.5% -1.0% -0.2% -0.7% -0.2% 0.6% 0.1% 0.8% -1.3%
21 0.0% -0.1% 0.1% 0.1% -0.1% 0.2% 0.0% -0.1% 0.1% -0.1% -0.2% 0.0% 0.0% 0.2% 0.2% 0.2% 0.2% 0.1% 0.0% 0.0% 0.0% 0.0%
Total -0.5% -0.4% -1.6% 1.5% -0.9% -1.6% -1.5% -1.1% 1.4% -0.1% 0.9% 9.0% 0.6% 0.6% 0.8% 0.8% 0.9% 1.0% -0.5% -0.3% -0.1% -0.5%
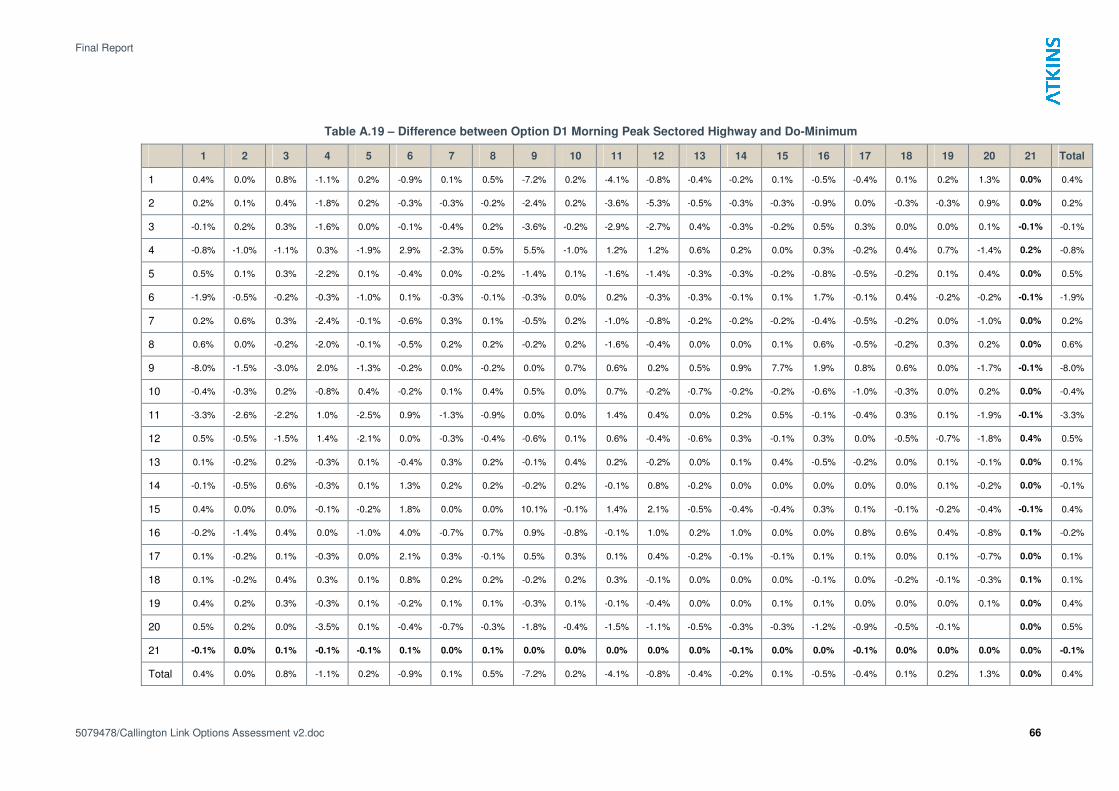
Final Report
5079478/Callington Link Options Assessment v2.doc 66
Table A.19 – Difference between Option D1 Morning Peak Sectored Highway and Do-Minimum
1 2 3 4 5 6 7 8 9 10 11 12 13 14 15 16 17 18 19 20 21 Total
1 0.4% 0.0% 0.8% -1.1% 0.2% -0.9% 0.1% 0.5% -7.2% 0.2% -4.1% -0.8% -0.4% -0.2% 0.1% -0.5% -0.4% 0.1% 0.2% 1.3% 0.0% 0.4%
2 0.2% 0.1% 0.4% -1.8% 0.2% -0.3% -0.3% -0.2% -2.4% 0.2% -3.6% -5.3% -0.5% -0.3% -0.3% -0.9% 0.0% -0.3% -0.3% 0.9% 0.0% 0.2%
3 -0.1% 0.2% 0.3% -1.6% 0.0% -0.1% -0.4% 0.2% -3.6% -0.2% -2.9% -2.7% 0.4% -0.3% -0.2% 0.5% 0.3% 0.0% 0.0% 0.1% -0.1% -0.1%
4 -0.8% -1.0% -1.1% 0.3% -1.9% 2.9% -2.3% 0.5% 5.5% -1.0% 1.2% 1.2% 0.6% 0.2% 0.0% 0.3% -0.2% 0.4% 0.7% -1.4% 0.2% -0.8%
5 0.5% 0.1% 0.3% -2.2% 0.1% -0.4% 0.0% -0.2% -1.4% 0.1% -1.6% -1.4% -0.3% -0.3% -0.2% -0.8% -0.5% -0.2% 0.1% 0.4% 0.0% 0.5%
6 -1.9% -0.5% -0.2% -0.3% -1.0% 0.1% -0.3% -0.1% -0.3% 0.0% 0.2% -0.3% -0.3% -0.1% 0.1% 1.7% -0.1% 0.4% -0.2% -0.2% -0.1% -1.9%
7 0.2% 0.6% 0.3% -2.4% -0.1% -0.6% 0.3% 0.1% -0.5% 0.2% -1.0% -0.8% -0.2% -0.2% -0.2% -0.4% -0.5% -0.2% 0.0% -1.0% 0.0% 0.2%
8 0.6% 0.0% -0.2% -2.0% -0.1% -0.5% 0.2% 0.2% -0.2% 0.2% -1.6% -0.4% 0.0% 0.0% 0.1% 0.6% -0.5% -0.2% 0.3% 0.2% 0.0% 0.6%
9 -8.0% -1.5% -3.0% 2.0% -1.3% -0.2% 0.0% -0.2% 0.0% 0.7% 0.6% 0.2% 0.5% 0.9% 7.7% 1.9% 0.8% 0.6% 0.0% -1.7% -0.1% -8.0%
10 -0.4% -0.3% 0.2% -0.8% 0.4% -0.2% 0.1% 0.4% 0.5% 0.0% 0.7% -0.2% -0.7% -0.2% -0.2% -0.6% -1.0% -0.3% 0.0% 0.2% 0.0% -0.4%
11 -3.3% -2.6% -2.2% 1.0% -2.5% 0.9% -1.3% -0.9% 0.0% 0.0% 1.4% 0.4% 0.0% 0.2% 0.5% -0.1% -0.4% 0.3% 0.1% -1.9% -0.1% -3.3%
12 0.5% -0.5% -1.5% 1.4% -2.1% 0.0% -0.3% -0.4% -0.6% 0.1% 0.6% -0.4% -0.6% 0.3% -0.1% 0.3% 0.0% -0.5% -0.7% -1.8% 0.4% 0.5%
13 0.1% -0.2% 0.2% -0.3% 0.1% -0.4% 0.3% 0.2% -0.1% 0.4% 0.2% -0.2% 0.0% 0.1% 0.4% -0.5% -0.2% 0.0% 0.1% -0.1% 0.0% 0.1%
14 -0.1% -0.5% 0.6% -0.3% 0.1% 1.3% 0.2% 0.2% -0.2% 0.2% -0.1% 0.8% -0.2% 0.0% 0.0% 0.0% 0.0% 0.0% 0.1% -0.2% 0.0% -0.1%
15 0.4% 0.0% 0.0% -0.1% -0.2% 1.8% 0.0% 0.0% 10.1% -0.1% 1.4% 2.1% -0.5% -0.4% -0.4% 0.3% 0.1% -0.1% -0.2% -0.4% -0.1% 0.4%
16 -0.2% -1.4% 0.4% 0.0% -1.0% 4.0% -0.7% 0.7% 0.9% -0.8% -0.1% 1.0% 0.2% 1.0% 0.0% 0.0% 0.8% 0.6% 0.4% -0.8% 0.1% -0.2%
17 0.1% -0.2% 0.1% -0.3% 0.0% 2.1% 0.3% -0.1% 0.5% 0.3% 0.1% 0.4% -0.2% -0.1% -0.1% 0.1% 0.1% 0.0% 0.1% -0.7% 0.0% 0.1%
18 0.1% -0.2% 0.4% 0.3% 0.1% 0.8% 0.2% 0.2% -0.2% 0.2% 0.3% -0.1% 0.0% 0.0% 0.0% -0.1% 0.0% -0.2% -0.1% -0.3% 0.1% 0.1%
19 0.4% 0.2% 0.3% -0.3% 0.1% -0.2% 0.1% 0.1% -0.3% 0.1% -0.1% -0.4% 0.0% 0.0% 0.1% 0.1% 0.0% 0.0% 0.0% 0.1% 0.0% 0.4%
20 0.5% 0.2% 0.0% -3.5% 0.1% -0.4% -0.7% -0.3% -1.8% -0.4% -1.5% -1.1% -0.5% -0.3% -0.3% -1.2% -0.9% -0.5% -0.1% 0.0% 0.5%
21 -0.1% 0.0% 0.1% -0.1% -0.1% 0.1% 0.0% 0.1% 0.0% 0.0% 0.0% 0.0% 0.0% -0.1% 0.0% 0.0% -0.1% 0.0% 0.0% 0.0% 0.0% -0.1%
Total 0.4% 0.0% 0.8% -1.1% 0.2% -0.9% 0.1% 0.5% -7.2% 0.2% -4.1% -0.8% -0.4% -0.2% 0.1% -0.5% -0.4% 0.1% 0.2% 1.3% 0.0% 0.4%
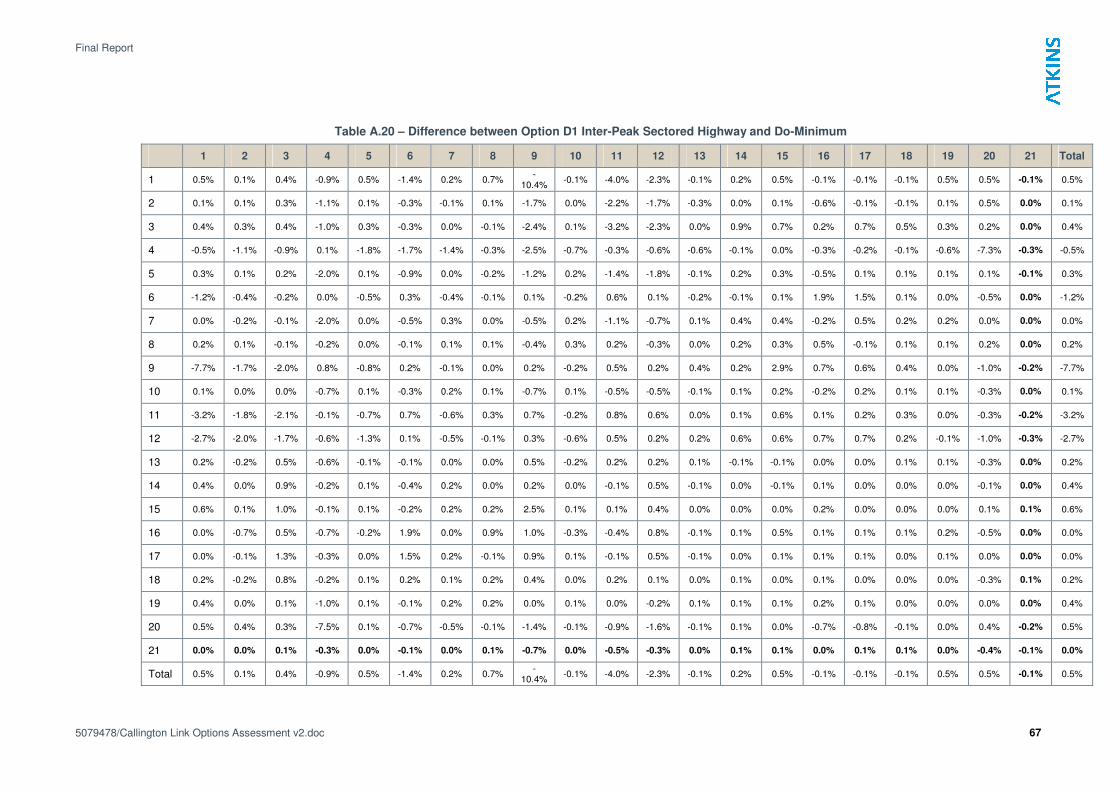
Final Report
5079478/Callington Link Options Assessment v2.doc 67
Table A.20 – Difference between Option D1 Inter-Peak Sectored Highway and Do-Minimum
1 2 3 4 5 6 7 8 9 10 11 12 13 14 15 16 17 18 19 20 21 Total
1 0.5% 0.1% 0.4% -0.9% 0.5% -1.4% 0.2% 0.7% -
10.4% -0.1% -4.0% -2.3% -0.1% 0.2% 0.5% -0.1% -0.1% -0.1% 0.5% 0.5% -0.1% 0.5%
2 0.1% 0.1% 0.3% -1.1% 0.1% -0.3% -0.1% 0.1% -1.7% 0.0% -2.2% -1.7% -0.3% 0.0% 0.1% -0.6% -0.1% -0.1% 0.1% 0.5% 0.0% 0.1%
3 0.4% 0.3% 0.4% -1.0% 0.3% -0.3% 0.0% -0.1% -2.4% 0.1% -3.2% -2.3% 0.0% 0.9% 0.7% 0.2% 0.7% 0.5% 0.3% 0.2% 0.0% 0.4%
4 -0.5% -1.1% -0.9% 0.1% -1.8% -1.7% -1.4% -0.3% -2.5% -0.7% -0.3% -0.6% -0.6% -0.1% 0.0% -0.3% -0.2% -0.1% -0.6% -7.3% -0.3% -0.5%
5 0.3% 0.1% 0.2% -2.0% 0.1% -0.9% 0.0% -0.2% -1.2% 0.2% -1.4% -1.8% -0.1% 0.2% 0.3% -0.5% 0.1% 0.1% 0.1% 0.1% -0.1% 0.3%
6 -1.2% -0.4% -0.2% 0.0% -0.5% 0.3% -0.4% -0.1% 0.1% -0.2% 0.6% 0.1% -0.2% -0.1% 0.1% 1.9% 1.5% 0.1% 0.0% -0.5% 0.0% -1.2%
7 0.0% -0.2% -0.1% -2.0% 0.0% -0.5% 0.3% 0.0% -0.5% 0.2% -1.1% -0.7% 0.1% 0.4% 0.4% -0.2% 0.5% 0.2% 0.2% 0.0% 0.0% 0.0%
8 0.2% 0.1% -0.1% -0.2% 0.0% -0.1% 0.1% 0.1% -0.4% 0.3% 0.2% -0.3% 0.0% 0.2% 0.3% 0.5% -0.1% 0.1% 0.1% 0.2% 0.0% 0.2%
9 -7.7% -1.7% -2.0% 0.8% -0.8% 0.2% -0.1% 0.0% 0.2% -0.2% 0.5% 0.2% 0.4% 0.2% 2.9% 0.7% 0.6% 0.4% 0.0% -1.0% -0.2% -7.7%
10 0.1% 0.0% 0.0% -0.7% 0.1% -0.3% 0.2% 0.1% -0.7% 0.1% -0.5% -0.5% -0.1% 0.1% 0.2% -0.2% 0.2% 0.1% 0.1% -0.3% 0.0% 0.1%
11 -3.2% -1.8% -2.1% -0.1% -0.7% 0.7% -0.6% 0.3% 0.7% -0.2% 0.8% 0.6% 0.0% 0.1% 0.6% 0.1% 0.2% 0.3% 0.0% -0.3% -0.2% -3.2%
12 -2.7% -2.0% -1.7% -0.6% -1.3% 0.1% -0.5% -0.1% 0.3% -0.6% 0.5% 0.2% 0.2% 0.6% 0.6% 0.7% 0.7% 0.2% -0.1% -1.0% -0.3% -2.7%
13 0.2% -0.2% 0.5% -0.6% -0.1% -0.1% 0.0% 0.0% 0.5% -0.2% 0.2% 0.2% 0.1% -0.1% -0.1% 0.0% 0.0% 0.1% 0.1% -0.3% 0.0% 0.2%
14 0.4% 0.0% 0.9% -0.2% 0.1% -0.4% 0.2% 0.0% 0.2% 0.0% -0.1% 0.5% -0.1% 0.0% -0.1% 0.1% 0.0% 0.0% 0.0% -0.1% 0.0% 0.4%
15 0.6% 0.1% 1.0% -0.1% 0.1% -0.2% 0.2% 0.2% 2.5% 0.1% 0.1% 0.4% 0.0% 0.0% 0.0% 0.2% 0.0% 0.0% 0.0% 0.1% 0.1% 0.6%
16 0.0% -0.7% 0.5% -0.7% -0.2% 1.9% 0.0% 0.9% 1.0% -0.3% -0.4% 0.8% -0.1% 0.1% 0.5% 0.1% 0.1% 0.1% 0.2% -0.5% 0.0% 0.0%
17 0.0% -0.1% 1.3% -0.3% 0.0% 1.5% 0.2% -0.1% 0.9% 0.1% -0.1% 0.5% -0.1% 0.0% 0.1% 0.1% 0.1% 0.0% 0.1% 0.0% 0.0% 0.0%
18 0.2% -0.2% 0.8% -0.2% 0.1% 0.2% 0.1% 0.2% 0.4% 0.0% 0.2% 0.1% 0.0% 0.1% 0.0% 0.1% 0.0% 0.0% 0.0% -0.3% 0.1% 0.2%
19 0.4% 0.0% 0.1% -1.0% 0.1% -0.1% 0.2% 0.2% 0.0% 0.1% 0.0% -0.2% 0.1% 0.1% 0.1% 0.2% 0.1% 0.0% 0.0% 0.0% 0.0% 0.4%
20 0.5% 0.4% 0.3% -7.5% 0.1% -0.7% -0.5% -0.1% -1.4% -0.1% -0.9% -1.6% -0.1% 0.1% 0.0% -0.7% -0.8% -0.1% 0.0% 0.4% -0.2% 0.5%
21 0.0% 0.0% 0.1% -0.3% 0.0% -0.1% 0.0% 0.1% -0.7% 0.0% -0.5% -0.3% 0.0% 0.1% 0.1% 0.0% 0.1% 0.1% 0.0% -0.4% -0.1% 0.0%
Total 0.5% 0.1% 0.4% -0.9% 0.5% -1.4% 0.2% 0.7% -
10.4% -0.1% -4.0% -2.3% -0.1% 0.2% 0.5% -0.1% -0.1% -0.1% 0.5% 0.5% -0.1% 0.5%
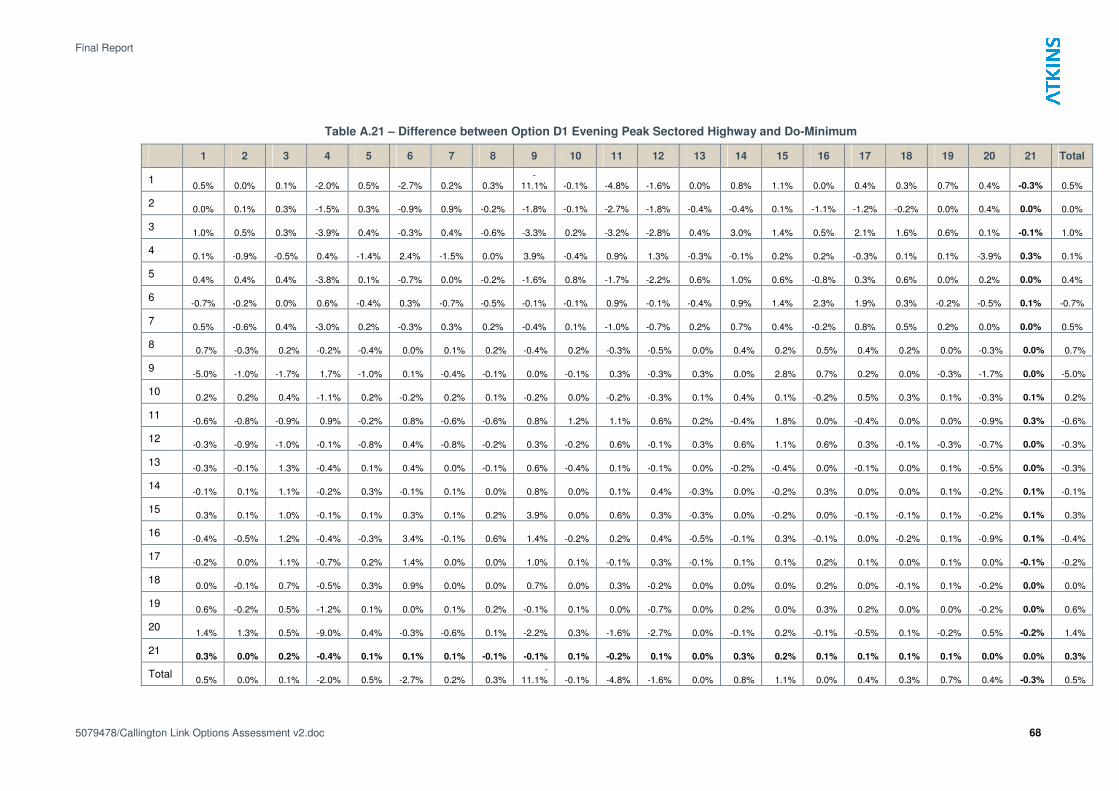
Final Report
5079478/Callington Link Options Assessment v2.doc 68
Table A.21 – Difference between Option D1 Evening Peak Sectored Highway and Do-Minimum
1 2 3 4 5 6 7 8 9 10 11 12 13 14 15 16 17 18 19 20 21 Total
1 0.5% 0.0% 0.1% -2.0% 0.5% -2.7% 0.2% 0.3%
-11.1% -0.1% -4.8% -1.6% 0.0% 0.8% 1.1% 0.0% 0.4% 0.3% 0.7% 0.4% -0.3% 0.5%
2 0.0% 0.1% 0.3% -1.5% 0.3% -0.9% 0.9% -0.2% -1.8% -0.1% -2.7% -1.8% -0.4% -0.4% 0.1% -1.1% -1.2% -0.2% 0.0% 0.4% 0.0% 0.0%
3 1.0% 0.5% 0.3% -3.9% 0.4% -0.3% 0.4% -0.6% -3.3% 0.2% -3.2% -2.8% 0.4% 3.0% 1.4% 0.5% 2.1% 1.6% 0.6% 0.1% -0.1% 1.0%
4 0.1% -0.9% -0.5% 0.4% -1.4% 2.4% -1.5% 0.0% 3.9% -0.4% 0.9% 1.3% -0.3% -0.1% 0.2% 0.2% -0.3% 0.1% 0.1% -3.9% 0.3% 0.1%
5 0.4% 0.4% 0.4% -3.8% 0.1% -0.7% 0.0% -0.2% -1.6% 0.8% -1.7% -2.2% 0.6% 1.0% 0.6% -0.8% 0.3% 0.6% 0.0% 0.2% 0.0% 0.4%
6 -0.7% -0.2% 0.0% 0.6% -0.4% 0.3% -0.7% -0.5% -0.1% -0.1% 0.9% -0.1% -0.4% 0.9% 1.4% 2.3% 1.9% 0.3% -0.2% -0.5% 0.1% -0.7%
7 0.5% -0.6% 0.4% -3.0% 0.2% -0.3% 0.3% 0.2% -0.4% 0.1% -1.0% -0.7% 0.2% 0.7% 0.4% -0.2% 0.8% 0.5% 0.2% 0.0% 0.0% 0.5%
8 0.7% -0.3% 0.2% -0.2% -0.4% 0.0% 0.1% 0.2% -0.4% 0.2% -0.3% -0.5% 0.0% 0.4% 0.2% 0.5% 0.4% 0.2% 0.0% -0.3% 0.0% 0.7%
9 -5.0% -1.0% -1.7% 1.7% -1.0% 0.1% -0.4% -0.1% 0.0% -0.1% 0.3% -0.3% 0.3% 0.0% 2.8% 0.7% 0.2% 0.0% -0.3% -1.7% 0.0% -5.0%
10 0.2% 0.2% 0.4% -1.1% 0.2% -0.2% 0.2% 0.1% -0.2% 0.0% -0.2% -0.3% 0.1% 0.4% 0.1% -0.2% 0.5% 0.3% 0.1% -0.3% 0.1% 0.2%
11 -0.6% -0.8% -0.9% 0.9% -0.2% 0.8% -0.6% -0.6% 0.8% 1.2% 1.1% 0.6% 0.2% -0.4% 1.8% 0.0% -0.4% 0.0% 0.0% -0.9% 0.3% -0.6%
12 -0.3% -0.9% -1.0% -0.1% -0.8% 0.4% -0.8% -0.2% 0.3% -0.2% 0.6% -0.1% 0.3% 0.6% 1.1% 0.6% 0.3% -0.1% -0.3% -0.7% 0.0% -0.3%
13 -0.3% -0.1% 1.3% -0.4% 0.1% 0.4% 0.0% -0.1% 0.6% -0.4% 0.1% -0.1% 0.0% -0.2% -0.4% 0.0% -0.1% 0.0% 0.1% -0.5% 0.0% -0.3%
14 -0.1% 0.1% 1.1% -0.2% 0.3% -0.1% 0.1% 0.0% 0.8% 0.0% 0.1% 0.4% -0.3% 0.0% -0.2% 0.3% 0.0% 0.0% 0.1% -0.2% 0.1% -0.1%
15 0.3% 0.1% 1.0% -0.1% 0.1% 0.3% 0.1% 0.2% 3.9% 0.0% 0.6% 0.3% -0.3% 0.0% -0.2% 0.0% -0.1% -0.1% 0.1% -0.2% 0.1% 0.3%
16 -0.4% -0.5% 1.2% -0.4% -0.3% 3.4% -0.1% 0.6% 1.4% -0.2% 0.2% 0.4% -0.5% -0.1% 0.3% -0.1% 0.0% -0.2% 0.1% -0.9% 0.1% -0.4%
17 -0.2% 0.0% 1.1% -0.7% 0.2% 1.4% 0.0% 0.0% 1.0% 0.1% -0.1% 0.3% -0.1% 0.1% 0.1% 0.2% 0.1% 0.0% 0.1% 0.0% -0.1% -0.2%
18 0.0% -0.1% 0.7% -0.5% 0.3% 0.9% 0.0% 0.0% 0.7% 0.0% 0.3% -0.2% 0.0% 0.0% 0.0% 0.2% 0.0% -0.1% 0.1% -0.2% 0.0% 0.0%
19 0.6% -0.2% 0.5% -1.2% 0.1% 0.0% 0.1% 0.2% -0.1% 0.1% 0.0% -0.7% 0.0% 0.2% 0.0% 0.3% 0.2% 0.0% 0.0% -0.2% 0.0% 0.6%
20 1.4% 1.3% 0.5% -9.0% 0.4% -0.3% -0.6% 0.1% -2.2% 0.3% -1.6% -2.7% 0.0% -0.1% 0.2% -0.1% -0.5% 0.1% -0.2% 0.5% -0.2% 1.4%
21 0.3% 0.0% 0.2% -0.4% 0.1% 0.1% 0.1% -0.1% -0.1% 0.1% -0.2% 0.1% 0.0% 0.3% 0.2% 0.1% 0.1% 0.1% 0.1% 0.0% 0.0% 0.3%
Total 0.5% 0.0% 0.1% -2.0% 0.5% -2.7% 0.2% 0.3%
-11.1% -0.1% -4.8% -1.6% 0.0% 0.8% 1.1% 0.0% 0.4% 0.3% 0.7% 0.4% -0.3% 0.5%
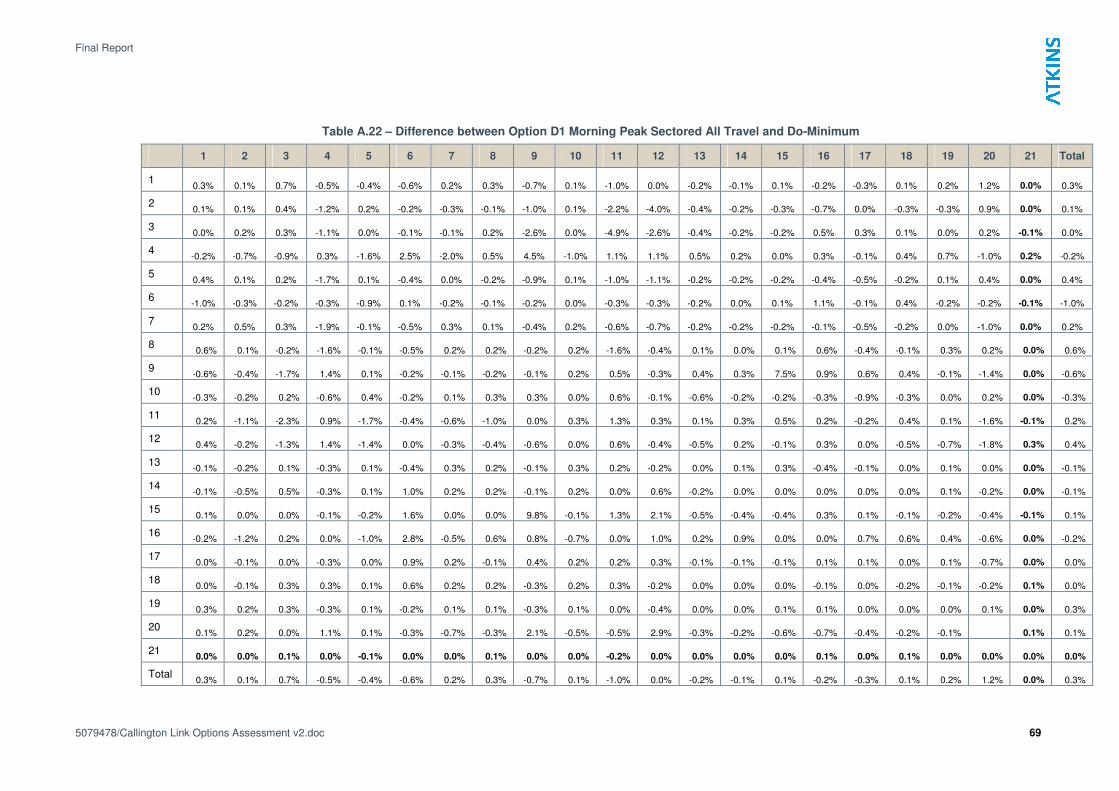
Final Report
5079478/Callington Link Options Assessment v2.doc 69
Table A.22 – Difference between Option D1 Morning Peak Sectored All Travel and Do-Minimum
1 2 3 4 5 6 7 8 9 10 11 12 13 14 15 16 17 18 19 20 21 Total
1 0.3% 0.1% 0.7% -0.5% -0.4% -0.6% 0.2% 0.3% -0.7% 0.1% -1.0% 0.0% -0.2% -0.1% 0.1% -0.2% -0.3% 0.1% 0.2% 1.2% 0.0% 0.3%
2 0.1% 0.1% 0.4% -1.2% 0.2% -0.2% -0.3% -0.1% -1.0% 0.1% -2.2% -4.0% -0.4% -0.2% -0.3% -0.7% 0.0% -0.3% -0.3% 0.9% 0.0% 0.1%
3 0.0% 0.2% 0.3% -1.1% 0.0% -0.1% -0.1% 0.2% -2.6% 0.0% -4.9% -2.6% -0.4% -0.2% -0.2% 0.5% 0.3% 0.1% 0.0% 0.2% -0.1% 0.0%
4 -0.2% -0.7% -0.9% 0.3% -1.6% 2.5% -2.0% 0.5% 4.5% -1.0% 1.1% 1.1% 0.5% 0.2% 0.0% 0.3% -0.1% 0.4% 0.7% -1.0% 0.2% -0.2%
5 0.4% 0.1% 0.2% -1.7% 0.1% -0.4% 0.0% -0.2% -0.9% 0.1% -1.0% -1.1% -0.2% -0.2% -0.2% -0.4% -0.5% -0.2% 0.1% 0.4% 0.0% 0.4%
6 -1.0% -0.3% -0.2% -0.3% -0.9% 0.1% -0.2% -0.1% -0.2% 0.0% -0.3% -0.3% -0.2% 0.0% 0.1% 1.1% -0.1% 0.4% -0.2% -0.2% -0.1% -1.0%
7 0.2% 0.5% 0.3% -1.9% -0.1% -0.5% 0.3% 0.1% -0.4% 0.2% -0.6% -0.7% -0.2% -0.2% -0.2% -0.1% -0.5% -0.2% 0.0% -1.0% 0.0% 0.2%
8 0.6% 0.1% -0.2% -1.6% -0.1% -0.5% 0.2% 0.2% -0.2% 0.2% -1.6% -0.4% 0.1% 0.0% 0.1% 0.6% -0.4% -0.1% 0.3% 0.2% 0.0% 0.6%
9 -0.6% -0.4% -1.7% 1.4% 0.1% -0.2% -0.1% -0.2% -0.1% 0.2% 0.5% -0.3% 0.4% 0.3% 7.5% 0.9% 0.6% 0.4% -0.1% -1.4% 0.0% -0.6%
10 -0.3% -0.2% 0.2% -0.6% 0.4% -0.2% 0.1% 0.3% 0.3% 0.0% 0.6% -0.1% -0.6% -0.2% -0.2% -0.3% -0.9% -0.3% 0.0% 0.2% 0.0% -0.3%
11 0.2% -1.1% -2.3% 0.9% -1.7% -0.4% -0.6% -1.0% 0.0% 0.3% 1.3% 0.3% 0.1% 0.3% 0.5% 0.2% -0.2% 0.4% 0.1% -1.6% -0.1% 0.2%
12 0.4% -0.2% -1.3% 1.4% -1.4% 0.0% -0.3% -0.4% -0.6% 0.0% 0.6% -0.4% -0.5% 0.2% -0.1% 0.3% 0.0% -0.5% -0.7% -1.8% 0.3% 0.4%
13 -0.1% -0.2% 0.1% -0.3% 0.1% -0.4% 0.3% 0.2% -0.1% 0.3% 0.2% -0.2% 0.0% 0.1% 0.3% -0.4% -0.1% 0.0% 0.1% 0.0% 0.0% -0.1%
14 -0.1% -0.5% 0.5% -0.3% 0.1% 1.0% 0.2% 0.2% -0.1% 0.2% 0.0% 0.6% -0.2% 0.0% 0.0% 0.0% 0.0% 0.0% 0.1% -0.2% 0.0% -0.1%
15 0.1% 0.0% 0.0% -0.1% -0.2% 1.6% 0.0% 0.0% 9.8% -0.1% 1.3% 2.1% -0.5% -0.4% -0.4% 0.3% 0.1% -0.1% -0.2% -0.4% -0.1% 0.1%
16 -0.2% -1.2% 0.2% 0.0% -1.0% 2.8% -0.5% 0.6% 0.8% -0.7% 0.0% 1.0% 0.2% 0.9% 0.0% 0.0% 0.7% 0.6% 0.4% -0.6% 0.0% -0.2%
17 0.0% -0.1% 0.0% -0.3% 0.0% 0.9% 0.2% -0.1% 0.4% 0.2% 0.2% 0.3% -0.1% -0.1% -0.1% 0.1% 0.1% 0.0% 0.1% -0.7% 0.0% 0.0%
18 0.0% -0.1% 0.3% 0.3% 0.1% 0.6% 0.2% 0.2% -0.3% 0.2% 0.3% -0.2% 0.0% 0.0% 0.0% -0.1% 0.0% -0.2% -0.1% -0.2% 0.1% 0.0%
19 0.3% 0.2% 0.3% -0.3% 0.1% -0.2% 0.1% 0.1% -0.3% 0.1% 0.0% -0.4% 0.0% 0.0% 0.1% 0.1% 0.0% 0.0% 0.0% 0.1% 0.0% 0.3%
20 0.1% 0.2% 0.0% 1.1% 0.1% -0.3% -0.7% -0.3% 2.1% -0.5% -0.5% 2.9% -0.3% -0.2% -0.6% -0.7% -0.4% -0.2% -0.1% 0.1% 0.1%
21 0.0% 0.0% 0.1% 0.0% -0.1% 0.0% 0.0% 0.1% 0.0% 0.0% -0.2% 0.0% 0.0% 0.0% 0.0% 0.1% 0.0% 0.1% 0.0% 0.0% 0.0% 0.0%
Total 0.3% 0.1% 0.7% -0.5% -0.4% -0.6% 0.2% 0.3% -0.7% 0.1% -1.0% 0.0% -0.2% -0.1% 0.1% -0.2% -0.3% 0.1% 0.2% 1.2% 0.0% 0.3%
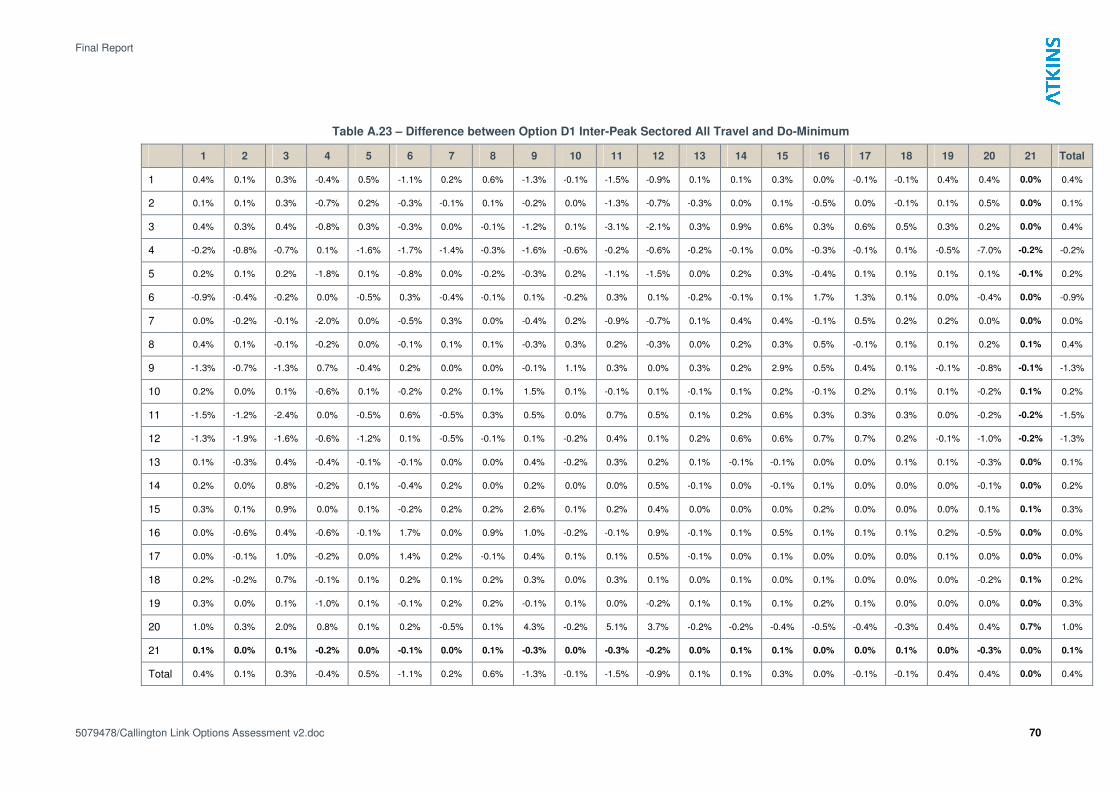
Final Report
5079478/Callington Link Options Assessment v2.doc 70
Table A.23 – Difference between Option D1 Inter-Peak Sectored All Travel and Do-Minimum
1 2 3 4 5 6 7 8 9 10 11 12 13 14 15 16 17 18 19 20 21 Total
1 0.4% 0.1% 0.3% -0.4% 0.5% -1.1% 0.2% 0.6% -1.3% -0.1% -1.5% -0.9% 0.1% 0.1% 0.3% 0.0% -0.1% -0.1% 0.4% 0.4% 0.0% 0.4%
2 0.1% 0.1% 0.3% -0.7% 0.2% -0.3% -0.1% 0.1% -0.2% 0.0% -1.3% -0.7% -0.3% 0.0% 0.1% -0.5% 0.0% -0.1% 0.1% 0.5% 0.0% 0.1%
3 0.4% 0.3% 0.4% -0.8% 0.3% -0.3% 0.0% -0.1% -1.2% 0.1% -3.1% -2.1% 0.3% 0.9% 0.6% 0.3% 0.6% 0.5% 0.3% 0.2% 0.0% 0.4%
4 -0.2% -0.8% -0.7% 0.1% -1.6% -1.7% -1.4% -0.3% -1.6% -0.6% -0.2% -0.6% -0.2% -0.1% 0.0% -0.3% -0.1% 0.1% -0.5% -7.0% -0.2% -0.2%
5 0.2% 0.1% 0.2% -1.8% 0.1% -0.8% 0.0% -0.2% -0.3% 0.2% -1.1% -1.5% 0.0% 0.2% 0.3% -0.4% 0.1% 0.1% 0.1% 0.1% -0.1% 0.2%
6 -0.9% -0.4% -0.2% 0.0% -0.5% 0.3% -0.4% -0.1% 0.1% -0.2% 0.3% 0.1% -0.2% -0.1% 0.1% 1.7% 1.3% 0.1% 0.0% -0.4% 0.0% -0.9%
7 0.0% -0.2% -0.1% -2.0% 0.0% -0.5% 0.3% 0.0% -0.4% 0.2% -0.9% -0.7% 0.1% 0.4% 0.4% -0.1% 0.5% 0.2% 0.2% 0.0% 0.0% 0.0%
8 0.4% 0.1% -0.1% -0.2% 0.0% -0.1% 0.1% 0.1% -0.3% 0.3% 0.2% -0.3% 0.0% 0.2% 0.3% 0.5% -0.1% 0.1% 0.1% 0.2% 0.1% 0.4%
9 -1.3% -0.7% -1.3% 0.7% -0.4% 0.2% 0.0% 0.0% -0.1% 1.1% 0.3% 0.0% 0.3% 0.2% 2.9% 0.5% 0.4% 0.1% -0.1% -0.8% -0.1% -1.3%
10 0.2% 0.0% 0.1% -0.6% 0.1% -0.2% 0.2% 0.1% 1.5% 0.1% -0.1% 0.1% -0.1% 0.1% 0.2% -0.1% 0.2% 0.1% 0.1% -0.2% 0.1% 0.2%
11 -1.5% -1.2% -2.4% 0.0% -0.5% 0.6% -0.5% 0.3% 0.5% 0.0% 0.7% 0.5% 0.1% 0.2% 0.6% 0.3% 0.3% 0.3% 0.0% -0.2% -0.2% -1.5%
12 -1.3% -1.9% -1.6% -0.6% -1.2% 0.1% -0.5% -0.1% 0.1% -0.2% 0.4% 0.1% 0.2% 0.6% 0.6% 0.7% 0.7% 0.2% -0.1% -1.0% -0.2% -1.3%
13 0.1% -0.3% 0.4% -0.4% -0.1% -0.1% 0.0% 0.0% 0.4% -0.2% 0.3% 0.2% 0.1% -0.1% -0.1% 0.0% 0.0% 0.1% 0.1% -0.3% 0.0% 0.1%
14 0.2% 0.0% 0.8% -0.2% 0.1% -0.4% 0.2% 0.0% 0.2% 0.0% 0.0% 0.5% -0.1% 0.0% -0.1% 0.1% 0.0% 0.0% 0.0% -0.1% 0.0% 0.2%
15 0.3% 0.1% 0.9% 0.0% 0.1% -0.2% 0.2% 0.2% 2.6% 0.1% 0.2% 0.4% 0.0% 0.0% 0.0% 0.2% 0.0% 0.0% 0.0% 0.1% 0.1% 0.3%
16 0.0% -0.6% 0.4% -0.6% -0.1% 1.7% 0.0% 0.9% 1.0% -0.2% -0.1% 0.9% -0.1% 0.1% 0.5% 0.1% 0.1% 0.1% 0.2% -0.5% 0.0% 0.0%
17 0.0% -0.1% 1.0% -0.2% 0.0% 1.4% 0.2% -0.1% 0.4% 0.1% 0.1% 0.5% -0.1% 0.0% 0.1% 0.0% 0.0% 0.0% 0.1% 0.0% 0.0% 0.0%
18 0.2% -0.2% 0.7% -0.1% 0.1% 0.2% 0.1% 0.2% 0.3% 0.0% 0.3% 0.1% 0.0% 0.1% 0.0% 0.1% 0.0% 0.0% 0.0% -0.2% 0.1% 0.2%
19 0.3% 0.0% 0.1% -1.0% 0.1% -0.1% 0.2% 0.2% -0.1% 0.1% 0.0% -0.2% 0.1% 0.1% 0.1% 0.2% 0.1% 0.0% 0.0% 0.0% 0.0% 0.3%
20 1.0% 0.3% 2.0% 0.8% 0.1% 0.2% -0.5% 0.1% 4.3% -0.2% 5.1% 3.7% -0.2% -0.2% -0.4% -0.5% -0.4% -0.3% 0.4% 0.4% 0.7% 1.0%
21 0.1% 0.0% 0.1% -0.2% 0.0% -0.1% 0.0% 0.1% -0.3% 0.0% -0.3% -0.2% 0.0% 0.1% 0.1% 0.0% 0.0% 0.1% 0.0% -0.3% 0.0% 0.1%
Total 0.4% 0.1% 0.3% -0.4% 0.5% -1.1% 0.2% 0.6% -1.3% -0.1% -1.5% -0.9% 0.1% 0.1% 0.3% 0.0% -0.1% -0.1% 0.4% 0.4% 0.0% 0.4%
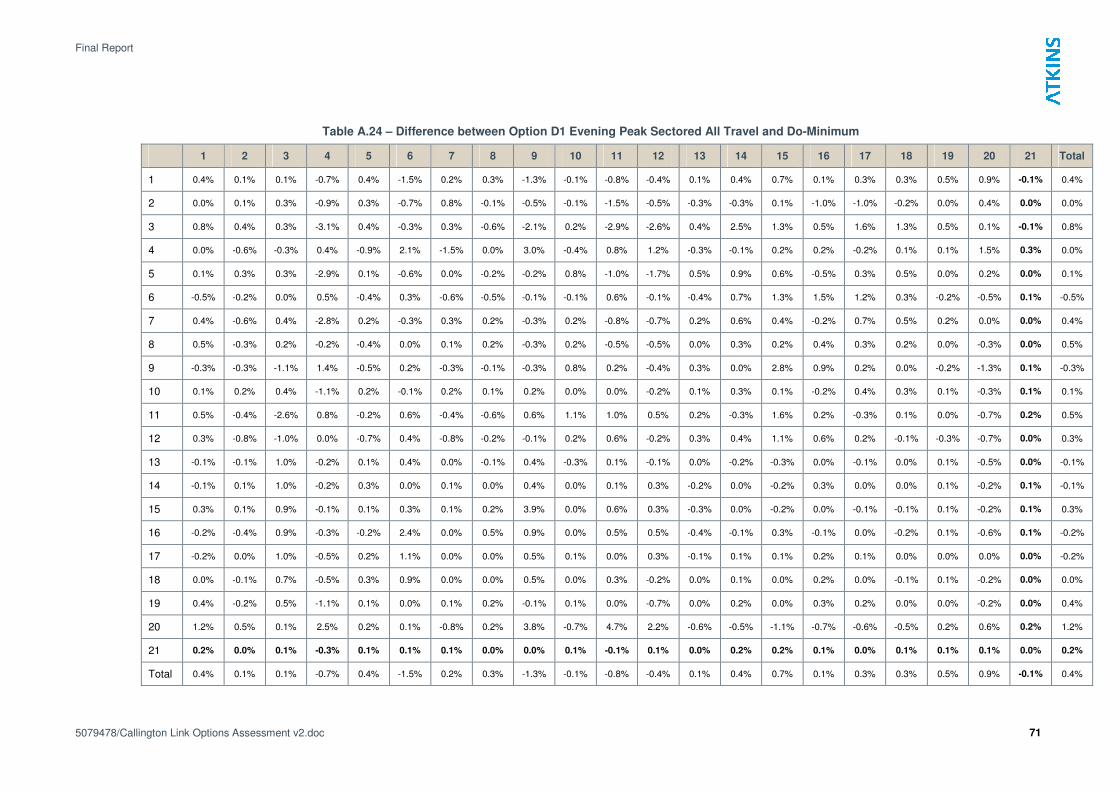
Final Report
5079478/Callington Link Options Assessment v2.doc 71
Table A.24 – Difference between Option D1 Evening Peak Sectored All Travel and Do-Minimum
1 2 3 4 5 6 7 8 9 10 11 12 13 14 15 16 17 18 19 20 21 Total
1 0.4% 0.1% 0.1% -0.7% 0.4% -1.5% 0.2% 0.3% -1.3% -0.1% -0.8% -0.4% 0.1% 0.4% 0.7% 0.1% 0.3% 0.3% 0.5% 0.9% -0.1% 0.4%
2 0.0% 0.1% 0.3% -0.9% 0.3% -0.7% 0.8% -0.1% -0.5% -0.1% -1.5% -0.5% -0.3% -0.3% 0.1% -1.0% -1.0% -0.2% 0.0% 0.4% 0.0% 0.0%
3 0.8% 0.4% 0.3% -3.1% 0.4% -0.3% 0.3% -0.6% -2.1% 0.2% -2.9% -2.6% 0.4% 2.5% 1.3% 0.5% 1.6% 1.3% 0.5% 0.1% -0.1% 0.8%
4 0.0% -0.6% -0.3% 0.4% -0.9% 2.1% -1.5% 0.0% 3.0% -0.4% 0.8% 1.2% -0.3% -0.1% 0.2% 0.2% -0.2% 0.1% 0.1% 1.5% 0.3% 0.0%
5 0.1% 0.3% 0.3% -2.9% 0.1% -0.6% 0.0% -0.2% -0.2% 0.8% -1.0% -1.7% 0.5% 0.9% 0.6% -0.5% 0.3% 0.5% 0.0% 0.2% 0.0% 0.1%
6 -0.5% -0.2% 0.0% 0.5% -0.4% 0.3% -0.6% -0.5% -0.1% -0.1% 0.6% -0.1% -0.4% 0.7% 1.3% 1.5% 1.2% 0.3% -0.2% -0.5% 0.1% -0.5%
7 0.4% -0.6% 0.4% -2.8% 0.2% -0.3% 0.3% 0.2% -0.3% 0.2% -0.8% -0.7% 0.2% 0.6% 0.4% -0.2% 0.7% 0.5% 0.2% 0.0% 0.0% 0.4%
8 0.5% -0.3% 0.2% -0.2% -0.4% 0.0% 0.1% 0.2% -0.3% 0.2% -0.5% -0.5% 0.0% 0.3% 0.2% 0.4% 0.3% 0.2% 0.0% -0.3% 0.0% 0.5%
9 -0.3% -0.3% -1.1% 1.4% -0.5% 0.2% -0.3% -0.1% -0.3% 0.8% 0.2% -0.4% 0.3% 0.0% 2.8% 0.9% 0.2% 0.0% -0.2% -1.3% 0.1% -0.3%
10 0.1% 0.2% 0.4% -1.1% 0.2% -0.1% 0.2% 0.1% 0.2% 0.0% 0.0% -0.2% 0.1% 0.3% 0.1% -0.2% 0.4% 0.3% 0.1% -0.3% 0.1% 0.1%
11 0.5% -0.4% -2.6% 0.8% -0.2% 0.6% -0.4% -0.6% 0.6% 1.1% 1.0% 0.5% 0.2% -0.3% 1.6% 0.2% -0.3% 0.1% 0.0% -0.7% 0.2% 0.5%
12 0.3% -0.8% -1.0% 0.0% -0.7% 0.4% -0.8% -0.2% -0.1% 0.2% 0.6% -0.2% 0.3% 0.4% 1.1% 0.6% 0.2% -0.1% -0.3% -0.7% 0.0% 0.3%
13 -0.1% -0.1% 1.0% -0.2% 0.1% 0.4% 0.0% -0.1% 0.4% -0.3% 0.1% -0.1% 0.0% -0.2% -0.3% 0.0% -0.1% 0.0% 0.1% -0.5% 0.0% -0.1%
14 -0.1% 0.1% 1.0% -0.2% 0.3% 0.0% 0.1% 0.0% 0.4% 0.0% 0.1% 0.3% -0.2% 0.0% -0.2% 0.3% 0.0% 0.0% 0.1% -0.2% 0.1% -0.1%
15 0.3% 0.1% 0.9% -0.1% 0.1% 0.3% 0.1% 0.2% 3.9% 0.0% 0.6% 0.3% -0.3% 0.0% -0.2% 0.0% -0.1% -0.1% 0.1% -0.2% 0.1% 0.3%
16 -0.2% -0.4% 0.9% -0.3% -0.2% 2.4% 0.0% 0.5% 0.9% 0.0% 0.5% 0.5% -0.4% -0.1% 0.3% -0.1% 0.0% -0.2% 0.1% -0.6% 0.1% -0.2%
17 -0.2% 0.0% 1.0% -0.5% 0.2% 1.1% 0.0% 0.0% 0.5% 0.1% 0.0% 0.3% -0.1% 0.1% 0.1% 0.2% 0.1% 0.0% 0.0% 0.0% 0.0% -0.2%
18 0.0% -0.1% 0.7% -0.5% 0.3% 0.9% 0.0% 0.0% 0.5% 0.0% 0.3% -0.2% 0.0% 0.1% 0.0% 0.2% 0.0% -0.1% 0.1% -0.2% 0.0% 0.0%
19 0.4% -0.2% 0.5% -1.1% 0.1% 0.0% 0.1% 0.2% -0.1% 0.1% 0.0% -0.7% 0.0% 0.2% 0.0% 0.3% 0.2% 0.0% 0.0% -0.2% 0.0% 0.4%
20 1.2% 0.5% 0.1% 2.5% 0.2% 0.1% -0.8% 0.2% 3.8% -0.7% 4.7% 2.2% -0.6% -0.5% -1.1% -0.7% -0.6% -0.5% 0.2% 0.6% 0.2% 1.2%
21 0.2% 0.0% 0.1% -0.3% 0.1% 0.1% 0.1% 0.0% 0.0% 0.1% -0.1% 0.1% 0.0% 0.2% 0.2% 0.1% 0.0% 0.1% 0.1% 0.1% 0.0% 0.2%
Total 0.4% 0.1% 0.1% -0.7% 0.4% -1.5% 0.2% 0.3% -1.3% -0.1% -0.8% -0.4% 0.1% 0.4% 0.7% 0.1% 0.3% 0.3% 0.5% 0.9% -0.1% 0.4%
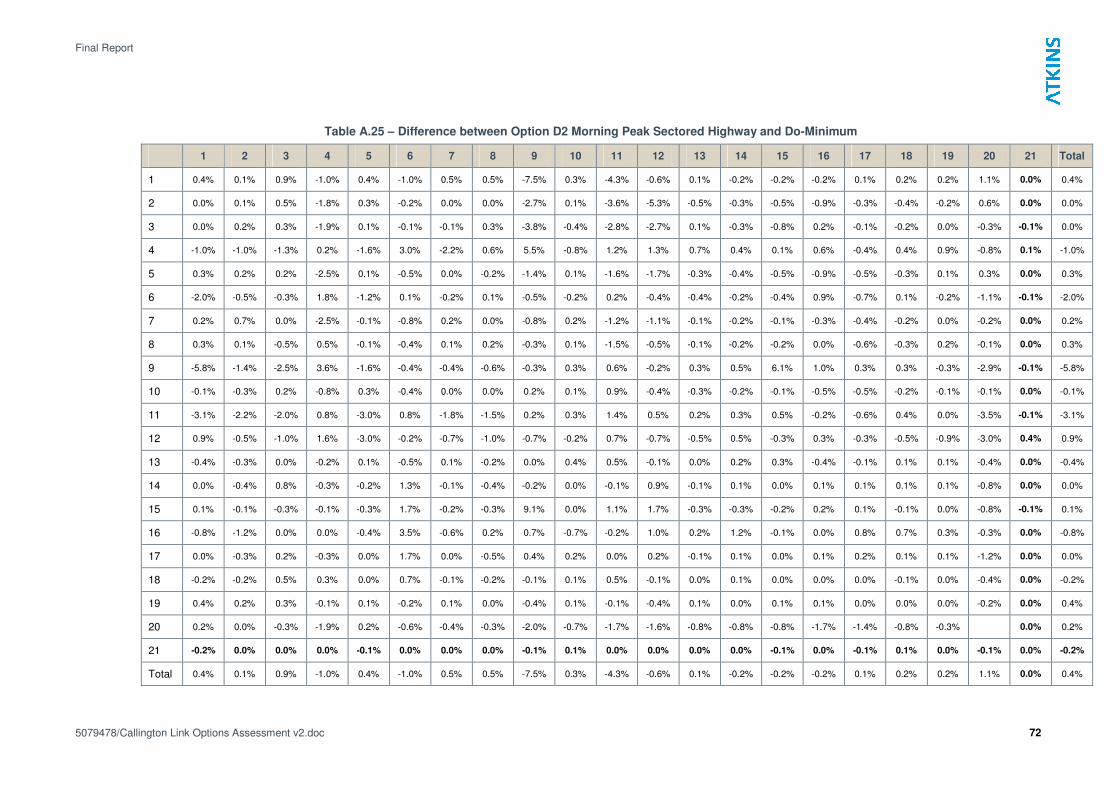
Final Report
5079478/Callington Link Options Assessment v2.doc 72
Table A.25 – Difference between Option D2 Morning Peak Sectored Highway and Do-Minimum
1 2 3 4 5 6 7 8 9 10 11 12 13 14 15 16 17 18 19 20 21 Total
1 0.4% 0.1% 0.9% -1.0% 0.4% -1.0% 0.5% 0.5% -7.5% 0.3% -4.3% -0.6% 0.1% -0.2% -0.2% -0.2% 0.1% 0.2% 0.2% 1.1% 0.0% 0.4%
2 0.0% 0.1% 0.5% -1.8% 0.3% -0.2% 0.0% 0.0% -2.7% 0.1% -3.6% -5.3% -0.5% -0.3% -0.5% -0.9% -0.3% -0.4% -0.2% 0.6% 0.0% 0.0%
3 0.0% 0.2% 0.3% -1.9% 0.1% -0.1% -0.1% 0.3% -3.8% -0.4% -2.8% -2.7% 0.1% -0.3% -0.8% 0.2% -0.1% -0.2% 0.0% -0.3% -0.1% 0.0%
4 -1.0% -1.0% -1.3% 0.2% -1.6% 3.0% -2.2% 0.6% 5.5% -0.8% 1.2% 1.3% 0.7% 0.4% 0.1% 0.6% -0.4% 0.4% 0.9% -0.8% 0.1% -1.0%
5 0.3% 0.2% 0.2% -2.5% 0.1% -0.5% 0.0% -0.2% -1.4% 0.1% -1.6% -1.7% -0.3% -0.4% -0.5% -0.9% -0.5% -0.3% 0.1% 0.3% 0.0% 0.3%
6 -2.0% -0.5% -0.3% 1.8% -1.2% 0.1% -0.2% 0.1% -0.5% -0.2% 0.2% -0.4% -0.4% -0.2% -0.4% 0.9% -0.7% 0.1% -0.2% -1.1% -0.1% -2.0%
7 0.2% 0.7% 0.0% -2.5% -0.1% -0.8% 0.2% 0.0% -0.8% 0.2% -1.2% -1.1% -0.1% -0.2% -0.1% -0.3% -0.4% -0.2% 0.0% -0.2% 0.0% 0.2%
8 0.3% 0.1% -0.5% 0.5% -0.1% -0.4% 0.1% 0.2% -0.3% 0.1% -1.5% -0.5% -0.1% -0.2% -0.2% 0.0% -0.6% -0.3% 0.2% -0.1% 0.0% 0.3%
9 -5.8% -1.4% -2.5% 3.6% -1.6% -0.4% -0.4% -0.6% -0.3% 0.3% 0.6% -0.2% 0.3% 0.5% 6.1% 1.0% 0.3% 0.3% -0.3% -2.9% -0.1% -5.8%
10 -0.1% -0.3% 0.2% -0.8% 0.3% -0.4% 0.0% 0.0% 0.2% 0.1% 0.9% -0.4% -0.3% -0.2% -0.1% -0.5% -0.5% -0.2% -0.1% -0.1% 0.0% -0.1%
11 -3.1% -2.2% -2.0% 0.8% -3.0% 0.8% -1.8% -1.5% 0.2% 0.3% 1.4% 0.5% 0.2% 0.3% 0.5% -0.2% -0.6% 0.4% 0.0% -3.5% -0.1% -3.1%
12 0.9% -0.5% -1.0% 1.6% -3.0% -0.2% -0.7% -1.0% -0.7% -0.2% 0.7% -0.7% -0.5% 0.5% -0.3% 0.3% -0.3% -0.5% -0.9% -3.0% 0.4% 0.9%
13 -0.4% -0.3% 0.0% -0.2% 0.1% -0.5% 0.1% -0.2% 0.0% 0.4% 0.5% -0.1% 0.0% 0.2% 0.3% -0.4% -0.1% 0.1% 0.1% -0.4% 0.0% -0.4%
14 0.0% -0.4% 0.8% -0.3% -0.2% 1.3% -0.1% -0.4% -0.2% 0.0% -0.1% 0.9% -0.1% 0.1% 0.0% 0.1% 0.1% 0.1% 0.1% -0.8% 0.0% 0.0%
15 0.1% -0.1% -0.3% -0.1% -0.3% 1.7% -0.2% -0.3% 9.1% 0.0% 1.1% 1.7% -0.3% -0.3% -0.2% 0.2% 0.1% -0.1% 0.0% -0.8% -0.1% 0.1%
16 -0.8% -1.2% 0.0% 0.0% -0.4% 3.5% -0.6% 0.2% 0.7% -0.7% -0.2% 1.0% 0.2% 1.2% -0.1% 0.0% 0.8% 0.7% 0.3% -0.3% 0.0% -0.8%
17 0.0% -0.3% 0.2% -0.3% 0.0% 1.7% 0.0% -0.5% 0.4% 0.2% 0.0% 0.2% -0.1% 0.1% 0.0% 0.1% 0.2% 0.1% 0.1% -1.2% 0.0% 0.0%
18 -0.2% -0.2% 0.5% 0.3% 0.0% 0.7% -0.1% -0.2% -0.1% 0.1% 0.5% -0.1% 0.0% 0.1% 0.0% 0.0% 0.0% -0.1% 0.0% -0.4% 0.0% -0.2%
19 0.4% 0.2% 0.3% -0.1% 0.1% -0.2% 0.1% 0.0% -0.4% 0.1% -0.1% -0.4% 0.1% 0.0% 0.1% 0.1% 0.0% 0.0% 0.0% -0.2% 0.0% 0.4%
20 0.2% 0.0% -0.3% -1.9% 0.2% -0.6% -0.4% -0.3% -2.0% -0.7% -1.7% -1.6% -0.8% -0.8% -0.8% -1.7% -1.4% -0.8% -0.3% 0.0% 0.2%
21 -0.2% 0.0% 0.0% 0.0% -0.1% 0.0% 0.0% 0.0% -0.1% 0.1% 0.0% 0.0% 0.0% 0.0% -0.1% 0.0% -0.1% 0.1% 0.0% -0.1% 0.0% -0.2%
Total 0.4% 0.1% 0.9% -1.0% 0.4% -1.0% 0.5% 0.5% -7.5% 0.3% -4.3% -0.6% 0.1% -0.2% -0.2% -0.2% 0.1% 0.2% 0.2% 1.1% 0.0% 0.4%
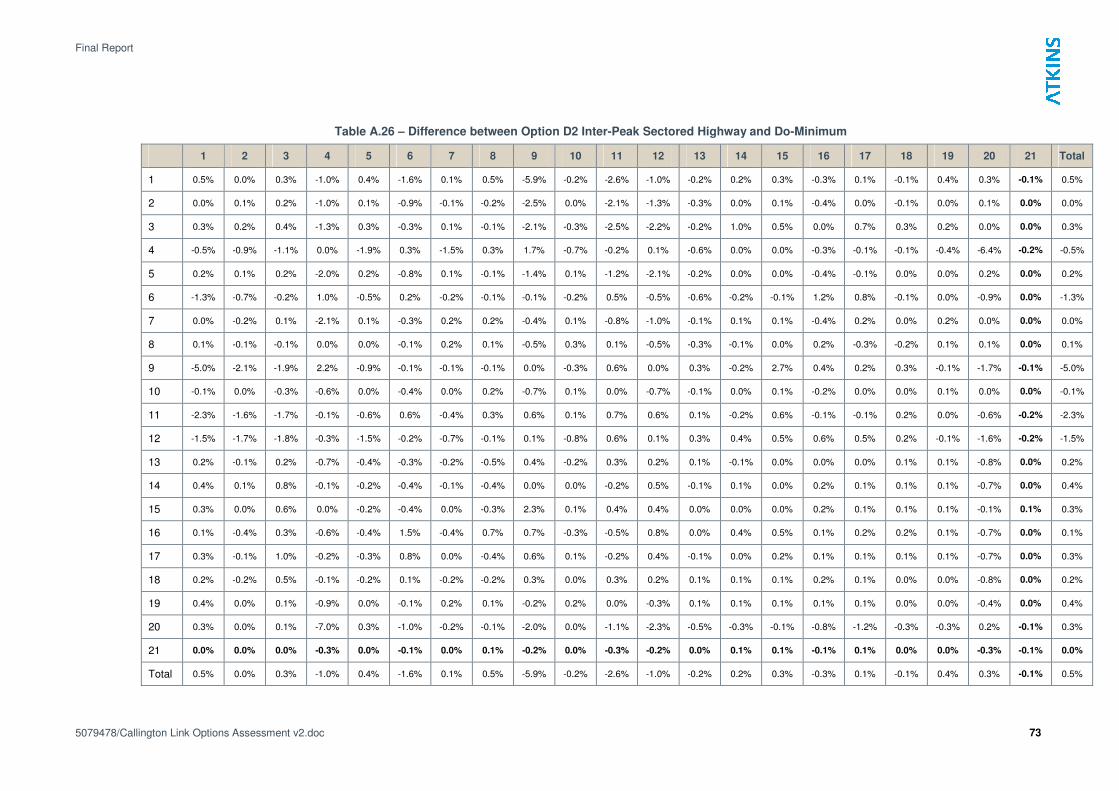
Final Report
5079478/Callington Link Options Assessment v2.doc 73
Table A.26 – Difference between Option D2 Inter-Peak Sectored Highway and Do-Minimum
1 2 3 4 5 6 7 8 9 10 11 12 13 14 15 16 17 18 19 20 21 Total
1 0.5% 0.0% 0.3% -1.0% 0.4% -1.6% 0.1% 0.5% -5.9% -0.2% -2.6% -1.0% -0.2% 0.2% 0.3% -0.3% 0.1% -0.1% 0.4% 0.3% -0.1% 0.5%
2 0.0% 0.1% 0.2% -1.0% 0.1% -0.9% -0.1% -0.2% -2.5% 0.0% -2.1% -1.3% -0.3% 0.0% 0.1% -0.4% 0.0% -0.1% 0.0% 0.1% 0.0% 0.0%
3 0.3% 0.2% 0.4% -1.3% 0.3% -0.3% 0.1% -0.1% -2.1% -0.3% -2.5% -2.2% -0.2% 1.0% 0.5% 0.0% 0.7% 0.3% 0.2% 0.0% 0.0% 0.3%
4 -0.5% -0.9% -1.1% 0.0% -1.9% 0.3% -1.5% 0.3% 1.7% -0.7% -0.2% 0.1% -0.6% 0.0% 0.0% -0.3% -0.1% -0.1% -0.4% -6.4% -0.2% -0.5%
5 0.2% 0.1% 0.2% -2.0% 0.2% -0.8% 0.1% -0.1% -1.4% 0.1% -1.2% -2.1% -0.2% 0.0% 0.0% -0.4% -0.1% 0.0% 0.0% 0.2% 0.0% 0.2%
6 -1.3% -0.7% -0.2% 1.0% -0.5% 0.2% -0.2% -0.1% -0.1% -0.2% 0.5% -0.5% -0.6% -0.2% -0.1% 1.2% 0.8% -0.1% 0.0% -0.9% 0.0% -1.3%
7 0.0% -0.2% 0.1% -2.1% 0.1% -0.3% 0.2% 0.2% -0.4% 0.1% -0.8% -1.0% -0.1% 0.1% 0.1% -0.4% 0.2% 0.0% 0.2% 0.0% 0.0% 0.0%
8 0.1% -0.1% -0.1% 0.0% 0.0% -0.1% 0.2% 0.1% -0.5% 0.3% 0.1% -0.5% -0.3% -0.1% 0.0% 0.2% -0.3% -0.2% 0.1% 0.1% 0.0% 0.1%
9 -5.0% -2.1% -1.9% 2.2% -0.9% -0.1% -0.1% -0.1% 0.0% -0.3% 0.6% 0.0% 0.3% -0.2% 2.7% 0.4% 0.2% 0.3% -0.1% -1.7% -0.1% -5.0%
10 -0.1% 0.0% -0.3% -0.6% 0.0% -0.4% 0.0% 0.2% -0.7% 0.1% 0.0% -0.7% -0.1% 0.0% 0.1% -0.2% 0.0% 0.0% 0.1% 0.0% 0.0% -0.1%
11 -2.3% -1.6% -1.7% -0.1% -0.6% 0.6% -0.4% 0.3% 0.6% 0.1% 0.7% 0.6% 0.1% -0.2% 0.6% -0.1% -0.1% 0.2% 0.0% -0.6% -0.2% -2.3%
12 -1.5% -1.7% -1.8% -0.3% -1.5% -0.2% -0.7% -0.1% 0.1% -0.8% 0.6% 0.1% 0.3% 0.4% 0.5% 0.6% 0.5% 0.2% -0.1% -1.6% -0.2% -1.5%
13 0.2% -0.1% 0.2% -0.7% -0.4% -0.3% -0.2% -0.5% 0.4% -0.2% 0.3% 0.2% 0.1% -0.1% 0.0% 0.0% 0.0% 0.1% 0.1% -0.8% 0.0% 0.2%
14 0.4% 0.1% 0.8% -0.1% -0.2% -0.4% -0.1% -0.4% 0.0% 0.0% -0.2% 0.5% -0.1% 0.1% 0.0% 0.2% 0.1% 0.1% 0.1% -0.7% 0.0% 0.4%
15 0.3% 0.0% 0.6% 0.0% -0.2% -0.4% 0.0% -0.3% 2.3% 0.1% 0.4% 0.4% 0.0% 0.0% 0.0% 0.2% 0.1% 0.1% 0.1% -0.1% 0.1% 0.3%
16 0.1% -0.4% 0.3% -0.6% -0.4% 1.5% -0.4% 0.7% 0.7% -0.3% -0.5% 0.8% 0.0% 0.4% 0.5% 0.1% 0.2% 0.2% 0.1% -0.7% 0.0% 0.1%
17 0.3% -0.1% 1.0% -0.2% -0.3% 0.8% 0.0% -0.4% 0.6% 0.1% -0.2% 0.4% -0.1% 0.0% 0.2% 0.1% 0.1% 0.1% 0.1% -0.7% 0.0% 0.3%
18 0.2% -0.2% 0.5% -0.1% -0.2% 0.1% -0.2% -0.2% 0.3% 0.0% 0.3% 0.2% 0.1% 0.1% 0.1% 0.2% 0.1% 0.0% 0.0% -0.8% 0.0% 0.2%
19 0.4% 0.0% 0.1% -0.9% 0.0% -0.1% 0.2% 0.1% -0.2% 0.2% 0.0% -0.3% 0.1% 0.1% 0.1% 0.1% 0.1% 0.0% 0.0% -0.4% 0.0% 0.4%
20 0.3% 0.0% 0.1% -7.0% 0.3% -1.0% -0.2% -0.1% -2.0% 0.0% -1.1% -2.3% -0.5% -0.3% -0.1% -0.8% -1.2% -0.3% -0.3% 0.2% -0.1% 0.3%
21 0.0% 0.0% 0.0% -0.3% 0.0% -0.1% 0.0% 0.1% -0.2% 0.0% -0.3% -0.2% 0.0% 0.1% 0.1% -0.1% 0.1% 0.0% 0.0% -0.3% -0.1% 0.0%
Total 0.5% 0.0% 0.3% -1.0% 0.4% -1.6% 0.1% 0.5% -5.9% -0.2% -2.6% -1.0% -0.2% 0.2% 0.3% -0.3% 0.1% -0.1% 0.4% 0.3% -0.1% 0.5%

Final Report
5079478/Callington Link Options Assessment v2.doc 74
Table A.27 – Difference between Option D2 Evening Peak Sectored Highway and Do-Minimum
1 2 3 4 5 6 7 8 9 10 11 12 13 14 15 16 17 18 19 20 21 Total
1 0.4% 0.0% 0.0% -2.1% 0.3% -3.1% 0.1% -0.2% -7.7% 0.1% -4.2% -0.7% -0.1% 1.0% 1.0% -0.3% 0.6% 0.4% 0.5% 0.0% -0.4% 0.4%
2 0.1% 0.1% 0.3% -1.2% 0.4% -1.3% 1.1% -0.2% -2.4% -0.3% -2.6% -1.8% -0.2% -0.5% -0.2% -0.5% -0.7% -0.3% 0.0% 0.2% 0.0% 0.1%
3 1.0% 0.5% 0.3% -3.9% 0.2% -0.5% 0.1% -0.8% -3.1% 0.5% -3.1% -2.7% 0.4% 3.3% 1.1% 0.6% 2.5% 1.8% 0.3% -0.2% -0.2% 1.0%
4 -0.2% -0.9% -0.9% 0.2% -1.7% 6.2% -1.8% 4.1% 5.9% -0.7% 0.4% 1.5% -0.3% -0.1% 0.1% 0.1% -0.3% 0.0% 0.2% -3.2% 0.3% -0.2%
5 0.7% 0.4% 0.3% -3.4% 0.2% -0.8% 0.0% -0.3% -1.8% 0.6% -2.0% -2.8% 0.1% 0.3% 0.2% 0.2% 0.2% 0.2% -0.1% 0.3% 0.0% 0.7%
6 -0.8% -0.3% 0.0% 1.5% -0.4% 0.3% -0.6% -0.5% -0.4% -0.3% 0.6% -0.5% -0.6% 1.0% 1.3% 1.8% 1.5% 0.2% -0.1% -0.7% 0.1% -0.8%
7 0.9% 0.1% 0.5% -3.1% 0.1% -0.2% 0.2% 0.1% -0.6% 0.1% -1.2% -1.0% -0.1% 0.2% 0.1% -0.2% 0.3% 0.0% 0.1% -0.1% 0.0% 0.9%
8 0.6% -0.1% 0.2% 0.3% -0.5% 0.0% 0.1% 0.2% -0.7% 0.1% -0.7% -0.9% -0.3% -0.1% -0.1% 0.2% 0.0% -0.2% 0.0% -0.4% 0.0% 0.6%
9 -3.8% -1.5% -1.8% 2.5% -1.0% -0.1% -0.5% -0.2% -0.2% -0.3% 0.4% -0.3% 0.3% 0.0% 2.4% 0.6% 0.3% 0.1% -0.3% -1.9% 0.1% -3.8%
10 0.3% 0.2% 0.3% -1.2% 0.2% -0.3% 0.2% 0.1% -0.6% 0.1% -0.1% -0.5% -0.1% 0.1% 0.1% -0.2% 0.2% 0.2% 0.1% -0.4% 0.1% 0.3%
11 -0.4% -1.2% -0.8% 1.0% -0.4% 0.5% -0.7% -0.8% 0.7% 1.0% 1.1% 0.6% 0.4% -0.4% 1.2% -0.1% -0.4% 0.2% -0.1% -1.1% 0.3% -0.4%
12 0.4% -1.0% -1.1% 0.2% -1.1% 0.0% -1.0% -0.3% 0.1% -0.4% 0.7% -0.2% 0.4% 0.6% 0.9% 0.6% 0.4% 0.1% -0.3% -1.2% 0.0% 0.4%
13 0.0% 0.0% 1.2% -0.2% 0.0% 0.0% -0.1% -0.2% 0.4% -0.3% 0.2% -0.1% 0.0% -0.1% -0.2% 0.0% -0.1% 0.0% 0.0% -0.7% 0.0% 0.0%
14 -0.1% -0.1% 1.1% 0.0% 0.1% -0.3% 0.0% -0.1% 0.4% -0.1% 0.0% 0.4% -0.2% 0.1% -0.1% 0.5% 0.0% 0.0% 0.1% -0.6% 0.0% -0.1%
15 0.0% -0.2% 0.2% 0.0% 0.0% -0.1% 0.0% 0.1% 3.3% 0.1% 0.6% 0.3% -0.2% 0.1% -0.1% 0.1% 0.0% 0.0% 0.1% -0.5% 0.0% 0.0%
16 -0.2% -0.2% 1.1% -0.1% -0.1% 2.3% -0.2% 0.0% 0.9% -0.2% 0.0% 0.5% -0.4% -0.1% 0.3% -0.1% -0.1% -0.1% 0.0% -1.2% 0.1% -0.2%
17 0.1% 0.0% 1.0% -0.6% 0.0% 0.5% -0.1% -0.2% 0.6% 0.0% -0.2% 0.2% -0.1% 0.1% 0.1% 0.2% 0.1% 0.0% 0.1% -0.8% 0.0% 0.1%
18 0.1% -0.1% 0.6% -0.4% 0.1% 0.5% -0.1% -0.2% 0.5% 0.0% 0.4% -0.2% 0.1% 0.1% 0.0% 0.3% 0.1% -0.1% 0.1% -0.6% 0.0% 0.1%
19 0.5% 0.0% 0.4% -1.1% 0.1% 0.0% 0.1% 0.2% -0.3% 0.2% 0.0% -0.8% 0.0% 0.2% 0.1% 0.2% 0.2% 0.0% 0.0% -0.4% 0.0% 0.5%
20 1.1% 0.8% 0.1% -8.6% 0.4% -0.9% 0.0% -0.1% -3.1% 0.3% -2.5% -3.8% -0.5% -0.6% -0.2% 0.5% -1.0% -0.1% -0.5% 0.4% -0.2% 1.1%
21 0.3% 0.1% 0.1% -0.5% 0.0% 0.2% 0.1% 0.0% 0.1% 0.0% -0.3% 0.1% 0.0% 0.2% 0.1% 0.1% 0.1% 0.1% 0.0% 0.0% 0.0% 0.3%
Total 0.4% 0.0% 0.0% -2.1% 0.3% -3.1% 0.1% -0.2% -7.7% 0.1% -4.2% -0.7% -0.1% 1.0% 1.0% -0.3% 0.6% 0.4% 0.5% 0.0% -0.4% 0.4%
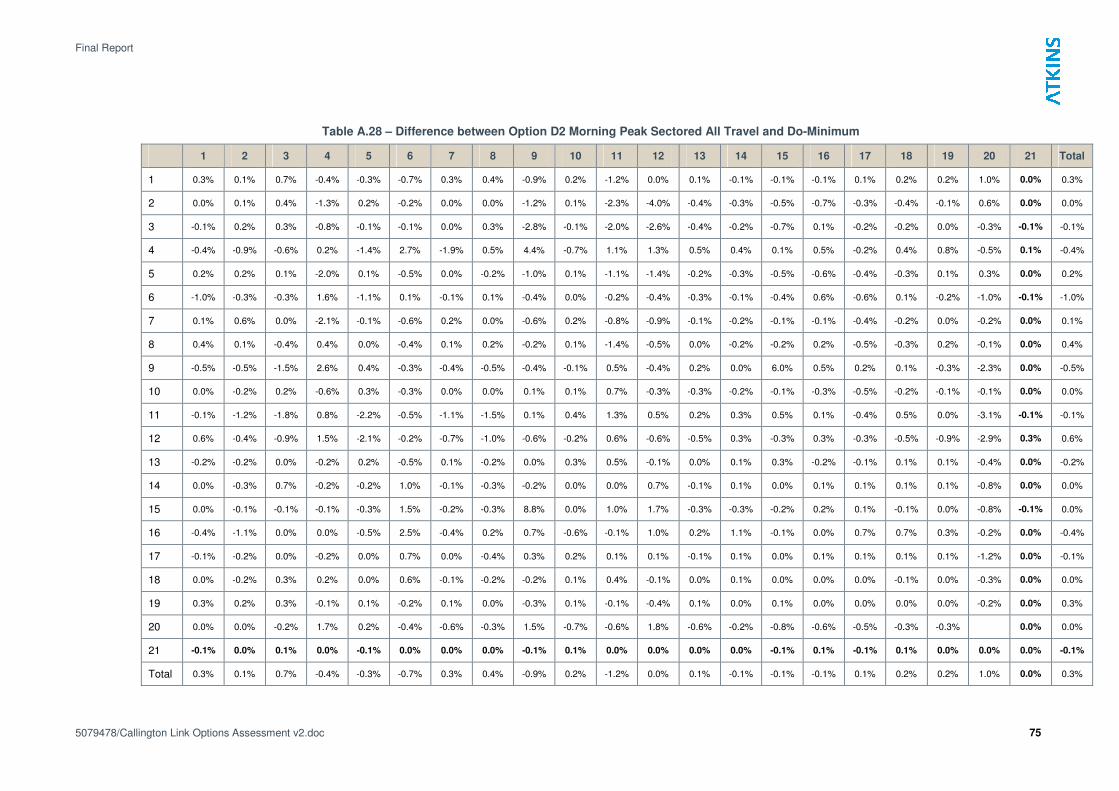
Final Report
5079478/Callington Link Options Assessment v2.doc 75
Table A.28 – Difference between Option D2 Morning Peak Sectored All Travel and Do-Minimum
1 2 3 4 5 6 7 8 9 10 11 12 13 14 15 16 17 18 19 20 21 Total
1 0.3% 0.1% 0.7% -0.4% -0.3% -0.7% 0.3% 0.4% -0.9% 0.2% -1.2% 0.0% 0.1% -0.1% -0.1% -0.1% 0.1% 0.2% 0.2% 1.0% 0.0% 0.3%
2 0.0% 0.1% 0.4% -1.3% 0.2% -0.2% 0.0% 0.0% -1.2% 0.1% -2.3% -4.0% -0.4% -0.3% -0.5% -0.7% -0.3% -0.4% -0.1% 0.6% 0.0% 0.0%
3 -0.1% 0.2% 0.3% -0.8% -0.1% -0.1% 0.0% 0.3% -2.8% -0.1% -2.0% -2.6% -0.4% -0.2% -0.7% 0.1% -0.2% -0.2% 0.0% -0.3% -0.1% -0.1%
4 -0.4% -0.9% -0.6% 0.2% -1.4% 2.7% -1.9% 0.5% 4.4% -0.7% 1.1% 1.3% 0.5% 0.4% 0.1% 0.5% -0.2% 0.4% 0.8% -0.5% 0.1% -0.4%
5 0.2% 0.2% 0.1% -2.0% 0.1% -0.5% 0.0% -0.2% -1.0% 0.1% -1.1% -1.4% -0.2% -0.3% -0.5% -0.6% -0.4% -0.3% 0.1% 0.3% 0.0% 0.2%
6 -1.0% -0.3% -0.3% 1.6% -1.1% 0.1% -0.1% 0.1% -0.4% 0.0% -0.2% -0.4% -0.3% -0.1% -0.4% 0.6% -0.6% 0.1% -0.2% -1.0% -0.1% -1.0%
7 0.1% 0.6% 0.0% -2.1% -0.1% -0.6% 0.2% 0.0% -0.6% 0.2% -0.8% -0.9% -0.1% -0.2% -0.1% -0.1% -0.4% -0.2% 0.0% -0.2% 0.0% 0.1%
8 0.4% 0.1% -0.4% 0.4% 0.0% -0.4% 0.1% 0.2% -0.2% 0.1% -1.4% -0.5% 0.0% -0.2% -0.2% 0.2% -0.5% -0.3% 0.2% -0.1% 0.0% 0.4%
9 -0.5% -0.5% -1.5% 2.6% 0.4% -0.3% -0.4% -0.5% -0.4% -0.1% 0.5% -0.4% 0.2% 0.0% 6.0% 0.5% 0.2% 0.1% -0.3% -2.3% 0.0% -0.5%
10 0.0% -0.2% 0.2% -0.6% 0.3% -0.3% 0.0% 0.0% 0.1% 0.1% 0.7% -0.3% -0.3% -0.2% -0.1% -0.3% -0.5% -0.2% -0.1% -0.1% 0.0% 0.0%
11 -0.1% -1.2% -1.8% 0.8% -2.2% -0.5% -1.1% -1.5% 0.1% 0.4% 1.3% 0.5% 0.2% 0.3% 0.5% 0.1% -0.4% 0.5% 0.0% -3.1% -0.1% -0.1%
12 0.6% -0.4% -0.9% 1.5% -2.1% -0.2% -0.7% -1.0% -0.6% -0.2% 0.6% -0.6% -0.5% 0.3% -0.3% 0.3% -0.3% -0.5% -0.9% -2.9% 0.3% 0.6%
13 -0.2% -0.2% 0.0% -0.2% 0.2% -0.5% 0.1% -0.2% 0.0% 0.3% 0.5% -0.1% 0.0% 0.1% 0.3% -0.2% -0.1% 0.1% 0.1% -0.4% 0.0% -0.2%
14 0.0% -0.3% 0.7% -0.2% -0.2% 1.0% -0.1% -0.3% -0.2% 0.0% 0.0% 0.7% -0.1% 0.1% 0.0% 0.1% 0.1% 0.1% 0.1% -0.8% 0.0% 0.0%
15 0.0% -0.1% -0.1% -0.1% -0.3% 1.5% -0.2% -0.3% 8.8% 0.0% 1.0% 1.7% -0.3% -0.3% -0.2% 0.2% 0.1% -0.1% 0.0% -0.8% -0.1% 0.0%
16 -0.4% -1.1% 0.0% 0.0% -0.5% 2.5% -0.4% 0.2% 0.7% -0.6% -0.1% 1.0% 0.2% 1.1% -0.1% 0.0% 0.7% 0.7% 0.3% -0.2% 0.0% -0.4%
17 -0.1% -0.2% 0.0% -0.2% 0.0% 0.7% 0.0% -0.4% 0.3% 0.2% 0.1% 0.1% -0.1% 0.1% 0.0% 0.1% 0.1% 0.1% 0.1% -1.2% 0.0% -0.1%
18 0.0% -0.2% 0.3% 0.2% 0.0% 0.6% -0.1% -0.2% -0.2% 0.1% 0.4% -0.1% 0.0% 0.1% 0.0% 0.0% 0.0% -0.1% 0.0% -0.3% 0.0% 0.0%
19 0.3% 0.2% 0.3% -0.1% 0.1% -0.2% 0.1% 0.0% -0.3% 0.1% -0.1% -0.4% 0.1% 0.0% 0.1% 0.0% 0.0% 0.0% 0.0% -0.2% 0.0% 0.3%
20 0.0% 0.0% -0.2% 1.7% 0.2% -0.4% -0.6% -0.3% 1.5% -0.7% -0.6% 1.8% -0.6% -0.2% -0.8% -0.6% -0.5% -0.3% -0.3% 0.0% 0.0%
21 -0.1% 0.0% 0.1% 0.0% -0.1% 0.0% 0.0% 0.0% -0.1% 0.1% 0.0% 0.0% 0.0% 0.0% -0.1% 0.1% -0.1% 0.1% 0.0% 0.0% 0.0% -0.1%
Total 0.3% 0.1% 0.7% -0.4% -0.3% -0.7% 0.3% 0.4% -0.9% 0.2% -1.2% 0.0% 0.1% -0.1% -0.1% -0.1% 0.1% 0.2% 0.2% 1.0% 0.0% 0.3%

Final Report
5079478/Callington Link Options Assessment v2.doc 76
Table A.29 – Difference between Option D2 Inter-Peak Sectored All Travel and Do-Minimum
1 2 3 4 5 6 7 8 9 10 11 12 13 14 15 16 17 18 19 20 21 Total
1 0.4% 0.0% 0.1% -0.5% 0.6% -1.3% 0.1% 0.4% -0.5% -0.2% -0.8% -0.2% 0.0% 0.2% 0.2% -0.1% 0.1% -0.1% 0.3% 0.3% 0.0% 0.4%
2 0.0% 0.1% 0.1% -0.8% 0.1% -0.8% -0.1% -0.2% -0.5% 0.0% -1.4% -0.5% -0.3% 0.0% 0.1% -0.4% 0.0% -0.1% 0.0% 0.4% 0.0% 0.0%
3 0.2% 0.2% 0.4% -0.5% 0.3% -0.3% 0.1% -0.1% -1.1% -0.3% -1.5% -2.1% 0.0% 0.9% 0.5% 0.1% 0.7% 0.3% 0.2% 0.1% 0.0% 0.2%
4 -0.3% -0.8% -0.3% -0.1% -1.5% 0.3% -1.5% 0.3% 1.5% -0.7% -0.1% 0.1% -0.4% 0.0% 0.1% -0.3% -0.1% 0.1% -0.4% -6.2% -0.2% -0.3%
5 0.2% 0.1% 0.1% -1.8% 0.2% -0.8% 0.1% -0.1% -0.4% 0.1% -1.0% -1.8% -0.1% 0.0% 0.0% -0.4% -0.1% 0.0% 0.0% 0.2% 0.0% 0.2%
6 -1.0% -0.7% -0.2% 1.0% -0.5% 0.2% -0.2% -0.1% -0.1% -0.2% 0.3% -0.5% -0.5% -0.2% -0.1% 1.1% 0.7% -0.1% 0.0% -0.8% 0.0% -1.0%
7 0.1% -0.2% 0.1% -2.0% 0.1% -0.3% 0.2% 0.2% -0.3% 0.1% -0.7% -1.0% -0.1% 0.1% 0.1% -0.4% 0.2% 0.0% 0.1% 0.0% 0.0% 0.1%
8 0.3% -0.1% -0.1% 0.0% 0.0% -0.1% 0.2% 0.1% -0.4% 0.3% 0.1% -0.5% -0.2% -0.1% 0.0% 0.2% -0.2% -0.1% 0.1% 0.1% 0.0% 0.3%
9 -0.8% -0.9% -1.3% 1.8% -0.5% -0.1% -0.1% -0.1% -0.3% 1.0% 0.4% -0.1% 0.3% -0.1% 2.7% 0.3% 0.2% 0.0% -0.1% -1.3% 0.0% -0.8%
10 0.1% 0.0% -0.1% -0.5% 0.0% -0.4% 0.0% 0.2% 1.4% 0.1% 0.3% -0.1% -0.1% 0.0% 0.1% -0.2% 0.0% 0.0% 0.1% 0.0% 0.0% 0.1%
11 -1.0% -1.2% -0.5% -0.1% -0.5% 0.6% -0.4% 0.3% 0.3% 0.2% 0.6% 0.5% 0.0% -0.2% 0.6% 0.0% -0.1% 0.2% -0.1% -0.6% 0.0% -1.0%
12 -0.6% -1.6% -1.7% -0.3% -1.4% -0.2% -0.7% -0.1% 0.0% -0.4% 0.5% 0.0% 0.3% 0.4% 0.5% 0.6% 0.5% 0.2% -0.1% -1.6% -0.2% -0.6%
13 0.1% -0.2% 0.2% -0.5% -0.3% -0.2% -0.1% -0.4% 0.4% -0.2% 0.3% 0.2% 0.1% -0.1% -0.1% 0.0% 0.0% 0.1% 0.1% -0.8% 0.0% 0.1%
14 0.3% 0.1% 0.7% -0.1% -0.2% -0.4% -0.1% -0.4% 0.1% 0.0% -0.1% 0.5% -0.1% 0.1% 0.0% 0.2% 0.1% 0.1% 0.1% -0.6% 0.0% 0.3%
15 0.1% 0.0% 0.5% 0.0% -0.2% -0.4% 0.0% -0.3% 2.5% 0.1% 0.4% 0.4% -0.1% 0.0% 0.0% 0.2% 0.1% 0.1% 0.1% -0.1% 0.1% 0.1%
16 0.0% -0.4% 0.2% -0.6% -0.3% 1.3% -0.4% 0.6% 0.8% -0.3% -0.3% 0.8% 0.0% 0.3% 0.5% 0.1% 0.2% 0.2% 0.1% -0.6% 0.0% 0.0%
17 0.1% -0.1% 0.8% -0.2% -0.3% 0.7% 0.0% -0.4% 0.3% 0.1% -0.1% 0.4% -0.1% 0.0% 0.2% 0.1% 0.0% 0.0% 0.1% -0.5% 0.0% 0.1%
18 0.2% -0.2% 0.5% -0.1% -0.2% 0.1% -0.2% -0.2% 0.2% 0.0% 0.3% 0.2% 0.1% 0.1% 0.1% 0.1% 0.1% 0.0% 0.0% -0.7% 0.0% 0.2%
19 0.3% 0.0% 0.1% -0.9% 0.0% -0.1% 0.2% 0.1% -0.2% 0.2% 0.0% -0.3% 0.1% 0.1% 0.1% 0.1% 0.1% 0.0% 0.0% -0.4% 0.0% 0.3%
20 1.0% 0.1% 2.1% 0.9% 0.3% 0.0% -0.3% 0.1% 4.0% -0.1% 5.4% 3.4% -0.5% -0.3% -0.5% -0.3% -0.5% -0.4% 0.2% 0.2% 0.7% 1.0%
21 0.0% 0.0% 0.1% -0.3% 0.1% -0.1% 0.0% 0.1% 0.0% 0.0% -0.1% -0.2% 0.0% 0.1% 0.1% -0.1% 0.1% 0.0% 0.0% -0.3% 0.0% 0.0%
Total 0.4% 0.0% 0.1% -0.5% 0.6% -1.3% 0.1% 0.4% -0.5% -0.2% -0.8% -0.2% 0.0% 0.2% 0.2% -0.1% 0.1% -0.1% 0.3% 0.3% 0.0% 0.4%

Final Report
5079478/Callington Link Options Assessment v2.doc 77
Table A.30 – Difference between Option D2 Evening Peak Sectored All Travel and Do-Minimum
1 2 3 4 5 6 7 8 9 10 11 12 13 14 15 16 17 18 19 20 21 Total
1 0.3% 0.0% 0.0% -0.8% 0.3% -1.7% 0.1% 0.0% -0.8% 0.0% -0.7% 0.1% 0.0% 0.5% 0.7% 0.0% 0.4% 0.4% 0.4% 0.7% -0.2% 0.3%
2 0.1% 0.1% 0.2% -0.9% 0.4% -1.1% 1.0% -0.2% -0.8% -0.2% -1.5% -0.7% -0.2% -0.4% -0.2% -0.4% -0.6% -0.2% 0.0% 0.2% 0.0% 0.1%
3 0.8% 0.4% 0.3% -2.8% 0.1% -0.4% 0.1% -0.8% -2.0% 0.4% -2.5% -2.5% 0.4% 2.8% 1.0% 0.5% 1.9% 1.4% 0.3% -0.2% -0.1% 0.8%
4 -0.1% -0.7% -0.3% 0.1% -1.2% 5.6% -1.7% 3.4% 4.6% -0.6% 0.4% 1.4% -0.3% -0.1% 0.1% 0.1% -0.1% 0.0% 0.2% 2.0% 0.3% -0.1%
5 0.2% 0.4% 0.2% -2.6% 0.2% -0.7% 0.0% -0.2% -0.1% 0.5% -1.2% -2.2% 0.2% 0.3% 0.2% 0.2% 0.1% 0.3% -0.1% 0.3% 0.0% 0.2%
6 -0.6% -0.3% 0.0% 1.3% -0.3% 0.3% -0.6% -0.5% -0.4% -0.2% 0.4% -0.5% -0.6% 0.8% 1.2% 1.2% 0.9% 0.2% -0.1% -0.6% 0.1% -0.6%
7 0.6% 0.1% 0.4% -2.8% 0.1% -0.1% 0.2% 0.1% -0.6% 0.1% -0.9% -1.0% -0.1% 0.2% 0.1% -0.2% 0.3% 0.0% 0.1% -0.1% 0.0% 0.6%
8 0.5% -0.1% 0.2% 0.3% -0.4% 0.0% 0.1% 0.2% -0.6% 0.1% -0.8% -0.9% -0.3% -0.1% -0.1% 0.2% 0.0% -0.2% 0.0% -0.4% 0.0% 0.5%
9 -0.2% -0.6% -1.2% 2.0% -0.5% 0.0% -0.4% -0.1% -0.4% 0.6% 0.3% -0.4% 0.3% 0.0% 2.4% 0.8% 0.2% 0.1% -0.2% -1.5% 0.1% -0.2%
10 0.2% 0.2% 0.3% -1.1% 0.2% -0.2% 0.2% 0.1% -0.1% 0.1% 0.0% -0.4% -0.1% 0.1% 0.1% -0.2% 0.2% 0.2% 0.1% -0.4% 0.1% 0.2%
11 0.4% -0.9% -1.4% 0.8% -0.2% 0.4% -0.6% -0.8% 0.5% 0.9% 0.9% 0.6% 0.4% -0.4% 1.0% 0.0% -0.3% 0.2% -0.1% -0.9% 0.2% 0.4%
12 0.7% -0.9% -1.1% 0.2% -0.9% 0.0% -1.0% -0.3% -0.2% 0.0% 0.6% -0.3% 0.4% 0.4% 0.9% 0.6% 0.3% 0.0% -0.3% -1.2% 0.0% 0.7%
13 0.0% 0.0% 0.9% -0.1% 0.0% 0.1% -0.1% -0.1% 0.3% -0.3% 0.2% -0.1% 0.0% -0.1% -0.2% 0.0% -0.1% 0.0% 0.0% -0.7% 0.0% 0.0%
14 -0.1% 0.0% 1.0% 0.0% 0.1% -0.2% 0.0% -0.1% 0.1% -0.1% 0.1% 0.3% -0.2% 0.1% -0.1% 0.4% 0.0% 0.0% 0.1% -0.6% 0.0% -0.1%
15 0.0% -0.2% 0.2% 0.0% 0.0% -0.1% 0.0% 0.1% 3.2% 0.1% 0.6% 0.3% -0.2% 0.1% -0.1% 0.0% 0.0% 0.0% 0.1% -0.5% 0.0% 0.0%
16 -0.1% -0.2% 0.7% -0.1% -0.1% 1.6% -0.1% 0.1% 0.7% -0.1% 0.3% 0.5% -0.3% -0.1% 0.2% -0.1% -0.1% -0.2% 0.0% -0.9% 0.1% -0.1%
17 0.0% 0.0% 0.9% -0.1% 0.0% 0.3% -0.1% -0.2% 0.2% 0.0% -0.1% 0.1% -0.1% 0.1% 0.1% 0.1% 0.0% 0.0% 0.1% -0.6% 0.0% 0.0%
18 0.1% -0.1% 0.5% -0.4% 0.2% 0.5% -0.1% -0.2% 0.3% 0.0% 0.4% -0.2% 0.0% 0.1% 0.0% 0.2% 0.1% -0.1% 0.1% -0.6% 0.0% 0.1%
19 0.3% 0.0% 0.4% -1.0% 0.1% 0.0% 0.1% 0.2% -0.4% 0.2% 0.0% -0.8% 0.0% 0.2% 0.1% 0.2% 0.2% 0.0% 0.0% -0.4% 0.0% 0.3%
20 1.0% 0.3% 0.0% 2.9% 0.2% 0.0% -0.5% 0.1% 3.4% -0.7% 4.8% 1.5% -0.9% -0.5% -1.1% -0.4% -0.7% -0.5% 0.0% 0.4% 0.2% 1.0%
21 0.2% 0.1% 0.1% -0.3% 0.1% 0.1% 0.1% 0.0% 0.2% 0.0% -0.1% 0.1% 0.0% 0.1% 0.1% 0.1% 0.1% 0.1% 0.0% 0.1% 0.0% 0.2%
Total 0.3% 0.0% 0.0% -0.8% 0.3% -1.7% 0.1% 0.0% -0.8% 0.0% -0.7% 0.1% 0.0% 0.5% 0.7% 0.0% 0.4% 0.4% 0.4% 0.7% -0.2% 0.3%

Final Report
5079478/Callington Link Options Assessment v2.doc 78
Table A.31 – Difference between Option E Morning Peak Sectored Highway and Do-Minimum
1 2 3 4 5 6 7 8 9 10 11 12 13 14 15 16 17 18 19 20 21 Total
1 -2.2% 0.1% 0.5% 0.4% 0.3% 0.3% 0.4% 0.9% 0.1% 0.4% -0.6% 0.8% 0.2% -0.7% -1.4% 0.0% -0.5% -0.6% 0.2% 0.3% -0.3% -2.2%
2 -0.2% 0.0% -0.2% -0.1% 0.1% 0.1% -0.2% -0.1% -1.4% 0.2% -1.2% -1.5% -0.1% -0.3% -0.7% -0.7% -0.2% -0.4% -0.1% 0.3% -0.1% -0.2%
3 -0.2% 0.0% 0.1% -1.4% 0.2% 0.1% 0.3% 0.4% -0.5% -0.1% -1.3% -1.5% -0.5% -1.3% -1.7% -0.8% -1.3% -1.0% 0.2% 0.2% -0.1% -0.2%
4 -1.1% -0.4% -0.5% 0.0% -0.8% -1.0% -0.7% -0.9% -0.5% -0.5% -0.5% -0.2% -0.2% 0.3% 0.1% -0.2% 0.1% 0.0% 0.4% -1.5% -0.3% -1.1%
5 -0.3% 0.2% 0.0% -1.3% 0.0% 0.0% -0.1% 0.0% -0.1% 0.2% -0.6% -0.2% 0.0% -0.3% -0.3% -1.0% 0.0% -0.2% 0.0% 0.2% 0.0% -0.3%
6 -0.5% -0.3% -0.1% -1.5% 0.0% 0.0% 0.1% 0.4% 0.1% 0.1% 0.5% 0.3% 0.1% -0.1% 0.4% -0.5% 0.0% 0.0% 0.1% 0.3% 0.0% -0.5%
7 -0.3% 0.5% 0.1% -0.9% -0.2% -0.1% 0.2% -0.1% 0.3% 0.0% -0.8% -0.2% 0.0% -0.2% -0.2% -0.4% 0.1% -0.2% 0.1% -0.4% 0.0% -0.3%
8 -0.1% 0.1% -0.1% -1.9% -0.1% 0.1% 0.0% 0.0% 0.3% 0.0% 0.2% 0.1% 0.0% -0.3% -0.3% -0.8% -0.1% -0.2% 0.1% -0.3% 0.0% -0.1%
9 1.9% -1.7% -0.9% -1.5% -0.4% -0.2% 0.0% -0.2% -0.3% -0.1% -0.5% -0.2% -0.1% -0.1% 0.5% -0.3% -0.1% -0.2% -0.1% -0.7% -0.3% 1.9%
10 0.0% -0.1% -0.2% -0.4% 0.2% 0.0% 0.1% -0.2% 0.2% 0.1% 0.7% 0.0% 0.2% -0.2% -0.2% -0.3% 0.3% 0.0% 0.1% -0.2% 0.0% 0.0%
11 -1.0% -0.7% 0.1% 0.6% -1.1% -0.1% -0.8% -0.4% -0.4% -0.4% 0.2% -0.3% -0.1% 0.0% 1.1% -0.1% -0.2% -0.2% -0.3% -1.1% -0.1% -1.0%
12 0.3% -0.9% -0.2% 0.0% -0.7% 0.0% 0.0% 0.1% 0.3% -0.7% -0.1% 0.2% 0.2% 0.3% 0.4% -0.1% 0.3% 0.1% -0.1% -1.0% 0.0% 0.3%
13 -1.1% -0.5% -0.7% 0.2% -0.3% -0.1% -0.3% -0.5% 0.4% -0.2% 0.3% 0.5% 0.0% -0.4% -0.6% 0.3% 0.2% 0.1% -0.2% -0.4% -0.1% -1.1%
14 -0.9% -0.3% -1.0% 0.4% -0.2% -0.1% -0.4% -0.6% 0.6% -0.3% 1.1% 0.7% -0.1% 0.1% -0.2% 0.7% 0.8% 0.3% -0.1% -0.5% -0.1% -0.9%
15 0.0% 0.5% -1.2% -0.1% -1.3% 0.2% -1.0% -1.3% -0.1% -1.2% 2.3% 0.6% -0.4% -0.7% -0.1% 1.3% 0.7% 0.1% -0.3% -1.4% -0.3% 0.0%
16 -1.7% -1.2% -1.1% 0.3% -1.2% -1.3% -1.1% -1.0% 0.6% -0.8% 1.3% 0.4% 0.7% 0.8% 0.2% 0.4% 0.9% 0.7% 0.0% -0.7% -0.3% -1.7%
17 -1.0% -0.8% -2.7% -0.1% 0.0% -1.2% 0.0% -0.3% 0.2% 0.1% 0.6% 0.3% 0.2% 0.0% 0.2% 0.3% 0.0% 0.1% 0.2% -0.2% -0.2% -1.0%
18 -1.1% -0.3% -1.3% 0.3% -0.2% -0.4% -0.4% -0.5% 0.1% -0.3% 0.2% 0.1% 0.0% 0.1% -0.1% 0.4% 0.3% 0.1% 0.0% -0.3% -0.1% -1.1%
19 -0.1% 0.0% 0.0% -0.4% 0.0% 0.0% 0.0% -0.1% 0.2% 0.0% 0.3% 0.1% 0.1% -0.1% -0.3% 0.1% 0.2% 0.0% 0.0% -0.1% 0.0% -0.1%
20 0.5% 0.3% -0.3% -3.5% 0.1% 0.0% -0.2% -0.1% -0.1% -0.2% -0.2% -0.2% -0.1% -0.3% -0.2% -1.2% -0.1% -0.1% 0.0% 0.0% 0.5%
21 -0.8% 0.0% 0.0% -0.2% 0.0% 0.0% 0.0% 0.0% -0.1% 0.0% -0.1% -0.1% 0.0% -0.2% -0.3% -0.1% 0.1% 0.0% 0.0% 0.0% -0.1% -0.8%
Total -2.2% 0.1% 0.5% 0.4% 0.3% 0.3% 0.4% 0.9% 0.1% 0.4% -0.6% 0.8% 0.2% -0.7% -1.4% 0.0% -0.5% -0.6% 0.2% 0.3% -0.3% -2.2%
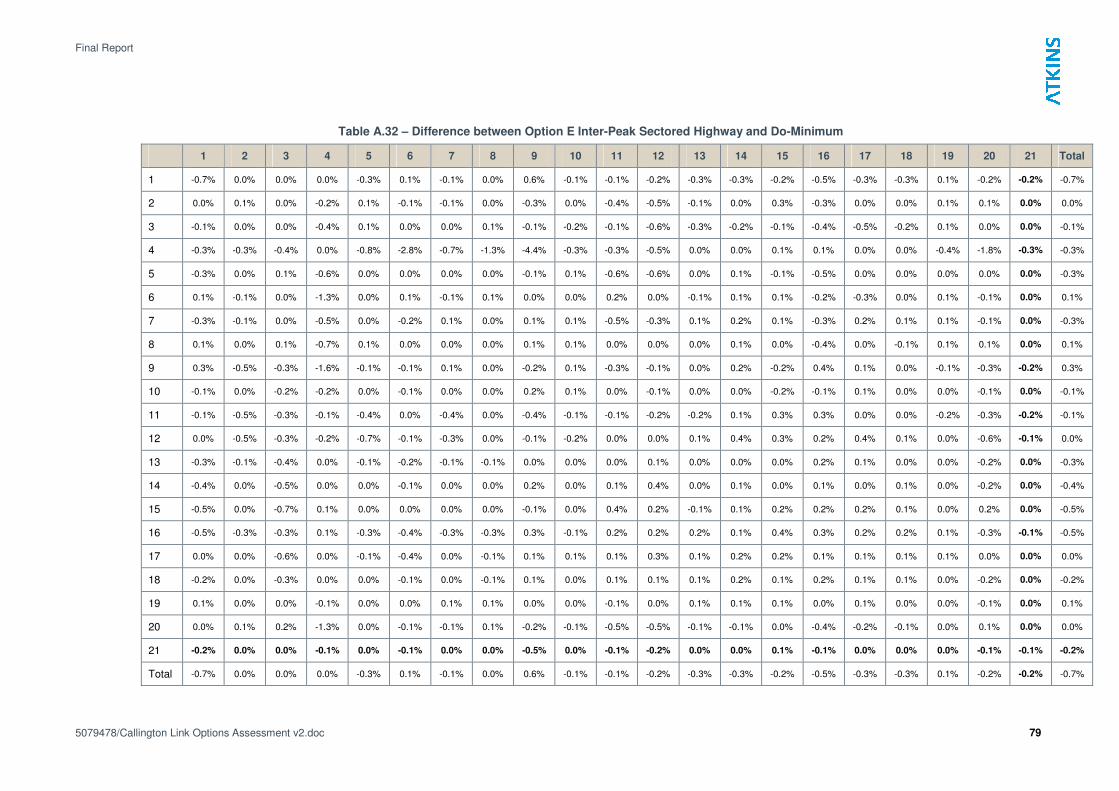
Final Report
5079478/Callington Link Options Assessment v2.doc 79
Table A.32 – Difference between Option E Inter-Peak Sectored Highway and Do-Minimum
1 2 3 4 5 6 7 8 9 10 11 12 13 14 15 16 17 18 19 20 21 Total
1 -0.7% 0.0% 0.0% 0.0% -0.3% 0.1% -0.1% 0.0% 0.6% -0.1% -0.1% -0.2% -0.3% -0.3% -0.2% -0.5% -0.3% -0.3% 0.1% -0.2% -0.2% -0.7%
2 0.0% 0.1% 0.0% -0.2% 0.1% -0.1% -0.1% 0.0% -0.3% 0.0% -0.4% -0.5% -0.1% 0.0% 0.3% -0.3% 0.0% 0.0% 0.1% 0.1% 0.0% 0.0%
3 -0.1% 0.0% 0.0% -0.4% 0.1% 0.0% 0.0% 0.1% -0.1% -0.2% -0.1% -0.6% -0.3% -0.2% -0.1% -0.4% -0.5% -0.2% 0.1% 0.0% 0.0% -0.1%
4 -0.3% -0.3% -0.4% 0.0% -0.8% -2.8% -0.7% -1.3% -4.4% -0.3% -0.3% -0.5% 0.0% 0.0% 0.1% 0.1% 0.0% 0.0% -0.4% -1.8% -0.3% -0.3%
5 -0.3% 0.0% 0.1% -0.6% 0.0% 0.0% 0.0% 0.0% -0.1% 0.1% -0.6% -0.6% 0.0% 0.1% -0.1% -0.5% 0.0% 0.0% 0.0% 0.0% 0.0% -0.3%
6 0.1% -0.1% 0.0% -1.3% 0.0% 0.1% -0.1% 0.1% 0.0% 0.0% 0.2% 0.0% -0.1% 0.1% 0.1% -0.2% -0.3% 0.0% 0.1% -0.1% 0.0% 0.1%
7 -0.3% -0.1% 0.0% -0.5% 0.0% -0.2% 0.1% 0.0% 0.1% 0.1% -0.5% -0.3% 0.1% 0.2% 0.1% -0.3% 0.2% 0.1% 0.1% -0.1% 0.0% -0.3%
8 0.1% 0.0% 0.1% -0.7% 0.1% 0.0% 0.0% 0.0% 0.1% 0.1% 0.0% 0.0% 0.0% 0.1% 0.0% -0.4% 0.0% -0.1% 0.1% 0.1% 0.0% 0.1%
9 0.3% -0.5% -0.3% -1.6% -0.1% -0.1% 0.1% 0.0% -0.2% 0.1% -0.3% -0.1% 0.0% 0.2% -0.2% 0.4% 0.1% 0.0% -0.1% -0.3% -0.2% 0.3%
10 -0.1% 0.0% -0.2% -0.2% 0.0% -0.1% 0.0% 0.0% 0.2% 0.1% 0.0% -0.1% 0.0% 0.0% -0.2% -0.1% 0.1% 0.0% 0.0% -0.1% 0.0% -0.1%
11 -0.1% -0.5% -0.3% -0.1% -0.4% 0.0% -0.4% 0.0% -0.4% -0.1% -0.1% -0.2% -0.2% 0.1% 0.3% 0.3% 0.0% 0.0% -0.2% -0.3% -0.2% -0.1%
12 0.0% -0.5% -0.3% -0.2% -0.7% -0.1% -0.3% 0.0% -0.1% -0.2% 0.0% 0.0% 0.1% 0.4% 0.3% 0.2% 0.4% 0.1% 0.0% -0.6% -0.1% 0.0%
13 -0.3% -0.1% -0.4% 0.0% -0.1% -0.2% -0.1% -0.1% 0.0% 0.0% 0.0% 0.1% 0.0% 0.0% 0.0% 0.2% 0.1% 0.0% 0.0% -0.2% 0.0% -0.3%
14 -0.4% 0.0% -0.5% 0.0% 0.0% -0.1% 0.0% 0.0% 0.2% 0.0% 0.1% 0.4% 0.0% 0.1% 0.0% 0.1% 0.0% 0.1% 0.0% -0.2% 0.0% -0.4%
15 -0.5% 0.0% -0.7% 0.1% 0.0% 0.0% 0.0% 0.0% -0.1% 0.0% 0.4% 0.2% -0.1% 0.1% 0.2% 0.2% 0.2% 0.1% 0.0% 0.2% 0.0% -0.5%
16 -0.5% -0.3% -0.3% 0.1% -0.3% -0.4% -0.3% -0.3% 0.3% -0.1% 0.2% 0.2% 0.2% 0.1% 0.4% 0.3% 0.2% 0.2% 0.1% -0.3% -0.1% -0.5%
17 0.0% 0.0% -0.6% 0.0% -0.1% -0.4% 0.0% -0.1% 0.1% 0.1% 0.1% 0.3% 0.1% 0.2% 0.2% 0.1% 0.1% 0.1% 0.1% 0.0% 0.0% 0.0%
18 -0.2% 0.0% -0.3% 0.0% 0.0% -0.1% 0.0% -0.1% 0.1% 0.0% 0.1% 0.1% 0.1% 0.2% 0.1% 0.2% 0.1% 0.1% 0.0% -0.2% 0.0% -0.2%
19 0.1% 0.0% 0.0% -0.1% 0.0% 0.0% 0.1% 0.1% 0.0% 0.0% -0.1% 0.0% 0.1% 0.1% 0.1% 0.0% 0.1% 0.0% 0.0% -0.1% 0.0% 0.1%
20 0.0% 0.1% 0.2% -1.3% 0.0% -0.1% -0.1% 0.1% -0.2% -0.1% -0.5% -0.5% -0.1% -0.1% 0.0% -0.4% -0.2% -0.1% 0.0% 0.1% 0.0% 0.0%
21 -0.2% 0.0% 0.0% -0.1% 0.0% -0.1% 0.0% 0.0% -0.5% 0.0% -0.1% -0.2% 0.0% 0.0% 0.1% -0.1% 0.0% 0.0% 0.0% -0.1% -0.1% -0.2%
Total -0.7% 0.0% 0.0% 0.0% -0.3% 0.1% -0.1% 0.0% 0.6% -0.1% -0.1% -0.2% -0.3% -0.3% -0.2% -0.5% -0.3% -0.3% 0.1% -0.2% -0.2% -0.7%
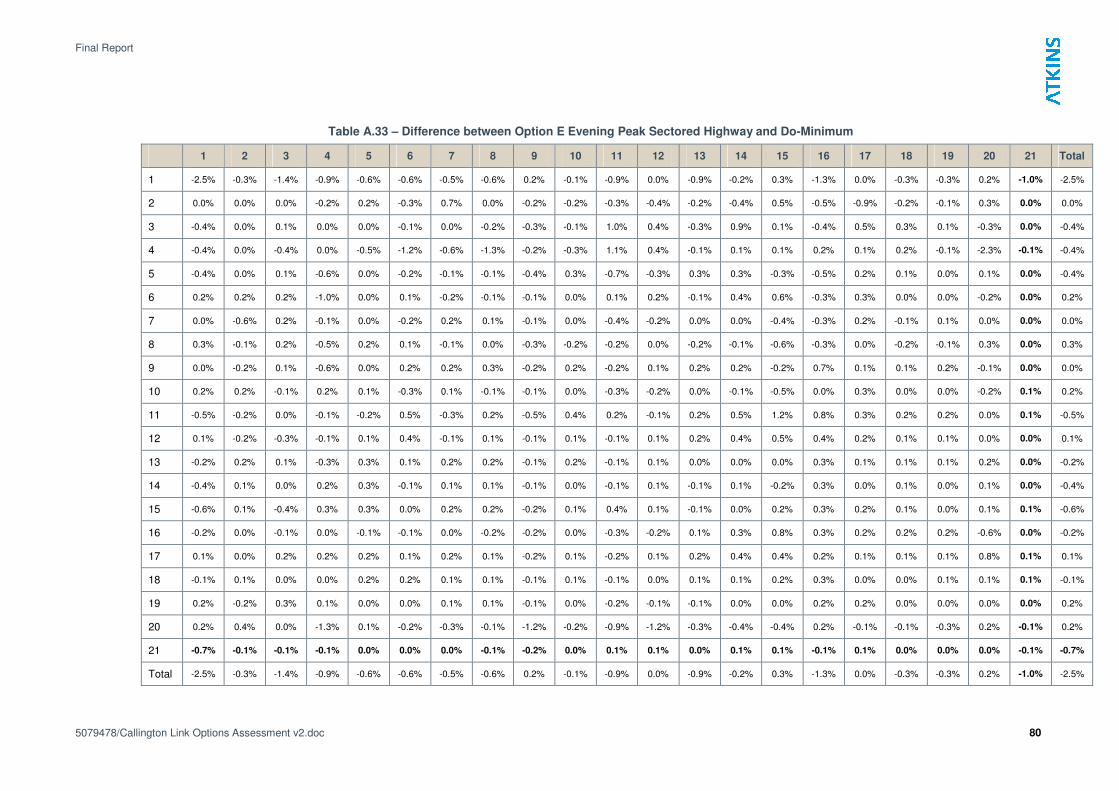
Final Report
5079478/Callington Link Options Assessment v2.doc 80
Table A.33 – Difference between Option E Evening Peak Sectored Highway and Do-Minimum
1 2 3 4 5 6 7 8 9 10 11 12 13 14 15 16 17 18 19 20 21 Total
1 -2.5% -0.3% -1.4% -0.9% -0.6% -0.6% -0.5% -0.6% 0.2% -0.1% -0.9% 0.0% -0.9% -0.2% 0.3% -1.3% 0.0% -0.3% -0.3% 0.2% -1.0% -2.5%
2 0.0% 0.0% 0.0% -0.2% 0.2% -0.3% 0.7% 0.0% -0.2% -0.2% -0.3% -0.4% -0.2% -0.4% 0.5% -0.5% -0.9% -0.2% -0.1% 0.3% 0.0% 0.0%
3 -0.4% 0.0% 0.1% 0.0% 0.0% -0.1% 0.0% -0.2% -0.3% -0.1% 1.0% 0.4% -0.3% 0.9% 0.1% -0.4% 0.5% 0.3% 0.1% -0.3% 0.0% -0.4%
4 -0.4% 0.0% -0.4% 0.0% -0.5% -1.2% -0.6% -1.3% -0.2% -0.3% 1.1% 0.4% -0.1% 0.1% 0.1% 0.2% 0.1% 0.2% -0.1% -2.3% -0.1% -0.4%
5 -0.4% 0.0% 0.1% -0.6% 0.0% -0.2% -0.1% -0.1% -0.4% 0.3% -0.7% -0.3% 0.3% 0.3% -0.3% -0.5% 0.2% 0.1% 0.0% 0.1% 0.0% -0.4%
6 0.2% 0.2% 0.2% -1.0% 0.0% 0.1% -0.2% -0.1% -0.1% 0.0% 0.1% 0.2% -0.1% 0.4% 0.6% -0.3% 0.3% 0.0% 0.0% -0.2% 0.0% 0.2%
7 0.0% -0.6% 0.2% -0.1% 0.0% -0.2% 0.2% 0.1% -0.1% 0.0% -0.4% -0.2% 0.0% 0.0% -0.4% -0.3% 0.2% -0.1% 0.1% 0.0% 0.0% 0.0%
8 0.3% -0.1% 0.2% -0.5% 0.2% 0.1% -0.1% 0.0% -0.3% -0.2% -0.2% 0.0% -0.2% -0.1% -0.6% -0.3% 0.0% -0.2% -0.1% 0.3% 0.0% 0.3%
9 0.0% -0.2% 0.1% -0.6% 0.0% 0.2% 0.2% 0.3% -0.2% 0.2% -0.2% 0.1% 0.2% 0.2% -0.2% 0.7% 0.1% 0.1% 0.2% -0.1% 0.0% 0.0%
10 0.2% 0.2% -0.1% 0.2% 0.1% -0.3% 0.1% -0.1% -0.1% 0.0% -0.3% -0.2% 0.0% -0.1% -0.5% 0.0% 0.3% 0.0% 0.0% -0.2% 0.1% 0.2%
11 -0.5% -0.2% 0.0% -0.1% -0.2% 0.5% -0.3% 0.2% -0.5% 0.4% 0.2% -0.1% 0.2% 0.5% 1.2% 0.8% 0.3% 0.2% 0.2% 0.0% 0.1% -0.5%
12 0.1% -0.2% -0.3% -0.1% 0.1% 0.4% -0.1% 0.1% -0.1% 0.1% -0.1% 0.1% 0.2% 0.4% 0.5% 0.4% 0.2% 0.1% 0.1% 0.0% 0.0% 0.1%
13 -0.2% 0.2% 0.1% -0.3% 0.3% 0.1% 0.2% 0.2% -0.1% 0.2% -0.1% 0.1% 0.0% 0.0% 0.0% 0.3% 0.1% 0.1% 0.1% 0.2% 0.0% -0.2%
14 -0.4% 0.1% 0.0% 0.2% 0.3% -0.1% 0.1% 0.1% -0.1% 0.0% -0.1% 0.1% -0.1% 0.1% -0.2% 0.3% 0.0% 0.1% 0.0% 0.1% 0.0% -0.4%
15 -0.6% 0.1% -0.4% 0.3% 0.3% 0.0% 0.2% 0.2% -0.2% 0.1% 0.4% 0.1% -0.1% 0.0% 0.2% 0.3% 0.2% 0.1% 0.0% 0.1% 0.1% -0.6%
16 -0.2% 0.0% -0.1% 0.0% -0.1% -0.1% 0.0% -0.2% -0.2% 0.0% -0.3% -0.2% 0.1% 0.3% 0.8% 0.3% 0.2% 0.2% 0.2% -0.6% 0.0% -0.2%
17 0.1% 0.0% 0.2% 0.2% 0.2% 0.1% 0.2% 0.1% -0.2% 0.1% -0.2% 0.1% 0.2% 0.4% 0.4% 0.2% 0.1% 0.1% 0.1% 0.8% 0.1% 0.1%
18 -0.1% 0.1% 0.0% 0.0% 0.2% 0.2% 0.1% 0.1% -0.1% 0.1% -0.1% 0.0% 0.1% 0.1% 0.2% 0.3% 0.0% 0.0% 0.1% 0.1% 0.1% -0.1%
19 0.2% -0.2% 0.3% 0.1% 0.0% 0.0% 0.1% 0.1% -0.1% 0.0% -0.2% -0.1% -0.1% 0.0% 0.0% 0.2% 0.2% 0.0% 0.0% 0.0% 0.0% 0.2%
20 0.2% 0.4% 0.0% -1.3% 0.1% -0.2% -0.3% -0.1% -1.2% -0.2% -0.9% -1.2% -0.3% -0.4% -0.4% 0.2% -0.1% -0.1% -0.3% 0.2% -0.1% 0.2%
21 -0.7% -0.1% -0.1% -0.1% 0.0% 0.0% 0.0% -0.1% -0.2% 0.0% 0.1% 0.1% 0.0% 0.1% 0.1% -0.1% 0.1% 0.0% 0.0% 0.0% -0.1% -0.7%
Total -2.5% -0.3% -1.4% -0.9% -0.6% -0.6% -0.5% -0.6% 0.2% -0.1% -0.9% 0.0% -0.9% -0.2% 0.3% -1.3% 0.0% -0.3% -0.3% 0.2% -1.0% -2.5%
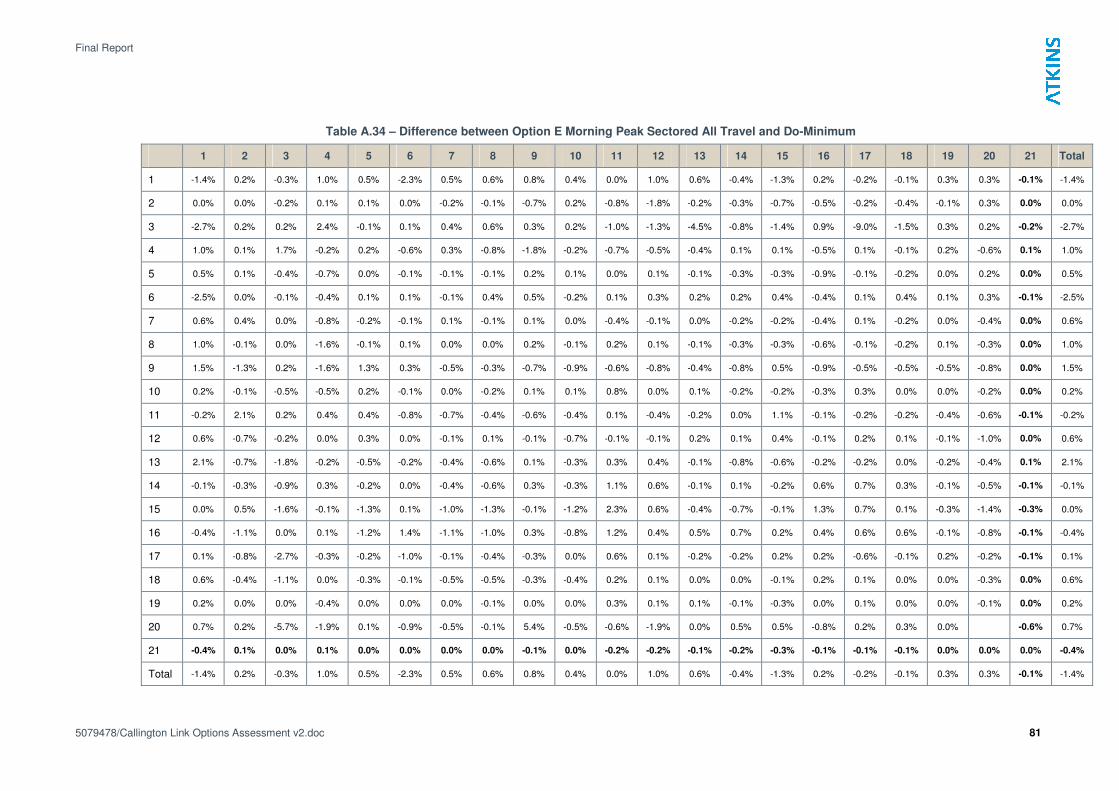
Final Report
5079478/Callington Link Options Assessment v2.doc 81
Table A.34 – Difference between Option E Morning Peak Sectored All Travel and Do-Minimum
1 2 3 4 5 6 7 8 9 10 11 12 13 14 15 16 17 18 19 20 21 Total
1 -1.4% 0.2% -0.3% 1.0% 0.5% -2.3% 0.5% 0.6% 0.8% 0.4% 0.0% 1.0% 0.6% -0.4% -1.3% 0.2% -0.2% -0.1% 0.3% 0.3% -0.1% -1.4%
2 0.0% 0.0% -0.2% 0.1% 0.1% 0.0% -0.2% -0.1% -0.7% 0.2% -0.8% -1.8% -0.2% -0.3% -0.7% -0.5% -0.2% -0.4% -0.1% 0.3% 0.0% 0.0%
3 -2.7% 0.2% 0.2% 2.4% -0.1% 0.1% 0.4% 0.6% 0.3% 0.2% -1.0% -1.3% -4.5% -0.8% -1.4% 0.9% -9.0% -1.5% 0.3% 0.2% -0.2% -2.7%
4 1.0% 0.1% 1.7% -0.2% 0.2% -0.6% 0.3% -0.8% -1.8% -0.2% -0.7% -0.5% -0.4% 0.1% 0.1% -0.5% 0.1% -0.1% 0.2% -0.6% 0.1% 1.0%
5 0.5% 0.1% -0.4% -0.7% 0.0% -0.1% -0.1% -0.1% 0.2% 0.1% 0.0% 0.1% -0.1% -0.3% -0.3% -0.9% -0.1% -0.2% 0.0% 0.2% 0.0% 0.5%
6 -2.5% 0.0% -0.1% -0.4% 0.1% 0.1% -0.1% 0.4% 0.5% -0.2% 0.1% 0.3% 0.2% 0.2% 0.4% -0.4% 0.1% 0.4% 0.1% 0.3% -0.1% -2.5%
7 0.6% 0.4% 0.0% -0.8% -0.2% -0.1% 0.1% -0.1% 0.1% 0.0% -0.4% -0.1% 0.0% -0.2% -0.2% -0.4% 0.1% -0.2% 0.0% -0.4% 0.0% 0.6%
8 1.0% -0.1% 0.0% -1.6% -0.1% 0.1% 0.0% 0.0% 0.2% -0.1% 0.2% 0.1% -0.1% -0.3% -0.3% -0.6% -0.1% -0.2% 0.1% -0.3% 0.0% 1.0%
9 1.5% -1.3% 0.2% -1.6% 1.3% 0.3% -0.5% -0.3% -0.7% -0.9% -0.6% -0.8% -0.4% -0.8% 0.5% -0.9% -0.5% -0.5% -0.5% -0.8% 0.0% 1.5%
10 0.2% -0.1% -0.5% -0.5% 0.2% -0.1% 0.0% -0.2% 0.1% 0.1% 0.8% 0.0% 0.1% -0.2% -0.2% -0.3% 0.3% 0.0% 0.0% -0.2% 0.0% 0.2%
11 -0.2% 2.1% 0.2% 0.4% 0.4% -0.8% -0.7% -0.4% -0.6% -0.4% 0.1% -0.4% -0.2% 0.0% 1.1% -0.1% -0.2% -0.2% -0.4% -0.6% -0.1% -0.2%
12 0.6% -0.7% -0.2% 0.0% 0.3% 0.0% -0.1% 0.1% -0.1% -0.7% -0.1% -0.1% 0.2% 0.1% 0.4% -0.1% 0.2% 0.1% -0.1% -1.0% 0.0% 0.6%
13 2.1% -0.7% -1.8% -0.2% -0.5% -0.2% -0.4% -0.6% 0.1% -0.3% 0.3% 0.4% -0.1% -0.8% -0.6% -0.2% -0.2% 0.0% -0.2% -0.4% 0.1% 2.1%
14 -0.1% -0.3% -0.9% 0.3% -0.2% 0.0% -0.4% -0.6% 0.3% -0.3% 1.1% 0.6% -0.1% 0.1% -0.2% 0.6% 0.7% 0.3% -0.1% -0.5% -0.1% -0.1%
15 0.0% 0.5% -1.6% -0.1% -1.3% 0.1% -1.0% -1.3% -0.1% -1.2% 2.3% 0.6% -0.4% -0.7% -0.1% 1.3% 0.7% 0.1% -0.3% -1.4% -0.3% 0.0%
16 -0.4% -1.1% 0.0% 0.1% -1.2% 1.4% -1.1% -1.0% 0.3% -0.8% 1.2% 0.4% 0.5% 0.7% 0.2% 0.4% 0.6% 0.6% -0.1% -0.8% -0.1% -0.4%
17 0.1% -0.8% -2.7% -0.3% -0.2% -1.0% -0.1% -0.4% -0.3% 0.0% 0.6% 0.1% -0.2% -0.2% 0.2% 0.2% -0.6% -0.1% 0.2% -0.2% -0.1% 0.1%
18 0.6% -0.4% -1.1% 0.0% -0.3% -0.1% -0.5% -0.5% -0.3% -0.4% 0.2% 0.1% 0.0% 0.0% -0.1% 0.2% 0.1% 0.0% 0.0% -0.3% 0.0% 0.6%
19 0.2% 0.0% 0.0% -0.4% 0.0% 0.0% 0.0% -0.1% 0.0% 0.0% 0.3% 0.1% 0.1% -0.1% -0.3% 0.0% 0.1% 0.0% 0.0% -0.1% 0.0% 0.2%
20 0.7% 0.2% -5.7% -1.9% 0.1% -0.9% -0.5% -0.1% 5.4% -0.5% -0.6% -1.9% 0.0% 0.5% 0.5% -0.8% 0.2% 0.3% 0.0% -0.6% 0.7%
21 -0.4% 0.1% 0.0% 0.1% 0.0% 0.0% 0.0% 0.0% -0.1% 0.0% -0.2% -0.2% -0.1% -0.2% -0.3% -0.1% -0.1% -0.1% 0.0% 0.0% 0.0% -0.4%
Total -1.4% 0.2% -0.3% 1.0% 0.5% -2.3% 0.5% 0.6% 0.8% 0.4% 0.0% 1.0% 0.6% -0.4% -1.3% 0.2% -0.2% -0.1% 0.3% 0.3% -0.1% -1.4%
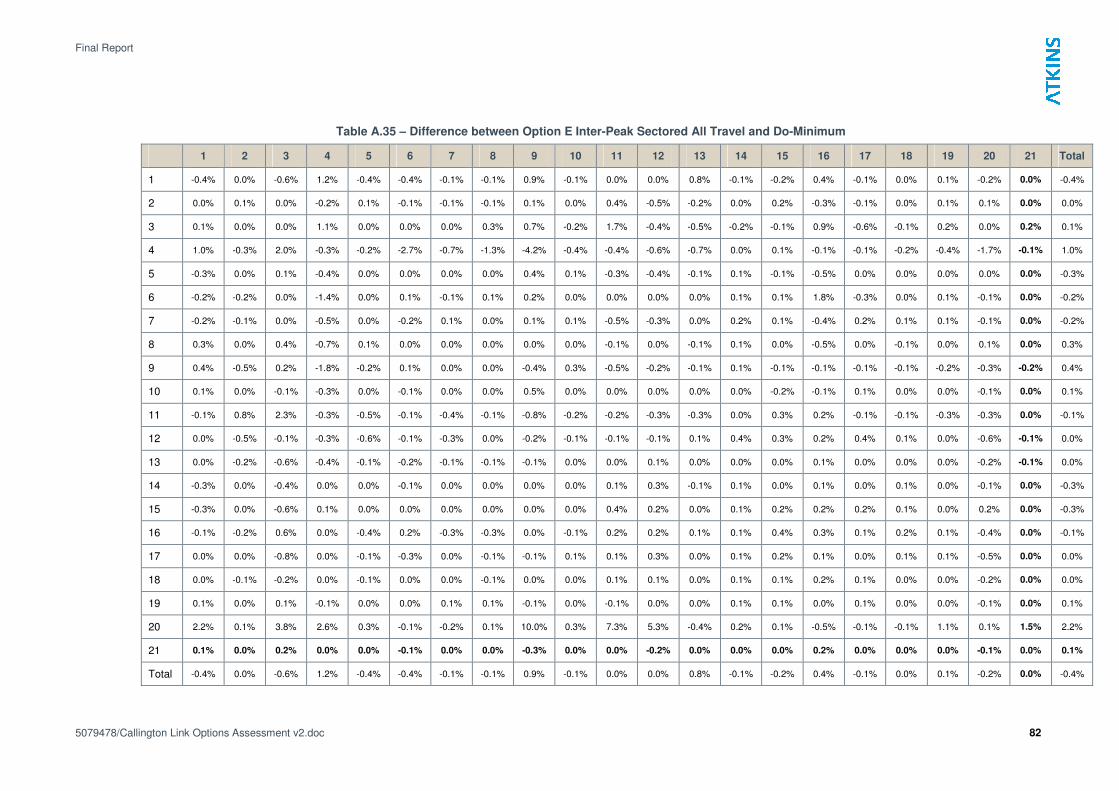
Final Report
5079478/Callington Link Options Assessment v2.doc 82
Table A.35 – Difference between Option E Inter-Peak Sectored All Travel and Do-Minimum
1 2 3 4 5 6 7 8 9 10 11 12 13 14 15 16 17 18 19 20 21 Total
1 -0.4% 0.0% -0.6% 1.2% -0.4% -0.4% -0.1% -0.1% 0.9% -0.1% 0.0% 0.0% 0.8% -0.1% -0.2% 0.4% -0.1% 0.0% 0.1% -0.2% 0.0% -0.4%
2 0.0% 0.1% 0.0% -0.2% 0.1% -0.1% -0.1% -0.1% 0.1% 0.0% 0.4% -0.5% -0.2% 0.0% 0.2% -0.3% -0.1% 0.0% 0.1% 0.1% 0.0% 0.0%
3 0.1% 0.0% 0.0% 1.1% 0.0% 0.0% 0.0% 0.3% 0.7% -0.2% 1.7% -0.4% -0.5% -0.2% -0.1% 0.9% -0.6% -0.1% 0.2% 0.0% 0.2% 0.1%
4 1.0% -0.3% 2.0% -0.3% -0.2% -2.7% -0.7% -1.3% -4.2% -0.4% -0.4% -0.6% -0.7% 0.0% 0.1% -0.1% -0.1% -0.2% -0.4% -1.7% -0.1% 1.0%
5 -0.3% 0.0% 0.1% -0.4% 0.0% 0.0% 0.0% 0.0% 0.4% 0.1% -0.3% -0.4% -0.1% 0.1% -0.1% -0.5% 0.0% 0.0% 0.0% 0.0% 0.0% -0.3%
6 -0.2% -0.2% 0.0% -1.4% 0.0% 0.1% -0.1% 0.1% 0.2% 0.0% 0.0% 0.0% 0.0% 0.1% 0.1% 1.8% -0.3% 0.0% 0.1% -0.1% 0.0% -0.2%
7 -0.2% -0.1% 0.0% -0.5% 0.0% -0.2% 0.1% 0.0% 0.1% 0.1% -0.5% -0.3% 0.0% 0.2% 0.1% -0.4% 0.2% 0.1% 0.1% -0.1% 0.0% -0.2%
8 0.3% 0.0% 0.4% -0.7% 0.1% 0.0% 0.0% 0.0% 0.0% 0.0% -0.1% 0.0% -0.1% 0.1% 0.0% -0.5% 0.0% -0.1% 0.0% 0.1% 0.0% 0.3%
9 0.4% -0.5% 0.2% -1.8% -0.2% 0.1% 0.0% 0.0% -0.4% 0.3% -0.5% -0.2% -0.1% 0.1% -0.1% -0.1% -0.1% -0.1% -0.2% -0.3% -0.2% 0.4%
10 0.1% 0.0% -0.1% -0.3% 0.0% -0.1% 0.0% 0.0% 0.5% 0.0% 0.0% 0.0% 0.0% 0.0% -0.2% -0.1% 0.1% 0.0% 0.0% -0.1% 0.0% 0.1%
11 -0.1% 0.8% 2.3% -0.3% -0.5% -0.1% -0.4% -0.1% -0.8% -0.2% -0.2% -0.3% -0.3% 0.0% 0.3% 0.2% -0.1% -0.1% -0.3% -0.3% 0.0% -0.1%
12 0.0% -0.5% -0.1% -0.3% -0.6% -0.1% -0.3% 0.0% -0.2% -0.1% -0.1% -0.1% 0.1% 0.4% 0.3% 0.2% 0.4% 0.1% 0.0% -0.6% -0.1% 0.0%
13 0.0% -0.2% -0.6% -0.4% -0.1% -0.2% -0.1% -0.1% -0.1% 0.0% 0.0% 0.1% 0.0% 0.0% 0.0% 0.1% 0.0% 0.0% 0.0% -0.2% -0.1% 0.0%
14 -0.3% 0.0% -0.4% 0.0% 0.0% -0.1% 0.0% 0.0% 0.0% 0.0% 0.1% 0.3% -0.1% 0.1% 0.0% 0.1% 0.0% 0.1% 0.0% -0.1% 0.0% -0.3%
15 -0.3% 0.0% -0.6% 0.1% 0.0% 0.0% 0.0% 0.0% 0.0% 0.0% 0.4% 0.2% 0.0% 0.1% 0.2% 0.2% 0.2% 0.1% 0.0% 0.2% 0.0% -0.3%
16 -0.1% -0.2% 0.6% 0.0% -0.4% 0.2% -0.3% -0.3% 0.0% -0.1% 0.2% 0.2% 0.1% 0.1% 0.4% 0.3% 0.1% 0.2% 0.1% -0.4% 0.0% -0.1%
17 0.0% 0.0% -0.8% 0.0% -0.1% -0.3% 0.0% -0.1% -0.1% 0.1% 0.1% 0.3% 0.0% 0.1% 0.2% 0.1% 0.0% 0.1% 0.1% -0.5% 0.0% 0.0%
18 0.0% -0.1% -0.2% 0.0% -0.1% 0.0% 0.0% -0.1% 0.0% 0.0% 0.1% 0.1% 0.0% 0.1% 0.1% 0.2% 0.1% 0.0% 0.0% -0.2% 0.0% 0.0%
19 0.1% 0.0% 0.1% -0.1% 0.0% 0.0% 0.1% 0.1% -0.1% 0.0% -0.1% 0.0% 0.0% 0.1% 0.1% 0.0% 0.1% 0.0% 0.0% -0.1% 0.0% 0.1%
20 2.2% 0.1% 3.8% 2.6% 0.3% -0.1% -0.2% 0.1% 10.0% 0.3% 7.3% 5.3% -0.4% 0.2% 0.1% -0.5% -0.1% -0.1% 1.1% 0.1% 1.5% 2.2%
21 0.1% 0.0% 0.2% 0.0% 0.0% -0.1% 0.0% 0.0% -0.3% 0.0% 0.0% -0.2% 0.0% 0.0% 0.0% 0.2% 0.0% 0.0% 0.0% -0.1% 0.0% 0.1%
Total -0.4% 0.0% -0.6% 1.2% -0.4% -0.4% -0.1% -0.1% 0.9% -0.1% 0.0% 0.0% 0.8% -0.1% -0.2% 0.4% -0.1% 0.0% 0.1% -0.2% 0.0% -0.4%
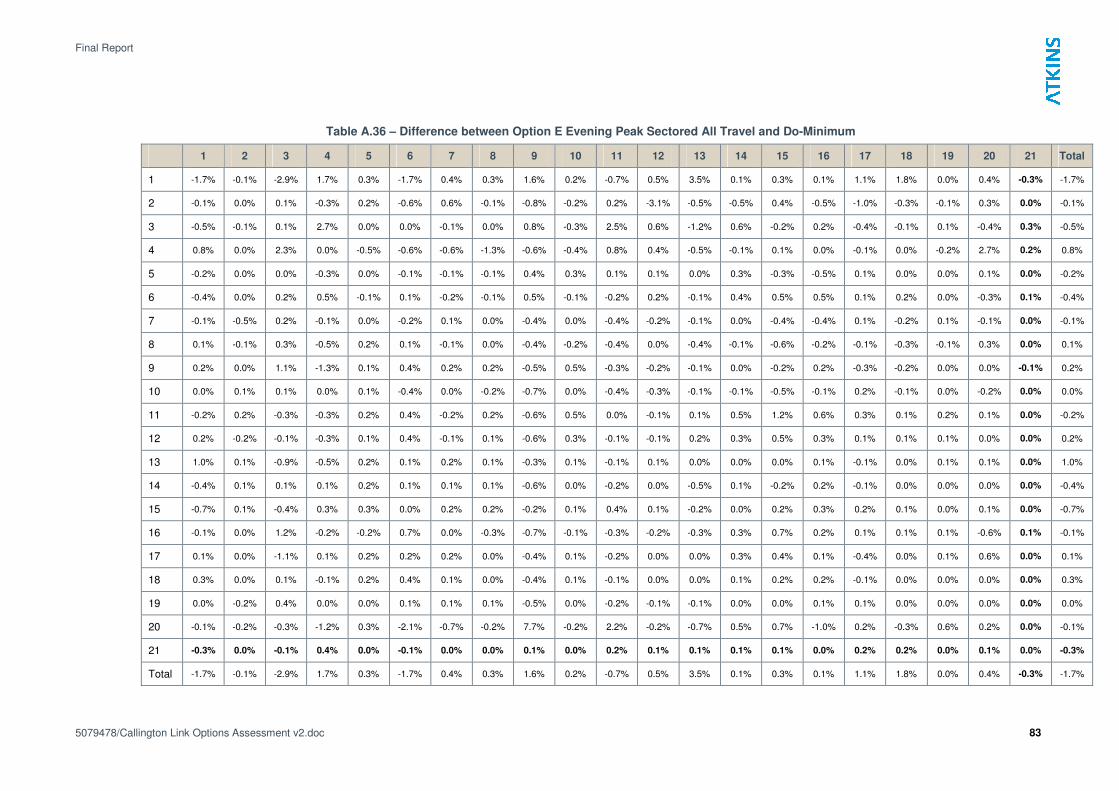
Final Report
5079478/Callington Link Options Assessment v2.doc 83
Table A.36 – Difference between Option E Evening Peak Sectored All Travel and Do-Minimum
1 2 3 4 5 6 7 8 9 10 11 12 13 14 15 16 17 18 19 20 21 Total
1 -1.7% -0.1% -2.9% 1.7% 0.3% -1.7% 0.4% 0.3% 1.6% 0.2% -0.7% 0.5% 3.5% 0.1% 0.3% 0.1% 1.1% 1.8% 0.0% 0.4% -0.3% -1.7%
2 -0.1% 0.0% 0.1% -0.3% 0.2% -0.6% 0.6% -0.1% -0.8% -0.2% 0.2% -3.1% -0.5% -0.5% 0.4% -0.5% -1.0% -0.3% -0.1% 0.3% 0.0% -0.1%
3 -0.5% -0.1% 0.1% 2.7% 0.0% 0.0% -0.1% 0.0% 0.8% -0.3% 2.5% 0.6% -1.2% 0.6% -0.2% 0.2% -0.4% -0.1% 0.1% -0.4% 0.3% -0.5%
4 0.8% 0.0% 2.3% 0.0% -0.5% -0.6% -0.6% -1.3% -0.6% -0.4% 0.8% 0.4% -0.5% -0.1% 0.1% 0.0% -0.1% 0.0% -0.2% 2.7% 0.2% 0.8%
5 -0.2% 0.0% 0.0% -0.3% 0.0% -0.1% -0.1% -0.1% 0.4% 0.3% 0.1% 0.1% 0.0% 0.3% -0.3% -0.5% 0.1% 0.0% 0.0% 0.1% 0.0% -0.2%
6 -0.4% 0.0% 0.2% 0.5% -0.1% 0.1% -0.2% -0.1% 0.5% -0.1% -0.2% 0.2% -0.1% 0.4% 0.5% 0.5% 0.1% 0.2% 0.0% -0.3% 0.1% -0.4%
7 -0.1% -0.5% 0.2% -0.1% 0.0% -0.2% 0.1% 0.0% -0.4% 0.0% -0.4% -0.2% -0.1% 0.0% -0.4% -0.4% 0.1% -0.2% 0.1% -0.1% 0.0% -0.1%
8 0.1% -0.1% 0.3% -0.5% 0.2% 0.1% -0.1% 0.0% -0.4% -0.2% -0.4% 0.0% -0.4% -0.1% -0.6% -0.2% -0.1% -0.3% -0.1% 0.3% 0.0% 0.1%
9 0.2% 0.0% 1.1% -1.3% 0.1% 0.4% 0.2% 0.2% -0.5% 0.5% -0.3% -0.2% -0.1% 0.0% -0.2% 0.2% -0.3% -0.2% 0.0% 0.0% -0.1% 0.2%
10 0.0% 0.1% 0.1% 0.0% 0.1% -0.4% 0.0% -0.2% -0.7% 0.0% -0.4% -0.3% -0.1% -0.1% -0.5% -0.1% 0.2% -0.1% 0.0% -0.2% 0.0% 0.0%
11 -0.2% 0.2% -0.3% -0.3% 0.2% 0.4% -0.2% 0.2% -0.6% 0.5% 0.0% -0.1% 0.1% 0.5% 1.2% 0.6% 0.3% 0.1% 0.2% 0.1% 0.0% -0.2%
12 0.2% -0.2% -0.1% -0.3% 0.1% 0.4% -0.1% 0.1% -0.6% 0.3% -0.1% -0.1% 0.2% 0.3% 0.5% 0.3% 0.1% 0.1% 0.1% 0.0% 0.0% 0.2%
13 1.0% 0.1% -0.9% -0.5% 0.2% 0.1% 0.2% 0.1% -0.3% 0.1% -0.1% 0.1% 0.0% 0.0% 0.0% 0.1% -0.1% 0.0% 0.1% 0.1% 0.0% 1.0%
14 -0.4% 0.1% 0.1% 0.1% 0.2% 0.1% 0.1% 0.1% -0.6% 0.0% -0.2% 0.0% -0.5% 0.1% -0.2% 0.2% -0.1% 0.0% 0.0% 0.0% 0.0% -0.4%
15 -0.7% 0.1% -0.4% 0.3% 0.3% 0.0% 0.2% 0.2% -0.2% 0.1% 0.4% 0.1% -0.2% 0.0% 0.2% 0.3% 0.2% 0.1% 0.0% 0.1% 0.0% -0.7%
16 -0.1% 0.0% 1.2% -0.2% -0.2% 0.7% 0.0% -0.3% -0.7% -0.1% -0.3% -0.2% -0.3% 0.3% 0.7% 0.2% 0.1% 0.1% 0.1% -0.6% 0.1% -0.1%
17 0.1% 0.0% -1.1% 0.1% 0.2% 0.2% 0.2% 0.0% -0.4% 0.1% -0.2% 0.0% 0.0% 0.3% 0.4% 0.1% -0.4% 0.0% 0.1% 0.6% 0.0% 0.1%
18 0.3% 0.0% 0.1% -0.1% 0.2% 0.4% 0.1% 0.0% -0.4% 0.1% -0.1% 0.0% 0.0% 0.1% 0.2% 0.2% -0.1% 0.0% 0.0% 0.0% 0.0% 0.3%
19 0.0% -0.2% 0.4% 0.0% 0.0% 0.1% 0.1% 0.1% -0.5% 0.0% -0.2% -0.1% -0.1% 0.0% 0.0% 0.1% 0.1% 0.0% 0.0% 0.0% 0.0% 0.0%
20 -0.1% -0.2% -0.3% -1.2% 0.3% -2.1% -0.7% -0.2% 7.7% -0.2% 2.2% -0.2% -0.7% 0.5% 0.7% -1.0% 0.2% -0.3% 0.6% 0.2% 0.0% -0.1%
21 -0.3% 0.0% -0.1% 0.4% 0.0% -0.1% 0.0% 0.0% 0.1% 0.0% 0.2% 0.1% 0.1% 0.1% 0.1% 0.0% 0.2% 0.2% 0.0% 0.1% 0.0% -0.3%
Total -1.7% -0.1% -2.9% 1.7% 0.3% -1.7% 0.4% 0.3% 1.6% 0.2% -0.7% 0.5% 3.5% 0.1% 0.3% 0.1% 1.1% 1.8% 0.0% 0.4% -0.3% -1.7%
Final Report
5079478/Callington Link Options Assessment v2.doc 84
Appendix B - Traffic Flow Difference Plots
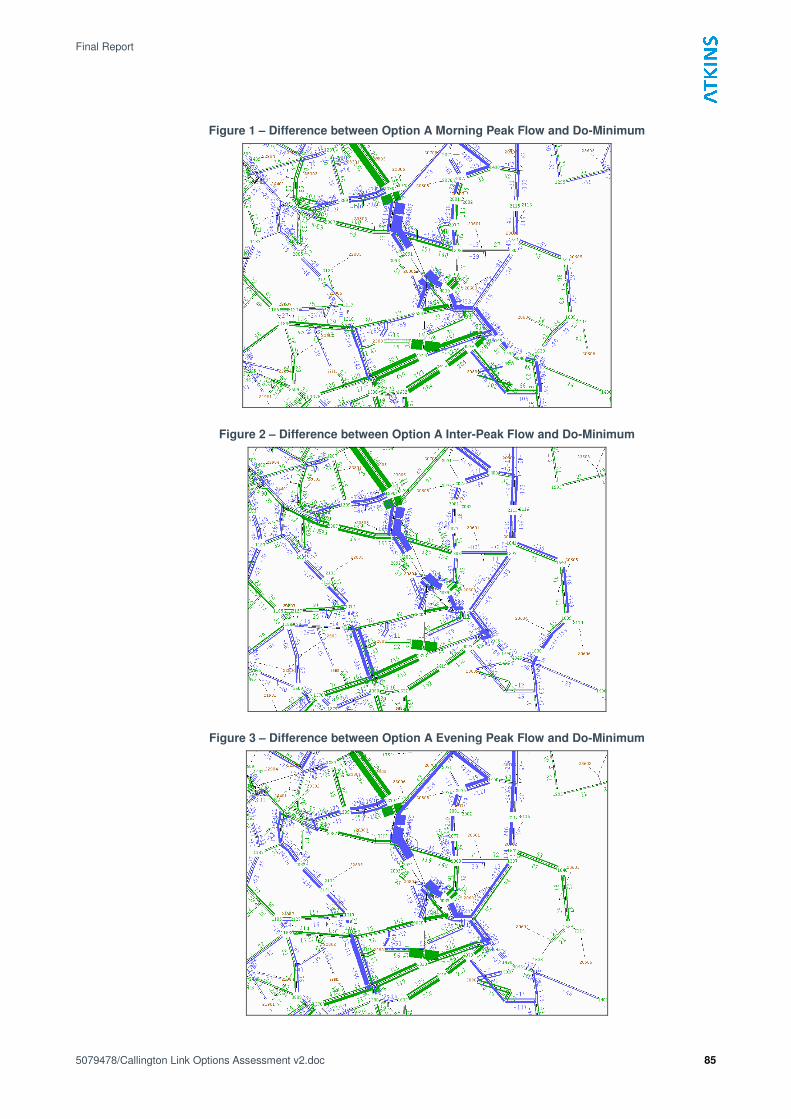
Final Report
5079478/Callington Link Options Assessment v2.doc 85
Figure 1 – Difference between Option A Morning Peak Flow and Do-Minimum
Figure 2 – Difference between Option A Inter-Peak Flow and Do-Minimum
Figure 3 – Difference between Option A Evening Peak Flow and Do-Minimum
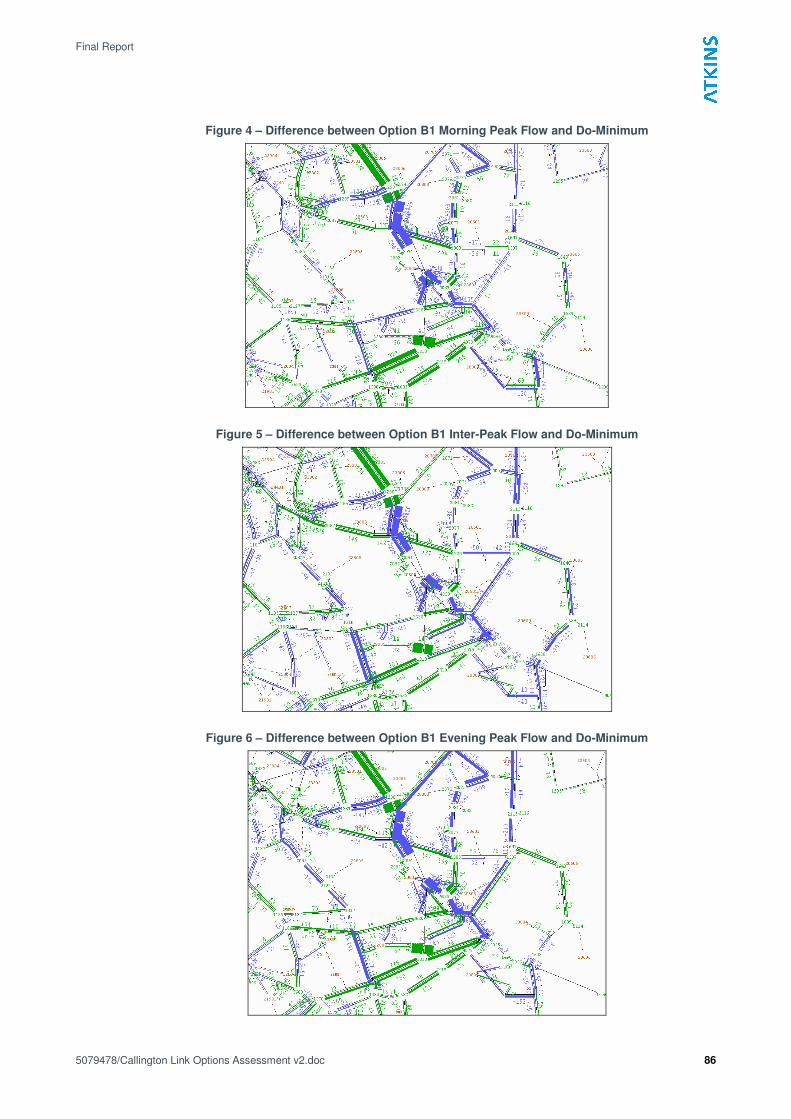
Final Report
5079478/Callington Link Options Assessment v2.doc 86
Figure 4 – Difference between Option B1 Morning Peak Flow and Do-Minimum
Figure 5 – Difference between Option B1 Inter-Peak Flow and Do-Minimum
Figure 6 – Difference between Option B1 Evening Peak Flow and Do-Minimum
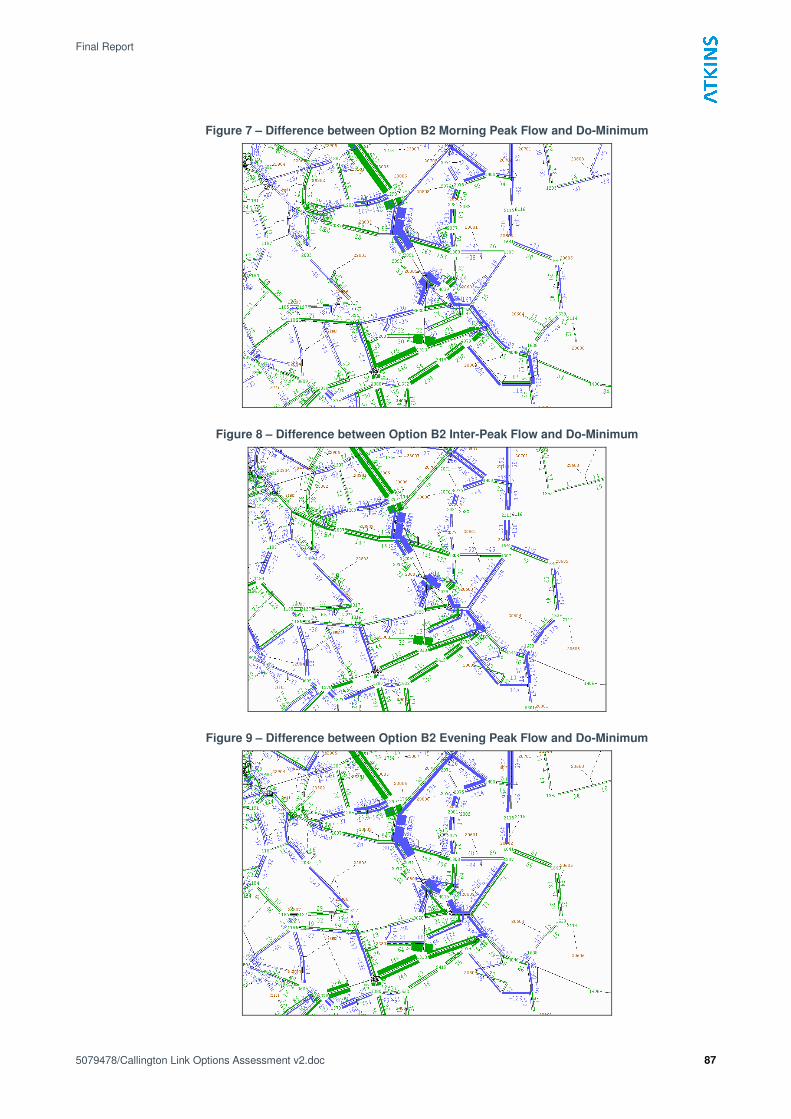
Final Report
5079478/Callington Link Options Assessment v2.doc 87
Figure 7 – Difference between Option B2 Morning Peak Flow and Do-Minimum
Figure 8 – Difference between Option B2 Inter-Peak Flow and Do-Minimum
Figure 9 – Difference between Option B2 Evening Peak Flow and Do-Minimum
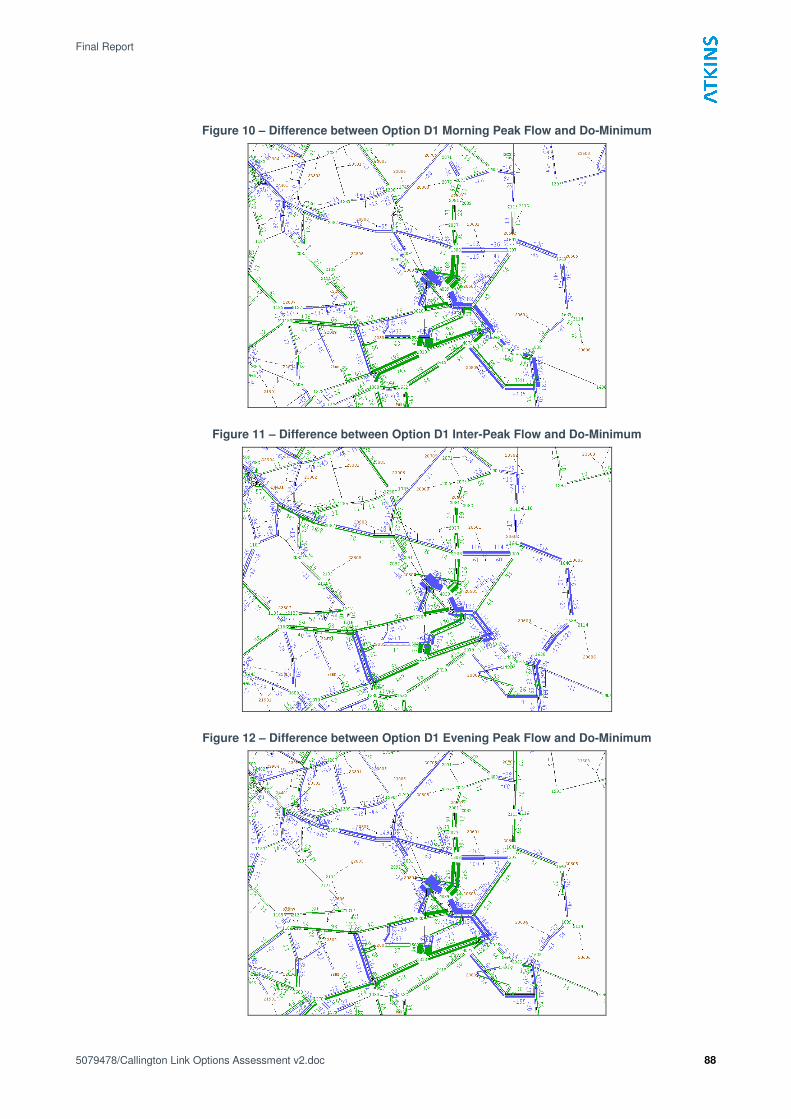
Final Report
5079478/Callington Link Options Assessment v2.doc 88
Figure 10 – Difference between Option D1 Morning Peak Flow and Do-Minimum
Figure 11 – Difference between Option D1 Inter-Peak Flow and Do-Minimum
Figure 12 – Difference between Option D1 Evening Peak Flow and Do-Minimum

Final Report
5079478/Callington Link Options Assessment v2.doc 89
Figure 13 – Difference between Option D2 Morning Peak Flow and Do-Minimum
Figure 14 – Difference between Option D2 Inter-Peak Flow and Do-Minimum
Figure 15 – Difference between Option D2 Evening Peak Flow and Do-Minimum
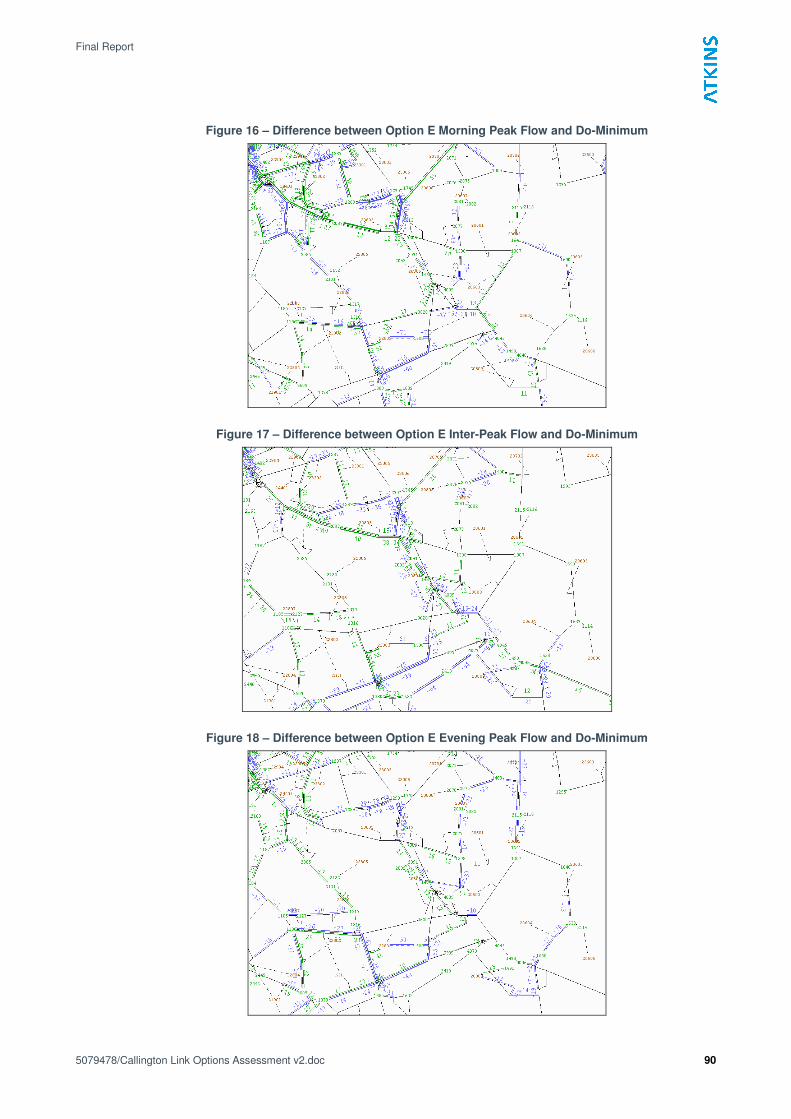
Final Report
5079478/Callington Link Options Assessment v2.doc 90
Figure 16 – Difference between Option E Morning Peak Flow and Do-Minimum
Figure 17 – Difference between Option E Inter-Peak Flow and Do-Minimum
Figure 18 – Difference between Option E Evening Peak Flow and Do-Minimum

Final Report
5079478/Callington Link Options Assessment v2.doc 91
Appendix C - Risk Assessment
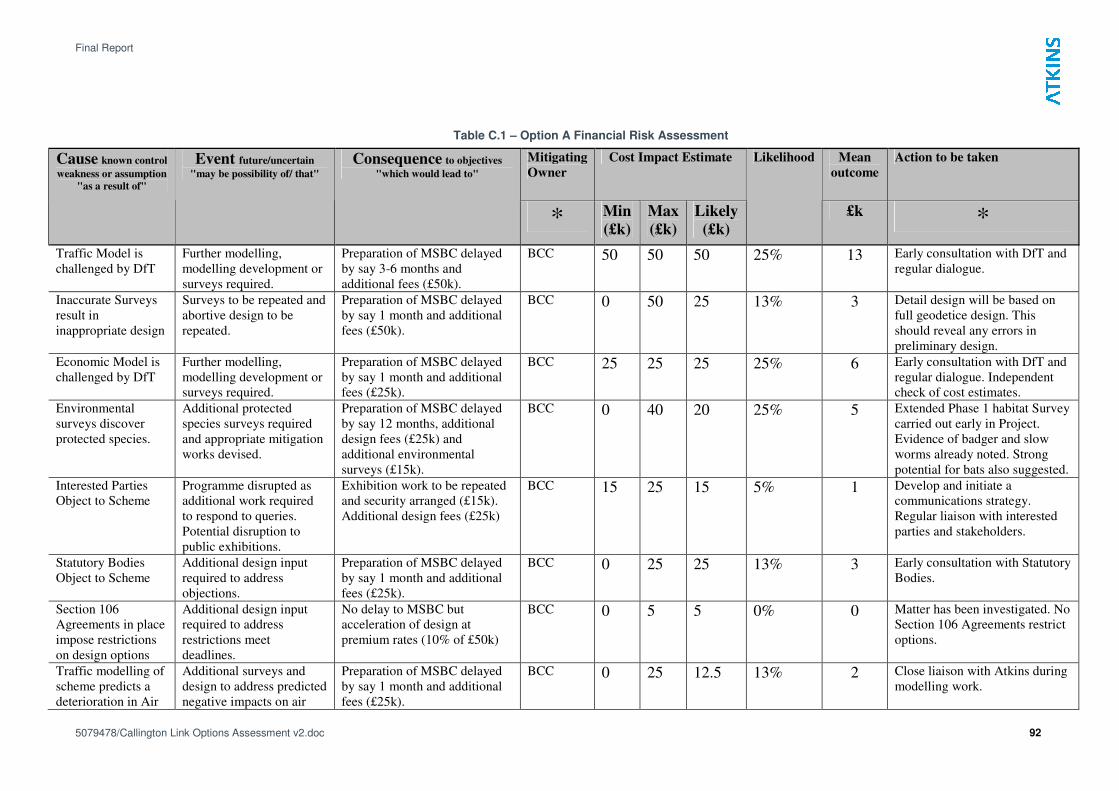
Final Report
5079478/Callington Link Options Assessment v2.doc 92
Table C.1 – Option A Financial Risk Assessment
Mitigating
Owner
Cost Impact Estimate Mean
outcome
Action to be taken Cause known control
weakness or assumption
"as a result of"
Event future/uncertain
"may be possibility of/ that" Consequence to objectives
"which would lead to"
* Min
(£k)
Max
(£k)
Likely
(£k)
Likelihood
£k *
Traffic Model is
challenged by DfT
Further modelling,
modelling development or
surveys required.
Preparation of MSBC delayed
by say 3-6 months and
additional fees (£50k).
BCC 50 50 50 25% 13 Early consultation with DfT and
regular dialogue.
Inaccurate Surveys
result in
inappropriate design
Surveys to be repeated and
abortive design to be
repeated.
Preparation of MSBC delayed
by say 1 month and additional
fees (£50k).
BCC 0 50 25 13% 3 Detail design will be based on
full geodetice design. This
should reveal any errors in
preliminary design.
Economic Model is
challenged by DfT
Further modelling,
modelling development or
surveys required.
Preparation of MSBC delayed
by say 1 month and additional
fees (£25k).
BCC 25 25 25 25% 6 Early consultation with DfT and
regular dialogue. Independent
check of cost estimates.
Environmental
surveys discover
protected species.
Additional protected
species surveys required
and appropriate mitigation
works devised.
Preparation of MSBC delayed
by say 12 months, additional
design fees (£25k) and
additional environmental
surveys (£15k).
BCC 0 40 20 25% 5 Extended Phase 1 habitat Survey
carried out early in Project.
Evidence of badger and slow
worms already noted. Strong
potential for bats also suggested.
Interested Parties
Object to Scheme
Programme disrupted as
additional work required
to respond to queries.
Potential disruption to
public exhibitions.
Exhibition work to be repeated
and security arranged (£15k).
Additional design fees (£25k)
BCC 15 25 15 5% 1 Develop and initiate a
communications strategy.
Regular liaison with interested
parties and stakeholders.
Statutory Bodies
Object to Scheme
Additional design input
required to address
objections.
Preparation of MSBC delayed
by say 1 month and additional
fees (£25k).
BCC 0 25 25 13% 3 Early consultation with Statutory
Bodies.
Section 106
Agreements in place
impose restrictions
on design options
Additional design input
required to address
restrictions meet
deadlines.
No delay to MSBC but
acceleration of design at
premium rates (10% of £50k)
BCC 0 5 5 0% 0 Matter has been investigated. No
Section 106 Agreements restrict
options.
Traffic modelling of
scheme predicts a
deterioration in Air
Additional surveys and
design to address predicted
negative impacts on air
Preparation of MSBC delayed
by say 1 month and additional
fees (£25k).
BCC 0 25 12.5 13% 2 Close liaison with Atkins during
modelling work.
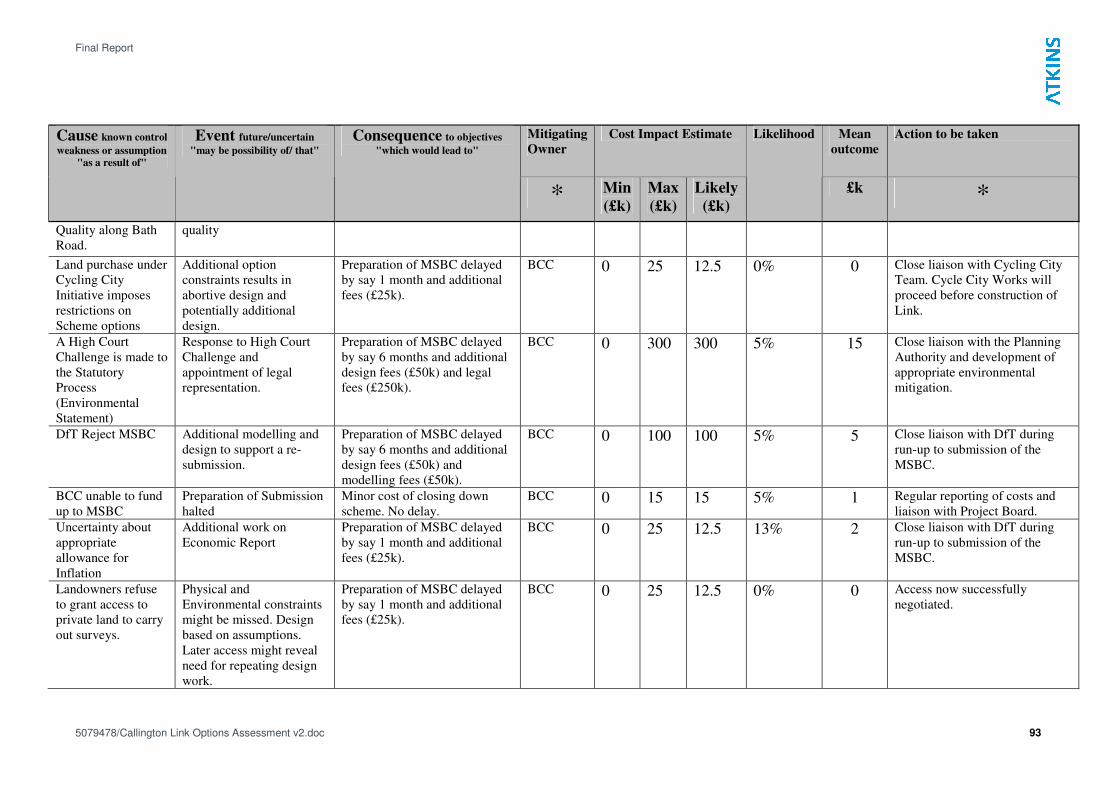
Final Report
5079478/Callington Link Options Assessment v2.doc 93
Mitigating
Owner
Cost Impact Estimate Mean
outcome
Action to be taken Cause known control
weakness or assumption
"as a result of"
Event future/uncertain
"may be possibility of/ that" Consequence to objectives
"which would lead to"
* Min
(£k)
Max
(£k)
Likely
(£k)
Likelihood
£k *
Quality along Bath
Road.
quality
Land purchase under
Cycling City
Initiative imposes
restrictions on
Scheme options
Additional option
constraints results in
abortive design and
potentially additional
design.
Preparation of MSBC delayed
by say 1 month and additional
fees (£25k).
BCC 0 25 12.5 0% 0 Close liaison with Cycling City
Team. Cycle City Works will
proceed before construction of
Link.
A High Court
Challenge is made to
the Statutory
Process
(Environmental
Statement)
Response to High Court
Challenge and
appointment of legal
representation.
Preparation of MSBC delayed
by say 6 months and additional
design fees (£50k) and legal
fees (£250k).
BCC 0 300 300 5% 15 Close liaison with the Planning
Authority and development of
appropriate environmental
mitigation.
DfT Reject MSBC Additional modelling and
design to support a re-
submission.
Preparation of MSBC delayed
by say 6 months and additional
design fees (£50k) and
modelling fees (£50k).
BCC 0 100 100 5% 5 Close liaison with DfT during
run-up to submission of the
MSBC.
BCC unable to fund
up to MSBC
Preparation of Submission
halted
Minor cost of closing down
scheme. No delay.
BCC 0 15 15 5% 1 Regular reporting of costs and
liaison with Project Board.
Uncertainty about
appropriate
allowance for
Inflation
Additional work on
Economic Report
Preparation of MSBC delayed
by say 1 month and additional
fees (£25k).
BCC 0 25 12.5 13% 2 Close liaison with DfT during
run-up to submission of the
MSBC.
Landowners refuse
to grant access to
private land to carry
out surveys.
Physical and
Environmental constraints
might be missed. Design
based on assumptions.
Later access might reveal
need for repeating design
work.
Preparation of MSBC delayed
by say 1 month and additional
fees (£25k).
BCC 0 25 12.5 0% 0 Access now successfully
negotiated.
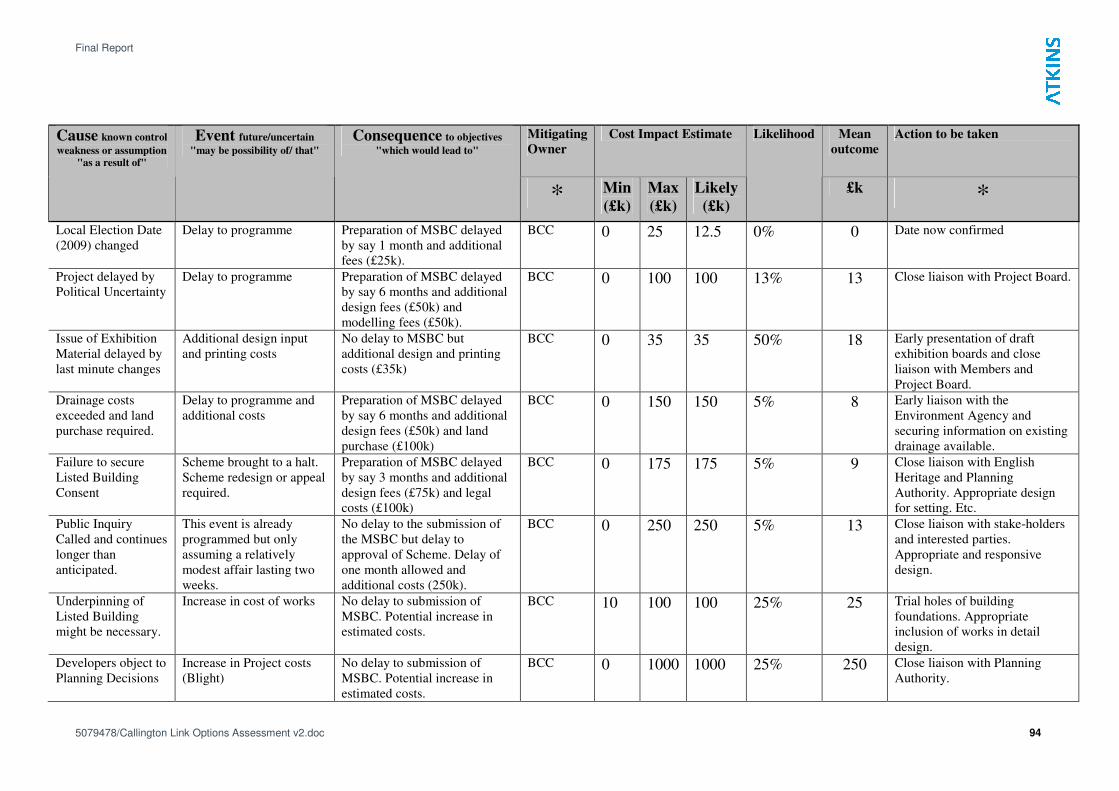
Final Report
5079478/Callington Link Options Assessment v2.doc 94
Mitigating
Owner
Cost Impact Estimate Mean
outcome
Action to be taken Cause known control
weakness or assumption
"as a result of"
Event future/uncertain
"may be possibility of/ that" Consequence to objectives
"which would lead to"
* Min
(£k)
Max
(£k)
Likely
(£k)
Likelihood
£k *
Local Election Date
(2009) changed
Delay to programme Preparation of MSBC delayed
by say 1 month and additional
fees (£25k).
BCC 0 25 12.5 0% 0 Date now confirmed
Project delayed by
Political Uncertainty
Delay to programme Preparation of MSBC delayed
by say 6 months and additional
design fees (£50k) and
modelling fees (£50k).
BCC 0 100 100 13% 13 Close liaison with Project Board.
Issue of Exhibition
Material delayed by
last minute changes
Additional design input
and printing costs
No delay to MSBC but
additional design and printing
costs (£35k)
BCC 0 35 35 50% 18 Early presentation of draft
exhibition boards and close
liaison with Members and
Project Board.
Drainage costs
exceeded and land
purchase required.
Delay to programme and
additional costs
Preparation of MSBC delayed
by say 6 months and additional
design fees (£50k) and land
purchase (£100k)
BCC 0 150 150 5% 8 Early liaison with the
Environment Agency and
securing information on existing
drainage available.
Failure to secure
Listed Building
Consent
Scheme brought to a halt.
Scheme redesign or appeal
required.
Preparation of MSBC delayed
by say 3 months and additional
design fees (£75k) and legal
costs (£100k)
BCC 0 175 175 5% 9 Close liaison with English
Heritage and Planning
Authority. Appropriate design
for setting. Etc.
Public Inquiry
Called and continues
longer than
anticipated.
This event is already
programmed but only
assuming a relatively
modest affair lasting two
weeks.
No delay to the submission of
the MSBC but delay to
approval of Scheme. Delay of
one month allowed and
additional costs (250k).
BCC 0 250 250 5% 13 Close liaison with stake-holders
and interested parties.
Appropriate and responsive
design.
Underpinning of
Listed Building
might be necessary.
Increase in cost of works No delay to submission of
MSBC. Potential increase in
estimated costs.
BCC 10 100 100 25% 25 Trial holes of building
foundations. Appropriate
inclusion of works in detail
design.
Developers object to
Planning Decisions
Increase in Project costs
(Blight)
No delay to submission of
MSBC. Potential increase in
estimated costs.
BCC 0 1000 1000 25% 250 Close liaison with Planning
Authority.

Final Report
5079478/Callington Link Options Assessment v2.doc 95
Mitigating
Owner
Cost Impact Estimate Mean
outcome
Action to be taken Cause known control
weakness or assumption
"as a result of"
Event future/uncertain
"may be possibility of/ that" Consequence to objectives
"which would lead to"
* Min
(£k)
Max
(£k)
Likely
(£k)
Likelihood
£k *
Scope of Project
expanded
significantly
(additional £40m)
Instruction to consider
additional transport
improvements over a
wider area.
Delay to public consultation.
Potential delay to submission of
MSBC and possibly Project as
a whole. Additional preparation
costs.
BCC 0 1120 1120 0% 0 Direction by Project Board. Not
applicable to original Link
alone.
PROCUREMENT 388
Interested Parties
Object to Scheme
Works programme
disrupted. Security
Measures introduced.
Additional cost of security
measures (£250 - £500k).
Possible 3 months delay to the
start of works
BCC and
DfT /
Contractor
250 500 375 5% 19 Develop and initiate a
communications strategy.
Regular liaison with interested
parties and stakeholders.
Predicted Public
Utility Costs
Exceeded
Unforeseen complications
during works progress
Delay to works completion. BCC and
DfT .
100 500 250 25% 63 Close liaison with Utilities
during detail design. Early
Contractor Involvement.
Unexpected
Contaminated
ground encountered
Works brought to a halt in
affected area.
2 months delay to works
completion and costs for
disposal / treatment (£250k).
BCC and
DfT .
0 250 250 5% 13 Reference to historical records.
Focussed site investigation and
soil testing.
94
TOTAL RISK COST
482

Final Report
5079478/Callington Link Options Assessment v2.doc 96
Table C.2 – Option A Delay Risk Assessment
Mitigating
Owner
Cost Impact Estimate Mean
outcome
Action to be taken Cause known control
weakness or assumption
"as a result of"
Event future/uncertain "may
be possibility of/ that" Consequence to
objectives "which would
lead to"
* Min
(mths)
Max
(mths)
Likely
(mths)
Likelihood
mth *
Traffic Model is
challenged by DfT
Further modelling,
modelling development or
surveys required.
Preparation of MSBC
delayed by say 3-6
months and additional
fees (£50k).
BCC 3 6 4.5 25% 1.1 Early consultation with DfT
and regular dialogue.
Inaccurate Surveys
result in
inappropriate design
Surveys to be repeated and
abortive design to be
repeated.
Preparation of MSBC
delayed by say 1
month and additional
fees (£50k).
BCC 0 1 1 13% 0.1 Detail design will be based on
full geodetice design. This
should reveal any errors in
preliminary design.
Economic Model is
challenged by DfT
Further modelling,
modelling development or
surveys required.
Preparation of MSBC
delayed by say 1
month and additional
fees (£25k).
BCC 0 1 1 25% 0.3 Early consultation with DfT
and regular dialogue.
Independent check of cost
estimates.
Environmental
surveys discover
protected species.
Additional protected
species surveys required
and appropriate mitigation
works devised.
Preparation of MSBC
delayed by say 12
months, additional
design fees (£25k)
and additional
environmental
surveys (£15k).
BCC 0 12 12 25% 3.0 Extended Phase 1 habitat
Survey carried out early in
Project. Evidence of badger
and slow worms already noted.
Strong potential for bats also
suggested.
Interested Parties
Object to Scheme
Programme disrupted as
additional work required to
respond to queries.
Potential disruption to
public exhibitions.
Exhibition work to be
repeated and security
arranged (£15k).
Additional design
fees (£25k)
BCC 0 0 0 5% 0.0 Develop and initiate a
communications strategy.
Regular liaison with interested
parties and stakeholders.
Statutory Bodies
Object to Scheme
Additional design input
required to address
objections.
Preparation of MSBC
delayed by say 1
month and additional
fees (£25k).
BCC 0 1 1 13% 0.1 Early consultation with
Statutory Bodies.
Section 106
Agreements in place
Additional design input
required to address
No delay to MSBC
but acceleration of
BCC 0 0 0 0% 0.0 Matter has been investigated.
No Section 106 Agreements
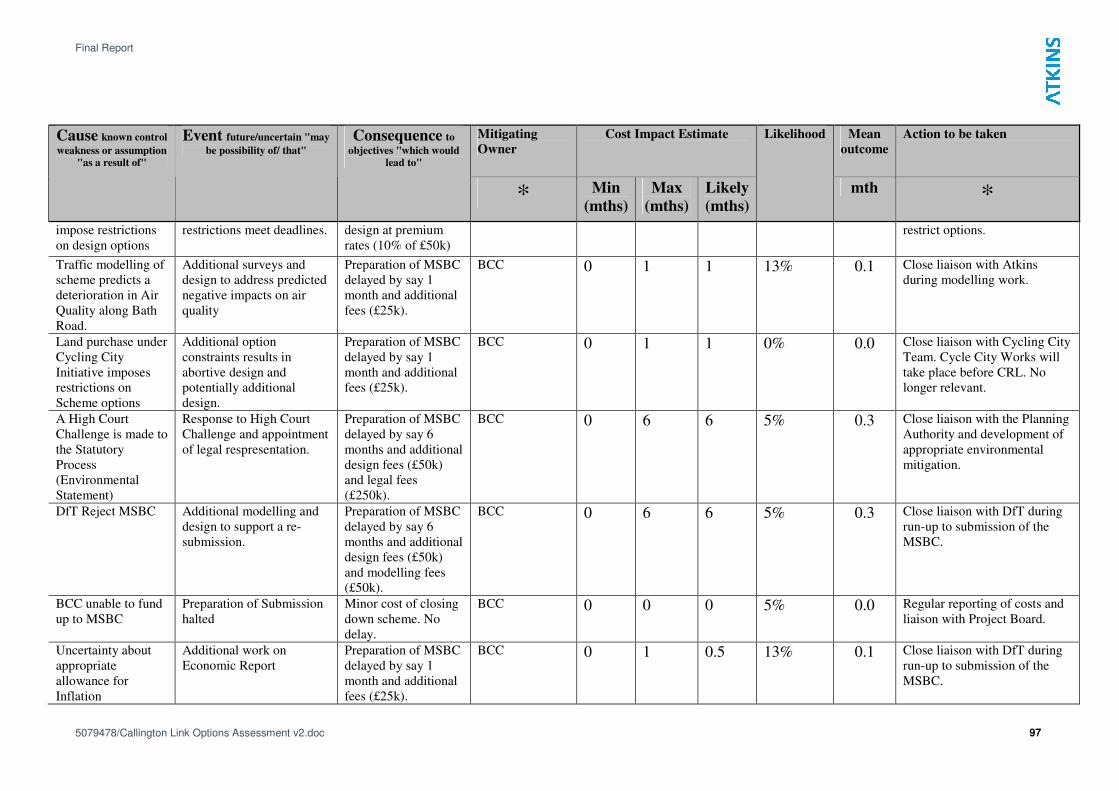
Final Report
5079478/Callington Link Options Assessment v2.doc 97
Mitigating
Owner
Cost Impact Estimate Mean
outcome
Action to be taken Cause known control
weakness or assumption
"as a result of"
Event future/uncertain "may
be possibility of/ that" Consequence to
objectives "which would
lead to"
* Min
(mths)
Max
(mths)
Likely
(mths)
Likelihood
mth *
impose restrictions
on design options
restrictions meet deadlines. design at premium
rates (10% of £50k)
restrict options.
Traffic modelling of
scheme predicts a
deterioration in Air
Quality along Bath
Road.
Additional surveys and
design to address predicted
negative impacts on air
quality
Preparation of MSBC
delayed by say 1
month and additional
fees (£25k).
BCC 0 1 1 13% 0.1 Close liaison with Atkins
during modelling work.
Land purchase under
Cycling City
Initiative imposes
restrictions on
Scheme options
Additional option
constraints results in
abortive design and
potentially additional
design.
Preparation of MSBC
delayed by say 1
month and additional
fees (£25k).
BCC 0 1 1 0% 0.0 Close liaison with Cycling City
Team. Cycle City Works will
take place before CRL. No
longer relevant.
A High Court
Challenge is made to
the Statutory
Process
(Environmental
Statement)
Response to High Court
Challenge and appointment
of legal respresentation.
Preparation of MSBC
delayed by say 6
months and additional
design fees (£50k)
and legal fees
(£250k).
BCC 0 6 6 5% 0.3 Close liaison with the Planning
Authority and development of
appropriate environmental
mitigation.
DfT Reject MSBC Additional modelling and
design to support a re-
submission.
Preparation of MSBC
delayed by say 6
months and additional
design fees (£50k)
and modelling fees
(£50k).
BCC 0 6 6 5% 0.3 Close liaison with DfT during
run-up to submission of the
MSBC.
BCC unable to fund
up to MSBC
Preparation of Submission
halted
Minor cost of closing
down scheme. No
delay.
BCC 0 0 0 5% 0.0 Regular reporting of costs and
liaison with Project Board.
Uncertainty about
appropriate
allowance for
Inflation
Additional work on
Economic Report
Preparation of MSBC
delayed by say 1
month and additional
fees (£25k).
BCC 0 1 0.5 13% 0.1 Close liaison with DfT during
run-up to submission of the
MSBC.
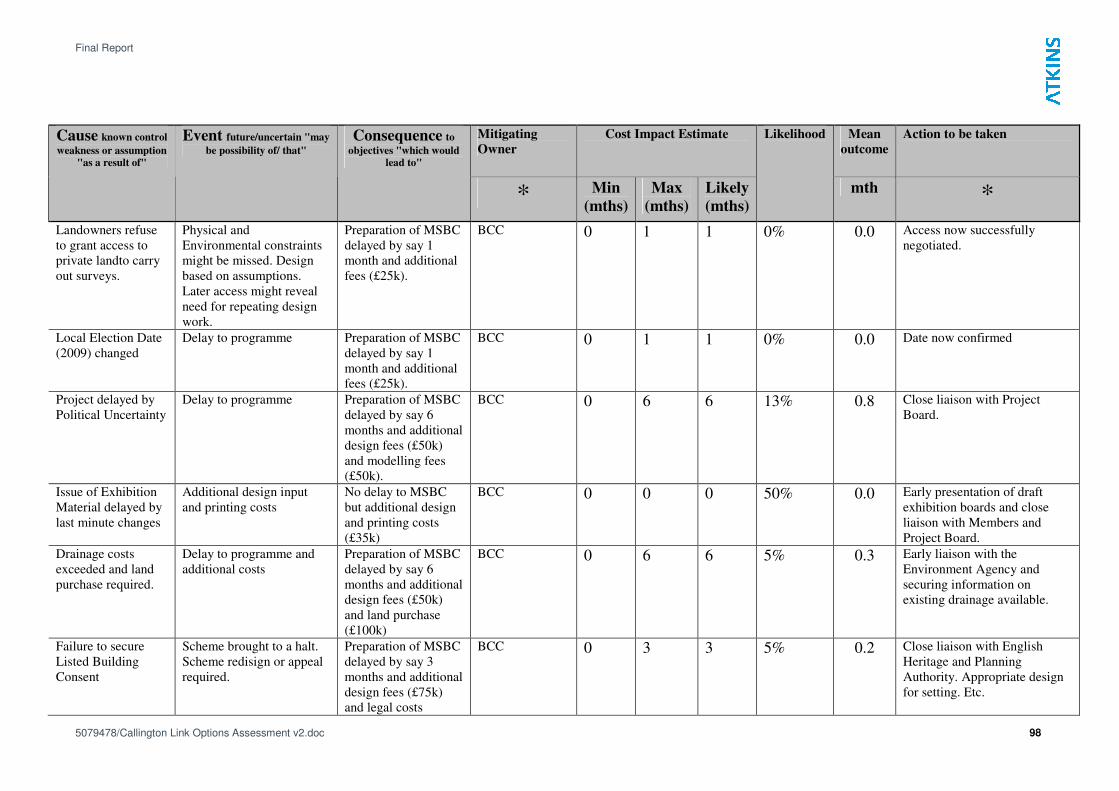
Final Report
5079478/Callington Link Options Assessment v2.doc 98
Mitigating
Owner
Cost Impact Estimate Mean
outcome
Action to be taken Cause known control
weakness or assumption
"as a result of"
Event future/uncertain "may
be possibility of/ that" Consequence to
objectives "which would
lead to"
* Min
(mths)
Max
(mths)
Likely
(mths)
Likelihood
mth *
Landowners refuse
to grant access to
private landto carry
out surveys.
Physical and
Environmental constraints
might be missed. Design
based on assumptions.
Later access might reveal
need for repeating design
work.
Preparation of MSBC
delayed by say 1
month and additional
fees (£25k).
BCC 0 1 1 0% 0.0 Access now successfully
negotiated.
Local Election Date
(2009) changed
Delay to programme Preparation of MSBC
delayed by say 1
month and additional
fees (£25k).
BCC 0 1 1 0% 0.0 Date now confirmed
Project delayed by
Political Uncertainty
Delay to programme Preparation of MSBC
delayed by say 6
months and additional
design fees (£50k)
and modelling fees
(£50k).
BCC 0 6 6 13% 0.8 Close liaison with Project
Board.
Issue of Exhibition
Material delayed by
last minute changes
Additional design input
and printing costs
No delay to MSBC
but additional design
and printing costs
(£35k)
BCC 0 0 0 50% 0.0 Early presentation of draft
exhibition boards and close
liaison with Members and
Project Board.
Drainage costs
exceeded and land
purchase required.
Delay to programme and
additional costs
Preparation of MSBC
delayed by say 6
months and additional
design fees (£50k)
and land purchase
(£100k)
BCC 0 6 6 5% 0.3 Early liaison with the
Environment Agency and
securing information on
existing drainage available.
Failure to secure
Listed Building
Consent
Scheme brought to a halt.
Scheme redisign or appeal
required.
Preparation of MSBC
delayed by say 3
months and additional
design fees (£75k)
and legal costs
BCC 0 3 3 5% 0.2 Close liaison with English
Heritage and Planning
Authority. Appropriate design
for setting. Etc.
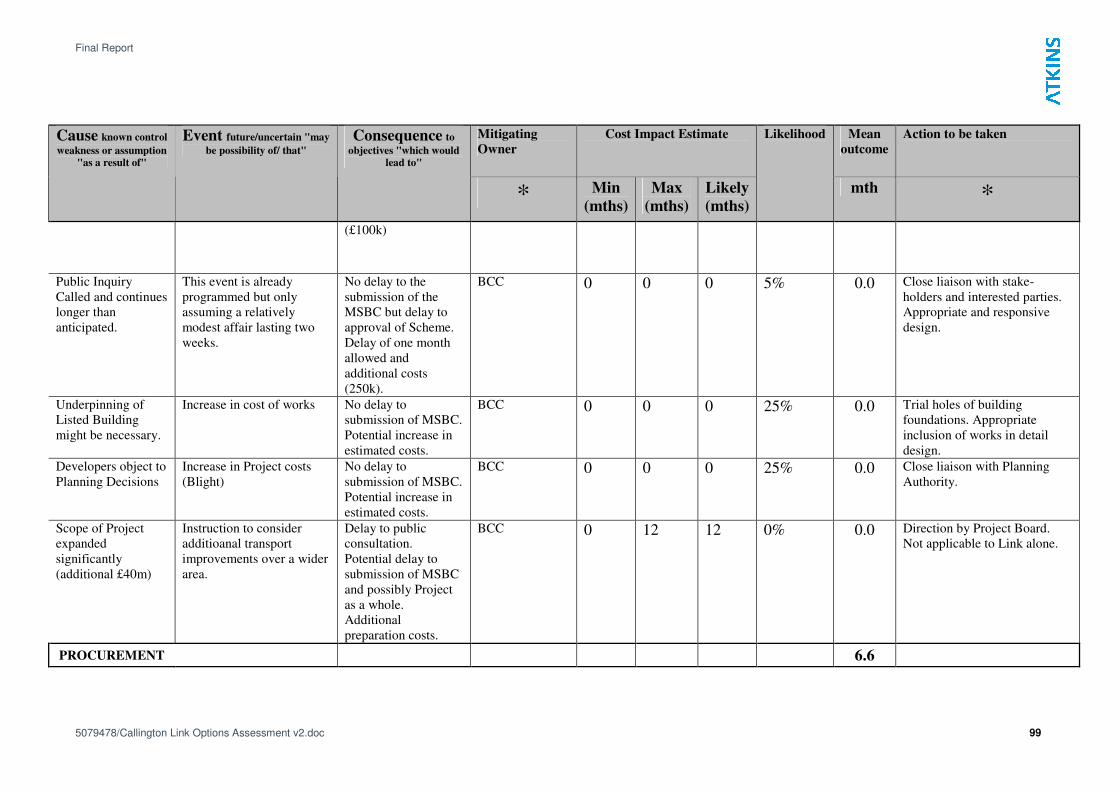
Final Report
5079478/Callington Link Options Assessment v2.doc 99
Mitigating
Owner
Cost Impact Estimate Mean
outcome
Action to be taken Cause known control
weakness or assumption
"as a result of"
Event future/uncertain "may
be possibility of/ that" Consequence to
objectives "which would
lead to"
* Min
(mths)
Max
(mths)
Likely
(mths)
Likelihood
mth *
(£100k)
Public Inquiry
Called and continues
longer than
anticipated.
This event is already
programmed but only
assuming a relatively
modest affair lasting two
weeks.
No delay to the
submission of the
MSBC but delay to
approval of Scheme.
Delay of one month
allowed and
additional costs
(250k).
BCC 0 0 0 5% 0.0 Close liaison with stake-
holders and interested parties.
Appropriate and responsive
design.
Underpinning of
Listed Building
might be necessary.
Increase in cost of works No delay to
submission of MSBC.
Potential increase in
estimated costs.
BCC 0 0 0 25% 0.0 Trial holes of building
foundations. Appropriate
inclusion of works in detail
design.
Developers object to
Planning Decisions
Increase in Project costs
(Blight)
No delay to
submission of MSBC.
Potential increase in
estimated costs.
BCC 0 0 0 25% 0.0 Close liaison with Planning
Authority.
Scope of Project
expanded
significantly
(additional £40m)
Instruction to consider
additioanal transport
improvements over a wider
area.
Delay to public
consultation.
Potential delay to
submission of MSBC
and possibly Project
as a whole.
Additional
preparation costs.
BCC 0 12 12 0% 0.0 Direction by Project Board.
Not applicable to Link alone.
PROCUREMENT 6.6
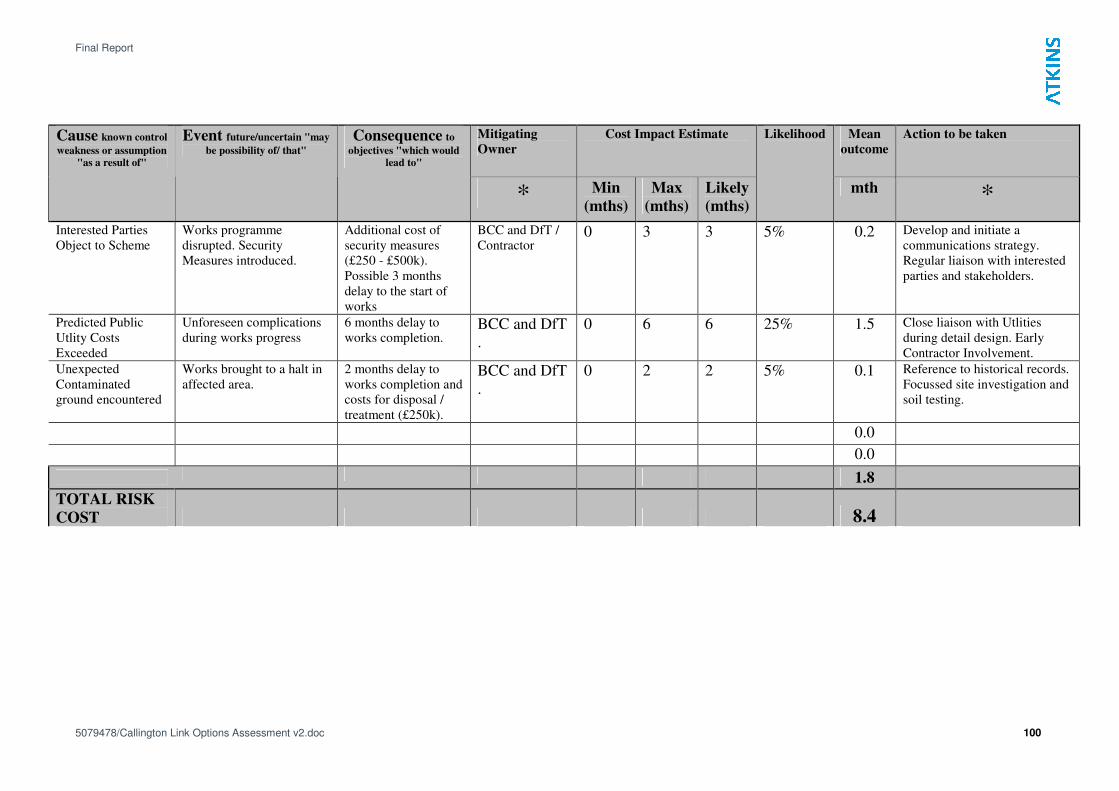
Final Report
5079478/Callington Link Options Assessment v2.doc 100
Mitigating
Owner
Cost Impact Estimate Mean
outcome
Action to be taken Cause known control
weakness or assumption
"as a result of"
Event future/uncertain "may
be possibility of/ that" Consequence to
objectives "which would
lead to"
* Min
(mths)
Max
(mths)
Likely
(mths)
Likelihood
mth *
Interested Parties
Object to Scheme
Works programme
disrupted. Security
Measures introduced.
Additional cost of
security measures
(£250 - £500k).
Possible 3 months
delay to the start of
works
BCC and DfT /
Contractor 0 3 3 5% 0.2 Develop and initiate a
communications strategy.
Regular liaison with interested
parties and stakeholders.
Predicted Public
Utlity Costs
Exceeded
Unforeseen complications
during works progress
6 months delay to
works completion. BCC and DfT
.
0 6 6 25% 1.5 Close liaison with Utlities
during detail design. Early
Contractor Involvement.
Unexpected
Contaminated
ground encountered
Works brought to a halt in
affected area.
2 months delay to
works completion and
costs for disposal /
treatment (£250k).
BCC and DfT
.
0 2 2 5% 0.1 Reference to historical records.
Focussed site investigation and
soil testing.
0.0
0.0
1.8
TOTAL RISK
COST 8.4
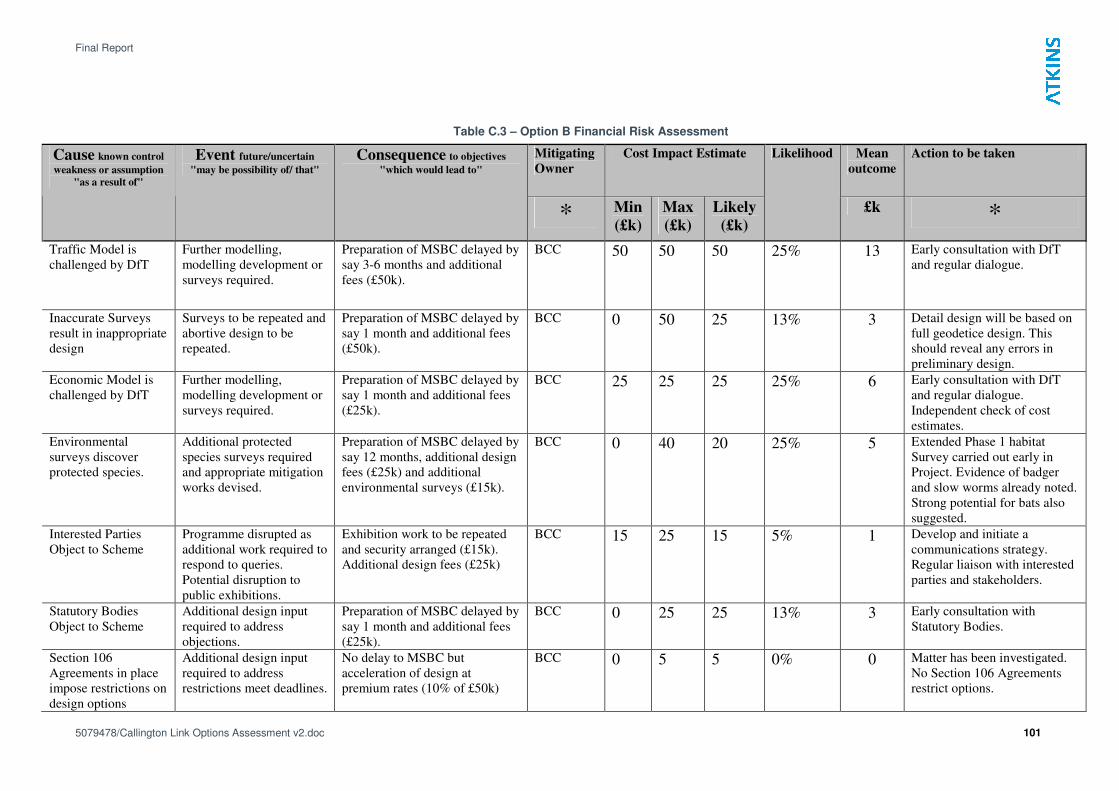
Final Report
5079478/Callington Link Options Assessment v2.doc 101
Table C.3 – Option B Financial Risk Assessment
Mitigating
Owner
Cost Impact Estimate Mean
outcome
Action to be taken Cause known control
weakness or assumption
"as a result of"
Event future/uncertain
"may be possibility of/ that" Consequence to objectives
"which would lead to"
* Min
(£k)
Max
(£k)
Likely
(£k)
Likelihood
£k *
Traffic Model is
challenged by DfT
Further modelling,
modelling development or
surveys required.
Preparation of MSBC delayed by
say 3-6 months and additional
fees (£50k).
BCC 50 50 50 25% 13 Early consultation with DfT
and regular dialogue.
Inaccurate Surveys
result in inappropriate
design
Surveys to be repeated and
abortive design to be
repeated.
Preparation of MSBC delayed by
say 1 month and additional fees
(£50k).
BCC 0 50 25 13% 3 Detail design will be based on
full geodetice design. This
should reveal any errors in
preliminary design.
Economic Model is
challenged by DfT
Further modelling,
modelling development or
surveys required.
Preparation of MSBC delayed by
say 1 month and additional fees
(£25k).
BCC 25 25 25 25% 6 Early consultation with DfT
and regular dialogue.
Independent check of cost
estimates.
Environmental
surveys discover
protected species.
Additional protected
species surveys required
and appropriate mitigation
works devised.
Preparation of MSBC delayed by
say 12 months, additional design
fees (£25k) and additional
environmental surveys (£15k).
BCC 0 40 20 25% 5 Extended Phase 1 habitat
Survey carried out early in
Project. Evidence of badger
and slow worms already noted.
Strong potential for bats also
suggested.
Interested Parties
Object to Scheme
Programme disrupted as
additional work required to
respond to queries.
Potential disruption to
public exhibitions.
Exhibition work to be repeated
and security arranged (£15k).
Additional design fees (£25k)
BCC 15 25 15 5% 1 Develop and initiate a
communications strategy.
Regular liaison with interested
parties and stakeholders.
Statutory Bodies
Object to Scheme
Additional design input
required to address
objections.
Preparation of MSBC delayed by
say 1 month and additional fees
(£25k).
BCC 0 25 25 13% 3 Early consultation with
Statutory Bodies.
Section 106
Agreements in place
impose restrictions on
design options
Additional design input
required to address
restrictions meet deadlines.
No delay to MSBC but
acceleration of design at
premium rates (10% of £50k)
BCC 0 5 5 0% 0 Matter has been investigated.
No Section 106 Agreements
restrict options.
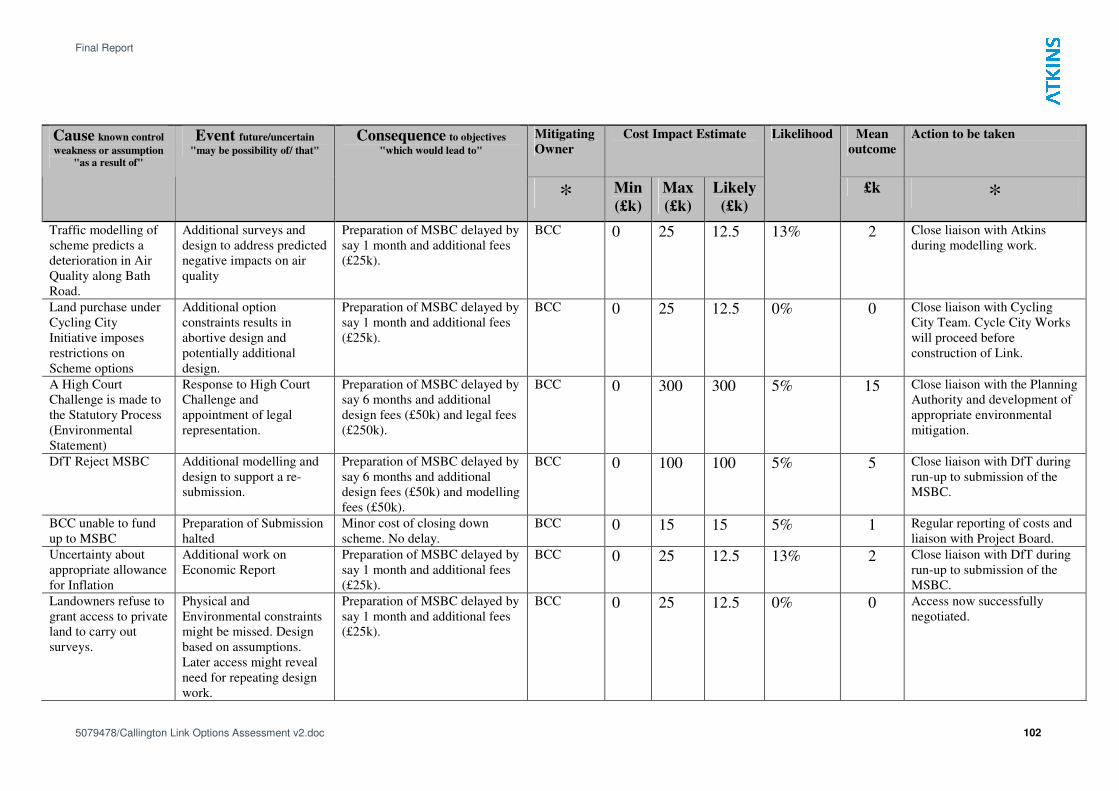
Final Report
5079478/Callington Link Options Assessment v2.doc 102
Mitigating
Owner
Cost Impact Estimate Mean
outcome
Action to be taken Cause known control
weakness or assumption
"as a result of"
Event future/uncertain
"may be possibility of/ that" Consequence to objectives
"which would lead to"
* Min
(£k)
Max
(£k)
Likely
(£k)
Likelihood
£k *
Traffic modelling of
scheme predicts a
deterioration in Air
Quality along Bath
Road.
Additional surveys and
design to address predicted
negative impacts on air
quality
Preparation of MSBC delayed by
say 1 month and additional fees
(£25k).
BCC 0 25 12.5 13% 2 Close liaison with Atkins
during modelling work.
Land purchase under
Cycling City
Initiative imposes
restrictions on
Scheme options
Additional option
constraints results in
abortive design and
potentially additional
design.
Preparation of MSBC delayed by
say 1 month and additional fees
(£25k).
BCC 0 25 12.5 0% 0 Close liaison with Cycling
City Team. Cycle City Works
will proceed before
construction of Link.
A High Court
Challenge is made to
the Statutory Process
(Environmental
Statement)
Response to High Court
Challenge and
appointment of legal
representation.
Preparation of MSBC delayed by
say 6 months and additional
design fees (£50k) and legal fees
(£250k).
BCC 0 300 300 5% 15 Close liaison with the Planning
Authority and development of
appropriate environmental
mitigation.
DfT Reject MSBC Additional modelling and
design to support a re-
submission.
Preparation of MSBC delayed by
say 6 months and additional
design fees (£50k) and modelling
fees (£50k).
BCC 0 100 100 5% 5 Close liaison with DfT during
run-up to submission of the
MSBC.
BCC unable to fund
up to MSBC
Preparation of Submission
halted
Minor cost of closing down
scheme. No delay.
BCC 0 15 15 5% 1 Regular reporting of costs and
liaison with Project Board.
Uncertainty about
appropriate allowance
for Inflation
Additional work on
Economic Report
Preparation of MSBC delayed by
say 1 month and additional fees
(£25k).
BCC 0 25 12.5 13% 2 Close liaison with DfT during
run-up to submission of the
MSBC.
Landowners refuse to
grant access to private
land to carry out
surveys.
Physical and
Environmental constraints
might be missed. Design
based on assumptions.
Later access might reveal
need for repeating design
work.
Preparation of MSBC delayed by
say 1 month and additional fees
(£25k).
BCC 0 25 12.5 0% 0 Access now successfully
negotiated.

Final Report
5079478/Callington Link Options Assessment v2.doc 103
Mitigating
Owner
Cost Impact Estimate Mean
outcome
Action to be taken Cause known control
weakness or assumption
"as a result of"
Event future/uncertain
"may be possibility of/ that" Consequence to objectives
"which would lead to"
* Min
(£k)
Max
(£k)
Likely
(£k)
Likelihood
£k *
Local Election Date
(2009) changed
Delay to programme Preparation of MSBC delayed by
say 1 month and additional fees
(£25k).
BCC 0 25 12.5 0% 0 Date now confirmed
Project delayed by
Political Uncertainty
Delay to programme Preparation of MSBC delayed by
say 6 months and additional
design fees (£50k) and modelling
fees (£50k).
BCC 0 100 100 13% 13 Close liaison with Project
Board.
Issue of Exhibition
Material delayed by
last minute changes
Additional design input
and printing costs
No delay to MSBC but
additional design and printing
costs (£35k)
BCC 0 35 35 50% 18 Early presentation of draft
exhibition boards and close
liaison with Members and
Project Board.
Drainage costs
exceeded and land
purchase required.
Delay to programme and
additional costs
Preparation of MSBC delayed by
say 6 months and additional
design fees (£50k) and land
purchase (£100k)
BCC 0 150 150 5% 8 Early liaison with the
Environment Agency and
securing information on
existing drainage available.
Failure to secure
Listed Building
Consent
Scheme brought to a halt.
Scheme redesign or appeal
required.
Preparation of MSBC delayed by
say 3 months and additional
design fees (£75k) and legal
costs (£100k)
BCC 0 175 175 5% 9 Close liaison with English
Heritage and Planning
Authority. Appropriate design
for setting. Etc.
Public Inquiry Called
and continues longer
than anticipated.
This event is already
programmed but only
assuming a relatively
modest affair lasting two
weeks.
No delay to the submission of
the MSBC but delay to approval
of Scheme. Delay of one month
allowed and additional costs
(250k).
BCC 0 250 250 5% 13 Close liaison with stake-
holders and interested parties.
Appropriate and responsive
design.
Underpinning of
Listed Building might
be necessary.
Increase in cost of works No delay to submission of
MSBC. Potential increase in
estimated costs.
BCC 10 100 100 0% 0 Trial holes of building
foundations. Appropriate
inclusion of works in detail
design. Building unaffected.
Developers object to
Planning Decisions
Increase in Project costs
(Blight)
No delay to submission of
MSBC. Potential increase in
estimated costs.
BCC 0 1000 1000 25% 250 Close liaison with Planning
Authority.
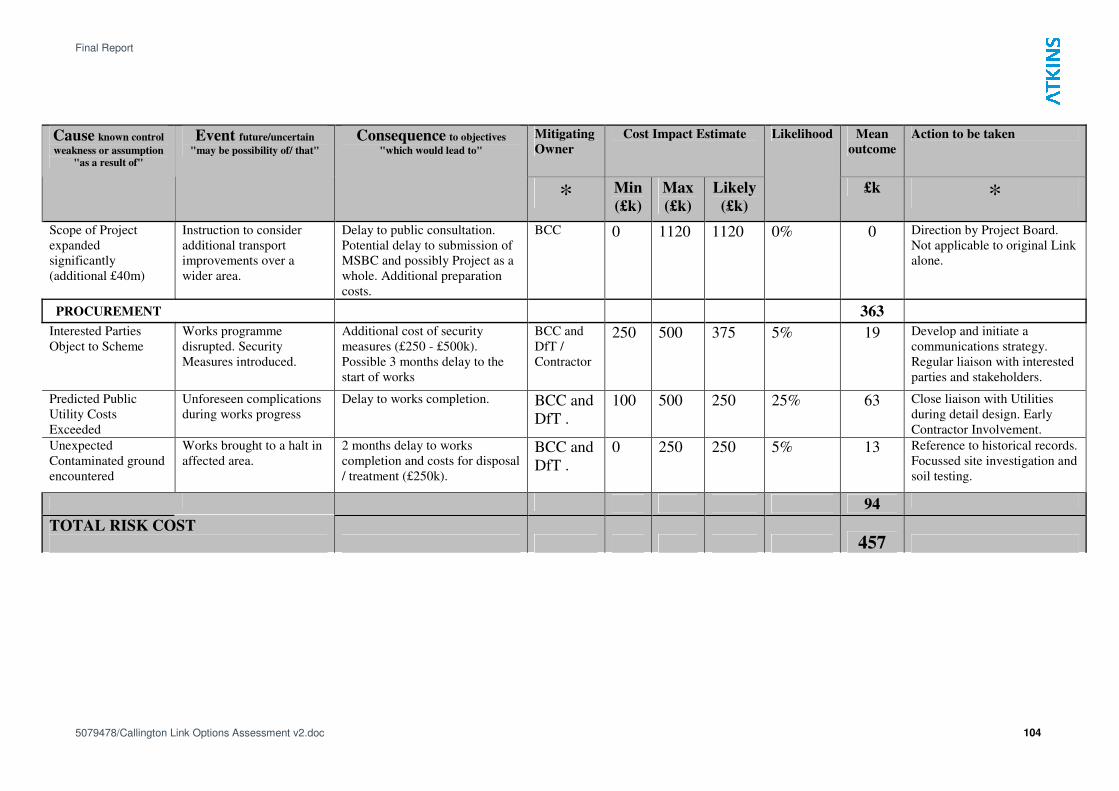
Final Report
5079478/Callington Link Options Assessment v2.doc 104
Mitigating
Owner
Cost Impact Estimate Mean
outcome
Action to be taken Cause known control
weakness or assumption
"as a result of"
Event future/uncertain
"may be possibility of/ that" Consequence to objectives
"which would lead to"
* Min
(£k)
Max
(£k)
Likely
(£k)
Likelihood
£k *
Scope of Project
expanded
significantly
(additional £40m)
Instruction to consider
additional transport
improvements over a
wider area.
Delay to public consultation.
Potential delay to submission of
MSBC and possibly Project as a
whole. Additional preparation
costs.
BCC 0 1120 1120 0% 0 Direction by Project Board.
Not applicable to original Link
alone.
PROCUREMENT 363
Interested Parties
Object to Scheme
Works programme
disrupted. Security
Measures introduced.
Additional cost of security
measures (£250 - £500k).
Possible 3 months delay to the
start of works
BCC and
DfT /
Contractor
250 500 375 5% 19 Develop and initiate a
communications strategy.
Regular liaison with interested
parties and stakeholders.
Predicted Public
Utility Costs
Exceeded
Unforeseen complications
during works progress
Delay to works completion. BCC and
DfT .
100 500 250 25% 63 Close liaison with Utilities
during detail design. Early
Contractor Involvement.
Unexpected
Contaminated ground
encountered
Works brought to a halt in
affected area.
2 months delay to works
completion and costs for disposal
/ treatment (£250k).
BCC and
DfT .
0 250 250 5% 13 Reference to historical records.
Focussed site investigation and
soil testing.
94
TOTAL RISK COST
457
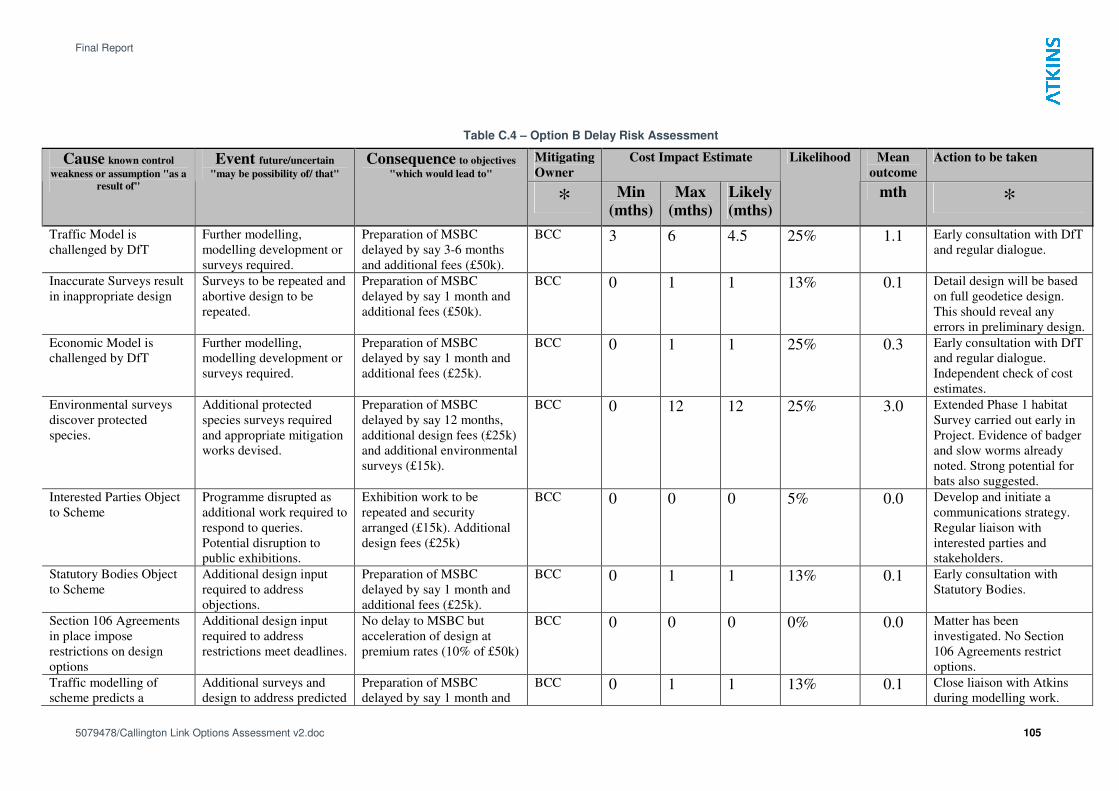
Final Report
5079478/Callington Link Options Assessment v2.doc 105
Table C.4 – Option B Delay Risk Assessment
Mitigating
Owner
Cost Impact Estimate Mean
outcome
Action to be taken Cause known control
weakness or assumption "as a
result of"
Event future/uncertain
"may be possibility of/ that" Consequence to objectives
"which would lead to"
* Min
(mths)
Max
(mths)
Likely
(mths)
Likelihood
mth *
Traffic Model is
challenged by DfT
Further modelling,
modelling development or
surveys required.
Preparation of MSBC
delayed by say 3-6 months
and additional fees (£50k).
BCC 3 6 4.5 25% 1.1 Early consultation with DfT
and regular dialogue.
Inaccurate Surveys result
in inappropriate design
Surveys to be repeated and
abortive design to be
repeated.
Preparation of MSBC
delayed by say 1 month and
additional fees (£50k).
BCC 0 1 1 13% 0.1 Detail design will be based
on full geodetice design.
This should reveal any
errors in preliminary design.
Economic Model is
challenged by DfT
Further modelling,
modelling development or
surveys required.
Preparation of MSBC
delayed by say 1 month and
additional fees (£25k).
BCC 0 1 1 25% 0.3 Early consultation with DfT
and regular dialogue.
Independent check of cost
estimates.
Environmental surveys
discover protected
species.
Additional protected
species surveys required
and appropriate mitigation
works devised.
Preparation of MSBC
delayed by say 12 months,
additional design fees (£25k)
and additional environmental
surveys (£15k).
BCC 0 12 12 25% 3.0 Extended Phase 1 habitat
Survey carried out early in
Project. Evidence of badger
and slow worms already
noted. Strong potential for
bats also suggested.
Interested Parties Object
to Scheme
Programme disrupted as
additional work required to
respond to queries.
Potential disruption to
public exhibitions.
Exhibition work to be
repeated and security
arranged (£15k). Additional
design fees (£25k)
BCC 0 0 0 5% 0.0 Develop and initiate a
communications strategy.
Regular liaison with
interested parties and
stakeholders.
Statutory Bodies Object
to Scheme
Additional design input
required to address
objections.
Preparation of MSBC
delayed by say 1 month and
additional fees (£25k).
BCC 0 1 1 13% 0.1 Early consultation with
Statutory Bodies.
Section 106 Agreements
in place impose
restrictions on design
options
Additional design input
required to address
restrictions meet deadlines.
No delay to MSBC but
acceleration of design at
premium rates (10% of £50k)
BCC 0 0 0 0% 0.0 Matter has been
investigated. No Section
106 Agreements restrict
options.
Traffic modelling of
scheme predicts a
Additional surveys and
design to address predicted
Preparation of MSBC
delayed by say 1 month and
BCC 0 1 1 13% 0.1 Close liaison with Atkins
during modelling work.
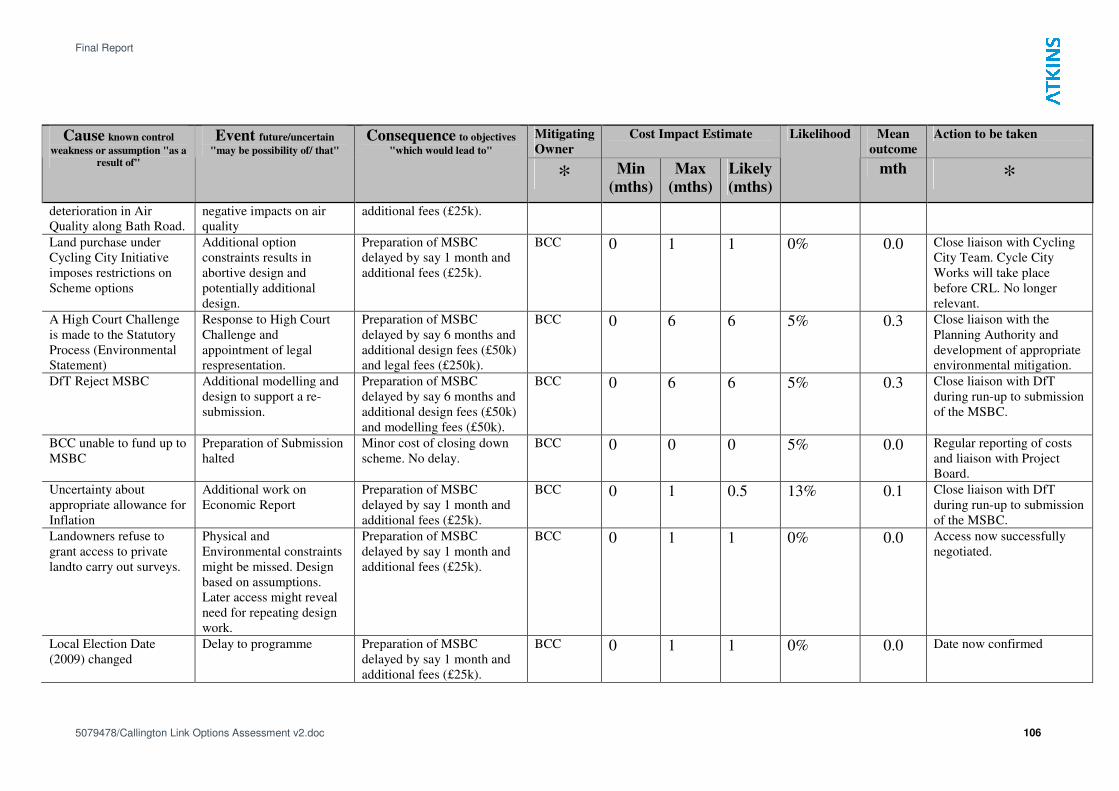
Final Report
5079478/Callington Link Options Assessment v2.doc 106
Mitigating
Owner
Cost Impact Estimate Mean
outcome
Action to be taken Cause known control
weakness or assumption "as a
result of"
Event future/uncertain
"may be possibility of/ that" Consequence to objectives
"which would lead to"
* Min
(mths)
Max
(mths)
Likely
(mths)
Likelihood
mth *
deterioration in Air
Quality along Bath Road.
negative impacts on air
quality
additional fees (£25k).
Land purchase under
Cycling City Initiative
imposes restrictions on
Scheme options
Additional option
constraints results in
abortive design and
potentially additional
design.
Preparation of MSBC
delayed by say 1 month and
additional fees (£25k).
BCC 0 1 1 0% 0.0 Close liaison with Cycling
City Team. Cycle City
Works will take place
before CRL. No longer
relevant.
A High Court Challenge
is made to the Statutory
Process (Environmental
Statement)
Response to High Court
Challenge and
appointment of legal
respresentation.
Preparation of MSBC
delayed by say 6 months and
additional design fees (£50k)
and legal fees (£250k).
BCC 0 6 6 5% 0.3 Close liaison with the
Planning Authority and
development of appropriate
environmental mitigation.
DfT Reject MSBC Additional modelling and
design to support a re-
submission.
Preparation of MSBC
delayed by say 6 months and
additional design fees (£50k)
and modelling fees (£50k).
BCC 0 6 6 5% 0.3 Close liaison with DfT
during run-up to submission
of the MSBC.
BCC unable to fund up to
MSBC
Preparation of Submission
halted
Minor cost of closing down
scheme. No delay.
BCC 0 0 0 5% 0.0 Regular reporting of costs
and liaison with Project
Board.
Uncertainty about
appropriate allowance for
Inflation
Additional work on
Economic Report
Preparation of MSBC
delayed by say 1 month and
additional fees (£25k).
BCC 0 1 0.5 13% 0.1 Close liaison with DfT
during run-up to submission
of the MSBC.
Landowners refuse to
grant access to private
landto carry out surveys.
Physical and
Environmental constraints
might be missed. Design
based on assumptions.
Later access might reveal
need for repeating design
work.
Preparation of MSBC
delayed by say 1 month and
additional fees (£25k).
BCC 0 1 1 0% 0.0 Access now successfully
negotiated.
Local Election Date
(2009) changed
Delay to programme Preparation of MSBC
delayed by say 1 month and
additional fees (£25k).
BCC 0 1 1 0% 0.0 Date now confirmed
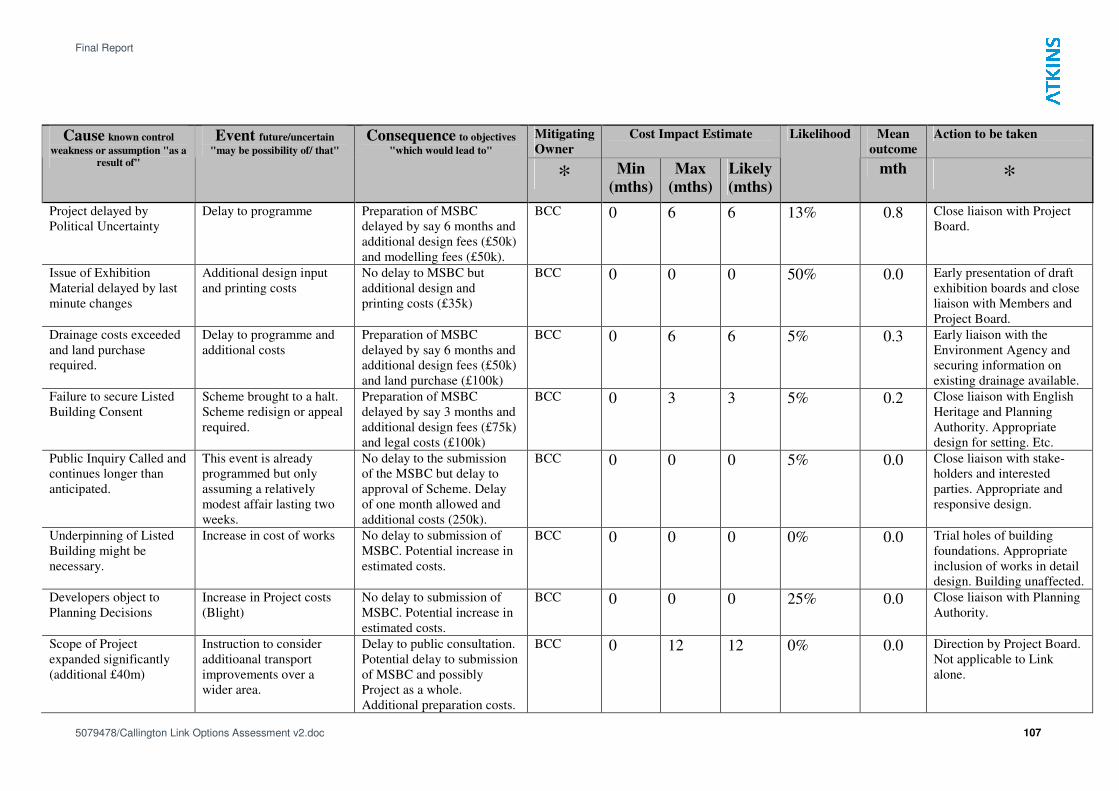
Final Report
5079478/Callington Link Options Assessment v2.doc 107
Mitigating
Owner
Cost Impact Estimate Mean
outcome
Action to be taken Cause known control
weakness or assumption "as a
result of"
Event future/uncertain
"may be possibility of/ that" Consequence to objectives
"which would lead to"
* Min
(mths)
Max
(mths)
Likely
(mths)
Likelihood
mth *
Project delayed by
Political Uncertainty
Delay to programme Preparation of MSBC
delayed by say 6 months and
additional design fees (£50k)
and modelling fees (£50k).
BCC 0 6 6 13% 0.8 Close liaison with Project
Board.
Issue of Exhibition
Material delayed by last
minute changes
Additional design input
and printing costs
No delay to MSBC but
additional design and
printing costs (£35k)
BCC 0 0 0 50% 0.0 Early presentation of draft
exhibition boards and close
liaison with Members and
Project Board.
Drainage costs exceeded
and land purchase
required.
Delay to programme and
additional costs
Preparation of MSBC
delayed by say 6 months and
additional design fees (£50k)
and land purchase (£100k)
BCC 0 6 6 5% 0.3 Early liaison with the
Environment Agency and
securing information on
existing drainage available.
Failure to secure Listed
Building Consent
Scheme brought to a halt.
Scheme redisign or appeal
required.
Preparation of MSBC
delayed by say 3 months and
additional design fees (£75k)
and legal costs (£100k)
BCC 0 3 3 5% 0.2 Close liaison with English
Heritage and Planning
Authority. Appropriate
design for setting. Etc.
Public Inquiry Called and
continues longer than
anticipated.
This event is already
programmed but only
assuming a relatively
modest affair lasting two
weeks.
No delay to the submission
of the MSBC but delay to
approval of Scheme. Delay
of one month allowed and
additional costs (250k).
BCC 0 0 0 5% 0.0 Close liaison with stake-
holders and interested
parties. Appropriate and
responsive design.
Underpinning of Listed
Building might be
necessary.
Increase in cost of works No delay to submission of
MSBC. Potential increase in
estimated costs.
BCC 0 0 0 0% 0.0 Trial holes of building
foundations. Appropriate
inclusion of works in detail
design. Building unaffected.
Developers object to
Planning Decisions
Increase in Project costs
(Blight)
No delay to submission of
MSBC. Potential increase in
estimated costs.
BCC 0 0 0 25% 0.0 Close liaison with Planning
Authority.
Scope of Project
expanded significantly
(additional £40m)
Instruction to consider
additioanal transport
improvements over a
wider area.
Delay to public consultation.
Potential delay to submission
of MSBC and possibly
Project as a whole.
Additional preparation costs.
BCC 0 12 12 0% 0.0 Direction by Project Board.
Not applicable to Link
alone.
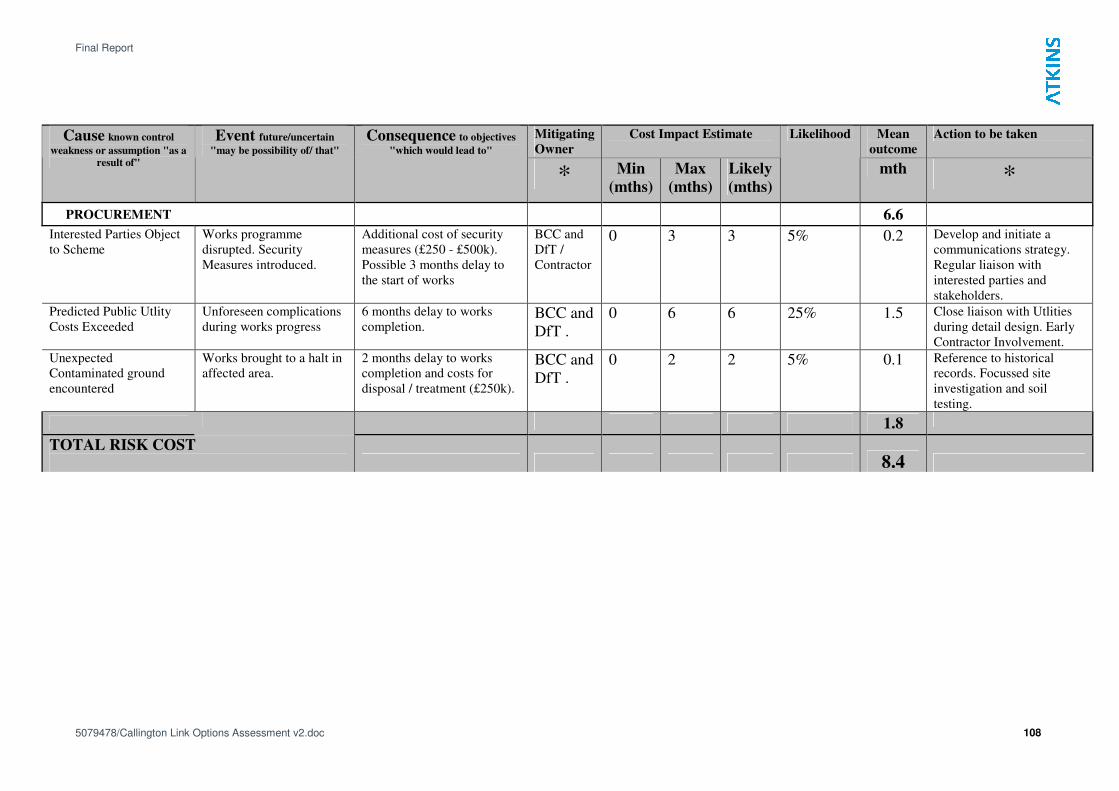
Final Report
5079478/Callington Link Options Assessment v2.doc 108
Mitigating
Owner
Cost Impact Estimate Mean
outcome
Action to be taken Cause known control
weakness or assumption "as a
result of"
Event future/uncertain
"may be possibility of/ that" Consequence to objectives
"which would lead to"
* Min
(mths)
Max
(mths)
Likely
(mths)
Likelihood
mth *
PROCUREMENT 6.6
Interested Parties Object
to Scheme
Works programme
disrupted. Security
Measures introduced.
Additional cost of security
measures (£250 - £500k).
Possible 3 months delay to
the start of works
BCC and
DfT /
Contractor
0 3 3 5% 0.2 Develop and initiate a
communications strategy.
Regular liaison with
interested parties and
stakeholders.
Predicted Public Utlity
Costs Exceeded
Unforeseen complications
during works progress
6 months delay to works
completion. BCC and
DfT .
0 6 6 25% 1.5 Close liaison with Utlities
during detail design. Early
Contractor Involvement.
Unexpected
Contaminated ground
encountered
Works brought to a halt in
affected area.
2 months delay to works
completion and costs for
disposal / treatment (£250k).
BCC and
DfT .
0 2 2 5% 0.1 Reference to historical
records. Focussed site
investigation and soil
testing.
1.8
TOTAL RISK COST
8.4
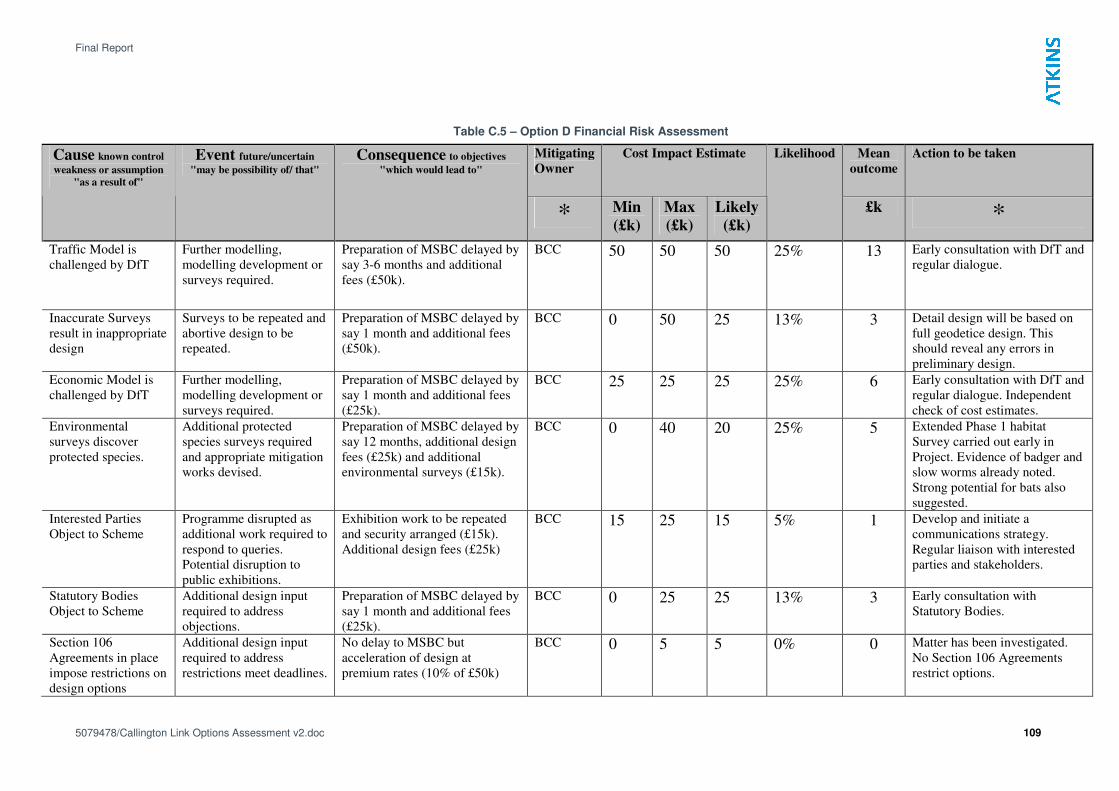
Final Report
5079478/Callington Link Options Assessment v2.doc 109
Table C.5 – Option D Financial Risk Assessment
Mitigating
Owner
Cost Impact Estimate Mean
outcome
Action to be taken Cause known control
weakness or assumption
"as a result of"
Event future/uncertain
"may be possibility of/ that" Consequence to objectives
"which would lead to"
* Min
(£k)
Max
(£k)
Likely
(£k)
Likelihood
£k *
Traffic Model is
challenged by DfT
Further modelling,
modelling development or
surveys required.
Preparation of MSBC delayed by
say 3-6 months and additional
fees (£50k).
BCC 50 50 50 25% 13 Early consultation with DfT and
regular dialogue.
Inaccurate Surveys
result in inappropriate
design
Surveys to be repeated and
abortive design to be
repeated.
Preparation of MSBC delayed by
say 1 month and additional fees
(£50k).
BCC 0 50 25 13% 3 Detail design will be based on
full geodetice design. This
should reveal any errors in
preliminary design.
Economic Model is
challenged by DfT
Further modelling,
modelling development or
surveys required.
Preparation of MSBC delayed by
say 1 month and additional fees
(£25k).
BCC 25 25 25 25% 6 Early consultation with DfT and
regular dialogue. Independent
check of cost estimates.
Environmental
surveys discover
protected species.
Additional protected
species surveys required
and appropriate mitigation
works devised.
Preparation of MSBC delayed by
say 12 months, additional design
fees (£25k) and additional
environmental surveys (£15k).
BCC 0 40 20 25% 5 Extended Phase 1 habitat
Survey carried out early in
Project. Evidence of badger and
slow worms already noted.
Strong potential for bats also
suggested.
Interested Parties
Object to Scheme
Programme disrupted as
additional work required to
respond to queries.
Potential disruption to
public exhibitions.
Exhibition work to be repeated
and security arranged (£15k).
Additional design fees (£25k)
BCC 15 25 15 5% 1 Develop and initiate a
communications strategy.
Regular liaison with interested
parties and stakeholders.
Statutory Bodies
Object to Scheme
Additional design input
required to address
objections.
Preparation of MSBC delayed by
say 1 month and additional fees
(£25k).
BCC 0 25 25 13% 3 Early consultation with
Statutory Bodies.
Section 106
Agreements in place
impose restrictions on
design options
Additional design input
required to address
restrictions meet deadlines.
No delay to MSBC but
acceleration of design at
premium rates (10% of £50k)
BCC 0 5 5 0% 0 Matter has been investigated.
No Section 106 Agreements
restrict options.

Final Report
5079478/Callington Link Options Assessment v2.doc 110
Mitigating
Owner
Cost Impact Estimate Mean
outcome
Action to be taken Cause known control
weakness or assumption
"as a result of"
Event future/uncertain
"may be possibility of/ that" Consequence to objectives
"which would lead to"
* Min
(£k)
Max
(£k)
Likely
(£k)
Likelihood
£k *
Traffic modelling of
scheme predicts a
deterioration in Air
Quality along Bath
Road.
Additional surveys and
design to address predicted
negative impacts on air
quality
Preparation of MSBC delayed by
say 1 month and additional fees
(£25k).
BCC 0 25 12.5 13% 2 Close liaison with Atkins during
modelling work.
Land purchase under
Cycling City
Initiative imposes
restrictions on
Scheme options
Additional option
constraints results in
abortive design and
potentially additional
design.
Preparation of MSBC delayed by
say 1 month and additional fees
(£25k).
BCC 0 25 12.5 0% 0 Close liaison with Cycling City
Team. Cycle City Works will
proceed before construction of
Link.
A High Court
Challenge is made to
the Statutory Process
(Environmental
Statement)
Response to High Court
Challenge and
appointment of legal
representation.
Preparation of MSBC delayed by
say 6 months and additional
design fees (£50k) and legal fees
(£250k).
BCC 0 300 300 5% 15 Close liaison with the Planning
Authority and development of
appropriate environmental
mitigation.
DfT Reject MSBC Additional modelling and
design to support a re-
submission.
Preparation of MSBC delayed by
say 6 months and additional
design fees (£50k) and modelling
fees (£50k).
BCC 0 100 100 5% 5 Close liaison with DfT during
run-up to submission of the
MSBC.
BCC unable to fund
up to MSBC
Preparation of Submission
halted
Minor cost of closing down
scheme. No delay.
BCC 0 15 15 5% 1 Regular reporting of costs and
liaison with Project Board.
Uncertainty about
appropriate allowance
for Inflation
Additional work on
Economic Report
Preparation of MSBC delayed by
say 1 month and additional fees
(£25k).
BCC 0 25 12.5 13% 2 Close liaison with DfT during
run-up to submission of the
MSBC.
Landowners refuse to
grant access to private
land to carry out
surveys.
Physical and
Environmental constraints
might be missed. Design
based on assumptions.
Later access might reveal
need for repeating design
work.
Preparation of MSBC delayed by
say 1 month and additional fees
(£25k).
BCC 0 25 12.5 0% 0 Access now successfully
negotiated.
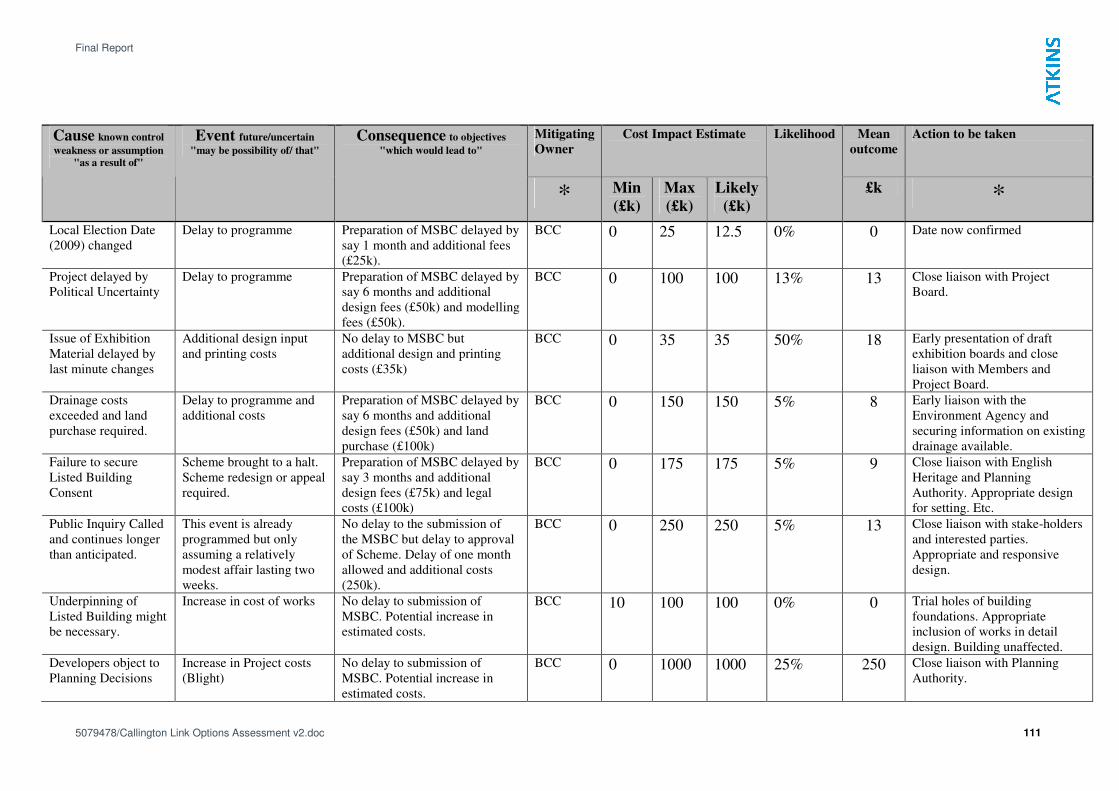
Final Report
5079478/Callington Link Options Assessment v2.doc 111
Mitigating
Owner
Cost Impact Estimate Mean
outcome
Action to be taken Cause known control
weakness or assumption
"as a result of"
Event future/uncertain
"may be possibility of/ that" Consequence to objectives
"which would lead to"
* Min
(£k)
Max
(£k)
Likely
(£k)
Likelihood
£k *
Local Election Date
(2009) changed
Delay to programme Preparation of MSBC delayed by
say 1 month and additional fees
(£25k).
BCC 0 25 12.5 0% 0 Date now confirmed
Project delayed by
Political Uncertainty
Delay to programme Preparation of MSBC delayed by
say 6 months and additional
design fees (£50k) and modelling
fees (£50k).
BCC 0 100 100 13% 13 Close liaison with Project
Board.
Issue of Exhibition
Material delayed by
last minute changes
Additional design input
and printing costs
No delay to MSBC but
additional design and printing
costs (£35k)
BCC 0 35 35 50% 18 Early presentation of draft
exhibition boards and close
liaison with Members and
Project Board.
Drainage costs
exceeded and land
purchase required.
Delay to programme and
additional costs
Preparation of MSBC delayed by
say 6 months and additional
design fees (£50k) and land
purchase (£100k)
BCC 0 150 150 5% 8 Early liaison with the
Environment Agency and
securing information on existing
drainage available.
Failure to secure
Listed Building
Consent
Scheme brought to a halt.
Scheme redesign or appeal
required.
Preparation of MSBC delayed by
say 3 months and additional
design fees (£75k) and legal
costs (£100k)
BCC 0 175 175 5% 9 Close liaison with English
Heritage and Planning
Authority. Appropriate design
for setting. Etc.
Public Inquiry Called
and continues longer
than anticipated.
This event is already
programmed but only
assuming a relatively
modest affair lasting two
weeks.
No delay to the submission of
the MSBC but delay to approval
of Scheme. Delay of one month
allowed and additional costs
(250k).
BCC 0 250 250 5% 13 Close liaison with stake-holders
and interested parties.
Appropriate and responsive
design.
Underpinning of
Listed Building might
be necessary.
Increase in cost of works No delay to submission of
MSBC. Potential increase in
estimated costs.
BCC 10 100 100 0% 0 Trial holes of building
foundations. Appropriate
inclusion of works in detail
design. Building unaffected.
Developers object to
Planning Decisions
Increase in Project costs
(Blight)
No delay to submission of
MSBC. Potential increase in
estimated costs.
BCC 0 1000 1000 25% 250 Close liaison with Planning
Authority.
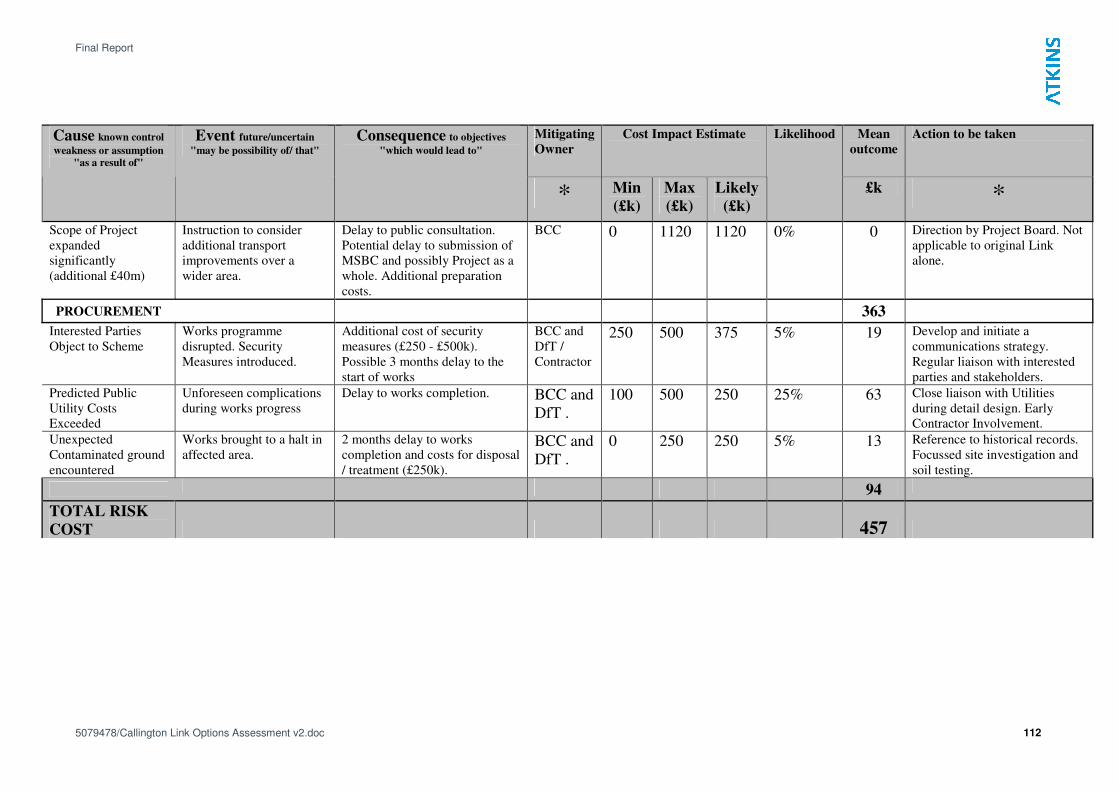
Final Report
5079478/Callington Link Options Assessment v2.doc 112
Mitigating
Owner
Cost Impact Estimate Mean
outcome
Action to be taken Cause known control
weakness or assumption
"as a result of"
Event future/uncertain
"may be possibility of/ that" Consequence to objectives
"which would lead to"
* Min
(£k)
Max
(£k)
Likely
(£k)
Likelihood
£k *
Scope of Project
expanded
significantly
(additional £40m)
Instruction to consider
additional transport
improvements over a
wider area.
Delay to public consultation.
Potential delay to submission of
MSBC and possibly Project as a
whole. Additional preparation
costs.
BCC 0 1120 1120 0% 0 Direction by Project Board. Not
applicable to original Link
alone.
PROCUREMENT 363
Interested Parties
Object to Scheme
Works programme
disrupted. Security
Measures introduced.
Additional cost of security
measures (£250 - £500k).
Possible 3 months delay to the
start of works
BCC and
DfT /
Contractor
250 500 375 5% 19 Develop and initiate a
communications strategy.
Regular liaison with interested
parties and stakeholders.
Predicted Public
Utility Costs
Exceeded
Unforeseen complications
during works progress
Delay to works completion. BCC and
DfT .
100 500 250 25% 63 Close liaison with Utilities
during detail design. Early
Contractor Involvement.
Unexpected
Contaminated ground
encountered
Works brought to a halt in
affected area.
2 months delay to works
completion and costs for disposal
/ treatment (£250k).
BCC and
DfT .
0 250 250 5% 13 Reference to historical records.
Focussed site investigation and
soil testing.
94
TOTAL RISK
COST 457
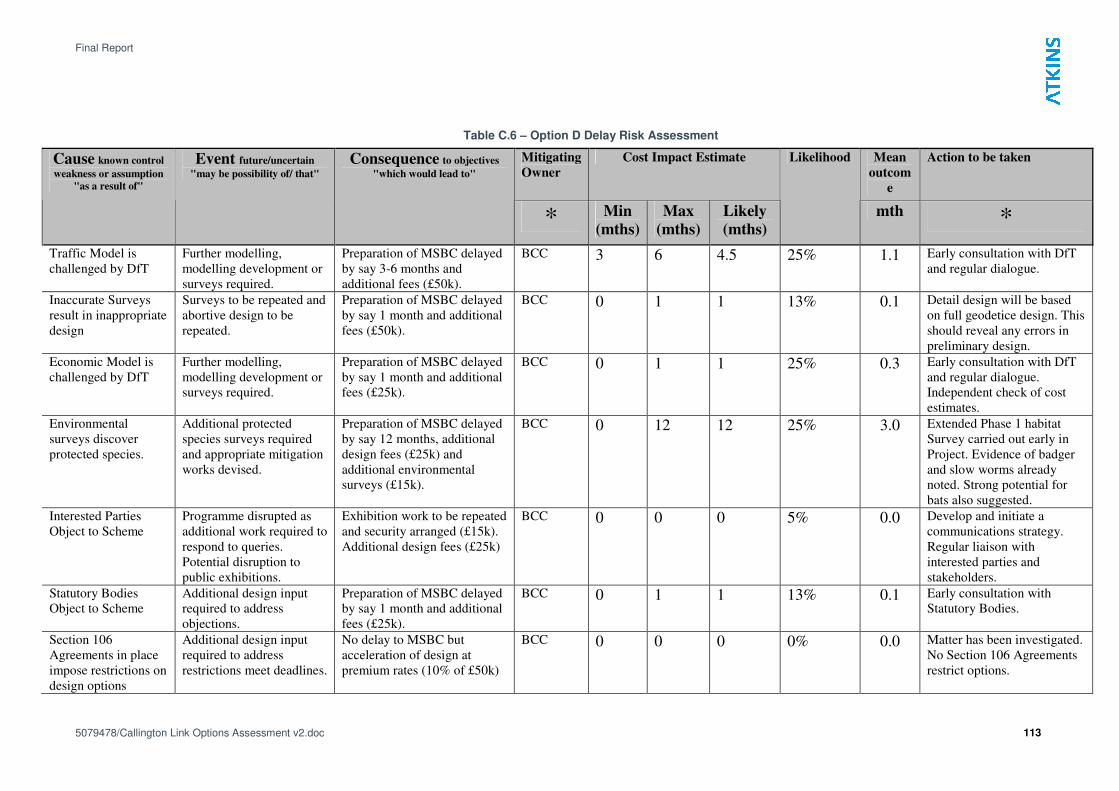
Final Report
5079478/Callington Link Options Assessment v2.doc 113
Table C.6 – Option D Delay Risk Assessment
Mitigating
Owner
Cost Impact Estimate Mean
outcom
e
Action to be taken Cause known control
weakness or assumption
"as a result of"
Event future/uncertain
"may be possibility of/ that" Consequence to objectives
"which would lead to"
* Min
(mths)
Max
(mths)
Likely
(mths)
Likelihood
mth *
Traffic Model is
challenged by DfT
Further modelling,
modelling development or
surveys required.
Preparation of MSBC delayed
by say 3-6 months and
additional fees (£50k).
BCC 3 6 4.5 25% 1.1 Early consultation with DfT
and regular dialogue.
Inaccurate Surveys
result in inappropriate
design
Surveys to be repeated and
abortive design to be
repeated.
Preparation of MSBC delayed
by say 1 month and additional
fees (£50k).
BCC 0 1 1 13% 0.1 Detail design will be based
on full geodetice design. This
should reveal any errors in
preliminary design.
Economic Model is
challenged by DfT
Further modelling,
modelling development or
surveys required.
Preparation of MSBC delayed
by say 1 month and additional
fees (£25k).
BCC 0 1 1 25% 0.3 Early consultation with DfT
and regular dialogue.
Independent check of cost
estimates.
Environmental
surveys discover
protected species.
Additional protected
species surveys required
and appropriate mitigation
works devised.
Preparation of MSBC delayed
by say 12 months, additional
design fees (£25k) and
additional environmental
surveys (£15k).
BCC 0 12 12 25% 3.0 Extended Phase 1 habitat
Survey carried out early in
Project. Evidence of badger
and slow worms already
noted. Strong potential for
bats also suggested.
Interested Parties
Object to Scheme
Programme disrupted as
additional work required to
respond to queries.
Potential disruption to
public exhibitions.
Exhibition work to be repeated
and security arranged (£15k).
Additional design fees (£25k)
BCC 0 0 0 5% 0.0 Develop and initiate a
communications strategy.
Regular liaison with
interested parties and
stakeholders.
Statutory Bodies
Object to Scheme
Additional design input
required to address
objections.
Preparation of MSBC delayed
by say 1 month and additional
fees (£25k).
BCC 0 1 1 13% 0.1 Early consultation with
Statutory Bodies.
Section 106
Agreements in place
impose restrictions on
design options
Additional design input
required to address
restrictions meet deadlines.
No delay to MSBC but
acceleration of design at
premium rates (10% of £50k)
BCC 0 0 0 0% 0.0 Matter has been investigated.
No Section 106 Agreements
restrict options.
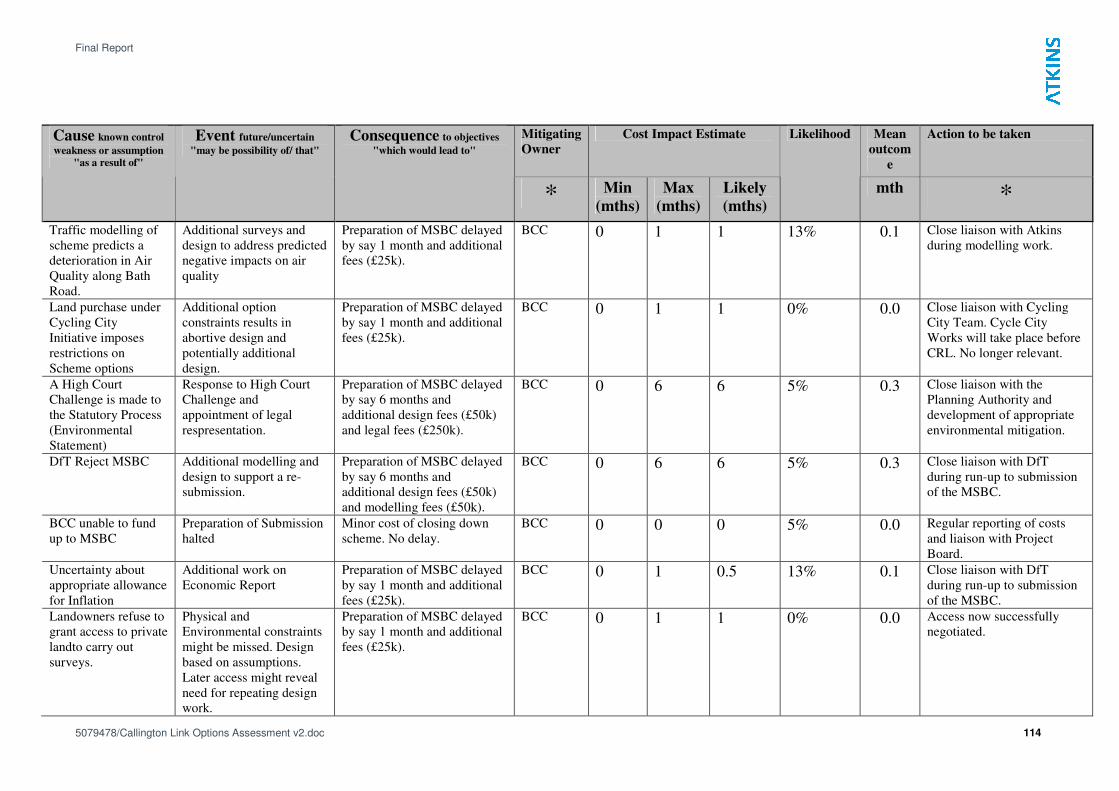
Final Report
5079478/Callington Link Options Assessment v2.doc 114
Mitigating
Owner
Cost Impact Estimate Mean
outcom
e
Action to be taken Cause known control
weakness or assumption
"as a result of"
Event future/uncertain
"may be possibility of/ that" Consequence to objectives
"which would lead to"
* Min
(mths)
Max
(mths)
Likely
(mths)
Likelihood
mth *
Traffic modelling of
scheme predicts a
deterioration in Air
Quality along Bath
Road.
Additional surveys and
design to address predicted
negative impacts on air
quality
Preparation of MSBC delayed
by say 1 month and additional
fees (£25k).
BCC 0 1 1 13% 0.1 Close liaison with Atkins
during modelling work.
Land purchase under
Cycling City
Initiative imposes
restrictions on
Scheme options
Additional option
constraints results in
abortive design and
potentially additional
design.
Preparation of MSBC delayed
by say 1 month and additional
fees (£25k).
BCC 0 1 1 0% 0.0 Close liaison with Cycling
City Team. Cycle City
Works will take place before
CRL. No longer relevant.
A High Court
Challenge is made to
the Statutory Process
(Environmental
Statement)
Response to High Court
Challenge and
appointment of legal
respresentation.
Preparation of MSBC delayed
by say 6 months and
additional design fees (£50k)
and legal fees (£250k).
BCC 0 6 6 5% 0.3 Close liaison with the
Planning Authority and
development of appropriate
environmental mitigation.
DfT Reject MSBC Additional modelling and
design to support a re-
submission.
Preparation of MSBC delayed
by say 6 months and
additional design fees (£50k)
and modelling fees (£50k).
BCC 0 6 6 5% 0.3 Close liaison with DfT
during run-up to submission
of the MSBC.
BCC unable to fund
up to MSBC
Preparation of Submission
halted
Minor cost of closing down
scheme. No delay.
BCC 0 0 0 5% 0.0 Regular reporting of costs
and liaison with Project
Board.
Uncertainty about
appropriate allowance
for Inflation
Additional work on
Economic Report
Preparation of MSBC delayed
by say 1 month and additional
fees (£25k).
BCC 0 1 0.5 13% 0.1 Close liaison with DfT
during run-up to submission
of the MSBC.
Landowners refuse to
grant access to private
landto carry out
surveys.
Physical and
Environmental constraints
might be missed. Design
based on assumptions.
Later access might reveal
need for repeating design
work.
Preparation of MSBC delayed
by say 1 month and additional
fees (£25k).
BCC 0 1 1 0% 0.0 Access now successfully
negotiated.
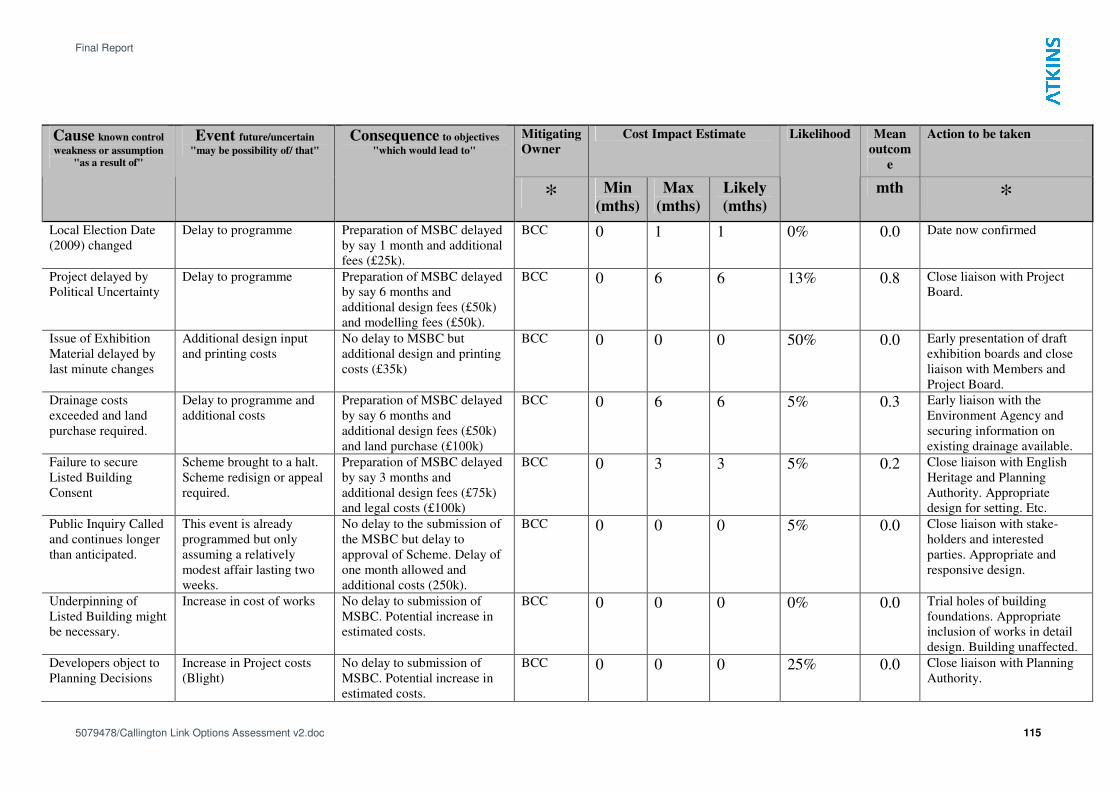
Final Report
5079478/Callington Link Options Assessment v2.doc 115
Mitigating
Owner
Cost Impact Estimate Mean
outcom
e
Action to be taken Cause known control
weakness or assumption
"as a result of"
Event future/uncertain
"may be possibility of/ that" Consequence to objectives
"which would lead to"
* Min
(mths)
Max
(mths)
Likely
(mths)
Likelihood
mth *
Local Election Date
(2009) changed
Delay to programme Preparation of MSBC delayed
by say 1 month and additional
fees (£25k).
BCC 0 1 1 0% 0.0 Date now confirmed
Project delayed by
Political Uncertainty
Delay to programme Preparation of MSBC delayed
by say 6 months and
additional design fees (£50k)
and modelling fees (£50k).
BCC 0 6 6 13% 0.8 Close liaison with Project
Board.
Issue of Exhibition
Material delayed by
last minute changes
Additional design input
and printing costs
No delay to MSBC but
additional design and printing
costs (£35k)
BCC 0 0 0 50% 0.0 Early presentation of draft
exhibition boards and close
liaison with Members and
Project Board.
Drainage costs
exceeded and land
purchase required.
Delay to programme and
additional costs
Preparation of MSBC delayed
by say 6 months and
additional design fees (£50k)
and land purchase (£100k)
BCC 0 6 6 5% 0.3 Early liaison with the
Environment Agency and
securing information on
existing drainage available.
Failure to secure
Listed Building
Consent
Scheme brought to a halt.
Scheme redisign or appeal
required.
Preparation of MSBC delayed
by say 3 months and
additional design fees (£75k)
and legal costs (£100k)
BCC 0 3 3 5% 0.2 Close liaison with English
Heritage and Planning
Authority. Appropriate
design for setting. Etc.
Public Inquiry Called
and continues longer
than anticipated.
This event is already
programmed but only
assuming a relatively
modest affair lasting two
weeks.
No delay to the submission of
the MSBC but delay to
approval of Scheme. Delay of
one month allowed and
additional costs (250k).
BCC 0 0 0 5% 0.0 Close liaison with stake-
holders and interested
parties. Appropriate and
responsive design.
Underpinning of
Listed Building might
be necessary.
Increase in cost of works No delay to submission of
MSBC. Potential increase in
estimated costs.
BCC 0 0 0 0% 0.0 Trial holes of building
foundations. Appropriate
inclusion of works in detail
design. Building unaffected.
Developers object to
Planning Decisions
Increase in Project costs
(Blight)
No delay to submission of
MSBC. Potential increase in
estimated costs.
BCC 0 0 0 25% 0.0 Close liaison with Planning
Authority.
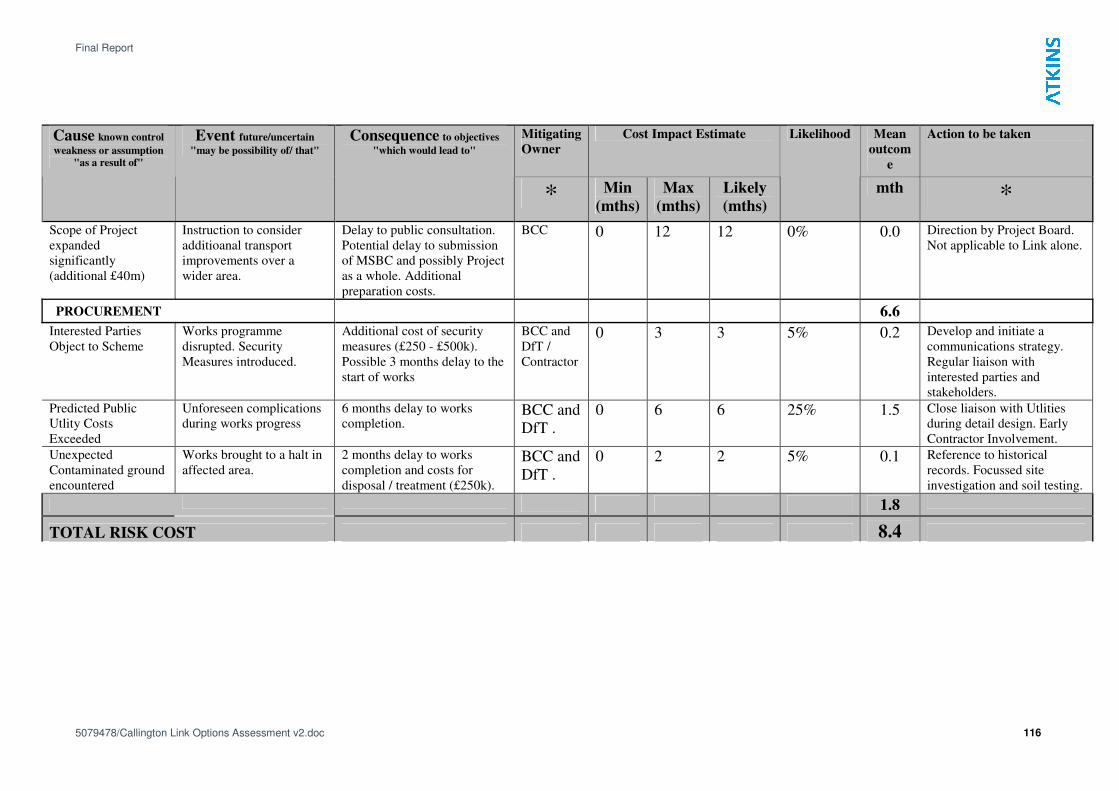
Final Report
5079478/Callington Link Options Assessment v2.doc 116
Mitigating
Owner
Cost Impact Estimate Mean
outcom
e
Action to be taken Cause known control
weakness or assumption
"as a result of"
Event future/uncertain
"may be possibility of/ that" Consequence to objectives
"which would lead to"
* Min
(mths)
Max
(mths)
Likely
(mths)
Likelihood
mth *
Scope of Project
expanded
significantly
(additional £40m)
Instruction to consider
additioanal transport
improvements over a
wider area.
Delay to public consultation.
Potential delay to submission
of MSBC and possibly Project
as a whole. Additional
preparation costs.
BCC 0 12 12 0% 0.0 Direction by Project Board.
Not applicable to Link alone.
PROCUREMENT 6.6
Interested Parties
Object to Scheme
Works programme
disrupted. Security
Measures introduced.
Additional cost of security
measures (£250 - £500k).
Possible 3 months delay to the
start of works
BCC and
DfT /
Contractor
0 3 3 5% 0.2 Develop and initiate a
communications strategy.
Regular liaison with
interested parties and
stakeholders.
Predicted Public
Utlity Costs
Exceeded
Unforeseen complications
during works progress
6 months delay to works
completion. BCC and
DfT .
0 6 6 25% 1.5 Close liaison with Utlities
during detail design. Early
Contractor Involvement.
Unexpected
Contaminated ground
encountered
Works brought to a halt in
affected area.
2 months delay to works
completion and costs for
disposal / treatment (£250k).
BCC and
DfT .
0 2 2 5% 0.1 Reference to historical
records. Focussed site
investigation and soil testing.
1.8
TOTAL RISK COST 8.4
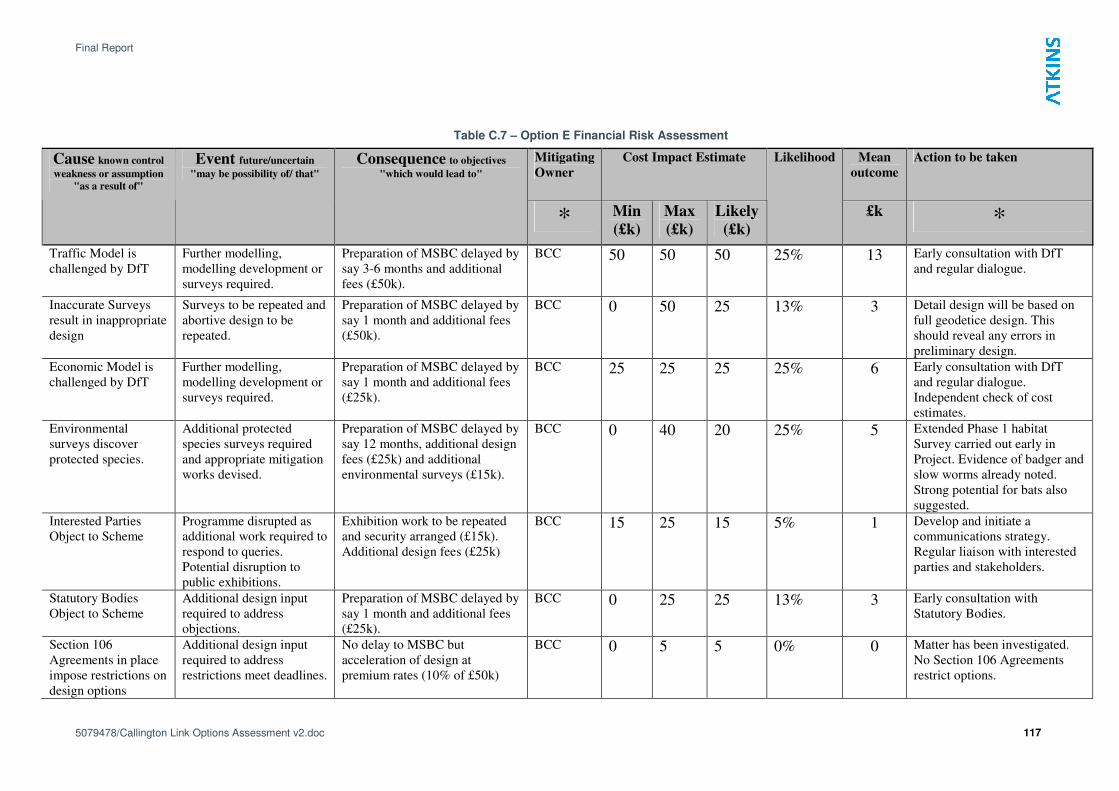
Final Report
5079478/Callington Link Options Assessment v2.doc 117
Table C.7 – Option E Financial Risk Assessment
Mitigating
Owner
Cost Impact Estimate Mean
outcome
Action to be taken Cause known control
weakness or assumption
"as a result of"
Event future/uncertain
"may be possibility of/ that" Consequence to objectives
"which would lead to"
* Min
(£k)
Max
(£k)
Likely
(£k)
Likelihood
£k *
Traffic Model is
challenged by DfT
Further modelling,
modelling development or
surveys required.
Preparation of MSBC delayed by
say 3-6 months and additional
fees (£50k).
BCC 50 50 50 25% 13 Early consultation with DfT
and regular dialogue.
Inaccurate Surveys
result in inappropriate
design
Surveys to be repeated and
abortive design to be
repeated.
Preparation of MSBC delayed by
say 1 month and additional fees
(£50k).
BCC 0 50 25 13% 3 Detail design will be based on
full geodetice design. This
should reveal any errors in
preliminary design.
Economic Model is
challenged by DfT
Further modelling,
modelling development or
surveys required.
Preparation of MSBC delayed by
say 1 month and additional fees
(£25k).
BCC 25 25 25 25% 6 Early consultation with DfT
and regular dialogue.
Independent check of cost
estimates.
Environmental
surveys discover
protected species.
Additional protected
species surveys required
and appropriate mitigation
works devised.
Preparation of MSBC delayed by
say 12 months, additional design
fees (£25k) and additional
environmental surveys (£15k).
BCC 0 40 20 25% 5 Extended Phase 1 habitat
Survey carried out early in
Project. Evidence of badger and
slow worms already noted.
Strong potential for bats also
suggested.
Interested Parties
Object to Scheme
Programme disrupted as
additional work required to
respond to queries.
Potential disruption to
public exhibitions.
Exhibition work to be repeated
and security arranged (£15k).
Additional design fees (£25k)
BCC 15 25 15 5% 1 Develop and initiate a
communications strategy.
Regular liaison with interested
parties and stakeholders.
Statutory Bodies
Object to Scheme
Additional design input
required to address
objections.
Preparation of MSBC delayed by
say 1 month and additional fees
(£25k).
BCC 0 25 25 13% 3 Early consultation with
Statutory Bodies.
Section 106
Agreements in place
impose restrictions on
design options
Additional design input
required to address
restrictions meet deadlines.
No delay to MSBC but
acceleration of design at
premium rates (10% of £50k)
BCC 0 5 5 0% 0 Matter has been investigated.
No Section 106 Agreements
restrict options.
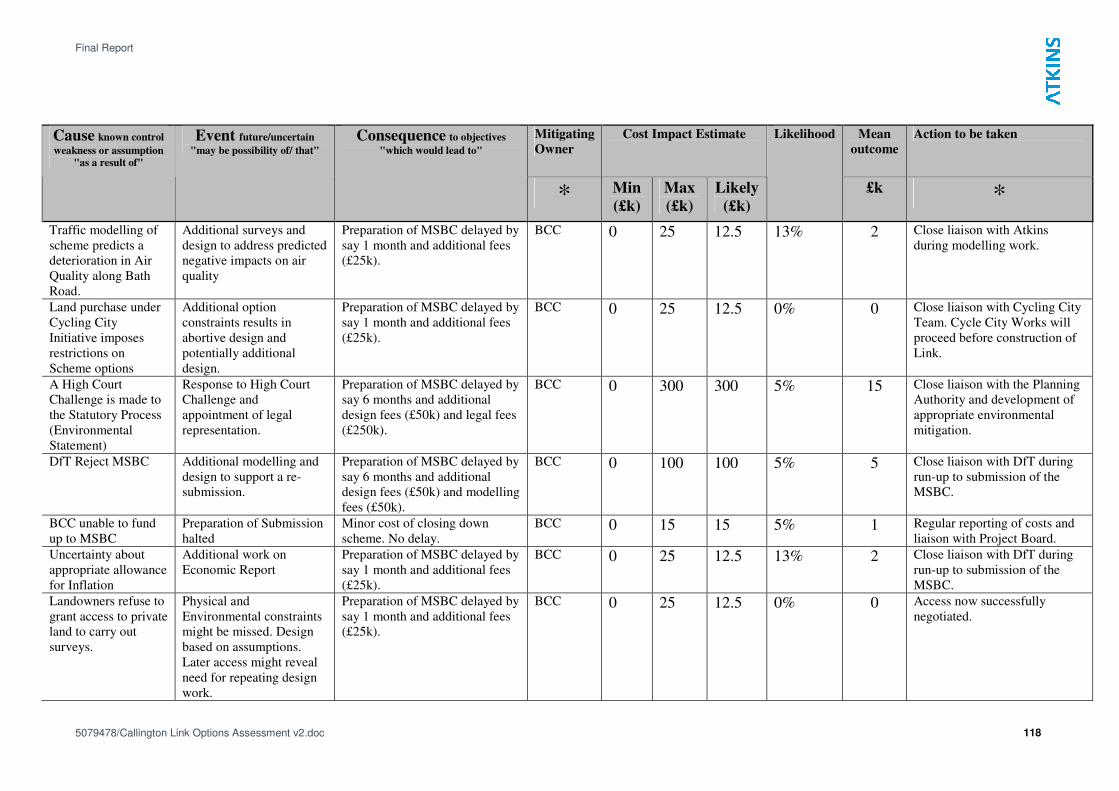
Final Report
5079478/Callington Link Options Assessment v2.doc 118
Mitigating
Owner
Cost Impact Estimate Mean
outcome
Action to be taken Cause known control
weakness or assumption
"as a result of"
Event future/uncertain
"may be possibility of/ that" Consequence to objectives
"which would lead to"
* Min
(£k)
Max
(£k)
Likely
(£k)
Likelihood
£k *
Traffic modelling of
scheme predicts a
deterioration in Air
Quality along Bath
Road.
Additional surveys and
design to address predicted
negative impacts on air
quality
Preparation of MSBC delayed by
say 1 month and additional fees
(£25k).
BCC 0 25 12.5 13% 2 Close liaison with Atkins
during modelling work.
Land purchase under
Cycling City
Initiative imposes
restrictions on
Scheme options
Additional option
constraints results in
abortive design and
potentially additional
design.
Preparation of MSBC delayed by
say 1 month and additional fees
(£25k).
BCC 0 25 12.5 0% 0 Close liaison with Cycling City
Team. Cycle City Works will
proceed before construction of
Link.
A High Court
Challenge is made to
the Statutory Process
(Environmental
Statement)
Response to High Court
Challenge and
appointment of legal
representation.
Preparation of MSBC delayed by
say 6 months and additional
design fees (£50k) and legal fees
(£250k).
BCC 0 300 300 5% 15 Close liaison with the Planning
Authority and development of
appropriate environmental
mitigation.
DfT Reject MSBC Additional modelling and
design to support a re-
submission.
Preparation of MSBC delayed by
say 6 months and additional
design fees (£50k) and modelling
fees (£50k).
BCC 0 100 100 5% 5 Close liaison with DfT during
run-up to submission of the
MSBC.
BCC unable to fund
up to MSBC
Preparation of Submission
halted
Minor cost of closing down
scheme. No delay.
BCC 0 15 15 5% 1 Regular reporting of costs and
liaison with Project Board.
Uncertainty about
appropriate allowance
for Inflation
Additional work on
Economic Report
Preparation of MSBC delayed by
say 1 month and additional fees
(£25k).
BCC 0 25 12.5 13% 2 Close liaison with DfT during
run-up to submission of the
MSBC.
Landowners refuse to
grant access to private
land to carry out
surveys.
Physical and
Environmental constraints
might be missed. Design
based on assumptions.
Later access might reveal
need for repeating design
work.
Preparation of MSBC delayed by
say 1 month and additional fees
(£25k).
BCC 0 25 12.5 0% 0 Access now successfully
negotiated.

Final Report
5079478/Callington Link Options Assessment v2.doc 119
Mitigating
Owner
Cost Impact Estimate Mean
outcome
Action to be taken Cause known control
weakness or assumption
"as a result of"
Event future/uncertain
"may be possibility of/ that" Consequence to objectives
"which would lead to"
* Min
(£k)
Max
(£k)
Likely
(£k)
Likelihood
£k *
Local Election Date
(2009) changed
Delay to programme Preparation of MSBC delayed by
say 1 month and additional fees
(£25k).
BCC 0 25 12.5 0% 0 Date now confirmed
Project delayed by
Political Uncertainty
Delay to programme Preparation of MSBC delayed by
say 6 months and additional
design fees (£50k) and modelling
fees (£50k).
BCC 0 100 100 13% 13 Close liaison with Project
Board.
Issue of Exhibition
Material delayed by
last minute changes
Additional design input
and printing costs
No delay to MSBC but
additional design and printing
costs (£35k)
BCC 0 35 35 50% 18 Early presentation of draft
exhibition boards and close
liaison with Members and
Project Board.
Drainage costs
exceeded and land
purchase required.
Delay to programme and
additional costs
Preparation of MSBC delayed by
say 6 months and additional
design fees (£50k) and land
purchase (£100k)
BCC 0 150 150 5% 8 Early liaison with the
Environment Agency and
securing information on
existing drainage available.
Failure to secure
Listed Building
Consent
Scheme brought to a halt.
Scheme redesign or appeal
required.
Preparation of MSBC delayed by
say 3 months and additional
design fees (£75k) and legal
costs (£100k)
BCC 0 175 175 5% 9 Close liaison with English
Heritage and Planning
Authority. Appropriate design
for setting. Etc.
Public Inquiry Called
and continues longer
than anticipated.
This event is already
programmed but only
assuming a relatively
modest affair lasting two
weeks.
No delay to the submission of
the MSBC but delay to approval
of Scheme. Delay of one month
allowed and additional costs
(250k).
BCC 0 250 250 5% 13 Close liaison with stake-holders
and interested parties.
Appropriate and responsive
design.
Underpinning of
Listed Building might
be necessary.
Increase in cost of works No delay to submission of
MSBC. Potential increase in
estimated costs.
BCC 10 100 100 0% 0 Trial holes of building
foundations. Appropriate
inclusion of works in detail
design. Building unaffected.
Developers object to
Planning Decisions
Increase in Project costs
(Blight)
No delay to submission of
MSBC. Potential increase in
estimated costs.
BCC 0 1000 1000 25% 250 Close liaison with Planning
Authority.
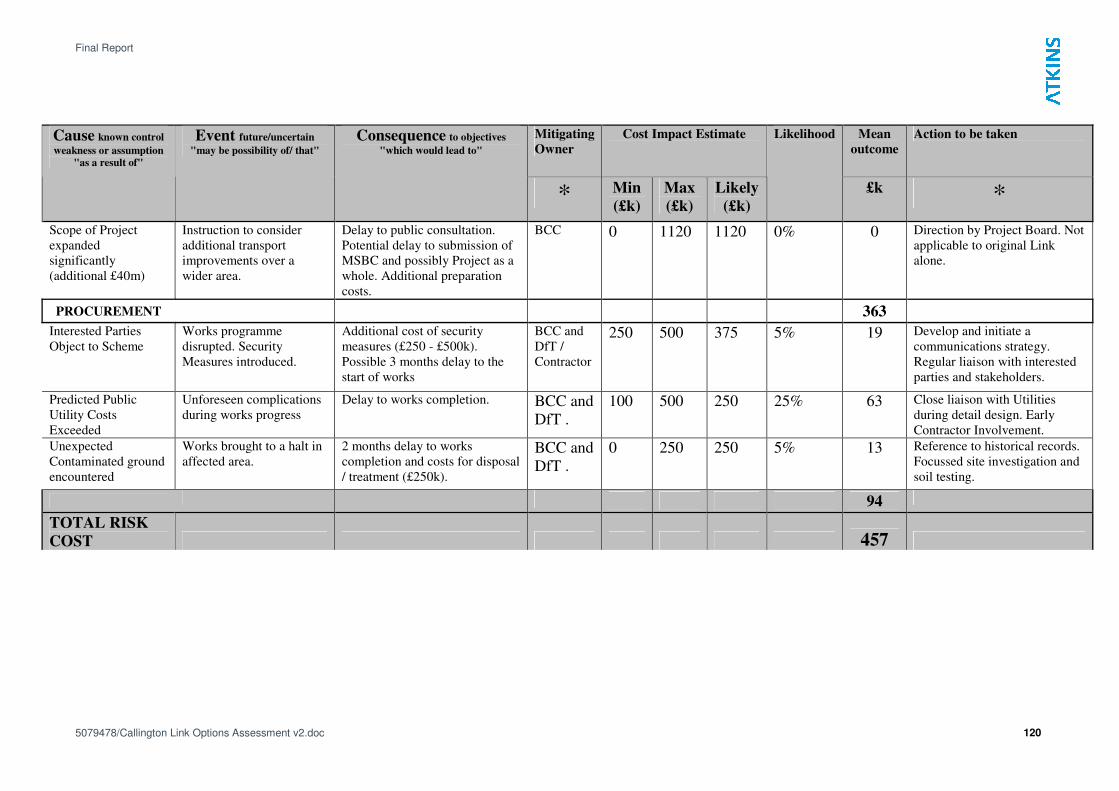
Final Report
5079478/Callington Link Options Assessment v2.doc 120
Mitigating
Owner
Cost Impact Estimate Mean
outcome
Action to be taken Cause known control
weakness or assumption
"as a result of"
Event future/uncertain
"may be possibility of/ that" Consequence to objectives
"which would lead to"
* Min
(£k)
Max
(£k)
Likely
(£k)
Likelihood
£k *
Scope of Project
expanded
significantly
(additional £40m)
Instruction to consider
additional transport
improvements over a
wider area.
Delay to public consultation.
Potential delay to submission of
MSBC and possibly Project as a
whole. Additional preparation
costs.
BCC 0 1120 1120 0% 0 Direction by Project Board. Not
applicable to original Link
alone.
PROCUREMENT 363
Interested Parties
Object to Scheme
Works programme
disrupted. Security
Measures introduced.
Additional cost of security
measures (£250 - £500k).
Possible 3 months delay to the
start of works
BCC and
DfT /
Contractor
250 500 375 5% 19 Develop and initiate a
communications strategy.
Regular liaison with interested
parties and stakeholders.
Predicted Public
Utility Costs
Exceeded
Unforeseen complications
during works progress
Delay to works completion. BCC and
DfT .
100 500 250 25% 63 Close liaison with Utilities
during detail design. Early
Contractor Involvement.
Unexpected
Contaminated ground
encountered
Works brought to a halt in
affected area.
2 months delay to works
completion and costs for disposal
/ treatment (£250k).
BCC and
DfT .
0 250 250 5% 13 Reference to historical records.
Focussed site investigation and
soil testing.
94
TOTAL RISK
COST 457
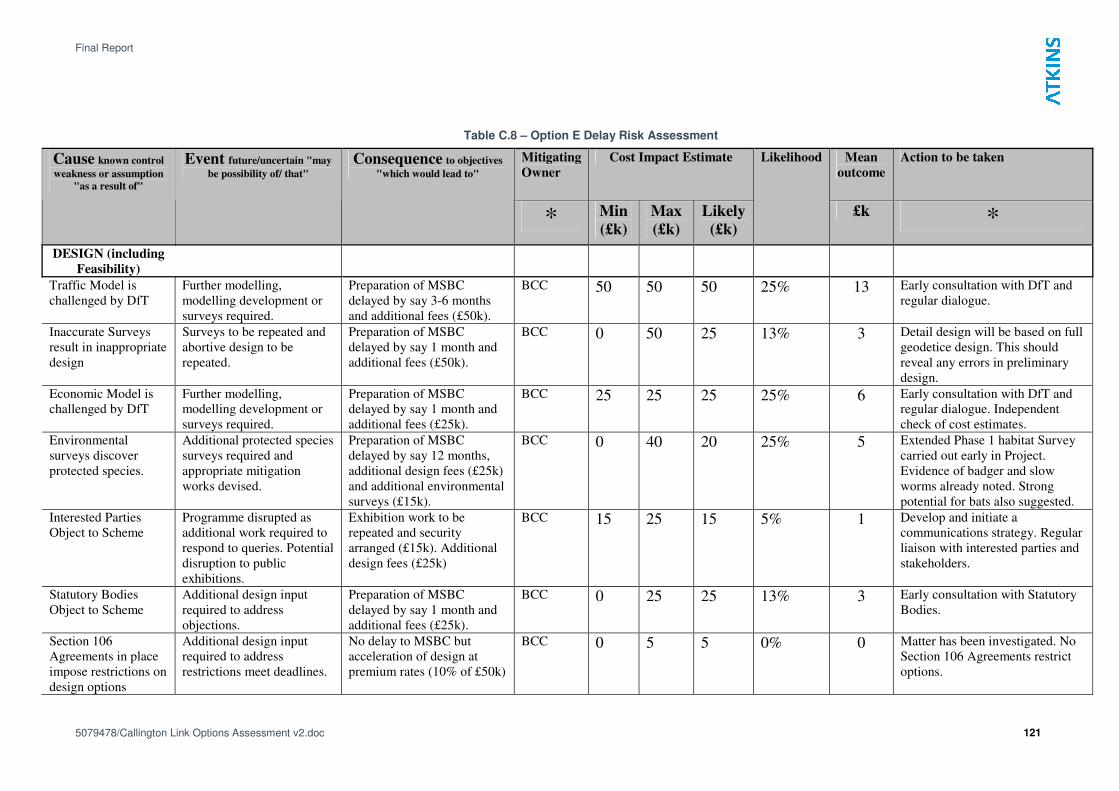
Final Report
5079478/Callington Link Options Assessment v2.doc 121
Table C.8 – Option E Delay Risk Assessment
Mitigating
Owner
Cost Impact Estimate Mean
outcome
Action to be taken Cause known control
weakness or assumption
"as a result of"
Event future/uncertain "may
be possibility of/ that" Consequence to objectives
"which would lead to"
* Min
(£k)
Max
(£k)
Likely
(£k)
Likelihood
£k *
DESIGN (including
Feasibility)
Traffic Model is
challenged by DfT
Further modelling,
modelling development or
surveys required.
Preparation of MSBC
delayed by say 3-6 months
and additional fees (£50k).
BCC 50 50 50 25% 13 Early consultation with DfT and
regular dialogue.
Inaccurate Surveys
result in inappropriate
design
Surveys to be repeated and
abortive design to be
repeated.
Preparation of MSBC
delayed by say 1 month and
additional fees (£50k).
BCC 0 50 25 13% 3 Detail design will be based on full
geodetice design. This should
reveal any errors in preliminary
design.
Economic Model is
challenged by DfT
Further modelling,
modelling development or
surveys required.
Preparation of MSBC
delayed by say 1 month and
additional fees (£25k).
BCC 25 25 25 25% 6 Early consultation with DfT and
regular dialogue. Independent
check of cost estimates.
Environmental
surveys discover
protected species.
Additional protected species
surveys required and
appropriate mitigation
works devised.
Preparation of MSBC
delayed by say 12 months,
additional design fees (£25k)
and additional environmental
surveys (£15k).
BCC 0 40 20 25% 5 Extended Phase 1 habitat Survey
carried out early in Project.
Evidence of badger and slow
worms already noted. Strong
potential for bats also suggested.
Interested Parties
Object to Scheme
Programme disrupted as
additional work required to
respond to queries. Potential
disruption to public
exhibitions.
Exhibition work to be
repeated and security
arranged (£15k). Additional
design fees (£25k)
BCC 15 25 15 5% 1 Develop and initiate a
communications strategy. Regular
liaison with interested parties and
stakeholders.
Statutory Bodies
Object to Scheme
Additional design input
required to address
objections.
Preparation of MSBC
delayed by say 1 month and
additional fees (£25k).
BCC 0 25 25 13% 3 Early consultation with Statutory
Bodies.
Section 106
Agreements in place
impose restrictions on
design options
Additional design input
required to address
restrictions meet deadlines.
No delay to MSBC but
acceleration of design at
premium rates (10% of £50k)
BCC 0 5 5 0% 0 Matter has been investigated. No
Section 106 Agreements restrict
options.
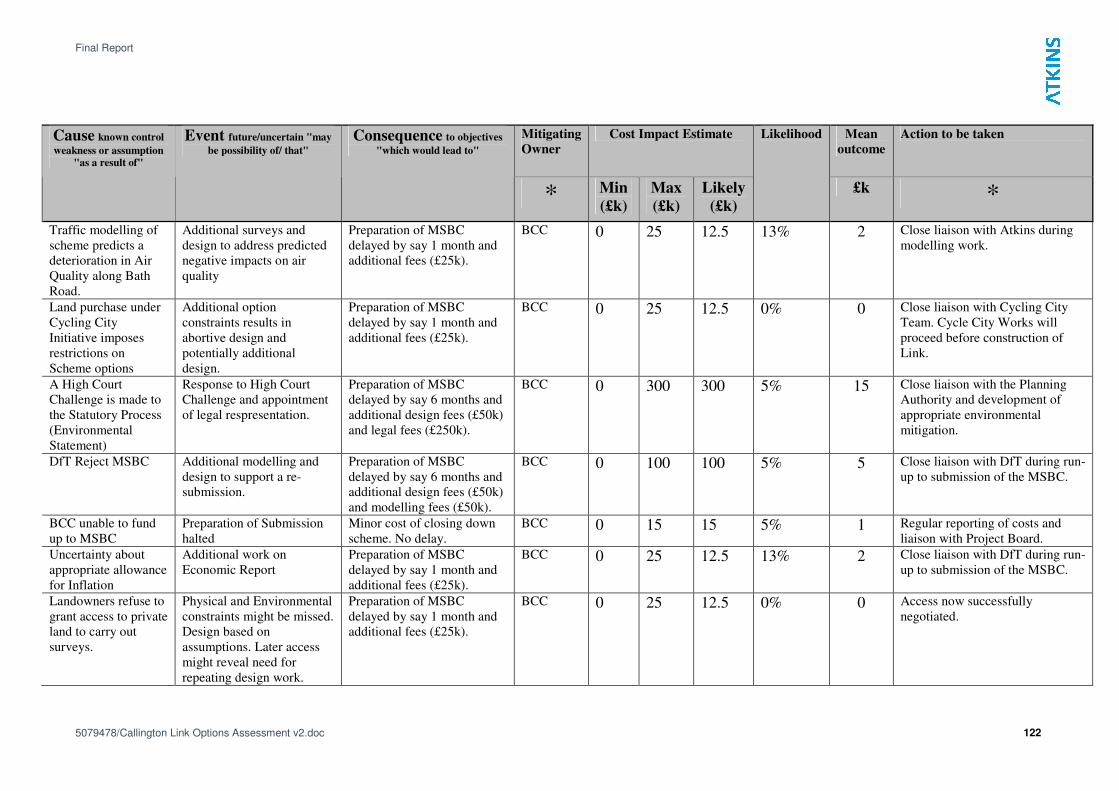
Final Report
5079478/Callington Link Options Assessment v2.doc 122
Mitigating
Owner
Cost Impact Estimate Mean
outcome
Action to be taken Cause known control
weakness or assumption
"as a result of"
Event future/uncertain "may
be possibility of/ that" Consequence to objectives
"which would lead to"
* Min
(£k)
Max
(£k)
Likely
(£k)
Likelihood
£k *
Traffic modelling of
scheme predicts a
deterioration in Air
Quality along Bath
Road.
Additional surveys and
design to address predicted
negative impacts on air
quality
Preparation of MSBC
delayed by say 1 month and
additional fees (£25k).
BCC 0 25 12.5 13% 2 Close liaison with Atkins during
modelling work.
Land purchase under
Cycling City
Initiative imposes
restrictions on
Scheme options
Additional option
constraints results in
abortive design and
potentially additional
design.
Preparation of MSBC
delayed by say 1 month and
additional fees (£25k).
BCC 0 25 12.5 0% 0 Close liaison with Cycling City
Team. Cycle City Works will
proceed before construction of
Link.
A High Court
Challenge is made to
the Statutory Process
(Environmental
Statement)
Response to High Court
Challenge and appointment
of legal respresentation.
Preparation of MSBC
delayed by say 6 months and
additional design fees (£50k)
and legal fees (£250k).
BCC 0 300 300 5% 15 Close liaison with the Planning
Authority and development of
appropriate environmental
mitigation.
DfT Reject MSBC Additional modelling and
design to support a re-
submission.
Preparation of MSBC
delayed by say 6 months and
additional design fees (£50k)
and modelling fees (£50k).
BCC 0 100 100 5% 5 Close liaison with DfT during run-
up to submission of the MSBC.
BCC unable to fund
up to MSBC
Preparation of Submission
halted
Minor cost of closing down
scheme. No delay.
BCC 0 15 15 5% 1 Regular reporting of costs and
liaison with Project Board.
Uncertainty about
appropriate allowance
for Inflation
Additional work on
Economic Report
Preparation of MSBC
delayed by say 1 month and
additional fees (£25k).
BCC 0 25 12.5 13% 2 Close liaison with DfT during run-
up to submission of the MSBC.
Landowners refuse to
grant access to private
land to carry out
surveys.
Physical and Environmental
constraints might be missed.
Design based on
assumptions. Later access
might reveal need for
repeating design work.
Preparation of MSBC
delayed by say 1 month and
additional fees (£25k).
BCC 0 25 12.5 0% 0 Access now successfully
negotiated.
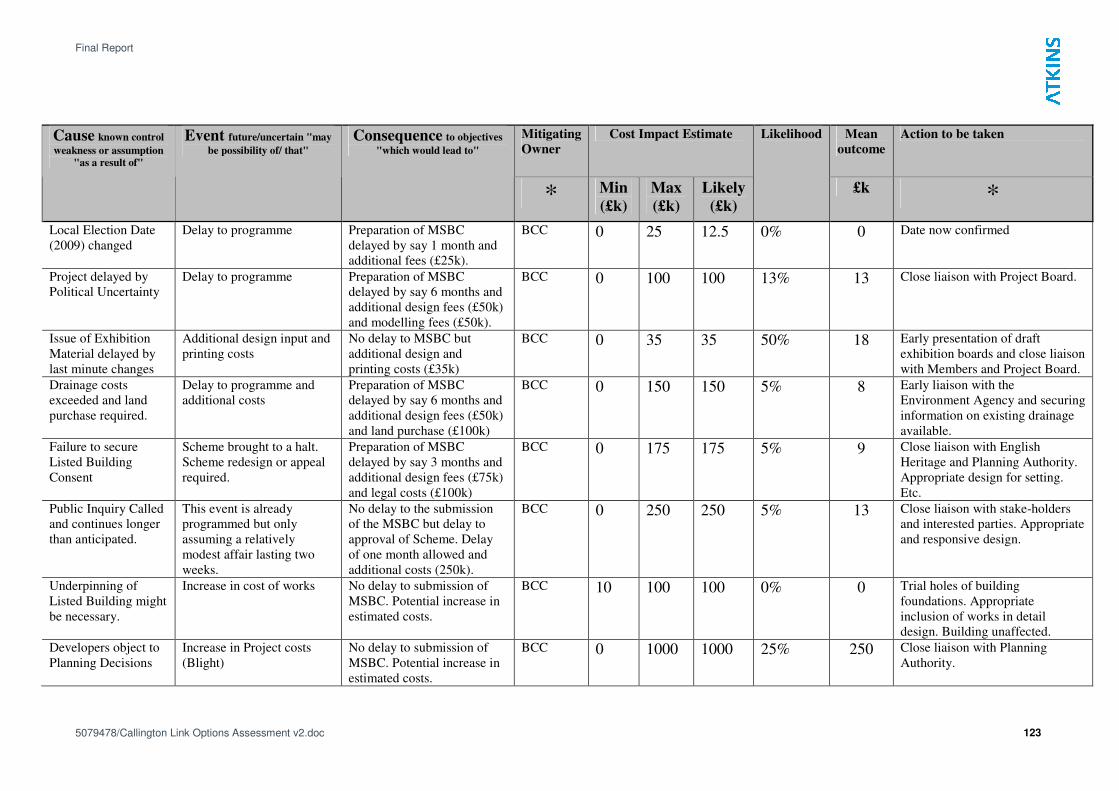
Final Report
5079478/Callington Link Options Assessment v2.doc 123
Mitigating
Owner
Cost Impact Estimate Mean
outcome
Action to be taken Cause known control
weakness or assumption
"as a result of"
Event future/uncertain "may
be possibility of/ that" Consequence to objectives
"which would lead to"
* Min
(£k)
Max
(£k)
Likely
(£k)
Likelihood
£k *
Local Election Date
(2009) changed
Delay to programme Preparation of MSBC
delayed by say 1 month and
additional fees (£25k).
BCC 0 25 12.5 0% 0 Date now confirmed
Project delayed by
Political Uncertainty
Delay to programme Preparation of MSBC
delayed by say 6 months and
additional design fees (£50k)
and modelling fees (£50k).
BCC 0 100 100 13% 13 Close liaison with Project Board.
Issue of Exhibition
Material delayed by
last minute changes
Additional design input and
printing costs
No delay to MSBC but
additional design and
printing costs (£35k)
BCC 0 35 35 50% 18 Early presentation of draft
exhibition boards and close liaison
with Members and Project Board.
Drainage costs
exceeded and land
purchase required.
Delay to programme and
additional costs
Preparation of MSBC
delayed by say 6 months and
additional design fees (£50k)
and land purchase (£100k)
BCC 0 150 150 5% 8 Early liaison with the
Environment Agency and securing
information on existing drainage
available.
Failure to secure
Listed Building
Consent
Scheme brought to a halt.
Scheme redesign or appeal
required.
Preparation of MSBC
delayed by say 3 months and
additional design fees (£75k)
and legal costs (£100k)
BCC 0 175 175 5% 9 Close liaison with English
Heritage and Planning Authority.
Appropriate design for setting.
Etc.
Public Inquiry Called
and continues longer
than anticipated.
This event is already
programmed but only
assuming a relatively
modest affair lasting two
weeks.
No delay to the submission
of the MSBC but delay to
approval of Scheme. Delay
of one month allowed and
additional costs (250k).
BCC 0 250 250 5% 13 Close liaison with stake-holders
and interested parties. Appropriate
and responsive design.
Underpinning of
Listed Building might
be necessary.
Increase in cost of works No delay to submission of
MSBC. Potential increase in
estimated costs.
BCC 10 100 100 0% 0 Trial holes of building
foundations. Appropriate
inclusion of works in detail
design. Building unaffected.
Developers object to
Planning Decisions
Increase in Project costs
(Blight)
No delay to submission of
MSBC. Potential increase in
estimated costs.
BCC 0 1000 1000 25% 250 Close liaison with Planning
Authority.
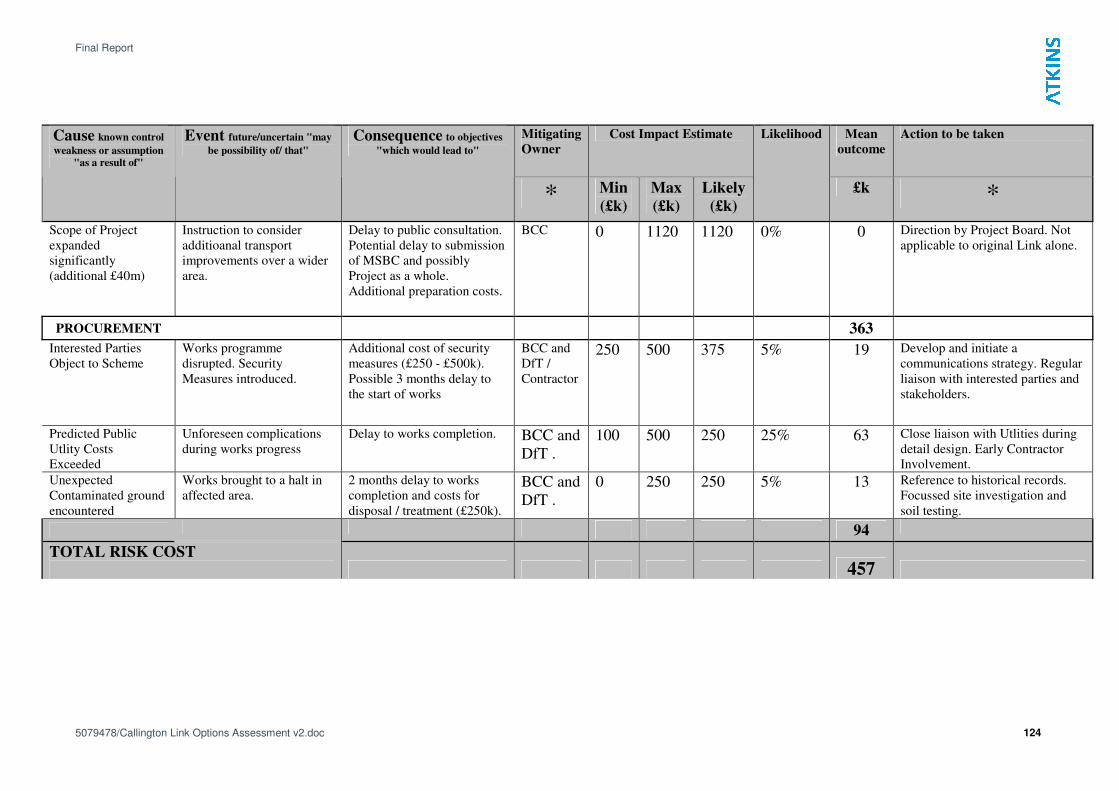
Final Report
5079478/Callington Link Options Assessment v2.doc 124
Mitigating
Owner
Cost Impact Estimate Mean
outcome
Action to be taken Cause known control
weakness or assumption
"as a result of"
Event future/uncertain "may
be possibility of/ that" Consequence to objectives
"which would lead to"
* Min
(£k)
Max
(£k)
Likely
(£k)
Likelihood
£k *
Scope of Project
expanded
significantly
(additional £40m)
Instruction to consider
additioanal transport
improvements over a wider
area.
Delay to public consultation.
Potential delay to submission
of MSBC and possibly
Project as a whole.
Additional preparation costs.
BCC 0 1120 1120 0% 0 Direction by Project Board. Not
applicable to original Link alone.
PROCUREMENT 363
Interested Parties
Object to Scheme
Works programme
disrupted. Security
Measures introduced.
Additional cost of security
measures (£250 - £500k).
Possible 3 months delay to
the start of works
BCC and
DfT /
Contractor
250 500 375 5% 19 Develop and initiate a
communications strategy. Regular
liaison with interested parties and
stakeholders.
Predicted Public
Utlity Costs
Exceeded
Unforeseen complications
during works progress
Delay to works completion. BCC and
DfT .
100 500 250 25% 63 Close liaison with Utlities during
detail design. Early Contractor
Involvement.
Unexpected
Contaminated ground
encountered
Works brought to a halt in
affected area.
2 months delay to works
completion and costs for
disposal / treatment (£250k).
BCC and
DfT .
0 250 250 5% 13 Reference to historical records.
Focussed site investigation and
soil testing.
94
TOTAL RISK COST
457

Final Report
5079478/Callington Link Options Assessment v2.doc 125
Appendix D - Optimism Bias
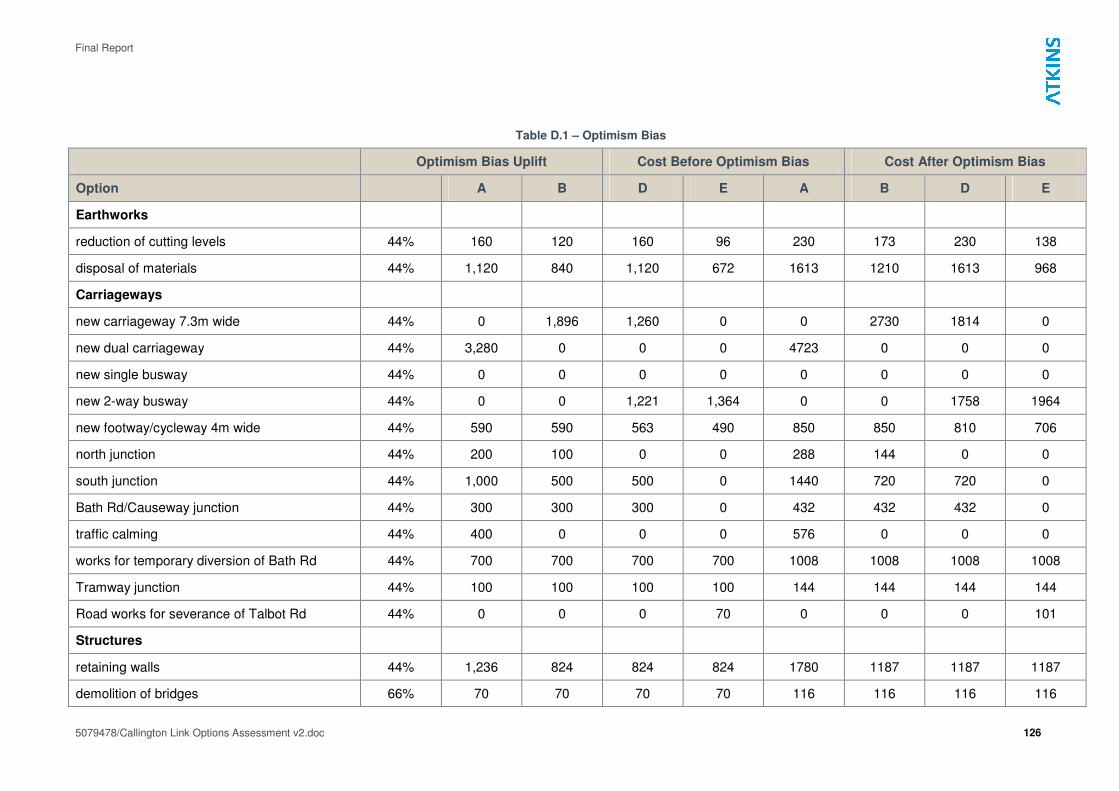
Final Report
5079478/Callington Link Options Assessment v2.doc 126
Table D.1 – Optimism Bias
Optimism Bias Uplift Cost Before Optimism Bias Cost After Optimism Bias
Option A B D E A B D E
Earthworks
reduction of cutting levels 44% 160 120 160 96 230 173 230 138
disposal of materials 44% 1,120 840 1,120 672 1613 1210 1613 968
Carriageways
new carriageway 7.3m wide 44% 0 1,896 1,260 0 0 2730 1814 0
new dual carriageway 44% 3,280 0 0 0 4723 0 0 0
new single busway 44% 0 0 0 0 0 0 0 0
new 2-way busway 44% 0 0 1,221 1,364 0 0 1758 1964
new footway/cycleway 4m wide 44% 590 590 563 490 850 850 810 706
north junction 44% 200 100 0 0 288 144 0 0
south junction 44% 1,000 500 500 0 1440 720 720 0
Bath Rd/Causeway junction 44% 300 300 300 0 432 432 432 0
traffic calming 44% 400 0 0 0 576 0 0 0
works for temporary diversion of Bath Rd 44% 700 700 700 700 1008 1008 1008 1008
Tramway junction 44% 100 100 100 100 144 144 144 144
Road works for severance of Talbot Rd 44% 0 0 0 70 0 0 0 101
Structures
retaining walls 44% 1,236 824 824 824 1780 1187 1187 1187
demolition of bridges 66% 70 70 70 70 116 116 116 116
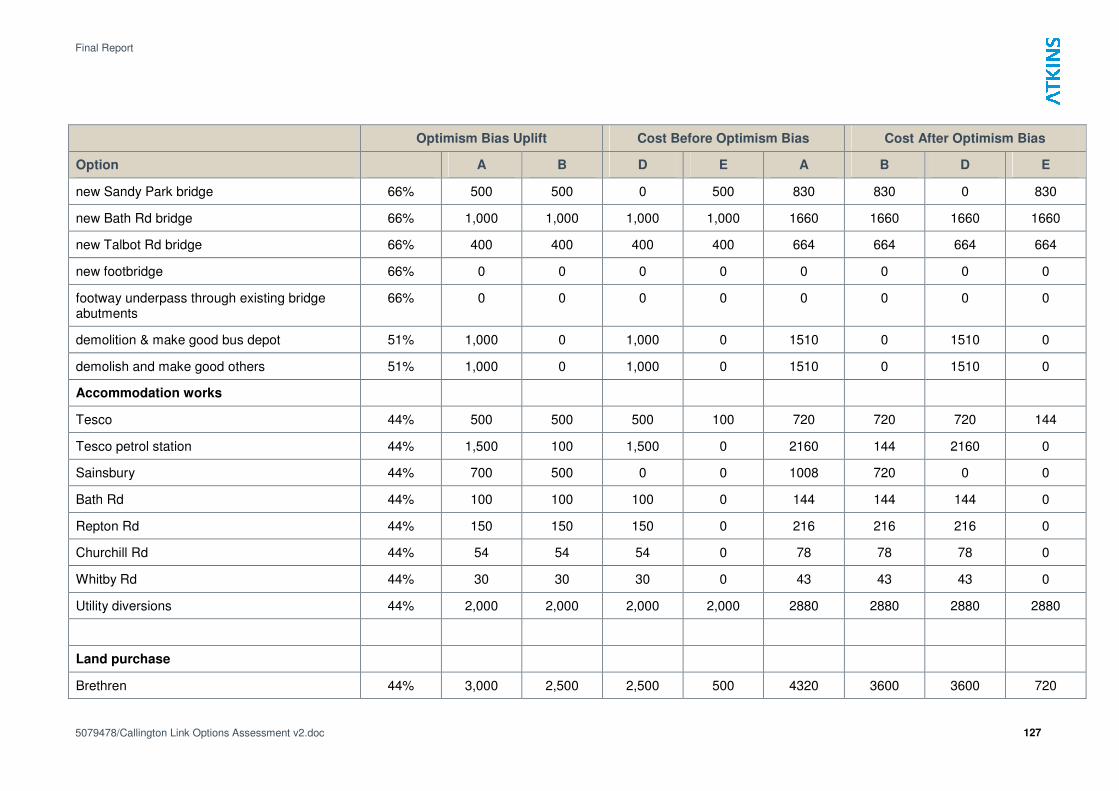
Final Report
5079478/Callington Link Options Assessment v2.doc 127
Optimism Bias Uplift Cost Before Optimism Bias Cost After Optimism Bias
Option A B D E A B D E
new Sandy Park bridge 66% 500 500 0 500 830 830 0 830
new Bath Rd bridge 66% 1,000 1,000 1,000 1,000 1660 1660 1660 1660
new Talbot Rd bridge 66% 400 400 400 400 664 664 664 664
new footbridge 66% 0 0 0 0 0 0 0 0
footway underpass through existing bridge abutments
66% 0 0 0 0 0 0 0 0
demolition & make good bus depot 51% 1,000 0 1,000 0 1510 0 1510 0
demolish and make good others 51% 1,000 0 1,000 0 1510 0 1510 0
Accommodation works
Tesco 44% 500 500 500 100 720 720 720 144
Tesco petrol station 44% 1,500 100 1,500 0 2160 144 2160 0
Sainsbury 44% 700 500 0 0 1008 720 0 0
Bath Rd 44% 100 100 100 0 144 144 144 0
Repton Rd 44% 150 150 150 0 216 216 216 0
Churchill Rd 44% 54 54 54 0 78 78 78 0
Whitby Rd 44% 30 30 30 0 43 43 43 0
Utility diversions 44% 2,000 2,000 2,000 2,000 2880 2880 2880 2880
Land purchase
Brethren 44% 3,000 2,500 2,500 500 4320 3600 3600 720
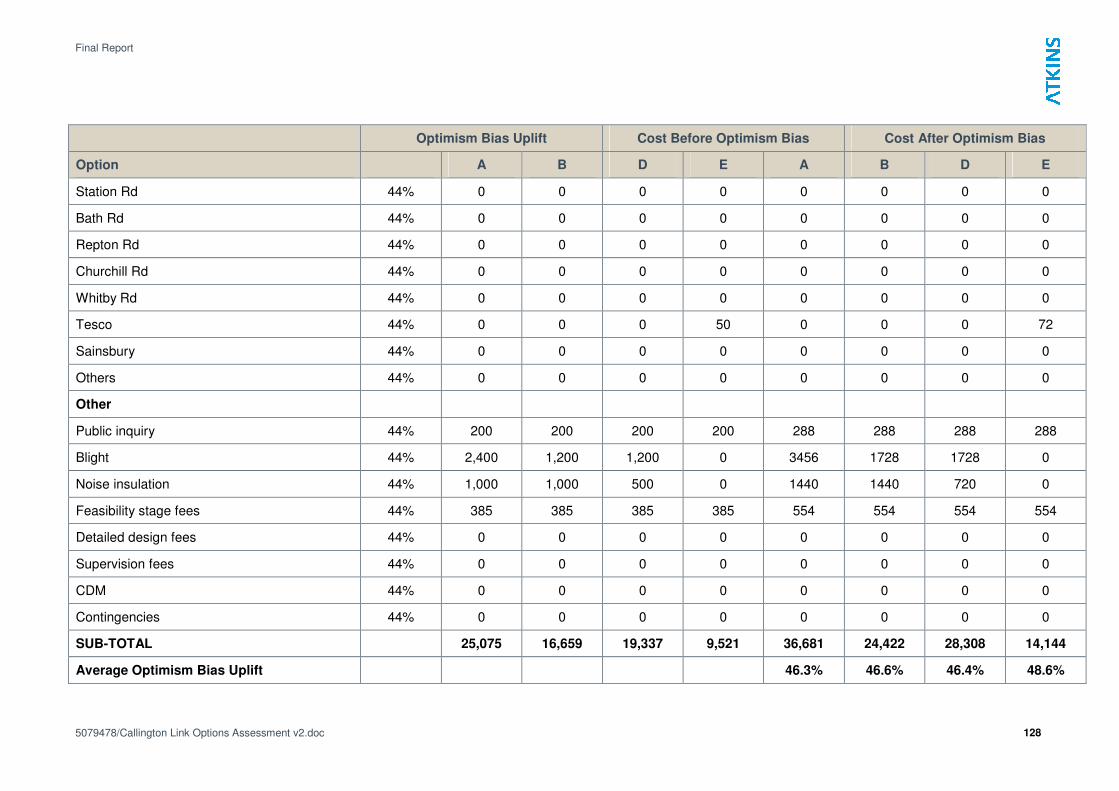
Final Report
5079478/Callington Link Options Assessment v2.doc 128
Optimism Bias Uplift Cost Before Optimism Bias Cost After Optimism Bias
Option A B D E A B D E
Station Rd 44% 0 0 0 0 0 0 0 0
Bath Rd 44% 0 0 0 0 0 0 0 0
Repton Rd 44% 0 0 0 0 0 0 0 0
Churchill Rd 44% 0 0 0 0 0 0 0 0
Whitby Rd 44% 0 0 0 0 0 0 0 0
Tesco 44% 0 0 0 50 0 0 0 72
Sainsbury 44% 0 0 0 0 0 0 0 0
Others 44% 0 0 0 0 0 0 0 0
Other
Public inquiry 44% 200 200 200 200 288 288 288 288
Blight 44% 2,400 1,200 1,200 0 3456 1728 1728 0
Noise insulation 44% 1,000 1,000 500 0 1440 1440 720 0
Feasibility stage fees 44% 385 385 385 385 554 554 554 554
Detailed design fees 44% 0 0 0 0 0 0 0 0
Supervision fees 44% 0 0 0 0 0 0 0 0
CDM 44% 0 0 0 0 0 0 0 0
Contingencies 44% 0 0 0 0 0 0 0 0
SUB-TOTAL 25,075 16,659 19,337 9,521 36,681 24,422 28,308 14,144
Average Optimism Bias Uplift 46.3% 46.6% 46.4% 48.6%
Final Report
5079478/Callington Link Options Assessment v2.doc 129
Appendix E - TEE Tables
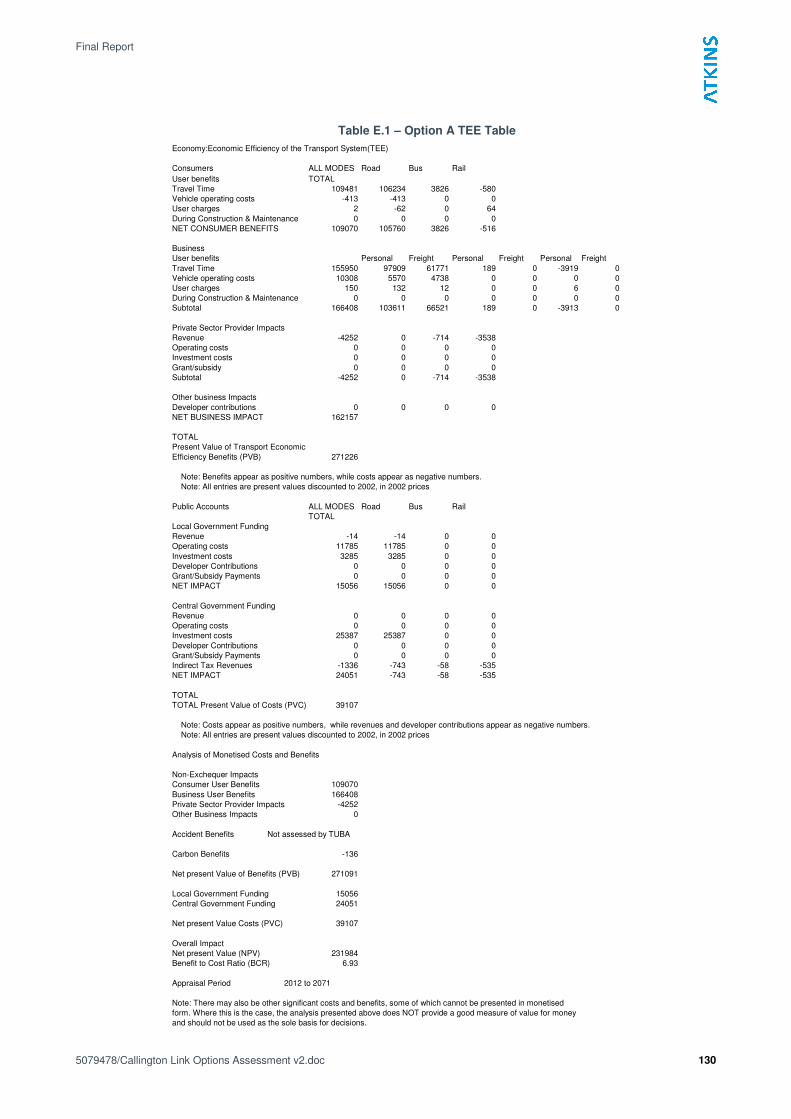
Final Report
5079478/Callington Link Options Assessment v2.doc 130
Table E.1 – Option A TEE Table
Economy:Economic Efficiency of the Transport System(TEE)
Consumers ALL MODES Road Bus Rail
User benefits TOTAL
Travel Time 109481 106234 3826 -580
Vehicle operating costs -413 -413 0 0
User charges 2 -62 0 64
During Construction & Maintenance 0 0 0 0
NET CONSUMER BENEFITS 109070 105760 3826 -516
Business
User benefits Personal Freight Personal Freight Personal Freight
Travel Time 155950 97909 61771 189 0 -3919 0
Vehicle operating costs 10308 5570 4738 0 0 0 0
User charges 150 132 12 0 0 6 0
During Construction & Maintenance 0 0 0 0 0 0 0
Subtotal 166408 103611 66521 189 0 -3913 0
Private Sector Provider Impacts
Revenue -4252 0 -714 -3538
Operating costs 0 0 0 0
Investment costs 0 0 0 0
Grant/subsidy 0 0 0 0
Subtotal -4252 0 -714 -3538
Other business Impacts
Developer contributions 0 0 0 0
NET BUSINESS IMPACT 162157
TOTAL
Present Value of Transport Economic
Efficiency Benefits (PVB) 271226
Note: Benefits appear as positive numbers, while costs appear as negative numbers.
Note: All entries are present values discounted to 2002, in 2002 prices
Public Accounts ALL MODES Road Bus Rail
TOTAL
Local Government Funding
Revenue -14 -14 0 0
Operating costs 11785 11785 0 0
Investment costs 3285 3285 0 0
Developer Contributions 0 0 0 0
Grant/Subsidy Payments 0 0 0 0
NET IMPACT 15056 15056 0 0
Central Government Funding
Revenue 0 0 0 0
Operating costs 0 0 0 0
Investment costs 25387 25387 0 0
Developer Contributions 0 0 0 0
Grant/Subsidy Payments 0 0 0 0
Indirect Tax Revenues -1336 -743 -58 -535
NET IMPACT 24051 -743 -58 -535
TOTAL
TOTAL Present Value of Costs (PVC) 39107
Note: Costs appear as positive numbers, while revenues and developer contributions appear as negative numbers.
Note: All entries are present values discounted to 2002, in 2002 prices
Analysis of Monetised Costs and Benefits
Non-Exchequer Impacts
Consumer User Benefits 109070
Business User Benefits 166408
Private Sector Provider Impacts -4252
Other Business Impacts 0
Accident Benefits Not assessed by TUBA
Carbon Benefits -136
Net present Value of Benefits (PVB) 271091
Local Government Funding 15056
Central Government Funding 24051
Net present Value Costs (PVC) 39107
Overall Impact
Net present Value (NPV) 231984
Benefit to Cost Ratio (BCR) 6.93
Appraisal Period 2012 to 2071
Note: There may also be other significant costs and benefits, some of which cannot be presented in monetised
form. Where this is the case, the analysis presented above does NOT provide a good measure of value for money
and should not be used as the sole basis for decisions.

Final Report
5079478/Callington Link Options Assessment v2.doc 131
Table E.2 – Option B1 TEE
Economy:Economic Efficiency of the Transport System(TEE)
Consumers ALL MODES Road Bus Rail
User benefits TOTAL
Travel Time 122553 93702 29370 -518
Vehicle operating costs 6568 6568 0 0
User charges 147 84 0 64
During Construction & Maintenance 0 0 0 0
NET CONSUMER BENEFITS 129268 100353 29370 -455
Business
User benefits Personal Freight Personal Freight Personal Freight
Travel Time 182931 114709 61218 10870 0 -3867 0
Vehicle operating costs 11155 4454 6701 0 0 0 0
User charges 109 40 62 0 0 6 0
During Construction & Maintenance 0 0 0 0 0 0 0
Subtotal 194195 119203 67981 10870 0 -3861 0
Private Sector Provider Impacts
Revenue -4340 0 -809 -3531
Operating costs 0 0 0 0
Investment costs 0 0 0 0
Grant/subsidy 0 0 0 0
Subtotal -4340 0 -809 -3531
Other business Impacts
Developer contributions 0 0 0 0
NET BUSINESS IMPACT 189854
TOTAL
Present Value of Transport Economic
Efficiency Benefits (PVB) 319122
Note: Benefits appear as positive numbers, while costs appear as negative numbers.
Note: All entries are present values discounted to 2002, in 2002 prices
Public Accounts ALL MODES Road Bus Rail
TOTAL
Local Government Funding
Revenue 112 112 0 0
Operating costs 8579 8579 0 0
Investment costs 2097 2097 0 0
Developer Contributions 0 0 0 0
Grant/Subsidy Payments 0 0 0 0
NET IMPACT 10788 10788 0 0
Central Government Funding
Revenue 0 0 0 0
Operating costs 0 0 0 0
Investment costs 14695 14695 0 0
Developer Contributions 0 0 0 0
Grant/Subsidy Payments 0 0 0 0
Indirect Tax Revenues 1530 2140 -65 -544
NET IMPACT 16225 2140 -65 -544
TOTAL
TOTAL Present Value of Costs (PVC) 27013
Note: Costs appear as positive numbers, while revenues and developer contributions appear as negative numbers.
Note: All entries are present values discounted to 2002, in 2002 prices
Analysis of Monetised Costs and Benefits
Non-Exchequer Impacts
Consumer User Benefits 129268
Business User Benefits 194195
Private Sector Provider Impacts -4340
Other Business Impacts 0
Accident Benefits Not assessed by TUBA
Carbon Benefits 324
Net present Value of Benefits (PVB) 319446
Local Government Funding 10788
Central Government Funding 16225
Net present Value Costs (PVC) 27013
Overall Impact
Net present Value (NPV) 292433
Benefit to Cost Ratio (BCR) 11.83
Appraisal Period 2012 to 2071
Note: There may also be other significant costs and benefits, some of which cannot be presented in monetised
form. Where this is the case, the analysis presented above does NOT provide a good measure of value for money
and should not be used as the sole basis for decisions.

Final Report
5079478/Callington Link Options Assessment v2.doc 132
Table E.3 – Option B2 TEE Table
Economy:Economic Efficiency of the Transport System(TEE)
Consumers ALL MODES Road Bus Rail
User benefits TOTAL
Travel Time 102666 100707 2289 -330
Vehicle operating costs 6277 6277 0 0
User charges 167 101 0 66
During Construction & Maintenance 0 0 0 0
NET CONSUMER BENEFITS 109109 107084 2289 -264
Business
User benefits Personal Freight Personal Freight Personal Freight
Travel Time 160234 110581 60320 -6720 0 -3948 0
Vehicle operating costs 11266 4277 6989 0 0 0 0
User charges 161 77 79 0 0 6 0
During Construction & Maintenance 0 0 0 0 0 0 0
Subtotal 171661 114935 67387 -6720 0 -3942 0
Private Sector Provider Impacts
Revenue -4782 0 -1055 -3727
Operating costs 0 0 0 0
Investment costs 0 0 0 0
Grant/subsidy 0 0 0 0
Subtotal -4782 0 -1055 -3727
Other business Impacts
Developer contributions 0 0 0 0
NET BUSINESS IMPACT 166879
TOTAL
Present Value of Transport Economic
Efficiency Benefits (PVB) 275988
Note: Benefits appear as positive numbers, while costs appear as negative numbers.
Note: All entries are present values discounted to 2002, in 2002 prices
Public Accounts ALL MODES Road Bus Rail
TOTAL
Local Government Funding
Revenue 170 170 0 0
Operating costs 8579 8579 0 0
Investment costs 1511 1511 0 0
Developer Contributions 0 0 0 0
Grant/Subsidy Payments 0 0 0 0
NET IMPACT 10260 10260 0 0
Central Government Funding
Revenue 0 0 0 0
Operating costs 0 0 0 0
Investment costs 13599 13599 0 0
Developer Contributions 0 0 0 0
Grant/Subsidy Payments 0 0 0 0
Indirect Tax Revenues 1415 2061 -62 -584
NET IMPACT 15014 2061 -62 -584
TOTAL
TOTAL Present Value of Costs (PVC) 25274
Note: Costs appear as positive numbers, while revenues and developer contributions appear as negative numbers.
Note: All entries are present values discounted to 2002, in 2002 prices
Analysis of Monetised Costs and Benefits
Non-Exchequer Impacts
Consumer User Benefits 109109
Business User Benefits 171661
Private Sector Provider Impacts -4782
Other Business Impacts 0
Accident Benefits Not assessed by TUBA
Carbon Benefits 312
Net present Value of Benefits (PVB) 276300
Local Government Funding 10260
Central Government Funding 15014
Net present Value Costs (PVC) 25274
Overall Impact
Net present Value (NPV) 251026
Benefit to Cost Ratio (BCR) 10.93
Appraisal Period 2012 to 2071
Note: There may also be other significant costs and benefits, some of which cannot be presented in monetised
form. Where this is the case, the analysis presented above does NOT provide a good measure of value for money
and should not be used as the sole basis for decisions.

Final Report
5079478/Callington Link Options Assessment v2.doc 133
Table E.4 – Option D1 TEE Table
Economy:Economic Efficiency of the Transport System(TEE)
Consumers ALL MODES Road Bus Rail
User benefits TOTAL
Travel Time 62120 55588 6281 251
Vehicle operating costs 3906 3906 0 0
User charges 182 66 0 116
During Construction & Maintenance 0 0 0 0
NET CONSUMER BENEFITS 66208 59560 6281 367
Business
User benefits Personal Freight Personal Freight Personal Freight
Travel Time 109897 62618 39058 8109 0 112 0
Vehicle operating costs 5390 1973 3417 0 0 0 0
User charges 59 10 36 0 0 13 0
During Construction & Maintenance 0 0 0 0 0 0 0
Subtotal 115346 64601 42511 8109 0 125 0
Private Sector Provider Impacts
Revenue 5771 0 6979 -1208
Operating costs 0 0 0 0
Investment costs 0 0 0 0
Grant/subsidy 0 0 0 0
Subtotal 5771 0 6979 -1208
Other business Impacts
Developer contributions 0 0 0 0
NET BUSINESS IMPACT 121117
TOTAL
Present Value of Transport Economic
Efficiency Benefits (PVB) 187325
Note: Benefits appear as positive numbers, while costs appear as negative numbers.
Note: All entries are present values discounted to 2002, in 2002 prices
Public Accounts ALL MODES Road Bus Rail
TOTAL
Local Government Funding
Revenue 131 131 0 0
Operating costs 11057 11057 0 0
Investment costs 2670 2670 0 0
Developer Contributions 0 0 0 0
Grant/Subsidy Payments 0 0 0 0
NET IMPACT 13858 13858 0 0
Central Government Funding
Revenue 0 0 0 0
Operating costs 0 0 0 0
Investment costs 19854 19854 0 0
Developer Contributions 0 0 0 0
Grant/Subsidy Payments 0 0 0 0
Indirect Tax Revenues 4619 3659 1133 -173
NET IMPACT 24473 3215 901 -131
TOTAL
TOTAL Present Value of Costs (PVC) 38331
Note: Costs appear as positive numbers, while revenues and developer contributions appear as negative numbers.
Note: All entries are present values discounted to 2002, in 2002 prices
Analysis of Monetised Costs and Benefits
Non-Exchequer Impacts
Consumer User Benefits 66208
Business User Benefits 115346
Private Sector Provider Impacts 5771
Other Business Impacts 0
Accident Benefits Not assessed by TUBA
Carbon Benefits 556
Net present Value of Benefits (PVB) 187881
Local Government Funding 13858
Central Government Funding 24473
Net present Value Costs (PVC) 38331
Overall Impact
Net present Value (NPV) 149550
Benefit to Cost Ratio (BCR) 4.90
Appraisal Period 2012 to 2071
Note: There may also be other significant costs and benefits, some of which cannot be presented in monetised
form. Where this is the case, the analysis presented above does NOT provide a good measure of value for money
and should not be used as the sole basis for decisions.

Final Report
5079478/Callington Link Options Assessment v2.doc 134
Table E.5 – Option D2 TEE Table
Economy:Economic Efficiency of the Transport System(TEE)
Consumers ALL MODES Road Bus Rail
User benefits TOTAL
Travel Time 59110 54572 4325 213
Vehicle operating costs 4461 4461 0 0
User charges 233 119 0 114
During Construction & Maintenance 0 0 0 0
NET CONSUMER BENEFITS 63804 59152 4325 327
Business
User benefits Personal Freight Personal Freight Personal Freight
Travel Time 99004 53161 38422 7307 0 114 0
Vehicle operating costs 5175 1847 3328 0 0 0 0
User charges 50 2 35 0 0 13 0
During Construction & Maintenance 0 0 0 0 0 0 0
Subtotal 104229 55010 41785 7307 0 127 0
Private Sector Provider Impacts
Revenue 9755 0 11599 -1844
Operating costs 0 0 0 0
Investment costs 0 0 0 0
Grant/subsidy 0 0 0 0
Subtotal 9755 0 11599 -1844
Other business Impacts
Developer contributions 0 0 0 0
NET BUSINESS IMPACT 113984
TOTAL
Present Value of Transport Economic
Efficiency Benefits (PVB) 177788
Note: Benefits appear as positive numbers, while costs appear as negative numbers.
Note: All entries are present values discounted to 2002, in 2002 prices
Public Accounts ALL MODES Road Bus Rail
TOTAL
Local Government Funding
Revenue 197 197 0 0
Operating costs 11057 11057 0 0
Investment costs 2670 2670 0 0
Developer Contributions 0 0 0 0
Grant/Subsidy Payments 0 0 0 0
NET IMPACT 13924 13924 0 0
Central Government Funding
Revenue 0 0 0 0
Operating costs 0 0 0 0
Investment costs 19854 19854 0 0
Developer Contributions 0 0 0 0
Grant/Subsidy Payments 0 0 0 0
Indirect Tax Revenues 5177 4062 1347 -232
NET IMPACT 25031 3275 1088 -181
TOTAL
TOTAL Present Value of Costs (PVC) 38955
Note: Costs appear as positive numbers, while revenues and developer contributions appear as negative numbers.
Note: All entries are present values discounted to 2002, in 2002 prices
Analysis of Monetised Costs and Benefits
Non-Exchequer Impacts
Consumer User Benefits 63804
Business User Benefits 104229
Private Sector Provider Impacts 9755
Other Business Impacts 0
Accident Benefits Not assessed by TUBA
Carbon Benefits 620
Net present Value of Benefits (PVB) 178408
Local Government Funding 13924
Central Government Funding 25031
Net present Value Costs (PVC) 38955
Overall Impact
Net present Value (NPV) 139453
Benefit to Cost Ratio (BCR) 4.58
Appraisal Period 2012 to 2071
Note: There may also be other significant costs and benefits, some of which cannot be presented in monetised
form. Where this is the case, the analysis presented above does NOT provide a good measure of value for money
and should not be used as the sole basis for decisions.
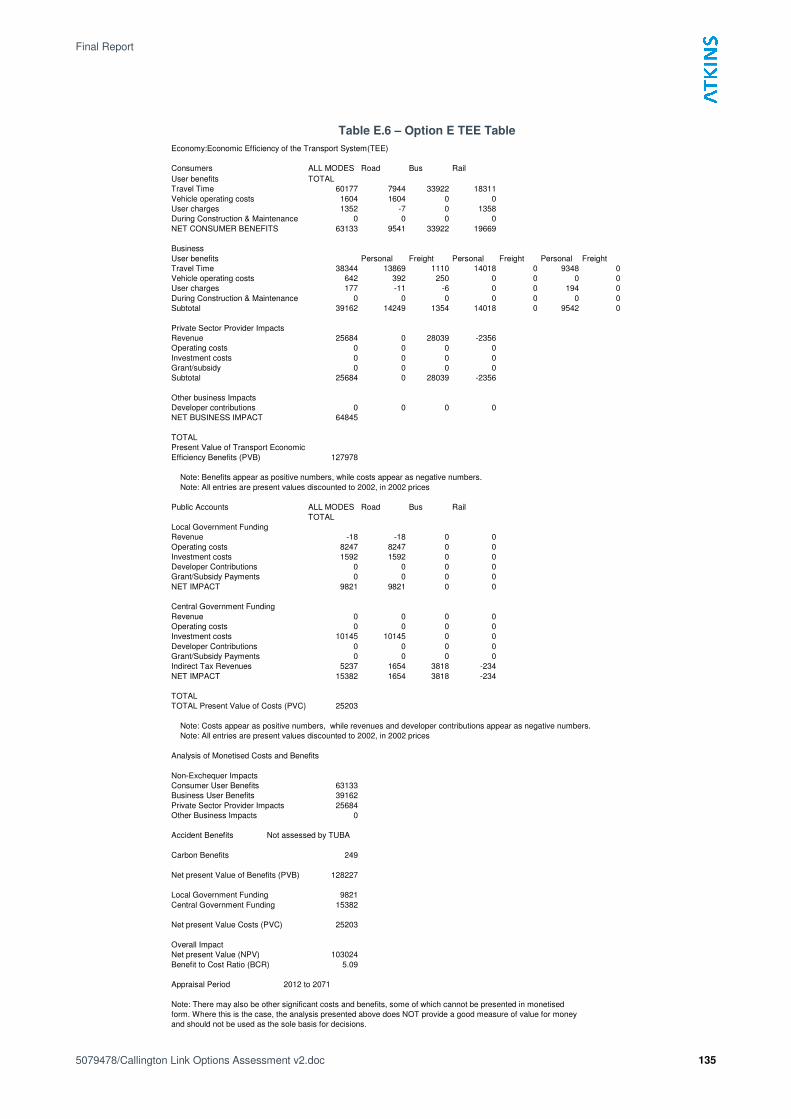
Final Report
5079478/Callington Link Options Assessment v2.doc 135
Table E.6 – Option E TEE Table
Economy:Economic Efficiency of the Transport System(TEE)
Consumers ALL MODES Road Bus Rail
User benefits TOTAL
Travel Time 60177 7944 33922 18311
Vehicle operating costs 1604 1604 0 0
User charges 1352 -7 0 1358
During Construction & Maintenance 0 0 0 0
NET CONSUMER BENEFITS 63133 9541 33922 19669
Business
User benefits Personal Freight Personal Freight Personal Freight
Travel Time 38344 13869 1110 14018 0 9348 0
Vehicle operating costs 642 392 250 0 0 0 0
User charges 177 -11 -6 0 0 194 0
During Construction & Maintenance 0 0 0 0 0 0 0
Subtotal 39162 14249 1354 14018 0 9542 0
Private Sector Provider Impacts
Revenue 25684 0 28039 -2356
Operating costs 0 0 0 0
Investment costs 0 0 0 0
Grant/subsidy 0 0 0 0
Subtotal 25684 0 28039 -2356
Other business Impacts
Developer contributions 0 0 0 0
NET BUSINESS IMPACT 64845
TOTAL
Present Value of Transport Economic
Efficiency Benefits (PVB) 127978
Note: Benefits appear as positive numbers, while costs appear as negative numbers.
Note: All entries are present values discounted to 2002, in 2002 prices
Public Accounts ALL MODES Road Bus Rail
TOTAL
Local Government Funding
Revenue -18 -18 0 0
Operating costs 8247 8247 0 0
Investment costs 1592 1592 0 0
Developer Contributions 0 0 0 0
Grant/Subsidy Payments 0 0 0 0
NET IMPACT 9821 9821 0 0
Central Government Funding
Revenue 0 0 0 0
Operating costs 0 0 0 0
Investment costs 10145 10145 0 0
Developer Contributions 0 0 0 0
Grant/Subsidy Payments 0 0 0 0
Indirect Tax Revenues 5237 1654 3818 -234
NET IMPACT 15382 1654 3818 -234
TOTAL
TOTAL Present Value of Costs (PVC) 25203
Note: Costs appear as positive numbers, while revenues and developer contributions appear as negative numbers.
Note: All entries are present values discounted to 2002, in 2002 prices
Analysis of Monetised Costs and Benefits
Non-Exchequer Impacts
Consumer User Benefits 63133
Business User Benefits 39162
Private Sector Provider Impacts 25684
Other Business Impacts 0
Accident Benefits Not assessed by TUBA
Carbon Benefits 249
Net present Value of Benefits (PVB) 128227
Local Government Funding 9821
Central Government Funding 15382
Net present Value Costs (PVC) 25203
Overall Impact
Net present Value (NPV) 103024
Benefit to Cost Ratio (BCR) 5.09
Appraisal Period 2012 to 2071
Note: There may also be other significant costs and benefits, some of which cannot be presented in monetised
form. Where this is the case, the analysis presented above does NOT provide a good measure of value for money
and should not be used as the sole basis for decisions.


