
California State University, Los Angeles Foundation
Financial Statements (With Supplementary Information) and Independent Auditor's Report
June 30, 2019

California State University, Los Angeles Foundation
Index
1
Page
Independent Auditor's Report 2
Financial Statements
Statement of Financial Position 4
Statement of Activities 5
Statement of Functional Expenses 6
Statement of Cash Flows 7
Notes to Financial Statements 8
Supplementary Information
Schedule of Net Position 18
Schedule of Revenues, Expenses and Changes in Net Position 19
Other Information 20
2
Independent Auditor's Report
Board of Trustees California State University, Los Angeles Foundation (A California State University Auxiliary Organization)
We have audited the accompanying financial statements of California State University, Los Angeles Foundation, which comprise the statement of financial position as of June 30, 2019, and the related statements of activities, functional expenses and cash flows for the year then ended, and the related notes to the financial statements.
Management's Responsibility for the Financial Statements
Management is responsible for the preparation and fair presentation of these financial statements in accordance with accounting principles generally accepted in the United States of America; this includes the design, implementation, and maintenance of internal control relevant to the preparation and fair presentation of financial statements that are free from material misstatement, whether due to fraud or error.
Auditor's Responsibility
Our responsibility is to express an opinion on these financial statements based on our audit. We conducted our audit in accordance with auditing standards generally accepted in the United States of America. Those standards require that we plan and perform the audit to obtain reasonable assurance about whether the financial statements are free from material misstatement.
An audit involves performing procedures to obtain audit evidence about the amounts and disclosures in the financial statements. The procedures selected depend on the auditor's judgment, including the assessment of the risks of material misstatement of the financial statements, whether due to fraud or error. In making those risk assessments, the auditor considers internal control relevant to the entity's preparation and fair presentation of the financial statements in order to design audit procedures that are appropriate in the circumstances, but not for the purpose of expressing an opinion on the effectiveness of the entity's internal control. Accordingly, we express no such opinion. An audit also includes evaluating the appropriateness of accounting policies used and the reasonableness of significant accounting estimates made by management, as well as evaluating the overall presentation of the financial statements.
We believe that the audit evidence we have obtained is sufficient and appropriate to provide a basis for our audit opinion.
Opinion
In our opinion, the 2019 financial statements referred to above present fairly, in all material respects, the financial position of California State University, Los Angeles Foundation as of June 30, 2019, and the changes in its net assets and its cash flows for the year then ended in accordance with accounting principles generally accepted in the United States of America.
3
Report on Summarized Comparative Information
The summarized comparative information of California State University, Los Angeles Foundation as of June 30, 2018 and for the year then ended was audited by other auditors whose report dated September 27, 2018 expressed an unmodified opinion on those statements.
Report on Supplementary Information
Our audit was conducted for the purpose of forming an opinion on the financial statements as a whole. The 2019 supplementary information is presented for purposes of additional analysis and is not a required part of the 2019 financial statements. Such information is the responsibility of management and was derived from and relates directly to the underlying accounting and other records used to prepare the 2019 financial statements. The information has been subjected to the auditing procedures applied in the audit of the 2019 financial statements and certain additional procedures, including comparing and reconciling such information directly to the underlying accounting and other records used to prepare the 2019 financial statements or to the 2019 financial statements themselves, and other additional procedures in accordance with auditing standards generally accepted in the United States of America. In our opinion, the information is fairly stated in all material respects in relation to the 2019 financial statements as a whole.
Los Angeles, California September 26, 2019

California State University, Los Angeles Foundation
Statement of Financial Position June 30, 2019
With Summarized Totals at June 30, 2018
See Notes to Financial Statements.
4
2019 2018
Current assetsCash and cash equivalents 3,973,524$ 4,627,287$ Short term investments 1,803,267 4,583,185Accounts receivable 552,497 65,427Pledges receivable, current portion, net 1,517,102 2,464,335Prepaid expenses and other current assets 13,660 183,237
Total current assets 7,860,050 11,923,471
Noncurrent assetsRestricted cash and cash equivalents 4,117,669 2,047,594 Investments 41,556,183 42,239,801 Pledges receivable, net of current portion 5,865,713 4,960,187
Total noncurrent assets 51,539,565 49,247,582
Total assets 59,399,615$ 61,171,053$
Current liabilitiesAccounts payable and other liabilities 774$ 1,683$ Accounts payable to affiliates 101,034 364,434
Total liabilities 101,808 366,117
Net assetsWithout donor restrictions
General operations 1,303,474 1,143,970 Board designated 975,554 958,429
Total 2,279,028 2,102,399
With donor restrictions 57,018,779 58,702,537
Total net assets 59,297,807 60,804,936
Total 59,399,615$ 61,171,053$
Assets
Liabilities and Net Assets
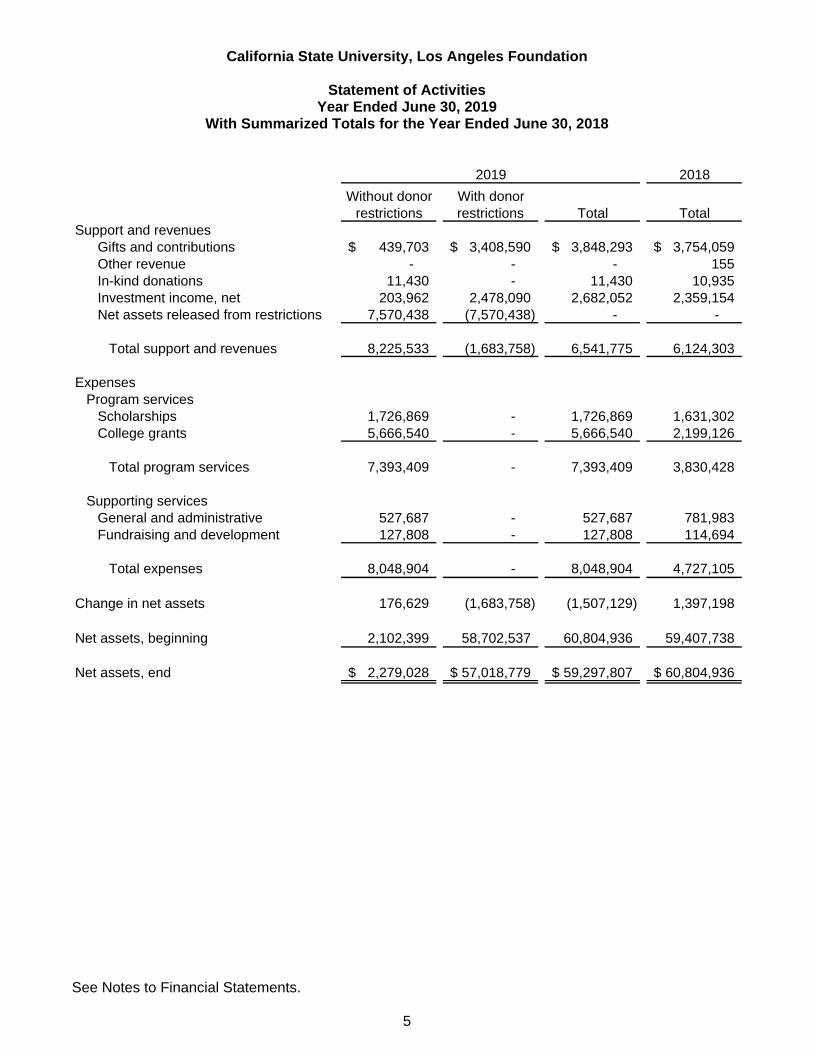
California State University, Los Angeles Foundation
Statement of Activities Year Ended June 30, 2019
With Summarized Totals for the Year Ended June 30, 2018
See Notes to Financial Statements.
5
2018
Without donor With donor
restrictions restrictions Total Total
Support and revenues
Gifts and contributions 439,703$ 3,408,590$ 3,848,293$ 3,754,059$
Other revenue - - - 155
In-kind donations 11,430 - 11,430 10,935
Investment income, net 203,962 2,478,090 2,682,052 2,359,154
Net assets released from restrictions 7,570,438 (7,570,438) - -
Total support and revenues 8,225,533 (1,683,758) 6,541,775 6,124,303
Expenses
Program services
Scholarships 1,726,869 - 1,726,869 1,631,302
College grants 5,666,540 - 5,666,540 2,199,126
Total program services 7,393,409 - 7,393,409 3,830,428
Supporting services
General and administrative 527,687 - 527,687 781,983
Fundraising and development 127,808 - 127,808 114,694
Total expenses 8,048,904 - 8,048,904 4,727,105
Change in net assets 176,629 (1,683,758) (1,507,129) 1,397,198
Net assets, beginning 2,102,399 58,702,537 60,804,936 59,407,738
Net assets, end 2,279,028$ 57,018,779$ 59,297,807$ 60,804,936$
2019

California State University, Los Angeles Foundation
Statement of Functional Expenses Year Ended June 30, 2019
With Summarized Totals for the Year Ended June 30, 2018
See Notes to Financial Statements.
6
Fundraising
College General and and
Scholarship grants administrative development Total 2018
Advertising -$ -$ 19,717$ -$ 19,717$ 18,526$
Bank fees - - 11,040 - 11,040 243,938
Contract services - - 158 98,658 98,816 196,329
Insurance - - 2,917 253 3,170 229,443
Leasing fees - - - - - 58,180
Maintenance - - - - - -
Miscellaneous - - 32,404 - 32,404 56,394
Office - - 1,263 - 1,263 7,217
Outside service - - - - - -
Professional fees - - 218,796 - 218,796 213,835
Scholarships and University projects 1,726,869 5,666,540 229,935 - 7,623,344 3,092,817
Supplies - - 9,599 28,897 38,496 575,929
Travel and entertainment - - 1,858 - 1,858 34,497
Total 1,726,869$ 5,666,540$ 527,687$ 127,808$ 8,048,904$ 4,727,105$
Program services Supporting services
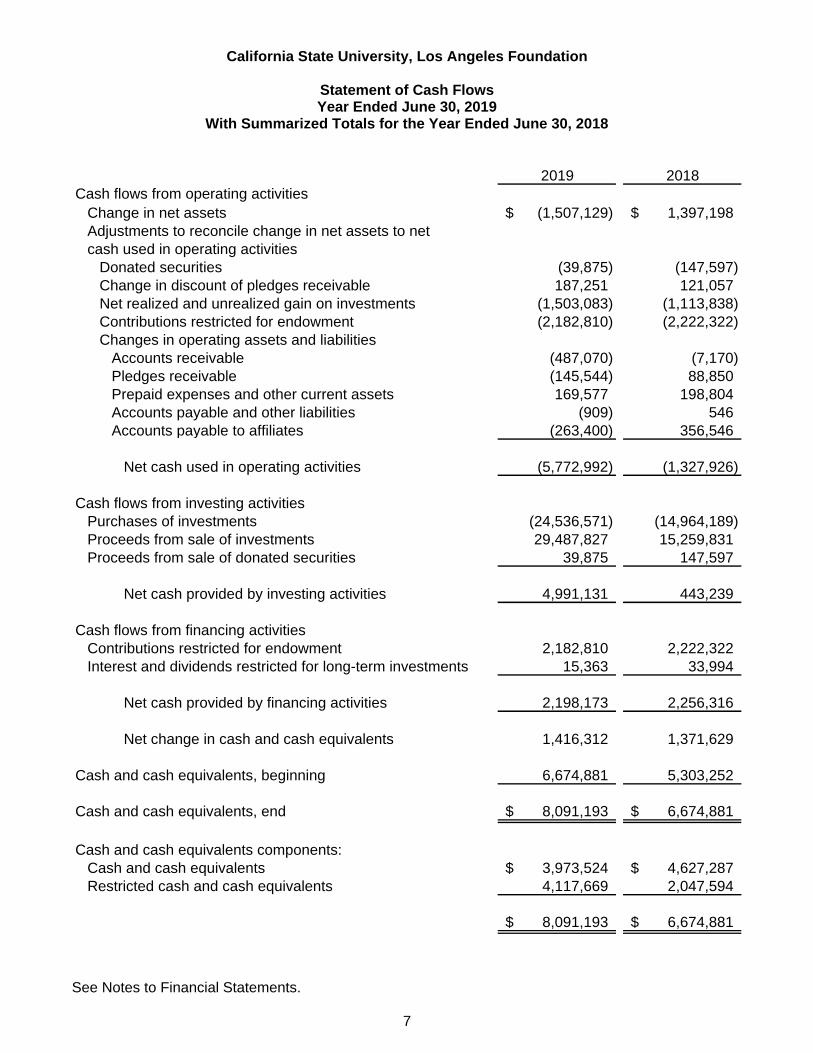
California State University, Los Angeles Foundation
Statement of Cash Flows Year Ended June 30, 2019
With Summarized Totals for the Year Ended June 30, 2018
See Notes to Financial Statements.
7
2019 2018
Cash flows from operating activities
Change in net assets (1,507,129)$ 1,397,198$
Adjustments to reconcile change in net assets to net
cash used in operating activities
Donated securities (39,875) (147,597)
Change in discount of pledges receivable 187,251 121,057
Net realized and unrealized gain on investments (1,503,083) (1,113,838)
Contributions restricted for endowment (2,182,810) (2,222,322)
Changes in operating assets and liabilities
Accounts receivable (487,070) (7,170)
Pledges receivable (145,544) 88,850
Prepaid expenses and other current assets 169,577 198,804
Accounts payable and other liabilities (909) 546
Accounts payable to affiliates (263,400) 356,546
Net cash used in operating activities (5,772,992) (1,327,926)
Cash flows from investing activities
Purchases of investments (24,536,571) (14,964,189)
Proceeds from sale of investments 29,487,827 15,259,831
Proceeds from sale of donated securities 39,875 147,597
Net cash provided by investing activities 4,991,131 443,239
Cash flows from financing activities
Contributions restricted for endowment 2,182,810 2,222,322
Interest and dividends restricted for long-term investments 15,363 33,994
Net cash provided by financing activities 2,198,173 2,256,316
Net change in cash and cash equivalents 1,416,312 1,371,629
Cash and cash equivalents, beginning 6,674,881 5,303,252
Cash and cash equivalents, end 8,091,193$ 6,674,881$
Cash and cash equivalents components:
Cash and cash equivalents 3,973,524$ 4,627,287$
Restricted cash and cash equivalents 4,117,669 2,047,594
8,091,193$ 6,674,881$
California State University, Los Angeles Foundation
Notes to Financial Statements June 30, 2019
8
Note 1 - Business activity and summary of significant accounting policies
Business activity California State University, Los Angeles Foundation (a California State University Auxiliary Organization) (the "Foundation") is a nonprofit auxiliary corporation organized under the California Nonprofit Public Benefit Corporation Law. It was incorporated on September 9, 1985, for the primary purpose of encouraging and promoting the scientific, literary, educational, and charitable purposes of California State University, Los Angeles (the "University") by providing financial assistance through scholarships, grants, gifts, loans, and other means to the University, its support groups, students, faculty, and staff.
Basis of accounting The accompanying financial statements have been prepared on the accrual basis of accounting in accordance with accounting principles generally accepted in the United States of America ("GAAP").
Financial statement presentation The Foundation reports information regarding its financial position and activities according to two classes of net assets: without donor restrictions and with donor restrictions. They are described as follows:
Net Assets Without Donor Restrictions - Net assets for use in general operations and not subject to donor (or certain grantor) restrictions. The governing board may designate, from net assets without donor restrictions, net assets for an operating reserve through a board-designated endowment.
Net Assets With Donor Restrictions - Net assets subject to donor (or certain grantor) imposed restrictions. Some donor-imposed restrictions are temporary in nature, such as those that will be met by the passage of time, purpose, or other events specified by the donor. Other donor-imposed restrictions are perpetual in nature where the donor stipulates that resources be maintained in perpetuity. Donor-imposed restrictions are released when a restriction expires, that is, when the stipulated time has elapsed, when the stipulated purpose for which the resource was restricted has been fulfilled, or both.
Contributions Unconditional promises to give are recorded as pledges receivable when the promise is received. Unconditional promises to give with payments due in future periods are reported as restricted support.
Contributions received are recorded as without donor restrictions or with donor restrictions depending on the existence or nature of any donor restrictions. Contributions for which donors have imposed restrictions, which limit the use of the donated assets, are reported as restricted support if the restrictions are not met in the same reporting period. When such donor-imposed restrictions are met in subsequent reporting periods, net assets with donor restrictions are reclassified to net assets without donor restrictions and reported as net assets released from restrictions. Contributions of assets which donors have stipulated must be maintained in perpetuity, with only the income earned thereon available for current use, are classified as contributions with donor restrictions. Contributions for which donors have not stipulated restrictions, as well as contributions for which donors have stipulated restrictions that are met within the same reporting period, are reported as net assets without donor restrictions.

California State University, Los Angeles Foundation
Notes to Financial Statements June 30, 2019
9
Gifts of land, buildings, and equipment are reported as unrestricted support unless explicit donor stipulations specify how the donated assets must be used. Gifts of long-lived assets with explicit restrictions that specify how the assets are to be used and gifts of cash or other assets that must be used to acquire long-lived assets are reported as restricted support. Absent explicit donor stipulation, the Foundation reports expirations of donor restrictions when the donated or acquired long-lived assets are placed in service.
Conditional promises to give, which depend on the occurrence of a specified future and uncertain event to bind the promisor, shall be recognized when the conditions on which they depend are substantially met, that is, when the conditional promise becomes unconditional.
Cash and cash equivalents Cash and cash equivalents consist of cash in banks and highly liquid investments with original maturities of three months or less unless held for meeting restrictions of a capital or endowment nature.
Investments Investments are reported at their fair values in the statement of financial position. Realized and unrealized gains and losses are included in the statement of activities as investment income (loss).
Fair value measurements The Foundation values its financial assets and liabilities based on the price that would be received to sell an asset or paid to transfer a liability in an orderly transaction between market participants at the measurement date. In order to increase consistency and comparability in fair value measurements, a fair value hierarchy prioritizes observable and unobservable inputs used to measure fair value into three broad levels, which are described below:
Level 1: Quoted prices (unadjusted) in active markets that are accessible at the measurement date for identical assets or liabilities. The fair value hierarchy gives the highest priority to Level 1 inputs.
Level 2: Observable inputs other than Level 1 prices, such as quoted prices for similar assets or liabilities; quoted prices in inactive markets; or model-derived valuations in which all significant inputs are observable or can be derived principally from or corroborated with observable market data.
Level 3: Unobservable inputs are used when little or no market data is available. The fair value hierarchy gives the lowest priority to Level 3 inputs.
Pledges receivable Pledges receivable are stated at unpaid balances, less an allowance for doubtful accounts and a discount on those pledges receivable due in greater than one year. The Foundation provides for losses on receivables using the allowance method. The allowance is based on experience and other circumstances. Receivables are considered impaired if full principal payments are not received in accordance with the contractual terms. It is the Foundation's policy to charge off uncollectible receivables when management determines the receivable will not be collected.

California State University, Los Angeles Foundation
Notes to Financial Statements June 30, 2019
10
Capital assets Capital assets are recorded at cost at the date of purchase or fair value at the date of donation. Betterments and improvements that significantly enhance an asset or extend the useful life of an asset are capitalized to fixed assets while ordinary repair costs that do not significantly extend the useful life of the asset are expensed as incurred. Depreciation is calculated using the straight-line method over an asset's estimated useful life. All capital assets are fully depreciated.
In-kind contributions The Foundation records various types of in-kind contributions. Contributions of tangible assets are recognized at fair value when received. Contributed services are recognized at fair value if the services received (a) create or enhance long-lived assets or (b) require specialized skills, are provided by individuals possessing those skills, and would typically need to be purchased if not provided by donation. The amounts reflected in the accompanying financial statements as in-kind contributions are offset by like amounts included in expenses. For the year ended June 30, 2019, the Foundation recorded in-kind contributions of $11,430. The Foundation had no donated services during the year.
Income taxes The Foundation is a not-for-profit organization that is exempt from income taxes under Section 501(c)(3) of the Internal Revenue Code and Section 23701(d) of the Revenue Taxation Code of California. Accordingly, no provision for income taxes is included in the accompanying financial statements.
The Foundation has no unrecognized tax benefits at June 30, 2019. The Foundation's federal and state income tax returns prior to 2016 and 2015, respectively, are closed and management continually evaluates expiring statutes of limitations, audits, proposed settlements, changes in tax law and new authoritative rulings.
If applicable, the Foundation recognizes interest and penalties associated with tax matters as part of income tax expense and includes accrued interest and penalties with the related tax liability in the statement of financial position.
Functional allocation of expenses The costs of providing services have been summarized on a functional basis. Accordingly, certain costs have been allocated among the program services and supporting services related to personnel time and space utilized for activities.
Use of estimates The preparation of financial statements in conformity with GAAP requires management to make estimates and assumptions that affect certain reported amounts and disclosures. Accordingly, actual results could differ from those estimates.
Comparative totals The financial statements include certain prior-year summarized comparative information in total but not by net asset class. Such information does not include sufficient detail to constitute a presentation in conformity with GAAP. Accordingly, such information should be read in conjunction with the Foundation's financial statements for the year ended June 30, 2018, from which the summarized information was derived.

California State University, Los Angeles Foundation
Notes to Financial Statements June 30, 2019
11
Adoption of new accounting pronouncement For the year ended June 30, 2019, the Foundation has adopted the Financial Accounting Standards Board's Accounting Standards Update ("ASU") No. 2016-14, Not-for-Profit Entities (Topic 958): Presentation of Financial Statements of Not-for-Profit Entities. The update addressed the complexity and understandability of net asset classification, deficiencies in information about liquidity and availability of resources, and the lack of consistency in the type of information provided about expenses and investment return between not-for-profit entities. A key change required by ASU 2016-14 are the net asset classes used in these financial statements. Amounts previously reported as unrestricted net assets are now reported as net assets without donor restrictions, and amounts previously reported as temporarily restricted net assets and permanently restricted net assets, if applicable, are now reported as net assets with donor restrictions.
Reclassifications Certain 2018 amounts have been reclassified to conform to the 2019 presentation.
Subsequent events The Foundation has evaluated subsequent events through September 26, 2019, which is the date the financial statements were available to be issued.
Note 2 - Liquidity and availability
The Foundation regularly monitors liquidity required to meet its operating needs and other contractual commitments. The Foundation has various sources of liquidity at its disposal, including cash and cash equivalents, receivables and investments.
At June 30, 2019, the Foundation had the following financial assets and liquidity resources available over the next 12 months:
Cash and cash equivalents 3,973,524$ Short-term investments 1,803,267 Accounts receivable 552,497Pledges receivable due in one year or less, net 1,517,102
7,846,390$
Note 3 - Concentrations of credit risk
Financial instruments which potentially subject the Foundation to concentrations of credit risk include cash and cash equivalents. The Foundation maintains its cash and cash equivalents and investments with high-credit quality financial institutions, which typically exceeds the federally insured limits. The Foundation has not experience any losses on such accounts and believes it is not exposed to any significant credit risk on cash and cash equivalents.
The Foundation's investments are subject to various risks, such as interest rate, credit and overall market volatility risks. Further, because of the significance of the investments to the Foundation's financial position and the level of risk inherent in most investments, it is reasonably possible that changes in the values of these investments could occur in the near term and such changes could materially affect the amounts reported in the financial statements. Management is of the opinion that the diversification of its invested assets among the various asset classes should mitigate the impact of changes.

California State University, Los Angeles Foundation
Notes to Financial Statements June 30, 2019
12
At June 30, 2019, three donors accounted for approximately 82% of the Foundation's total pledges receivable. For the year ended June 30, 2019, one donor accounted for approximately 36% of the Foundation's contributions.
Note 4 - Investments
At June 30, 2019, investments consist of the following:
Common stocks 20,590,112$ Exchanged-traded funds 3,848,063 Corporate bonds 707,478 U.S. treasury securities 434,263 U.S. agency securities 813,430Certificates of deposits 4,202,604
Mutual funds 11,109,533
Hedge funds 403,967
Alternative investments 1,250,000
Total investments 43,359,450
Less short term investments 1,803,267
Long-term investments 41,556,183$
At June 30, 2019, the Foundation has the following investments in limited partnerships that calculate net asset value ("NAV") per share:
Redemption
Investment Redemption Redemption restrictions in Unfunded
strategy NAV terms restrictions place at year-end commitments
Multi-strategy 1,250,000$ Annually None None -$
Note 5 - Fair value measurements
At June 30, 2019, financial assets that are carried at fair value are classified in the table below in one of the three categories as described in Note 1:
InvestmentsLevel 1 Level 2 Level 3 measured at NAV Total
Common stocks 20,590,112$ -$ -$ -$ 20,590,112$ Exchanged-traded funds 3,848,063 - - - 3,848,063 Corporate bonds 707,478 - - - 707,478 U.S. treasury securities 434,263 - - - 434,263 U.S. agency securities 813,430 - - - 813,430 Certificates of deposits - 4,202,604 - - 4,202,604 Mutual funds 11,109,533 - - - 11,109,533 Hedge funds 403,967 - - - 403,967 Alternative investments - - - 1,250,000 1,250,000
Total 37,906,846$ 4,202,604$ -$ 1,250,000$ 43,359,450$
California State University, Los Angeles Foundation
Notes to Financial Statements June 30, 2019
13
Financial assets valued using Level 1 inputs are based on quoted market prices within active markets and are valued on a recurring basis. Financial assets valued using Level 2 inputs are valued based on investment yields. The fair value of alternative investments is determined using the NAV of shares held by the Foundation. In some instances, the NAV may not equal the fair value that would be calculated under fair value accounting standards. For the year ended June 30, 2019, there have been no changes in the valuation methodologies.
The preceding methods may produce a fair value calculation that may not be indicative of net realizable value or reflective of future fair values. Furthermore, although the Foundation believes its valuation methods are appropriate and consistent with other market participants, the use of different methodologies or assumptions to determine the fair value of certain financial instruments could result in a different fair value measurement at the reporting date.
Note 6 - Pledges receivable
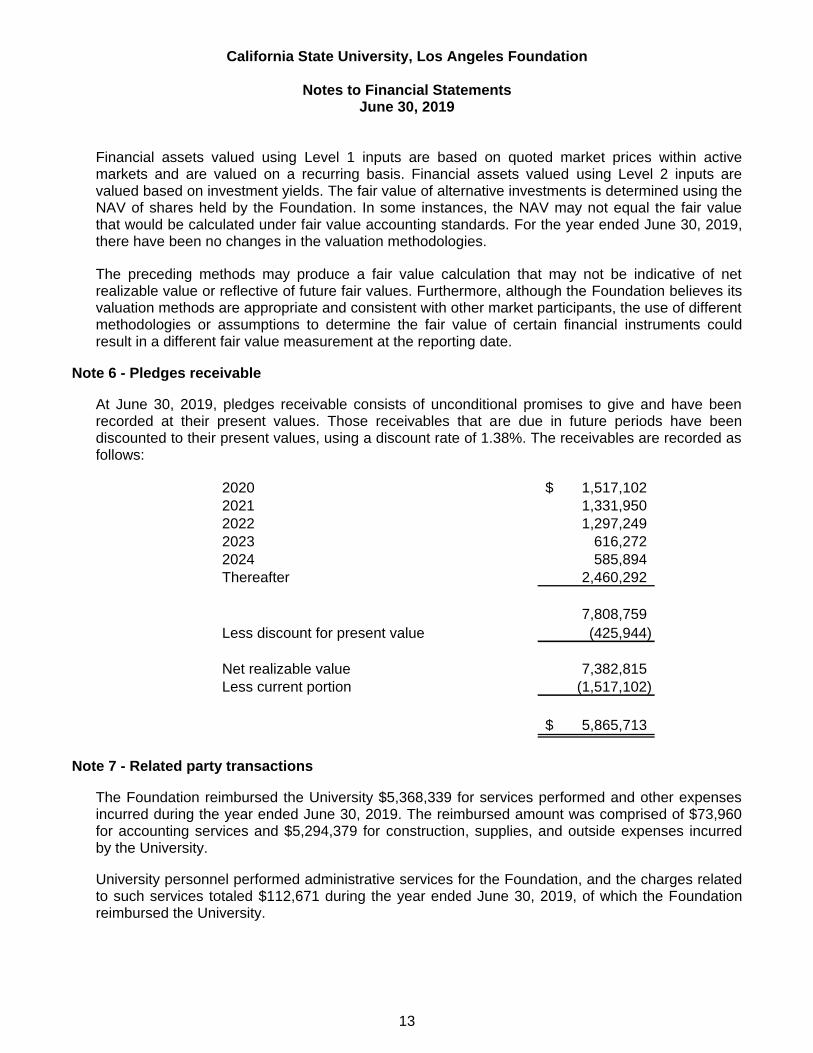
At June 30, 2019, pledges receivable consists of unconditional promises to give and have been recorded at their present values. Those receivables that are due in future periods have been discounted to their present values, using a discount rate of 1.38%. The receivables are recorded as follows:
2020 1,517,102$
2021 1,331,950
2022 1,297,249
2023 616,272
2024 585,894
Thereafter 2,460,292
7,808,759
Less discount for present value (425,944)
Net realizable value 7,382,815
Less current portion (1,517,102)
5,865,713$
Note 7 - Related party transactions
The Foundation reimbursed the University $5,368,339 for services performed and other expenses incurred during the year ended June 30, 2019. The reimbursed amount was comprised of $73,960 for accounting services and $5,294,379 for construction, supplies, and outside expenses incurred by the University.
University personnel performed administrative services for the Foundation, and the charges related to such services totaled $112,671 during the year ended June 30, 2019, of which the Foundation reimbursed the University.

California State University, Los Angeles Foundation
Notes to Financial Statements June 30, 2019
14
The University Student Union at California State University, Los Angeles ("USU") provides the staff used during the Annual Fund Drive. The Foundation reimburses these personnel costs along with an administrative fee. For the year ended June 30, 2019, the total personnel costs were $98,971 of which $2,924 was accrued. Total administrative fees paid were $4,800 for the year ended June 30, 2019.
Accounts payable between the Foundation and its affiliated parties as of June 30, 2019 is as follows:
University Auxiliary Services 1,822$
USU 2,924
University 96,288
101,034$
Note 8 - Net assets
Board designated net assets without restrictions Board designated net assets without restrictions consist of funds that are to be used for scholarships. Additionally, earnings have also been designated for scholarships. At June 30, 2019, Board designated net assets without restrictions was $975,554.
Net assets with donor restrictions At June 30, 2019, net assets with donor restrictions consist of the following:
Time or purpose:Cal State LA environment science fund, LaKretz 458,774$ Guglielmo endowed chair 379,677 Honor college 23,530 Luckman fine arts complex 625,019 Other college grants 884,614 Rongxiang Xu 5,658,660 Scholarships 10,613,945 Simulation lab 950,000 Student investment fund, Marshall Geller 283,513 Tennis projects 581,093
20,458,825 Perpetual:
Endowment investments 36,559,954
57,018,779$
Net assets totaling $36,559,954 are restricted for investments in perpetuity, primarily for scholarships and program services, which represents the Foundation's endowment funds. At the request of the donor, any interest not awarded to any qualified candidates should be retained as permanently restricted in the same year. The amount of investment income to be retained as permanently restricted was $15,363 for the year ended June 30, 2019.

California State University, Los Angeles Foundation
Notes to Financial Statements June 30, 2019
15
Net assets released from restrictions Net assets with donor restrictions were released from restrictions for the following purposes:
Scholarships 1,526,869$ College grants 5,666,540 Investment fee 220,666Annual general fund support 156,363
7,570,438$
Note 9 - Endowments
General board policy on administration of endowment funds The Board of Trustees of the Foundation has interpreted the Uniform Prudent Management of Institutional Funds Act ("UPMIFA") as requiring the preservation of the fair value of the original gift as of the gift date of the donor-restricted endowment funds absent explicit donor stipulations to the contrary. As a result of this interpretation, the Foundation classifies as permanently restricted net assets (a) the original value of gifts donated to the permanent endowment, (b) the original value of subsequent gifts donated to the permanent endowment, and (c) accumulations to the permanent endowment made in accordance with the direction of the applicable donor gift instrument at the time the accumulation is added to the fund. The remaining portion of the donor-restricted endowment fund that is not classified in permanently restricted net assets is classified as temporarily restricted net assets until those amounts are appropriated for spending by the Foundation in a manner consistent with the standard of prudence prescribed by UPMIFA.
In accordance with UPMIFA, the organization considers the following factors in making a determination to appropriate or accumulate donor-restricted endowment funds:
(1) The duration and preservation of the fund (2) The purposes of the organization and the donor-restricted endowment fund (3) General economic conditions (4) The possible effect of inflation and deflation (5) The expected total return from income and the appreciation of investments (6) Other resources of the organization (7) The investment policies of the organization
Investment policy for endowment funds The Foundation has adopted investment and spending policies, approved by the Board of Trustees, for endowment assets that attempt to provide a predictable stream of funding for the scholarships supported by its endowment assets, while also maintaining the purchasing power of those endowment assets over the long-term. Accordingly, the investment process seeks to achieve an after-cost total rate of return, including investment income as well as capital appreciation, which exceeds the annual distribution with acceptable levels of risk. Endowment assets are invested in a well-diversified asset mix, which includes equity, debt securities and mutual funds, that is intended to result in a consistent inflation-protected rate of return that has sufficient liquidity to make annual scholarship distributions of approximately 3% to 5% of the fair value of the endowment investments as of December 31, while growing the funds if possible. Investment assets and allocation between asset classes and strategies are managed to not expose the fund to unacceptable levels of risk.

California State University, Los Angeles Foundation
Notes to Financial Statements June 30, 2019
16
Spending policy for endowment funds The Foundation has a policy of appropriating for distribution for scholarships each year approximately 3% to 5% of its endowed investments' fair value as of December 31. In establishing this policy, the Foundation considered the long-term expected return on its investment assets, the nature and duration of the endowment fund which must be maintained in perpetuity because of donor restrictions, and the possible effects of inflation. The policy is consistent with the Foundation's objective to maintain the purchasing power of the endowment assets as well as to provide additional real growth through new gifts and investment return. For the year ended June 30, 2019, appropriation of $1,496,966 was made from the endowment fund for scholarship distributions.
The Foundation has a policy of appropriating 5% of all contributions received for the endowment fund annually to cover general operating expenses of the Foundation of which donors are notified of upon gift acceptance. The amount appropriated from the endowment for general operations as of June 30, 2019, was $40,517, which represented 5% of endowed contributions received.
Additionally, the Foundation has a policy of appropriating up to 1.5% of its endowment fund's fair value as of June 30 of the prior year, for general operating expenses of the Foundation as established in the annual budget for the Foundation in July of the subsequent year. During the year ended June 30, 2019, a $156,363 appropriation was made from the endowment fund for general
operations expenses.
Endowment net asset composition by type of fund as of June 30, 2019 is as follows:
Without donor
restrictions Time or purpose Perpetual Total
Donor-restricted
endowment funds -$ 5,354,435$ 36,559,954$ 41,914,389$
Board designated
endowment funds 975,554 2,599,926 - 3,575,480
Total funds 975,554$ 7,954,361$ 36,559,954$ 45,489,869$
With donor restrictions
Changes in endowment net assets for the year ended June 30, 2019 are as follows:
Without donor
restrictions Time or purpose Perpetual Total
Balance, beginning 958,429$ 7,183,269$ 34,361,781$ 42,503,479$
Investment income, net 17,125 2,405,789 15,363 2,438,277
Contributions - 19,078 2,188,316 2,207,394
Transfers in - - 35,011 35,011
Administrative fees - (446) (40,517) (40,963)
Appropriated for expenditure - (1,653,329) - (1,653,329)
Balance, end 975,554$ 7,954,361$ 36,559,954$ 45,489,869$
With donor restrictions

Supplementary Information

California State University, Los Angeles Foundation
Schedule of Net Position June 30, 2019
(for inclusion in the California State University)
See Independent Auditor's Report.
18
Assets:
Current assets:
Cash and cash equivalents 3,973,524$
Short-term investments 1,803,267
Accounts receivable, net 552,497
Capital lease receivable, current portion -
Notes receivable, current portion -
Pledges receivable, net 1,517,102
Prepaid expenses and other current assets 13,660
Total current assets 7,860,050
Noncurrent assets:
Restricted cash and cash equivalents 4,117,669
Accounts receivable, net -
Capital lease receivable, net of current portion -
Notes receivable, net of current portion -
Student loans receivable, net -
Pledges receivable, net 5,865,713
Endowment investments 37,166,258
Other long-term investments 4,389,925
Capital assets, net -
Other assets -
Total noncurrent assets 51,539,565
Total assets 59,399,615
Deferred outflows of resources:
Unamortized loss on debt refunding -
Net pension liability -
Net OPEB liability -
Others -
Total deferred outflows of resources -
Liabilities:
Current liabilities:
Accounts payable 101,808
Accrued salaries and benefits -
Accrued compensated absences, current portion -
Unearned revenues -
Capital lease obligations, current portion -
Long-term debt obligations, current portion -
Claims liability for losses and loss adjustment expenses, current portion -
Depository accounts -
Other liabilities -
Total current liabilities 101,808
Noncurrent liabilities:
Accrued compensated absences, net of current portion -
Unearned revenues -
Grants refundable -
Capital lease obligations, net of current portion -
Long-term debt obligations, net of current portion -
Claims liability for losses and loss adjustment expenses, net of current portion -
Depository accounts -
Net other postemployment benefits liability -
Net pension liability -
Other liabilities -
Total noncurrent liabilities -
Total liabilities 101,808
Deferred inflows of resources:
Service concession arrangements -
Net pension liability -
Net OPEB liability -
Unamortized gain on debt refunding -
Nonexchange transactions -
Others -
Total deferred inflows of resources -
Net Position:
Net investment in capital assets -
Restricted for: -
Nonexpendable – endowments 36,559,954
Expendable: -
Scholarships and fellowships 20,458,825
Research -
Loans -
Capital projects -
Debt service -
Others -
Unrestricted 2,279,028 Total net position 59,297,807$

California State University, Los Angeles Foundation
Schedule of Revenues, Expenses and Changes in Net Position Year Ended June 30, 2019
(for inclusion in the California State University)
See Independent Auditor's Report.
19
Revenues:
Operating revenues:
Student tuition and fees, gross -$
Scholarship allowances (enter as negative) -
Grants and contracts, noncapital:
Federal -
State -
Local -
Nongovernmental -
Sales and services of educational activities -
Sales and services of auxiliary enterprises, gross -
Scholarship allowances (enter as negative) -
Other operating revenues -
Total operating revenues -
Expenses:
Operating expenses:
Instruction -
Research -
Public service -
Academic support -
Student services -
Institutional support 707,442
Operation and maintenance of plant -
Student grants and scholarships 1,726,869
Auxiliary enterprise expenses -
Depreciation and amortization -
Total operating expenses 2,434,311
Operating income (loss) (2,434,311)
Nonoperating revenues (expenses):
State appropriations, noncapital -
Federal financial aid grants, noncapital -
State financial aid grants, noncapital -
Local financial aid grants, noncapital -
Nongovernmental and other financial aid grants, noncapital -
Other federal nonoperating grants, noncapital -
Gifts, noncapital 1,723,354
Investment income (loss), net 319,233
Endowment income (loss), net 2,362,819
Interest expense -
Other nonoperating revenues (expenses) - excl. interagency transfers -
Other nonoperating revenues (expenses) - interagency transfers (5,666,540)
Net nonoperating revenues (expenses) (1,261,134)
Income (loss) before other revenues (expenses) (3,695,445)
State appropriations, capital -
Grants and gifts, capital -
Additions (reductions) to permanent endowments 2,188,316
Increase (decrease) in net position (1,507,129)
Net position:
Net position at beginning of year, as previously reported 60,804,936
Restatements
Net position at beginning of year, as restated 60,804,936 Net position at end of year 59,297,807$

California State University, Los Angeles Foundation
Other Information June 30, 2019
(for inclusion in the California State University)
20
1 Cash and cash equivalents:
Portion of restricted cash and cash equivalents related to endowments $ 4,117,669
All other restricted cash and cash equivalents -
Noncurrent restricted cash and cash equivalents 4,117,669
Current cash and cash equivalents 3,973,524 Total $ 8,091,193
2.1 Composition of investments:
Current Noncurrent Total
Money market funds $ - $ - $ -
Repurchase agreements - - -
Certificates of deposit 1,803,267 2,399,337 4,202,604
U.S. agency securities - 1,247,693 1,247,693
U.S. treasury securities - - -
Municipal bonds - - -
Corporate bonds - 707,478 707,478
Asset backed securities - - -
Mortgage backed securities - - -
Commercial paper - - -
Mutual funds - 11,109,533 11,109,533
Exchange traded funds - 3,848,063 3,848,063
Equity securities - 20,590,112 20,590,112
Alternative investments:
Private equity (including limited partnerships) - - -
Hedge funds - 1,653,967 1,653,967
Managed futures - - -
Real estate investments (including REITs) - - -
Commodities - - -
Derivatives - - -
Other alternative investment types - - -
Other external investment pools (excluding SWIFT) - - -
Other investments - - -
State of California Local Agency Investment Fund (LAIF) - - -
State of California Surplus Money Investment Fund (SMIF) - - -
Total investments 1,803,267 41,556,183 43,359,450
Less endowment investments (enter as negative number) - (37,166,258) (37,166,258)
Total investments, net of endowments $ 1,803,267 $ 4,389,925 $ 6,193,192

California State University, Los Angeles Foundation
Other Information June 30, 2019
(for inclusion in the California State University)
21
2.2 Fair value hierarchy in investments:
Total
Quoted Prices in
Active Markets for
Identical Assets
(Level 1)
Significant Other
Observable Inputs
(Level 2)
Significant
Unobservable Inputs
(Level 3)
Net Asset Value
(NAV)
Money market funds $ - $ - $ - $ - $ -
Repurchase agreements - - - - -
Certificates of deposit 4,202,604 - 4,202,604 - -
U.S. agency securities 1,247,693 1,247,693 - - -
U.S. treasury securities - - - - -
Municipal bonds - - - - -
Corporate bonds 707,478 707,478 - - -
Asset backed securities - - - - -
Mortgage backed securities - - - - -
Commercial paper - - - - -
Mutual funds 11,109,533 11,109,533 - - -
Exchange traded funds 3,848,063 3,848,063 - - -
Equity securities 20,590,112 20,590,112 - - -
Alternative investments:
Private equity (including limited partnerships) - - - - -
Hedge funds 1,653,967 1,653,967 - - -
Managed futures - - - - -
Real estate investments (including REITs) - - - - -
Commodities - - - - -
Derivatives - - - - -
Other alternative investment types - - - - -
Other external investment pools (excluding SWIFT) - - - - -
Other investments - - - - -
State of California Local Agency Investment Fund (LAIF) - - - - -
State of California Surplus Money Investment Fund (SMIF) - - - - - Total investments $ 43,359,450 $ 39,156,846 $ 4,202,604 $ - $ -
2.3 Investments held by the University under contractual agreements:
Instruction: Amounts should agree with University's investments held on behalf of
Discretely Presented Component Units. Current Noncurrent Total
Investments held by the University under contractual agreements (e.g CSU
Consolidated SWIFT Inv pool): - - $ -

California State University, Los Angeles Foundation
Other Information June 30, 2019
(for inclusion in the California State University)
22
3.1 Composition of capital assets:
Balance
June 30, 2018 Reclassifications
Prior Period
Additions
Prior Period
Retirements
Balance
June 30, 2018
(Restated) Additions Retirements
Transfer of
completed CWIP
Balance
June 30, 2019
Non-depreciable/Non-amortizable capital assets:
Land and land improvements $ - $ - $ - $ - $ - $ - $ - $ - $ -
Works of art and historical treasures - - - - - - - - -
Construction work in progress (CWIP) - - - - - - - - -
Intangible assets:
Rights and easements - - - - - - - - -
Patents, copyrights and trademarks - - - - - - - - -
Intangible assets in progress (PWIP) - - - - - - - - -
Licenses and permits - - - - - - - - -
Other intangible assets - - - - - - - - -
Total intangible assets - - - - - - - - -
Total non-depreciable/non-amortizable capital assets - - - - - - - - -
Depreciable/Amortizable capital assets:
Buildings and building improvements 77,900 - - - 77,900 - - - 77,900
Improvements, other than buildings - - - - - - - - -
Infrastructure - - - - - - - - -
Leasehold improvements - - - - - - - - -
Personal property:
Equipment - - - - - - - - -
Library books and materials - - - - - - - - -
Intangible assets:
Software and websites - - - - - - - - -
Rights and easements - - - - - - - - -
Patents, copyrights and trademarks - - - - - - - - -
Licenses and permits - - - - - - - - -
Other intangible assets - - - - - - - - -
Total intangible assets - - - - - - - - -
Total depreciable/amortizable capital assets 77,900 - - - 77,900 - - - 77,900
Total capital assets 77,900 - - - 77,900 - - - 77,900
Less accumulated depreciation/amortization: (enter as negative number, except
for reductions enter as positive number)
Buildings and building improvements (77,900) - - - (77,900) - - - (77,900)
Improvements, other than buildings - - - - - - - - -
Infrastructure - - - - - - - - -
Leasehold improvements - - - - - - - - -
Personal property:
Equipment - - - - - - - - -
Library books and materials - - - - - - - - -
Intangible assets:
Software and websites - - - - - - - - -
Rights and easements - - - - - - - - -
Patents, copyrights and trademarks - - - - - - - - -
Licenses and permits - - - - - - - - -
Other intangible assets - - - - - -
Total intangible assets - - - - - - - - -
Total accumulated depreciation/amortization (77,900) - - - (77,900) - - - (77,900)Total capital assets, net $ - $ - $ - $ - $ - $ - $ - $ - $ -
3.2 Detail of depreciation and amortization expense:
Depreciation and amortization expense related to capital assets $ -
Amortization expense related to other assets - Total depreciation and amortization $ -

California State University, Los Angeles Foundation
Other Information June 30, 2019
(for inclusion in the California State University)
23
4 Long-term liabilities:
Balance
June 30, 2018
Prior Period
Adjustments/Reclassi
fications
Balance
June 30, 2018
(Restated) Additions Reductions
Balance
June 30, 2019 Current Portion
Noncurrent
Portion
1. Accrued compensated absences $ - $ - $ - $ - $ - $ - $ - $ -
2. Claims liability for losses and loss adjustment expenses - - - - - - - -
3. Capital lease obligations:
Gross balance - - - - - - - -
Unamortized net premium/(discount) - - - - - - - -
Total capital lease obligations - - - - - - - -
4. Long-term debt obligations:
4.1 Auxiliary revenue bonds (non-SRB related) - - - - - - - -
4.2 Commercial paper - - - - - - - -
4.3 Notes payable (SRB related) - - - - - - - -
4.4 Others:
Total others - - - - - - -
Sub-total long-term debt - - - - - - - -
4.5 Unamortized net bond premium/(discount) - - - - -
Total long-term debt obligations - - - - - - - - Total long-term liabilities $ - $ - $ - $ - $ - $ - $ - $ -
5 Capital lease obligations schedule:
Principal Only Interest Only
Principal and
Interest Principal Only Interest Only Principal and Interest Principal Only Interest Only
Principal and
Interest
Year ending June 30:
2020 $ - $ - $ - $ - $ - $ - $ - $ - $ -
2021 - - - - - - - - -
2022 - - - - - - - - -
2023 - - - - - - - - -
2024 - - - - - - - - -
2025 - 2029 - - - - - - - - -
2030 - 2034 - - - - - - - - -
2035 - 2039 - - - - - - - - -
2040 - 2044 - - - - - - - - -
2045 - 2049 - - - - - - - - -
Thereafter - - - - - - - - -
Total minimum lease payments - - - - - - - - -
Less: amounts representing interest -
Present value of future minimum lease payments -
Unamortized net premium/(discount) -
Total capital lease obligations -
Less: current portion - Capital lease obligations, net of current portion $ -
Capital lease obligations related to SRB All other capital lease obligations Total capital lease obligations

California State University, Los Angeles Foundation
Other Information June 30, 2019
(for inclusion in the California State University)
24
6 Long-term debt obligations schedule:
Principal Only Interest Only
Principal and
Interest Principal Only Interest Only Principal and Interest Principal Only Interest Only
Principal and
Interest
Year ending June 30:
2020 $ - $ - $ - $ - $ - $ - $ - $ - $ -
2021 - - - - - - - - -
2022 - - - - - - - - -
2023 - - - - - - - - -
2024 - - - - - - - - -
2025 - 2029 - - - - - - - - -
2030 - 2034 - - - - - - - - -
2035 - 2039 - - - - - - - - -
2040 - 2044 - - - - - - - - -
2045 - 2049 - - - - - - - - -
Thereafter - - - - - - - - -
Total minimum payments - - - - - - - - -
Less: amounts representing interest -
Present value of future minimum payments -
Unamortized net premium/(discount) -
Total long-term debt obligations -
Less: current portion -
Long-term debt obligations, net of current portion $ -
7 Transactions with related entities:Payments to University for salaries of University personnel working on contracts,
grants, and other programs $ 112,671
Payments to University for other than salaries of University personnel 5,368,339
Payments received from University for services, space, and programs -
Gifts-in-kind to the University from discretely presented component units 1,496,509
Gifts (cash or assets) to the University from discretely presented component units -
Accounts (payable to) University (enter as negative number) (96,288)
Other amounts (payable to) University (enter as negative number) -
Accounts receivable from University (enter as positive number) -
Other amounts receivable from University (enter as positive number) -
8 Restatements/Prior period adjustments:
Debit/(Credit)
Transaction #1
Transaction #2
Auxiliary revenue bonds (non-SRB related) All other long-term debt obligations Total long-term debt obligations
Provide a detailed breakdown of the journal entries (at the financial statement line items level) booked to record each restatement/PPA:
Enter transaction description
Enter transaction description
California State University, Los Angeles Foundation
Other Information June 30, 2019
(for inclusion in the California State University)
See Independent Auditor's Report.
25
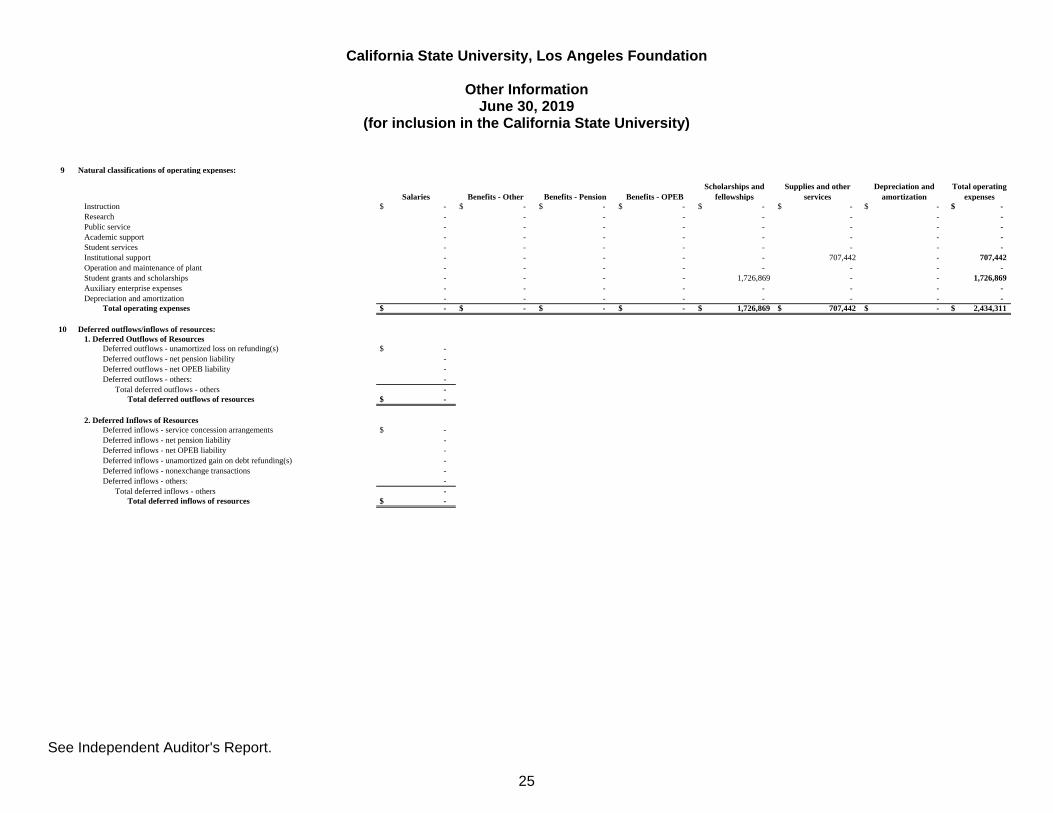
9 Natural classifications of operating expenses:
Salaries Benefits - Other Benefits - Pension Benefits - OPEB
Scholarships and
fellowships
Supplies and other
services
Depreciation and
amortization
Total operating
expenses
Instruction $ - $ - $ - $ - $ - $ - $ - $ -
Research - - - - - - - -
Public service - - - - - - - -
Academic support - - - - - - - -
Student services - - - - - - - -
Institutional support - - - - - 707,442 - 707,442
Operation and maintenance of plant - - - - - - - -
Student grants and scholarships - - - - 1,726,869 - - 1,726,869
Auxiliary enterprise expenses - - - - - - - -
Depreciation and amortization - - - - - - - -
Total operating expenses $ - $ - $ - $ - $ 1,726,869 $ 707,442 $ - $ 2,434,311
10 Deferred outflows/inflows of resources:
1. Deferred Outflows of Resources
Deferred outflows - unamortized loss on refunding(s) $ -
Deferred outflows - net pension liability -
Deferred outflows - net OPEB liability -
Deferred outflows - others: -
Total deferred outflows - others -
Total deferred outflows of resources $ -
2. Deferred Inflows of Resources
Deferred inflows - service concession arrangements $ -
Deferred inflows - net pension liability -
Deferred inflows - net OPEB liability -
Deferred inflows - unamortized gain on debt refunding(s) -
Deferred inflows - nonexchange transactions -
Deferred inflows - others: -
Total deferred inflows - others -
Total deferred inflows of resources $ -


