CAD/CAE of Blanks for Post-Machining Stretch Forming of
Complex Aircraft Panels
Ruibiao Song
A Thesis
In the Department
of
Mechanical and Industrial Engineering
Presented in Partial Fulfillment of the Requirements
For the Degree of Master of Applied Science at
Concordia University
Montreal, Quebec, Canada
April 2014
© Ruibiao Song, 2014

CONCORDIA UNIVERSITYSchool of Graduate Studies
This is to certify that the thesis prepared
By:
Entitled:
and submitted in partial fulfillment of the requirements for the degree of
complies with the regulations of the University and meets the accepted standards withrespect to originality and quality.
Signed by the final examining committee:
______________________________________ Chair
______________________________________ Examiner
______________________________________ Examiner
______________________________________ Supervisor
Approved by ________________________________________________Chair of Department or Graduate Program Director
________________________________________________Dean of Faculty
Date ________________________________________________
Ruibiao Song
CAD/CAE of Blanks for Post-Machining Stretch Forming of Complex Aircraft Panels
Master of Applied Science (Mechanical Engineering)
Dr. A. K. Waizuddin Ahmed
Dr. Youming Zhang
Dr. Liangzhu Wang
Dr. Zezhong Chen

III
ABSTRACT
CAD/CAE of Blanks for Post-Machining Stretch Forming of Complex Aircraft Panels
Ruibiao Song
In this thesis, it mainly focuses on the blank design for the precision stretch
forming process of aircraft skin. According to the industry survey and literature review, in
the current aerospace industry, the most popular manufacture method for aircraft skin is
that the gripper jaws of stretch forming machine hold two ends of the flat blank sheet,
stretch and wrap it onto the die to form the desired shape. In this process, the flat blank
to be deformed is usually an intact blank sheet with identical thickness. After the
deformation, milling process is performed on the curved panel. However, the quality of
the curved sheet metal is relatively difficult to be guaranteed since the process of stretch
forming would introduce the machining accuracy problem in the milling process.
To improve the quality of the formed part, a new approach is proposed in this
thesis for the aircraft skin manufacture. By employing the designed flat blank with
pockets pre-machined, the stretch forming process is conducted to form the designed
aircraft skin. Comparing with the traditional method that the pockets are machined after
the blank deformed, this approach relatively increased the accuracy of pockets positions
and shapes and it eliminated the machining difficulty on the curved surface. To study the
IV
feasibility and reliability of this method, the commercial tools of CAD software CATIA and
FEA simulation software were utilized for research, in which the CAD data of the FEA
simulation output was analysed by the CAD software and then input the modified data
to FEA again.
To precisely determine whether the shape and position of the pocket features
have met the requirement, the major clue is to evaluate the deformed features in X, Y
and Z three directions respectively. Once the formed part is coincidence with the
correspondence designed features in these three directions, it means that the designed
flat blank could be adopted for stretch forming. To consider the deviation in Z direction,
it could be converted to the problem of springback value minimization in Z direction.
Due to the large number of factors that influence the springback, optimization method is
employed to integrate those possible factors and find the optimal solution. For the
deviation in X and Y directions, they are studied through the projection of the profiles on
the XY plane. By using shape sensitivity method that judging the influence of two
designed blanks offset on the formed pockets profiles, the previous designed flat blank is
updated. Comparing the results of different methods, the shape sensitivity method
showed a result of efficiently decreasing in the iteration numbers of flat blank design
modification and reduction in the shapes deviation between the formed pocket profiles

V
and the target pocket profiles.

VI
ACKNOWLEDGEMENTS
I hereby wish to express my sincere gratitude and thanks to my supervisor, Dr.
Chevy Chen, for his precious guidance and patient tutorials that lead me throughout this
work. Not only to mention how extraordinary he is as my supervisor in my research, but
also he is truly a teacher of my spirit. It was him who keeps propelling me forward and
changes me a lot with the example of his own meticulous attitude on doing researches.
I also need to say special thanks to the people in Bombardier, Jean-Francois
Lalonde and Benjamin Larregain. In my research period, they always gave me the
valuable instructions in industry standard. Also, their information made my work
meaningful with real production.
Additionally, I would like to pass my appreciation to all the dear fellows in our lab,
for the tireless help you generously offered when I encountered problems and doubts. I
could have needed to face a lot more obstacles to finish this work without your help.
Finally, I give my special thanks to my parents and my fiancee, for giving me all
their selfless love, as always, and supporting me in every aspect during my study.
VII
List of Figures
Figure 1.1 Samples of aircraft skins ...............................................................................1
Figure 1.2 Stretch forming machine ..............................................................................2
Figure 2.1 Simplified mechanism of VTL1000 kinematic movement ............................16
Figure 2.2 Revolution angle of jaws .............................................................................17
Figure 2.3 Yoke swing angle ........................................................................................17
Figure 2.4 Jaws curvature design ................................................................................18
Figure 2.5 Pre-stretch stage ........................................................................................19
Figure 2.6 Wrap forming stage ....................................................................................20
Figure 2.7 Additional stretch stage ..............................................................................22
Figure 2.8 Locking definition for half model ................................................................24
Figure 2.9 Forming limit diagram ................................................................................27
Figure 2.10 Design variable in pre-stretch stage ..........................................................29
Figure 2.11 Design variable in additional stretch stage ................................................30
Figure 2.12 FLD quality evaluation for the formed part ...............................................34
Figure 2.13 Optimum point of optimization result verification in Pam-Stamp .............41
Figure 3.1 Blank design procedures flowchart .............................................................43
VIII
Figure 3.2 Designed panel with simple features ..........................................................44
Figure 3.3 Illustration of single curvature panel unfolding ...........................................45
Figure 3.4 Procedures for the obtaining the initial pockets position ............................46
Figure 3.5 Deformed part without outline compensation ...........................................47
Figure 3.6 Thickness distribution of the deformed part without outline compensation
......................................................................................................................................48
Figure 3.7 Blank outline design methods - compensation in transverse direction ........48
Figure 3.8 Blank outline design methods - compensation in longitudinal direction .....49
Figure 3.9 Blank outline design methods - partial compensation ................................49
Figure 3.10 Illustration of springback value in Z direction ............................................51
Figure 3.11 Comparison of the deformed profiles of the initial blank design and target
profiles ..........................................................................................................................52
Figure 3.12 Illustration of the parameters to define the deviation in X and Y direction 53
Figure 3.13 Design parameters of pockets on flat blank ..............................................54
Figure 3.14 Pocket profiles in four iterations ...............................................................55
Figure 3.15 Designed panel of double curvature with complex features......................57
Figure 3.16 Size of the designed part ..........................................................................57
Figure 3.17 Flattened surface length distortion ...........................................................58
IX
Figure 3.18 Initial pockets position determination for double curvature panel ............59
Figure 3.19 Dimensions of initial blank design ............................................................60
Figure 3.20 Springback value distribution in Z direction ..............................................61
Figure 3.21 Comparison of pocket profiles between the deformed profiles after first
iteration and target profile .............................................................................................62
Figure 3.22 Profiles dispersing and correspondence relationship setup.......................63
Figure 3.23 Movement of node in deformation process ..............................................64
Figure 3.24 Node on designed flat blank .....................................................................64
Figure 3.25 Node on deformed panel..........................................................................65
Figure 3.26 Numbering and six iterations of five pocket profiles .................................66
Figure 3.27 Iteration comparison of pocket profile 5 ...................................................67
Figure 3.28 Thickness distribution of the deformed part area 1 ..................................71
Figure 3.29 Thickness distribution of the deformed part area 2 ..................................71
Figure 3.30 Quality evaluation of the deformed part...................................................72
Figure 3.31 Shape deviation caused by the meshing edges .........................................73
Figure 4.1 Designed part of example 1 ........................................................................75
Figure 4.2 Shape deviation comparison in XY plane between the target profile and
deformed profile of first iteration ..................................................................................76

X
Figure 4.3 Evaluation of the shape deviation in X and Y directions of example 1 .........77
Figure 4.4 Thickness distribution of area 1 of example 1 .............................................78
Figure 4.5 Thickness distribution of area 2 of example 1 .............................................78
Figure 4.6 Thickness distribution of area 3 of example 1 .............................................79
Figure 4.7 Designed part of example 2 ........................................................................80

XI
List of Tables
Table 2.1 Design variables ...........................................................................................30
Table 2.2 Experimental design of five-fator sixteen-level orthogonal array ..................33
Table 2.3 Simulation results for each experimental run ...............................................33
Table 2.4 Experimental Design for Reliability and Sensitivity .......................................35
Table 2.5 Springback value change of the sensitivity and reliability simulations ..........36
Table 2.6 Values for velocities .....................................................................................37
Table 2.7 New design variables ...................................................................................37
Table 2.8 Experimental Design of two-factor five-level ................................................37
Table 2.9 Coefficients of polynomial equations ...........................................................39
Table 2.10 Optimization result with different initial points of polynomial equation of
degree 2 ........................................................................................................................39
Table 2.11 Local minimum point of the polynomial equations ....................................40
Table 3.1 Pockets deviation with the target profile in four iterations ...........................56
Table 3.2 Maximum deviations between the formed profiles and the target profiles on
XY plane by using the sensitivity method .......................................................................68
Table 3.3 Setting the sensitive factor as 1 in all the iterations......................................68

XII
Table 3.4 Setting the sensitive factor as 0.5 in all the iterations ...................................69
Table 4.1 Maximum springback value in five iterations of example 1 ..........................76
Table 4.2 Maximum deviations between the formed profiles and the target profiles on
XY plane of example 1....................................................................................................77
Table 4.3 Maximum springback value in five iterations of example 2 ..........................81
Table 4.4 Maximum deviations between the formed profiles and the target profiles on
XY plane of example 2....................................................................................................81

XIII
Table of Contents
ACKNOWLEDGEMENTS ............................................................................................ VI
List of Figures .......................................................................................................... VII
List of Tables ............................................................................................................ XI
Table of Contents ................................................................................................... XIII
CHAPTER 1 INTRODUCTION .................................................................................... 1
1.1 Aircraft Skin .................................................................................................. 1
1.2 Stretch Forming Process ................................................................................ 2
1.3 Literature Review .......................................................................................... 3
1.3.1 Stretch Forming Process....................................................................... 4
1.3.2 Optimum Blank Design ........................................................................ 6
1.4 Limitations of Current Manufacture Method................................................. 8
1.5 Research Objective ....................................................................................... 9
1.6 Thesis Outline ............................................................................................. 11
CHAPTER 2 SPRINGBACK VALUE MINIMIZATION BY THE STRETCH FORMING PROCESS ANALYSIS ................................................................................................. 12
2.1 Introduction ................................................................................................ 12
2.2 Stretching Forming Machine ....................................................................... 13
2.2.1 Introduction to Stretch Forming Machine........................................... 13
2.2.2 Mechanism Analysis .......................................................................... 14
2.3 Stages of the Stretch Forming Process ........................................................ 18
2.3.1 Pre-Stretch Stage ............................................................................... 18
2.3.2 Wrap Forming Stage .......................................................................... 19
2.3.3 Additional Stretch Stage .................................................................... 21
2.3.4 Trimming and Springback .................................................................. 22
2.4 Material Properties ..................................................................................... 24
2.4.1 Characteristics ................................................................................... 24
XIV
2.4.2 HILL 90 Material Law ......................................................................... 25
2.4.3 Forming Limit Diagram ...................................................................... 26
2.5 Determination of Stretch Forming Loading Trajectory ................................. 28
2.5.1 Definition of Design Variables ............................................................ 29
2.5.2 Identification of the Criterion to be Optimized ................................... 30
2.5.3 Identification of the Constraints ......................................................... 31
2.5.4 General Global Search with Meta-Model Numerical Simulation ......... 32
2.5.5 Response Surface Setup and Optimal Solution Calculation ................. 36
CHAPTER 3 POCKETS POSITION DESIGN ON FLAT BLANK SHEET ........................... 42
3.1 Introduction ................................................................................................ 42
3.2 Blank Design for Aircraft Skin with Simple Pocket Features ......................... 43
3.2.1. Initial pocket position assumption..................................................... 44
3.2.2. Initial blank outline determination .................................................... 46
3.2.3 Shape Deviation Evaluation ............................................................... 50
3.2.4 Modification of Blank Design ............................................................. 53
3.2.5 Simulation Result ............................................................................... 54
3.3 Blank Design for Aircraft Skin with Complex Pocket Features ...................... 56
3.3.1 Initial Blank Design ............................................................................ 58
3.3.2 Shape Deviation Evaluation of the Formed Part ................................. 60
3.3.3 Blank Design Modification by Sensitive Method ................................. 63
3.3.4 Simulation Results Comparison and Analysis ..................................... 66
3.3.5 Quality of the Deformed Part and Analysis ........................................ 70
CHAPTER 4 APPLICATIONS .................................................................................... 74
4.1 Example 1 ................................................................................................... 74
4.2 Example 2 ................................................................................................... 79
CHAPTER 5 Conclusions and Future Work ............................................................. 83
5.1 Conclusions ................................................................................................. 83
5.2 Future work ................................................................................................ 84
Bibliography ......................................................................................................... 86

1
CHAPTER 1 INTRODUCTION
1.1 Aircraft Skin
In the aircraft design, the skin plays an important role in carrying loads and its
quality directly influences the assembling accuracy and lifetime of aircraft. The function
of skin is to assemble with stiffeners for transferring the aerodynamic loads acting on
the skin onto the frames, so that the shape of the skin is usually designed as the curved
sheet panel with several features, like the pockets in the inner side of the skin with
certain depth. The properties of features on the skin are varied according to the
different assembling purposes. They could have different and irregular shapes, as two
samples shown in Figure 1.1. The thickness of the panel is usually around 2mm to 3mm.
Figure 1.1 Samples of aircraft skins
2
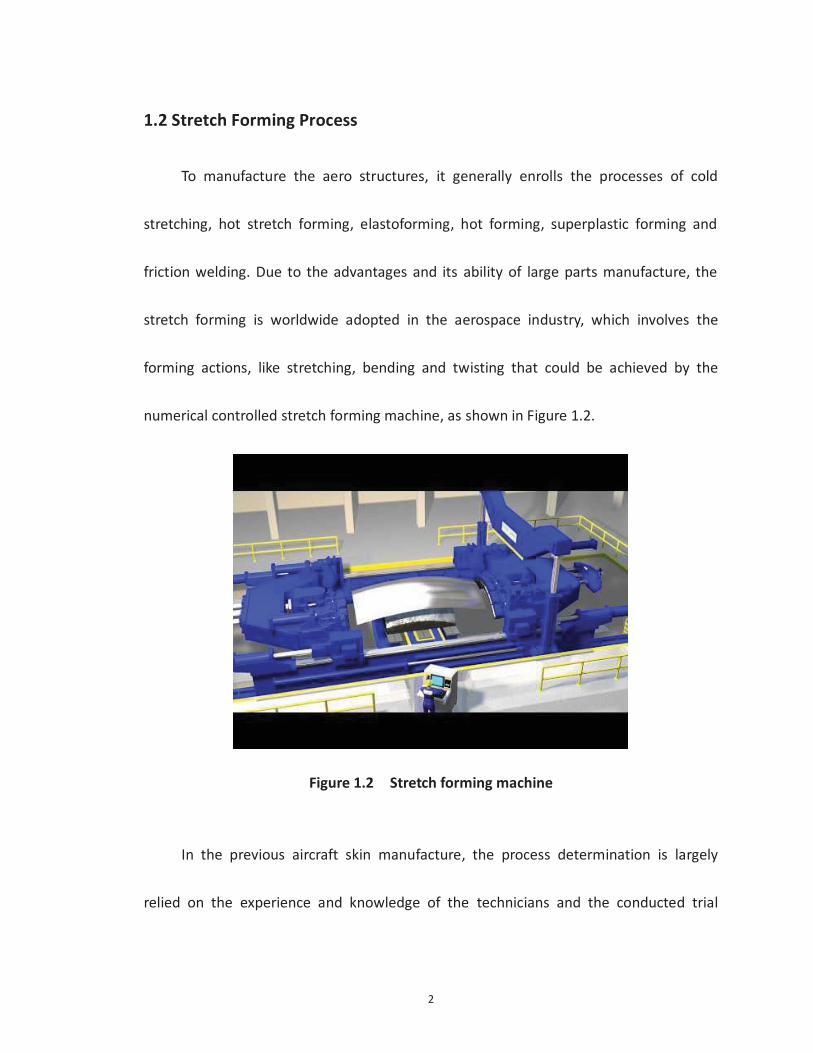
1.2 Stretch Forming Process
To manufacture the aero structures, it generally enrolls the processes of cold
stretching, hot stretch forming, elastoforming, hot forming, superplastic forming and
friction welding. Due to the advantages and its ability of large parts manufacture, the
stretch forming is worldwide adopted in the aerospace industry, which involves the
forming actions, like stretching, bending and twisting that could be achieved by the
numerical controlled stretch forming machine, as shown in Figure 1.2.
Figure 1.2 Stretch forming machine
In the previous aircraft skin manufacture, the process determination is largely
relied on the experience and knowledge of the technicians and the conducted trial

3
experiments to find the optimal solution. With the development of the numerical
controlled technology and its application on the stretch forming machine, more and
more researchers have focused on the utilization of numerical simulation with finite
element analysis method to study the stretch forming process. By building the model for
the forming tools, simulating the kinematic movement of the machine and conducting
experiments to obtain the material properties, the sheet panel deformation process is
treated as the real manufacture condition, which greatly reduced the experiment time
and cost consumption. At the same time, the numerical simulation technology
guaranteed and improved the formed part quality.
1.3 Literature Review
A lot of technical articles and relative researches can be found in the field of
aircraft skin stretch forming. A. Parris [1] in his Ph.D. thesis focused on the topic of
improving of the precision of the stretch forming process. By building a two-dimensional
analytical model of the stretch forming operation, it predicted the stresses, strains,
springback and also assessed the effects of material parameters variation, pre and post
stretch, friction, chemical milling, cross-section and routing. Also, it revealed the
significant variation of die table movement, force, strain and separation of the part from

4
die, a measure of springback. It could say that it introduced most of the related issues
and gave people the general idea about the stretch forming process.
1.3.1 Stretch Forming Process
In the current and most popular stretch forming process method, based on the
designed skin, the stretch machine performs the process onto an intact blank sheet with
uniform thickness. Many researches have been done on the process of stretch forming
to try to improve the quality of the formed part. Wisselink and van den Boogaard [2]
published an article about the delicate relation between material models and forming
limits by modeling the material with the Vegter yield function. The demonstration of the
work hardening and the shape of the yield function both influence the FLC explained the
importance of proper process parameters. The process parameters also could affect the
strain and stress distribution significantly [3, 4, 5, 6]. Zhang and Zhou [3] proposed the
initial loading trajectory of double curve skin through analytic method and combined
finite element analysis and optimization algorithms SQP to acquire the reasonable
loading trajectory. However, the article did not mention how to establish the explicit
function for the optimization objective. In another article published by Zhang and Zhou
[4], it analyzed the possible defects in stretch forming and springback generation

5
mechanism. Based on the springback value of each independent stretch forming case,
they established the respond surface and using NPQLP optimization algorithm under the
restrictive of maximal strain to obtain the reasonable process parameters. Han and Wan
[5] proposed a method for selecting the major parameters effect on the product quality.
The multi-objective problem was dealt as the objective function by transforming the
multi-objective problem that concerns sheet metal thinning value and springback value
into a single objective function with importance factors and applying the optimization
calculation. In this method, it only took two parameters into consideration, which
cannot reflect the real manufacture condition though it simplified the calculation. He et
al. [6] applied analytical method to determine the loading trajectory and its range by
using strain control.
Refer to the stretch forming machine, Liu [7] and He [8] researched on the
kinematic movements of stretch forming machine of different models. He and Zhou [7]
studied the mechanism of motion according to the FET1200. The motion locus of the clip
is calculated by using the theory of gyration tensor and the knowledge of computer
graphics. He et al. [8] wrote an article combining the process design, numerical
simulation and NC stretch forming. They built the stretch forming equipment VTL1000
NC from Cyril Bath Company and then using geometry analysis method to introduce the

6
relation between sheet metal deformations and loading of mechanism motion, which
integrated the stretch forming process design, analysis and manufacture coincidence
with the real manufacture condition.
1.3.2 Optimum Blank Design
In the stretch forming process, besides the importance of the stretch forming
process parameters, the proper designed optimal blank is also a key factor that
influences the formed part quality. In this thesis, the blank design is an important part of
work to obtain the desired aircraft skin. It mainly relates to the location and shape of the
features on the flat sheet metal. From the literature review, it could be found that
several methods have been developed.
Karima [9], Vogel and Lee [10], Chen and Sowerby [11, 12], Kuwabara and Si [13],
Parsa et al. [14] used the slip line field method to obtain the optimum blank. This
approach modelled the plastic deformation in plane strain only for a solid part that can
be represented as a rigid-plastic body that elasticity is not included and the loading has
to be quasi-static. Also it has some limitations, like mentioned in the article of Kuwabara
[13] that all this calculation is based on the assumptions that the material is isotropic
and the thickness of the blank does not change during the process.

7
Sowerby et al. [15], Blount and Fisher [16] and Gerdeen and Chen [17] used
geometric mapping method to determine the optimum blank. The basic theory of
geometric mapping method is trying to find the transformation relationship between
designed 3-D part and the blank sheet in 2-D by the point to point mapping. Sowerby et
al. [15] described the method of evaluating the strains over the deformed surface by
measurements of the nodal points of a grid marked on the undeformed sheet. It could
be possible to find the solution for a special case. However, due to the complex behavior
of the material and the variation of stretch forming process, any change of the
parameters of will result in the transformation modification.
Another optimum blank design method named inverse approach (IA) researched
by Barlat [18], Guo et al. [19, 20], Tang [21], Parsa [22]. In the IA method, under the
assumption that the deformation follows the minimum work path and the elasto-plastic
deformation are independent of the loading path, only two configurations are taken into
consideration: the initial flat blank sheet and the 3-D part and. Unlike the geometrical
mapping method that only cares about the geometrical relationship, it is also affected by
the material properties like yielding criteria, internal force, external force and residual
force. Tang et al. [21] proposed an enhanced inverse analysis method by using a robust
energy-based 3-D mesh mapping algorithm to obtain the initial solution and then

8
improve the accuracy. It considered the material and the process parameters to reduce
the iteration times. However, for this IA method, the path is only achievable when the
principle stretch lines directions fixed with respect to the material during deformation.
For the stretch forming with large dimension part, the process could not always follow
the proposed path.
Besides the method mentioned above, some other methods are also studied. Toh
[23], Kim [24] and Guo [25] used the trial and error method based on the FE method to
obtain the optimum blank. Ideal forming was employed by Barlat [26] and Park [27].
Park [27] combined the ideal forming theory with a deformation path iteration method.
Shim [28, 29] proposed sensitivity method and Biglari [29] improved the method by
ignoring the sensitivity coefficients from the last two iterations, which resulted as a
faster solution convergence.
1.4 Limitations of Current Manufacture Method
From the above statement, it has been known that the most popular method for
the aircraft skin manufacture is numerical controlled machine performs the stretch
forming process and then milling the pocket features on the curved panel. However, the
curvature accuracy of the deformed sheet metal after stretch forming is relatively

9
difficult to be guaranteed and thus it introduces problem in the milling process. First, it is
unavoidable to generate springback when the jaws release the part from machine,
which causes the curvature error. The curvature error is difficult to be measured so that
the milling machine cannot find the accurate machining location. Also, the springback
distribution is sensitive to change and hard to be predicted. Second, the location and
thickness of the pockets features are not easy to be controlled when milling on the
curved surface. The thickness value will be slightly varied at different areas so that the
depth to be machined needs further measurement check. And during the milling process,
it is always necessary to calculate the curvature at each point since it is no longer the
exactly same as the designed curvature because of the springback phenomenon.
1.5 Research Objective
To reduce possibility of machining error and improve the accuracy of pockets
position and shape, a new approach is proposed in this thesis by performing the pocket
milling process on the flat sheet panel before the stretch forming process. The objective
of this thesis is concluded by the following aspects:
Up to now, few researches is found related to the stretch forming of post
machined part. In this study, it tried to found the solution of this issue by comparing the

10
formed features in X, Y and Z three directions with the target profiles. If the accuracy of
these three directions reaches the tolerance, the designed blank and stretch forming
process could be adopted.
To check the deviation in Z direction, it would be achieved by measuring the
springback value in Z direction, which indicates the distance between the formed panel
and the die surface. In this way, the kinematic movement of the stretching machine, the
stretch forming process and the material properties of the blank to be stretched need to
be studied first. Due to the large number of factors considered, optimization method is
applied to try to setup the relationship between the stretch forming process parameters
and the maximum springback value.
For the deviation in X and Y directions, it could be achieved by using the shape
sensitivity method to modify the designed flat blank until it reaches the error
requirement.
Combination of the deviation in X, Y and Z three directions, the flat blank with
pockets machined could be deformed precisely coincidence with the designed part and
the quality of the panel is guaranteed.
11
1.6 Thesis Outline
In this thesis, it consists of five chapters. CHAPTER 1 gave a general introduction
about the aircraft skin, the stretch forming machine and followed by reviewed literatures
on this topic. CHAPTER 2 revealed the mechanism of stretch forming machine, stages of
the stretch forming process, related material properties and the optimization method to
minimize the maximum springback value. CHAPTER 3 focused on the method to reduce
the deviation in X and Y directions. A simple case with regular shape is introduced first
and then more complex case with multi irregular shapes are solved by sensitivity
method. CHAPTER 4 gave two examples with two different types of panels to prove the
feasibility and reliability of this blank design method. CHAPTER 5 concluded the blank
design method and proposed the possible future work based on this current work.

12
CHAPTER 2 SPRINGBACK VALUE MINIMIZATION BY
THE STRETCH FORMING PROCESS ANALYSIS
2.1 Introduction
As the widespread manufacture process in the aerospace industry, the stretch
forming keeps the ability of large parts manufacturing, most often made of Aluminum,
with lower tooling costs than the regular drawing tools due to less run. Through the
upward movement of the die and the wrapping movement of the jaws that include the
deformation of stretching, bending, twisting and their combination, the designed shape
of the panel could be formed. According to the current production and research, the
major stages employed are wrap forming and additional stretch, or pre-stretch, wrap
forming and additional stretch [6]. However, this process is complicated that changing
the parameters of process could result in possible defects like over tinning in some area,
wrinkle and large springback.
In this chapter, the stretch machine of VTL1000 from Cyril Bath Company will be
studied first to find the possible kinematic movement. And then the influence of the
parameters of each stage in stretch forming is introduced. The parts of single curvature,

13
double curvature are included in this chapter.
2.2 Stretching Forming Machine
2.2.1 Introduction to Stretch Forming Machine
In the forming process of aircraft skin, the stretch forming machine could achieve
the manufacturing process by stretching the metal beyond its elastic limits and wrapping
it around the die to obtain the desired shape, which includes the actions of stretching,
bending, compression, twisting and their combinations. The advanced machine enables
one step setting up of production runs for certain parts that seem impossible instead of
employment of several machines and multiple steps. Its application in the industry has
largely improved efficiency in time and cost saving. Since stretch forming machine also
keeps the metal under constant tension with the application of one step setting up, it
successfully suppressed the possible imperfections such as "cans" or "buckles."
ACB-Aerospace Metal Solutions and Cyril Bath are the two companies that
enrolled in the stretch forming machine manufacture. The machines are generally having
two categories: transversal stretch presses and longitudinal stretch presses. For the
transversal stretch forming machines exert a traction forces in the transversal direction
of the metal sheet. The gripper jaws are in line and rigidly mounted. The kinematics

14
impressed by the machine to the two lines of gripper jaws allows wrapping the part in a
direction tangent to the tool throughout the forming process. And for the longitudinal
stretch forming machines, it dedicated to the forming of very long sheets and they are
equipped with curvable jaws
In this study, the longitudinal stretch forming machine from Cyril Bath Company
will be employed for kinematic analysis, stretch forming process simulation and
experiment validation. Cyril Bath Company offers the options of transverse/longitudinal
VTL series press, T-series (transverse) and L-series (longitudinal) presses. Also the
tonnage rating from 150 to 3000 ton is also available. The model selected in this study is
VTL1000.
2.2.2 Mechanism Analysis
In this thesis, the numerical controlled machine that used for stretch forming are
based on the model of VTL1000 manufactured by Cyril Company as mentioned in the
above section. To analyze the kinematic movement and the possible loading trajectory
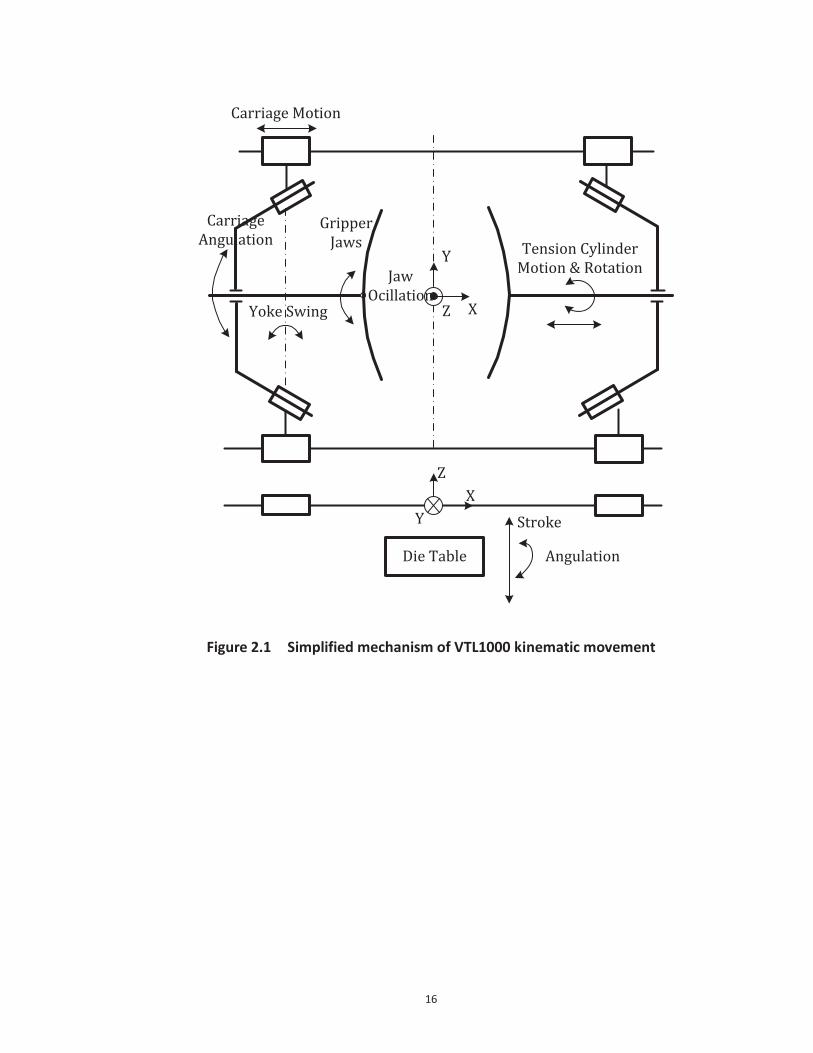
path, it is necessary to have a fully understanding of the machine. In Figure 2.1 , it shows
the simplified mechanism of VTL1000 kinematic movement.
The kinematic movement of the machine could be summarized as followed:
15
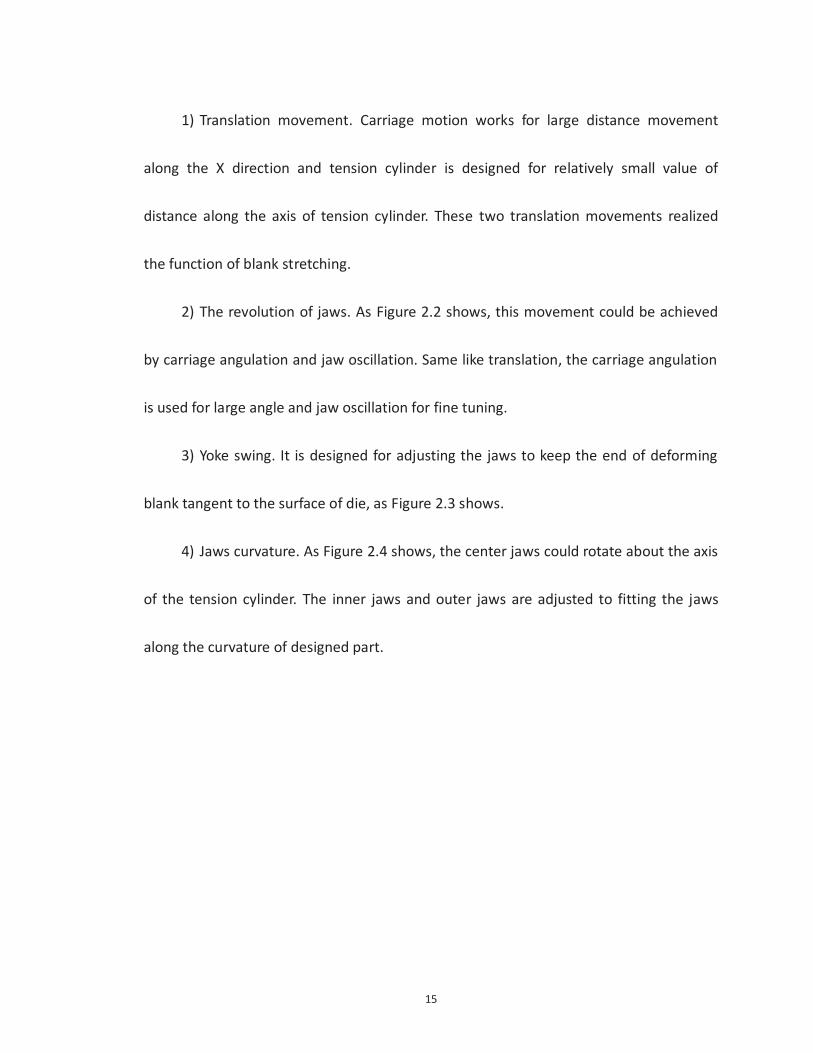
1) Translation movement. Carriage motion works for large distance movement
along the X direction and tension cylinder is designed for relatively small value of
distance along the axis of tension cylinder. These two translation movements realized
the function of blank stretching.
2) The revolution of jaws. As Figure 2.2 shows, this movement could be achieved
by carriage angulation and jaw oscillation. Same like translation, the carriage angulation
is used for large angle and jaw oscillation for fine tuning.
3) Yoke swing. It is designed for adjusting the jaws to keep the end of deforming
blank tangent to the surface of die, as Figure 2.3 shows.
4) Jaws curvature. As Figure 2.4 shows, the center jaws could rotate about the axis
of the tension cylinder. The inner jaws and outer jaws are adjusted to fitting the jaws
along the curvature of designed part.
16
Carriage Motion
Tension Cylinder Motion & Rotation
Yoke Swing
Jaw Ocillation
Gripper Jaws
X
Y
Z
XZ
Y
Die Table
Stroke
Angulation
Carriage Angulation
Figure 2.1 Simplified mechanism of VTL1000 kinematic movement

17
JawsTension cylinder
Revolution angle
X
Y
Z
Blank
Figure 2.2 Revolution angle of jaws
Die
Deforming blank
Jaws
Z
XYYoke swing
angle
Figure 2.3 Yoke swing angle

18
Die
Z
YX
Center jawInner jawOuter Jaw
Figure 2.4 Jaws curvature design
2.3 Stages of the Stretch Forming Process
In the stretch forming process, it is generally divided with several stages as
pre-stretch, wrap forming, additional stretch, trimming and springback. In this section,
each stage will be introduced.
2.3.1 Pre-Stretch Stage
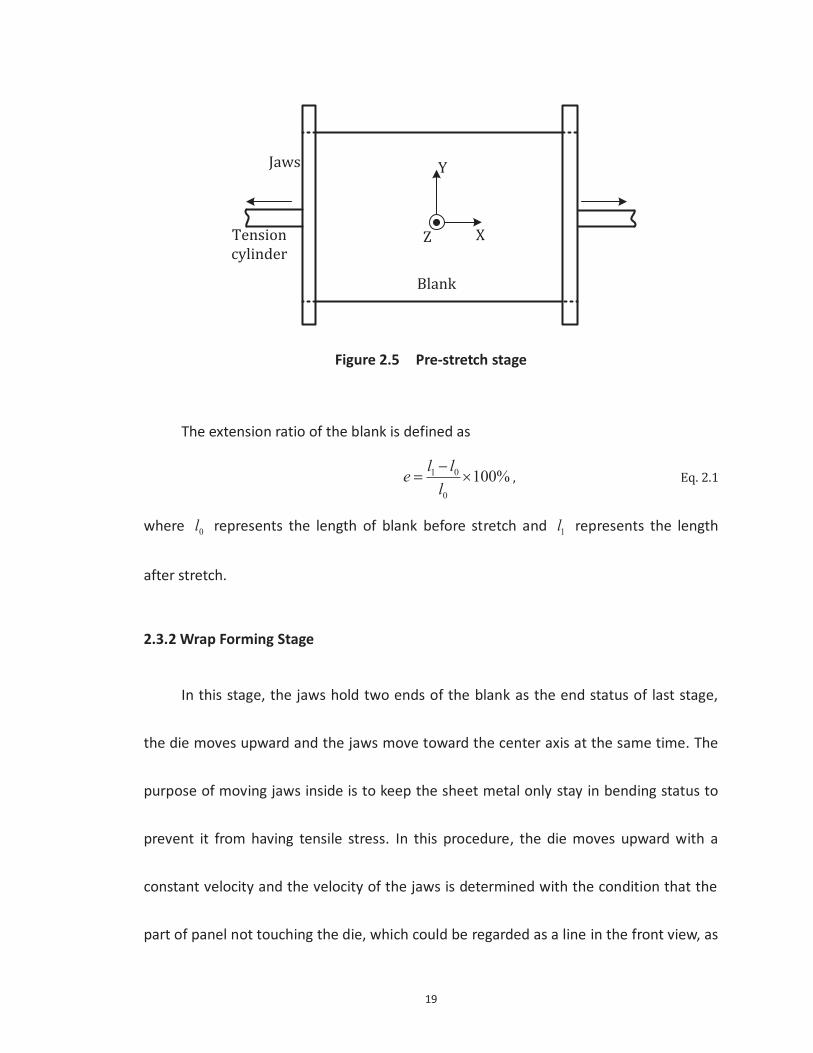
For the pre-stretch stage, the gripper jaws of machine hold the two ends of the
blank and move in the outer direction for a certain distance, as Figure 2.5 shows. In the
references [30, 31, 32], it has been mentioned that a certain amount of pre-stretch could
effectively restrain the springback phenomenon.
19
Blank
Jaws
Tension cylinder
X
Y
Z
Figure 2.5 Pre-stretch stage
The extension ratio of the blank is defined as
1 0
0
100%l lel
, Eq. 2.1
where 0l represents the length of blank before stretch and 1l represents the length
after stretch.
2.3.2 Wrap Forming Stage
In this stage, the jaws hold two ends of the blank as the end status of last stage,
the die moves upward and the jaws move toward the center axis at the same time. The
purpose of moving jaws inside is to keep the sheet metal only stay in bending status to
prevent it from having tensile stress. In this procedure, the die moves upward with a
constant velocity and the velocity of the jaws is determined with the condition that the
part of panel not touching the die, which could be regarded as a line in the front view, as

20
Figure 2.6 shows, always keeps tangent to the spline curve of the die at the end point
touching the die.
Symmetry Axis
Jaws
Die
Initial Blank
Final Shape after Wrap Forming
Status during Wrap Forming Process
Z
XY
Figure 2.6 Wrap forming stage
To obtain the velocity of the jaws, it could be calculated as followed. First,
according to the given shape of the die, find numerous points on the spline curve of the
die and then use polynomial function for the curve fitting. For example, n points
( 1 2 3, , ..... nP P P P ) are picked up equal length along the curve and then the polynomial
function
3 23 2 1 0z a x a x a x a Eq. 2.2
is applied for curve fitting. Also, according to the polynomial function obtained, the
21
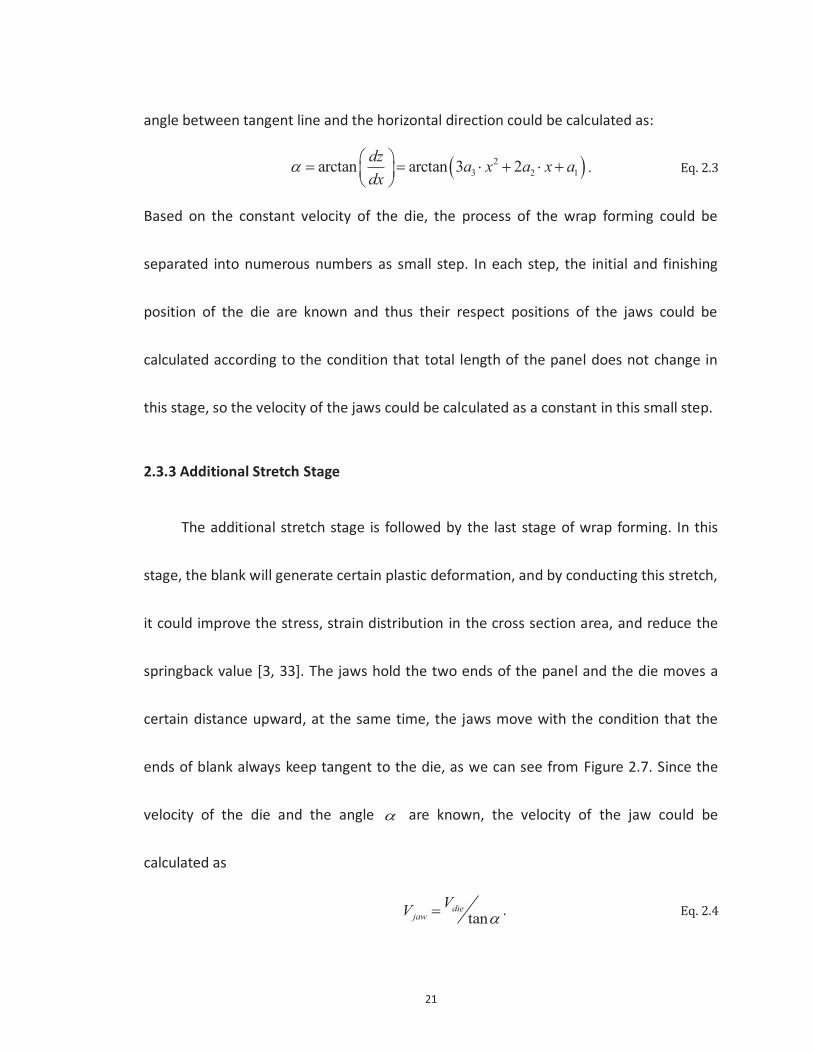
angle between tangent line and the horizontal direction could be calculated as:
23 2 1arctan arctan 3 2dz a x a x a
dx. Eq. 2.3
Based on the constant velocity of the die, the process of the wrap forming could be
separated into numerous numbers as small step. In each step, the initial and finishing
position of the die are known and thus their respect positions of the jaws could be
calculated according to the condition that total length of the panel does not change in
this stage, so the velocity of the jaws could be calculated as a constant in this small step.
2.3.3 Additional Stretch Stage
The additional stretch stage is followed by the last stage of wrap forming. In this
stage, the blank will generate certain plastic deformation, and by conducting this stretch,
it could improve the stress, strain distribution in the cross section area, and reduce the
springback value [3, 33]. The jaws hold the two ends of the panel and the die moves a
certain distance upward, at the same time, the jaws move with the condition that the
ends of blank always keep tangent to the die, as we can see from Figure 2.7. Since the
velocity of the die and the angle are known, the velocity of the jaw could be
calculated as
tandie
jawVV . Eq. 2.4

22
Z
X
Panel before stretch
Panel after stretch
jawV
dieV
1 1 1,P x y
2 2 2,P x y
Y
Figure 2.7 Additional stretch stage
The elongation ratio of the panel in this stage could be calculated by using the
following equation:
12 2 2
1 2 1 2100%
die initial
initial
x x y y l le
l, Eq. 2.5
where diel represents the arc length of the die, initiall represents the initial length of
the blank.
2.3.4 Trimming and Springback
After finishing the stretch forming process, the redundant material of the panel
will be trimmed and then release the formed part from the machine. It usually generates
the phenomenon of springback. In the stretch forming process, the bending strain and
23
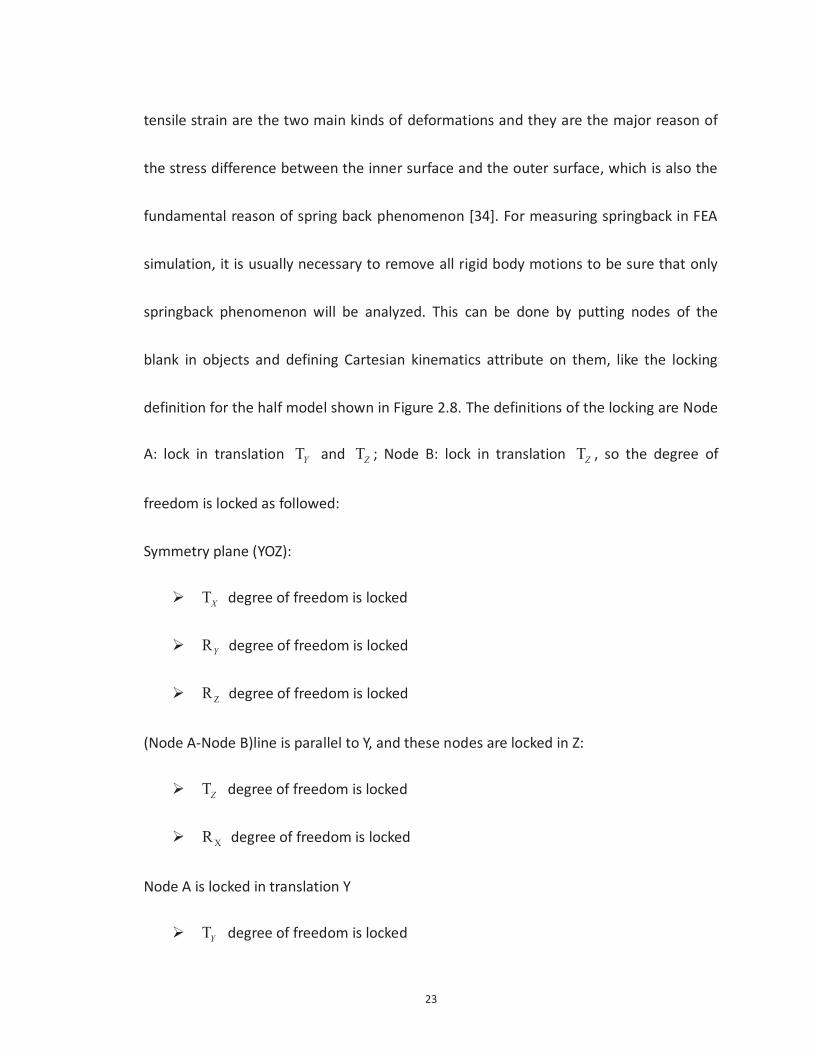
tensile strain are the two main kinds of deformations and they are the major reason of
the stress difference between the inner surface and the outer surface, which is also the
fundamental reason of spring back phenomenon [34]. For measuring springback in FEA
simulation, it is usually necessary to remove all rigid body motions to be sure that only
springback phenomenon will be analyzed. This can be done by putting nodes of the
blank in objects and defining Cartesian kinematics attribute on them, like the locking
definition for the half model shown in Figure 2.8. The definitions of the locking are Node
A: lock in translation TY and TZ ; Node B: lock in translation TZ , so the degree of
freedom is locked as followed:
Symmetry plane (YOZ):
TX degree of freedom is locked
RY degree of freedom is locked
ZR degree of freedom is locked
(Node A-Node B)line is parallel to Y, and these nodes are locked in Z:
TZ degree of freedom is locked
XR degree of freedom is locked
Node A is locked in translation Y
TY degree of freedom is locked
24
Z
Y
X
Symmetry plane
Formed part
Node ANode B
Figure 2.8 Locking definition for half model
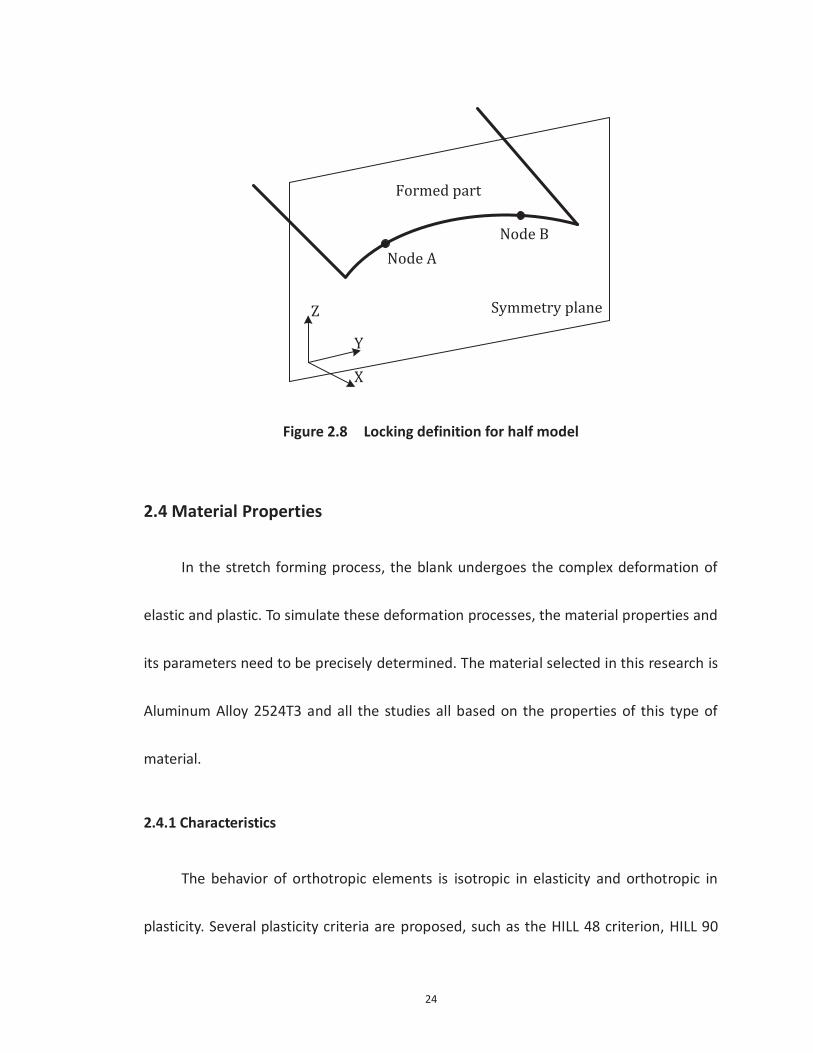
2.4 Material Properties
In the stretch forming process, the blank undergoes the complex deformation of
elastic and plastic. To simulate these deformation processes, the material properties and
its parameters need to be precisely determined. The material selected in this research is
Aluminum Alloy 2524T3 and all the studies all based on the properties of this type of
material.
2.4.1 Characteristics
The behavior of orthotropic elements is isotropic in elasticity and orthotropic in
plasticity. Several plasticity criteria are proposed, such as the HILL 48 criterion, HILL 90

25
criterion, the BARLAT’s criterion, the Corus-Vegter and the Mooney Rivlin law. For
aluminum, it is found that HILL 90 criterion is well adapted [35, 36].
Besides the material law, the following data are necessary for material definitions
that do not depend on the material law:
1) Thickness;
2) Young’s modulus E ;
3) Poisson’s coefficient ;
4) Density ;
5) Rolling direction.
2.4.2 HILL 90 Material Law
The HILL 90 criterion is based on a non-quadratic yield function. This criterion is
able to take into account different behaviors during the bending/unbending phase and
seems to be well adapted to aluminum. The HILL 90 criterion models plasticity convex in
a more general manner than HILL 48. For HILL 90 material law, the yield function is
written as:
26
2 22
1 22 2 2 2 22
1
4
2
1
2
mm m
x y x y xy
m
x y xy x y x y
mmy
mby
, Eq. 2.6
where 1y is the yield stress under uni-axial tension on rolling direction, b
y is the
yield stress under equi-biaxial tension. , , and m are the coefficients of
material dependent. They could be calculated based on an iterative method that
minimizes a function whose variables are yield stresses and the anisotropy coefficients
(least square method).
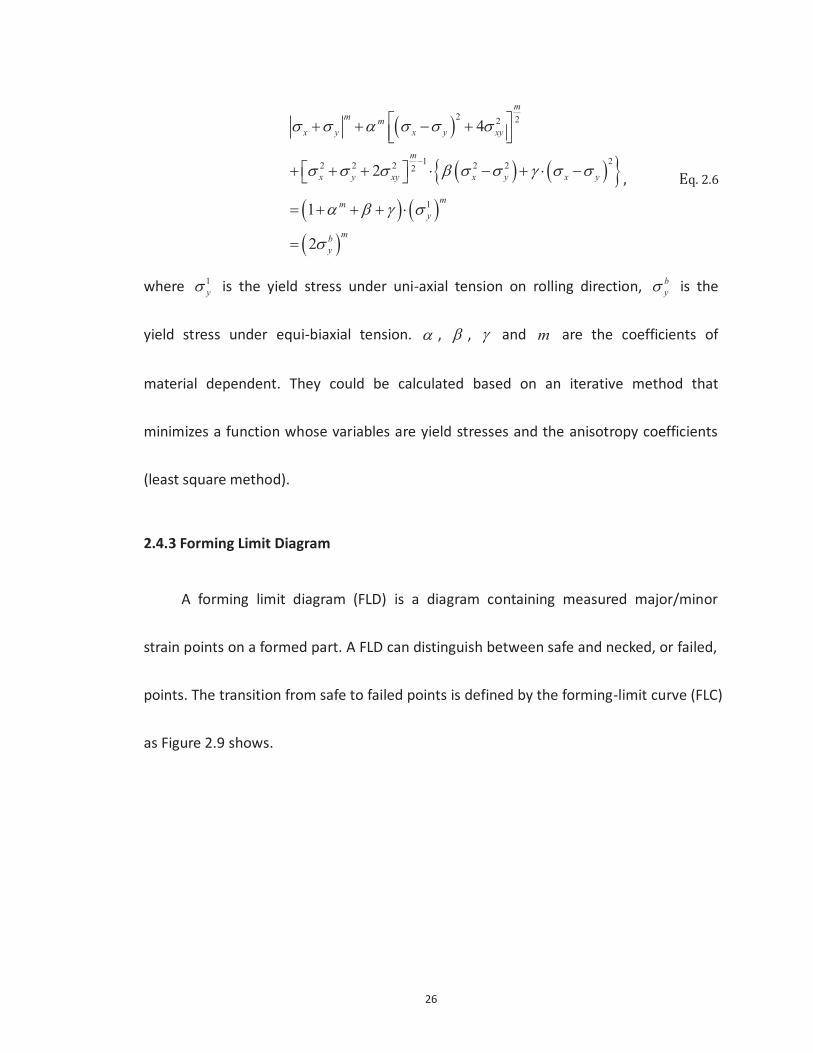
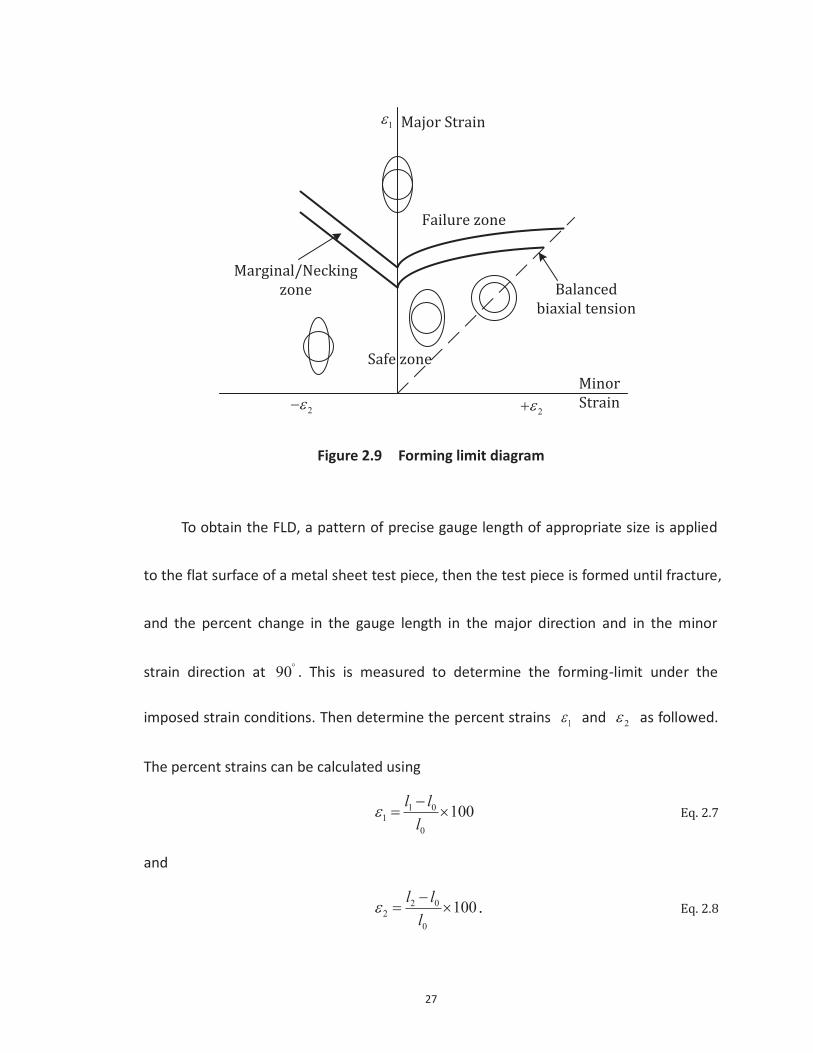
2.4.3 Forming Limit Diagram
A forming limit diagram (FLD) is a diagram containing measured major/minor
strain points on a formed part. A FLD can distinguish between safe and necked, or failed,
points. The transition from safe to failed points is defined by the forming-limit curve (FLC)
as Figure 2.9 shows.
27
22
1
Balanced biaxial tension
Minor Strain
Major Strain
Safe zone
Failure zone
Marginal/Necking zone
Figure 2.9 Forming limit diagram
To obtain the FLD, a pattern of precise gauge length of appropriate size is applied
to the flat surface of a metal sheet test piece, then the test piece is formed until fracture,
and the percent change in the gauge length in the major direction and in the minor
strain direction at 90 . This is measured to determine the forming-limit under the
imposed strain conditions. Then determine the percent strains 1 and 2 as followed.
The percent strains can be calculated using
1 01
0
100l ll
Eq. 2.7
and
2 02
0
100l ll
. Eq. 2.8
28
Plot 1 against 2 on a forming limit diagram. The major strain 1 is plotted along
the Y axis and the minor strain 2 is plotted along the X axis. And draw the
forming-limit curve through the points of maximum 1 strain.
2.5 Determination of Stretch Forming Loading Trajectory
In the stretch forming process of aircraft skin, the loading trajectory of the jaws is a
key factor for high quality of the product. In this section, the equivalent finite element
model used for simulation is established in commercial FEA software. The kinematic
movement of the machine and the blank material are all set up based on the previous
sections. A calculating method is proposed to obtain the loading trajectory of the
machine by combination of the finite element method and optimization algorithms with
the objective of achieving the minimum distance between the designed part and the
formed part in Z direction, which is known as the springback value.
To illustrate the methodology in this section, an example is employed in this
section. For the more complex shape of the die, the jaws could be adjusted as
mentioned in the previous section 2.2.2 of the jaws curvature.

29
2.5.1 Definition of Design Variables
According to previous statement, this stretch forming process includes four stages:
pre-stretch, wrap forming, additional stretch and springback. For each stage, certain
parameters need to be determined.
In the pre-stretch stage, the jaws hold two sides of the blank to stretch in the
horizontal direction, as Figure 2.10 shows. The variables to be determined in this stage is
the distance of the jaws movement in each side is 1( )x mm and the velocity of the jaws
movement 1( / )v mm s . The length of blank reaches to 1( )l mm ,as
1 0 12l l x . Eq. 2.9
Jaw Blank
X1 X1l0
Figure 2.10 Design variable in pre-stretch stage
In the wrap forming stage, the blank is fully wrapped onto the die without
stretching, so the movement of the jaws is adjusted according to the position of die and
the angle of the jaws always keeps tangent to the curvature of the die at the end
touching point of blank and die. The only parameter to be known is the velocity of the
die 2 ( / )v mm s moves upward.
30
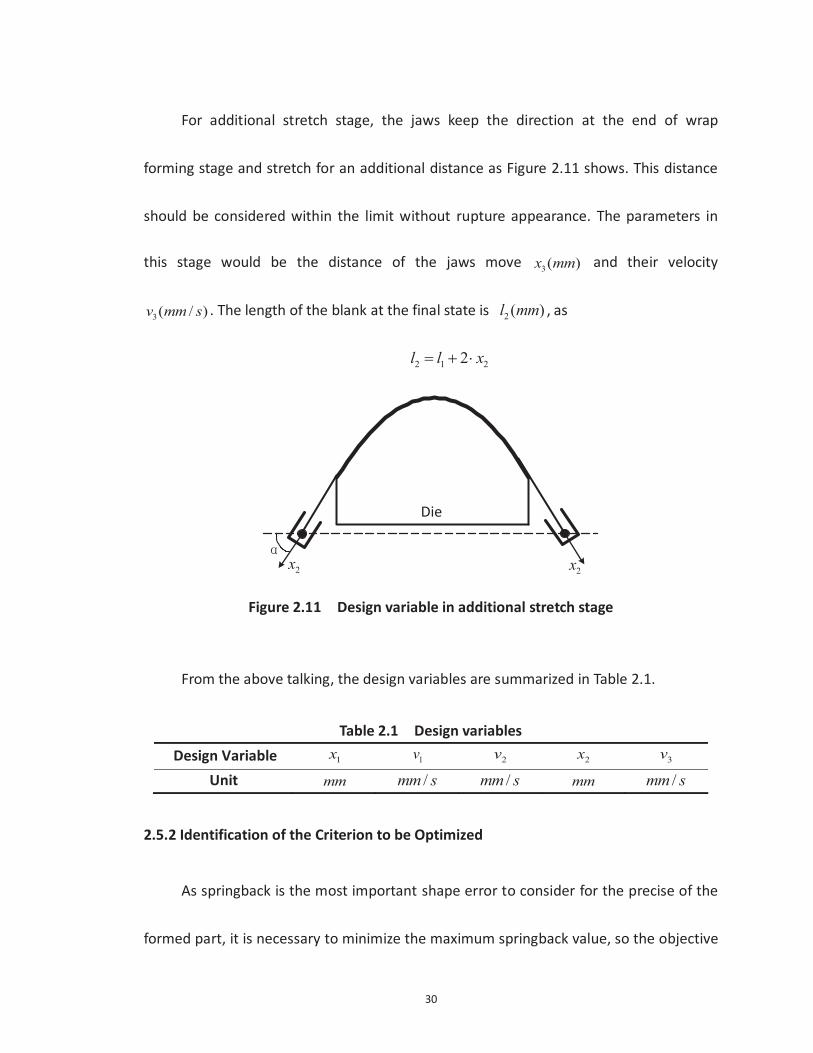
For additional stretch stage, the jaws keep the direction at the end of wrap
forming stage and stretch for an additional distance as Figure 2.11 shows. This distance
should be considered within the limit without rupture appearance. The parameters in
this stage would be the distance of the jaws move 3( )x mm and their velocity
3( / )v mm s . The length of the blank at the final state is 2 ( )l mm , as
2 1 22l l x
2x 2x
Die
Figure 2.11 Design variable in additional stretch stage
From the above talking, the design variables are summarized in Table 2.1.
Table 2.1 Design variables Design Variable 1x 1v 2v 2x 3v
Unit mm /mm s /mm s mm /mm s
2.5.2 Identification of the Criterion to be Optimized
As springback is the most important shape error to consider for the precise of the
formed part, it is necessary to minimize the maximum springback value, so the objective

31
function can be developed as:
min max( ) 1,2, ,if u i n , Eq. 2.10
where max( )iu stands for the maximum springback value in Z direction.
2.5.3 Identification of the Constraints
According to the simulation of the purely stretch in horizontal direction, when one
side of jaws reached 62mm, the FLD showed that some points dropped in the unsafe
zone. If more deformation enrolled, like bending or twisting, the extension length should
be less than 62mm before the defects begin to appear. Also, to get desired
deformation, minimum extension ratio is required as 2% . Thus, the constraint of
extension length is set as
0 1 21 2% 622l x x . Eq. 2.11
In this case of study, 0l is 1720mm. For the velocity of the jaws movement, according to
the industry survey, it is usually between 1.25 /mm s and 8 /mm s . So the constraints
can be described as:
1 217.2 62x x , Eq. 2.12
11.25 8v , Eq. 2.13
21.25 8v , Eq. 2.14
31.25 8v . Eq. 2.15

32
2.5.4 General Global Search with Meta-Model Numerical Simulation
The objective function is used to evaluate the relationship between the springback
value and the parameters of the forming process. According to the above statement,
there are five parameters to determine. However, some of these parameters have a
significant influence on the final result, and others may have little influence on it. And
also due to the large range of these parameters and their internal complex relationship,
it is necessary to evaluate their significances to the springback value. First, a research is
conducted to roughly learn their relationship by a global search. Usually one cycle of
simulation takes 10 to 20 hours depends on the parameters. To find out the explicit
objective function, several numerical simulations will be conducted to generate
meta-model.
To setup the meta-model, design variables are selected in several levels. Opposite
to the full factorial analysis, the Taguchi method reduces the number of experimental
runs to a reasonable one, in terms of cost and time, by using orthogonal arrays[37].
Choosing the proper orthogonal arrays suitable for the problem of interest is very
important in the Taguchi’s approach. Using the method of Sorana D. Bolboaca[38],
sixteen levels for five factors are used to conduct the numerical simulations. Table 2.2 is
a five-factor sixteen-level orthogonal array of the experimental design and includes the

33
value of design variables and their corresponding levels.
Table 2.2 Experimental design of five-fator sixteen-level orthogonal array
Exp. No. Level (Value)
1( )x mm 1( )v mm s 2 ( )v mm s 2 ( )x mm 3( )v mm s
1 0(0) 0(1.25) 0(1.25) 0(18) 0(1.25) 2 1(2) 1(1.70) 13(7.10) 9(36) 14(7.55) 3 2(4) 2(2.15) 12(6.65) 13(44) 8(4.85) 4 3(6) 15(8.00) 1(1.70) 1(20) 15(8.00) 5 4(8) 14(7.55) 2(2.15) 15(48) 3(2.60) 6 5(10) 13(7.10) 15(8.00) 2(22) 1(1.70) 7 6(12) 12(6.65) 14(7.55) 8(34) 7(4.40) 8 7(14) 11(6.20) 3(2.60) 14(46) 10(5.75) 9 8(16) 10(5.75) 11(6.20) 11(40) 2(2.15)
10 9(18) 3(2.60) 4(3.05) 12(42) 12(6.65) 11 10(20) 9(5.30) 9(5.30) 4(26) 11(6.20) 12 11(22) 8(4.85) 10(5.75) 3(24) 13(7.10) 13 12(24) 7(4.40) 7(4.40) 7(32) 9(5.30) 14 13(26) 4(3.05) 8(4.85) 6(30) 5(3.50) 15 14(28) 6(3.95) 5(3.50) 10(38) 4(3.05) 16 15(30) 5(3.50) 6(3.95) 5(28) 6(3.95)
Table 2.3 showed the process parameters and the results of simulations.
Table 2.3 Simulation results for each experimental run
Exp. No. 1x
( )mm 1v
( )mm s 2v
( )mm s 2x
( )mm 3v
( )mm s Max.
Springback value
1 0 1.25 1.25 18 1.25 19.24 2 2 1.70 7.10 36 7.55 8.63 3 4 2.15 6.65 44 4.85 15.96 4 6 8.00 1.70 20 8.00 12.87 5 8 7.55 2.15 48 2.60 13.2 6 10 7.10 8.00 22 1.70 28.21 7 12 6.65 7.55 34 4.40 15.03 8 14 6.20 2.60 46 5.75 18.60 9 16 5.75 6.20 40 2.15 15.35
10 18 2.60 3.05 42 6.65 9.83 11 20 5.30 5.30 26 6.20 21.5 12 22 4.85 5.75 24 7.10 9.22
34
13 24 4.40 4.40 32 5.30 13.03 14 26 3.05 4.85 30 3.50 16.78 15 28 3.95 3.50 38 3.05 21.81 16 30 3.50 3.95 28 3.95 14.55
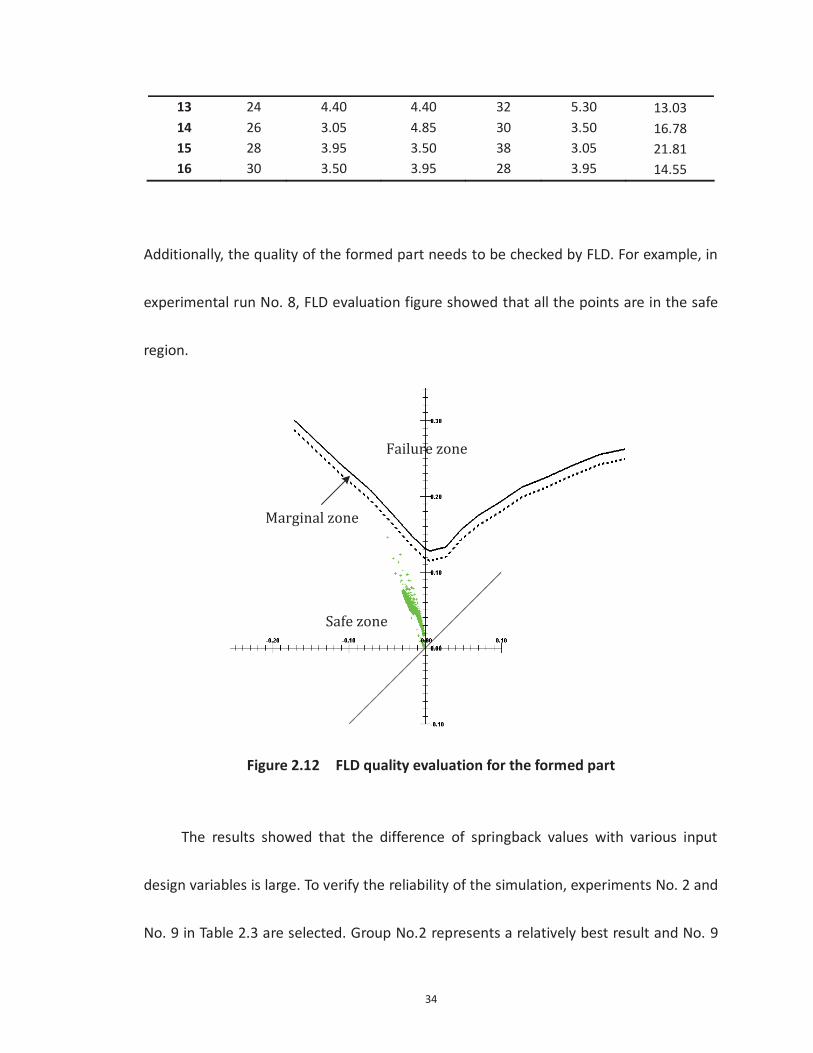
Additionally, the quality of the formed part needs to be checked by FLD. For example, in
experimental run No. 8, FLD evaluation figure showed that all the points are in the safe
region.
Safe zone
Failure zone
Marginal zone
Figure 2.12 FLD quality evaluation for the formed part
The results showed that the difference of springback values with various input
design variables is large. To verify the reliability of the simulation, experiments No. 2 and
No. 9 in Table 2.3 are selected. Group No.2 represents a relatively best result and No. 9
35
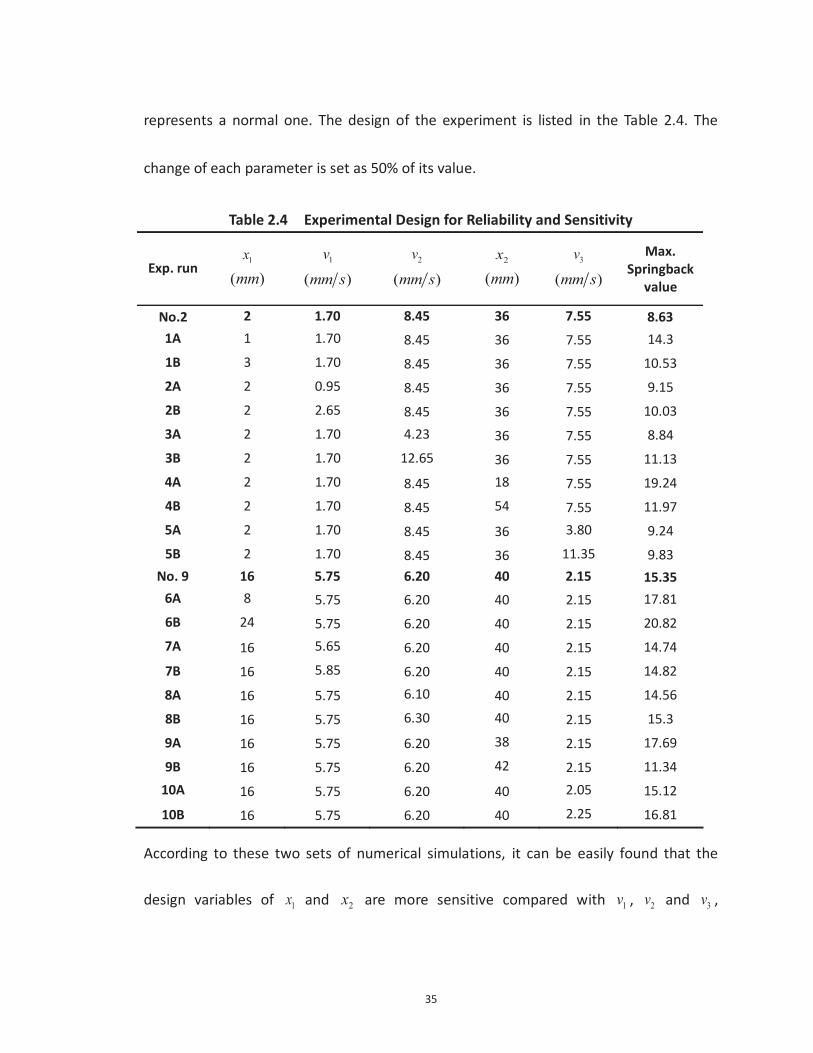
represents a normal one. The design of the experiment is listed in the Table 2.4. The
change of each parameter is set as 50% of its value.
Table 2.4 Experimental Design for Reliability and Sensitivity
Exp. run 1x
( )mm 1v
( )mm s 2v
( )mm s 2x
( )mm 3v
( )mm s Max.
Springback value
No.2 2 1.70 8.45 36 7.55 8.63 1A 1 1.70 8.45 36 7.55 14.3 1B 3 1.70 8.45 36 7.55 10.53 2A 2 0.95 8.45 36 7.55 9.15 2B 2 2.65 8.45 36 7.55 10.03 3A 2 1.70 4.23 36 7.55 8.84 3B 2 1.70 12.65 36 7.55 11.13 4A 2 1.70 8.45 18 7.55 19.24 4B 2 1.70 8.45 54 7.55 11.97 5A 2 1.70 8.45 36 3.80 9.24 5B 2 1.70 8.45 36 11.35 9.83
No. 9 16 5.75 6.20 40 2.15 15.35 6A 8 5.75 6.20 40 2.15 17.81 6B 24 5.75 6.20 40 2.15 20.82 7A 16 5.65 6.20 40 2.15 14.74
7B 16 5.85 6.20 40 2.15 14.82
8A 16 5.75 6.10 40 2.15 14.56
8B 16 5.75 6.30 40 2.15 15.3
9A 16 5.75 6.20 38 2.15 17.69
9B 16 5.75 6.20 42 2.15 11.34 10A 16 5.75 6.20 40 2.05 15.12
10B 16 5.75 6.20 40 2.25 16.81
According to these two sets of numerical simulations, it can be easily found that the
design variables of 1x and 2x are more sensitive compared with 1v , 2v and 3v ,

36
which can be identified in Table 2.5.
Table 2.5 Springback value change of the sensitivity and reliability simulations Springback
value change 1x 1v 2v 2x 3v
No.2 5.67 0.52 0.21 10.61 0.61 1.9 1.4 2.5 3.34 1.2
No.9 2.46 0.61 0.79 2.34 0.23 5.47 0.53 0.05 4.01 1.46
It can be found that based on the same percentage change of the design variables, 1x
and 2x have a relatively higher sensitivity. Small change of their value could result in
the large variation. This phenomenon can be explained as these two values are directly
related to the extension ratio of the deformation and only limited in a special range it
could result a better springback result. It can prove that the parameters for pre-stretch
and additional stretch will influence the final result largely. And the other three
velocities related parameters do not have much effect on the springback value.
2.5.5 Response Surface Setup and Optimal Solution Calculation
According to the previous statement we can realize that the control of springback
value is a really complex problem. There are many parameters need to be considered
and these parameters do not have an explicit relationship to the springback value. From
the initial numerical simulations in previous section it is possible to setup a relationship
between them.
37
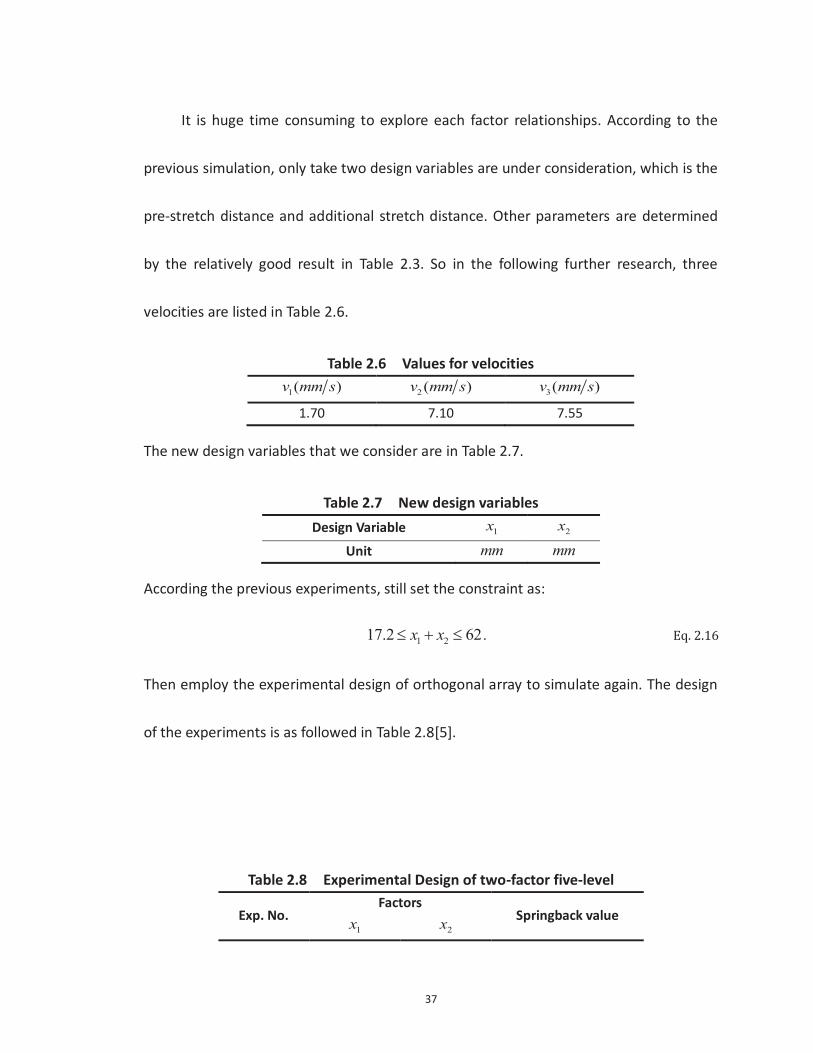
It is huge time consuming to explore each factor relationships. According to the
previous simulation, only take two design variables are under consideration, which is the
pre-stretch distance and additional stretch distance. Other parameters are determined
by the relatively good result in Table 2.3. So in the following further research, three
velocities are listed in Table 2.6.
Table 2.6 Values for velocities
1( )v mm s 2 ( )v mm s 3( )v mm s
1.70 7.10 7.55
The new design variables that we consider are in Table 2.7.
Table 2.7 New design variables Design Variable 1x 2x
Unit mm mm
According the previous experiments, still set the constraint as:
1 217.2 62x x . Eq. 2.16
Then employ the experimental design of orthogonal array to simulate again. The design
of the experiments is as followed in Table 2.8[5].
Table 2.8 Experimental Design of two-factor five-level
Exp. No. Factors
Springback value 1x 2x

38
1 2 18 16.58 2 5 35 9.49 3 8 22 14.34 4 11 31 9.05 5 14 26 15.39 6 17 27 7.37 7 20 30 10.74 8 23 23 9.52 9 23 34 11.62
10 20 29 8.81 11 17 29 12.86 12 14 35 10.09 13 11 24 7.41 14 8 41 9.82 15 5 19 13.22 16 2 47 8.81
Then, the polynomial equation is employed for curve fitting. It is usually not the
case that the higher degree bring a higher accuracy, the degree of 2, 3 and 4 are tried
respectively by using Matlab to find the optimum solution, and then compared with the
numerical simulation result. The format of polynomial equations of degree 2, 3 and 4 are
as followed:
2 22 1 2 1 1 2 200 10 01 20 11 02f p p x p x p x p x x p x , Eq. 2.17
2 23 1 2 1 1 2 2
3 2 2 31 1 2 1 2 2
00 10 01 20 11 02
30 21 12 30
f p p x p x p x p x x p x
p x p x x p x x p x, Eq. 2.18
2 24 1 2 1 1 2 2
3 2 2 31 1 2 1 2 2
4 3 2 2 3 41 1 2 1 2 1 2 2
00 10 01 20 11 02
30 21 12 03
40 31 22 13 04
f p p x p x p x p x x p xp x p x x p x x p xp x p x x p x x p x x p x
. Eq. 2.19
The coefficients of polynomial equations for curve fitting are in the Table 2.9.

39
Table 2.9 Coefficients of polynomial equations Polynomial Degree 2 3 4
00p 7347 -1.323e+05 5.154e+14
10p 43.48 639.8 1.085e+13
01p -206.2 3553 -3.479e+13
20p -0.2273 4.984 1.226e+10
11p 0.1193 -25.45 -3.661e+11
02p 0.9929 -23.6 7.664e+11
30p \ 0.01283 -4.718e+08
21p \ -0.09251 1.513e+09
12p \ 0.2381 1.887e+09
03p \ -0.004884 -6.052e+09
40p \ \ 9.749e+05
31p \ \ -0.0302
22p \ \ -7.799e+06
13p \ \ 0.05786
04p \ \ 1.56e+07
The optimum point of the response surface of each degree can be calculated in the
Matlab. One thing that needs to be careful is that the objective is to find the absolute
minimization value of the objective function since the objective function represents the
springback value and it approaches to zero.
Set the polynomial equation of degree 2 as an example to verify the optimization
solution is global and robust, it could be checked with different initial points. The result
is listed in the Table 2.10.
Table 2.10 Optimization result with different initial points of polynomial equation of degree 2
40
Initial Point 1x 2x fval
[50, 40] 12.5282 30.0591 1.05914 [40, 30] 12.3254 30.5510 0.1810 [2, 65] 12.3254 30.5510 0.1810
[25, 25] 12.3254 30.5510 0.1810 [70, 15] 9.7000 30.7681 19.0917 [65, 2] 12.3254 28.5510 0.1810
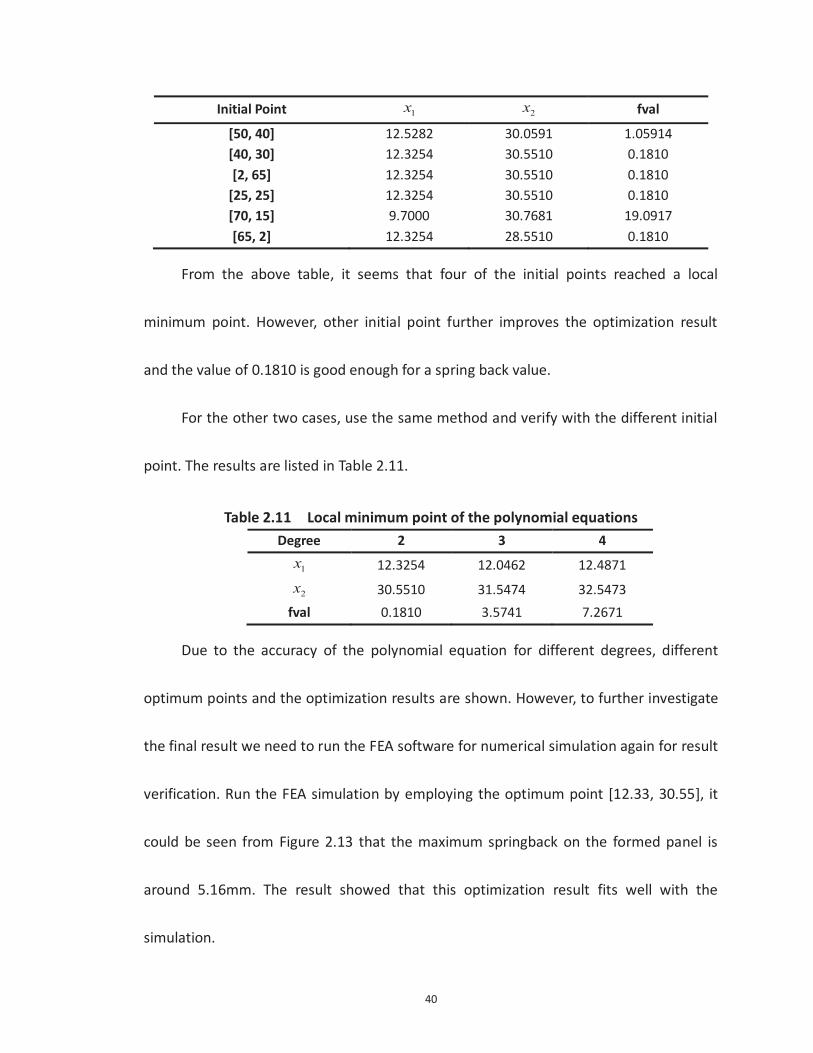
From the above table, it seems that four of the initial points reached a local
minimum point. However, other initial point further improves the optimization result
and the value of 0.1810 is good enough for a spring back value.
For the other two cases, use the same method and verify with the different initial
point. The results are listed in Table 2.11.
Table 2.11 Local minimum point of the polynomial equations Degree 2 3 4
1x 12.3254 12.0462 12.4871
2x 30.5510 31.5474 32.5473 fval 0.1810 3.5741 7.2671
Due to the accuracy of the polynomial equation for different degrees, different
optimum points and the optimization results are shown. However, to further investigate
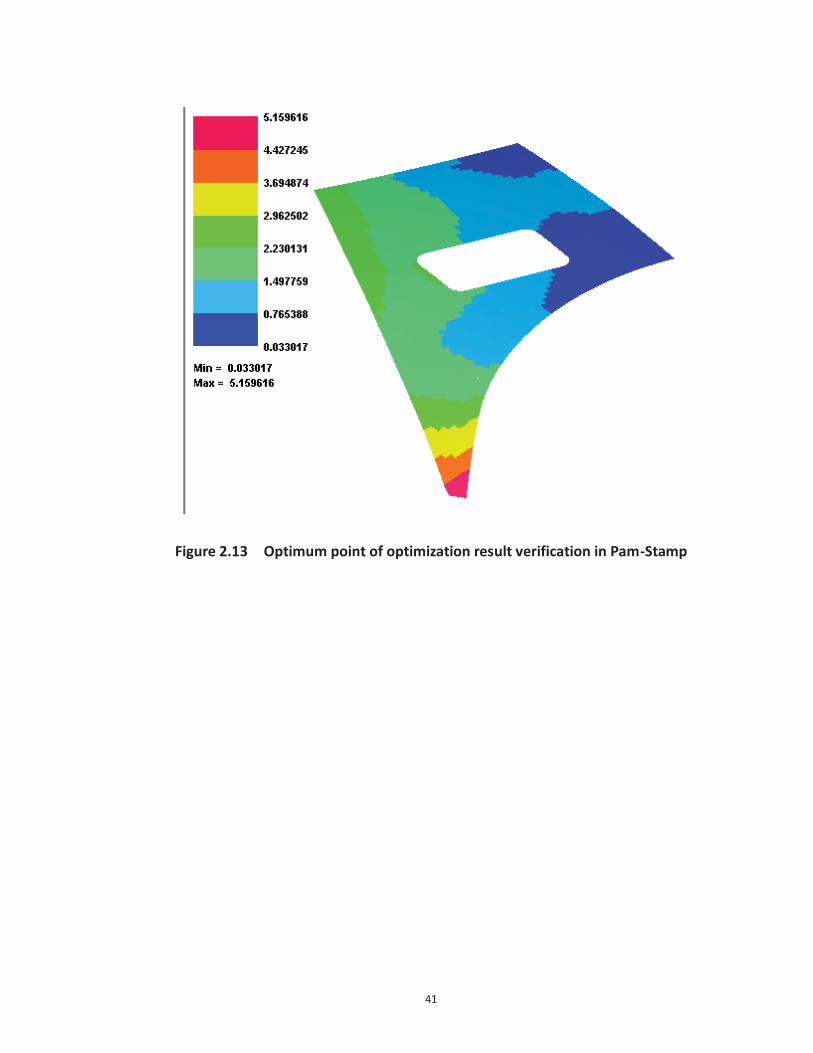
the final result we need to run the FEA software for numerical simulation again for result
verification. Run the FEA simulation by employing the optimum point [12.33, 30.55], it
could be seen from Figure 2.13 that the maximum springback on the formed panel is
around 5.16mm. The result showed that this optimization result fits well with the
simulation.
41
Figure 2.13 Optimum point of optimization result verification in Pam-Stamp

42
CHAPTER 3 POCKETS POSITION DESIGN ON FLAT
BLANK SHEET
3.1 Introduction
In order to achieve sheet metal forming process, the influences of a considerable
number of process parameters are evaluated experimentally or analytically. For the case
in this study that the pockets are machined before the stretching, besides the
parameters of the process, manufacture condition, the blank design also plays an
important role in the determination of the quality of the panel, especially for the
accuracy of the pockets shape and position. To reduce the factors that taken into
consideration, the loading trajectory of the jaws needs is calculated first, and then with
this determined stretch forming process, conduct FEA simulation, analyze result, make
modification and finally get the designed flat blank.
In this study, design of pockets on the blank is studied based on the shape
sensitivity method. The blank design procedures could be described as the following
flowchart in Figure 3.1. Based on the designed CAD model of the aircraft panel, an initial
blank with pockets is assumed. Then this initial blank is used to perform stretch forming

43
process to obtain the CAD data of the formed panel. Based on the deviation compared
between the formed panel with the designed panel, modify the assumed initial blank
and conduct the FEA simulation for the next iteration. If the result of the comparison
shows that difference is less than the tolerance, the design procedures is finished and
the blank could be machined for stretch forming. If the difference exceeds the tolerance,
make modification for another iteration until it meets the requirement.
CAD Data of the Designed 3D Panel
Assume an Initial Blank Design
FEA Simulation
Shape Error<Tolerance
Machining Designed Blankand Stretching
Modify Blank
Yes
No
Figure 3.1 Blank design procedures flowchart
3.2 Blank Design for Aircraft Skin with Simple Pocket Features
Based on the designed 3D panel, the blank is employed for conducting the stretch
44
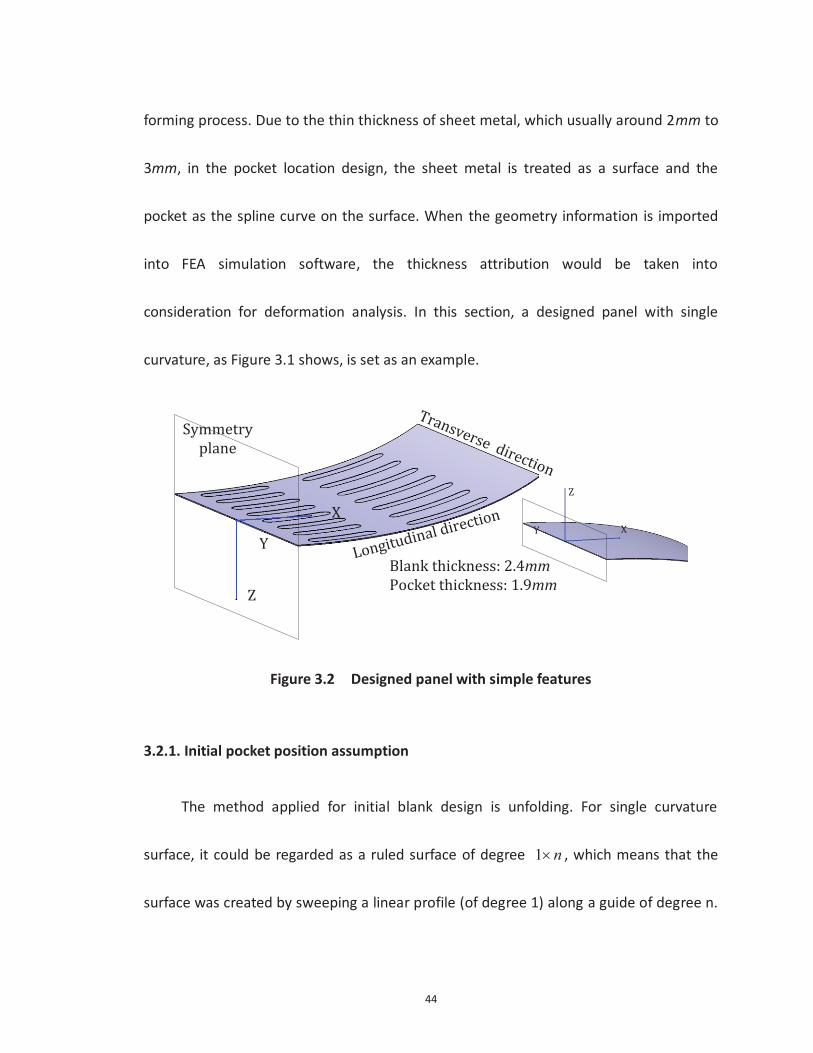
forming process. Due to the thin thickness of sheet metal, which usually around 2mm to
3mm, in the pocket location design, the sheet metal is treated as a surface and the
pocket as the spline curve on the surface. When the geometry information is imported
into FEA simulation software, the thickness attribution would be taken into
consideration for deformation analysis. In this section, a designed panel with single
curvature, as Figure 3.1 shows, is set as an example.
Z
Y
XZ
Y X
Longitudinal direction
Transverse direction
Blank thickness: 2.4mmPocket thickness: 1.9mm
Symmetry plane
Figure 3.2 Designed panel with simple features
3.2.1. Initial pocket position assumption
The method applied for initial blank design is unfolding. For single curvature
surface, it could be regarded as a ruled surface of degree 1 n , which means that the
surface was created by sweeping a linear profile (of degree 1) along a guide of degree n.

45
Figure 3.3 showed the front view of unfolding process for a single curvature surface. The
arc length of the designed panel profile is equal to the length of the unfolded profile.
The profile of the designed panel could be described by the polynomial function as:
3 21 2 3 4.z p x p x p x p Eq. 3.1
Z
X
Designed Panel Profile
Unfolded Surface Profile
PD
PUY
Figure 3.3 Illustration of single curvature panel unfolding
After unfolding, the curved surface is transferred onto the flat surface. Considering
that in the whole stretch forming process, it usually has at least 2% extension ratio in the
longitudinal direction, the arc length of the designed panel would be 2% more than X
axis value in the initial blank design. For the Y axis, it is assumed that the length in
transverse direction does not change. Figure 3.4 shows the procedures for obtaining the
initial pockets position.
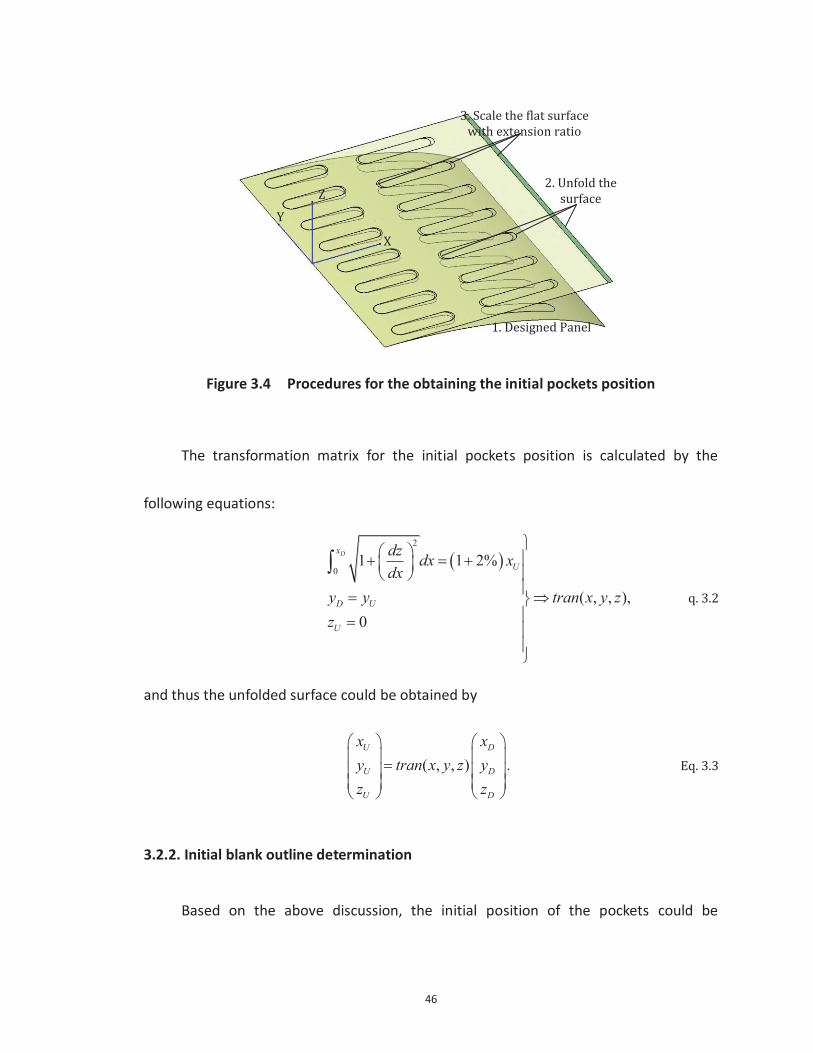
46
Z
X
Y
2. Unfold the surface
1. Designed Panel
3. Scale the flat surface with extension ratio
Figure 3.4 Procedures for the obtaining the initial pockets position
The transformation matrix for the initial pockets position is calculated by the
following equations:
2
01 1 2%
( , , ),0
Dx
U
D U
U
dz dx xdx
y y tran x y zz
q. 3.2
and thus the unfolded surface could be obtained by
( , , )U D
U D
U D
x xy tran x y z yz z
. Eq. 3.3
3.2.2. Initial blank outline determination
Based on the above discussion, the initial position of the pockets could be
47
obtained. However, the outline of the blank still needs further study. A proper outline of
the blank could largely improve the problem of stress concentration due to the pockets
machined before stretching and also the over thinning around the pockets area, which
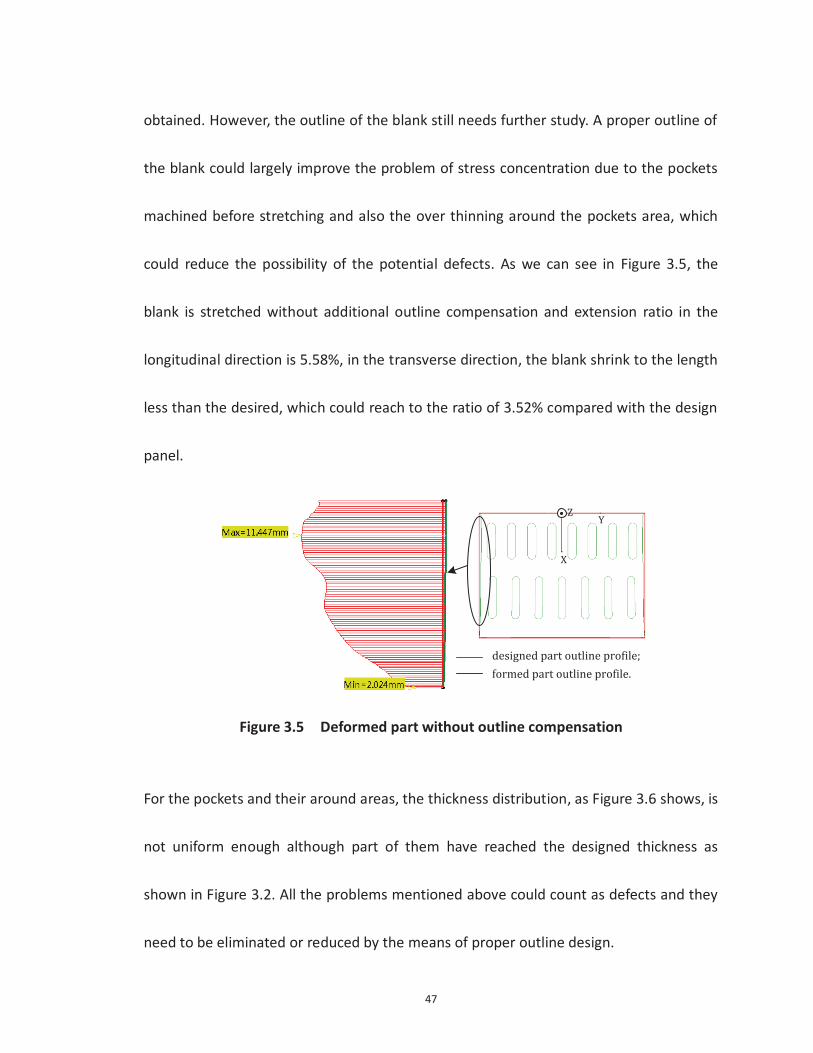
could reduce the possibility of the potential defects. As we can see in Figure 3.5, the
blank is stretched without additional outline compensation and extension ratio in the
longitudinal direction is 5.58%, in the transverse direction, the blank shrink to the length
less than the desired, which could reach to the ratio of 3.52% compared with the design
panel.
X
Y
designed part outline profile;formed part outline profile.
Z
Figure 3.5 Deformed part without outline compensation
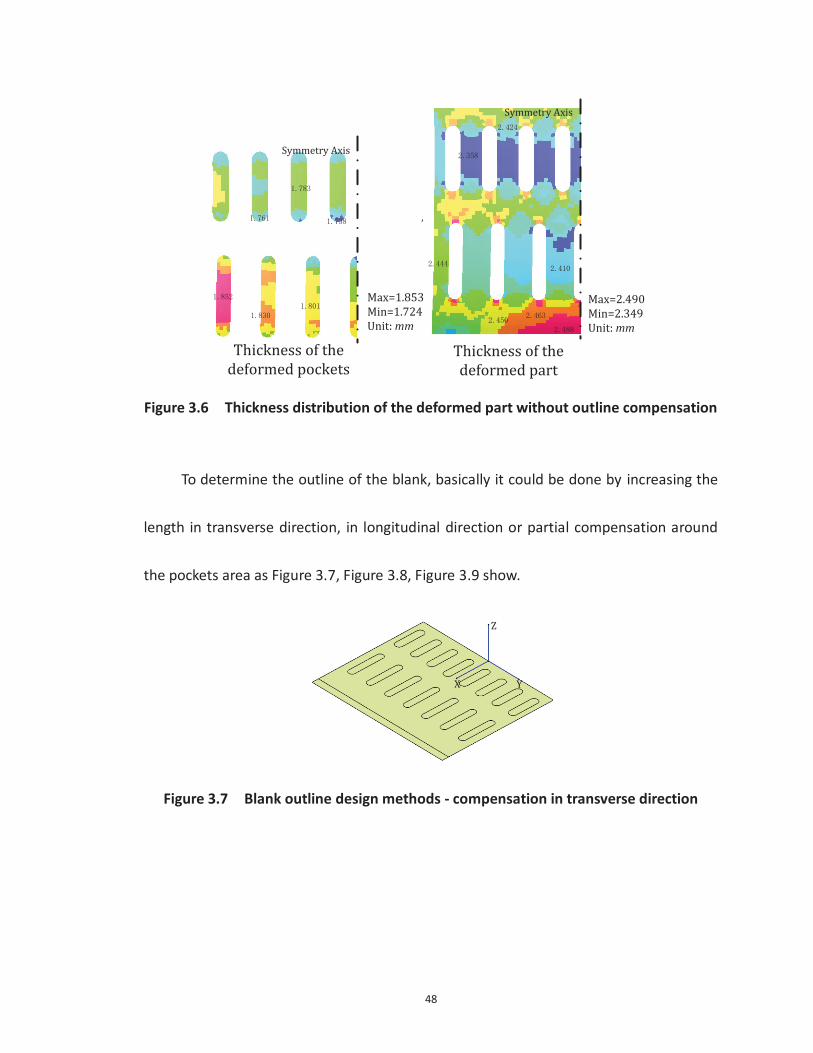
For the pockets and their around areas, the thickness distribution, as Figure 3.6 shows, is
not uniform enough although part of them have reached the designed thickness as
shown in Figure 3.2. All the problems mentioned above could count as defects and they
need to be eliminated or reduced by the means of proper outline design.
48
Symmetry Axis
Symmetry Axis
Thickness of the deformed pockets
Thickness of the deformed part
Max=2.490Min=2.349Unit: mm
Max=1.853Min=1.724Unit: mm
Figure 3.6 Thickness distribution of the deformed part without outline compensation
To determine the outline of the blank, basically it could be done by increasing the
length in transverse direction, in longitudinal direction or partial compensation around
the pockets area as Figure 3.7, Figure 3.8, Figure 3.9 show.
Z
YX
Figure 3.7 Blank outline design methods - compensation in transverse direction

49
Z
YX
Figure 3.8 Blank outline design methods - compensation in longitudinal direction
Z
YX
Figure 3.9 Blank outline design methods - partial compensation
For each method of compensation, they have their own functions to improve the quality
of the panel. Like the compensation in transverse direction, it could improve the
springback distribution at the end part of the panel and the compensation in
longitudinal direction and the partial area could reduce the problem of stress
concentration and nonuniform thickness distribution. Combination of these
compensation methods could achieve a better result.
However, there is no specific rule to define how exact these boundaries of the
panel are working. The basic method to find the most appropriate boundaries is by

50
trying different ways. Too large length compensation would result in material waste and
too small compensation could not solve the quality problems mentioned above. For the
method of partial compensation, although it could improve the quality of the panel in
some degree, it increases the workload of outline machining. And also, by designing the
appropriate length of compensation in transverse and longitudinal directions, it could
also achieve the same result.
3.2.3 Shape Deviation Evaluation
After finishing FEA simulation, the result of formed panel could be accessed and
analyzed. In this section, the formed panel of simulation result and the designed panel
would be compared and evaluated under the same coordinate system. From the
previous analysis it is known that the thickness distribution and the extension ratio have
all met the requirements. Especially for the small springback value, it means that the
curvature of the whole part fits the designed panel well, so the thing we need to take
into consideration is the location of the pockets.
To precisely determine the deviation between the designed panel and the formed
panel, the comparisons in X, Y, Z axes are applied. First for deviation in Z direction, go to
the front view of the 3D panel, it can be seen from Figure 3.10. As long as the formed

51
panel has a small springback value in Z direction within the tolerance, the shape
deviation in the Z axis could be regarded qualified.
Designed panelFormed panel with small springback valueFormed panel with large springback value
Z
Xdz: springback value in
Z direction
Figure 3.10 Illustration of springback value in Z direction
The next thing needs to be considered is the deviation in the X and Y directions. Based
on the designed panel and the panel formed by simulation, extract the boundaries of
pocket profiles since we only need to consider the accuracy of the profiles boundary,
then project these two profiles onto XY plane and combine them under same coordinate
system, as shown in Figure 3.11. The one generated by the projection of designed panel
is set as the reference to check the shape deviation of the formed panel in X and Y
directions.

52
Pocket profiles of designed panel Pocket profiles of formed panel
Y
X
Z
X
Y
Z
Y
X
Combination of these two profiles under one coordinate system and project the profiles on XY plane
Figure 3.11 Comparison of the deformed profiles of the initial blank design and
target profiles
Based on the comparison between the projection of the formed part and the designed
skin part on XY plane, the deviation of each pocket profile could be evaluated. It could
be illustrated as shown in Figure 3.12.
53
1l
3l
1d
3d
2l
2d4d
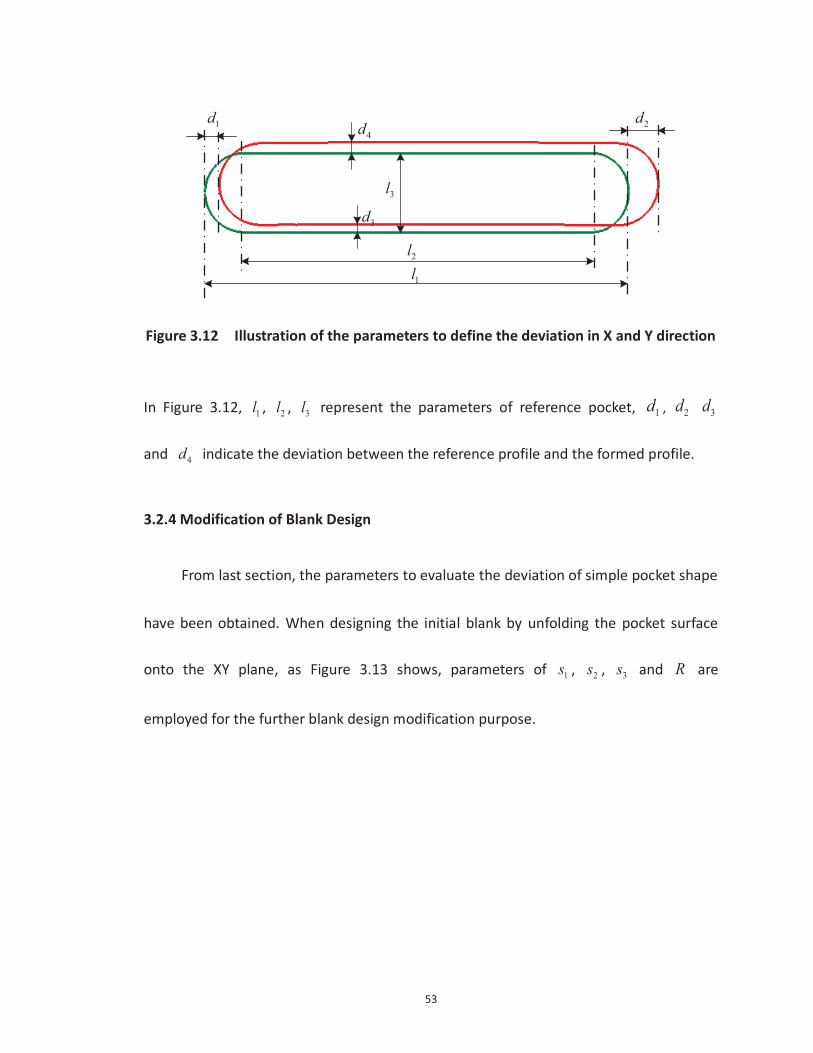
Figure 3.12 Illustration of the parameters to define the deviation in X and Y direction
In Figure 3.12, 1l , 2l , 3l represent the parameters of reference pocket, 1d , 2d 3d
and 4d indicate the deviation between the reference profile and the formed profile.
3.2.4 Modification of Blank Design
From last section, the parameters to evaluate the deviation of simple pocket shape
have been obtained. When designing the initial blank by unfolding the pocket surface
onto the XY plane, as Figure 3.13 shows, parameters of 1s , 2s , 3s and R are
employed for the further blank design modification purpose.

54
1s
R
2s
R3s
Reference Boundary
Figure 3.13 Design parameters of pockets on flat blank
By using the deviation evaluated in Figure 3.12, the parameters for blank design
could be updated as equations:
'1 1 1s s d , Eq. 3.4
'2 2 4s s d , Eq. 3.5
'3 3 2 1s s d d , Eq. 3.6
' 4 3
2d dR R . Eq. 3.7
Based on the updated blank design, under the same condition of stretch forming
process and material properties, conduct another simulation of the stretch forming,
evaluate the deviation and make the modification until it meets the requirement.
3.2.5 Simulation Result
Due to the simple shape of the pocket and the symmetry part only has single

55
curvature, after four iterations, it has reached the deviation requirement. Figure 3.14
showed the changing of pocket profiles in these four iterations.
Y
X
Standard pocket profile
Formed profile of 1st iteration
Formed profile of 2nd iteration
Formed profile of 3rd iteration
Formed profile of 4th iteration
Pocket 1
Pocket 2
Pocket 3
Pocket 4
Pocket 5
Pocket 6
Pocket 7
Pocket 8
Pocket 9
Pocket 10
Pocket 11
Pocket 12
Pocket 13
Pocket 14
Pocket 15
Figure 3.14 Pocket profiles in four iterations
Table 3.1 is the list of the deviation of each pocket profiles with its corresponding
target profile. In the first four iterations, the deviation has decreased largely. For the fifth
iteration, it stayed around the same level of fourth iteration, even some of the pockets
rebounded.

56
Table 3.1 Pockets deviation with the target profile in four iterations
Max. deviation
(mm) Iteration 1 Iteration 2 Iteration 3 Iteration 4 Iteration 5
Pocket 1 8.863 3.899 0.726 0.952 1.16 Pocket 2 7.049 3.944 1.036 0.857 0.801 Pocket 3 6.73 3.235 1.083 0.871 0.736 Pocket 4 6.083 3.177 1.027 0.689 0.661 Pocket 5 6.02 3.093 1.081 0.729 0.65 Pocket 6 6.35 3.078 1.231 1.148 1.53 Pocket 7 6.561 3.547 0.911 0.871 0.815 Pocket 8 7.621 3.454 1.188 1.047 1.166 Pocket 9 15.986 6.783 2.342 1.128 0.932
Pocket 10 16.911 7.714 2.4 0.596 0.633 Pocket 11 17.439 7.396 2.568 0.541 0.587 Pocket 12 17.566 7.387 0.812 0.741 0.577 Pocket 13 17.257 7.169 2.755 1.271 0.609 Pocket 14 16.525 6.677 2.894 0.599 0.678 Pocket 15 15.4 6.07 3.061 1.101 0.967
From this case, it can be concluded that this method could be used for the blank design.
However, the accuracy cannot meet the requirement even for this simple case. Method
for higher accuracy needs proposed.
3.3 Blank Design for Aircraft Skin with Complex Pocket Features
However, in the real industry, the shapes of the pocket are not simple like the case
mentioned above. The panel that used for assembly in aircraft shown in Figure 3.15 is
provided by Bombardier Inc. It can be identified that the shapes are irregular and when

57
trying to make the deviation evaluation and flat blank design modification, it cannot be
achieved by just employing just several parameters. For the size of the designed part is
shown in Figure 3.16.
1
2
ThicknessArea 1: 2.26mmArea 2: 1.95mm
Figure 3.15 Designed panel of double curvature with complex features
143mm
1105mm
747mm
Figure 3.16 Size of the designed part

58
To solve this problem, a new approach is proposed by dispersing the pocket
profiles to analyze the profile and evaluate the deviation, and then the shape sensitivity
method is employed to improve the blank design. Since this panel is designed with
symmetry structure, the following research is all done with half part.
3.3.1 Initial Blank Design
Unlike the panel with single curvature that can be regarded as a ruled surface of
degree 1 n , the double curvature panel cannot be unfolded onto a flattened surface
without length distortion. With the assistance of CATIA unfolding function, the double
curved surface is unfolded onto the XY plane. The length distortion distribution is shown
in Figure 3.17, which is along X direction with the reference of YZ plane. It could be
observed that the length distortion is very small compared with the value of shape
deviation and it could be compensated in the future modification.
Maximum: 0.15295%Minimum: -0.19718%
Figure 3.17 Flattened surface length distortion

59
By using this unfolding function, the position of initial pockets could be determined as
Figure 3.18 shows. The outline of the initial blank is adjusted for first process simulation
as 1620mm 900mm, as Figure 3.19 shows.
X Y
Z
Designed Pocket Profile
Unfolded pocket profile on XY plane
Symmetry plane
Figure 3.18 Initial pockets position determination for double curvature panel
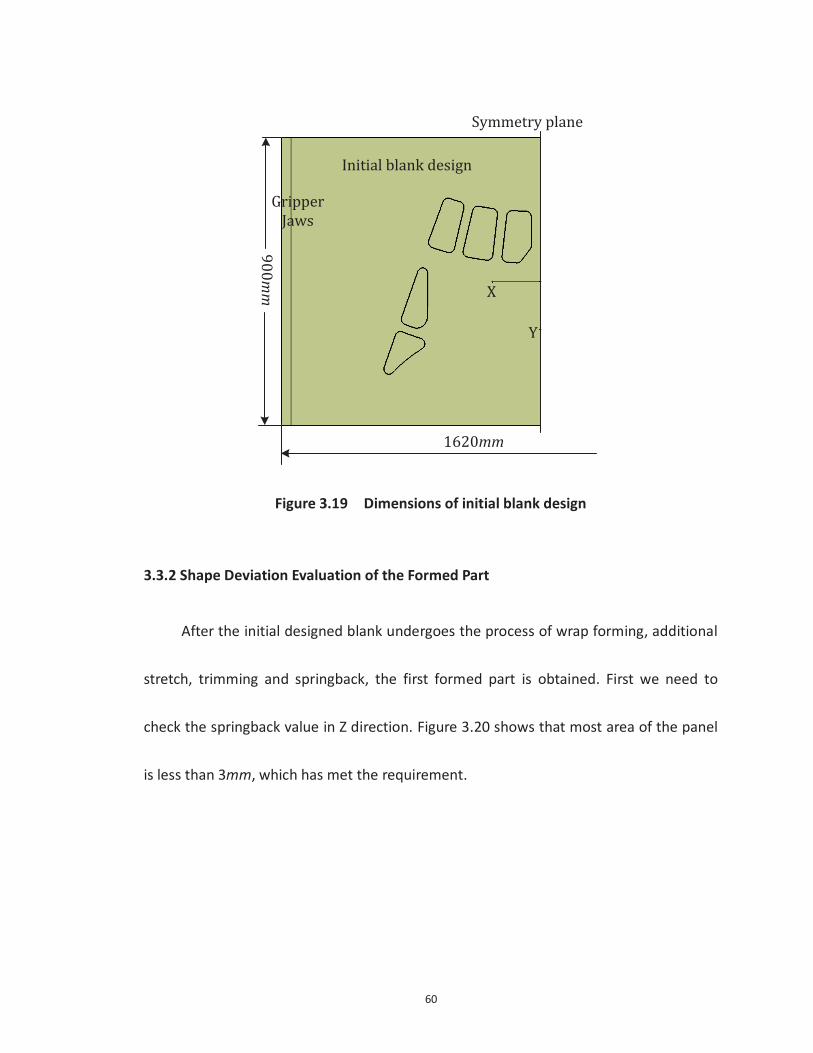
60
Symmetry plane
Y
X
Initial blank design
1620mm
900mm
GripperJaws
Figure 3.19 Dimensions of initial blank design
3.3.2 Shape Deviation Evaluation of the Formed Part
After the initial designed blank undergoes the process of wrap forming, additional
stretch, trimming and springback, the first formed part is obtained. First we need to
check the springback value in Z direction. Figure 3.20 shows that most area of the panel
is less than 3mm, which has met the requirement.

61
Figure 3.20 Springback value distribution in Z direction
For the deviation in X and Y direction, project the standard profiles and formed
pocket profiles in XY plane as shown in Figure 3.21. It could be observed that for the
deviation between the formed profile and the standard profile, due to the irregular
shape, it is hard to employ just a few parameters to define the deviation.
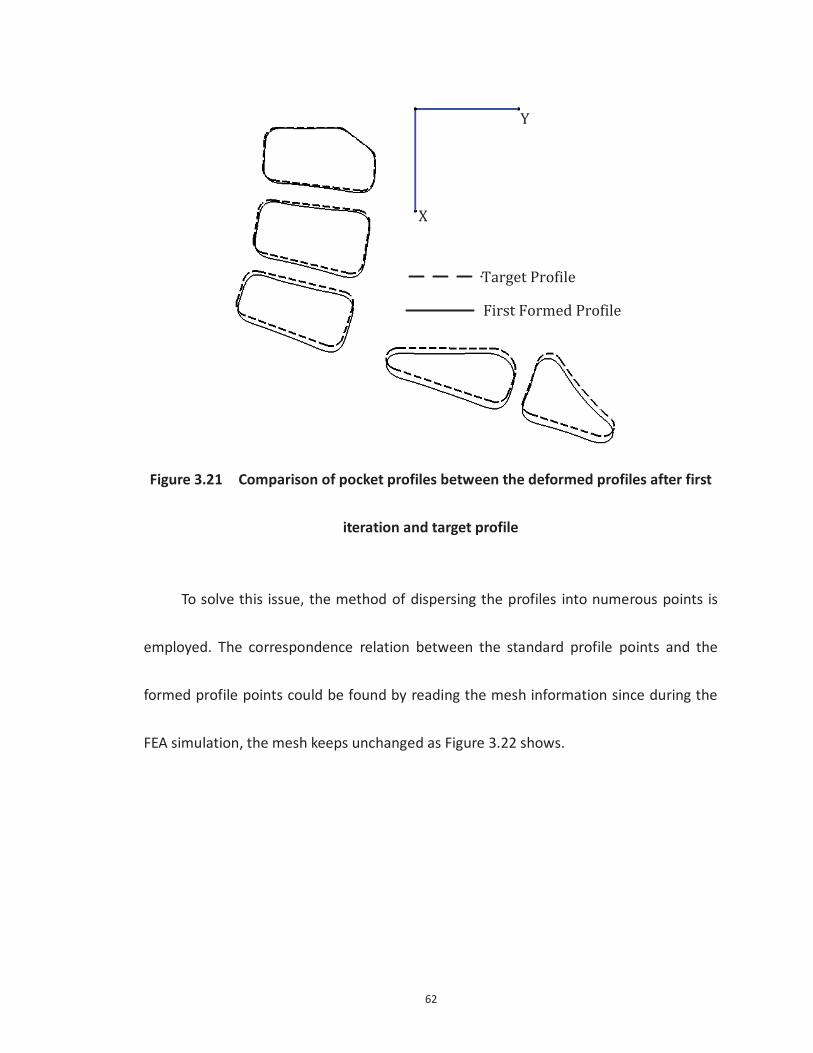
62
X
Y
Target Profile
First Formed Profile
Figure 3.21 Comparison of pocket profiles between the deformed profiles after first
iteration and target profile
To solve this issue, the method of dispersing the profiles into numerous points is
employed. The correspondence relation between the standard profile points and the
formed profile points could be found by reading the mesh information since during the
FEA simulation, the mesh keeps unchanged as Figure 3.22 shows.
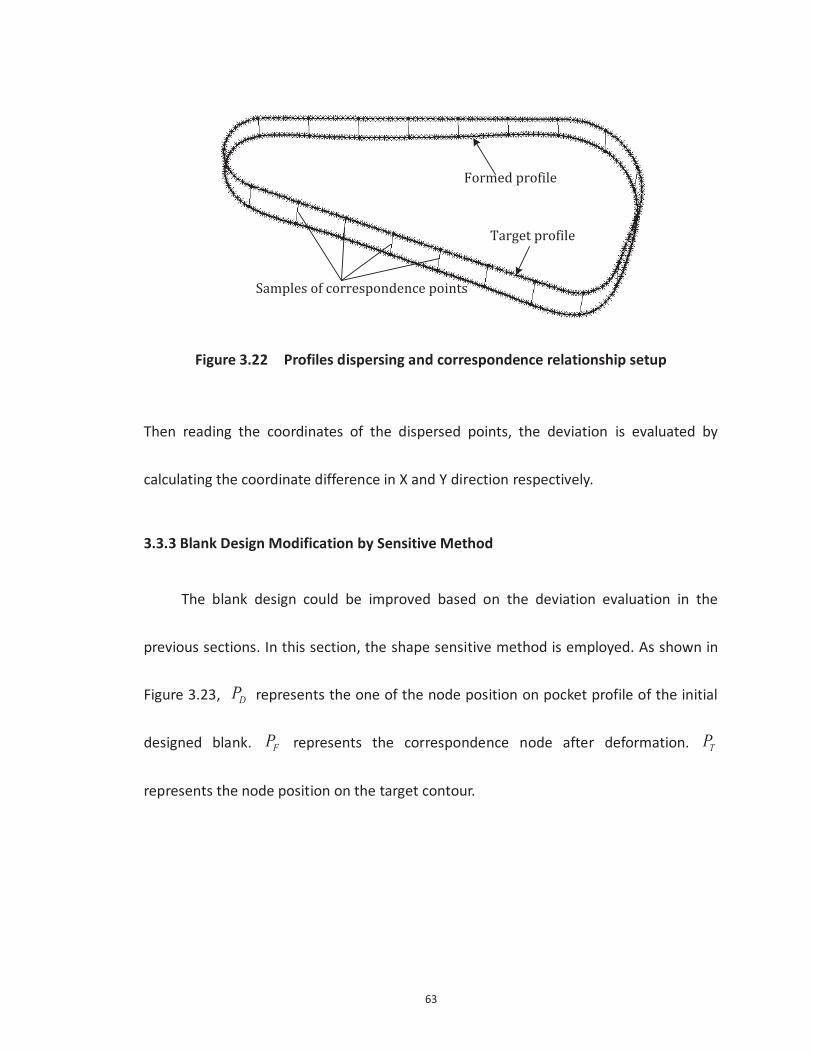
63
Samples of correspondence points
Target profile
Formed profile
Figure 3.22 Profiles dispersing and correspondence relationship setup
Then reading the coordinates of the dispersed points, the deviation is evaluated by
calculating the coordinate difference in X and Y direction respectively.
3.3.3 Blank Design Modification by Sensitive Method
The blank design could be improved based on the deviation evaluation in the
previous sections. In this section, the shape sensitive method is employed. As shown in
Figure 3.23, DP represents the one of the node position on pocket profile of the initial
designed blank. FP represents the correspondence node after deformation. TP
represents the node position on the target contour.

64
Initial pocket profile
Target pocket profile
Formed pocket profile
PD
Linearized deformation path
PT
PF
Figure 3.23 Movement of node in deformation process
When the blank deformation finished, the offset of blank is determined by the shape
sensitivity. As Figure 3.24 and Figure 3.25 show, 1nDP and n
DP indicate the node of
designed blank in 1 thn and thn design. 1nFP and n
FP indicate the node of
formed part after 1 thn and thn deformation. Vector 1n nD DP P is found as the
blank offset and 1n nF FP P as deformation offset of each node.
nDP
1nDP
2nDP
Figure 3.24 Node on designed flat blank
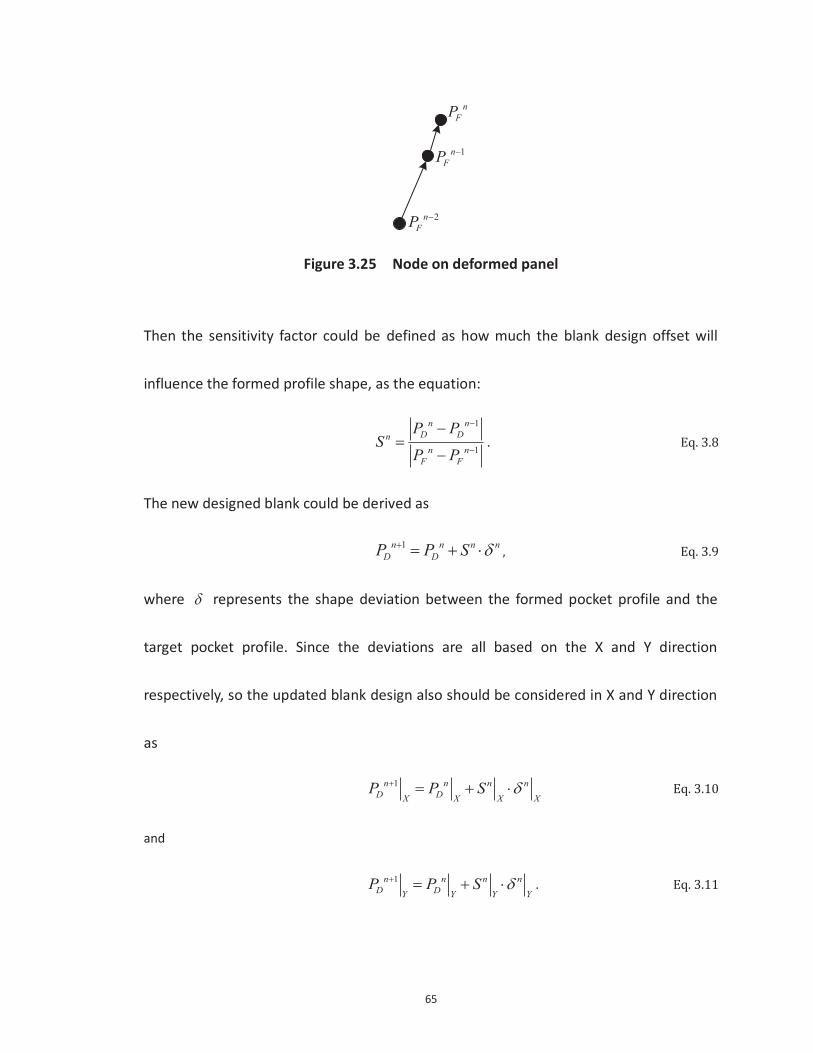
65
2nFP
nFP
1nFP
Figure 3.25 Node on deformed panel
Then the sensitivity factor could be defined as how much the blank design offset will
influence the formed profile shape, as the equation:
1
1
n nD Dnn n
F F
P PS
P P. Eq. 3.8
The new designed blank could be derived as
1n n n nD DP P S , Eq. 3.9
where represents the shape deviation between the formed pocket profile and the
target pocket profile. Since the deviations are all based on the X and Y direction
respectively, so the updated blank design also should be considered in X and Y direction
as
1n n n nD DX X X XP P S Eq. 3.10
and
1n n n nD DY Y Y YP P S . Eq. 3.11

66
3.3.4 Simulation Results Comparison and Analysis
Figure 3.26 shows numbering of the five pockets profiles in six iterations and
Figure 3.27 amplifies for the detail of pocket 5.
X
Y
Pocket 1
Pocket 2
Pocket 3
Pocket 4
Pocket 5
Figure 3.26 Numbering and six iterations of five pocket profiles

67
Pocket 5
Standard Profile1st Iteration
2nd Iteration
3rd Iteration
4th Iteration
5th Iteration
6th Iteration
Figure 3.27 Iteration comparison of pocket profile 5
Table 3.2 is the list of maximum deviations between the formed profiles and the
target profiles on XY plane by using the sensitivity method. After five iterations, the
deviation could be decreased to around 0.2mm to 0.3mm. In the sixth iteration, it is
floating around that level. Since the sensitive method requires the two offset blank, the
sensitive factor for second blank design is set as 1, which means
2 1 1D DX X XP P Eq. 3.12
and
2 1 1D DY Y YP P . Eq. 3.13

68
From Table 3.2 we can also see that from the first iteration to the second, the deviation
decreased most. For the following iterations, their convergence rates slow down since
they almost reached the target profile.
Table 3.2 Maximum deviations between the formed profiles and the target profiles on XY plane by using the sensitivity method
Max. deviation
(mm) Profile 1 Profile 2 Profile 3 Profile 4 Profile 5
Iteration 1 3.646 6.629 8.922 10.71 10.506 Iteration 2 1.932 2.25 2.275 2.191 2.704 Iteration 3 0.817 0.611 0.77 1.139 0.994 Iteration 4 0.717 0.386 0.349 0.831 0.557 Iteration 5 0.23 0.245 0.221 0.372 0.314 Iteration 6 0.253 0.217 0.318 0.367 0.348
Table 3.3 Setting the sensitive factor as 1 in all the iterations
Max. deviation
(mm) Profile 1 Profile 2 Profile 3 Profile 4 Profile 5
Iteration 1 3.646 6.629 8.922 10.71 10.506 Iteration 2 1.932 2.25 2.275 2.191 2.704 Iteration 3 0.842 1.074 1.554 0.981 1.001 Iteration 4 0.624 0.767 0.684 1.109 0.667 Iteration 5 0.781 0.631 0.66 0.812 0.752 Iteration 6 0.507 0.63 0.774 0.608 0.512
To prove the effective of the sensitivity method, Table 3.3 shows the result of
setting the sensitive factor as 1 in all the iterations. The results of first two iterations

69
should be the same as the sensitive method. In the following iterations, it could be
found the values of maximum deviation always floating around 0.5mm to 0.6mm, that is
to say that the sensitive factor 1 is no longer suitable when the deviation has reached a
certain level.
The Table 3.4 listed the case of setting the sensitive factor as 0.5 during all the
iterations of blank design. For the final result, it showed that it could reach to the level
of around 0.2mm to 0.3mm. However, it experienced 11 iterations to get the same level
as the sensitive method.
Table 3.4 Setting the sensitive factor as 0.5 in all the iterations
Max. deviation
(mm) Profile 1 Profile 2 Profile 3 Profile 4 Profile 5
Iteration 1 3.646 6.629 8.922 10.71 10.506 Iteration 2 2.124 3.36 4.552 5.346 5.506 Iteration 3 1.167 1.833 2.381 3.131 3.077 Iteration 4 0.872 1.127 1.554 1.823 1.542 Iteration 5 0.57 0.978 0.97 1.035 1.157 Iteration 6 0.506 0.591 0.568 0.794 0.917 Iteration 7 0.399 0.484 0.511 0.433 0.61 Iteration 8 0.437 0.437 0.404 0.32 0.345 Iteration 9 0.383 0.362 0.373 0.744 0.24
Iteration 10 0.407 0.375 0.317 0.364 0.294 Iteration 11 0.295 0.461 0.374 0.294 0.338
Based on the three cases talked above, that the sensitive method, keeping the
sensitive factor as 1 and 0.5 during all the iterations, it could be found that applying the

70
sensitive method to the blank design could not only result in a relatively good result but
also it largely decrease the numbers of iteration.
3.3.5 Quality of the Deformed Part and Analysis
Since the springback phenomenon is considered in the deviation in Z direction, the
quality of the deformed part will be focused on the thickness distribution, FLD
evaluation and possible reason for deviation.
The thickness distribution of the deformed part is shown in Figure 3.28 and Figure
3.29. From them it could be seen that although some of the places are not fully
stretched or over thinning, the maximum thickness difference with the target value is
around 0.04mm for area 1 and the 0.025mm for area 2.
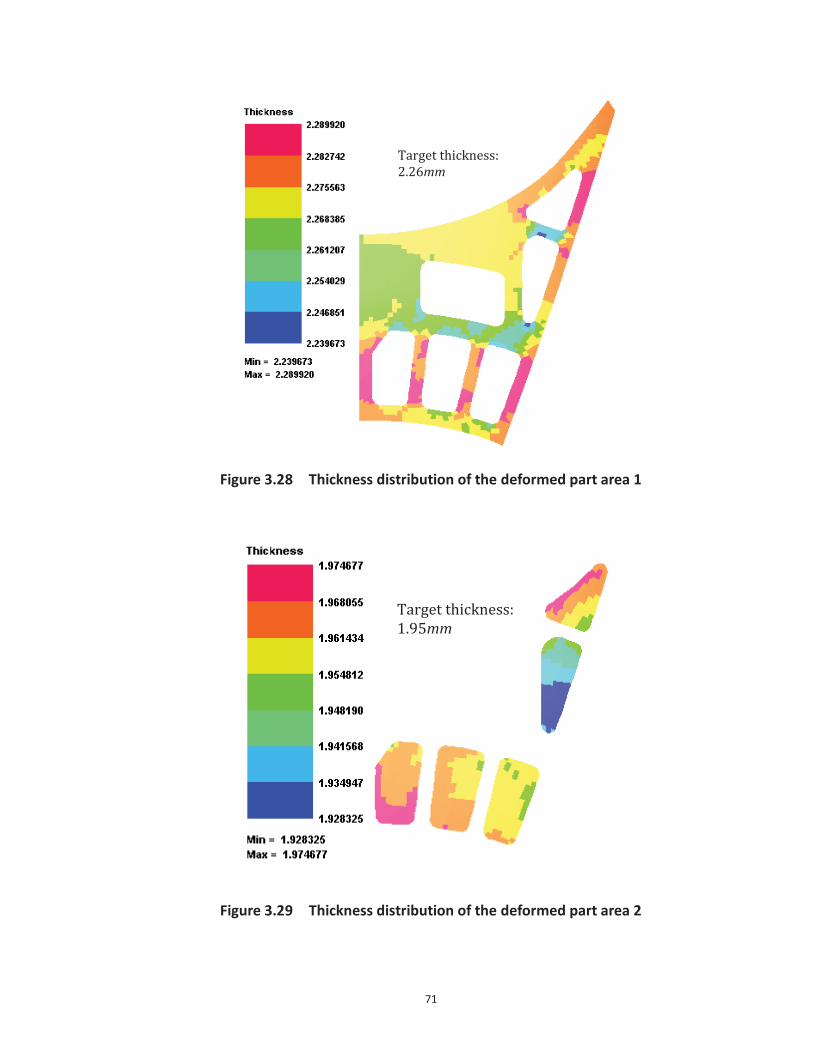
71
Target thickness: 2.26mm
Figure 3.28 Thickness distribution of the deformed part area 1
Target thickness:1.95mm
Figure 3.29 Thickness distribution of the deformed part area 2

72
Figure 3.30 Quality evaluation of the deformed part
The Figure 3.30 shows the quality evaluation of the deformed part by FLD curve. All the
points are located in the safe zone.
Another thing that needs to be mentioned here is the possible reason of the
deviation keeps around 0.2mm to 0.3mm. Except the accuracy of simulation and the
blank design in FEA simulation, due to the thin thickness, the blank is meshed as a
surface with triangle and quadrangle, whose boundaries are straight lines, as shown in
Figure 3.31. The shape deviations are unavoidable because of the space between
the straight line and the spline curve.

73
Target profile
Meshing edges of formed profile
Figure 3.31 Shape deviation caused by the meshing edges
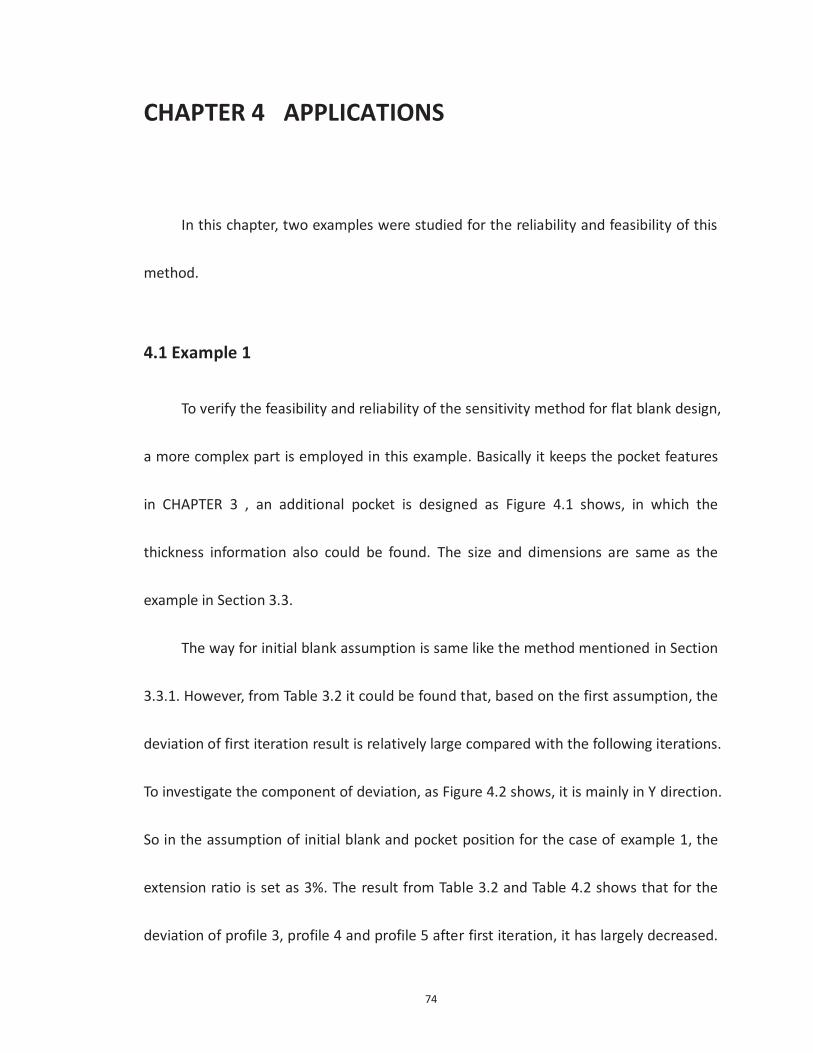
74
CHAPTER 4 APPLICATIONS
In this chapter, two examples were studied for the reliability and feasibility of this
method.
4.1 Example 1
To verify the feasibility and reliability of the sensitivity method for flat blank design,
a more complex part is employed in this example. Basically it keeps the pocket features
in CHAPTER 3 , an additional pocket is designed as Figure 4.1 shows, in which the
thickness information also could be found. The size and dimensions are same as the
example in Section 3.3.
The way for initial blank assumption is same like the method mentioned in Section
3.3.1. However, from Table 3.2 it could be found that, based on the first assumption, the
deviation of first iteration result is relatively large compared with the following iterations.
To investigate the component of deviation, as Figure 4.2 shows, it is mainly in Y direction.
So in the assumption of initial blank and pocket position for the case of example 1, the
extension ratio is set as 3%. The result from Table 3.2 and Table 4.2 shows that for the
deviation of profile 3, profile 4 and profile 5 after first iteration, it has largely decreased.

75
For the deviation of other profiles, it stays at the same level since the deviation also
could be caused in X direction.
Thickness:Area 1: 2.25mmArea 2: 2.05mmArea 3: 1.85mm
Figure 4.1 Designed part of example 1
Table 4.1 shows the maximum springback value in Z direction in five iterations.
Although it varies a little bit, by undergoing the same stretch forming process, they could
all reach the level around 5mm.

76
X
Y
Figure 4.2 Shape deviation comparison in XY plane between the target profile and
deformed profile of first iteration
Table 4.1 Maximum springback value in five iterations of example 1
Iterations No. Max. springback
value in Z direction (mm)
1 5.413 2 5.334 3 5.471 4 5.18 5 5.226
For the deviation in X and Y directions, Figure 4.3 shows the numbering of the
profiles and partial view of the deformed profiles of each iteration. Table 4.2 gives a
detail of the maximum deviation on XY plane.

77
Profile 1Y
XProfile 2
Profile 3
Profile 4Profile 5
Profile 6
Target profile
First iteration
Second iteration
Third iteration
Fourth iteration
Fifth iteration
Figure 4.3 Evaluation of the shape deviation in X and Y directions of example 1
Table 4.2 Maximum deviations between the formed profiles and the target profiles on XY plane of example 1
Max. deviation
(mm) Profile 1 Profile 2 Profile 3 Profile 4 Profile 5 Profile 6
Iteration 1 2.137 3.647 4.066 3.575 3.082 3.158 Iteration 2 1.51 2.676 2.456 3.072 2.443 2.066 Iteration 3 0.75 1.212 1.095 1.543 1.041 1.272 Iteration 4 0.472 0.427 0.672 0.371 0.421 0.761 Iteration 5 0.47 0.375 0.663 0.556 0.3 0.729
The thickness distribution of area 1, area 2, and area 3 are shown in Figure 4.4,
Figure 4.5, Figure 4.6 respectively.

78
Figure 4.4 Thickness distribution of area 1 of example 1
Figure 4.5 Thickness distribution of area 2 of example 1
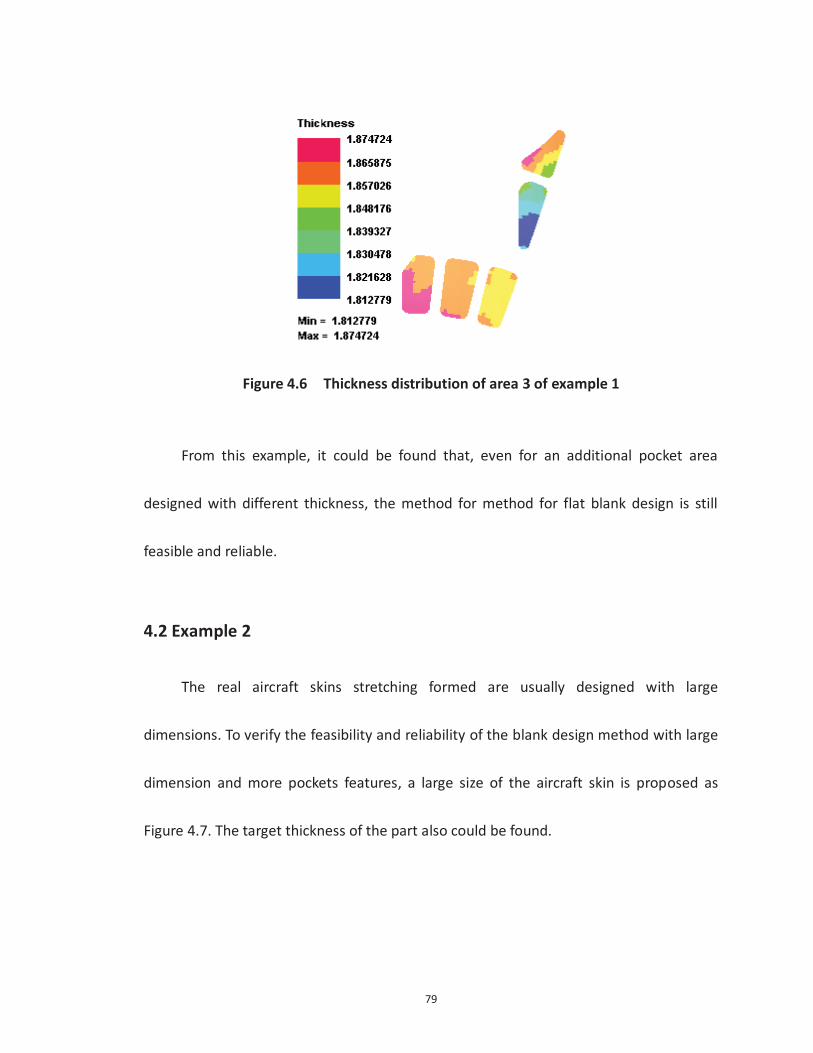
79
Figure 4.6 Thickness distribution of area 3 of example 1
From this example, it could be found that, even for an additional pocket area
designed with different thickness, the method for method for flat blank design is still
feasible and reliable.
4.2 Example 2
The real aircraft skins stretching formed are usually designed with large
dimensions. To verify the feasibility and reliability of the blank design method with large
dimension and more pockets features, a large size of the aircraft skin is proposed as
Figure 4.7. The target thickness of the part also could be found.
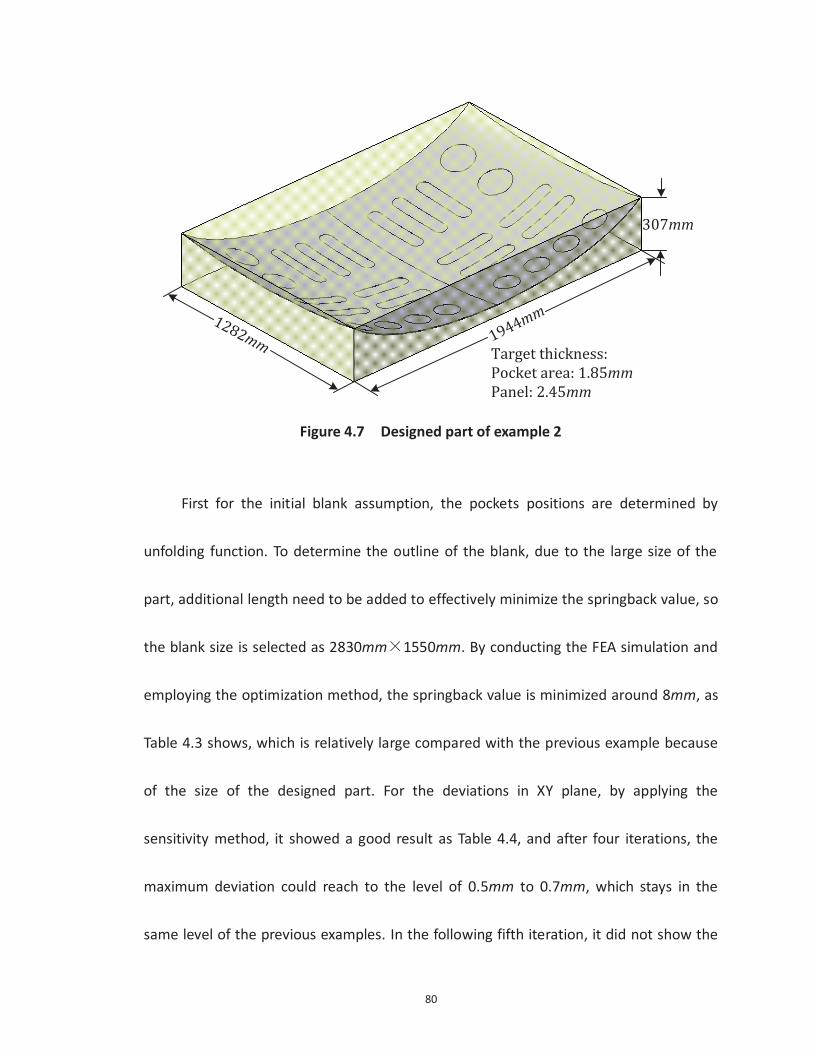
80
1944mm
307mm
1282mmTarget thickness:Pocket area: 1.85mmPanel: 2.45mm
Figure 4.7 Designed part of example 2
First for the initial blank assumption, the pockets positions are determined by
unfolding function. To determine the outline of the blank, due to the large size of the
part, additional length need to be added to effectively minimize the springback value, so
the blank size is selected as 2830mm 1550mm. By conducting the FEA simulation and
employing the optimization method, the springback value is minimized around 8mm, as
Table 4.3 shows, which is relatively large compared with the previous example because
of the size of the designed part. For the deviations in XY plane, by applying the
sensitivity method, it showed a good result as Table 4.4, and after four iterations, the
maximum deviation could reach to the level of 0.5mm to 0.7mm, which stays in the
same level of the previous examples. In the following fifth iteration, it did not show the

81
improvement of the deviation. The thickness distribution for the pockets area is in the
range of 1.8213mm~1.8878mm and the pockets area is around 2.403mm~2.481mm.
Table 4.3 Maximum springback value in five iterations of example 2
Iterations No. Max. springback
value in Z direction (mm)
1 8.249 2 8.106 3 9.085 4 8.738 5 8.059
Table 4.4 Maximum deviations between the formed profiles and the target profiles on XY plane of example 2
Max. deviation
(mm)
Iteration 1
Iteration 2
Iteration 3
Iteration 4
Iteration 5
Profile 1 5.872 2.982 0.914 0.693 0.691 Profile 2 6.687 3.911 1.215 0.55 0.79 Profile 3 8.217 3.225 1.189 0.663 0.79 Profile 4 11.755 4.173 1.527 0.777 0.91 Profile 5 7.398 3.033 1.179 0.525 0.573 Profile 6 12.648 4.904 1.514 0.691 0.533 Profile 7 7.305 2.852 1.005 0.655 0.52 Profile 8 12.471 3.37 1.94 0.703 0.526 Profile 9 10.156 2.542 0.917 0.286 0.531
Profile 10 10.587 3.003 1.523 0.569 0.518 Profile 11 5.683 2.268 0.716 0.447 0.44 Profile 12 11.98 4.983 1.236 0.619 0.773 Profile 13 12.113 3.161 1.074 0.585 0.708
From the example 2, it also proved that for the aircraft skin with large dimensions

82
and multi features, the method for flat blank design is still feasible and reliable.

83
CHAPTER 5 Conclusions and Future Work
5.1 Conclusions
In this work, a new approach is proposed for the manufacture of the aircraft skin
by machining the pockets on the flat blank and then performing the stretching. To
ensure the accuracy of simulation, the kinematic movement of the stretching machine,
the properties of the materials are analyzed. For the simulation result of the deformed
part, the position and shape are checked in X, Y and Z three directions respectively.
Comparing to the traditional method of aircraft skin manufacture that machining the
pocket features on the stretched panel, it solved the issue of machining accuracy on the
curved surface, whose curvature is slightly varied from the designed part due to the
springback phenomenon. The major improvements and contributions of this thesis can
be summed up in the following aspects:
To check the deviation between the deformed part and the designed part in Z
direction, the optimization method is employed to obtain the optimal stretching process
parameters by minimization of the maximum springback value. Each stretching stage is
analyzed and the possible movements are designed based on the stretching machine.
84
To evaluate the deviation in X and Y directions and find the mapping relationship
of the pockets on the flat blank, initial flat blank is assumed by unfolding the designed
part on XY plane and then performing the FEA simulation. Based on the deviation
between the deformed part and the designed part in X and Y directions, the blank
design is updated by applying the shape sensitivity method. Then conduct the second
iteration of simulation until the deviation has reached the requirement.
The results of the applications prove the feasibility and reliability of this method.
By employing the sensitivity method, the deviation always could converge to the level
around 0.3mm to 0.6mm. The quality evaluation by FLD curve shows a qualified part.
Also, due to the limitation of the FEA method, the possible reason for the final level of
deviation is mentioned.
5.2 Future work
For future research, the following topics can be considered to expand the present
work:
To obtain the accuracy simulation of the stretching forming process, the process
parameters of friction coefficient, temperature are changing during the stretching
process and they have some effects on the formed part, they could be taken into

85
consideration if those data are known.
The feature of the slot of the slot could be considered. Due to the stress
concentration, a solution could be proposed that the slots are machined before the
stretching process and without quality defects.
An automatic system could be developed. According to the input of a designed
panel, a system comprising CAD model analysis, FEA simulation, optimization calculation
and flat blank design modification could output the optimal blank.

86
Bibliography
1. Parris, A. N. (1996). Precision stretch forming of metal for precision assembly (Doctoral dissertation, Massachusetts Institute of Technology).
2. Wisselink, H. H., & van den Boogaard, A. H. (2005, August). Finite element simulation of the stretch-forming of aircraft skins. In AIP Conference Proceedings (Vol. 778, No. A, p. 60). IOP INSTITUTE OF PHYSICS PUBLISHING LTD.
3. Zhang, Y., Zhou, X., Luo, H., & Li, X. (2006). Optimization and validation of loading trajectory for double curve aircraft skin stretch forming process. Zhongguo Jixie GongchengChina Mechanical Engineering, 17(19), 2053-2056.
4. Zhang, Y. M., & Zhou, X. B. (2006). Parameter Optimization in Aircraft Skin Stretch Forming Process. ACTA AERONAUTICA ET ASTRONAUTICA SINICA-SERIES A AND B-, 27(6), 1203.
5. Han, J. Q., Wan, M., & Chen, X. M. (2009). Optimization of process parameters in stretch forming of aircraft complex skin. Journal of Plasticity Engineering, 6, 019.
6. He, D. H., Li, D. S. & Li, L. Q. (2009). Design and optimization of the loading trajectory in aircraft skin drape forming process. Journal of Plasticity Engineering, 6, 020.
7. Liu, Y. C. & Zhou, X. B. (2004). Mechanism motion analysis of the skin stretch-forming machine. Aeronautical Manufacturing Technology, 1, 85-88.
8. HE, D. H., LI, D. S., TUN, Z. M., & LI, X. J. (2010)Design of Displacement Loading for Aircraft Skin in NC Stretch Forming. China Mechanical Engineering, 2, 137-140.
9. Karima, M. (1989). Blank development and tooling design for drawn parts using a modified slip line field based approach. Journal of Engineering for Industry, 111 (4), 345-350.
10. Vogel, J. H., & Lee, D. (1990). An analysis method for deep drawing process design. International Journal of Mechanical Sciences, 32(11), 891-907.
11. Chen, X., & Sowerby, R. (1992). The development of ideal blank shapes by the method of plane stress characteristics. International journal of mechanical sciences, 34(2), 159-166.
12. Chen, X., & Sowerby, R. (1996). Blank development and the prediction of earing
87
in cup drawing. International journal of mechanical sciences, 38(5), 509-516.
13. Kuwabara, T., & Si, W. H. (1997). PC-based blank design system for deep-drawing irregularly shaped prismatic shells with arbitrarily shape flange. Journal of materials processing technology, 63(1), 89-94.
14. Parsa, M. H., Matin, P. H., & Mashhadi, M. M. (2004). Improvement of initial blank shape for intricate products using slip line field. Journal of materials processing technology, 145(1), 21-26.
15. Sowerby, R., Duncan, J. L., & Chu, E. (1986). The modelling of sheet metal stampings. International journal of mechanical sciences, 28(7), 415-430.
16. Blount, G. N., & Fischer, B. V. (1995). Computerised blank shape prediction for sheet metal components having doubly-curved surfaces. THE INTERNATIONAL JOURNAL OF PRODUCTION RESEARCH, 33(4), 993-1005.
17. Gerdeen, J. C., & Chen, P. (1989, June). Geometric mapping method of computer modeling of sheet metal forming. In Numiform (Vol. 89, pp. 437-444).
18. Barlet, O., Batoz, J. L., Guo, Y. Q., Mercier, F., Naceur, H., & Knopf-Lenoir, C. (1996). Optimum design of blank contours using the inverse approach and a mathematical programming technique. In Numisheet (Vol. 96, pp. 178-185).
19. Guo, Y. Q., Batoz, J. L., Naceur, H., Bouabdallah, S., Mercier, F., & Barlet, O. (2000). Recent developments on the analysis and optimum design of sheet metal forming parts using a simplified inverse approach. Computers & Structures, 78(1), 133-148.
20. Guo, Y. Q., Naceur, H., Debray, K., & Bogard, F. (2003). Initial solution estimation to speed up inverse approach in stamping modeling. Engineering Computations , 20(7), 810-834.
21. Tang, B. T., Zhao, Z., Lu, X. Y., Wang, Z. Q., Zhao, X. W., & Chen, S. Y. (2007). Fast thickness prediction and blank design in sheet metal forming based on an enhanced inverse analysis method. International journal of mechanical sciences, 49(9), 1018-1028.
22. Parsa, M. H., & Pournia, P. (2007). Optimization of initial blank shape predicted based on inverse finite element method. Finite elements in analysis and design, 43(3), 218-233.
23. Toh, C. H., & Kobayashi, S. (1985). Deformation analysis and blank design in square cup drawing. International Journal of Machine Tool Design and Research,

88
25(1), 15-32.
24. Kim, N., & Kobayashi, S. (1986). Blank design in rectangular cup drawing by an approximate method, International Journal of Machine Tool Design and Research, 26(2), 125-135.
25. Guo, Y. Q., Batoz, J. L., Detraux, J. M., & Duroux, P. (1990). Finite element procedures for strain estimations of sheet metal forming parts. International Journal for Numerical Methods in Engineering, 30(8), 1385-1401.
26. Barlat, F., Chung, K., & Richmond, O. (1994). Anisotropic plastic potentials for polycrystals and application to the design of optimum blank shapes in sheet forming. Metallurgical and Materials Transactions A, 25(6), 1209-1216.
27. Park, S. H., Yoon, J. W., Yang, D. Y., & Kim, Y. H. (1999). Optimum blank design in sheet metal forming by the deformation path iteration method. International Journal of Mechanical Sciences, 41(10), 1217-1232.
28. Shim, H. B., & Son, K. C. (2001). Optimal blank design for the drawings of arbitrary shapes by the sensitivity method. Journal of engineering materials and technology, 123(4), 468-475.
29. Biglari, F. R., Agahi, A., Nikfarjam, O., & Nikbin, K. (2006). Optimum Blank Design Based on Modified Sensitivity Approach. stress, 31, 208.
30. Jin, C. H., Zhou, X. B., Diao, K. S., & Li, X. X. (2004). Springback analysis for stretch bending of aluminum profile. Cailiao Kexue Yu Gongyi(Material Science and Technology)(China), 12(4), 394-397.
31. Diao, K. S., Zhou, X. B., Li, X. X. (2005). Stretch bending of aluminum extrusion. Journal of Beijing University of Aeronautics and Astronautics, 31(2), 134-137.
32. Jin, Z. H., Zhou, X. B. & Diao, K. S. (2004) Numerical simulation of stretch-bending process for extruded aluminum rectangular tubes. Materials Science & Technology, 12(6), 572-575.
33. Clausen, A. H., Hopperstad, O. S., & Langseth, M. (2000). Stretch bending of aluminium extrusions for car bumpers. Journal of Materials Processing Technology, 102(1), 241-248.
34. Tongxi, X. Y., & Zhang, L. (1996). Plastic bending: theory and applications (Vol. 2). World Scientific.
35. Lin, S. B., & Ding, J. L. (1995). Experimental study of the plastic yielding of rolled

89
sheet metals with the cruciform plate specimen. International journal of plasticity, 11(5), 583-604.
36. Barlat, F., Maeda, Y., Chung, K., Yanagawa, M., Brem, J. C., Hayashida, Y., ... & Makosey, S. (1997). Yield function development for aluminum alloy sheets. Journal of the Mechanics and Physics of Solids, 45(11), 1727-1763.
37. Taguchi, G., Jugulum, R., & Taguchi, S. (2004). Computer-based robust engineering: essentials for DFSS. ASQ Quality Press.
38. Bolboacă, S. D., & Jäntschi, L. (2007). Design of experiments: Useful orthogonal arrays for number of experiments from 4 to 16. Entropy, 9(4), 198-232.


