

2
ACKNOWLEDGEMENTSThe Boyne Tannum Hook Up (BTHU) is the largest family fishing competition in Australiawith around 3,000 adult entrants and many more juniors. The event is managed by theBoyneTannumHookUpManagementCommitteeandisahugeundertaking.ThisyearisthethirdunderthenewcommitteewithJenniMaguireandherteamandarecongratulatedonagreateventagainthisyear.Thecommitteehasplacedaparticularemphasisonthesustainabilityoftheeventandthefish stocks on which the event relies. To that end the committee provided a donation toInfofishAustraliatocontinueitsdatacollectionattheBTHU.Infofishhascollectedtagdatasince 2000 in conjunction with the Gladstone Sportfishing Club and catch and effort datasince2004throughanumberofprojects.2015wastheonlyyearthatcatchandeffortdatawerenotabletobecollected.CoverPhotos:Top–Collectingfishingtripdetailsattheliveweigh-instationBottom – tagged Mangrove Jack and Barred Javelin in the Gladstone Sportfishing ClubdisplaytankpriortoreleasePhotosbelowarescenesfromthe2017BTHUatBrayPark.

3
BOYNETANNUMHOOKUP2008-2017REPORTThis report has been prepared by Infofish Australia for the Boyne Tannum HookUpCommittee–June2017.SCOPE Thisreportexaminesthedatacollectedduringthe2017HookUpanddatacollectedoverthepastdecadefrom2008-2017:
ª Estuarycatchratesin2017andchangeincatchratesfrom2008-2017ª Speciescompositionofthecatchª Hometownoffishersª Taggedfishandrecaptureratesª Dispersaloftaggedfishreleasedfromtheliveweigh-inª Sizecompositionoffishweighedandtaggedattheliveweigh-in
DATASOURCESDatacollectedattheBoyneTannumHookUp:
ª CatchandeffortboatrampsurveysforfishingtripsbyInfofishAustraliafrom2008-2017
ª Taggingdatafromliveweigh-inbyGladstoneSportfishingClubfrom2008-2017ª DataarestoredintheInfofishAustraliadatabaseathttp://qld.info-fish.net.
BACKGROUNDThe Boyne Tannum HookUp celebrated its 22nd birthday in 2017. It has grown to be thelargestfishingcompetitioninAustraliawithacurrentcapof3,000adultentrants.Theeventhas its headquarters at Bray Park near the mouth of the Boyne River. While there are nofishing boundaries most of the estuary fishing occurs from the Narrows in the north toRoddsHarbour(TurkeyBeach)inthesouth.Thereareanumberoffishingcategoriesincludingaliveweigh-insectionthatismanagedbytheGladstoneSportfishingClubwhichcommencedin2000.InfofishAustraliahasalsocollectedcatchandeffortdatathroughboatrampsurveyssince2004.From2004-2006thefocuswascollectingdataonoffshoretripsthroughtheCapReefproject. From 2007-2014 the focus shifted to estuary trips through CapReef and later theGladfishproject.Noboatrampsurveyswereconductedin2015.In2016-2017thefocusremainedonestuarytripswithanemphasisonBreamasYellowfinBream and Pikey Bream recruitment were selected as the fish indicator for the GladstoneHealthyHarbourPartnership.

4
METHODSBoatrampsurveyswereundertakenattheBrayParkrampandotherkeyboatrampsintheGladstoneareatoobtaindetailsofcatchandeffort.Surveyswerealsoconductedattheliveweigh-instationasthisprovideddatafromalloverthefishingarea.Boatrampsurveyscollectedthefollowingdetails:
ª Numberoftrailersatboatrampsª Dateoftripª Startandfinishtimesofthetrip(timeleavingboatrampandreturn)ª Forlandbasedtripsthefishingtimewasrecordedª Speciesbynumberkeptandnumberreleasedª Lengthswererecordedwhereprovidedandthroughtheliveweigh-in
Data from boat ramp surveys were analysis to determine the catch rate for estuary tripseachyear.Catchdetailswerecollectedas fishcaught/trip timeand fishkept/trip time foreachyear’sevent.Catchrateswerethencalculatedbasedonastandardfishingtripsothatacomparisoncouldbemadebetweencatchandeffortforeachyear.
Standardfishingtrip=AveragenumberoffishersxaveragefishingtimeFor 2016-2017 an additional analysis was undertaken to compare results over the 3 days,overall and for key species Bream, Flathead and Whiting. Species in the catch wereaggregated at the group level as there was likely to be some misidentification of actualspecies.The aggregated Bream data included Yellowfin Bream, Pikey Bream and Tarwhine. Theaggregateddata forFlathead includedDuskyFlathead,BartailFlathead,RockFlatheadandother Flathead (not specified). The aggregated data for Whiting included Sand Whiting,GoldenlineWhiting,NorthernWhiting,WinterWhitingandWhiting(notspecified).AsBreamrecruitmenthasbeenadoptedfor theGladstoneHealthyHarborPartnership fortheReportCardon thehealthofGladstoneHarbourand surroundscatch rates forBreamoverthedatacollectionperiodwerealsocalculated.Anadditionalanalysiswasundertakenofcatchratesbylocation.CatchratesfortheBoyneRiverandSouthTrees inlet (SuntaggridmapBRG)werecomparedwithcatch rates forallotherlocations.Total estuary trips were estimated to determine the overall fishing effort. Trailer countswereundertakenatkeyboatrampseachdayandthencorrectedtototaltripsperdayusinga correction factor calculated during the Gladfish project. For other ramps from RamsayCrossing at the Narrow in the north to Turkey Beach in the south the number of tripsrecordedfromthoserampsduringboatrampsurveyswereused.AnestimatewasthenmadeofthepercentageofthosetripsthatwereassociatedwithBTHUestuarytripsbasedontheweather(windspeed)andpercentageoflargertrailers(usedforoffshore fishing). Landbased tripswerealsoestimatedandcorrected to total tripsperdayusingacorrectionfactorcalculatedduringtheGladfishproject.

5
The species composition of the catch from boat ramp surveys in 2017 was assessed todeterminethemostcaughtandkeptspecies.Locationswererecordedbasedonriver,creekorharboursothatanassessmentoflocationsfishedcouldbemade.Datacollectedatboatrampssurveysincludedthehometownoffishersundertakingfishingtrips.Where fisherscamefromdifferent townsthehometownof theboatowner/skipperwasrecorded.Itwasnotedthatinmanyinstancestheboatowner/skipperwasalocalwithfamily members or friends from other centres. As trips were recorded over 3 days manyfishersweresurveyedmorethanoncesothatthehometownfortripsreflectsthenumberoftripsbyfishersfromthosecentres.Theliveweigh-insectioninvolveslegalsizebeingbroughtinlivetotheheadquartersatBrayParkwheretheyaremeasured,weighedandtagged.Theywerethenplacedindisplaytankswhere their recovery could be monitored. They were then released at the Bray Park boatramp. Recaptures of these fish are then recorded to determine dispersal of fish from thereleasesite.Fish lengths were obtained from tag records and an analysis of size range of fish wasundertakenforBreamandFlathead.KEYFISHINGAREAThere are no fishing boundaries for fishing in the BTHU however much of the fishing iscarriedoutfromtheNarrowsinnorthtoRoddsHarbourinthesouth.Figure1showsthekeyfishingareasaroundGladstonewheremostestuaryfishersfishedintheBTHU.
Figure1:MainestuaryfishingareafishedintheBTHUin2017
6
SOMEOBSERVATIONSBasedonthedatacollectedintheBTHUin2017(28-30/4/2017)andfrom2008-2017:
ª Thereweredetailsof296trips(272estuaryand24offshoretrips)collectedthroughboatrampsurveysandatthelive-weigh-instationin2017
ª Analysis was limited to estuary trips as offshore trips were severely limited byweatherconditionsandtherewereinsufficienttripstoprovidereliableestimates
ª Catchrates for fishcaughtand forBreamcaughthave trendedupwardsover timewhilethecatchrateforkeptfishhastrendeddownwards
ª Forthepast10years,theoverallcatchraterangedfromalowof5.1fish/stdtripin2010toahighof10.4fish/stdtripin2016(9.7fish/stdtripin2017)
ª Catchratesin2016and2017declinedoverthe3daysofthecompetitionª YellowfinBreamcomprised38.3%of thecatch followedbySandWhitingat13.4%
andBarredJavelinat9.7%ª Fishers from Gladstone and surrounds from Boyne Island to Mount Larcom
accountedfor69.6%oftripsand60.1%oftripsweretotheBoyneRiverandSouthTreesInlet
ª Liveweigh-inoffishandtagginghasoccurredfrom2000-2017ª The average recapture rate from 2008-2017 was 5.0% and ranged from a low of
3.6%in2010toahighof6.3%in2014ª For recaptures 76.7% were made within 6 months, 97.9% were recaptured were
within20kmand57.9%werewithin2kmª Forfishtagged25.9%ofYellowfinBreamwereinthesizerange280:299mm,31.0%
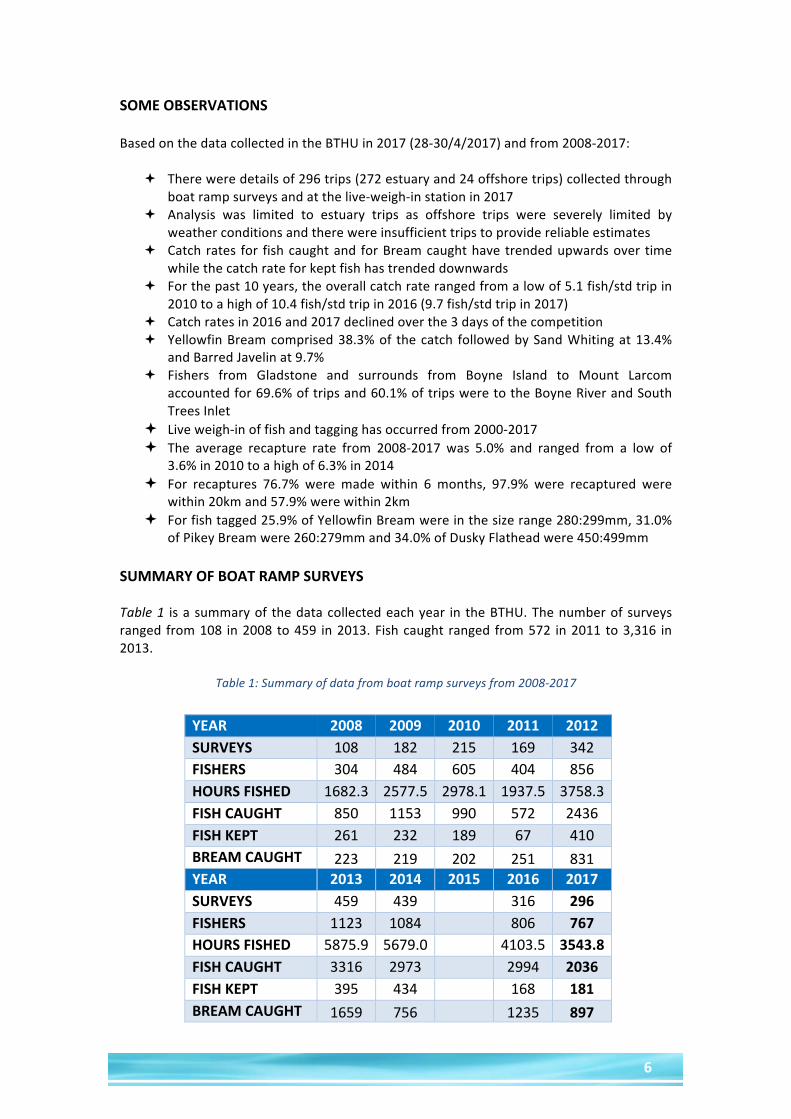
ofPikeyBreamwere260:279mmand34.0%ofDuskyFlatheadwere450:499mmSUMMARYOFBOATRAMPSURVEYSTable1 isasummaryof thedatacollectedeachyear in theBTHU.Thenumberofsurveysranged from108 in2008to459 in2013.Fishcaught ranged from572 in2011to3,316 in2013.
Table1:Summaryofdatafromboatrampsurveysfrom2008-2017
YEAR 2008 2009 2010 2011 2012SURVEYS 108 182 215 169 342FISHERS 304 484 605 404 856HOURSFISHED 1682.3 2577.5 2978.1 1937.5 3758.3FISHCAUGHT 850 1153 990 572 2436FISHKEPT 261 232 189 67 410BREAMCAUGHT 223 219 202 251 831YEAR 2013 2014 2015 2016 2017SURVEYS 459 439 316 296FISHERS 1123 1084 806 767HOURSFISHED 5875.9 5679.0 4103.5 3543.8FISHCAUGHT 3316 2973 2994 2036FISHKEPT 395 434 168 181BREAMCAUGHT 1659 756 1235 897

7
ESTUARYCATCHRATES2008-2017To ensure a valid comparison could be made between catch rates from year to year astandardfishingtripwasdeterminedbasedontheaveragefishingtripandcatchrateswereadjustedtofish/standardtrip.Thestandardfishtripadoptedwas:
Standardfishingtrip=2.5fishersX5fishinghours=12.5fishinghoursFigure2shows the catch rates each year from 2008-2017. The lowest catch rate was 5.1fish/stdtripin2010to10.4fish/stdtripin2016.Thisshowsanoverallupwardtrendinthecatchrateoverthepast10yearswiththehighestcatchratein2016.Thecatchratein2017was9.7fish/stdtrip.
Figure2:BTHUestuarycatchratesfrom2008-2017(bars95%confidence)
Figure3:BTHUestuarycatchratesforkeptfishfrom2008-2017(bars95%confidence)
0.00
2.00
4.00
6.00
8.00
10.00
12.00
14.00
2008 2009 2010 2011 2012 2013 2014 2015 2016 2017
FISH/
STDTRIP
BOYNETANNUMHOOKUPESTUARYCATCHRATE
0.00
0.50
1.00
1.50
2.00
2.50
3.00
2008 2009 2010 2011 2012 2013 2014 2015 2016 2017
BOYNETANNUMHOOKUPKEPTFISHCATCHRATE

8
Figure3showsthecatchratesforkeptfisheachyearfrom2008-2017.Thelowestrateforkeptfishwas0.4fish/stdtripin2011toahighof1.8fish/stdtripin2008.In2017thecatchrateforkept fishwas0.8fish/stdtrip.Overall14.1%of fishcaught inallBTHUswerekeptwhilein2017therewere8.9%kept.Itshouldbenotedthat2011wastheheightofthefishhealthissuesinGladstoneandfisherswerediscouragedfromkeepingfish.Therehasbeenasteadydeclineinthecatchrateoffishkept.Thishasbeenmainlyduetotheincreasedpopularityoftheliveweigh-inovertime.In2017itwasreportedthatmanyfishersreleasedfishthatwereoverlegalsize.WithBreamnowbeingmonitored for thereportcardon thehealthofGladstoneHarbourthedataforBreamwereexaminedinmoredetail.Figure4showsthecatchrateforBream(allspeciescombined)from2008-2017.Breamcatchratesrangedfromalowof1.6fish/stdtripin2010toahighof4.1fish/stdtripin2016and2017.Overall35.1%offishcaughtinallBTHUswereBreamwhilein2017theywere44.1%ofthecatch.
Figure4:BTHUBreamcatchratesfrom2008-2017(bars95%confidence)
CATCHRATES2017 Catchrates for2017wereassessedforeachdaytodeterminechanges incatchratesovertheevent.Figure5showsthedailycatchratesfor2017.Thehighestcatchratewasrecordedonday1with11.1 fish/std tripand9.1 fish/std triponday2.Day3 focusedoncollectingdata from offshore trips resulting in a limited number of estuary trips. The average catchrateover3dayswas9.7fish/stdtrip.ThedailycatchrateswerealsoassessedforthekeyspeciesBream,FlatheadandWhitingforeachday.Figure6showthedailycatchratesforthekeyspecies.ForBreamthedailycatchrate was 4.5 fish/std trip on day 1 and 4.1 fish/std fish on day 2. Bream were caught on73.9%oftripsandwere44.1%ofthecatch.ForFlatheadthedailycatchratewas0.8 fish/std triponday1and0.4onday2.Flatheadwerecaughton17.3%oftripsandwere9.3%ofthecatch.ForWhitingthedailycatchratewas1.5fish/stdtriponday1and1.1fish/stdtriponday2.Whitingwerecaughton18.0%oftripsandwere13.2%ofthecatch.
0.00
1.00
2.00
3.00
4.00
5.00
6.00
2008 2009 2010 2011 2012 2013 2014 2015 2016 2017
FISH/
STDTRIP
BOYNETANNUMHOOKUPBREAMCATCHRATE

9
Figure5:BTHUdailycatchratesfor2017(bars95%confidence)
Figure6:BTHUkeyspeciesdailycatchratesfor2017(bars95%confidence)
As the headquarters for the BTHU are at Bray Park much of the fishing effort wasconcentratedintheBoyneRiverandSouthTreesInlet,especiallyforthosetakingpartinthelive weigh-in as this meant a shorter time for keeping fish alive for the live weigh-in. Thiscouldresultinadifferentcatchratecomparedwithotherlocations.Figure7showsthecatchratesfortheBoyneRiverandSouthTreesinlet(SuntagmapBRG)comparedwithotherlocationsin2017.ThecatchratefortheBoyneRiverandSouthTreesInletwas9.9fish/stdtripwhileforallotherlocationscombinedwas10.4fish/stdtrip.Thissuggeststherewaslittledifferenceintheoverallestuarycatchrate.
0.00
2.00
4.00
6.00
8.00
10.00
12.00
14.00
16.00
18.00
DAY1 DAY2 DAY3 DAYS1-3
FISH
/STD
TRIP
BOYNETANNUMHOOKUPDAILYCATCHRATES2017
0.00
1.00
2.00
3.00
4.00
5.00
6.00
7.00
DAY1 DAY2 DAY3 DAYS1-3
FISH
/STD
TRIP
BOYNETANNUMHOOKUPKEYSPECIESDAILYCATCHRATES2017
BREAM/STDTRIP FLATHEAD/STDTRIP WHITING/STDTRIP

10
Figure7:Catchratesbylocationin2017(bars95%confidence)
FISHINGEFFORT2017 There were 17 boat ramps from Ramsay Crossing at the Narrows in the north to TurkeyBeachinthesouththatwereprimarilyusedduringtheBTHU.Foreachdaythetotalnumberof fishing trips, both boat and landbased, were estimated. Figure 8 shows the estimatednumberofestuarytripseachdayandoverall.Theestimatednumberoftripsforthe3dayswas926.4+/-20%.Thetotalnumberofsurveyswas296whichwas32.0%oftheestimatedtotalnumberoftrips.
Figure8:Estimatednumberofestuarytripsin2017(bars+/-20%ofestimate)
0.00
2.00
4.00
6.00
8.00
10.00
12.00
14.00
BOYNE/SOUTHTREES OTHERLOCATIONS
FISH
/STD
TRIP
BOYNETANNUMHOOKUPCATCHRATESBYLOCATION2017
0
200
400
600
800
1000
1200
DAY1 DAY2 DAY3 DAY1-3
TRIPS
BOYNETANNUMHOOKUPFISHINGTRIPSANDSURVEYS2017
FISHINGTRIPS SURVEYS

11
SPECIESCOMPOSITION2017 From the boat ramp surveys, there were a total of 44 species recorded in estuary trips.Figure 9 shows the top 10 species caught with Yellowfin Bream comprising 38.3% of thecatchfollowedbySandWhitingat13.4%andBarredJavelinat9.7%.OftheYellowfinBreamcaught6.7%werekept,26.1%ofSandWhitingcaughtwerekeptand5.6% of Barred Javelin were kept. For other species 43.2% of Blue Threadfin caught werekept.
Figure9:Top10speciesrecordedin2017boatrampsurveys
LOCATIONSFISHED2017
Figure10:Locationswheretripswererecordedin2017
02004006008001000
NUMBEROFFISH
BOYNETANNUMHOOKUPSPECIESCOMPOSITION2017
Caught Kept
05101520253035404550
PERCEN
RTAG
ELO
CATIONS
BOYNETANNUMHOOKUPLOCATIONSFISHED2017

12
Figure10showsthelocationswherefishersfishedin2017rangingfromtheNarrowsinthenorthtoRoddsHarbourinthesouth.AstheBTHUiscentredaroundBrayPark43.9%oftripsweretotheBoyneRiverandafurther16.2%weretoSouthTreesInlet.HOMETOWNOFFISHERS2017 Forthe2017tripsthehometownoftheboatowner/skipperwasrecorded.Figure11showsthebreakdownofhometownsoffishers.Thehighestnumberoftripswereundertakenbythose from Boyne Island/Tannum Sands with 40.9% of trips. For Gladstone and surroundsfrom Boyne Island to Benaraby to Calliope to Mount Larcom the percentage of trips was69.6%.Fisherscamefromas farafieldasTownsville inthenorthtoNSWinthesouthandDysarttothewest.
Figure11:Hometownoffishersfishingin2017
FISHTAGGEDANDRECAPTURED2008-2017
Figure12:Fishtaggedandrecapturerates2008-2017
41%
20%
9%
9%
7%4%3%3%2%1%1%0%0%
TTRRIIPPSS BOYNEISLAND/TANNUMSANDSGLADSTONEROCKHAMPTON/CAPCOASTBENARABY/CALLIOPE/YARWUNINLANDCENTRALQLDBRISBANESUNSHINECOASTBUNDABERGMARYBOROUGH/HERVEYBAYNSWMIRIAMVALE/AGNESWATERNORTHQLDINLANDSTHQLD
0.0% 1.0% 2.0% 3.0% 4.0% 5.0% 6.0% 7.0%
0100200300400500600700800
FISH
TAG
GED
BOYNETANNUMHOOKUPFISHTAGGEDANDRECAPTURERATE
TAGGED %RECAPTURED

13
Since 2000 there has been a live weigh-in section managed by the Gladstone SportfishingClub. From2008-2017thenumberoffishtaggedrangedfromalowof235in2009toahighof672in2017.Figure12showsthenumberoffishtaggedeachyearandtherecapturerateforfishtaggedineachyear.Theaveragerecapturerateto2016was5.0%andrangedfromalowof3.6%in2010toahighof6.3%in2014.Therecaptureratesforthelastfewyearswillcontinuetoincreaseasmorerecapturesaremade.
Figure13:Speciestaggedandrecapturerates2008-2017
Figure 13 shows the number of fish tagged from 2008-2017 for each key species and therecapturerate.ThemosttaggedspecieswasYellowfinBreamat1,937fishwitharecapturerate of 2.6%. The highest recapture rate was for Pikey Bream at 7.3%. These rates willchangeasmorefisharerecapturefromrecentyear’sfish.
Figure14:YellowfinBreamtaggedandrecapturerates2008-2017
0.01.02.03.04.05.06.07.08.0
0
500
1000
1500
2000
2500
YellowfinBream
DuskyFlathead
PikeyBream BarredJavelin
MangroveJack
Otherspecies
PERCENTAGERECAPTURED
TAGGED
BOYNETANNUMHOOKUPSPECIESTAGGEDANDRECAPTURERATES
TAGGED2008-2017 %RECAPTURED
0.0
2.0
4.0
6.0
0
200
400
600
2008 2009 2010 2011 2012 2013 2014 2015 2016 2017
PERCENTAGER
ECAPTURED
FIS
HT
AGGED
YELLOWFINBREAM
TAGGEDANDRECAPTURERATES
YellowfinBream YellowfinBreamrecaptures
Linear (YellowfinBream) Linear (YellowfinBreamrecaptures)

14
Figure14 shows thenumberofYellowfinBreamtaggedeachyearand the recapture rate.Themostfishweretaggedin2017at452.Thehighestrecaptureratewas in2016at4.9%whileitwaslowestin2013at1.1%.Ratesfromtagginginrecentyearswillcontinuetorise.DISTANCEMOVEDANDDAYSOUT Since2000alltaggedfishwerereleasedattheBrayParkboatrampatSuntagmapgridBRGM24. Since 2008 there were a total of 157 recaptures where there was sufficient data todeterminedistancemoved.Figure15showsthedistancemovedcomparedtodaysout.Oftherecaptures97.9%wererecapturedwithin20kmof thereleasepointwhile57.9%wererecapturedwithin2km.ThegreaterdistancemovedwasbyaPikeyBreamtaggedin2015.Thefishmoved32kmin109 days and was recaptured in the Calliope River. A Barred Javelin tagged in 2017 wasrecapturedintheCalliopeRiver13dayslaterhavingmoved23km.Oftherecaptures76.7%weremadeinlessthan6months(183days).ThelongesttimeoutwasaGoldenSnappertaggedin2013andrecaptured571dayslater(1.6years)inGladstoneHarbour.
Figure15:Distancemovedcomparedwithdaysout
BREAMSIZESFROMTAGGING2017 Only legal size Bream could be live weighed and tagged. There were452 Yellowfin Breamand87PikeyBreamthatweretaggedandmeasured.Figure16showsthepercentageoffishineach20mmsizerange(totallength)from240:259–380:399mm.For Yellowfin Bream the greatest percentage (25.9%) of fish were in the size range280:299mmwhileforPikeyBreamthegreatestpercentage(31.0%)offishwereinthesizerange260:279mm.ThelongestYellowfinBreamwas390mmwhilethelongestPikeyBreamtaggedwas360mm.
0
5
10
15
20
25
30
35
0 182.5 365 547.5 730
DISTAN
CEM
OVE
D
DAYSOUT(6MONTHS)
DISTANCEMOVED

15
Figure16:SizerangeofBreamintheBTHU2017
DUSKYFLATHEADSIZESFROMTAGGING2017 OnlylegalDuskyFlatheadwereabletobeliveweighedandtagged.Therewere50fishthatweretaggedandmeasured.Figure17showsthepercentageoffishineach50mmsizerange(totallength)from400:449–700:749mm.For Dusky Flathead the greatest percentage (34.0%) of fish were in the size range450:499mmandthelargestfishwas730mmandwasbelowthemaximumlegalsize.
Figure17:SizerangeofDuskyFlatheadintheBTHU2017
0
5
10
15
20
25
30
35
240:259 260:279 280:299 300:319 320:339 340:359 360:379 380:399
PERCEN
TAGE
BOYNETANNUMHOOKUPSIZERANGEOFBREAM
YELLOWFINBREAM PIKEYBREAM
0
5
10
15
20
25
30
35
40
400:449 450:499 500:549 550:599 600:649 650:699 700:749
PERCEN
TAGE
DUSKYFLATHEADSIZERANGE
16
DISCUSSIONAsthereisnolongeranyregularmonitoringofrecreationalfishingintheGladstoneareatheBTHU provides an important annual snapshot of the recreational fishery in the Gladstonearea. The catch and effort data over the past 10 years allows an assessment of trends incatch rates. Catch rates for fish caught and for Bream caught are both trending upwardsoverthattimewhilethecatchrateforfishkepthastrendeddownwards.ThissuggeststhatfishersintheBTHUarekeepingfewerfish.Thismaybeareflectionof fewer legal fishbutbasedonconversationswith fishersduringboat ramp surveys it suggests that more fishers are releasing legal sized fish. This issupportedbyhaving539legalBreambroughttotheliveweigh-inthisyearwhilejust5.8%(58of999)ofBreamcaughtwerekeptfromthetripsurveys.Therehasbeenanincreaseinthenumbersoffishbroughttotheliveweigh-inandtaggedinthepast3years,withalargeincreaseinYellowfinBreamin2015and2017.Alongwiththedownward trend in fish kept it suggests a shift in fisher behavior in the BTHU away fromkeepingfishtoliveweigh-in.MostofthefishersthatundertookestuaryfishingtripswerefromBoyneIslandandTannumSandswith 40.9%of tripsand fromGladstoneand surroundswas 69.6%.TheBoyneRiverand South Trees Inlet were the most fished locations at 60.1%. This suggests that mostfisherswerelocalandconcentratedtheireffortsonthelocalwaterwaysincloseproximitytotheBrayParkheadquarters.


