
Malaysian International Conference on Trends in Bioprocess Engineering (MICOTriBE) 2012
BSE-502-1
BSE-502: A STUDY ON THE EFFECTIVENESS OF BIOFILTER BASED ON
EFFECTIVE MICROORGANISM (EM) AND EMPTY FRUIT BUNCH (EFB)
FOR WATER QUALITY IMPROVEMENT: AN APPLICATION IN OPEN
CHANNEL SYSTEM
Noor Suraya Romali1,*
, Aimi Ilmar Ramli2, Nadiah Mokhtar
1, Siti Fatimah Che Osmi
1, Afiq
Aiman Mohamad Razak1, Mohd Aiman Mohd Ali
1, and Muhammad Iskandar
1
1Faculty of Civil Engineering and Earth Resources, Universiti Malaysia Pahang, Lebuhraya Tun Razak, 26300,
Kuantan, Pahang; *[email protected]
2Central Laboratory, Universiti Malaysia Pahang, Lebuhraya Tun Razak, 26300, Kuantan , Pahang.
Nowadays, clean water resources are reduced due to water pollution problems. The discharge of
solid waste and domestic wastewater into the open channel system leads to the surface water
problem. This study emphasizes on the utilization of a biofilter system to treat the domestic water
before being discharge into river to preserve the sustainability of water bodies. This biofilter is
based on the concept of biological treatment involves the use of Effective Microorganism (EM)
Mudball and Empty Fruit Bunch (EFB) with other natural occurring materials such as sand &
gravel and activated carbon. This compartmentalized system also contains sponge and charcoal. The
biofilter is design to be placed in an open drainage system in a residential area where the flow is
continuous. Experiment was conducted at Student Residential College (KK3), Universiti Malaysia
Pahang where a site scale filtering system was set up to observe the potential of the system in
removing pollutants. The experiments were conducted using three increasing quantity variables.
The results were analyzed by evaluating the water quality parameters SS, COD, BOD, AN and
turbidity in term of their percentages of removal and comparison to Standard A and Standard B of
Environmental Quality Act (1974). The results indicated that the biofilter system is most effective
in improving the concentration of turbidity and suspended solid where the percentages of removal is
as high as 72.42% and 67.31% respectively, followed by COD with 51.63% removal. The
performance of the biofilter is also increased with the increasing quantity of filtering media used.
Keywords: Continuous flow, Domestic wastewater, Effective microorganism, Empty fruit bunch,
Mudball
INTRODUCTION
Water is an essential and irreplaceable element to ensuring the continuance of life. The demand of
clean water increases as population grows. Water pollution is a major problem in the global context. It has
been suggested that it is the leading worldwide cause of deaths and diseases and that it accounts for the
deaths of more than 14,000 people daily [1]. Domestic waste water is one type of point source pollution
instead of a factory or city storm drain. Conventional wastewater treatment method maybe used to remove unwanted nutrient and dissolved
heavy metal ions from wastewaters. Other method that was available but costly is chemical oxidation and
reduction, ion exchange, electrochemical and treatment. However, these high-technology processes have
significant disadvantages, including incomplete metal removal, requirements, such as expensive equipment
and monitoring systems, high reagent, energy and generation of toxic sludge or other waste products that
require disposal [2]. In the other hand, implementing a centralized waste water treatment system would be
costly due to construction and maintenance. Considerately, biological method is considered as an economical
solution in terms of construction, operation, maintenance, and pollution.

Malaysian International Conference on Trends in Bioprocess Engineering (MICOTriBE) 2012
BSE-502-2
Biofilter studies and research are increasingly popular nowadays as the world is moving
environmentally sustainable development technologies. Ling et al. [3] have constructed a pilot scale biofilter
for treatment of greywater. The biofilter “EcoSan” was implemented at Hui Sing Garden, a residential area
located 4.5km from downtown Kuching City. Prior to the implementation of EcoSan, black water from the
toilets was partially treated in the septic tanks and the outflow was discharged into the storm drains. Studies
on the application of biofilter in the treatment of wastewater had been conducted by the researchers from the
Faculty of Civil Engineering, Universiti Teknologi Malaysia. The significant of this study is to determine the
efficiency of biofilter application for water quality improvement [4]. This study discovered that the
wastewater treatment using Biological Active Filter (BAF) indicated a significant improvement in water
quality parameter tested. BAF was capable of removing COD, TSS, turbidity and nutrients such as nitrate,
phosphate and sulphate from the studied area.
The focus of this study is to cater the domestic waste water problem. Domestic wastewater is produced
from kitchens, bathrooms and laundries in residential homes and from various commercial and industrial
sources. Nowadays, the effluent from domestic wastewater is highly untreated. Hence, when the effluents
flow to the river it will cause water pollution and will affect water quality of the river. Hence, the aim of the
study is to improve the water quality at point source before discharge into river. The biofilter is design in
horizontal to be installed at drainage system for continuous flow application.
Biofilters has the prospect of an environmental friendly system but most of them are lack of the
capability to be executed at site as the biofilter consist of delicate filtering material that cannot hold up to
actual environment force. For this reason, the better design, selection of filtering material and proportion of
each material is the design focus of proposed biofilter. The purposes of this study are to determine the design
criteria and to evaluate the performance of the biofilter system as a wastewater treatment device. Three
different quantity variables were used to investigate the effect of using different quantity of filtering media to
the performance of the biofilter system.
MATERIALS AND METHODS
Location of study
The study was conducted at an open drainage system located at student residential college (KK3),
Universiti Malaysia Pahang (UMP). The catchment area consists of a cafeteria and hostel that produces
domestic effluent that discharged into Sungai Belat as shown in Plate 1.
Plate 1 Location of study
Biofilter
system
Main Entrance
KK3
Malaysian International Conference on Trends in Bioprocess Engineering (MICOTriBE) 2012
BSE-502-3
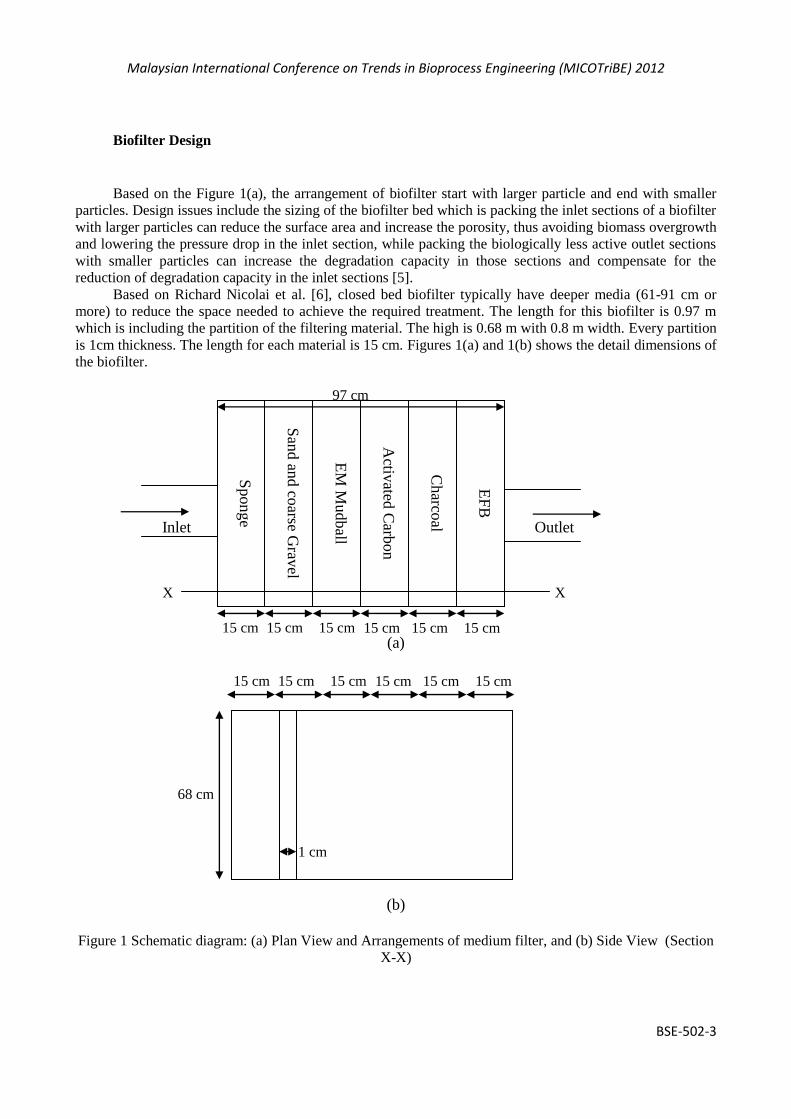
Biofilter Design
Based on the Figure 1(a), the arrangement of biofilter start with larger particle and end with smaller
particles. Design issues include the sizing of the biofilter bed which is packing the inlet sections of a biofilter
with larger particles can reduce the surface area and increase the porosity, thus avoiding biomass overgrowth
and lowering the pressure drop in the inlet section, while packing the biologically less active outlet sections
with smaller particles can increase the degradation capacity in those sections and compensate for the
reduction of degradation capacity in the inlet sections [5].
Based on Richard Nicolai et al. [6], closed bed biofilter typically have deeper media (61-91 cm or
more) to reduce the space needed to achieve the required treatment. The length for this biofilter is 0.97 m
which is including the partition of the filtering material. The high is 0.68 m with 0.8 m width. Every partition
is 1cm thickness. The length for each material is 15 cm. Figures 1(a) and 1(b) shows the detail dimensions of
the biofilter.
Inlet Outlet
X
(a)
(b)
Figure 1 Schematic diagram: (a) Plan View and Arrangements of medium filter, and (b) Side View (Section
X-X)
Sponge
San
d an
d co
arse Grav
el
EM
Mudball
Charco
al
A
ctivated
Carb
on
EF
B
97 cm
X X
15 cm 15 cm 15 cm 15 cm 15 cm 15 cm
15 cm 15 cm 15 cm 15 cm 15 cm 15 cm
68 cm
1 cm

Malaysian International Conference on Trends in Bioprocess Engineering (MICOTriBE) 2012
BSE-502-4
Filtering Media
The main media in the biofilter system are EM (effective microorganism) Mudball and Empty Fruit
Bunch (EFB). The other filter media used are sponge, sand and gravel, activated carbon and charcoal.
Sponge is functioned to adsorb oil pollutant. The oil will adsorb onto its surface during the treatment. Sand
and gravel are used in the system to provide maximum turbidity entrapment. Activated carbon is capable to
remove Chemical Oxygen Demand (COD) and suspended solid [7] while charcoal is used to remove odor.
The arrangement of the filtering media is illustrated in Figure 1(a) where the treatment starts with sponge,
then followed with sand and gravel, EM Mudball, activated carbon, charcoal and EFB.
1. EM Mudball. Effective microorganism contains selected species of microorganisms including
predominant populations of lactic acid bacteria and yeasts and smaller numbers of photosynthetic bacteria,
actinomycetes and other types of organisms. All of these are mutually compatible with one another and can
coexist in liquid culture. Organic materials within wastewater originate from plants, animals or synthetic
organic compound, and enter wastewater via a number of routes including human waste, detergents, and
industrial sources [8]. EM can be used to solve this problem as it contains various organic acids due to the
presence of lactic acid bacteria, which secrete organics acids, enzymes, antioxidants, and metallic chelates
[9]. E.M decompose organic matter by converting it to carbon dioxide (CO2) and methane (CH4) or use it for
growth and reproduction through the mechanism shown in Eq. (1):
3224 0 NHHCOCHNOHCNOHC zyxwdcba (1)
The mud balls used in this study are produced from EM liquid, food waste and clay soil (content ratio
3 litre, 1 kilo and 2 kilo). The final product of mudball is shown in Plate 2.
2. Empty Fruit Bunch (EFB). Oil palm fibres belong to the group of lignoselulosik material, which
contain components polimerik as hemiselulosa (20-21%), cellulose (35-40%) and lignin (17-21%), which
can be processed to be converted to carbon products through carbonization process. The fibres are suitable as
agents for water filtration. EFB is function to removing suspended solid matter contained in water. This EFB
will absorb onto its surface during the treatment. The EFB used in this study is shown in Plate 3.
Experimental Set-up and Flow Mechanism
Plate 4 shows the biofilter setup at site. The biofilter have six compartments and each compartment is
filled with filtering material. The biofilter is installed at the sump before the wastewater goes into the river.
The biofilter design used the basic concept of water filter where it uses a closed system. Water intake will
first run through sponge which filters large materials, then filtered with Empty Fruit Bunch (EFB), followed
by mud ball, then chemical reactions by activated carbon, further filtered subsequently by coarse gravel and
sand, and lastly run through charcoal to eliminate odor before output to water body.
Plate 2 EM Mudball Plate 3 Empty Fruit Bunch
Malaysian International Conference on Trends in Bioprocess Engineering (MICOTriBE) 2012
BSE-502-5
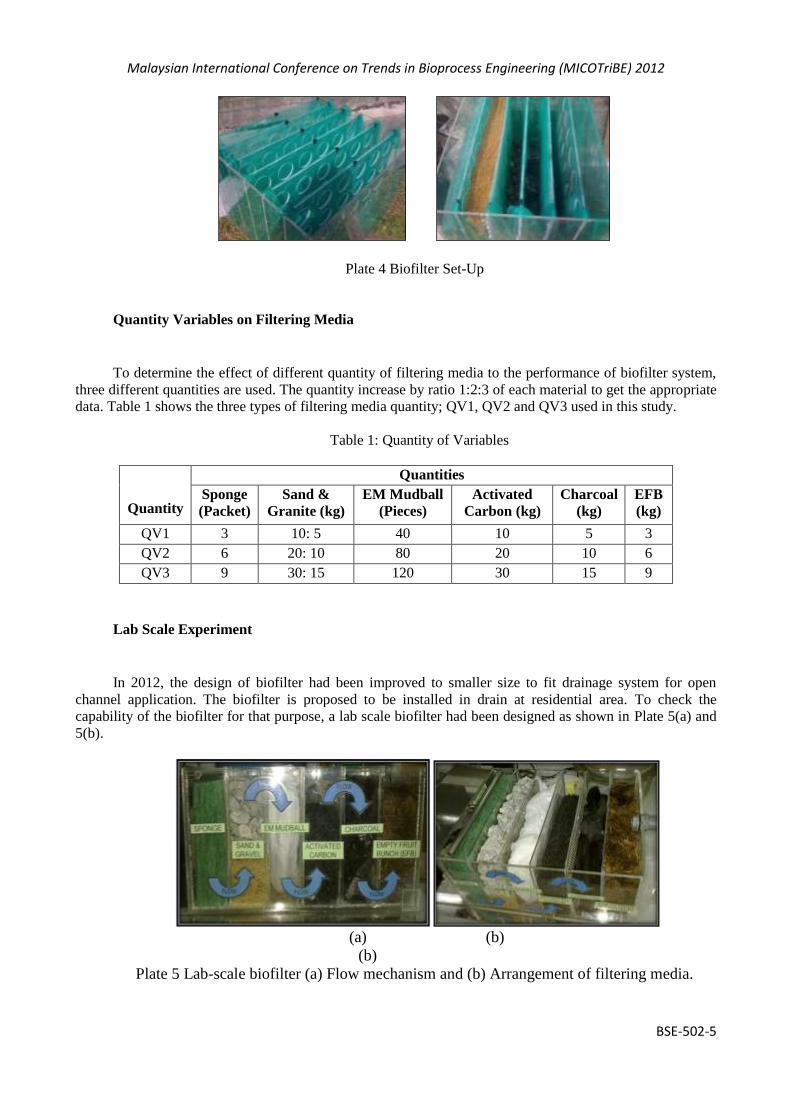
Plate 4 Biofilter Set-Up
Quantity Variables on Filtering Media
To determine the effect of different quantity of filtering media to the performance of biofilter system,
three different quantities are used. The quantity increase by ratio 1:2:3 of each material to get the appropriate
data. Table 1 shows the three types of filtering media quantity; QV1, QV2 and QV3 used in this study.
Table 1: Quantity of Variables
Quantity
Quantities
Sponge
(Packet)
Sand &
Granite (kg)
EM Mudball
(Pieces)
Activated
Carbon (kg)
Charcoal
(kg)
EFB
(kg)
QV1 3 10: 5 40 10 5 3
QV2 6 20: 10 80 20 10 6
QV3 9 30: 15 120 30 15 9
Lab Scale Experiment
In 2012, the design of biofilter had been improved to smaller size to fit drainage system for open
channel application. The biofilter is proposed to be installed in drain at residential area. To check the
capability of the biofilter for that purpose, a lab scale biofilter had been designed as shown in Plate 5(a) and
5(b).
(a) (b)
(b)
Plate 5 Lab-scale biofilter (a) Flow mechanism and (b) Arrangement of filtering media.

Malaysian International Conference on Trends in Bioprocess Engineering (MICOTriBE) 2012
BSE-502-6
RESULTS AND DISCUSSION
The performance of the biofilter system is evaluated in terms of water quality improvement,
comparison with Standard A and Standard B of Environmental Quality Act (1974) and removal efficiency.
Experiment has been started on 4th October 2010, evaluated five parameters; Suspended Solid (SS),
Chemical Oxygen Demand (COD), Biochemical Oxygen Demand (BOD), Ammoniacal Nitrogen (AN) and
turbidity. The result in Figure 2 shows that the concentration of SS decreased from 88 mg/L to 73 mg/L after
the treatment with 17% improvement. The high concentration of COD enters the biofilter (1023 mg/L)
managed to be improved to 495 mg/L i.e. 52% of removal. However, no improvement recorded for BOD
while AN shows 29% improvement in quality of water from 0.42 mg/L to 0.3 mg/L. Turbidity shows a great
performance with 72% of removal where the concentration decreased from 97.17 NTU to 26.8 NTU.
Figure 2: Water Quality Results for Event 1
Data collection on 4th October 2010 will refer to as Event 1 in the next section. Another four data
collection taken from 6th October to 14
th October 2010 is Event2, Event 3, Event 4 and Event 5 respectively.
Each experiment was repeated with different quantities of filtering media as shown in Table 1. The system
flows continuously during the data collection, hence the influent for each event is difference depending on
the domestic waste generated on that day (event).
Water Quality Improvement and Comparison with Standard A and Standard B of
Environmental Quality Act (1974)
Figure 3(a) to 3(e) are the water quality results for parameters SS, COD, BOD, AN and Turbidity.
Effluent 1, Effluent 2 and Effluent 3 refers to the concentration of parameters after treated using three types
of quantity variables QV1, QV2, and QV3 respectively.
The performance of biofilter in improving water quality can be observed by comparing the
concentration of SS at Influent and Effluent 1 where the treatment is done with initial quantity (QV1). Figure
3(a) shows the concentrations of SS improve at Effluent 1 for all the five events. The highest removal is
recorded at Event 4 where the concentration decreased from 156 mg/L to 51 mg/L. For quantity variables
evaluation, it can be seen from Figure 3(a) that the values of SS decrease from Effluent 1 to Effluent 2 and
decrease again at Effluent 3. There are three influent samples which are Event 3, Event 4, and Event 5 that
SS values exceed 100 mg/L which mean it not achieved standard B. However, the values of Effluent 2 are
fulfill Standard B after the treatment and all the Effluent 3 managed to comply Standard A. This result
88
1023
38.55 0.42 73
495
38.85 0.3 0
200
400
600
800
1000
SS COD BOD AN
Co
nce
ntr
atio
n (
mg/
L)
Water Quality Parameters
Influent
Effluent

Malaysian International Conference on Trends in Bioprocess Engineering (MICOTriBE) 2012
BSE-502-7
proved that the biofilter are capable to improve SS and the concentration of SS decreased with the increasing
quantity of filtering media applied.
Encouraging results of COD removal can be seen at Figure 3(b), where at Event 1, as high as 1023
mg/L Influent decrease to 495 mg/L after the treatment. The values decreased to 460 mg/L and 440 mg/L at
Effluent 2 and Effluent 3 respectively. The same trend of results can be observed at Event 2, Event 3, Event
4 and Event 5 respectively. Despite of that, all the effluents value of discharge water in term of COD
concentrations are high thus still not complying both Standard A and Standard B, EQA 1974. From Figure
3(b) we can observe that the concentration of COD enters the system is high, which is in the range 544.33
mg/L to 1022.67 mg/L.
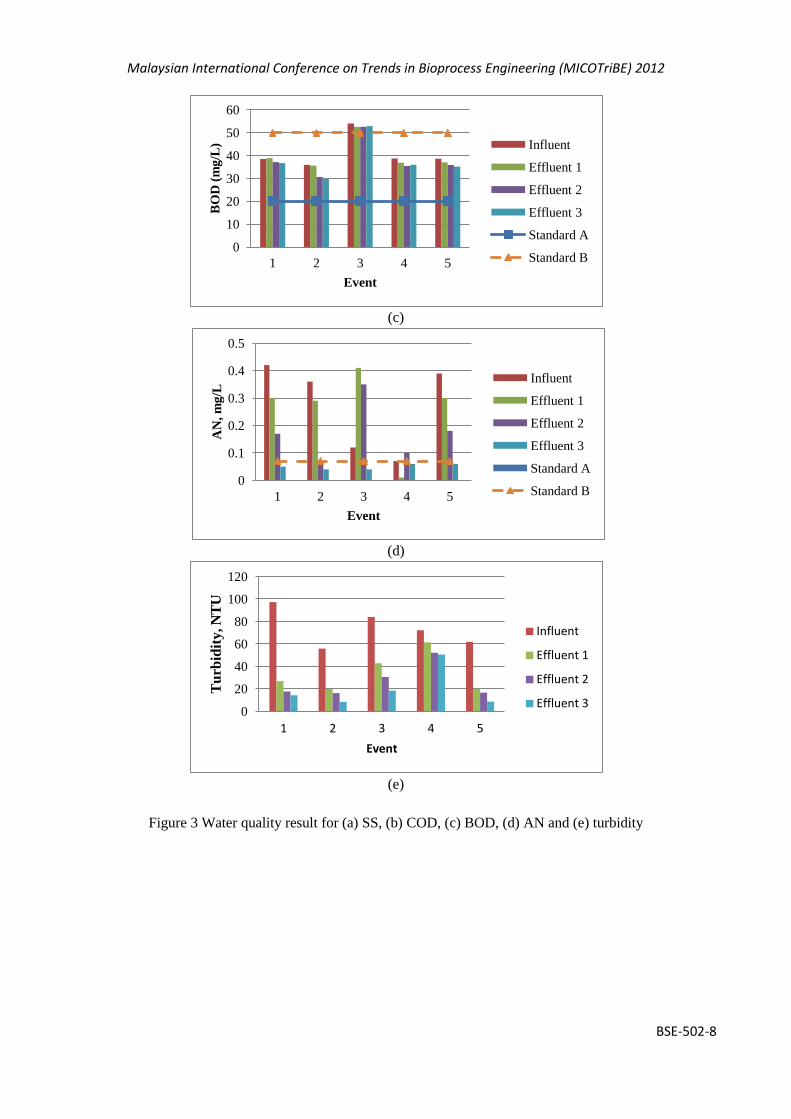
Figure 3(c) shows that the concentration of BOD decreases as the quantity of filtering media increase
for all five events. The concentration of BOD decreases from 35.95 mg/L to 35.60 mg/L at Effluent 1. The
BOD concentration continues to decrease at Effluent 2 and Effluent 3 to 30.65 mg/L and 29.85 mg/L
respectively. The slight improvement also can be observed at Event2, Event 3, Event 4 and Event 5. All the
effluent discharge complies Standard B except Event 3.
Results for parameter AN and turbidity are illustrated in Figure 3(d) and Figure 3(e) respectively.
Concentration of AN in effluent samples were improved in Event 1, Event 2 and Event 4. Only Effluent 3
fulfill Standard B. Effluent discharges for turbidity for all events were improved and the removal increase
with the increasing values of filtering media used.
(a)
(b)
0
20
40
60
80
100
120
140
160
1 2 3 4 5
SS
(m
g/L
)
Event
Influent
Effluent 1
Effluent 2
Effluent 3
Standard A
Standard B
0
200
400
600
800
1000
1 2 3 4 5
CO
D, m
g/L
Event
Influent
Effluent 1
Effluent 2
Effluent 3
Standard A
Standard B
Malaysian International Conference on Trends in Bioprocess Engineering (MICOTriBE) 2012
BSE-502-8
(c)
(d)
(e)
Figure 3 Water quality result for (a) SS, (b) COD, (c) BOD, (d) AN and (e) turbidity
0
10
20
30
40
50
60
1 2 3 4 5
BO
D (
mg
/L)
Event
Influent
Effluent 1
Effluent 2
Effluent 3
Standard A
Standard B
0
0.1
0.2
0.3
0.4
0.5
1 2 3 4 5
AN
, m
g/L
Event
Influent
Effluent 1
Effluent 2
Effluent 3
Standard A
Standard B
0
20
40
60
80
100
120
1 2 3 4 5
Tu
rbid
ity, N
TU
Event
Influent
Effluent 1
Effluent 2
Effluent 3

Malaysian International Conference on Trends in Bioprocess Engineering (MICOTriBE) 2012
BSE-502-9
(a) (b)
(c) (d)
(e)
Figure 4 Removal efficiency result for (a) SS, (b) COD, (c) BOD, (d) AN and (e) turbidity
Removal Efficiency
The biofilter system shows encouraging results in terms of removal efficiency for parameters SS,
COD, BOD, AN, and Turbidity as shown in Figure 4(a) to 4(e) respectively. The highest removal efficiency
for SS is achieved in Event 4 where the biofilter system managed to remove 67.31% of SS when QV1 is
used, as illustrated in Figure 4(a). The SS removal increase to 68.59% and 69.23% after treatment with QV2
and QV3 respectively. The removal efficiency increase as the increase value of filtering media applied for all
five events. The best fit result is at Event 5 where the R-squared value is 0.992.
R² = 0.6416 R² = 0.3342
R² = 0.9897
R² = 0.9643 R² = 0.9925
0
20
40
60
80
1 2 3
Pe
rce
nta
ges
of
Re
mo
val (
%)
Quantity Variables (QV)
SS
Event 1 Event 2 Event 3 Event 4 Event 5
R² = 0.9779
R² = 0.7532 R² = 0.8912 R² = 0.2584
R² = 0.9874
0
20
40
60
80
1 2 3 Pe
rce
nta
ges
of
Re
mo
val (
%)
Quantity Variables (QV)
COD
Event 1 Event 2 Event 3 Event 4 Event 5
R² = 0.907
R² = 0.8522
R² = 0.6463
R² = 0.4032 R² = 0.9811
0
5
10
15
20
1 2 3 Pe
rce
nta
ges
of
Re
mo
val (
%)
Quantity Variables (QV)
BOD
Event 1 Event 2 Event 3 Event 4 Event 5
R² = 0.9995
R² = 0.8385
R² = 0.75
R² = 0.6048
R² = 1
0
20
40
60
80
100
120
1 2 3 Pe
rce
nta
ges
of
Re
mo
val (
%)
Quantity Variables (QV)
AN
Event 1 Event 2 Event 3 Event 4 Event 5
R² = 0.9248 R² = 0.9588
R² = 1
R² = 0.8624
R² = 0.9534
0
20
40
60
80
100
1 2 3 Pe
rce
nta
ges
of
Re
mo
val (
%)
Quantity Variables (QV)
Turbidity
Event 1 Event 2 Event 3 Event 4 Event 5
Malaysian International Conference on Trends in Bioprocess Engineering (MICOTriBE) 2012
BSE-502-10
The highest percentage of removal for COD is at Event 1 with 51.63% of removal obtained with QV1,
then increase to 55.02% and 57.01% at QV2 and QV3 respectively (Figure 4(b)). A poor performance is
detected for parameter BOD where the removal efficiency is the range 0.97% to 4.90% only after treatment
with quantity of filtering media QV1. However, the performance of BOD removal increase as the quantity of
filtering media increased, as shown in Figure 4(c). The R-squared is more than 0.50 for all events except in
Event 4 for both parameters COD and BOD.
The removal efficiency for AN range from 19.44% to 85.71% with QV1. However, no improvement
shown in Event 3 and the percentages of removal decrease with increasing quantity variables in Event 4.
The performance of the biofilter system in improving the turbidity of domestic water is excellent
where the removal efficiency range from 15.09% to 72.42% after treatment with initial quantity variable
(RV1). The percentages increased up to 85% when the quantity of filtering media increased in Event 1.
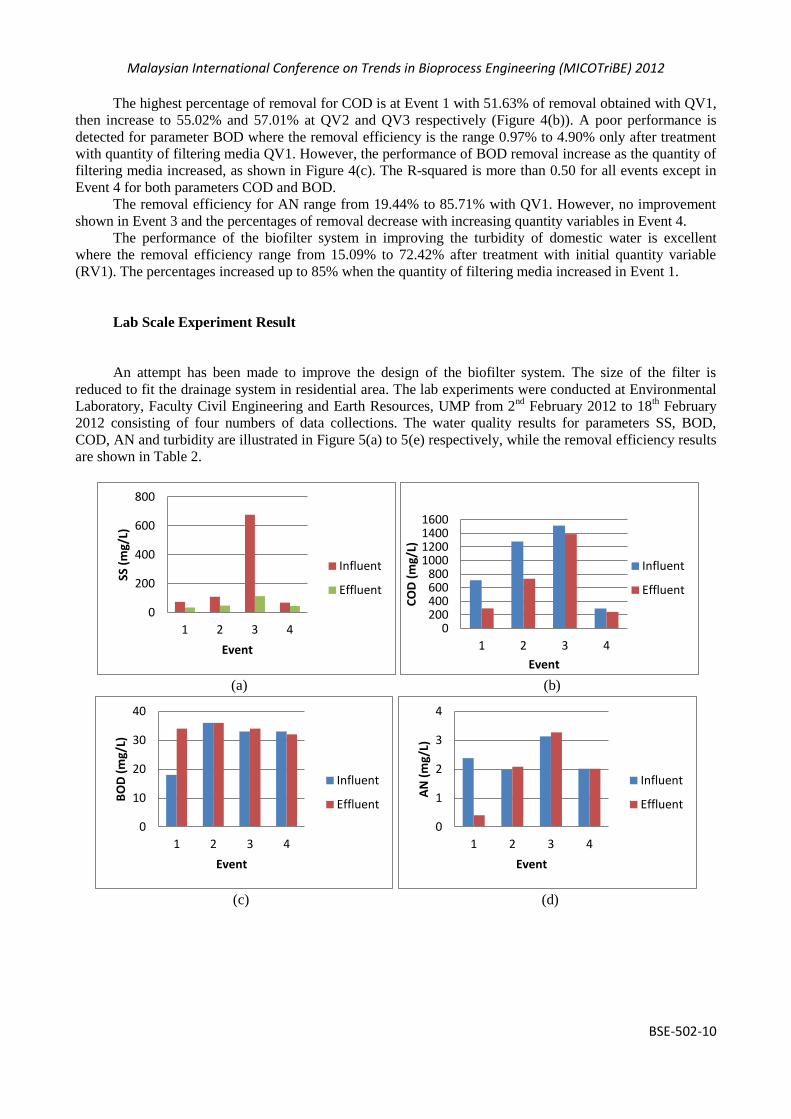
Lab Scale Experiment Result
An attempt has been made to improve the design of the biofilter system. The size of the filter is
reduced to fit the drainage system in residential area. The lab experiments were conducted at Environmental
Laboratory, Faculty Civil Engineering and Earth Resources, UMP from 2nd
February 2012 to 18th February
2012 consisting of four numbers of data collections. The water quality results for parameters SS, BOD,
COD, AN and turbidity are illustrated in Figure 5(a) to 5(e) respectively, while the removal efficiency results
are shown in Table 2.
(a) (b)
(c) (d)
0
200
400
600
800
1 2 3 4
SS (
mg/
L)
Event
Influent
Effluent
0 200 400 600 800
1000 1200 1400 1600
1 2 3 4
CO
D (
mg/
L)
Event
Influent
Effluent
0
10
20
30
40
1 2 3 4
BO
D (
mg/
L)
Event
Influent
Effluent
0
1
2
3
4
1 2 3 4
AN
(m
g/L)
Event
Influent
Effluent

Malaysian International Conference on Trends in Bioprocess Engineering (MICOTriBE) 2012
BSE-502-11
(e)
Figure 5: Water quality result for (a) SS, (b) COD, (c) BOD, (d) AN and (e) turbidity
The water quality improvement can be seen at Figure 5(a), 5(b) and 5(e) for parameter SS, COD, and
turbidity respectively. The concentration of BOD increased at Event 1 and Event 3, as shown in Figure 5(c).
Same trend of result can be observed for AN where only Event 1 shows an improvement. As can be observed
at Table 2, the removal efficiency for SS and COD is in the range 33.8% to 52.7% and 8.4% to 58.2%
respectively. Turbidity of domestic water also improved by 7.1% to 26%. However, no percentages of
removal recorded for BOD and AN.
Table 2: Removal Efficiency
Event Percentages of Removal (%)
BOD COD SS An Turbidity
1 - 58.2 52.7 83.2 10.0
2 - 42.8 56.9 - 26.0
3 - 8.4 83.2 - -
4 3.0 16.7 33.8 - 7.1
CONCLUSIONS
The site scale biofilter system is found to be effective in improving water quality where for overall the
concentration of parameters SS, COD, BOD, AN and turbidity decreased after the treatment. The biofilter is
most capable in improving SS and turbidity where the highest removal efficiency achieved is as high as
67.31% and 72.42% respectively. The percentages of removal for COD are in the range 4.7% to 51.63%.
Poor performance were shown in AN and BOD improvement. The average removal efficiency recorded for
the five events is only 3.7% and 2.4% for AN and BOD respectively.
The performance of biofilter increased with the increase quantity of filtering media used. In Event 1,
the removal efficiency of turbidity increased by 34.7% from 26.8 mg/L to 17.51 mg/L when the quantity of
filtering media is increased. The concentration improved to 14.36 mg/L with another increment of filtering
media. The same trend of increasing performance can be observed at other parameters SS, COD, BOD and
AN in all five events. In terms of comparison with Standard A and B of Environmental Quality Act (1974),
all Effluent 1 are not complying Standard A and only concentration of SS is below Standard B. However,
when the quantity of filtering media used is increased, the concentration of SS at Effluent 3 managed to
comply Standard A and B.
Instead of encouraging results shown by the site scale biofilter, more efforts and further research has to
be applied to improve the performance of lab scale biofilter. The experiment found that the lab scale biofilter
only manage to improve SS, COD and turbidity with highest removal efficiency recorded is 83.2%, 58.2%
and 26% respectively.
0
20
40
60
80
100
120
1 2 3 4
Turb
idit
y (F
AU
) Event
Influent
Effluent

Malaysian International Conference on Trends in Bioprocess Engineering (MICOTriBE) 2012
BSE-502-12
REFERENCES
[1] West, L. (2006). World Water Day: A Billion People Worldwide Lack Safe Drinking Water.
http://environment.about.com/od/environmentalevents/a/waterdayqa.htm
[2] CWA (Clean Water Act). (1987). Water Pollution Prevention and Control. United States Ministry of
Environment.
[3] Ling T.Y, Apun K., and Siti-Rubiah Zainuddin, (2009). Performance of a Pilot-Scale Biofilters and
Constructed Wetland with Ornamental Plants in Greywater Treatment. Universiti Malaysia Sarawak:
Faculty of Resource Science and Technology.
[4] Norhan, A.R., Noraliani, A., Siti Rabeah, O., and Noor Suraya, R. (2008). Biofilter Application for
Surface Runoff System. International Conference on Civil Engineering, 12-14 May 2008, Hyatt
Regency Kuantan Resort, Pahang.
[5] Yang Y, and Allen E.R. (1994) Biofiltration control of hydrogen sulphide. 1. Design and operational
parameters. J Air waste Manage Assoc 44:863-868.
[6] Nicolai, R. E., Schmidt David and Kevin A. Janni. (1997). Biofilter Design Information. Published:
December 12, 2006.
[7] Meng, Z. and Lianqing, Y. (2010). Treatment of Phenol-containing Wastewater with Specially-made
Activated Carbon. Youth Science and Technology Fund of China Electric Power Research Institute
(FT84-09-002).
[8] Taylor, C., Yahner, J., Jones, D. & Dunn, A. 1997, ‘Wastewater’ in Pipeline, 8 (4).
[9] Higa, T. and Chinen, N. (1998). EM Treatments of Odor, Waste Water, and Environmental Problems.
College of Agriculture, University of Ryukyus, Okinawa, Japan.
Acknowledgement
The author appreciates all the helps obtained from everyone involved directly or indirectly, especially
for all research team members. The author also wishes to thank Universiti Malaysia Pahang for provision of
research grant.


