
Broad context…
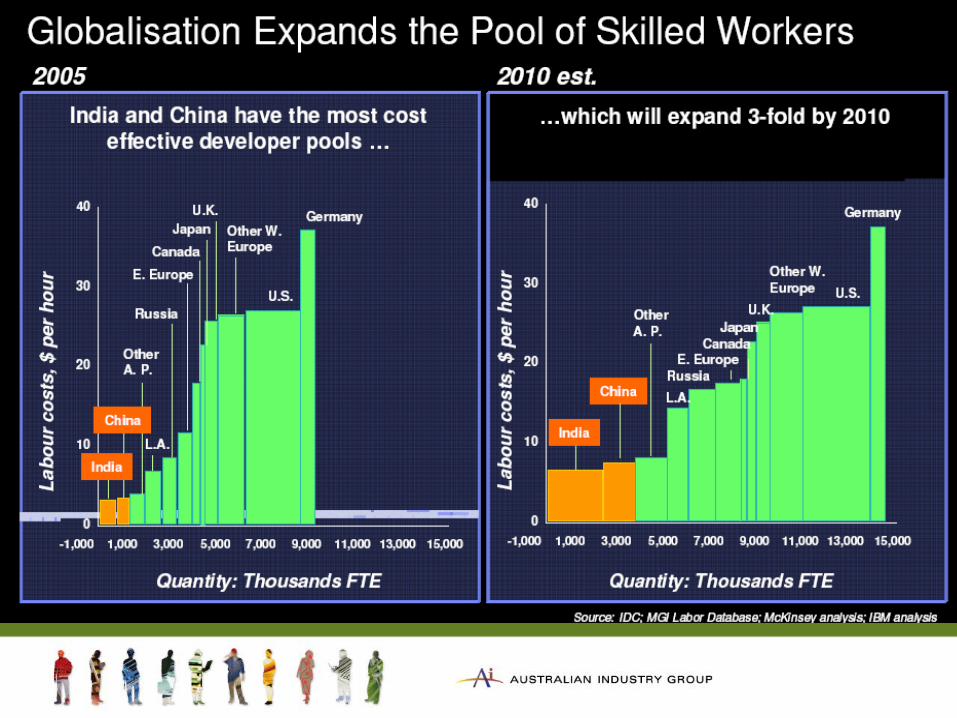
• Increasing integration of world’s economies resulting in changes in competitiveness
• Emergence of BRIC economies• Accelerating technological innovation• Increased pressure to improve environmental
outcomes and more sustainable resource use• Ageing population
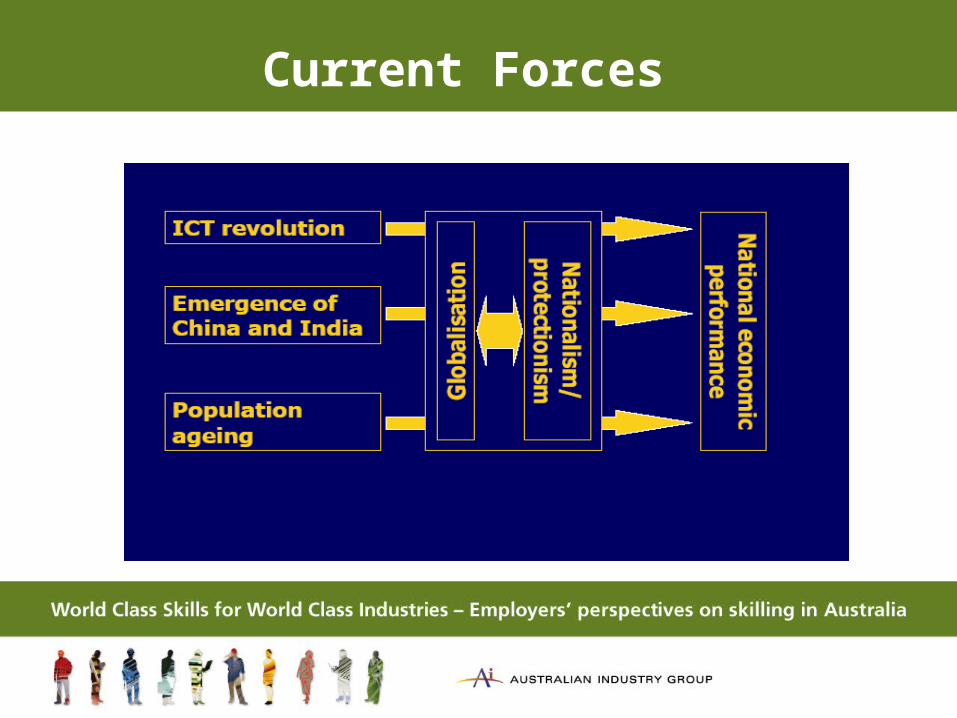
Current Forces

The World Class Skills for World Class Industries Report….
• Analyses the perspectives of employers on the current state of skilling in Australia
• Develops an understanding of future skilling needs
• Provides a set of strategic policies to impact on skilling

The centrality of skills …
The Report highlights that skills are seen as integral to competitiveness.
There are three main implications for skilling:the need for higher level skillsthe need for a broader range of skillsskills need to be updated more often
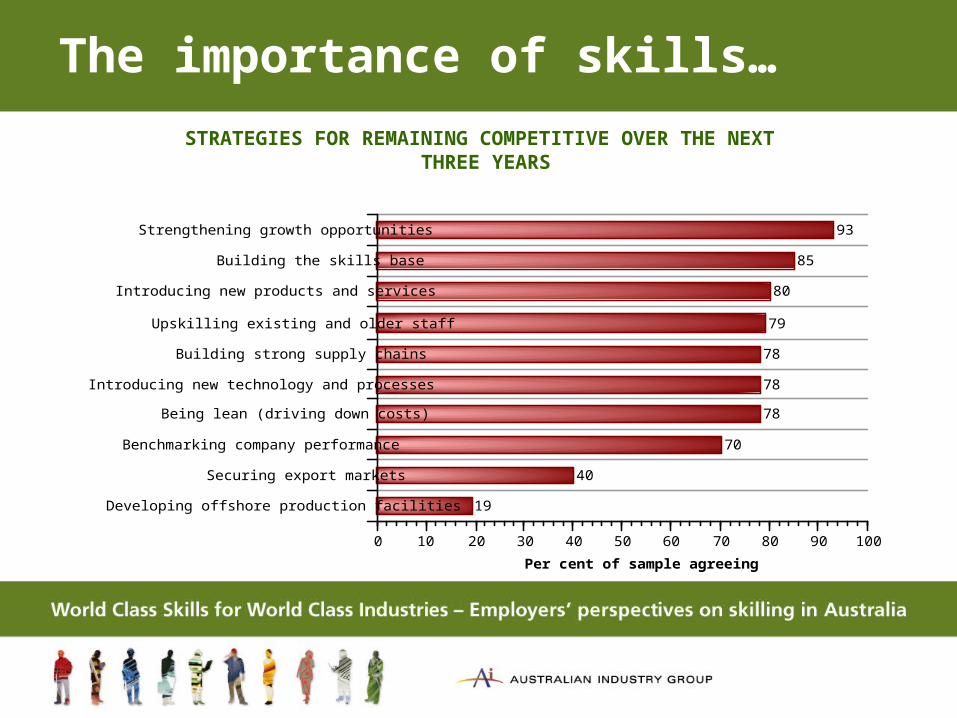
The importance of skills…
STRATEGIES FOR REMAINING COMPETITIVE OVER THE NEXT THREE YEARS
Developing offshore production facilities
Securing export markets
Benchmarking company performance
Being lean (driving down costs)
Introducing new technology and processes
Building strong supply chains
Upskilling existing and older staff
Introducing new products and services
Building the skills base
Strengthening growth opportunities
0 10 20 30 40 50 60 70 80 90 100
Per cent of sample agreeing
93
85
80
79
78
78
78
70
40
19

What do firms look for in their employees….
IT proficient
Comparable with the bestin the world
Have formal qualifications
Committed to the company
Multi-skilled
Appropriately experienced
Good communicators
Committed to excellence
Technically competent
Team workers
Willing to learn on the job
Flexible and adaptive
30 40 50 60 70 80 90 100Per cent of sample
9596
9595
9496
9494
9395
8892
8788
8692
8490
5662
5567
3655
Now In 3 years

Skill shortages a major threat to competitiveness …
BARRIERS TO COMPANY SUCCESS OVER THE NEXT THREE YEARS
Inability to secure exportmarkets
Poor innovation culture
Inability to retain skilledstaff
Insufficient domesticmarket growth
Insufficient labour flexibility
Competition from domesticproducers
Competition from lowcost countries
High cost of skilled labour
Inabilty to secure skilled staff
0 10 20 30 40 50 60 70 80
Percent of sample agreeing
74
70
63
59
57
47
46
23
20

Skills in demand: where the skills shortages are…
DIFFICULTIES SECURING SKILLS (BY TYPE OF EMPLOYEE) IN THE LAST 12 MONTHS
IT professionals
Clerical and administrators
Other professionals
Labourers and process workersManagers
Apprentices and trainees
Engineering professionals
Technicians and paraprofessionals
Trades
0 10 20 30 40 50 60 70Per cent of sample agreeing
64
48
46
36
3635
26
19
15

Impact of skill shortages
IMPACT OF SKILL SHORTAGES ON BUSINESS
Lost contracts
Work needs to be outsourced
Damage to the industry overall
Reduced staff morale
Production delays
Reduced productivity
Added costs to production
Higher overtime levels
0 10 20 30 40 50 60 70 80Per cent of sample agreeing
72
67
63
58
56
49
47
35
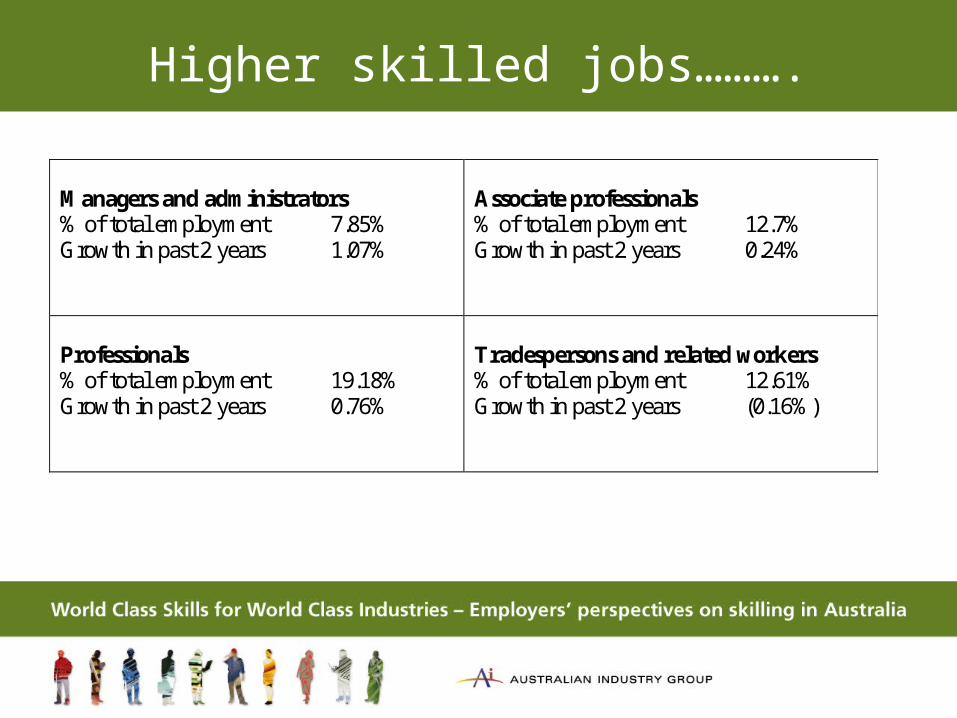
Higher skilled jobs……….
Managers and administrators % of total employment 7.85% Growth in past 2 years 1.07%
Associate professionals % of total employment 12.7% Growth in past 2 years 0.24%
Professionals % of total employment 19.18% Growth in past 2 years 0.76%
Tradespersons and related workers % of total employment 12.61% Growth in past 2 years (0.16%)

Lower skilled jobs……….
Advanced clerical, sales & service workers % of total employment 3.87% Growth in past 2 years (0.17%)
Intermediate production & transport workers % of total employment 8.48% Growth in past 2 years (0.22%)
Intermediate clerical, sales & service workers % of total employment 16.35% Growth in past 2 years (1.03%)
Elementary clerical, sales & service workers % of total employment 10.25% Growth in past 2 years (0.09%) Labourers and related workers % of total employment 8.7% Growth in past 2 years (0.16%)

Qualifications for jobs and the qualification profile…
Potential qualifications pathways for jobs % of employment
• Jobs that currently and potentially have a
university pathway 24.0• Jobs that currently and potentially have
a VET pathway 62.3• Jobs not requiring qualifications 13.7
Current qualifications profile of the population % of 15-64 pop.
• University qualifications 20.0• VET qualifications 29.9• No qualifications 50.1
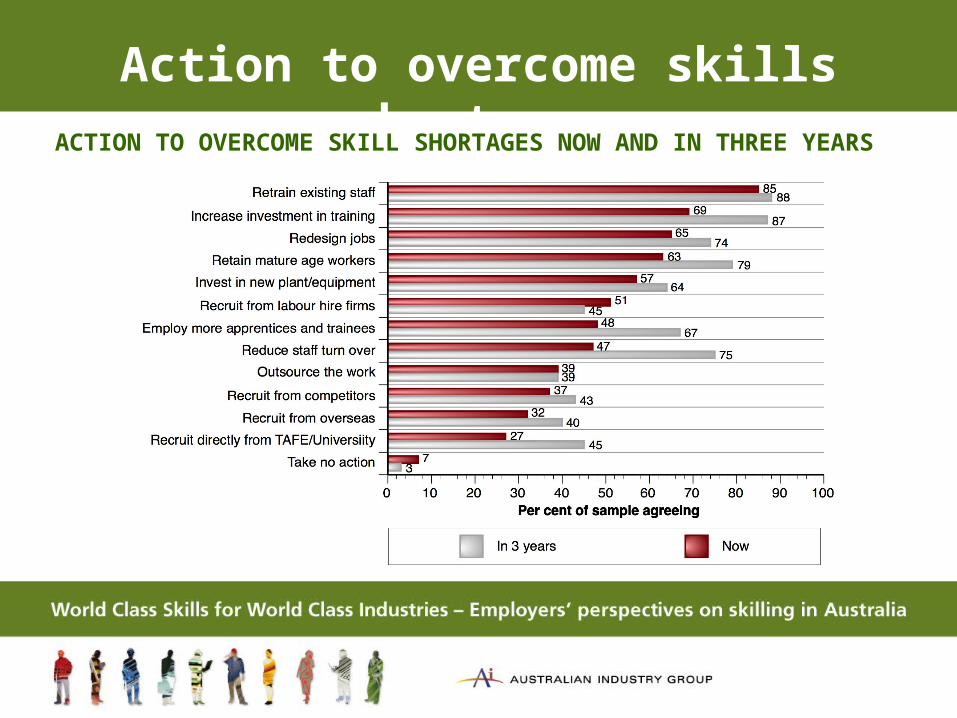
Action to overcome skills shortages
ACTION TO OVERCOME SKILL SHORTAGES NOW AND IN THREE YEARS

Employers signal a step-up in their efforts to meet skill needs …
FORMAL AND INFORMAL LEARNING, AUSTRALIAN COMPANIES, NOW AND IN THREE YEARS, PER CENT OF TURNOVER
Apprentices and trainees Other employees
0
1
2
3
4
5
2.9
43.5
4.7
Present
Future

New products & processes - Australian Companies 2005
NEW PRODUCTS AND PROCESSES, AUSTRALIAN COMPANIES, 2005
Per cent of annual turnover
Per cent of annual turnover derived from• New products & services (introduced in last three years) 10.4
Per cent of annual turnover spent on:
• New technology 5.2• Research & Development 4.2• Skills Acquisition & Training 4.0• Environmental Management 2.5
Source: Survey of Australian employers 2005
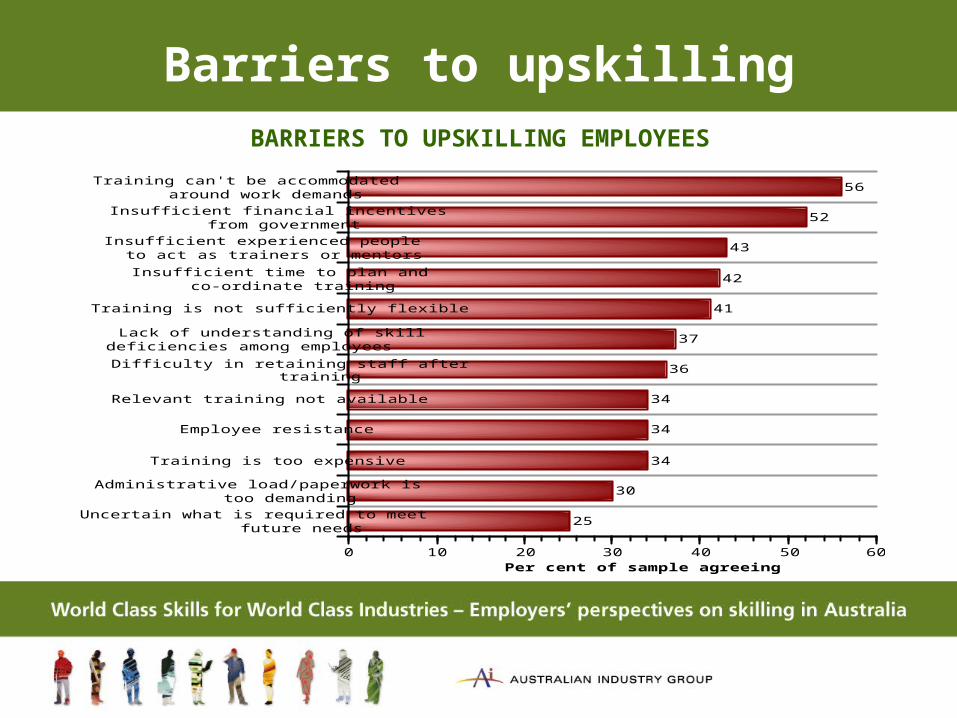
Barriers to upskillingBARRIERS TO UPSKILLING EMPLOYEES
Uncertain what is required to meetfuture needs
Administrative load/paperwork istoo demanding
Training is too expensive
Employee resistance
Relevant training not available
Difficulty in retaining staff aftertraining
Lack of understanding of skilldeficiencies among employees
Training is not sufficiently flexible
Insufficient time to plan andco-ordinate training
Insufficient experienced peopleto act as trainers or mentors
Insufficient financial incentivesfrom government
Training can't be accommodatedaround work demands
0 10 20 30 40 50 60Per cent of sample agreeing
56
52
43
42
41
37
36
34
34
34
30
25

What needs to be done?
Australia not yet skilling in a world class way.
The responsibility for change is shared between:– employers– individuals– employer groups– providers– governments


