
May 29, 2013
Breadwinner Moms Mothers Are the Sole or Primary Provider in Four-in-Ten Households with
Children; Public Conflicted about the Growing Trend
FOR FURTHER INFORMATION, CONTACT
Pew Research Center
1615 L St., N.W., Suite 700
Washington, D.C. 20036
Media Inquiries:
202.419.4372
www.pewresearch.org
1
PEW SOCIAL & DEMOGRAPHIC TRENDS
www.pewsocialtrends.org
25.3
15.0
0
10
20
30
40
50
1960 1970 1980 1990 2000 2010
Married mother/primary provider
Single mother
%
2011
40.4
10.8
7.3
3.5
Breadwinner Moms
Mothers Are the Sole or Primary Provider in Four-in-Ten Households with
Children; Public Conflicted about the Growing Trend
By Wendy Wang, Kim Parker and Paul Taylor
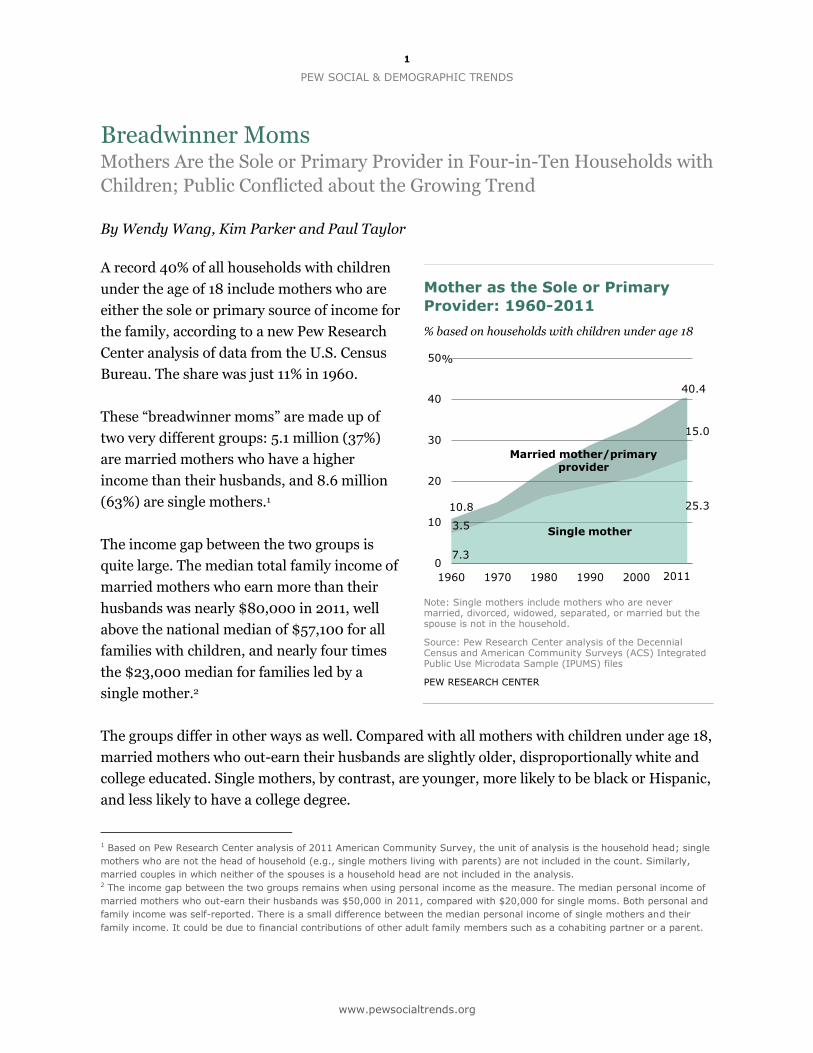
A record 40% of all households with children
under the age of 18 include mothers who are
either the sole or primary source of income for
the family, according to a new Pew Research
Center analysis of data from the U.S. Census
Bureau. The share was just 11% in 1960.
These “breadwinner moms” are made up of
two very different groups: 5.1 million (37%)
are married mothers who have a higher
income than their husbands, and 8.6 million
(63%) are single mothers.1
The income gap between the two groups is
quite large. The median total family income of
married mothers who earn more than their
husbands was nearly $80,000 in 2011, well
above the national median of $57,100 for all
families with children, and nearly four times
the $23,000 median for families led by a
single mother.2
The groups differ in other ways as well. Compared with all mothers with children under age 18,
married mothers who out-earn their husbands are slightly older, disproportionally white and
college educated. Single mothers, by contrast, are younger, more likely to be black or Hispanic,
and less likely to have a college degree.
1 Based on Pew Research Center analysis of 2011 American Community Survey, the unit of analysis is the household head; single
mothers who are not the head of household (e.g., single mothers living with parents) are not included in the count. Similarly,
married couples in which neither of the spouses is a household head are not included in the analysis. 2 The income gap between the two groups remains when using personal income as the measure. The median personal income of
married mothers who out-earn their husbands was $50,000 in 2011, compared with $20,000 for single moms. Both personal and
family income was self-reported. There is a small difference between the median personal income of single mothers and their
family income. It could be due to financial contributions of other adult family members such as a cohabiting partner or a parent.
Mother as the Sole or Primary
Provider: 1960-2011
% based on households with children under age 18
Note: Single mothers include mothers who are never married, divorced, widowed, separated, or married but the spouse is not in the household.
Source: Pew Research Center analysis of the Decennial Census and American Community Surveys (ACS) Integrated Public Use Microdata Sample (IPUMS) files
PEW RESEARCH CENTER
2
BREADWINNER MOMS
www.pewsocialtrends.org
28
50
74
67
35
19
Harder Easier
Families to earn enough to live comfortably
Marriages to be successful
Parents to raise children
34
76
51
8 11
13
Depends Better off with mother home
Better off with father home
Just as well off if mother works
Just as well off if father works
The growth of both groups of mothers is tied to
women’s increasing presence in the workplace.
Women make up almost of half (47%) of the
U.S. labor force today, and the employment
rate of married mothers with children has
increased from 37% in 1968 to 65% in 2011.3
The impact the recession may have had on this
trend is unclear.4 However, a Pew Research
Center survey conducted in November 2012
found that mothers’ views about whether and
how much they would like to work had
changed significantly since 2007 (before the
recession officially began). The share of
mothers saying their ideal situation would be
to work full time increased from 20% in 2007
to 32% in 2012. And the share saying they
would prefer not to work at all fell from 29% to
20%.
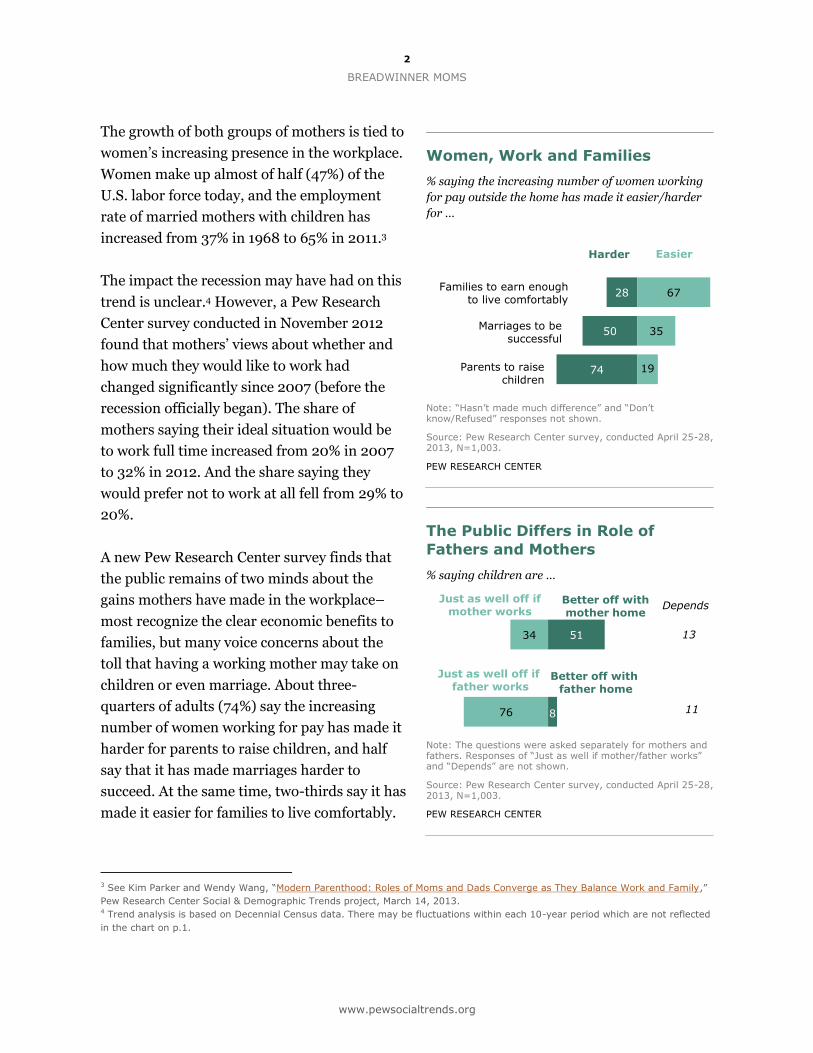
A new Pew Research Center survey finds that
the public remains of two minds about the
gains mothers have made in the workplace–
most recognize the clear economic benefits to
families, but many voice concerns about the
toll that having a working mother may take on
children or even marriage. About three-
quarters of adults (74%) say the increasing
number of women working for pay has made it
harder for parents to raise children, and half
say that it has made marriages harder to
succeed. At the same time, two-thirds say it has
made it easier for families to live comfortably.
3 See Kim Parker and Wendy Wang, “Modern Parenthood: Roles of Moms and Dads Converge as They Balance Work and Family,”
Pew Research Center Social & Demographic Trends project, March 14, 2013. 4 Trend analysis is based on Decennial Census data. There may be fluctuations within each 10-year period which are not reflected
in the chart on p.1.
Women, Work and Families
% saying the increasing number of women working
for pay outside the home has made it easier/harder
for …
Note: “Hasn’t made much difference” and “Don’t know/Refused” responses not shown.
Source: Pew Research Center survey, conducted April 25-28, 2013, N=1,003.
PEW RESEARCH CENTER
The Public Differs in Role of
Fathers and Mothers
% saying children are …
Note: The questions were asked separately for mothers and fathers. Responses of “Just as well if mother/father works” and “Depends” are not shown.
Source: Pew Research Center survey, conducted April 25-28, 2013, N=1,003.
PEW RESEARCH CENTER
3
PEW SOCIAL & DEMOGRAPHIC TRENDS
www.pewsocialtrends.org
64
71
19
19
13
8
2013
2007
Big problem Small problem Not a problem
64
67
56
42
65
74
78
51
65
All
White
Non-white
18-29
30-49
50+
Rep
Dem
Ind
While the vast majority of Americans (79%)
reject the idea that women should return to
their traditional roles, 5 the new Pew Research
survey finds that the public still sees mothers
and fathers in a different light when it comes to
evaluating the best work-family balance for
children.
About half (51%) of survey respondents say
that children are better off if a mother is home
and doesn’t hold a job, while just 8% say the
same about a father.
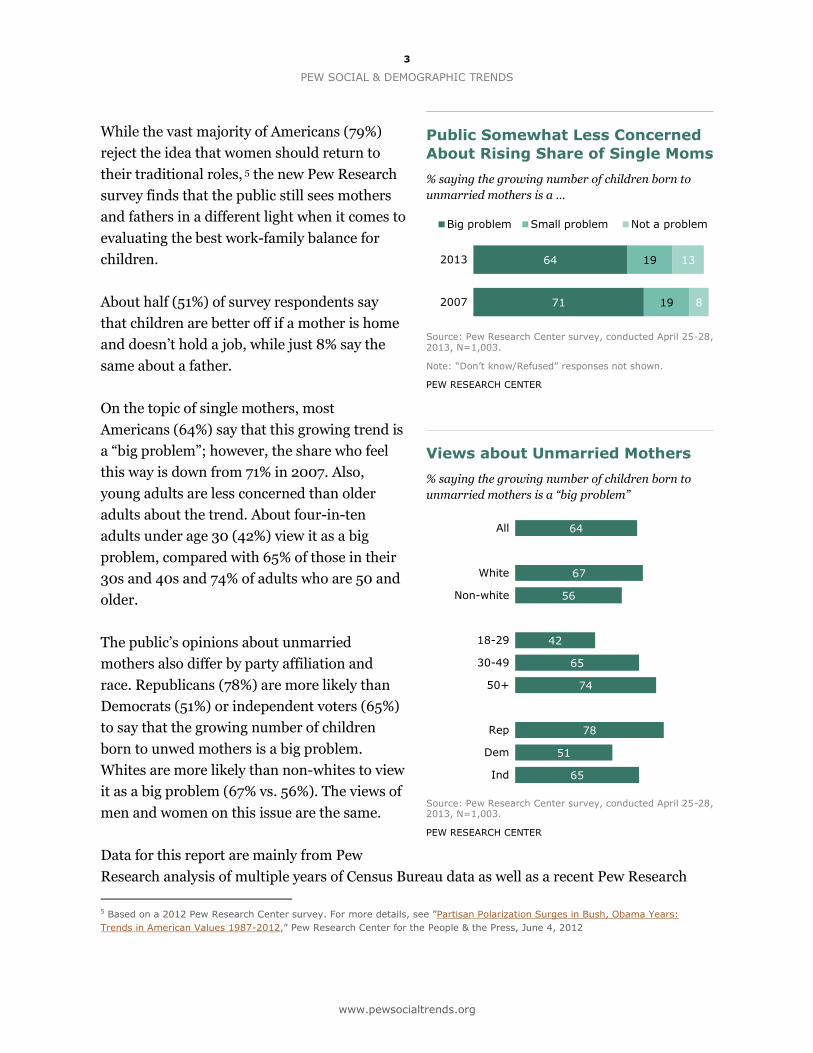
On the topic of single mothers, most
Americans (64%) say that this growing trend is
a “big problem”; however, the share who feel
this way is down from 71% in 2007. Also,
young adults are less concerned than older
adults about the trend. About four-in-ten
adults under age 30 (42%) view it as a big
problem, compared with 65% of those in their
30s and 40s and 74% of adults who are 50 and
older.
The public’s opinions about unmarried
mothers also differ by party affiliation and
race. Republicans (78%) are more likely than
Democrats (51%) or independent voters (65%)
to say that the growing number of children
born to unwed mothers is a big problem.
Whites are more likely than non-whites to view
it as a big problem (67% vs. 56%). The views of
men and women on this issue are the same.
Data for this report are mainly from Pew
Research analysis of multiple years of Census Bureau data as well as a recent Pew Research
5 Based on a 2012 Pew Research Center survey. For more details, see ”Partisan Polarization Surges in Bush, Obama Years:
Trends in American Values 1987-2012,” Pew Research Center for the People & the Press, June 4, 2012
Public Somewhat Less Concerned
About Rising Share of Single Moms
% saying the growing number of children born to
unmarried mothers is a …
Source: Pew Research Center survey, conducted April 25-28, 2013, N=1,003.
Note: “Don’t know/Refused” responses not shown.
PEW RESEARCH CENTER
Views about Unmarried Mothers
% saying the growing number of children born to
unmarried mothers is a “big problem”
Source: Pew Research Center survey, conducted April 25-28, 2013, N=1,003.
PEW RESEARCH CENTER
4
BREADWINNER MOMS
www.pewsocialtrends.org
survey conducted by landline and cellular telephone April 25-28, 2013, among a nationally
representative sample of 1,003 adults living in the continental United States. More detailed
information about the data sources can be found in Appendix 2.
Other Key Findings
Both groups of breadwinner mothers, married and single, have grown in
size in the past five decades. Of all households with children younger than 18, the
share of married mothers who out-earn their husbands has gone up from 4% in 1960 to
15% in 2011, nearly a fourfold increase. During the same period, the share of families
led by a single mother has more than tripled (from 7% to 25%).
The total family income is higher when the mother, not the father, is the
primary breadwinner. In 2011, the median family income was nearly $80,000 for
couples in which wife is the primary breadwinner, about $2,000 more than it was for
couples in which husband is the primary breadwinner, and $10,000 more than for
couples in which spouses’ income is the same.
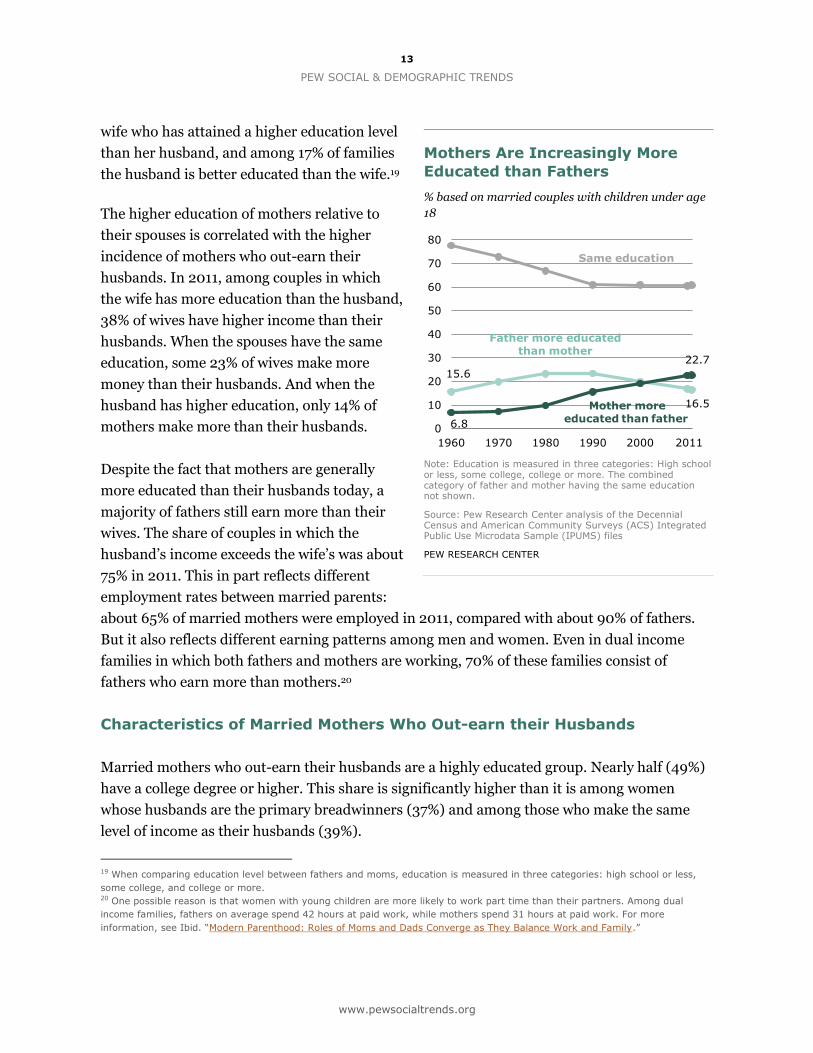
Married mothers are increasingly better educated than their husbands.
Even though a majority of spouses have a similar educational background, the share of
couples in which the mother has attained a higher education than her spouse has gone
up from 7% in 1960 to 23% in 2011. In two-parent families today, 61% have a mother
whose education level is similar to her husband’s, 23% have a mother who is better
educated than her husband, and 16% have a father who is better educated than his wife.
Most people reject the idea that it is bad for a marriage if a wife out-earns
her husband. When asked if they agree or disagree that it is generally better for a
marriage if a husband earns more than his wife, some 28% of survey respondents say
they agree and 63% disagree. When a similar question was asked in 1997, 40% said
they agreed. In the new survey, adults with a high school diploma or less were twice as
likely as those with a college degree (35% vs. 18%) to say it is generally better for a
marriage if a husband out-earns a wife. There were no significant differences between
men and women on this question.
Today’s single mothers are much more likely to be never married than
were single mothers in the past. The share of never married mothers among all
single mothers has increased from 4% in 1960 to 44% in 2011. During the same period,
5
PEW SOCIAL & DEMOGRAPHIC TRENDS
www.pewsocialtrends.org
the share of single mothers who had children from previous marriages has gone down
from 82% to 50%.
Never married mothers have a distinctive profile. Compared with single
mothers who are divorced, widowed or separated, never married mothers are
significantly younger, disproportionally non-white, and have lower education and
income. Close to half of never married mothers in 2011 (46%) are ages 30 and younger,
six-in-ten are either black (40%) or Hispanic (24%), and nearly half (49%) have a high
school education or less. Their median family income was $17, 400 in 2011, the lowest
among all families with children.
6
BREADWINNER MOMS
www.pewsocialtrends.org
28
50
74
67
35
19
Harder Easier
Families to earn enough to live comfortably
Marriages to be successful
Parents to raise children
PUBLIC VIEWS ON CHANGING GENDER ROLES
The public has mixed views about the changing role of women in the workplace and the impact
this has had on family life. Today women make up almost half of the U.S. labor force, and in
2012 nearly as many working-aged women (68%) as men (79%) were in the labor force.6 Most
Americans applaud these trends, and very few would favor a return to more traditional gender
roles. In a 2012 Pew Research survey, only 18% of all adults agreed that “women should return
to their traditional roles in society.” Fully eight-in-ten adults (79%) rejected this idea.7
When it comes to mothers of young children, the public is more conflicted. Relatively few
(21%) think the trend toward more mothers of young children working outside the home is a
good thing for our society8, and only 16% say having a mother who works full time is the ideal
situation for a young child.9
A new Pew Research Center
survey, conducted April 25-
28, 2013, finds that the
public remains of two minds
about the gains women have
made in the workplace–most
recognize the clear economic
benefits to families, but at
the same time many voice
concerns about the toll
having a working mother
may take on children.
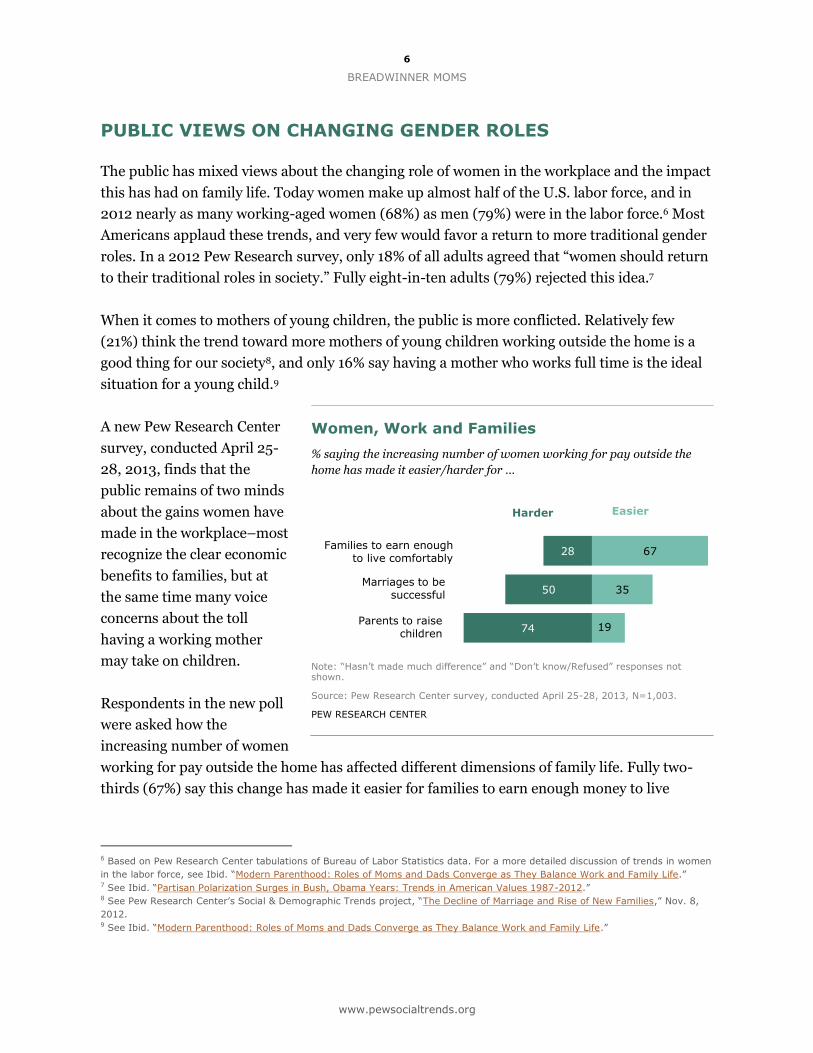
Respondents in the new poll
were asked how the
increasing number of women
working for pay outside the home has affected different dimensions of family life. Fully two-
thirds (67%) say this change has made it easier for families to earn enough money to live
6 Based on Pew Research Center tabulations of Bureau of Labor Statistics data. For a more detailed discussion of trends in women
in the labor force, see Ibid. “Modern Parenthood: Roles of Moms and Dads Converge as They Balance Work and Family Life.” 7 See Ibid. “Partisan Polarization Surges in Bush, Obama Years: Trends in American Values 1987-2012.” 8 See Pew Research Center’s Social & Demographic Trends project, “The Decline of Marriage and Rise of New Families,” Nov. 8,
2012. 9 See Ibid. “Modern Parenthood: Roles of Moms and Dads Converge as They Balance Work and Family Life.”
Women, Work and Families
% saying the increasing number of women working for pay outside the
home has made it easier/harder for …
Note: “Hasn’t made much difference” and “Don’t know/Refused” responses not shown.
Source: Pew Research Center survey, conducted April 25-28, 2013, N=1,003.
PEW RESEARCH CENTER
7
PEW SOCIAL & DEMOGRAPHIC TRENDS
www.pewsocialtrends.org
60
36
18
78
54
30
18-29 30 and older
Parents to raise children
Marriages to be successful
Families to earn enough to live
comfortably
comfortably. About three-in-ten (28%) say this change has made it harder for families to earn
enough, and 2% say it hasn’t made much difference in this regard.
While this trend may be beneficial for family finances, the public thinks having more women in
the workplace has not had a positive effect on child rearing and even marriage. Roughly three-
quarters of adults (74%) say the increasing number of women working for pay has made it
harder for parents to raise children. Only 19% say this has made it easier to raise children, and
2% say it hasn’t made much difference.
Half of all adults say the trend toward more women working has made it harder for marriages
to be successful. Only about one-third (35%) say this change has made it easier for marriages
to be successful, and 5% say it hasn’t made much difference.
These attitudes have changed somewhat over the past decade and a half. In a survey conducted
by the Washington Post, the Kaiser Family Foundation and Harvard University in 1997, most
adults saw the economic benefits of having more women in the workplace: 60% said this trend
made it easier for families to earn enough money to live comfortably. That share is even higher
today (67%).
Compared with current attitudes, the public
had a more negative assessment in 1997 of the
effect this trend was having on children and
marriage. Fully 82% said having more women
working for pay outside the home made it
harder for parents to raise children (compared
with 74% today), and 67% said this trend made
it harder for marriages to be successful (vs.
50% today).
There is no significant gender gap in views
about how having more women in the
workplace affects marriage and child rearing.
However, men are more likely than women to
see the economic benefits of this trend.
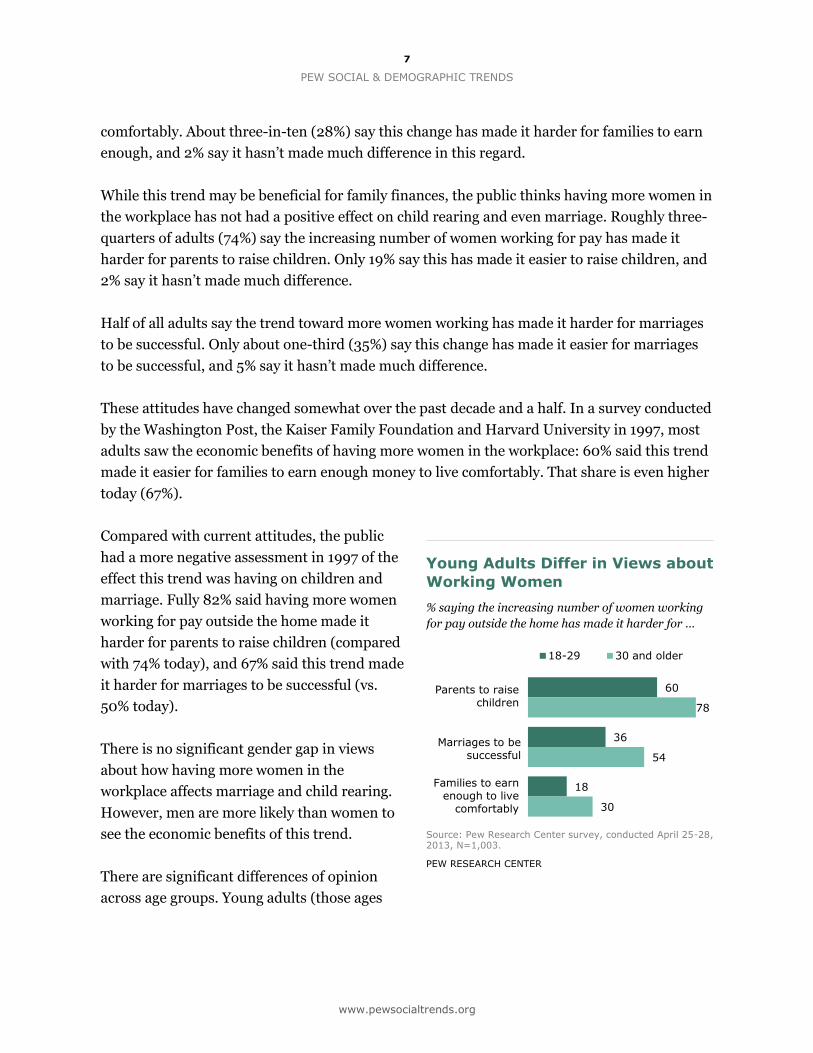
There are significant differences of opinion
across age groups. Young adults (those ages
Young Adults Differ in Views about
Working Women
% saying the increasing number of women working
for pay outside the home has made it harder for …
Source: Pew Research Center survey, conducted April 25-28, 2013, N=1,003.
PEW RESEARCH CENTER
8
BREADWINNER MOMS
www.pewsocialtrends.org
64
19
13
Big problem
Small problem
Not a problem
18-29) are less likely than older adults to see negative consequences from this trend and more
likely to see positive effects.
For example, while 78% of those adults ages 30 and older say having more women in the
workforce has made it harder for parents to raise children, only 60% of those ages 18-29 agree
with this assessment. Similarly, while more than half (54%) of adults ages 30 and older say the
rising share of women in the workplace has made it harder for marriages to be successful, only
36% of young adults agree. Not surprisingly, there are also large gaps by age in the incidence
levels of marriage and parenting. Among the survey respondents, only about one-quarter
(26%) of those ages 18-29 reported having a child under age 18. This compares with 66% of
those ages 30-49. Roughly one-in-five (19%) of those under age 30 said they were married,
compared with more than half (58%) of those ages 30 and older.
When it comes to earning enough money to live comfortably, young adults (79%) are more
likely than those ages 30 and older (64%) to say having more women working outside the
home has made this easier to accomplish.
The Rising Share of Single Mothers
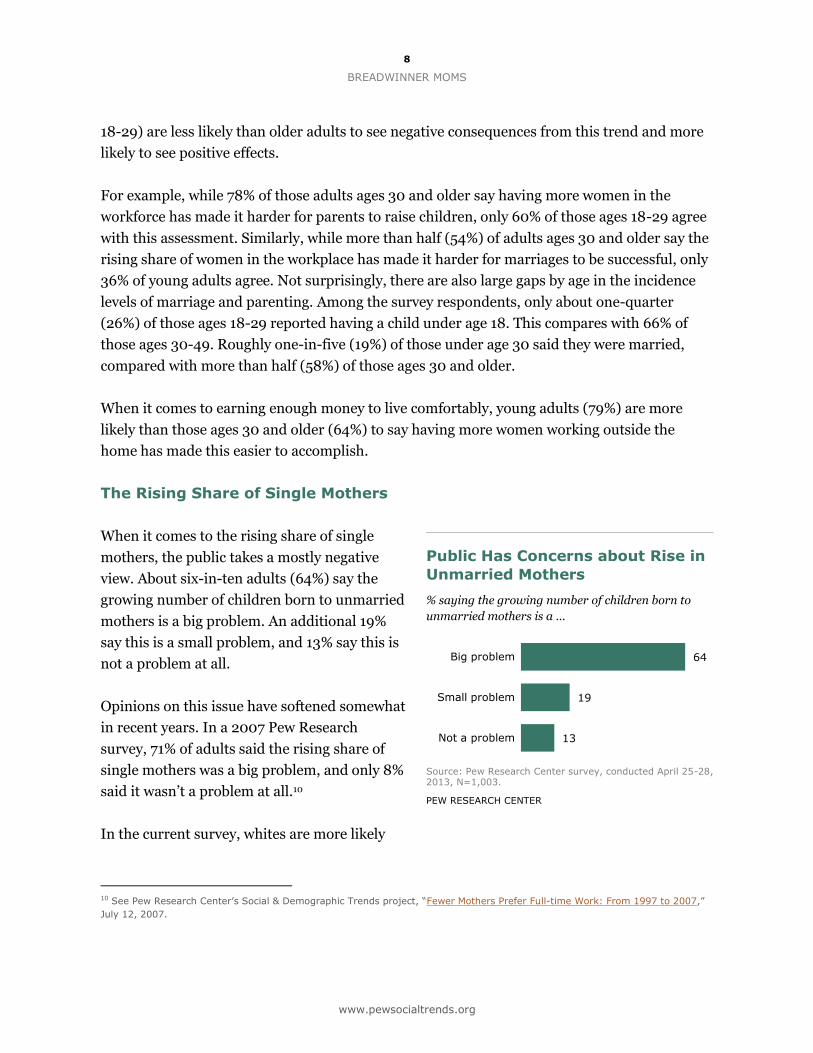
When it comes to the rising share of single
mothers, the public takes a mostly negative
view. About six-in-ten adults (64%) say the
growing number of children born to unmarried
mothers is a big problem. An additional 19%
say this is a small problem, and 13% say this is
not a problem at all.
Opinions on this issue have softened somewhat
in recent years. In a 2007 Pew Research
survey, 71% of adults said the rising share of
single mothers was a big problem, and only 8%
said it wasn’t a problem at all.10
In the current survey, whites are more likely
10 See Pew Research Center’s Social & Demographic Trends project, “Fewer Mothers Prefer Full-time Work: From 1997 to 2007,”
July 12, 2007.
Public Has Concerns about Rise in
Unmarried Mothers
% saying the growing number of children born to
unmarried mothers is a …
Source: Pew Research Center survey, conducted April 25-28, 2013, N=1,003.
PEW RESEARCH CENTER
9
PEW SOCIAL & DEMOGRAPHIC TRENDS
www.pewsocialtrends.org
51%
34%
13%
Better off with mother home
Just as well off if mother works
Depends (VOL.)
than non-whites to see this trend as a problem. Some 67% of whites compared with 56% of
non-whites say the growing number of children born to unmarried mothers is a big problem.11
Young adults have much different views on this issue than do middle-aged and older adults.
Only 42% of those ages 18-29 view the rising share of unmarried mothers as a big problem. By
contrast, 65% of those ages 30-49 say this is a big problem, as do 74% of those ages 50 and
older. Among young adults, most say this trend is either a small problem (35%) or not a
problem at all (19%).
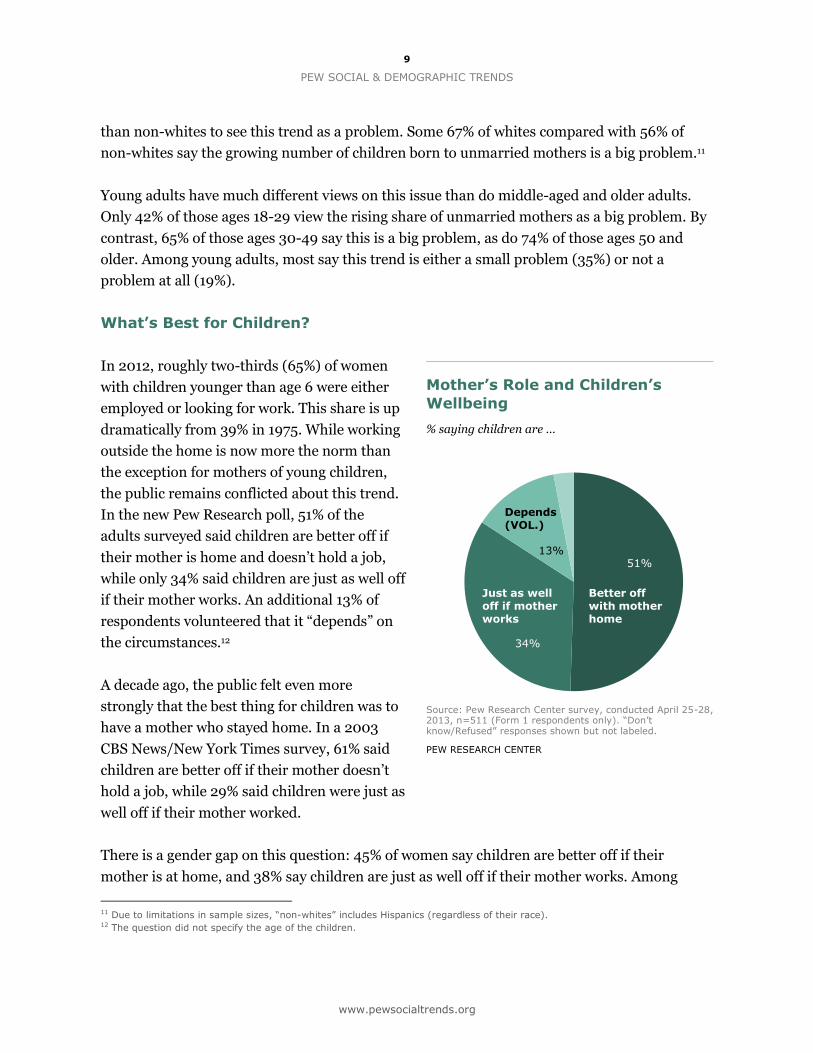
What’s Best for Children?
In 2012, roughly two-thirds (65%) of women
with children younger than age 6 were either
employed or looking for work. This share is up
dramatically from 39% in 1975. While working
outside the home is now more the norm than
the exception for mothers of young children,
the public remains conflicted about this trend.
In the new Pew Research poll, 51% of the
adults surveyed said children are better off if
their mother is home and doesn’t hold a job,
while only 34% said children are just as well off
if their mother works. An additional 13% of
respondents volunteered that it “depends” on
the circumstances.12
A decade ago, the public felt even more
strongly that the best thing for children was to
have a mother who stayed home. In a 2003
CBS News/New York Times survey, 61% said
children are better off if their mother doesn’t
hold a job, while 29% said children were just as
well off if their mother worked.
There is a gender gap on this question: 45% of women say children are better off if their
mother is at home, and 38% say children are just as well off if their mother works. Among
11 Due to limitations in sample sizes, “non-whites” includes Hispanics (regardless of their race). 12 The question did not specify the age of the children.
Mother’s Role and Children’s
Wellbeing
% saying children are …
Source: Pew Research Center survey, conducted April 25-28, 2013, n=511 (Form 1 respondents only). “Don’t know/Refused” responses shown but not labeled.
PEW RESEARCH CENTER
10
BREADWINNER MOMS
www.pewsocialtrends.org
8%
11%
Better off with father home
Just as well off if father works
Depends (VOL.)
76%
men, 57% say children are better off if their mother is at home, while 29% say they are just as
well off if their mother works.
There is an age gap on this question as well. Again, young adults express a different set of
views than their older counterparts. Nearly half (46%) of those under age 30 say children are
just as well off if their mother works, while 37% say they are better off with a mother who stays
home. Among those ages 30 and older, the balance of opinion is just the opposite: 55% say
children are better off if their mother is home, and 31% say they are just as well off with a
working mother.
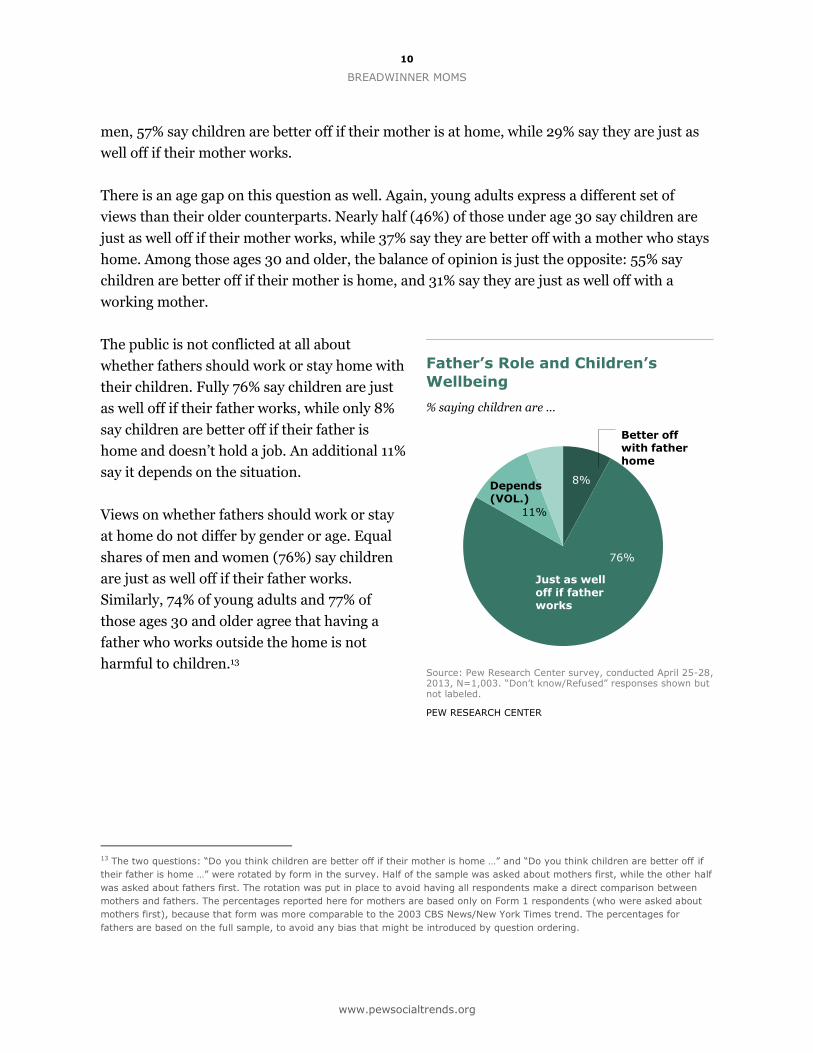
The public is not conflicted at all about
whether fathers should work or stay home with
their children. Fully 76% say children are just
as well off if their father works, while only 8%
say children are better off if their father is
home and doesn’t hold a job. An additional 11%
say it depends on the situation.
Views on whether fathers should work or stay
at home do not differ by gender or age. Equal
shares of men and women (76%) say children
are just as well off if their father works.
Similarly, 74% of young adults and 77% of
those ages 30 and older agree that having a
father who works outside the home is not
harmful to children.13
13 The two questions: “Do you think children are better off if their mother is home …” and “Do you think children are better off if
their father is home …” were rotated by form in the survey. Half of the sample was asked about mothers first, while the other half
was asked about fathers first. The rotation was put in place to avoid having all respondents make a direct comparison between
mothers and fathers. The percentages reported here for mothers are based only on Form 1 respondents (who were asked about
mothers first), because that form was more comparable to the 2003 CBS News/New York Times trend. The percentages for
fathers are based on the full sample, to avoid any bias that might be introduced by question ordering.
Father’s Role and Children’s
Wellbeing
% saying children are …
Source: Pew Research Center survey, conducted April 25-28, 2013, N=1,003. “Don’t know/Refused” responses shown but not labeled.
PEW RESEARCH CENTER
11
PEW SOCIAL & DEMOGRAPHIC TRENDS
www.pewsocialtrends.org
63
58
28
40
Disagree Agree
2013
1997
What’s Best for Marriage?
These days, in most two-parent households (59%), both the mother and the father work
outside the home.14 In a majority of those households, the father has a higher income than the
mother, but for a growing share of these couples, the mother out-earns the father.
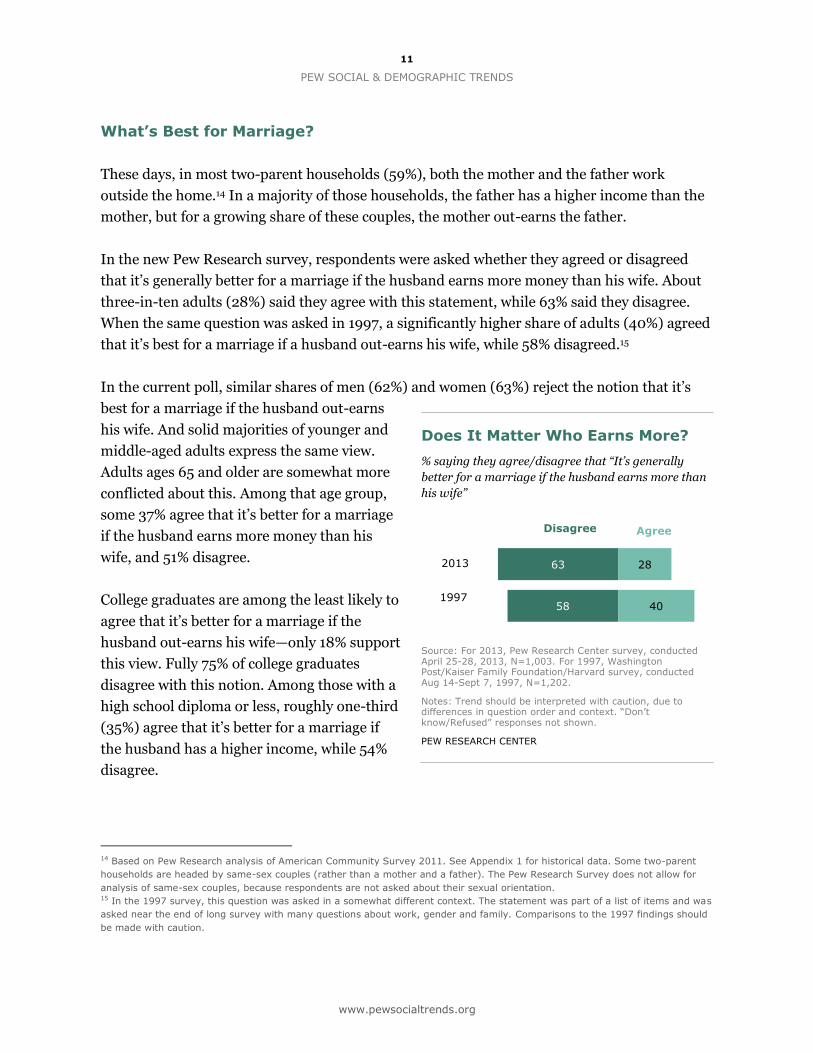
In the new Pew Research survey, respondents were asked whether they agreed or disagreed
that it’s generally better for a marriage if the husband earns more money than his wife. About
three-in-ten adults (28%) said they agree with this statement, while 63% said they disagree.
When the same question was asked in 1997, a significantly higher share of adults (40%) agreed
that it’s best for a marriage if a husband out-earns his wife, while 58% disagreed.15
In the current poll, similar shares of men (62%) and women (63%) reject the notion that it’s
best for a marriage if the husband out-earns
his wife. And solid majorities of younger and
middle-aged adults express the same view.
Adults ages 65 and older are somewhat more
conflicted about this. Among that age group,
some 37% agree that it’s better for a marriage
if the husband earns more money than his
wife, and 51% disagree.
College graduates are among the least likely to
agree that it’s better for a marriage if the
husband out-earns his wife—only 18% support
this view. Fully 75% of college graduates
disagree with this notion. Among those with a
high school diploma or less, roughly one-third
(35%) agree that it’s better for a marriage if
the husband has a higher income, while 54%
disagree.
14 Based on Pew Research analysis of American Community Survey 2011. See Appendix 1 for historical data. Some two-parent
households are headed by same-sex couples (rather than a mother and a father). The Pew Research Survey does not allow for
analysis of same-sex couples, because respondents are not asked about their sexual orientation. 15 In the 1997 survey, this question was asked in a somewhat different context. The statement was part of a list of items and was
asked near the end of long survey with many questions about work, gender and family. Comparisons to the 1997 findings should
be made with caution.
Does It Matter Who Earns More?
% saying they agree/disagree that “It’s generally
better for a marriage if the husband earns more than
his wife”
Source: For 2013, Pew Research Center survey, conducted April 25-28, 2013, N=1,003. For 1997, Washington Post/Kaiser Family Foundation/Harvard survey, conducted Aug 14-Sept 7, 1997, N=1,202.
Notes: Trend should be interpreted with caution, due to differences in question order and context. “Don’t know/Refused” responses not shown.
PEW RESEARCH CENTER
12
BREADWINNER MOMS
www.pewsocialtrends.org
3.8
22.5
94.8
74.9
0
20
40
60
80
100
1960 1970 1980 1990 2000 2010 2011
Father makes more
Mother makes more
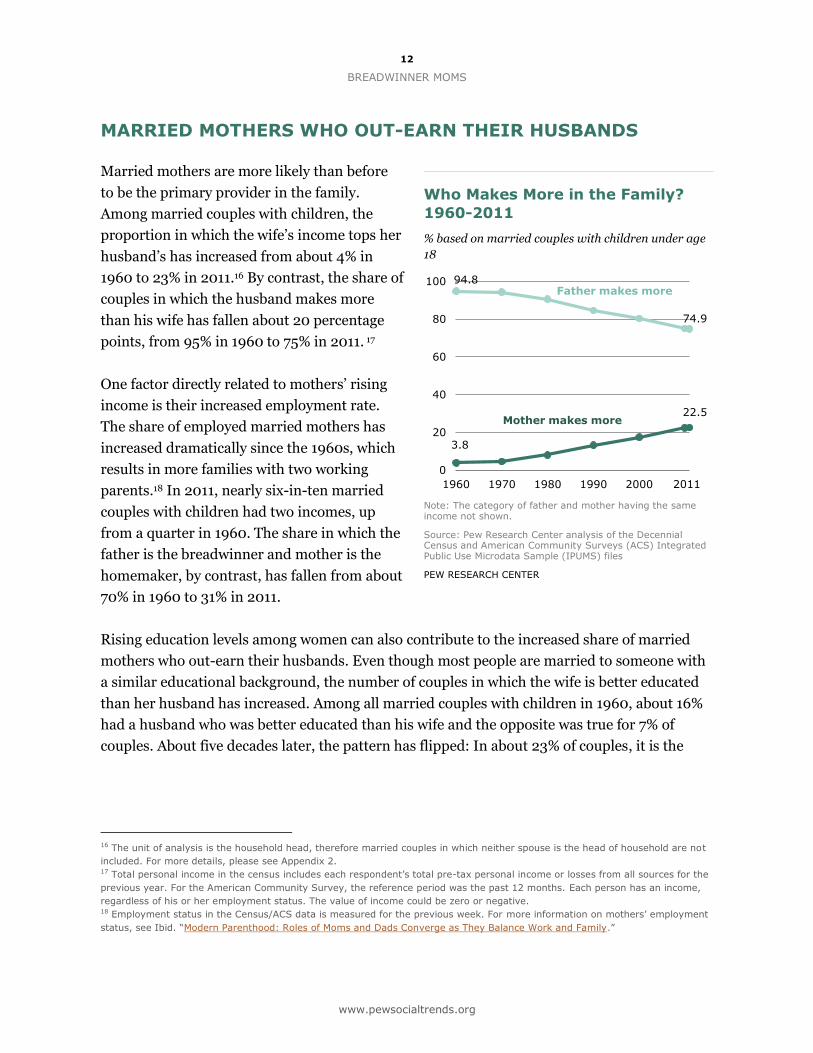
MARRIED MOTHERS WHO OUT-EARN THEIR HUSBANDS
Married mothers are more likely than before
to be the primary provider in the family.
Among married couples with children, the
proportion in which the wife’s income tops her
husband’s has increased from about 4% in
1960 to 23% in 2011.16 By contrast, the share of
couples in which the husband makes more
than his wife has fallen about 20 percentage
points, from 95% in 1960 to 75% in 2011. 17
One factor directly related to mothers’ rising
income is their increased employment rate.
The share of employed married mothers has
increased dramatically since the 1960s, which
results in more families with two working
parents.18 In 2011, nearly six-in-ten married
couples with children had two incomes, up
from a quarter in 1960. The share in which the
father is the breadwinner and mother is the
homemaker, by contrast, has fallen from about
70% in 1960 to 31% in 2011.
Rising education levels among women can also contribute to the increased share of married
mothers who out-earn their husbands. Even though most people are married to someone with
a similar educational background, the number of couples in which the wife is better educated
than her husband has increased. Among all married couples with children in 1960, about 16%
had a husband who was better educated than his wife and the opposite was true for 7% of
couples. About five decades later, the pattern has flipped: In about 23% of couples, it is the
16 The unit of analysis is the household head, therefore married couples in which neither spouse is the head of household are not
included. For more details, please see Appendix 2. 17 Total personal income in the census includes each respondent’s total pre-tax personal income or losses from all sources for the
previous year. For the American Community Survey, the reference period was the past 12 months. Each person has an income,
regardless of his or her employment status. The value of income could be zero or negative. 18 Employment status in the Census/ACS data is measured for the previous week. For more information on mothers’ employment
status, see Ibid. “Modern Parenthood: Roles of Moms and Dads Converge as They Balance Work and Family.”
Who Makes More in the Family?
1960-2011
% based on married couples with children under age
18
Note: The category of father and mother having the same income not shown.
Source: Pew Research Center analysis of the Decennial Census and American Community Surveys (ACS) Integrated Public Use Microdata Sample (IPUMS) files
PEW RESEARCH CENTER
13
PEW SOCIAL & DEMOGRAPHIC TRENDS
www.pewsocialtrends.org
15.6
16.5
6.8
22.7
0
10
20
30
40
50
60
70
80
1960 1970 1980 1990 2000 2010
Mother more educated than father
Father more educated than mother
2011
Same education
wife who has attained a higher education level
than her husband, and among 17% of families
the husband is better educated than the wife.19
The higher education of mothers relative to
their spouses is correlated with the higher
incidence of mothers who out-earn their
husbands. In 2011, among couples in which
the wife has more education than the husband,
38% of wives have higher income than their
husbands. When the spouses have the same
education, some 23% of wives make more
money than their husbands. And when the
husband has higher education, only 14% of
mothers make more than their husbands.
Despite the fact that mothers are generally
more educated than their husbands today, a
majority of fathers still earn more than their
wives. The share of couples in which the
husband’s income exceeds the wife’s was about
75% in 2011. This in part reflects different
employment rates between married parents:
about 65% of married mothers were employed in 2011, compared with about 90% of fathers.
But it also reflects different earning patterns among men and women. Even in dual income
families in which both fathers and mothers are working, 70% of these families consist of
fathers who earn more than mothers.20
Characteristics of Married Mothers Who Out-earn their Husbands
Married mothers who out-earn their husbands are a highly educated group. Nearly half (49%)
have a college degree or higher. This share is significantly higher than it is among women
whose husbands are the primary breadwinners (37%) and among those who make the same
level of income as their husbands (39%).
19 When comparing education level between fathers and moms, education is measured in three categories: high school or less,
some college, and college or more. 20 One possible reason is that women with young children are more likely to work part time than their partners. Among dual
income families, fathers on average spend 42 hours at paid work, while mothers spend 31 hours at paid work. For more
information, see Ibid. “Modern Parenthood: Roles of Moms and Dads Converge as They Balance Work and Family.”
Mothers Are Increasingly More
Educated than Fathers
% based on married couples with children under age
18
Note: Education is measured in three categories: High school or less, some college, college or more. The combined category of father and mother having the same education not shown.
Source: Pew Research Center analysis of the Decennial Census and American Community Surveys (ACS) Integrated Public Use Microdata Sample (IPUMS) files
PEW RESEARCH CENTER
14
BREADWINNER MOMS
www.pewsocialtrends.org
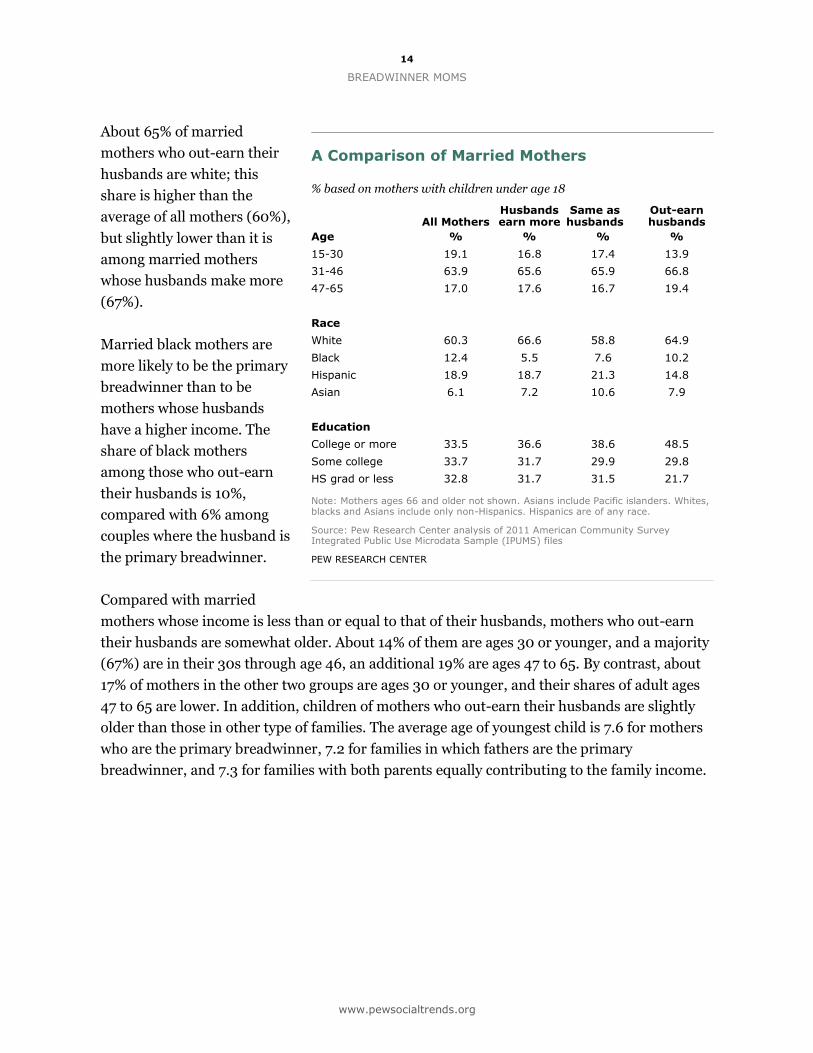
About 65% of married
mothers who out-earn their
husbands are white; this
share is higher than the
average of all mothers (60%),
but slightly lower than it is
among married mothers
whose husbands make more
(67%).
Married black mothers are
more likely to be the primary
breadwinner than to be
mothers whose husbands
have a higher income. The
share of black mothers
among those who out-earn
their husbands is 10%,
compared with 6% among
couples where the husband is
the primary breadwinner.
Compared with married
mothers whose income is less than or equal to that of their husbands, mothers who out-earn
their husbands are somewhat older. About 14% of them are ages 30 or younger, and a majority
(67%) are in their 30s through age 46, an additional 19% are ages 47 to 65. By contrast, about
17% of mothers in the other two groups are ages 30 or younger, and their shares of adult ages
47 to 65 are lower. In addition, children of mothers who out-earn their husbands are slightly
older than those in other type of families. The average age of youngest child is 7.6 for mothers
who are the primary breadwinner, 7.2 for families in which fathers are the primary
breadwinner, and 7.3 for families with both parents equally contributing to the family income.
A Comparison of Married Mothers
% based on mothers with children under age 18
All Mothers Husbands earn more
Same as husbands
Out-earn husbands
Age % % % %
15-30 19.1 16.8 17.4 13.9
31-46 63.9 65.6 65.9 66.8
47-65 17.0 17.6 16.7 19.4
Race
White 60.3 66.6 58.8 64.9
Black 12.4 5.5 7.6 10.2
Hispanic 18.9 18.7 21.3 14.8
Asian 6.1 7.2 10.6 7.9
Education
College or more 33.5 36.6 38.6 48.5
Some college 33.7 31.7 29.9 29.8
HS grad or less 32.8 31.7 31.5 21.7
Note: Mothers ages 66 and older not shown. Asians include Pacific islanders. Whites, blacks and Asians include only non-Hispanics. Hispanics are of any race.
Source: Pew Research Center analysis of 2011 American Community Survey Integrated Public Use Microdata Sample (IPUMS) files
PEW RESEARCH CENTER
15
PEW SOCIAL & DEMOGRAPHIC TRENDS
www.pewsocialtrends.org
$79,800
$78,000
$70,000
Mother makes more
Father makes more
Same income
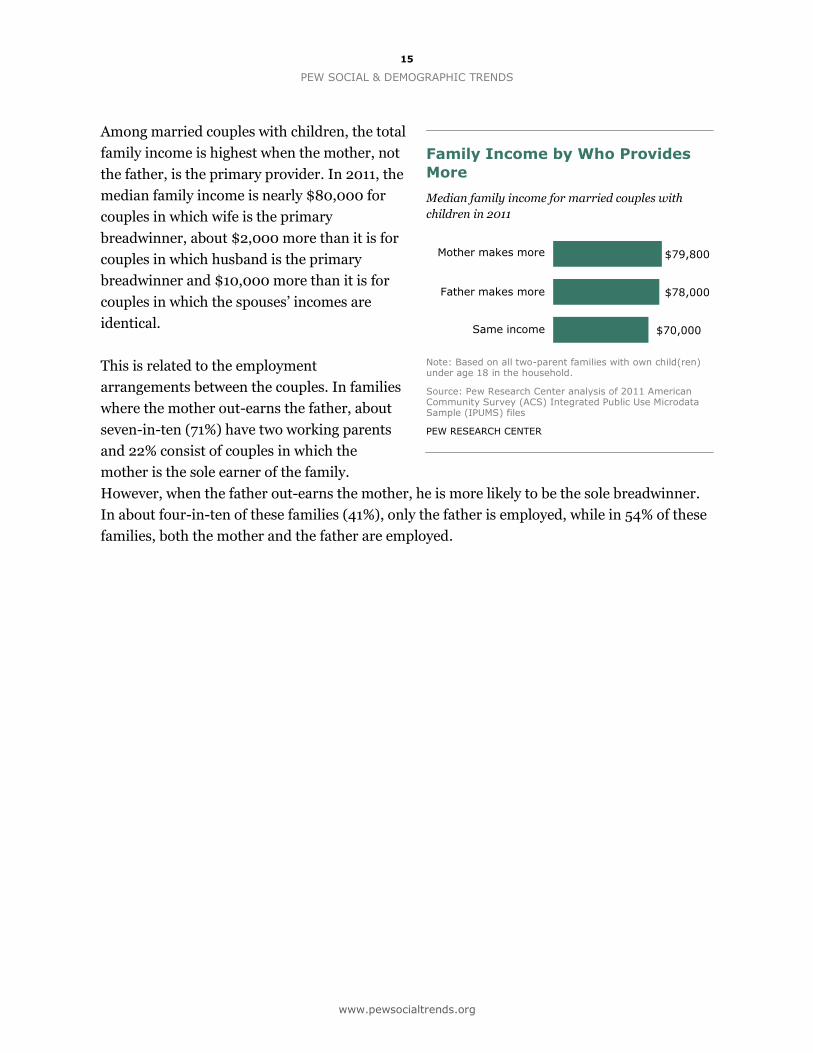
Among married couples with children, the total
family income is highest when the mother, not
the father, is the primary provider. In 2011, the
median family income is nearly $80,000 for
couples in which wife is the primary
breadwinner, about $2,000 more than it is for
couples in which husband is the primary
breadwinner and $10,000 more than it is for
couples in which the spouses’ incomes are
identical.
This is related to the employment
arrangements between the couples. In families
where the mother out-earns the father, about
seven-in-ten (71%) have two working parents
and 22% consist of couples in which the
mother is the sole earner of the family.
However, when the father out-earns the mother, he is more likely to be the sole breadwinner.
In about four-in-ten of these families (41%), only the father is employed, while in 54% of these
families, both the mother and the father are employed.
Family Income by Who Provides
More
Median family income for married couples with
children in 2011
Note: Based on all two-parent families with own child(ren) under age 18 in the household.
Source: Pew Research Center analysis of 2011 American Community Survey (ACS) Integrated Public Use Microdata Sample (IPUMS) files
PEW RESEARCH CENTER
16
BREADWINNER MOMS
www.pewsocialtrends.org
67%
30%
3%
Wife makes more
Husband makes more
Same
Income
16%
26%
57% Wife
Husband
Same
Education
Income and Education among Newlyweds
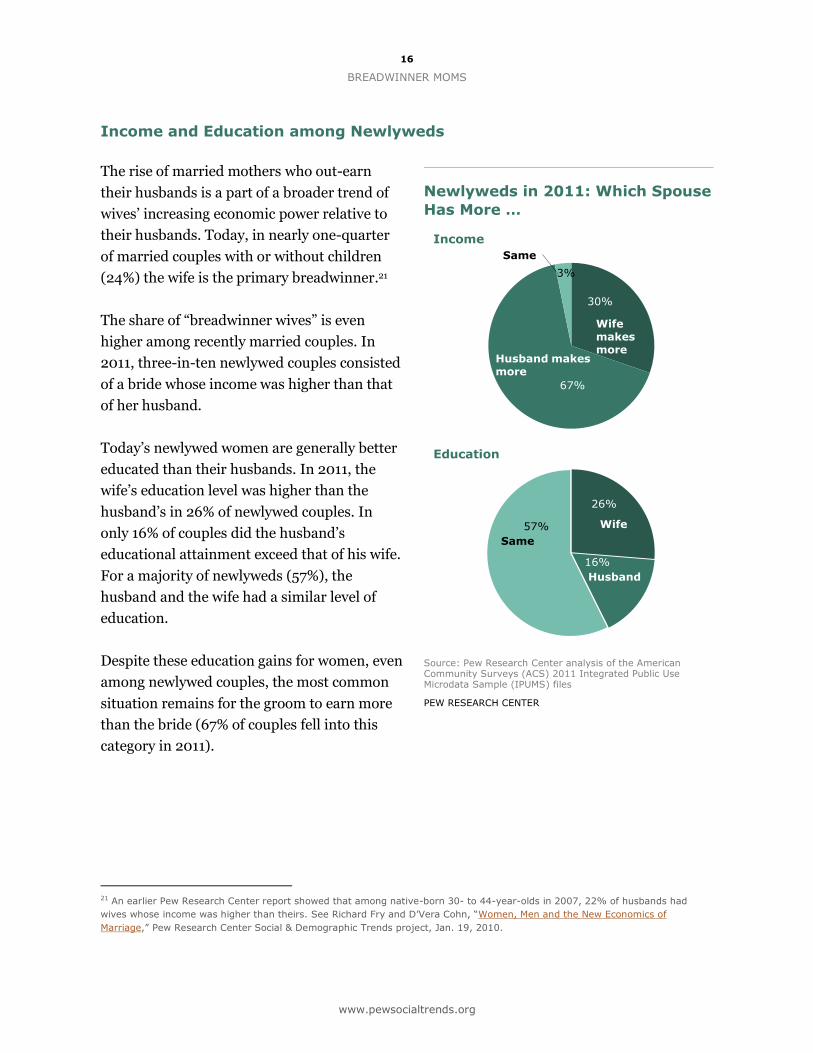
The rise of married mothers who out-earn
their husbands is a part of a broader trend of
wives’ increasing economic power relative to
their husbands. Today, in nearly one-quarter
of married couples with or without children
(24%) the wife is the primary breadwinner.21
The share of “breadwinner wives” is even
higher among recently married couples. In
2011, three-in-ten newlywed couples consisted
of a bride whose income was higher than that
of her husband.
Today’s newlywed women are generally better
educated than their husbands. In 2011, the
wife’s education level was higher than the
husband’s in 26% of newlywed couples. In
only 16% of couples did the husband’s
educational attainment exceed that of his wife.
For a majority of newlyweds (57%), the
husband and the wife had a similar level of
education.
Despite these education gains for women, even
among newlywed couples, the most common
situation remains for the groom to earn more
than the bride (67% of couples fell into this
category in 2011).
21 An earlier Pew Research Center report showed that among native-born 30- to 44-year-olds in 2007, 22% of husbands had
wives whose income was higher than theirs. See Richard Fry and D’Vera Cohn, “Women, Men and the New Economics of
Marriage,” Pew Research Center Social & Demographic Trends project, Jan. 19, 2010.
Newlyweds in 2011: Which Spouse
Has More …
Source: Pew Research Center analysis of the American Community Surveys (ACS) 2011 Integrated Public Use Microdata Sample (IPUMS) files
PEW RESEARCH CENTER
17
PEW SOCIAL & DEMOGRAPHIC TRENDS
www.pewsocialtrends.org
1.4
12.8
11.2
0
10
20
30
40
50
1960 1970 1980 1990 2000 2010
Divorced, separated, widowed
%
25.3
Never married
2011
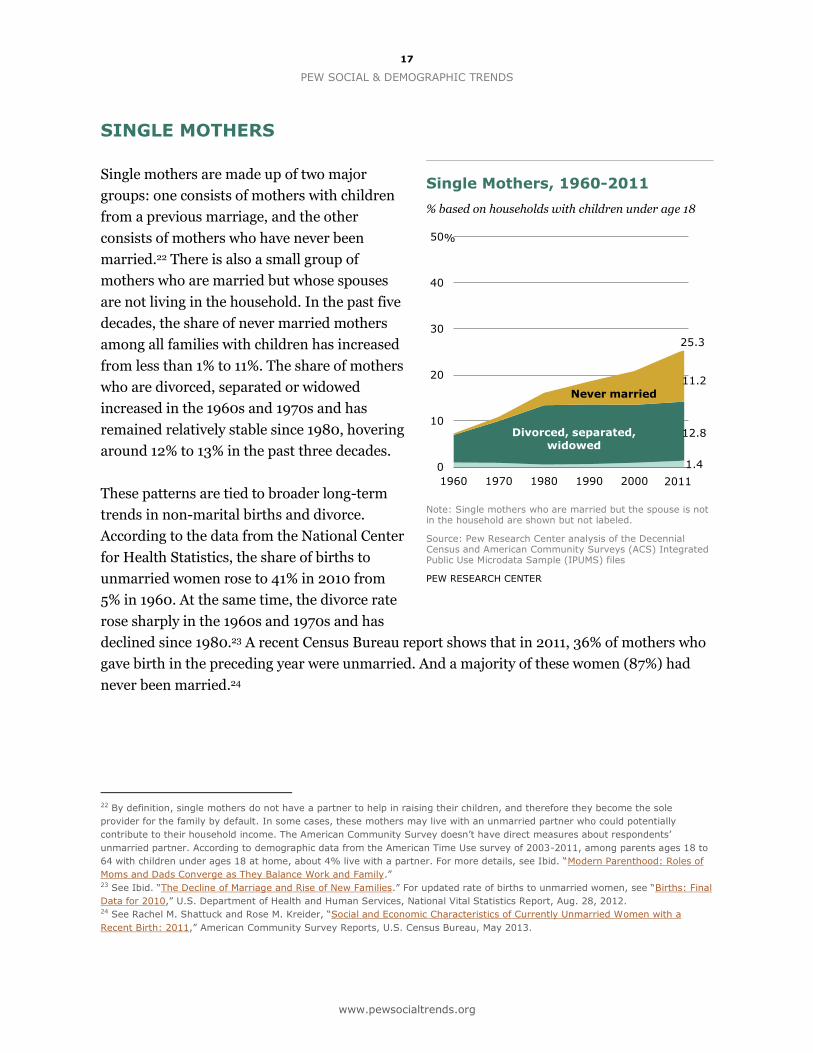
SINGLE MOTHERS
Single mothers are made up of two major
groups: one consists of mothers with children
from a previous marriage, and the other
consists of mothers who have never been
married.22 There is also a small group of
mothers who are married but whose spouses
are not living in the household. In the past five
decades, the share of never married mothers
among all families with children has increased
from less than 1% to 11%. The share of mothers
who are divorced, separated or widowed
increased in the 1960s and 1970s and has
remained relatively stable since 1980, hovering
around 12% to 13% in the past three decades.
These patterns are tied to broader long-term
trends in non-marital births and divorce.
According to the data from the National Center
for Health Statistics, the share of births to
unmarried women rose to 41% in 2010 from
5% in 1960. At the same time, the divorce rate
rose sharply in the 1960s and 1970s and has
declined since 1980.23 A recent Census Bureau report shows that in 2011, 36% of mothers who
gave birth in the preceding year were unmarried. And a majority of these women (87%) had
never been married.24
22 By definition, single mothers do not have a partner to help in raising their children, and therefore they become the sole
provider for the family by default. In some cases, these mothers may live with an unmarried partner who could potentially
contribute to their household income. The American Community Survey doesn’t have direct measures about respondents’
unmarried partner. According to demographic data from the American Time Use survey of 2003-2011, among parents ages 18 to
64 with children under ages 18 at home, about 4% live with a partner. For more details, see Ibid. “Modern Parenthood: Roles of
Moms and Dads Converge as They Balance Work and Family.” 23 See Ibid. “The Decline of Marriage and Rise of New Families.” For updated rate of births to unmarried women, see “Births: Final
Data for 2010,” U.S. Department of Health and Human Services, National Vital Statistics Report, Aug. 28, 2012. 24 See Rachel M. Shattuck and Rose M. Kreider, “Social and Economic Characteristics of Currently Unmarried Women with a
Recent Birth: 2011,” American Community Survey Reports, U.S. Census Bureau, May 2013.
Single Mothers, 1960-2011
% based on households with children under age 18
Note: Single mothers who are married but the spouse is not in the household are shown but not labeled.
Source: Pew Research Center analysis of the Decennial Census and American Community Surveys (ACS) Integrated Public Use Microdata Sample (IPUMS) files
PEW RESEARCH CENTER
18
BREADWINNER MOMS
www.pewsocialtrends.org
82%
14%
4%
Never Married
Divorced, separated, widowed
Spouse absent
1960
6%
50% 44%
Divorced, Separated,Widowed
Never Married
2011 Spouse absent
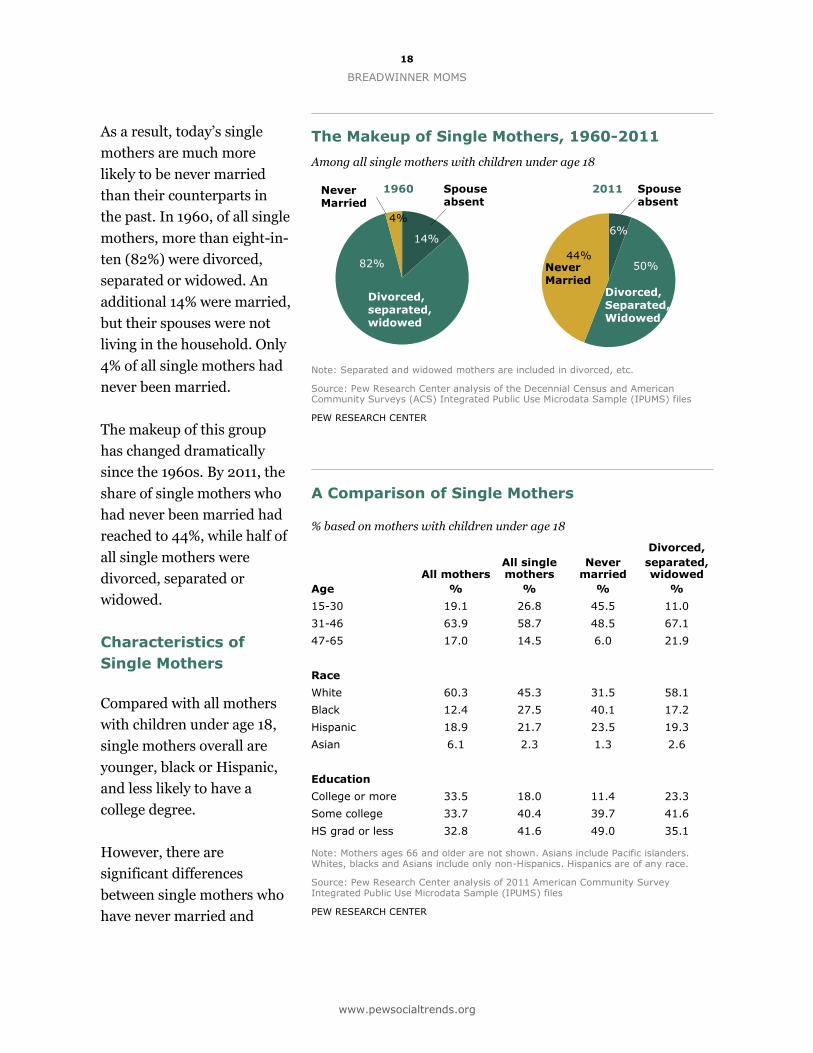
As a result, today’s single
mothers are much more
likely to be never married
than their counterparts in
the past. In 1960, of all single
mothers, more than eight-in-
ten (82%) were divorced,
separated or widowed. An
additional 14% were married,
but their spouses were not
living in the household. Only
4% of all single mothers had
never been married.
The makeup of this group
has changed dramatically
since the 1960s. By 2011, the
share of single mothers who
had never been married had
reached to 44%, while half of
all single mothers were
divorced, separated or
widowed.
Characteristics of
Single Mothers
Compared with all mothers
with children under age 18,
single mothers overall are
younger, black or Hispanic,
and less likely to have a
college degree.
However, there are
significant differences
between single mothers who
have never married and
A Comparison of Single Mothers
% based on mothers with children under age 18
All mothers All single mothers
Never married
Divorced,
separated, widowed
Age % % % %
15-30 19.1 26.8 45.5 11.0
31-46 63.9 58.7 48.5 67.1
47-65 17.0 14.5 6.0 21.9
Race
White 60.3 45.3 31.5 58.1
Black 12.4 27.5 40.1 17.2
Hispanic 18.9 21.7 23.5 19.3
Asian 6.1 2.3 1.3 2.6
Education
College or more 33.5 18.0 11.4 23.3
Some college 33.7 40.4 39.7 41.6
HS grad or less 32.8 41.6 49.0 35.1
Note: Mothers ages 66 and older are not shown. Asians include Pacific islanders. Whites, blacks and Asians include only non-Hispanics. Hispanics are of any race.
Source: Pew Research Center analysis of 2011 American Community Survey Integrated Public Use Microdata Sample (IPUMS) files
PEW RESEARCH CENTER
The Makeup of Single Mothers, 1960-2011
Among all single mothers with children under age 18
Note: Separated and widowed mothers are included in divorced, etc.
Source: Pew Research Center analysis of the Decennial Census and American Community Surveys (ACS) Integrated Public Use Microdata Sample (IPUMS) files
PEW RESEARCH CENTER
19
PEW SOCIAL & DEMOGRAPHIC TRENDS
www.pewsocialtrends.org
$57,100
$29,000
$17,400
All households with children
Divorced, Separated,Widowed
Never married
those who have children from previous marriages. Never married mothers are significantly
younger: About 46% of them are ages 30 or younger; and nearly half are in their 30s and 40s.
By contrast, only 11% of divorced, separated or widowed mothers are ages 30 or younger. A
majority of them are in their 30s through age 46 (67%), and about 22% are ages 47 to 65.
Never married mothers are disproportionally racial and ethnic minorities. As of 2011, about
40% of never married mothers were black (compared with 12% of all mothers), 24% were
Hispanic (compared with 19% of all mothers), and 32% were white (compared with 60% of all).
There is much less of a racial skew among mothers who are divorced, separated or widowed;
17% of them were black, 19% were Hispanic and 58% were white.
The two groups of single mothers also differ by
education. Nearly half of never married
mothers (49%) have a high school education or
less, compared with 35% among mothers who
are divorced, widowed or separated. The share
of college graduates is higher among divorced
mothers (23%) than among never married
mothers (11%).
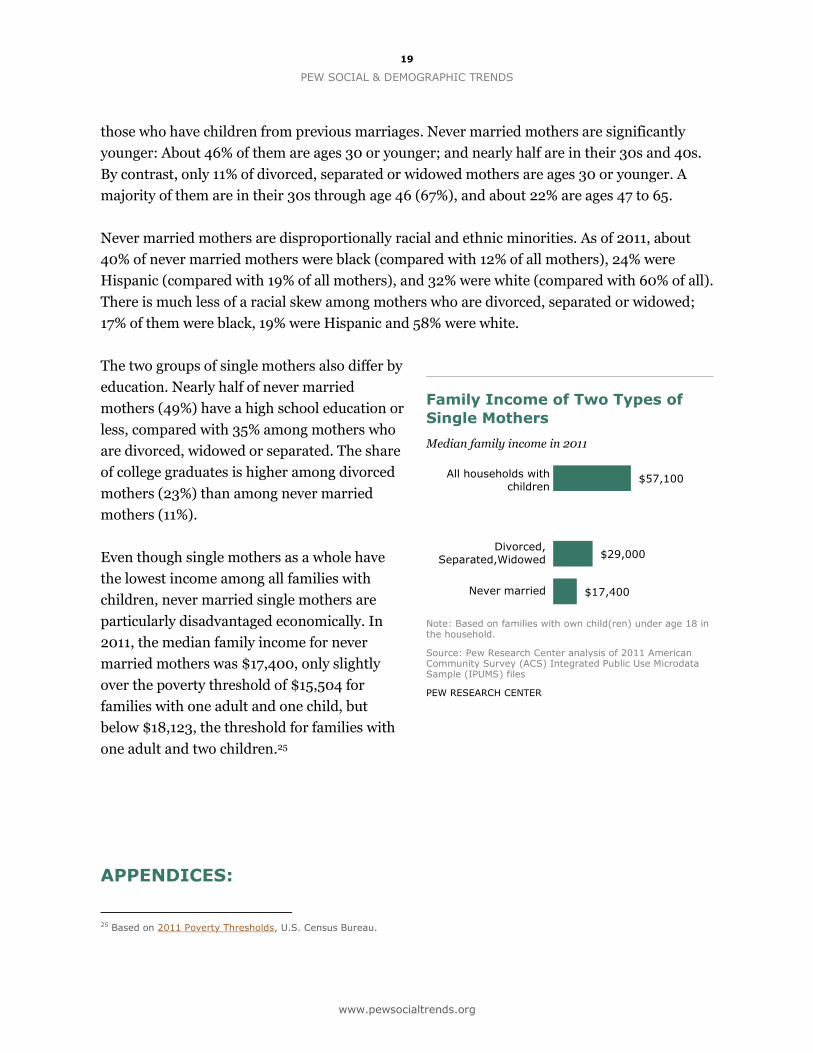
Even though single mothers as a whole have
the lowest income among all families with
children, never married single mothers are
particularly disadvantaged economically. In
2011, the median family income for never
married mothers was $17,400, only slightly
over the poverty threshold of $15,504 for
families with one adult and one child, but
below $18,123, the threshold for families with
one adult and two children.25
APPENDICES:
25 Based on 2011 Poverty Thresholds, U.S. Census Bureau.
Family Income of Two Types of
Single Mothers
Median family income in 2011
Note: Based on families with own child(ren) under age 18 in the household.
Source: Pew Research Center analysis of 2011 American Community Survey (ACS) Integrated Public Use Microdata Sample (IPUMS) files
PEW RESEARCH CENTER
20
BREADWINNER MOMS
www.pewsocialtrends.org
24.6
58.6
69.7
31.2
1.6 6.7
0
10
20
30
40
50
60
70
80
1960 1970 1980 1990 2000 2010
Only father employed
Dual income
2011
Only mother employed
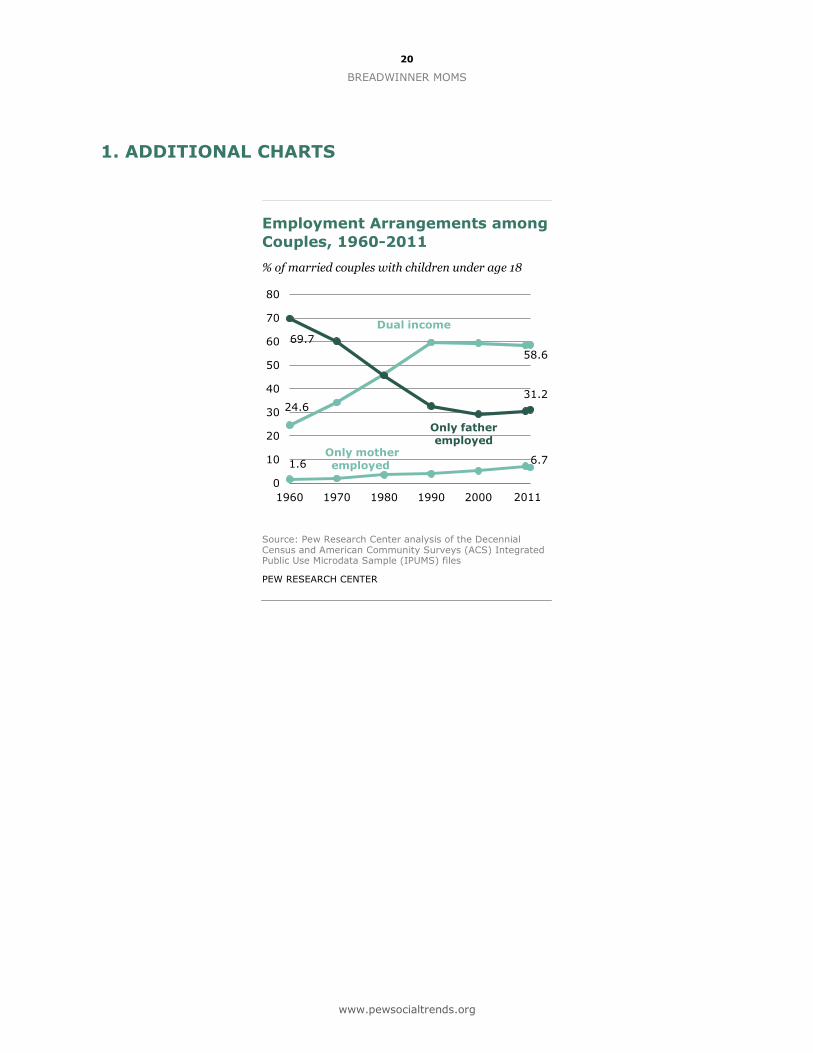
1. ADDITIONAL CHARTS
Employment Arrangements among
Couples, 1960-2011
% of married couples with children under age 18
Source: Pew Research Center analysis of the Decennial Census and American Community Surveys (ACS) Integrated Public Use Microdata Sample (IPUMS) files
PEW RESEARCH CENTER

21
PEW SOCIAL & DEMOGRAPHIC TRENDS
www.pewsocialtrends.org
$57,100
$79,800
$78,000
$70,000
$35,000
$23,000
Two Parent-Mother makes more
Two Parent-Father makes more
Two Parent-Same income
Single father
Single mother
All households with children under age 18
Family Income by Who Provides
More for the Family
Median family income in 2011
Note: Based on all families with own child(ren) under age 18 in the household.
Source: Pew Research Center analysis of 2011 American Community Survey (ACS) Integrated Public Use Microdata Sample (IPUMS) files
PEW RESEARCH CENTER
22
BREADWINNER MOMS
www.pewsocialtrends.org
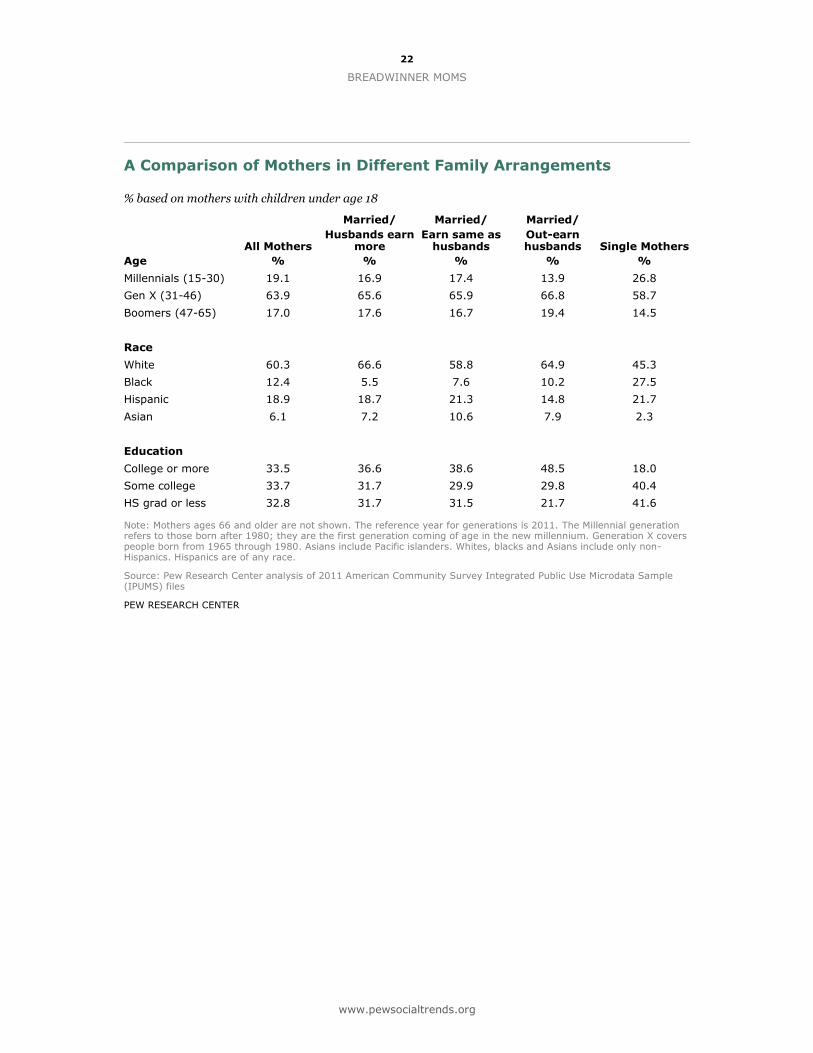
A Comparison of Mothers in Different Family Arrangements
% based on mothers with children under age 18
All Mothers
Married/
Husbands earn more
Married/
Earn same as husbands
Married/
Out-earn husbands Single Mothers
Age % % % % %
Millennials (15-30) 19.1 16.9 17.4 13.9 26.8
Gen X (31-46) 63.9 65.6 65.9 66.8 58.7
Boomers (47-65) 17.0 17.6 16.7 19.4 14.5
Race
White 60.3 66.6 58.8 64.9 45.3
Black 12.4 5.5 7.6 10.2 27.5
Hispanic 18.9 18.7 21.3 14.8 21.7
Asian 6.1 7.2 10.6 7.9 2.3
Education
College or more 33.5 36.6 38.6 48.5 18.0
Some college 33.7 31.7 29.9 29.8 40.4
HS grad or less 32.8 31.7 31.5 21.7 41.6
Note: Mothers ages 66 and older are not shown. The reference year for generations is 2011. The Millennial generation refers to those born after 1980; they are the first generation coming of age in the new millennium. Generation X covers people born from 1965 through 1980. Asians include Pacific islanders. Whites, blacks and Asians include only non-Hispanics. Hispanics are of any race.
Source: Pew Research Center analysis of 2011 American Community Survey Integrated Public Use Microdata Sample (IPUMS) files
PEW RESEARCH CENTER
23
PEW SOCIAL & DEMOGRAPHIC TRENDS
www.pewsocialtrends.org
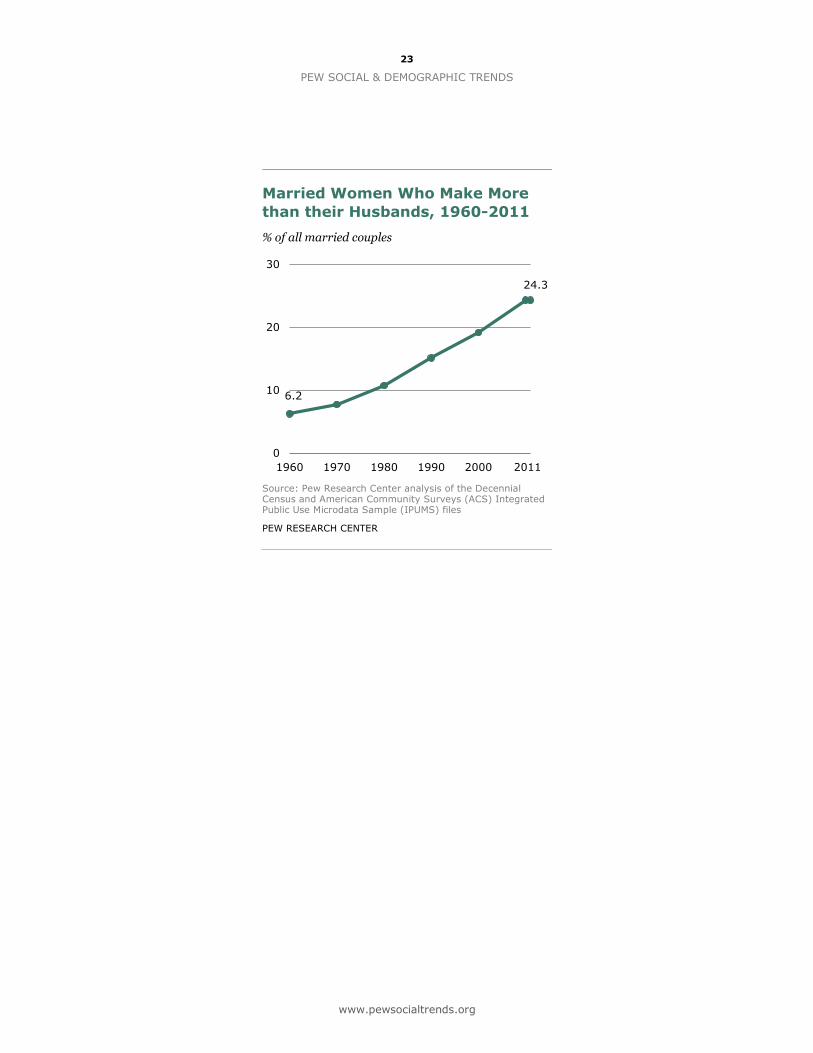
6.2
24.3
0
10
20
30
1960 1970 1980 1990 2000 2010 2011
Married Women Who Make More
than their Husbands, 1960-2011
% of all married couples
Source: Pew Research Center analysis of the Decennial Census and American Community Surveys (ACS) Integrated Public Use Microdata Sample (IPUMS) files
PEW RESEARCH CENTER
24
BREADWINNER MOMS
www.pewsocialtrends.org
2. DATA & METHODOLOGY
Decennial Census and American Community Survey
Analysis of the characteristics of mothers, married couples and newlyweds are based on the
most recent American Community Survey (ACS) data (2011). The data set was obtained from
the IPUMS-USA database26 (http://www.ipums.org/) and constructed by the Pew Research
Center.
The analysis of historical trends is based on microdata from the Decennial Censuses of 1960,
1970, 1980, 1990 and 2000 and the American Community Surveys (ACS) of 2010 and 2011.
The microdata files were obtained from the IPUMS-USA database. Data are a 1% sample of the
U.S. population for the five decennial censuses and ACS.
Except for 1960, the data are limited to the head of the household ages 15 and older. The head
of household were ages 14 and older in 1960. The spousal information is attached to the
household head if that person’s marital status is “married, spouse present.”
The American Community Survey is a household survey developed by the U.S. Census Bureau
to replace the long form of decennial census program. It is collected throughout the year using
mailed questionnaires, telephone interviews, and visits from Census Bureau field
representatives to about 3 million household addresses annually.
Parents with children under age 18: This refers to people who have at least one “own”
child under age 18 in the household. “Own” children in the Census Bureau data are biological
children, stepchildren or adopted children.
Mothers who are the sole or primary provider (Breadwinner moms): The
breadwinner mothers consist of two groups of women with children under age 18: One is
married and their income is higher than their husband’s, and the other is single (including
women who are never married, divorced, separated, widowed, and married but with spouse
absent from the household). Because the information about personal earnings (includes wages
or income from own business or farm for the previous year) was not available for samples prior
to 1990, the total personal income (INCTOT), instead of total personal earned income
(INCEARN), was used to compare the earning power between the husbands and wives.
26 Steven Ruggles, J. Trent Alexander, Katie Genadek, Ronald Goeken, Matthew B. Schroeder and Matthew Sobek. Integrated
Public Use Microdata Series: Version 5.0 [Machine-readable database]. Minneapolis: University of Minnesota, 2010.
25
PEW SOCIAL & DEMOGRAPHIC TRENDS
www.pewsocialtrends.org
According to the Census Bureau, total personal income (INCTOT) includes each respondent’s
total pre-tax personal income or losses from all sources for the previous year.
Married population: The currently married population is selected as individuals whose
marital status is “married, spouse present.” The spouse must be present in the data set to
ascertain his/her education and income information. In these data sets all married couples
consist of a man and a woman. The unit of analysis in this report is the head of the household,
the married couples in which neither of the spouses is a household head are not included in
this study. The IPUMS database includes linkages of spouse records and supplies “attached
variables” that place the value for the spouse’s variable on each record. However, for a married
person whose spouse is not in the household (married, spouse absent), the spousal information
is not available.
Newly married population: The newly married population is a subset of the currently
married population drawn from ACS 2011. Beginning in 2008, the ACS includes questions
related to date of marriage. One question asked respondents if they had been married (or
divorced or widowed) in the “past 12 months.”27 Those saying they had married are the basis
for the analyses of “newlyweds” and “new marriages” in this report.
Race and ethnicity: Unless otherwise noted, the terms “whites,” “blacks,” and “Asians”
exclude the non-Hispanic components of their populations.
Weighting: All estimates have been weighted to reflect the actual population.
Public Opinion Survey
The survey findings presented in this report are based on an omnibus survey, conducted April
25 to 28, 2013, with a nationally representative sample of 1,003 adults living in the continental
United States. Telephone interviews were conducted by landline (500) and cell phone (503,
including 237 without a landline phone). The survey was conducted by Princeton Survey
Research Associates International (PSRAI). Interviews were done in English by Princeton Data
Source. Statistical results are weighted to correct known demographic discrepancies. The
margin of sampling error for the complete set of weighted data is plus or minus 3.5 percentage
points at the 95% confidence level.
27 Because each year’s ACS is an aggregation of 12 monthly samples, responses to this question cannot be assigned to a specific
year or set of months. Thus the marriages are reported as occurring in the “previous year.”
26
BREADWINNER MOMS
www.pewsocialtrends.org
3. TOPLINE QUESTIONNAIRE
PEW SOCIAL & DEMOGRAPHIC TRENDS APRIL 2013 BREADWINNER MOTHERS OMNIBUS SURVEY
FINAL TOPLINE APRIL 25-28, 2013
TOTAL N=1,003
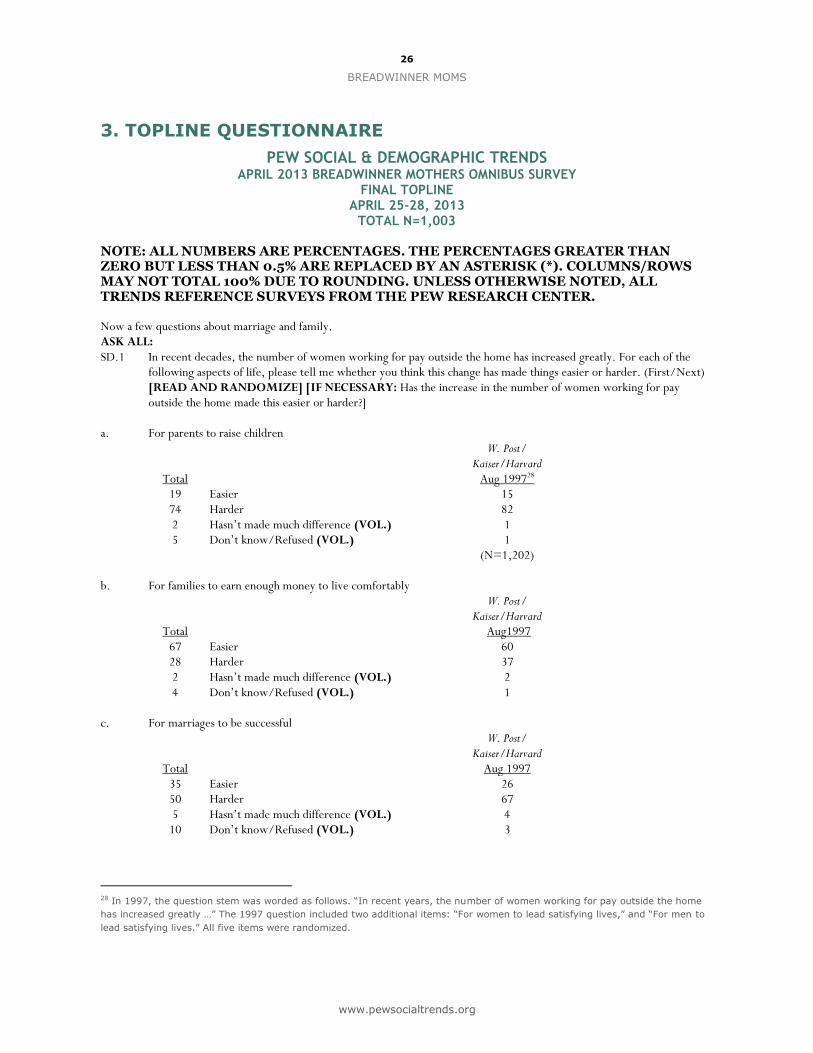
NOTE: ALL NUMBERS ARE PERCENTAGES. THE PERCENTAGES GREATER THAN ZERO BUT LESS THAN 0.5% ARE REPLACED BY AN ASTERISK (*). COLUMNS/ROWS MAY NOT TOTAL 100% DUE TO ROUNDING. UNLESS OTHERWISE NOTED, ALL TRENDS REFERENCE SURVEYS FROM THE PEW RESEARCH CENTER. Now a few questions about marriage and family. ASK ALL: SD.1 In recent decades, the number of women working for pay outside the home has increased greatly. For each of the
following aspects of life, please tell me whether you think this change has made things easier or harder. (First/Next) [READ AND RANDOMIZE] [IF NECESSARY: Has the increase in the number of women working for pay outside the home made this easier or harder?]
a. For parents to raise children
Total
W. Post/ Kaiser/Harvard
Aug 199728 19 Easier 15 74 Harder 82 2 Hasn’t made much difference (VOL.) 1 5 Don’t know/Refused (VOL.) 1 (N=1,202)
b. For families to earn enough money to live comfortably
Total
W. Post/ Kaiser/Harvard
Aug1997 67 Easier 60 28 Harder 37 2 Hasn’t made much difference (VOL.) 2 4 Don’t know/Refused (VOL.) 1
c. For marriages to be successful
Total
W. Post/ Kaiser/Harvard
Aug 1997 35 Easier 26 50 Harder 67 5 Hasn’t made much difference (VOL.) 4
10 Don’t know/Refused (VOL.) 3
28 In 1997, the question stem was worded as follows. “In recent years, the number of women working for pay outside the home
has increased greatly …” The 1997 question included two additional items: “For women to lead satisfying lives,” and “For men to
lead satisfying lives.” All five items were randomized.
27
PEW SOCIAL & DEMOGRAPHIC TRENDS
www.pewsocialtrends.org
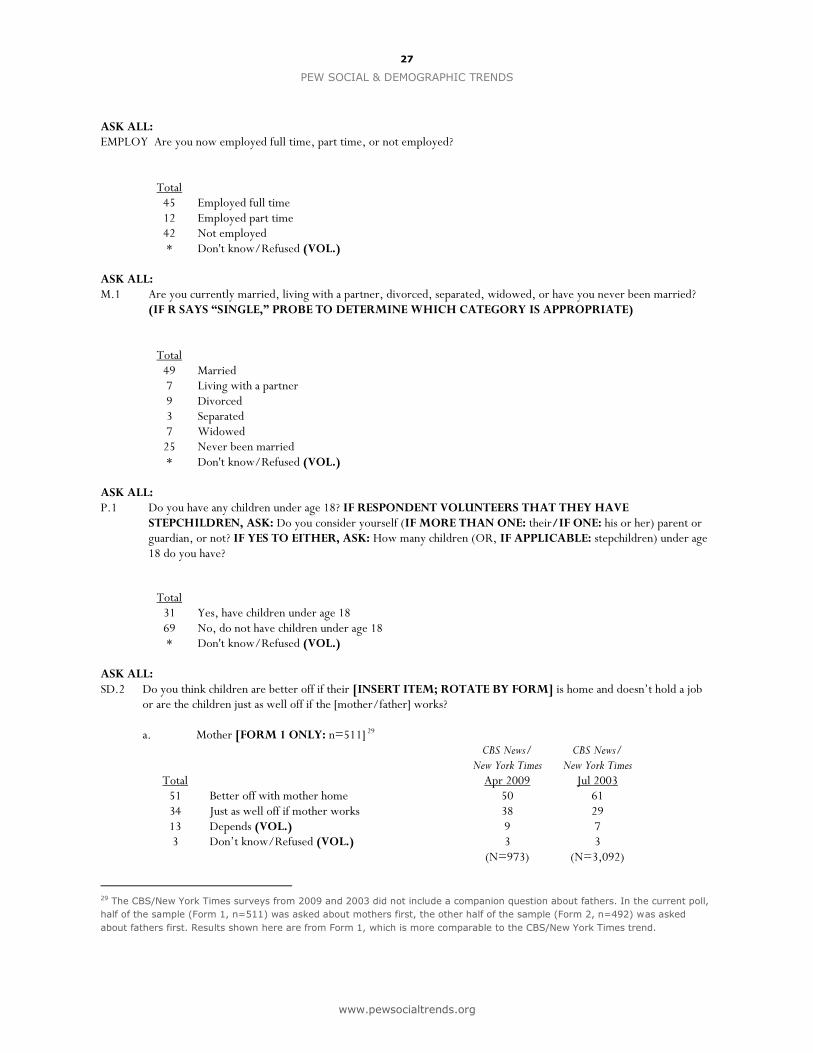
ASK ALL: EMPLOY Are you now employed full time, part time, or not employed?
Total
45 Employed full time 12 Employed part time 42 Not employed * Don't know/Refused (VOL.)
ASK ALL: M.1 Are you currently married, living with a partner, divorced, separated, widowed, or have you never been married?
(IF R SAYS “SINGLE,” PROBE TO DETERMINE WHICH CATEGORY IS APPROPRIATE)
Total
49 Married 7 Living with a partner 9 Divorced 3 Separated 7 Widowed
25 Never been married * Don't know/Refused (VOL.)
ASK ALL: P.1 Do you have any children under age 18? IF RESPONDENT VOLUNTEERS THAT THEY HAVE
STEPCHILDREN, ASK: Do you consider yourself (IF MORE THAN ONE: their/IF ONE: his or her) parent or guardian, or not? IF YES TO EITHER, ASK: How many children (OR, IF APPLICABLE: stepchildren) under age 18 do you have?
Total
31 Yes, have children under age 18 69 No, do not have children under age 18 * Don't know/Refused (VOL.)
ASK ALL: SD.2 Do you think children are better off if their [INSERT ITEM; ROTATE BY FORM] is home and doesn’t hold a job
or are the children just as well off if the [mother/father] works? a. Mother [FORM 1 ONLY: n=511] 29
Total
CBS News/ New York Times
Apr 2009
CBS News/ New York Times
Jul 2003 51 Better off with mother home 50 61 34 Just as well off if mother works 38 29 13 Depends (VOL.) 9 7 3 Don’t know/Refused (VOL.) 3 3 (N=973) (N=3,092)
29 The CBS/New York Times surveys from 2009 and 2003 did not include a companion question about fathers. In the current poll,
half of the sample (Form 1, n=511) was asked about mothers first, the other half of the sample (Form 2, n=492) was asked
about fathers first. Results shown here are from Form 1, which is more comparable to the CBS/New York Times trend.
28
BREADWINNER MOMS
www.pewsocialtrends.org
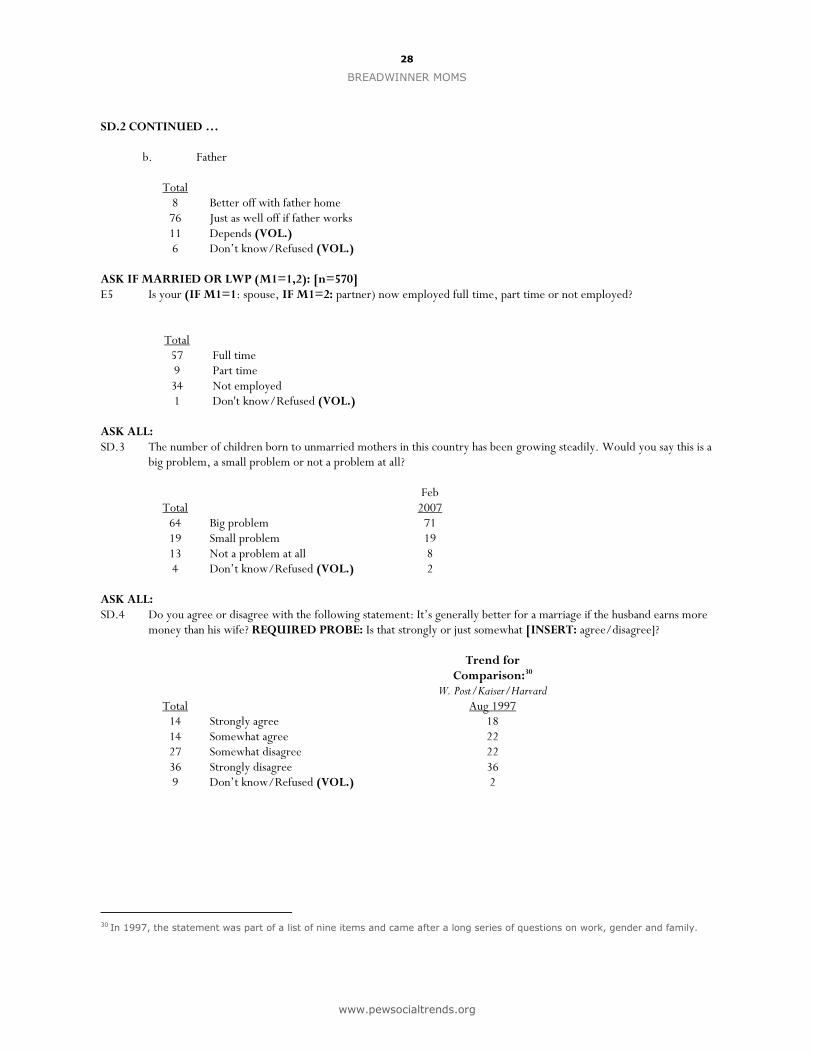
SD.2 CONTINUED … b. Father
Total 8 Better off with father home
76 Just as well off if father works 11 Depends (VOL.) 6 Don’t know/Refused (VOL.)
ASK IF MARRIED OR LWP (M1=1,2): [n=570] E5 Is your (IF M1=1: spouse, IF M1=2: partner) now employed full time, part time or not employed?
Total
57 Full time 9 Part time
34 Not employed 1 Don't know/Refused (VOL.)
ASK ALL: SD.3 The number of children born to unmarried mothers in this country has been growing steadily. Would you say this is a
big problem, a small problem or not a problem at all?
Total
Feb 2007
64 Big problem 71 19 Small problem 19 13 Not a problem at all 8 4 Don’t know/Refused (VOL.) 2
ASK ALL: SD.4 Do you agree or disagree with the following statement: It’s generally better for a marriage if the husband earns more
money than his wife? REQUIRED PROBE: Is that strongly or just somewhat [INSERT: agree/disagree]?
Total
Trend for Comparison:30
W. Post/Kaiser/Harvard Aug 1997
14 Strongly agree 18 14 Somewhat agree 22 27 Somewhat disagree 22 36 Strongly disagree 36 9 Don’t know/Refused (VOL.) 2
30 In 1997, the statement was part of a list of nine items and came after a long series of questions on work, gender and family.


