
SAFE HARBOR STATEMENTForward-looking statements in this presentation are made pursuant to the "safe harbor" provisions of
the U.S. Private Securities Litigation Reform Act of 1995 and applicable Canadian securities laws.
When used herein, words such as "expect", "anticipate", "estimate", "may", "will", "should", “could”,
"intend", "believe", and similar expressions, are intended to identify forward-looking statements.
Forward-looking statements are based on estimates and assumptions made by BlackBerry Limited in
light of its experience and its perception of historical trends, current conditions and expected future
developments, as well as other factors that BlackBerry believes are appropriate in the circumstances.
Many factors could cause BlackBerry's actual results, performance or achievements to differ materially
from those expressed or implied by the forward-looking statements, including those described in the
"Risk Factors" section of BlackBerry's Annual Information Form, which is included in its Annual Report
on Form 40-F (copies of which filings may be obtained at www.sedar.com or www.sec.gov). These
factors should be considered carefully, and readers should not place undue reliance on BlackBerry's
forward-looking statements. BlackBerry has no intention and undertakes no obligation to update or
revise any forward-looking statements, whether as a result of new information, future events or
otherwise, except as required by law. BlackBerry and related trademarks, names and logos are the
property of BlackBerry Limited and are registered and/or used in the U.S. and countries around the
world. All other marks are the property of their respective owners. BlackBerry is not responsible for
any third-party products or services.

© 2018 BlackBerry. All Rights Reserved. 3
3
STRATEGY

© 2018 BlackBerry. All Rights Reserved. 4
4
OUR VISION A connected world, in which you are safe
and your data is yours
OUR MISSION To be the world’s leading provider of end-to-end
mobility solutions that are the most secure and trusted
OUR VALUE PROPOSITION BlackBerry provides the secure and trusted foundation
for the Enterprise of Things

OUR STRATEGY Four synergistic growth engines, delivering the most secure
and comprehensive Enterprise of Things (EoT)
Endpoint management
Embedded software
Appliances
Technology & IP licensing
2
3
4
1
© 2018 BlackBerry. All Rights Reserved. 6
6
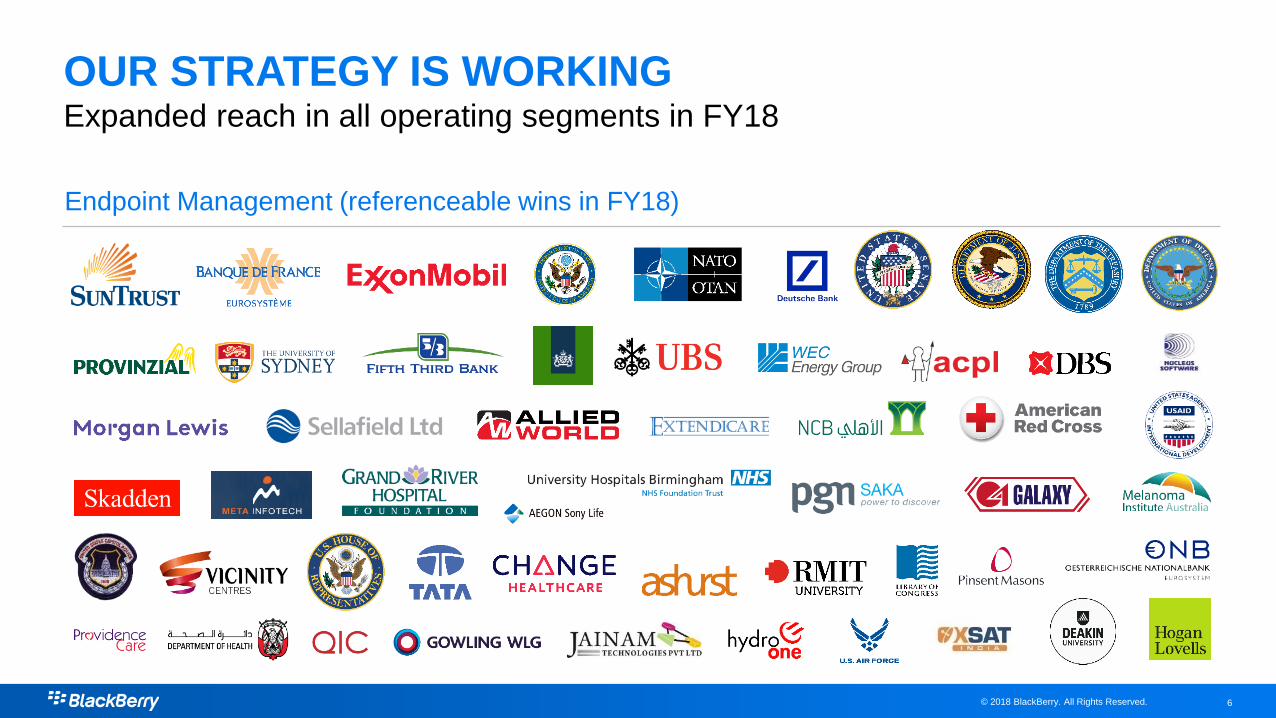
OUR STRATEGY IS WORKINGExpanded reach in all operating segments in FY18
Endpoint Management (referenceable wins in FY18)

© 2018 BlackBerry. All Rights Reserved. 7
7
OUR STRATEGY IS WORKINGExpanded reach in all operating segments in FY18
Embedded Software & Asset Tracking (referenceable wins in FY18)
Technology & IP Licensing (referenceable wins in FY18)
© 2018 BlackBerry. All Rights Reserved. 8
8
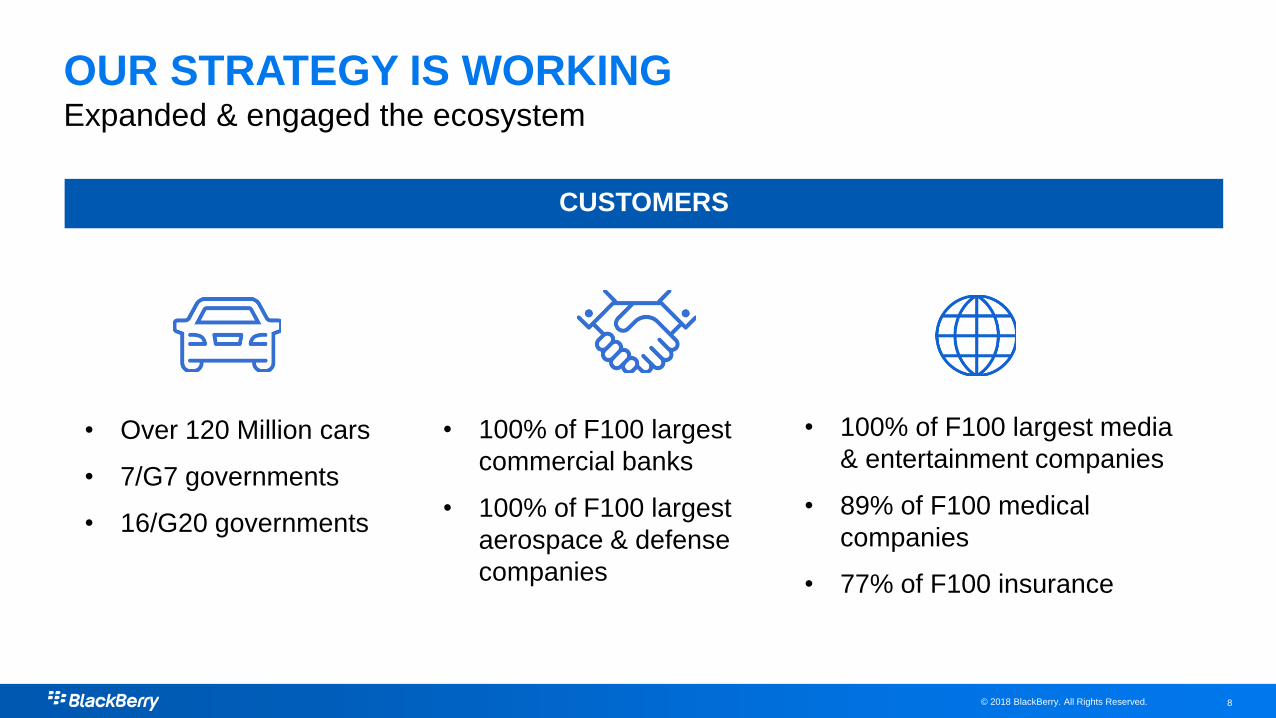
OUR STRATEGY IS WORKINGExpanded & engaged the ecosystem
CUSTOMERS
• Over 120 Million cars
• 7/G7 governments
• 16/G20 governments
• 100% of F100 largest
commercial banks
• 100% of F100 largest
aerospace & defense
companies
• 100% of F100 largest media
& entertainment companies
• 89% of F100 medical
companies
• 77% of F100 insurance
companies

© 2018 BlackBerry. All Rights Reserved. 9
9
OUR STRATEGY IS WORKINGExpanded & engaged the ecosystem
Channels
• 32% YoY growth in
enterprise channels
• 18% YoY growth in BTS
channels
• Expansion of reach into new
industries including
construction, robotics &
subsea
Developers
• 25% YoY growth in ISV
partners
• 29% YoY growth in
BlackBerry enterprise apps
marketplace
• 2.6M BlackBerry Dynamics
apps licenses
Engagement
• 167% growth in BlackBerry
Security Summit attendance
• BlackBerry Analyst Day
sold-out
• First BlackBerry Secure
world tour
GO TO MARKET

OUR STRATEGY IS WORKINGOur security & mobility leadership is recognized by the industry
Named BlackBerry the highest scoring vendor in
all six categories of their critical capabilities for
high-security mobility management report.
Named BlackBerry the highest scoring vendor in
workforce productivity & centralized content
protection, in their content collaboration critical
capabilities report.
Named BlackBerry a leader in their Magic
Quadrant for EMM Suites BlackBerry is the only
vendor with positive movement in both vision &
ability to execute.
Named BlackBerry a leader in their Market Guide
for Information-Centric Endpoint & Mobile
Protection. BlackBerry is the only vendor they
recognized in all eight categories with a single-
platform offering.
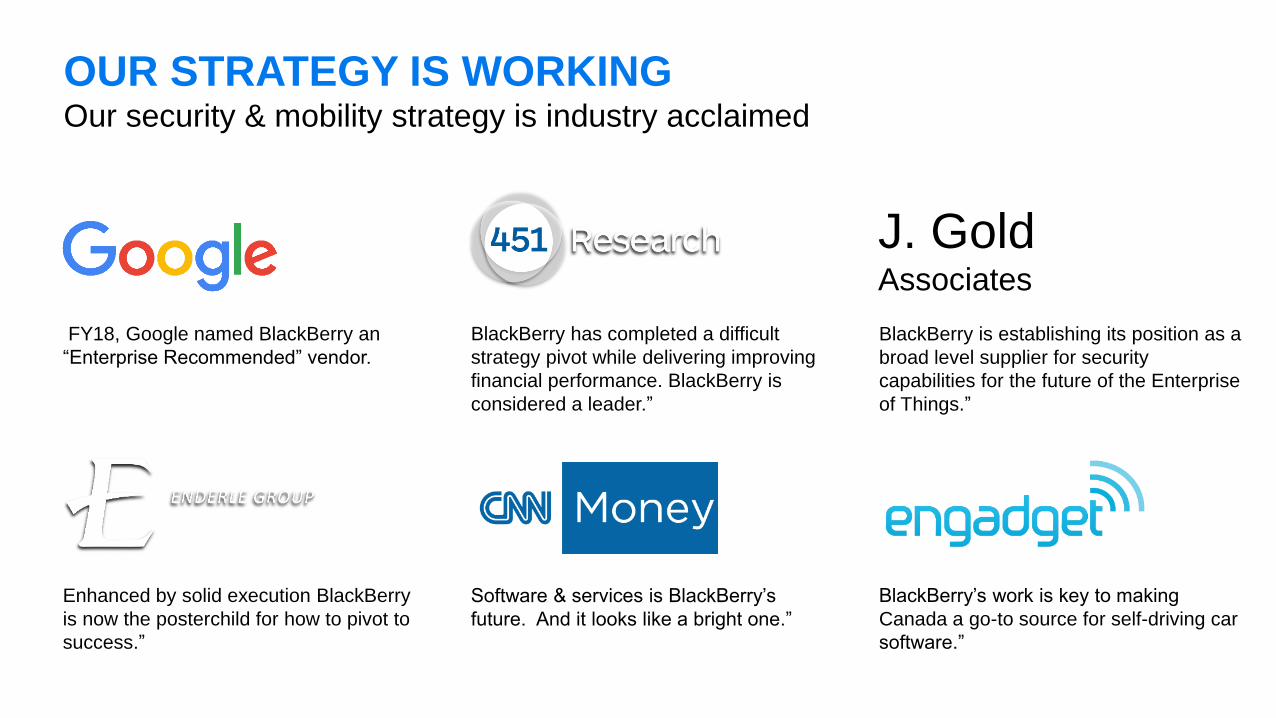
OUR STRATEGY IS WORKINGOur security & mobility strategy is industry acclaimed
IFY18, Google named BlackBerry an
“Enterprise Recommended” vendor.
BlackBerry has completed a difficult
strategy pivot while delivering improving
financial performance. BlackBerry is
considered a leader.”
BlackBerry is establishing its position as a
broad level supplier for security
capabilities for the future of the Enterprise
of Things.”
Enhanced by solid execution BlackBerry
is now the posterchild for how to pivot to
success.”
Software & services is BlackBerry’s
future. And it looks like a bright one.”
BlackBerry’s work is key to making
Canada a go-to source for self-driving car
software.”
J. GoldAssociates

© 2018 BlackBerry. All Rights Reserved. 12
12
WE ARE WELL POSITIONED FOR GROWTHThe Enterprise of Things era is upon us
Consumer
EoT
$1.29T by 2020
Connected Things
By 2021
51.5B56% CAGR
Exabytes data
By 2020
52,00051% CAGR
… & SECURITY IS THE #1 TECHNICAL BARRIER TO SUCCESS
THE NUMBER OF CONNECTED ‘THINGS’ IS
GROWING RAPIDLY …
… MOST OF THE SPEND ON ‘THINGS’
WILL BE IN EOT ...
Sources: Juniper Research, McKinsey Global Institute, IDC, Gartner
© 2018 BlackBerry. All Rights Reserved. 13
13
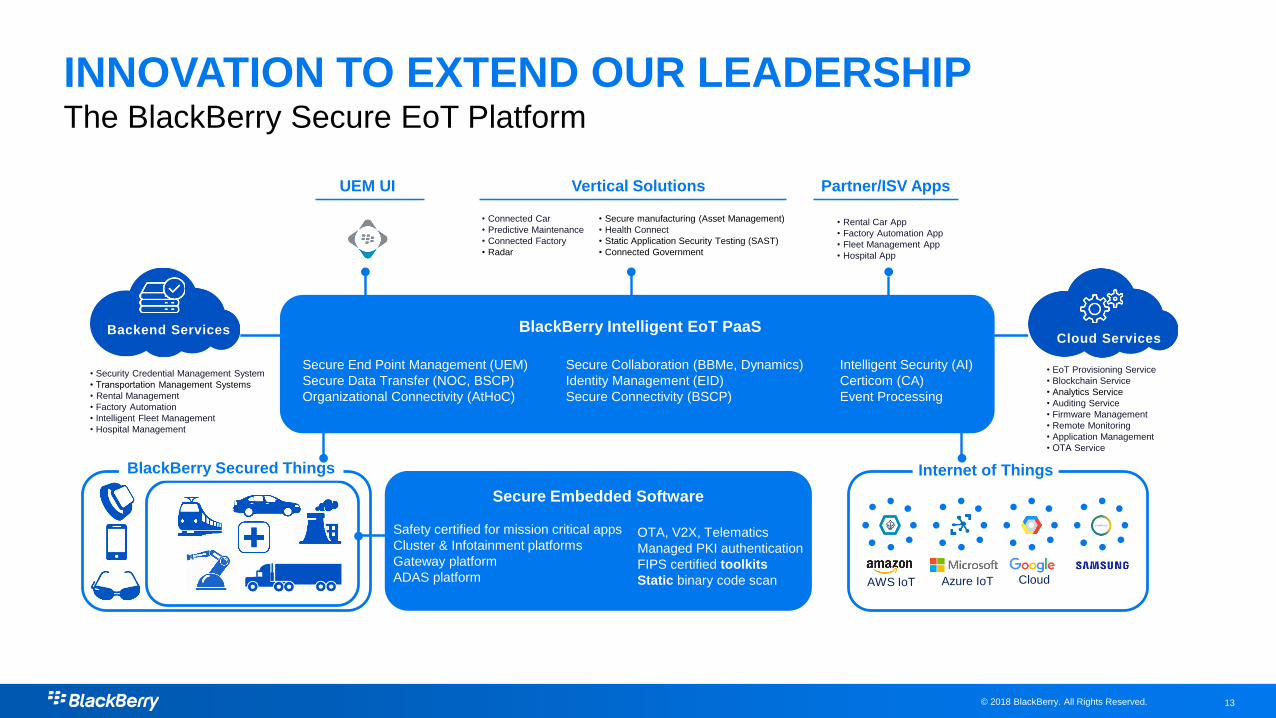
INNOVATION TO EXTEND OUR LEADERSHIPThe BlackBerry Secure EoT Platform
BlackBerry Secured Things
Secure End Point Management (UEM)
Secure Data Transfer (NOC, BSCP)
Organizational Connectivity (AtHoC)
Secure Collaboration (BBMe, Dynamics)
Identity Management (EID)
Secure Connectivity (BSCP)
BlackBerry Intelligent EoT PaaS
• EoT Provisioning Service
• Blockchain Service
• Analytics Service
• Auditing Service
• Firmware Management
• Remote Monitoring
• Application Management
• OTA Service
UEM UI
• Rental Car App
• Factory Automation App
• Fleet Management App
• Hospital App
Partner/ISV AppsVertical Solutions
• Connected Car
• Predictive Maintenance
• Connected Factory
• Radar
• Security Credential Management System
• Transportation Management Systems
• Rental Management
• Factory Automation
• Intelligent Fleet Management
• Hospital Management
Cloud Services
Safety certified for mission critical apps
Cluster & Infotainment platforms
Gateway platform
ADAS platform
Secure Embedded Software
OTA, V2X, Telematics
Managed PKI authentication
FIPS certified toolkits
Static binary code scan
Backend Services
Intelligent Security (AI)
Certicom (CA)
Event Processing
CloudAWS IoT Azure IoT
Internet of Things
• Secure manufacturing (Asset Management)
• Health Connect
• Static Application Security Testing (SAST)
• Connected Government

© 2018 BlackBerry. All Rights Reserved. 14
14
FINANCIALS

15© 2018 BlackBerry. All Rights Reserved.
BUSINESS OUTLOOK
• Market leader in operating system
for Auto where reliability and
security are most demanding.
• Innovation in new products for Auto
and related industries (Jarvis and
Radar)
• Increase presence in Asia – Korea,
Japan, China
• Expand RADAR partnerships to
Europe
• Build out Jarvis sales team
• Market leader in EMM - strong
base in security conscious
industries
• Growth through consolidation,
new logos and upselling of new
products
• Expand strategic partnerships
• Grow cybersecurity services
• Patent licensing remains the current
backbone as we build out Licensing
business for devices and EoT
• Support and extend smartphone
manufacturers
• Extend reach into consumer and
commercial EoT supported devices
• Patent monetization
BlackBerry Technology SolutionsEnterprise Licensing
BlackBerry
Steady revenue improvement,
access to enterprise clients
Double digit revenue growth,
increasing momentum
Continuous revenue improvement,
strong future in EoT

© 2018 BlackBerry. All Rights Reserved. 16
16
KEY OBJECTIVES FOR FY19 AND BEYOND
Double-digit growth in software
and services billings
Positive EPS
Positive cash flows from
continuing operations
Continue to drive toward our
timeless model
Accelerated growth from EoT
Recurring software & services revenue
~90%
Gross margin ~80-85%
Operating Income ~20-25%
Adjusted EBITDA ~25-30%
Continue building momentum Timeless model
Note: Non-GAAP Financials
FY18 results
Recurring software & services
revenue ~75%
Gross margin 75%
Operating Income 8%
Adjusted EBITDA 17%
Current performance
© 2018 BlackBerry. All Rights Reserved. 17
17
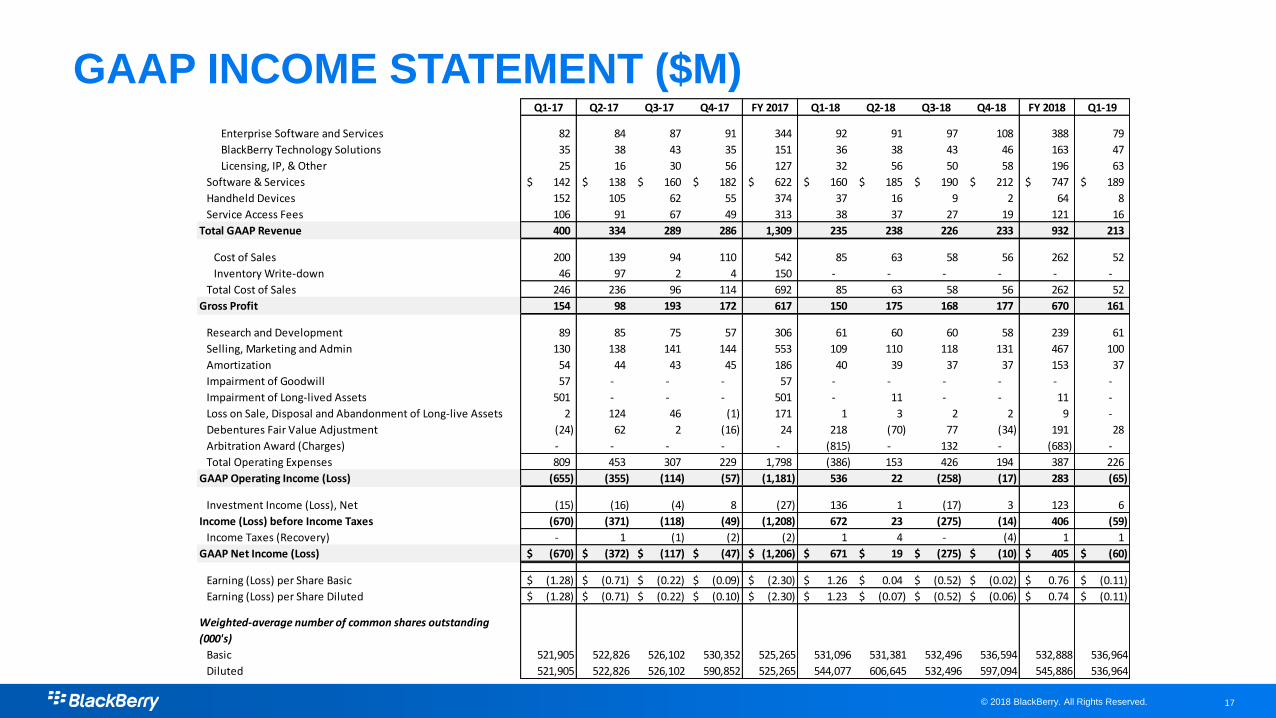
GAAP INCOME STATEMENT ($M)Q1-17 Q2-17 Q3-17 Q4-17 FY 2017 Q1-18 Q2-18 Q3-18 Q4-18 FY 2018 Q1-19
Enterprise Software and Services 82 84 87 91 344 92 91 97 108 388 79
BlackBerry Technology Solutions 35 38 43 35 151 36 38 43 46 163 47
Licensing, IP, & Other 25 16 30 56 127 32 56 50 58 196 63
Software & Services 142$ 138$ 160$ 182$ 622$ 160$ 185$ 190$ 212$ 747$ 189$
Handheld Devices 152 105 62 55 374 37 16 9 2 64 8
Service Access Fees 106 91 67 49 313 38 37 27 19 121 16
Total GAAP Revenue 400 334 289 286 1,309 235 238 226 233 932 213
Cost of Sales 200 139 94 110 542 85 63 58 56 262 52
Inventory Write-down 46 97 2 4 150 - - - - - -
Total Cost of Sales 246 236 96 114 692 85 63 58 56 262 52
Gross Profit 154 98 193 172 617 150 175 168 177 670 161
Research and Development 89 85 75 57 306 61 60 60 58 239 61
Selling, Marketing and Admin 130 138 141 144 553 109 110 118 131 467 100
Amortization 54 44 43 45 186 40 39 37 37 153 37
Impairment of Goodwill 57 - - - 57 - - - - - -
Impairment of Long-lived Assets 501 - - - 501 - 11 - - 11 -
Loss on Sale, Disposal and Abandonment of Long-live Assets 2 124 46 (1) 171 1 3 2 2 9 -
Debentures Fair Value Adjustment (24) 62 2 (16) 24 218 (70) 77 (34) 191 28
Arbitration Award (Charges) - - - - - (815) - 132 - (683) -
Total Operating Expenses 809 453 307 229 1,798 (386) 153 426 194 387 226
GAAP Operating Income (Loss) (655) (355) (114) (57) (1,181) 536 22 (258) (17) 283 (65)
Investment Income (Loss), Net (15) (16) (4) 8 (27) 136 1 (17) 3 123 6
Income (Loss) before Income Taxes (670) (371) (118) (49) (1,208) 672 23 (275) (14) 406 (59)
Income Taxes (Recovery) - 1 (1) (2) (2) 1 4 - (4) 1 1
GAAP Net Income (Loss) (670)$ (372)$ (117)$ (47)$ (1,206)$ 671$ 19$ (275)$ (10)$ 405$ (60)$
Earning (Loss) per Share Basic (1.28)$ (0.71)$ (0.22)$ (0.09)$ (2.30)$ 1.26$ 0.04$ (0.52)$ (0.02)$ 0.76$ (0.11)$
Earning (Loss) per Share Diluted (1.28)$ (0.71)$ (0.22)$ (0.10)$ (2.30)$ 1.23$ (0.07)$ (0.52)$ (0.06)$ 0.74$ (0.11)$
Weighted-average number of common shares outstanding
(000's)
Basic 521,905 522,826 526,102 530,352 525,265 531,096 531,381 532,496 536,594 532,888 536,964
Diluted 521,905 522,826 526,102 590,852 525,265 544,077 606,645 532,496 597,094 545,886 536,964

© 2018 BlackBerry. All Rights Reserved. 18
18
NON-GAAP RECONCILIATION ($M)Non-GAAP Adjustments (Pre-Tax and After-Tax) Q1-17 Q2-17 Q3-17 Q4-17 FY 2017 Q1-18 Q2-18 Q3-18 Q4-18 FY 2018 Q1-19
LLA Impairment Charges 501 - - - 501 - 11 - - 11 -
Selective Patent Abandonment 2 - 1 1 4 1 2 - 2 4 -
Goodwill Impairment Charges 57 - - - 57 - - - - - -
Inventory Write-down 41 96 - 4 141 - - - - - -
Debentures Fair Value Adjustment (24) 62 2 (16) 24 218 (70) 77 (34) 191 28
Write-down of Assets Held for Sale - 123 42 - 165 - - - - - -
RAP Changes 23 24 23 24 95 16 16 20 26 78 4
CORE Program Recoveries (2) (2) (2) - (7) - - - - - -
Software Deferred Revenue Acquired 24 18 12 11 65 9 11 9 6 35 4
Stock Compensation Expense 12 18 15 15 60 13 12 12 13 49 18
Acquired Intangible Amortization 28 28 28 28 112 25 24 23 22 95 22
Business Acquisition and Integration Costs 7 4 5 3 19 11 1 1 - 14 1
Arbitration Charges (Awards) - - - - - (954) - 149 (1) (806) -
Legacy Royalty Adjustments - - - - - - - - 1 1 -
Total Non-GAAP Adjustment (Pre-Tax and After-Tax) 669$ 371$ 126$ 70$ 1,236$ (661)$ 7$ 291$ 35$ (328)$ 77$
GAAP to non-GAAP Gross Profit Q1-17 Q2-17 Q3-17 Q4-17 FY 2017 Q1-18 Q2-18 Q3-18 Q4-18 FY 2018 Q1-19
GAAP Revenue 400$ 334$ 289$ 286$ 1,309$ 235$ 238$ 226$ 233$ 932$ 213$
Software Deferred Revenue Acquired 24 18 12 11 65 9 11 9 6 35 4
Non-GAAP Revenue 424 352 301 297 1,374 244 249 235 239 967 217
GAAP Cost of Sales 246 236 96 114 692 85 63 58 56 262 52
Non-GAAP Adjustments to Cost of Sales (48) (103) (5) (11) (167) (4) (4) (3) (5) (16) (1)
Non-GAAP Cost of Sales 198 133 91 103 525 81 59 55 51 246 51
Non-GAAP Gross Profit 226 219 210 194 849 163 190 180 188 721 166
© 2018 BlackBerry. All Rights Reserved. 19
19
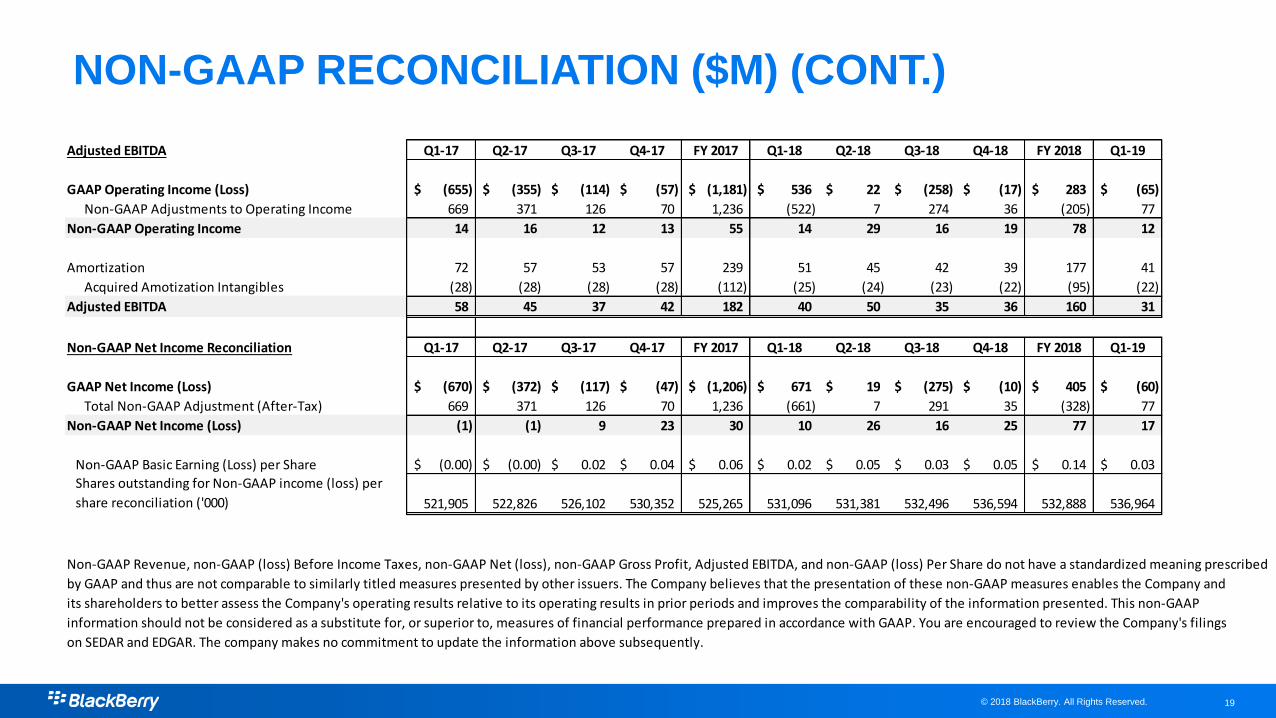
NON-GAAP RECONCILIATION ($M) (CONT.)
Adjusted EBITDA Q1-17 Q2-17 Q3-17 Q4-17 FY 2017 Q1-18 Q2-18 Q3-18 Q4-18 FY 2018 Q1-19
GAAP Operating Income (Loss) (655)$ (355)$ (114)$ (57)$ (1,181)$ 536$ 22$ (258)$ (17)$ 283$ (65)$
Non-GAAP Adjustments to Operating Income 669 371 126 70 1,236 (522) 7 274 36 (205) 77
Non-GAAP Operating Income 14 16 12 13 55 14 29 16 19 78 12
Amortization 72 57 53 57 239 51 45 42 39 177 41
Acquired Amotization Intangibles (28) (28) (28) (28) (112) (25) (24) (23) (22) (95) (22)
Adjusted EBITDA 58 45 37 42 182 40 50 35 36 160 31
Non-GAAP Net Income Reconciliation Q1-17 Q2-17 Q3-17 Q4-17 FY 2017 Q1-18 Q2-18 Q3-18 Q4-18 FY 2018 Q1-19
GAAP Net Income (Loss) (670)$ (372)$ (117)$ (47)$ (1,206)$ 671$ 19$ (275)$ (10)$ 405$ (60)$
Total Non-GAAP Adjustment (After-Tax) 669 371 126 70 1,236 (661) 7 291 35 (328) 77
Non-GAAP Net Income (Loss) (1) (1) 9 23 30 10 26 16 25 77 17
Non-GAAP Basic Earning (Loss) per Share (0.00)$ (0.00)$ 0.02$ 0.04$ 0.06$ 0.02$ 0.05$ 0.03$ 0.05$ 0.14$ 0.03$
Shares outstanding for Non-GAAP income (loss) per
share reconciliation ('000) 521,905 522,826 526,102 530,352 525,265 531,096 531,381 532,496 536,594 532,888 536,964
Non-GAAP Revenue, non-GAAP (loss) Before Income Taxes, non-GAAP Net (loss), non-GAAP Gross Profit, Adjusted EBITDA, and non-GAAP (loss) Per Share do not have a standardized meaning prescribed
by GAAP and thus are not comparable to similarly titled measures presented by other issuers. The Company believes that the presentation of these non-GAAP measures enables the Company and
its shareholders to better assess the Company's operating results relative to its operating results in prior periods and improves the comparability of the information presented. This non-GAAP
information should not be considered as a substitute for, or superior to, measures of financial performance prepared in accordance with GAAP. You are encouraged to review the Company's filings
on SEDAR and EDGAR. The company makes no commitment to update the information above subsequently.

© 2018 BlackBerry. All Rights Reserved. 20
20
AMORTIZATION AND RECONCILIATION DETAILS ($M)CORE Charges (Recovery) Details Q1-17 Q2-17 Q3-17 Q4-17 FY 2017 Q1-18 Q2-18 Q3-18 Q4-18 FY 2018 Q1-19
Cost of Sales -$ -$ -$ -$ -$ -$ -$ -$ -$ -$ -$
Research and Development - - - - - - - - - - -
Selling, General and Administration (2) (2) (2) - (7) - - - - - -
Total CORE Charges (2)$ (2)$ (2)$ -$ (7)$ -$ -$ -$ -$ -$ -$
RAP Charges Details (Pre-Tax) Q1-17 Q2-17 Q3-17 Q4-17 FY 2017 Q1-18 Q2-18 Q3-18 Q4-18 FY 2018 Q1-19
Cost of Sales 7$ 7$ 5$ 6$ 25$ 3$ 3$ 2$ 3$ 11$ -$
Research and Development 2 - (1) 3 4 3 1 1 - 5 2
Selling, General and Administration 14 17 19 15 66 10 12 17 23 62 2
Total RAP Charges 23$ 24$ 23$ 24$ 95$ 16$ 16$ 20$ 26$ 78$ 4$
Amortization of Intangibles and PP&E Details Q1-17 Q2-17 Q3-17 Q4-17 FY 2017 Q1-18 Q2-18 Q3-18 Q4-18 FY 2018 Q1-19
In Cost of Sales
Property, Plan and Equipment 12$ 12$ 10$ 9$ 43$ 7$ 4$ 5$ 2$ 18$ 2$
Intangibles Assets 6 1 - 3 10 4 2 - - 6 2
Total in Cost of Sales 18 13 10 12 53 11 6 5 2 24 4
In Operating Expenses
Property, Plan and Equipment 12$ 8$ 6$ 7$ 33$ 5$ 5$ 3$ 5$ 18$ 3$
Intangibles Assets 42 36 37 38 153 35 34 34 32 135 34
Total in Operating Expenses 54 44 43 45 186 40 39 37 37 153 37
Total Amortization
Property, Plan and Equipment 24$ 20$ 16$ 16$ 76$ 12$ 9$ 8$ 7$ 36$ 5$
Intangibles Assets 48 37 37 41 163 39 36 34 32 141 36
Total Amortization 72 57 53 57 239 51 45 42 39 177 41
Non-GAAP Revenue, non-GAAP (loss) Before Income Taxes, non-GAAP Net (loss), non-GAAP Gross Profit, Adjusted EBITDA, and non-GAAP (loss) Per Share do not have a standardized meaning
prescribed by GAAP and thus are not comparable to similarly titled measures presented by other issuers. The Company believes that the presentation of these non-GAAP measures enables the
Company and its shareholders to better assess the Company's operating results relative to its operating results in prior periods and improves the comparability of the information presented.
This non-GAAP information should not be considered as a substitute for, or superior to, measures of financial performance prepared in accordance with GAAP. You are encouraged to review
the Company's filings on SEDAR and EDGAR. The company makes no commitment to update the information above subsequently.

© 2018 BlackBerry. All Rights Reserved. 21
21
OUR MANAGEMENT TEAM
Mark WilsonChief Marketing Officer
John ChenChief Executive Officer &
Executive Chair
Steve CapelliChief Financial Officer & Chief
Operating Officer
Steve E. ZippersteinChief Legal Officer
Carl WiesePresident, Global Sales
Billy HoEVP, Enterprise Products
and VAS
Nita White-IvyEVP, Human Resources
Sandeep ChennakeshuPresident, BlackBerry Technology
Solutions
Vito GiallorenzoSVP, Corporate
Development & Strategic
Partnerships
Alex ThurberSVP and GM,
Mobility Solutions
Charles EaganChief Technology
Officer

THANK YOU


