
For all Queensland schools
2015 Senior External Examination
Biology Monday 9 November 2015
Paper One — Question and response book 9 am to 11:40 am
Time allowed
• Perusal time: 10 minutes
• Working time: 2 hours 30 minutes
Examination materials provided
• Paper One — Question and response book
• Notepaper
Equipment/materials allowed
• QCAA-approved equipment
• non-programmable calculator
• one A4 sheet of EBI question topic research notes
Directions
Do not write in this book during perusal time.
Paper One has three parts:
• Part A — Cell structure and function
• Part B — Physiology of organisms
• Part C — Organisms and ecosystems
Attempt all questions.
Suggested time allocation
• Part A: 40 minutes
• Part B: 55 minutes
• Part C: 55 minutes
Assessment
Paper One assesses the following assessment criteria:
• Understanding biology (UB)
• Investigating biology (IB)
• Evaluating biological issues (EBI)
Assessment standards are at the end of this book.
After the examination session
The supervisor will collect this book.
Take your research notes when you leave for use in Paper Two.
––
Candidate use
Print your candidate number here
Attach barcode here
Number of books used
1 5
Supervisor use only
QCAA use only
Supervisor’s initials
Marker number

Planning space
Part A — Cell structure and function
Questions 1–6 assess Understanding biology (UB) and Investigating biology (IB).
Attempt all questions. Write your responses in the spaces provided.
Suggested time allocation: 40 minutes.
Question 1 (UB)
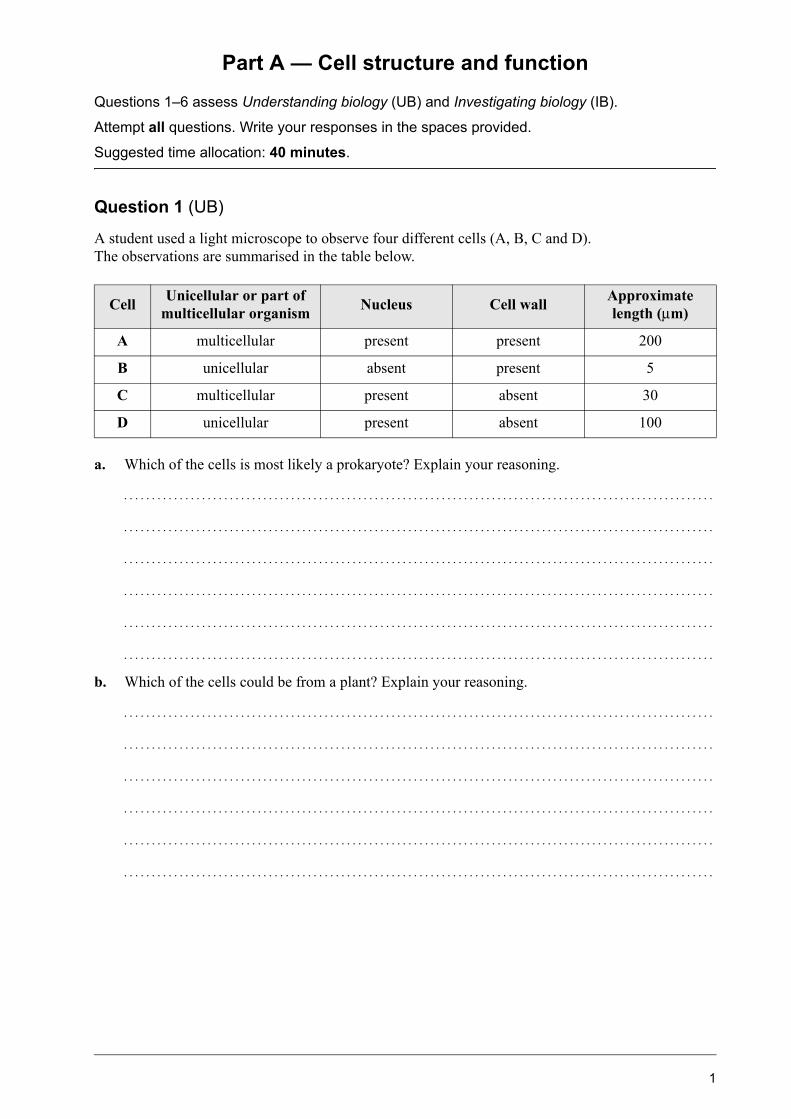
A student used a light microscope to observe four different cells (A, B, C and D).The observations are summarised in the table below.
a. Which of the cells is most likely a prokaryote? Explain your reasoning.
..........................................................................................................
..........................................................................................................
..........................................................................................................
..........................................................................................................
..........................................................................................................
..........................................................................................................
b. Which of the cells could be from a plant? Explain your reasoning.
..........................................................................................................
..........................................................................................................
..........................................................................................................
..........................................................................................................
..........................................................................................................
..........................................................................................................
CellUnicellular or part of
multicellular organismNucleus Cell wall
Approximate length (m)
A multicellular present present 200
B unicellular absent present 5
C multicellular present absent 30
D unicellular present absent 100
1
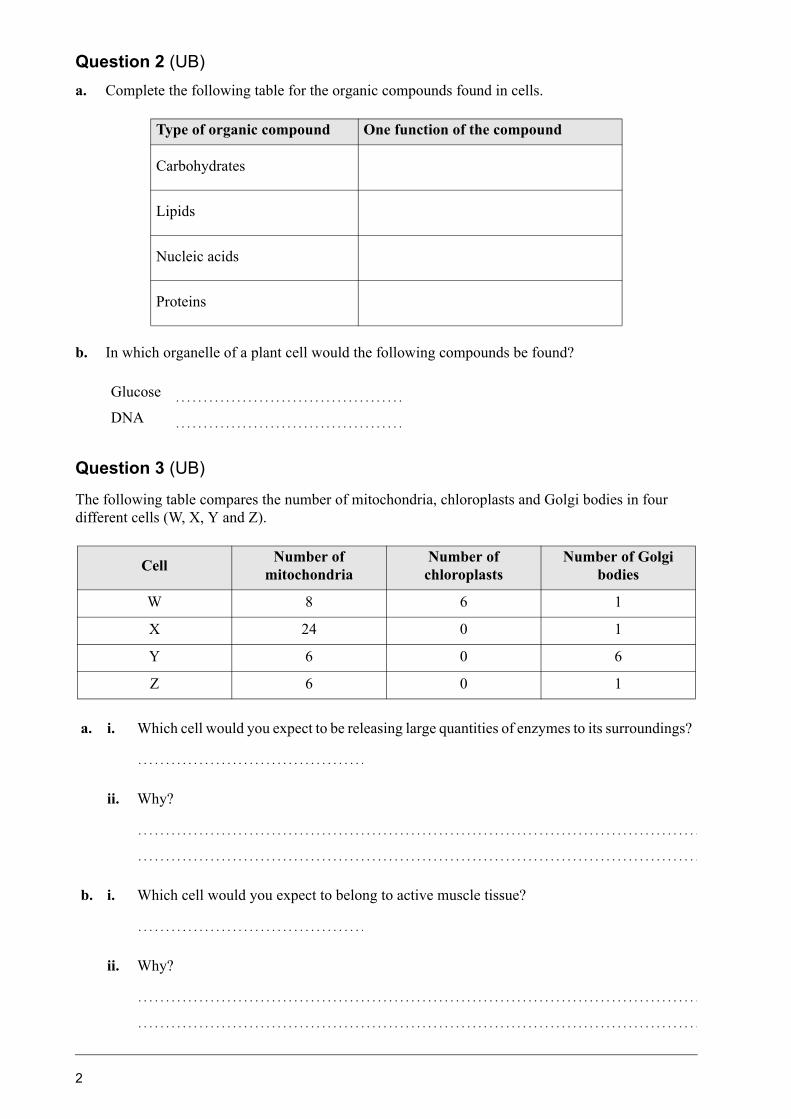
Question 2 (UB)a. Complete the following table for the organic compounds found in cells.
b. In which organelle of a plant cell would the following compounds be found?
Question 3 (UB)
The following table compares the number of mitochondria, chloroplasts and Golgi bodies in four different cells (W, X, Y and Z).
Type of organic compound One function of the compound
Carbohydrates
Lipids
Nucleic acids
Proteins
Glucose
DNA
CellNumber of
mitochondriaNumber of
chloroplastsNumber of Golgi
bodies
W 8 6 1
X 24 0 1
Y 6 0 6
Z 6 0 1
a. i. Which cell would you expect to be releasing large quantities of enzymes to its surroundings?
ii. Why?
b. i. Which cell would you expect to belong to active muscle tissue?
ii. Why?
.........................................
.........................................
.........................................
.....................................................................................................
.....................................................................................................
.........................................
.....................................................................................................
.....................................................................................................
2

Question 4 (IB)
The research department of a forestry company has been asked to compare the photosynthetic rate of leaf tissue from five species of eucalyptus trees. The researchers chose to use the leaf disc method for their investigation.
Design an experimental investigation for the research team.
• Provide methodology.
• Address variables.
• Plan replicate treatments.
• Identify data to be collected.
...............................................................................................................
...............................................................................................................
...............................................................................................................
...............................................................................................................
...............................................................................................................
...............................................................................................................
...............................................................................................................
...............................................................................................................
...............................................................................................................
...............................................................................................................
...............................................................................................................
...............................................................................................................
...............................................................................................................
...............................................................................................................
...............................................................................................................
...............................................................................................................
...............................................................................................................
...............................................................................................................
...............................................................................................................
Leaf disc method
When leaf discs are cut from fresh leaves and kept in water containing CO2 they remain alive and are able to photosynthesise. Normally such leaf discs would float in water, but if air is removed from the spaces between cells a low pressure is created. They will become less buoyant and sink. When the leaf discs photosynthesise they produce oxygen, become buoyant and float to the surface of the water. The faster the discs rise, the faster the rate of photosynthesis.
3

Question 5 (UB/IB)
Plants are often grown commercially in a controlled environment in greenhouses.
Plant growers want their crops to grow quickly and will often artificially increase the concentration of carbon dioxide in the greenhouse air during the day — to about 0.1% compared to the normal level of about 0.034%. In cooler weather greenhouses are heated. The rate of photosynthesis changes in a pattern similar to that shown in the table below.
Concentration of CO2 in the greenhouse air (%)
Relative rate of photosynthesis
At 20 °C At 35 °C
0.005 20 23
0.020 80 95
0.034 (normal level of CO2) 100 110
0.060 110 120
0.090 117 123
0.120 117 123
a. i. Use the data above to plot two graphs on the same set of axes.
ii. Draw two lines of best fit to compare the change in the concentration of CO2 in the greenhouse air with the relative rate of photosynthesis at the two temperatures.
100
40
20
0 0.01
Concentration of CO2
Rel
ativ
e ra
te o
f photo
synth
esis
60
80
120
140
0.02 0.03 0.04 0.05 0.06 0.07 0.08 0.09 0.10 0.11 0.12 0.13
4

b. Complete the equation for photosynthesis.
c. Explain why the relative rate of photosynthesis stays the same after the concentration of CO2 in the greenhouse exceeds 0.090%.
..........................................................................................................
..........................................................................................................
..........................................................................................................
..........................................................................................................
d. The concentration of CO2 in the greenhouse air was found to increase at night, even though none is artificially added. Explain why.
..........................................................................................................
..........................................................................................................
..........................................................................................................
..........................................................................................................
..........................................................................................................
..........................................................................................................
+ water Light energy +.................... .................... ....................
5

Question 6 (UB/IB)
Amoeba are single-celled aquatic organisms. Amoeba obtained from an estuary are to be used in a study where amoeba will be added to three aquatic environments: marine, estuarine and freshwater. The salt concentration of each environment is shown below.
a. Hypothesise what will happen to the amoeba when they are introduced to each environment. Justify each hypothesis.
..........................................................................................................
..........................................................................................................
..........................................................................................................
..........................................................................................................
..........................................................................................................
..........................................................................................................
..........................................................................................................
..........................................................................................................
..........................................................................................................
..........................................................................................................
..........................................................................................................
..........................................................................................................
..........................................................................................................
..........................................................................................................
..........................................................................................................
..........................................................................................................
..........................................................................................................
..........................................................................................................
Environment Marine Estuarine Freshwater
Salt concentration (mg/L)
3000 2500 18
6

b. Some amoeba have contractile vacuoles that collect and expel water from the cell. A large number of mitochondria are generally found in the immediate vicinity of the contractile vacuole. The diagram below shows a contractile vacuole.
Explain the relationship between these contractile vacuoles and mitochondria.
..........................................................................................................
..........................................................................................................
..........................................................................................................
..........................................................................................................
c. The salt concentration within the amoeba remains constant even though extracellular salt concentration changes. How does the amoeba achieve this? Explain your response.
..........................................................................................................
..........................................................................................................
..........................................................................................................
..........................................................................................................
..........................................................................................................
..........................................................................................................
End of Part A
Filling vacuole 50 m�
50 m�Contracting vacuole
A contractile vacuole fills with fluid that enters from asystem of canals radiating throughout the cytoplasm.
When full, the vacuole and canals contract, expellingfluid from the cell.
7

Part B — Physiology of organisms
Questions 1–5 assess Understanding biology (UB) and Investigating biology (IB).
Question 6 assesses Evaluating biological issues (EBI).
Attempt all questions. Write your responses in the spaces provided.
Suggested time allocation: 55 minutes.
Question 1 (UB)
The diagram below represents the gas exchange within an organism.
a. Which two gases are exchanged at X?
..........................................................................................................
..........................................................................................................
b. What is the process by which gases are exchanged at X and Y?
..........................................................................................................
c. List two characteristics that make lungs and gills efficient surfaces for gas exchange. Explain how these characteristics make the structures more efficient.
..........................................................................................................
..........................................................................................................
..........................................................................................................
..........................................................................................................
..........................................................................................................
..........................................................................................................
Lungs or gills Respiring cell
Gas exchangeGas exchange
Blood flow
Blood transports gasesX Y
Blood flow
8

Question 2 (UB)
The diagrams below show the circulatory systems of a human foetus and a human baby. The foetal heart has two vessels which allow blood to bypass the lungs.
In the foetal system:
• About 60% of the blood that enters the right atrium passes through the foramen ovale — indicated on the diagram at (i) — to the left atrium.
• Most of the remaining 40% passes via the ductus arteriosus — indicated on the diagram at (ii) — into the body circulation.
a. In what significant way would the blood entering the left side of the heart of a foetus differ from the blood entering the left side of the heart of a baby after birth? Explain your response.
..........................................................................................................
..........................................................................................................
..........................................................................................................
..........................................................................................................
b. Describe the disadvantages for the baby if, after birth, the bypasses remain unchanged.
..........................................................................................................
..........................................................................................................
..........................................................................................................
..........................................................................................................
..........................................................................................................
..........................................................................................................
Lungs
Umbilical vein(from placenta)
Foetal circulation (before birth) Baby’s circulation (after birth)
Umbilical artery(to placenta)
LiverHeart
Body
Lungs
(ii)
(i)
LiverHeart
Body
9

Question 3 (UB)
The diagram below shows two villi from the small intestine of a healthy person.
a. Explain how the structures of the villi are related to their function.
..........................................................................................................
..........................................................................................................
..........................................................................................................
The diagram below shows two villi from the small intestine of a person with coeliac disease, which causes inflammation and affects the shape of the villi.
b. Without treatment, children with coeliac disease have low growth rates (failure to thrive), fatigue and anaemia.
Explain how changes to the structure of the villi would result in these symptoms.
..........................................................................................................
..........................................................................................................
..........................................................................................................
..........................................................................................................
..........................................................................................................
..........................................................................................................
..........................................................................................................
Blood capillary
Blood capillary
10

Question 4 (UB)
The diagram below shows a simplified representation of the structural unit of a human kidney, the nephron. Concentrations of three substances in various regions of the nephron are shown in the tables.
a. On the diagram, label the four items: glomerulus, Bowman’s capsule, collecting tubule and renal artery.
b. Explain the processes that change the concentration of each of the substances below. Use the terms renal artery, glomerulus, Bowman’s capsule and collection tubule in your explanations.
i. Glucose
..........................................................................................................
..........................................................................................................
..........................................................................................................
..........................................................................................................
ii. Urea
..........................................................................................................
..........................................................................................................
..........................................................................................................
..........................................................................................................
iii. Protein
..........................................................................................................
..........................................................................................................
..........................................................................................................
..........................................................................................................
Glucose
Urea
Protein
90
30
740
Substance Concentration(mg/100 mL)
Glucose
Urea
Protein
90
30
0
Substance Concentration(mg/100 mL)
Glucose
Urea
Protein
0
2000
0
Substance Concentration(mg/100 mL)
11

Question 5 (UB/IB)
The diagram below shows the cross-section of a leaf with the magnified view showing extra detail.
a. Name two features shown in the diagram that help minimise water loss from the leaf.Explain how each feature you named does this.
..........................................................................................................
..........................................................................................................
..........................................................................................................
..........................................................................................................
..........................................................................................................
..........................................................................................................
..........................................................................................................
..........................................................................................................
Magnified view
12

b. The graph below shows the rate of water loss of the plant on a hot summer’s day (February) and on a cool winter’s day (June). The rate of water loss is measured on a scale from 0–6, with 0 being no water loss.
Interpret the graph to draw a justified conclusion about why the pattern of water loss is different in summer than in winter.
..........................................................................................................
..........................................................................................................
..........................................................................................................
..........................................................................................................
..........................................................................................................
..........................................................................................................
..........................................................................................................
FebruaryRate ofwater loss
04
am6
am8
am10am
12noon
2pm
4pm
6pm
8pm
2
4
6
Time of day (hour)
June
13

Question 6 assesses Evaluating biological issues (EBI). Write an extended response below.
Your response MUST refer to biological principles, concepts and ideas.
Question 6 (EBI)
The consumption of meat is linked to cancer, heart disease and obesity, although some people believe that recommendations to cut down or give up meat altogether are too restrictive and could be doing more harm than good.
Do you agree with this statement? Justify your decision referring to both health and environmental concepts.
...............................................................................................................
...............................................................................................................
...............................................................................................................
...............................................................................................................
...............................................................................................................
...............................................................................................................
...............................................................................................................
...............................................................................................................
...............................................................................................................
...............................................................................................................
...............................................................................................................
...............................................................................................................
...............................................................................................................
...............................................................................................................
...............................................................................................................
...............................................................................................................
...............................................................................................................
...............................................................................................................
...............................................................................................................
...............................................................................................................
...............................................................................................................
...............................................................................................................
...............................................................................................................
...............................................................................................................
14

...............................................................................................................
...............................................................................................................
...............................................................................................................
...............................................................................................................
...............................................................................................................
...............................................................................................................
...............................................................................................................
...............................................................................................................
...............................................................................................................
...............................................................................................................
End of Part B
15

Part C — Organisms and ecosystems
Questions 1–5 assess Understanding biology (UB) and Investigating biology (IB).
Question 6 assesses Evaluating biological issues (EBI).
Attempt all questions. Write your responses in the spaces provided.
Suggested time allocation: 55 minutes.
Question 1 (IB)
The Kaibab Plateau is on the edge of the Grand Canyon. Before 1905, the deer population on the Kaibab Plateau was estimated to be approximately 4000. The average carrying capacity of the plateau was then estimated to be about 30000 deer. In 1906, the Grand Canyon National Game Preserve was created to protect the deer.
Unfortunately, by this time, the forest area had already been overgrazed by sheep, cattle and horses. Most of the tall grasses had been eliminated.
A number of control mechanisms were taken to protect the deer population, including:
• all deer hunting was banned from 1905
• between 1907 and 1939, 816 mountain lions, 20 wolves, 7388 coyotes and more than 500 bobcats were killed.
Signs that the deer population was out of control began to appear as early as 1920 – the range was beginning to deteriorate rapidly. By 1923, the deer were on the verge of starvation. Hunting was reopened, and during 1924, 675 deer were killed by hunters.
The table below shows the deer population for selected years from 1905 until 1939.
Year Deer population
1905 004000
1910 009000
1915 025000
1920 065000
1924 100000
1925 060000
1926 040000
1927 037000
1928 035000
1929 030000
1930 025000
1931 020000
1935 018000
1939 010000
16

a. Graph the deer population data. Annotate the graph with the control mechanisms used.
Question 1 continues
17

b. Two methods were used to protect the deer population. Discuss the success of these methods. Use the data from the graph to support your response.
..........................................................................................................
..........................................................................................................
..........................................................................................................
..........................................................................................................
..........................................................................................................
..........................................................................................................
..........................................................................................................
..........................................................................................................
..........................................................................................................
..........................................................................................................
..........................................................................................................
..........................................................................................................
c. Explain why the deer population declined in 1925 despite the killing of predators.
..........................................................................................................
..........................................................................................................
..........................................................................................................
..........................................................................................................
..........................................................................................................
d. The population of deer in 1905 was 4000, although the plateau had a carrying capacity of 30000. Why was the population this size?
..........................................................................................................
..........................................................................................................
..........................................................................................................
..........................................................................................................
..........................................................................................................
18

e. Predict what might have happened to the deer population without human intervention. Explain your response.
..........................................................................................................
..........................................................................................................
..........................................................................................................
..........................................................................................................
..........................................................................................................
..........................................................................................................
..........................................................................................................
..........................................................................................................
..........................................................................................................
Question 2 (UB)
The diagram below shows part of the carbon cycle.
a. Explain how living things are involved in the constant cycling of carbon. Name the processes involved.
..........................................................................................................
..........................................................................................................
..........................................................................................................
..........................................................................................................
..........................................................................................................
..........................................................................................................
..........................................................................................................
..........................................................................................................
..........................................................................................................
..........................................................................................................
Carbon dioxide inthe atmosphere
Microorganisms
AnimalsGreen plants
Question 2 continues
19

b. Explain the likely effect on the carbon cycle if:
• decomposers were absent.
..........................................................................................................
..........................................................................................................
..........................................................................................................
..........................................................................................................
..........................................................................................................
• deforestation occurred.
..........................................................................................................
..........................................................................................................
..........................................................................................................
..........................................................................................................
..........................................................................................................
Question 3 (UB)
The food chain below is from a seashore.
Seaweed Limpet Crab Seagull
The population and biomass of each of the organisms were estimated for part of a seashore as shown in the table below.
a. Use the information in the table to estimate the biomass of the seagull population.
Organism PopulationMean mass ofone organism
(g)
Biomass of population (g)
Seaweed 0050 4000 200000
Limpet 1200 0030 036000
Crab 0100 0090 009000
Seagull 0002 0900
20

b. Draw a pyramid of biomass for this food chain.
c. The biomass of the crab population is much less than the biomass of the limpet population. Explain why.
..........................................................................................................
..........................................................................................................
..........................................................................................................
..........................................................................................................
..........................................................................................................
..........................................................................................................
Question 4 (UB)
Using examples, explain the difference between primary and secondary succession.
...............................................................................................................
...............................................................................................................
...............................................................................................................
...............................................................................................................
...............................................................................................................
...............................................................................................................
...............................................................................................................
...............................................................................................................
...............................................................................................................
...............................................................................................................
...............................................................................................................
...............................................................................................................
...............................................................................................................
21

Question 5 (IB)
A gardener wanted to investigate if changing the pH of the soil would cause the flowers of her plants to change colour. She collected five plants growing in pots and changed the pH of the soil as follows:
• Pot 1 – pH 7
• Pot 2 – pH 8
• Pot 3 – pH 6
• Pot 4 – pH 5
• Pot 5 – pH 4
Evaluate the design of the experiment and propose refinements.
...............................................................................................................
...............................................................................................................
...............................................................................................................
...............................................................................................................
...............................................................................................................
...............................................................................................................
...............................................................................................................
...............................................................................................................
...............................................................................................................
...............................................................................................................
...............................................................................................................
...............................................................................................................
...............................................................................................................
...............................................................................................................
...............................................................................................................
...............................................................................................................
22

Question 6 assesses Evaluating biological issues (EBI). Write an extended response below.
Your response MUST refer to biological principles, concepts and ideas.
Question 6 (EBI)
Climate change significantly affects the habitat in which a population of organisms lives.
Predict the effect an increase in average temperature will have on the Emperor penguin population of the Antarctic.
...............................................................................................................
...............................................................................................................
...............................................................................................................
...............................................................................................................
...............................................................................................................
...............................................................................................................
...............................................................................................................
...............................................................................................................
...............................................................................................................
...............................................................................................................
...............................................................................................................
...............................................................................................................
...............................................................................................................
...............................................................................................................
...............................................................................................................
...............................................................................................................
...............................................................................................................
...............................................................................................................
...............................................................................................................
...............................................................................................................
...............................................................................................................
...............................................................................................................
...............................................................................................................
...............................................................................................................
...............................................................................................................
23

...............................................................................................................
...............................................................................................................
...............................................................................................................
...............................................................................................................
...............................................................................................................
...............................................................................................................
...............................................................................................................
...............................................................................................................
...............................................................................................................
...............................................................................................................
...............................................................................................................
...............................................................................................................
...............................................................................................................
...............................................................................................................
...............................................................................................................
End of Part C
End of Paper One
24

Additional pages for responses (if required)
25

...............................................................................................................
...............................................................................................................
...............................................................................................................
...............................................................................................................
...............................................................................................................
...............................................................................................................
...............................................................................................................
...............................................................................................................
...............................................................................................................
...............................................................................................................
...............................................................................................................
...............................................................................................................
...............................................................................................................
...............................................................................................................
...............................................................................................................
...............................................................................................................
...............................................................................................................
...............................................................................................................
...............................................................................................................
...............................................................................................................
...............................................................................................................
...............................................................................................................
...............................................................................................................
...............................................................................................................
...............................................................................................................
...............................................................................................................
...............................................................................................................
...............................................................................................................
Part Question
26

...............................................................................................................
...............................................................................................................
...............................................................................................................
...............................................................................................................
...............................................................................................................
...............................................................................................................
...............................................................................................................
...............................................................................................................
...............................................................................................................
...............................................................................................................
...............................................................................................................
...............................................................................................................
...............................................................................................................
...............................................................................................................
...............................................................................................................
...............................................................................................................
...............................................................................................................
...............................................................................................................
...............................................................................................................
...............................................................................................................
...............................................................................................................
...............................................................................................................
...............................................................................................................
...............................................................................................................
...............................................................................................................
...............................................................................................................
...............................................................................................................
...............................................................................................................
Part Question
27

Planning space
28

Planning space
29

Planning space
30

Ass
essm
ent
stan
dar
ds
der
ived
fro
m t
he
Bio
log
y S
enio
r E
xter
nal
Syl
lab
us
2006
Pap
er
On
e
Crite
rion
AB
CD
E
Unde
rsta
ndin
g bi
olog
yTh
e ca
ndid
ate
com
mun
icat
es
unde
rsta
ndin
g by
:
•mak
ing
links
bet
wee
n re
late
d id
eas,
con
cept
s, p
rinci
ples
and
th
eorie
s to
reve
al m
eani
ngfu
l in
terre
latio
nshi
ps
•app
lyin
g kn
owle
dge
and
unde
rsta
ndin
g to
a ra
nge
of
com
plex
and
cha
lleng
ing
task
s.
The
cand
idat
e co
mm
unic
ates
un
ders
tand
ing
by:
•exp
lain
ing
idea
s, c
once
pts,
pr
inci
ples
and
theo
ries
and
desc
ribin
g in
terre
latio
nshi
ps
betw
een
them
•app
lyin
g kn
owle
dge
and
unde
rsta
ndin
g to
a ra
nge
of
com
plex
task
s.
The
cand
idat
e co
mm
unic
ates
un
ders
tand
ing
by:
•def
inin
g an
d de
scrib
ing
idea
s,
conc
epts
, prin
cipl
es a
nd
theo
ries,
and
id
entif
ying
inte
rrela
tions
hips
•app
lyin
g kn
owle
dge
and
unde
rsta
ndin
g to
a ra
nge
of
task
s.
The
cand
idat
e co
mm
unic
ates
un
ders
tand
ing
by s
tatin
g id
eas
and
usin
g te
rmin
olog
y re
leva
nt
to c
once
pts
and
reca
lling
inte
rrela
tions
hips
.
The
cand
idat
e st
ates
te
rmin
olog
y an
d id
eas
rele
vant
to
con
cept
s.
Inve
stig
atin
g bi
olog
yTh
e ca
ndid
ate
com
mun
icat
es
inve
stig
ativ
e pr
oces
ses
by:
•for
mul
atin
g ju
stifi
ed
rese
arch
able
que
stio
ns
•des
igni
ng a
n in
vest
igat
ion
by
prov
idin
g m
etho
dolo
gy,
addr
essi
ng v
aria
bles
and
co
ntro
l, pl
anni
ng re
plic
ate
treat
men
ts a
nd id
entif
ying
dat
a to
be
colle
cted
•org
anis
ing
data
to id
entif
y tre
nds
and
inte
rrela
tions
hips
•int
erpr
etin
g an
d cr
itica
lly
anal
ysin
g da
ta w
ith li
nks
to
theo
retic
al c
once
pts
to d
raw
co
nclu
sion
s re
latin
g to
the
ques
tion/
s
•eva
luat
ing
the
desi
gn o
f the
in
vest
igat
ion
and
refle
ctin
g on
th
e ad
equa
cy o
f the
dat
a co
llect
ed a
nd p
ropo
sing
re
finem
ents
.
The
cand
idat
e co
mm
unic
ates
in
vest
igat
ive
proc
esse
s by
:
•for
mul
atin
g re
sear
chab
le
ques
tions
•des
igni
ng a
n in
vest
igat
ion
by
prov
idin
g m
etho
dolo
gy,
addr
essi
ng o
bvio
us v
aria
bles
an
d co
ntro
l and
pla
nnin
g re
plic
ate
treat
men
ts
•org
anis
ing
data
•int
erpr
etin
g da
ta a
nd d
raw
ing
conc
lusi
ons
rela
ting
to th
e qu
estio
n/s
•eva
luat
ing
the
desi
gn o
f the
in
vest
igat
ion
and
the
adeq
uacy
of
the
data
col
lect
ed.
The
cand
idat
e co
mm
unic
ates
in
vest
igat
ive
proc
esse
s by
:
•ide
ntify
ing
rese
arch
able
qu
estio
ns
•des
igni
ng a
n in
vest
igat
ion
by
prov
idin
g in
com
plet
e m
etho
dolo
gy w
ith fe
w
varia
bles
and
atte
mpt
s to
in
clud
e a
cont
rol
•org
anis
ing
data
•usi
ng d
ata
to d
raw
co
nclu
sion
s.
The
cand
idat
e co
mm
unic
ates
in
vest
igat
ive
proc
esse
s by
:
•usi
ng d
ata
to a
nsw
er
ques
tions
•des
igni
ng a
n in
vest
igat
ion
whi
ch p
rovi
des
inco
mpl
ete
met
hodo
logy
and
men
tions
va
riabl
es
•atte
mpt
ing
to o
rgan
ise
data
.
The
cand
idat
e co
mm
unic
ates
in
vest
igat
ive
proc
esse
s by
pr
ovid
ing
inco
mpl
ete
met
hodo
logy
, and
tran
scrib
es
data
.
31

Pap
er O
ne
(co
nti
nu
ed)
Crite
rion
AB
CD
E
Evalu
atin
g bi
olog
ical
issue
s
The
cand
idat
e co
mm
unic
ates
by:
•int
egra
ting
the
info
rmat
ion
and
data
to m
ake
just
ified
and
re
spon
sibl
e de
cisi
ons
•com
parin
g al
tern
ativ
es a
nd
pred
ictio
ns re
leva
nt in
pas
t, pr
esen
t and
futu
re b
iolo
gica
l co
ntex
ts.
The
cand
idat
e co
mm
unic
ates
by:
•int
egra
ting
the
info
rmat
ion
and
data
to m
ake
logi
cal d
ecis
ions
•rec
ogni
sing
alte
rnat
ives
and
pr
edic
tions
that
are
rele
vant
in
a ra
nge
of p
ast a
nd p
rese
nt
biol
ogic
al c
onte
xts.
The
cand
idat
e co
mm
unic
ates
by
:
•sel
ectin
g re
leva
nt in
form
atio
n an
d da
ta to
mak
e pl
ausi
ble
deci
sion
s an
d pr
edic
tions
•rec
ogni
sing
con
cept
s th
at fo
rm
the
basi
s of
pre
sent
-day
bi
olog
ical
issu
es in
a ra
nge
of
biol
ogic
al c
onte
xts.
The
cand
idat
e co
mm
unic
ates
by
:
•mak
ing
unsu
ppor
ted
deci
sion
s
•rec
ogni
sing
that
a g
iven
issu
e ha
s bi
olog
ical
impl
icat
ions
.
The
cand
idat
e co
mm
unic
ates
by
rest
atin
g su
pplie
d in
form
atio
n.
32


© Th
Copyr
ManaPublisEmail
Que& APO BoLevel 7T + 61F + 61
www.
e State of Queensland (Queensland Curriculum and Assessment Authority) 2015
ight enquiries should be made to:
ger hing Unit
ensland Curriculumssessment Authorityx 307, Spring Hill QLD 4004 Australia, 154 Melbourne Street, South Brisbane
7 3864 0299 7 3221 2553qcaa.qld.edu.au


