
BERNARDS TOWNSHIP School District
Fall District Testing Report: Standardized Test Results/Analysis
Sean Siet
Director of Curriculum and Instruction
September 12, 2011

Introduction
• An overview of the district test results on New Jersey standardized tests and highlight areas where the district differs from comparable districts (same DFG (J) or District Factor Group, which is a measure of socioeconomic status)
NJ Assessments
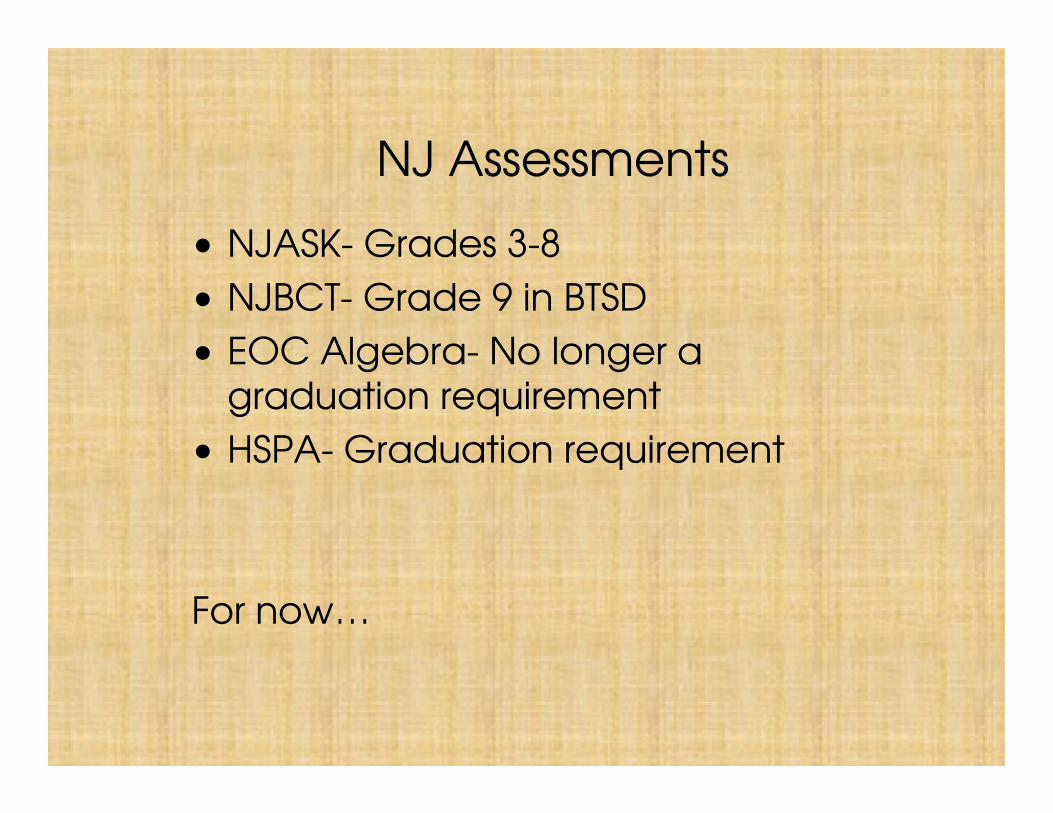
• NJASK- Grades 3-8
• NJBCT- Grade 9 in BTSD
• EOC Algebra- No longer a graduation requirement
• HSPA- Graduation requirement
For now…

State Testing Parameters• Sub-group size
• n = 30 for all groups
• Formerly 35 for special education and 20 for all other groups
• Target or benchmark score for making Adequate Yearly Progress (AYP)
• Change in tests (5-8): increased rigor in 08-09
• Banking of Scores (11th-12th grade)
• Students have 3 opportunities to ‘pass’ the HSPA (AHSA)
• Calculator use not permitted on SCR (3-8)
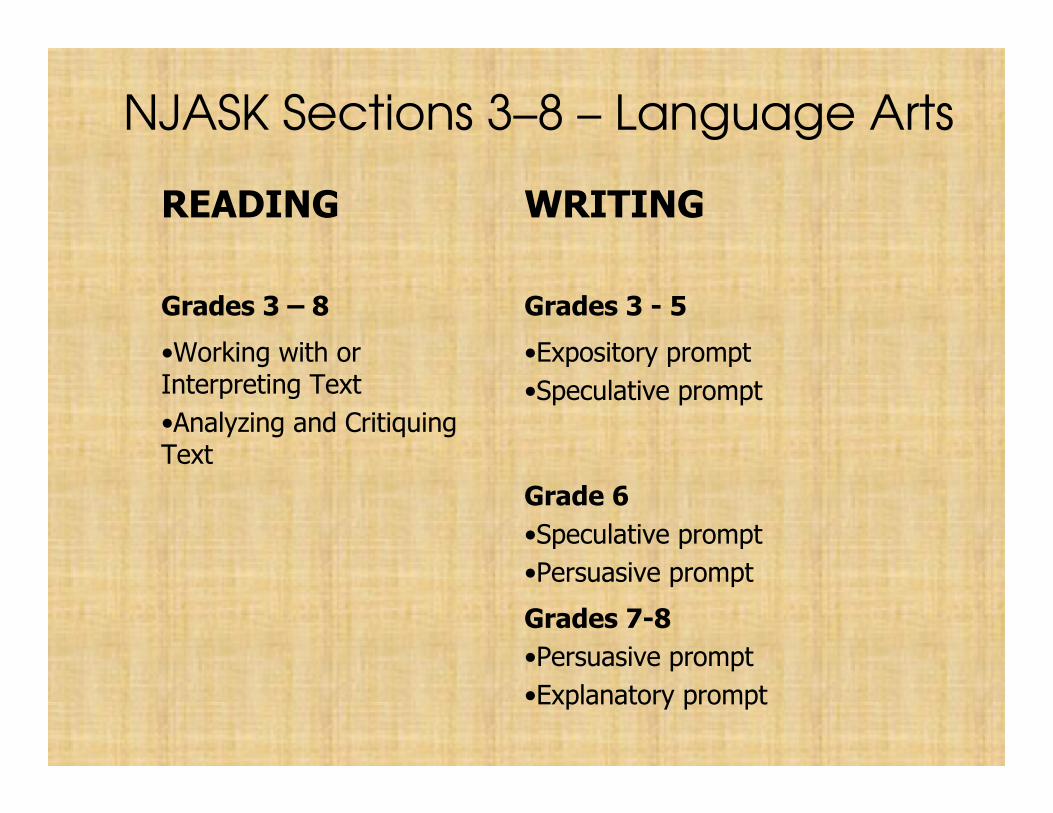
NJASK Sections 3–8 – Language Arts
READING WRITING
Grades 3 – 8 Grades 3 - 5
•Working with or Interpreting Text
•Analyzing and Critiquing Text
•Expository prompt
•Speculative prompt
Grade 6
•Speculative prompt
•Persuasive prompt
Grades 7-8
•Persuasive prompt
•Explanatory prompt

LAL Sample Expository Prompt 3-5
• Most people have a special activity or hobby that they enjoy. Some people collect things while others like to read or play games. What activity do you like to do?
• Write a composition describing what you enjoy doing. Explain why that activity is special to you.
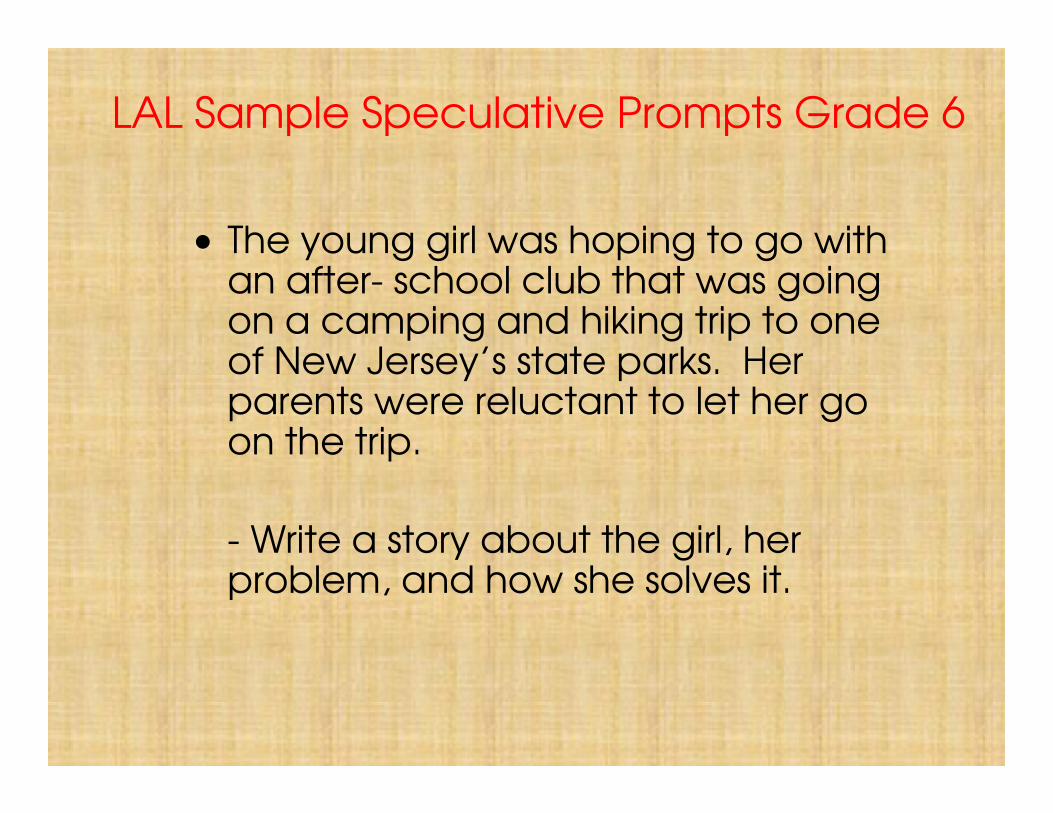
LAL Sample Speculative Prompts Grade 6
• The young girl was hoping to go with an after- school club that was going on a camping and hiking trip to one of New Jersey’s state parks. Her parents were reluctant to let her go on the trip.
- Write a story about the girl, her problem, and how she solves it.

LAL Sample Speculative Prompts Grade 7
• Sasha dreams of becoming a famous inventor. She jots down ideas, and makes observations about how things work. She hopes to invent something that will help people.
- Imagine what Sasha might invent. Write a story about her invention, and how it can be used

LAL Sample Speculative Prompts Grade 8
• After weeks of preparation, Ella proudly handed in a history report. Her best friend in the same class copied a report from the Internet. When the graded papers were returned, Ella received a C+ while her friend received an A.
- Write a story about how Ella might deal with this situation

NJASK Sections 3–8 - Mathematics
• Number and Numerical Operations
• Geometry and Measurement
• Patterns and Algebra
• Data Analysis, Probability, and Discrete Mathematics
�Multiple Choice, Short Constructed Response and Extended Constructed Response

Sample Math Problem• Inez has a toy car collection. She has 55 red
cars, 67 blue cars, and 123 orange cars. How many cars does she have in all? (Grade 4)
• How many ways can a teacher choose 2 students from a group of 4 students? (Grade 6)
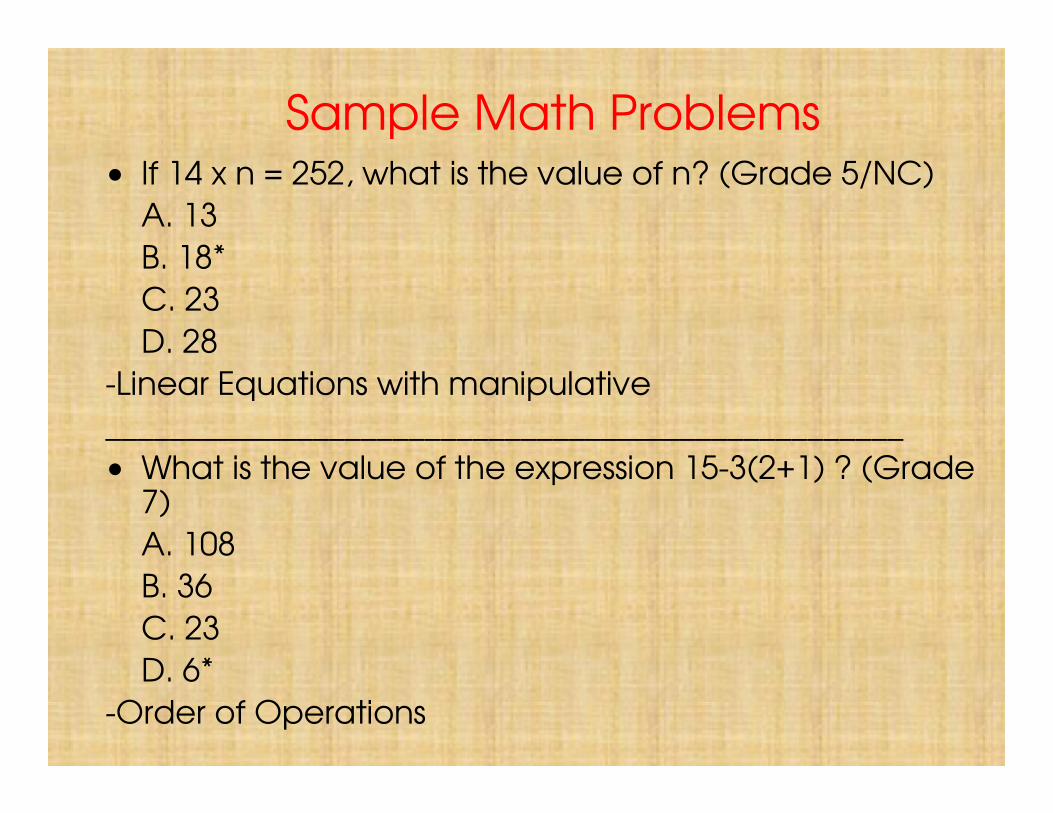
Sample Math Problems• If 14 x n = 252, what is the value of n? (Grade 5/NC)
A. 13
B. 18*
C. 23
D. 28
-Linear Equations with manipulative
__________________________________________________
• What is the value of the expression 15-3(2+1) ? (Grade 7)
A. 108
B. 36
C. 23
D. 6*
-Order of Operations

Analyzing Data: NJASK, Language Arts Literacy
GRADE Partially Proficient Proficient Advanced Proficient
3: BTSD (404)
DFG
STATE
11.9
15.1
37.0
62.2
67.4
55.8
25.9
17.5
7.2
4: BTSD (442)
DFG
STATE
12.0
15.0
37.3
68.0
67.8
55.5
20.0
17.2
7.2
5: BTSD (436)
DFG
STATE
8.9
13.2
39.1
71.3
69.7
54.8
19.9
17.2
6.1
6: BTSD (490)
DFG
STATE
7.2
10.8
33.3
70.6
72.8
59.4
22.2
19.1
7.3
7: BTSD (486)
DFG
STATE
10.4
11.8
36.7
59.5
57.9
51.0
30.1
30.9
12.3

Analyzing Data: NJASK, Mathematics
GRADE Partially Proficient Proficient Advanced Proficient
3: BTSD (404)
DFG
STATE
4.5
5.8
21.1
26.0
29.7
40.5
69.4
64.4
38.4
4: BTSD (442)
DFG
STATE
3.7
6.0
20.7
31.4
38.7
47.2
64.9
55.4
32.1
5: BTSD (436)
DFG
STATE
2.1
4.0
19.4
22.5
27.7
41.1
75.4
68.3
39.5
6: BTSD (490)
DFG
STATE
4.1
5.6
22.7
41.8
40.2
49.8
54.1
54.2
27.6
7: BTSD (486)
DFG
STATE
11.0
11.7
34.3
33.5
36.5
41.4
55.5
51.8
24.3

Analyzing Data: NJASK 8, Language Arts Literacy
GRADE Partially Proficient
Proficient Advanced Proficient
8: BTSD (466)
DFG
STATE
2.2
3.2
17.8
62.0
53.9
63.0
35.8
42.9
19.1

Analyzing Data: NJASK8, Mathematics
GRADE Partially Proficient
Proficient Advanced Proficient
8: BTSD (466)
DFG
STATE
8.1
9.3
17.8
40.3
34.0
63.0
51.6
56.6
19.1

Analyzing Data: NJ HSPA, Language Arts Literacy
GRADE Partially Proficient
Proficient Advanced Proficient
11: BTSD (440)
DFG
STATE
2.1
2.3
10.5
54.9
51.7
68.8
43.1
46.1
20.8
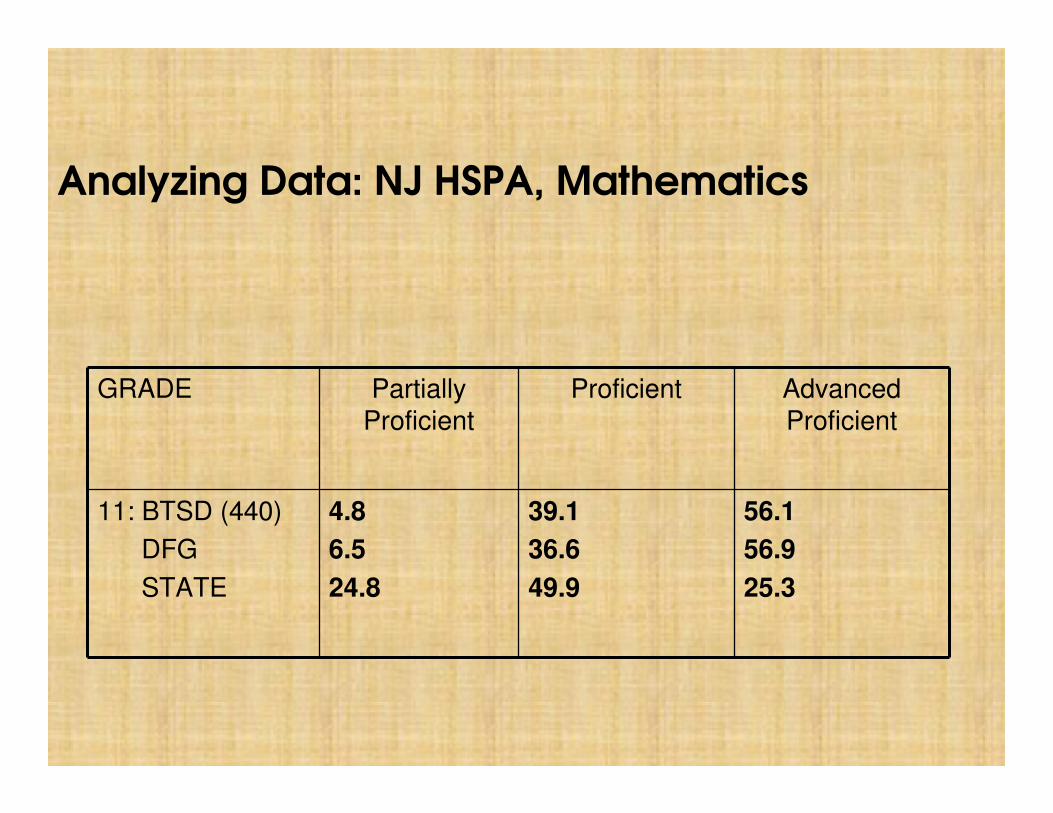
Analyzing Data: NJ HSPA, Mathematics
GRADE Partially Proficient
Proficient Advanced Proficient
11: BTSD (440)
DFG
STATE
4.8
6.5
24.8
39.1
36.6
49.9
56.1
56.9
25.3

Data Analysis
Examine test scores:
• in comparison to comparable districts
• from a multi-year perspective
• from a longitudinal perspective
• from a building perspective
• in conjunction with local assessments
Recognize areas of strength and areas of need
Evaluate the curriculum

Setting Priorities & Moving Ahead
• Design ongoing local assessment that will drive the curriculum
• Align measurable building objectives with test improvement priorities
• Balance test improvement strategies with good pedagogy
• Continue to align staff development with needs of the district
• Use multiple measures of performance
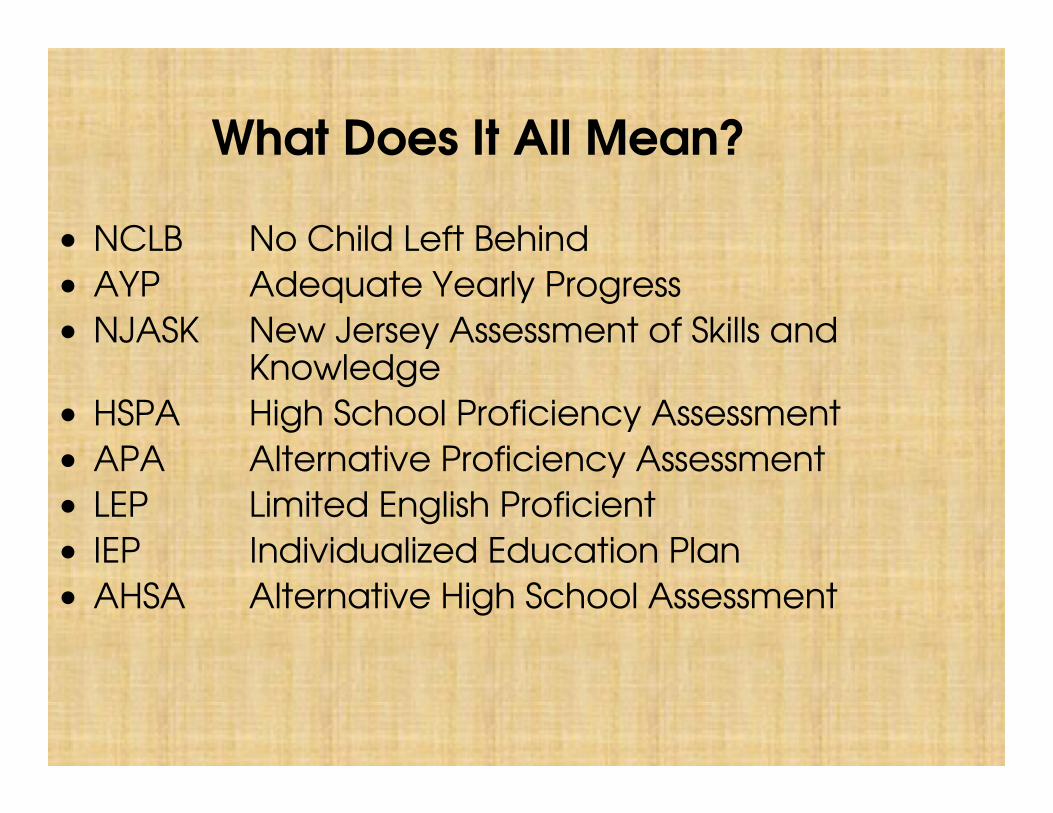
What Does It All Mean?
• NCLB No Child Left Behind
• AYP Adequate Yearly Progress
• NJASK New Jersey Assessment of Skills and Knowledge
• HSPA High School Proficiency Assessment
• APA Alternative Proficiency Assessment
• LEP Limited English Proficient
• IEP Individualized Education Plan
• AHSA Alternative High School Assessment

Background
• No Child Left Behind Act 2001
– Signed into law on January 8, 2002
• This law represents the most significant changes to the Elementary and Secondary Schools Act (ESEA) since its enactment in 1965
• August 2011: States allowed to apply for waivers
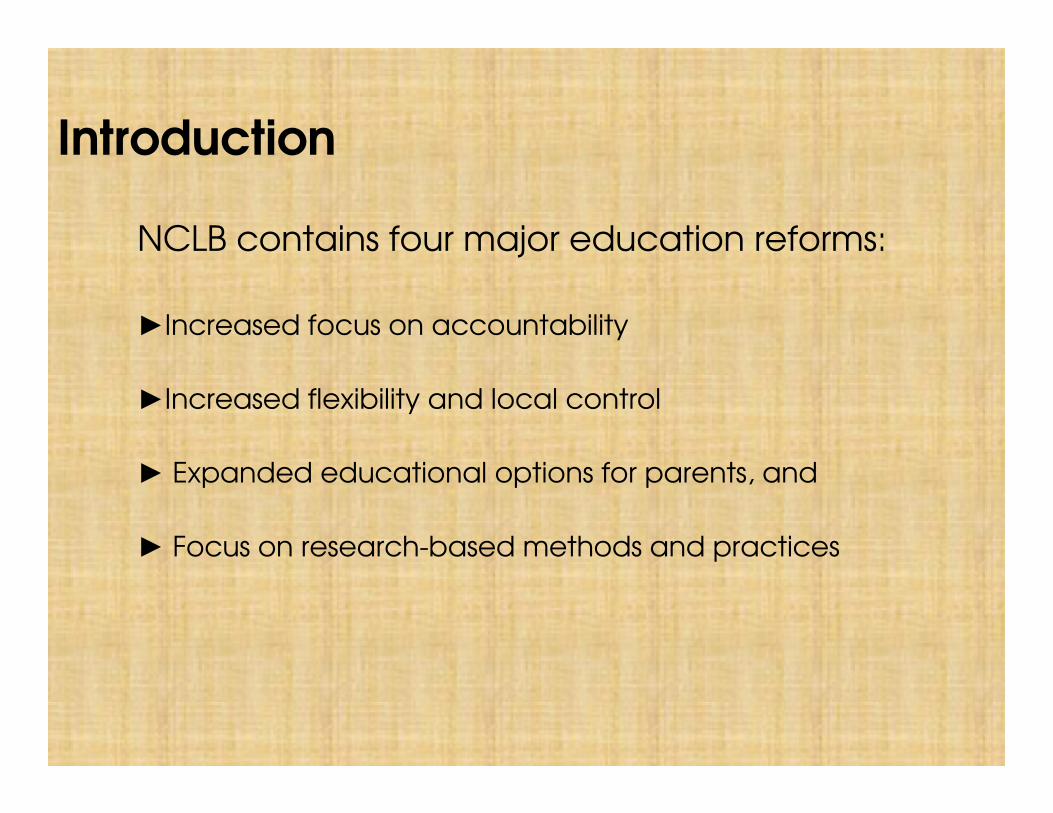
Introduction
NCLB contains four major education reforms:
►Increased focus on accountability
►Increased flexibility and local control
► Expanded educational options for parents, and
► Focus on research-based methods and practices

Guidelines for Assessing Students
Goal:All students will be assessed
• 95% of each student group must participate in the assessment process
• Students enrolled for <1 year will not be included in the accountability process
• Students with severe disabilities must be assessed utilizing the APA
• Out-of-district students are included in their home school’s accountability process
• LEP students must also be assessed

Adequate Yearly Progress (AYP)
Student progress is also assessed by student groups:
• Ethnicity: (American Indian, Asian, Black, Hispanic, Pacific Islander, White, Other)
• Income: (Economically Disadvantaged/Non-Economically Disadvantaged)
• LEP
• Special Education

New Jersey State Benchmarks for Adequate Yearly Progress
Effective November 2009
Content Area Grade Span Starting
Point 2003
2005-2007 2008-2010 2011-2013 2014
Language Arts
Literacy
Elementary (Grades 3-5) 68 75 59 79 100
Middle School (Grades 6-8) 58 66 72 86 100
High School (Grade 11) 73 79 85 92 100
Mathematics Elementary (Grades 3-5) 53 62 66 83 100
Middle School (Grades 6-8) 39 49 61 80 100
High School (Grade 11) 55 64 74 86 100

NJASK3 Language Arts Literacy AYP
Subgroup %
Proficient
2011
%
Proficient
2010
%
Proficient
2009
%
Proficient
2008
%
Proficient
2007
AYP
Met
Total Students
- 40488.1 88 86.8 98.0 96.4 Y
General Ed -
31193.3 93 89.4 99.2 98.6 Y
Special Ed -
8767.1 67.6 77.9 93.0 86.6 Y
Asian – 74 96.0 95.6 94.7 100 100 Y
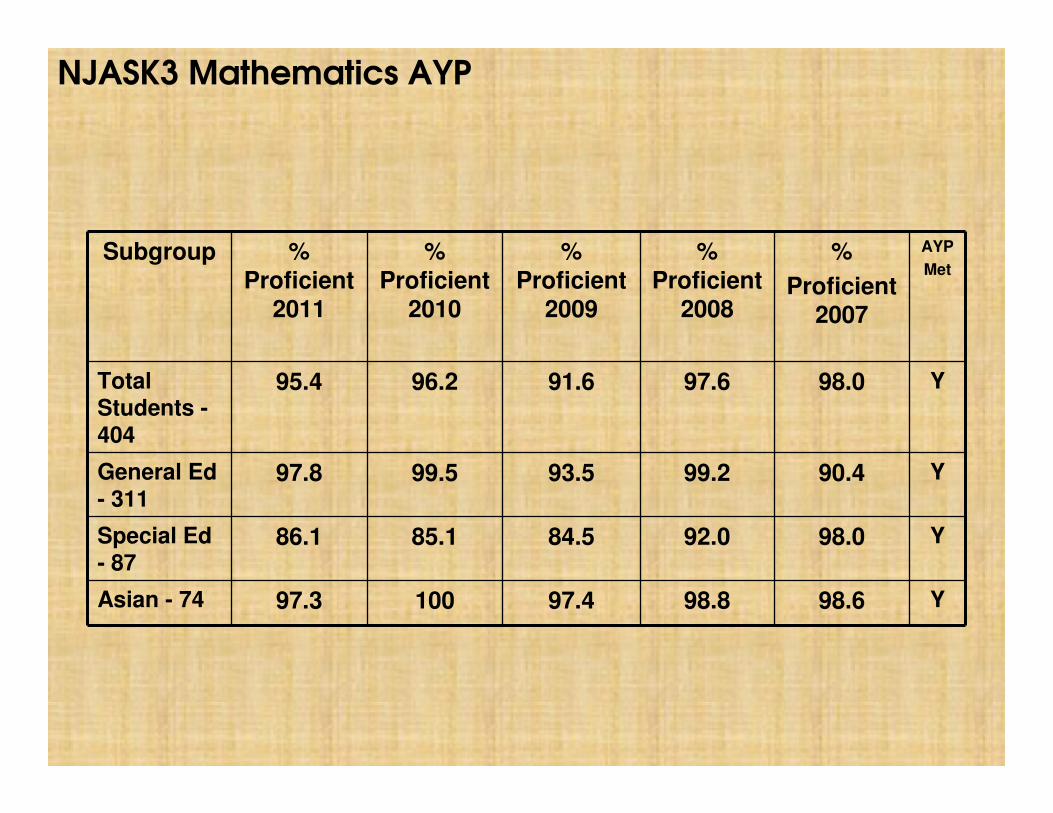
NJASK3 Mathematics AYP
Subgroup %
Proficient
2011
%
Proficient
2010
%
Proficient
2009
%
Proficient
2008
%
Proficient
2007
AYP
Met
Total Students -404
95.4 96.2 91.6 97.6 98.0 Y
General Ed - 311
97.8 99.5 93.5 99.2 90.4 Y
Special Ed - 87
86.1 85.1 84.5 92.0 98.0 Y
Asian - 74 97.3 100 97.4 98.8 98.6 Y
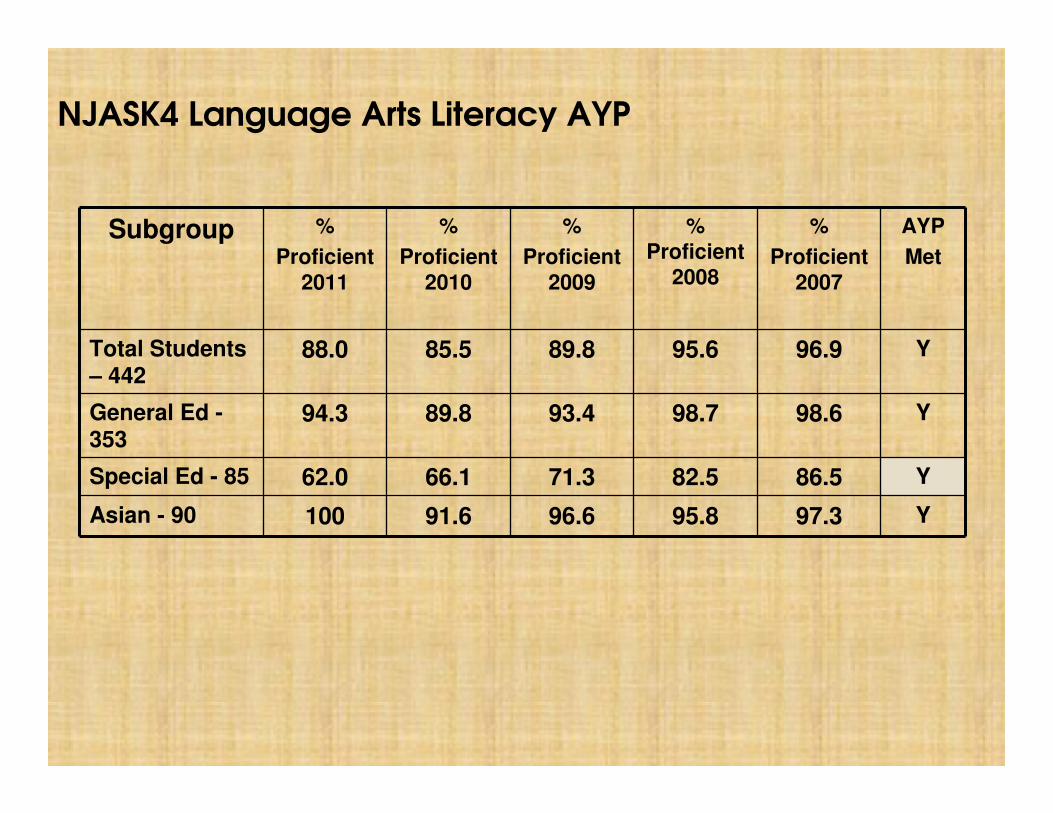
NJASK4 Language Arts Literacy AYP
Subgroup %
Proficient
2011
%
Proficient
2010
%
Proficient
2009
%
Proficient
2008
%
Proficient
2007
AYP
Met
Total Students – 442
88.0 85.5 89.8 95.6 96.9 Y
General Ed -353
94.3 89.8 93.4 98.7 98.6 Y
Special Ed - 85 62.0 66.1 71.3 82.5 86.5 Y
Asian - 90 100 91.6 96.6 95.8 97.3 Y
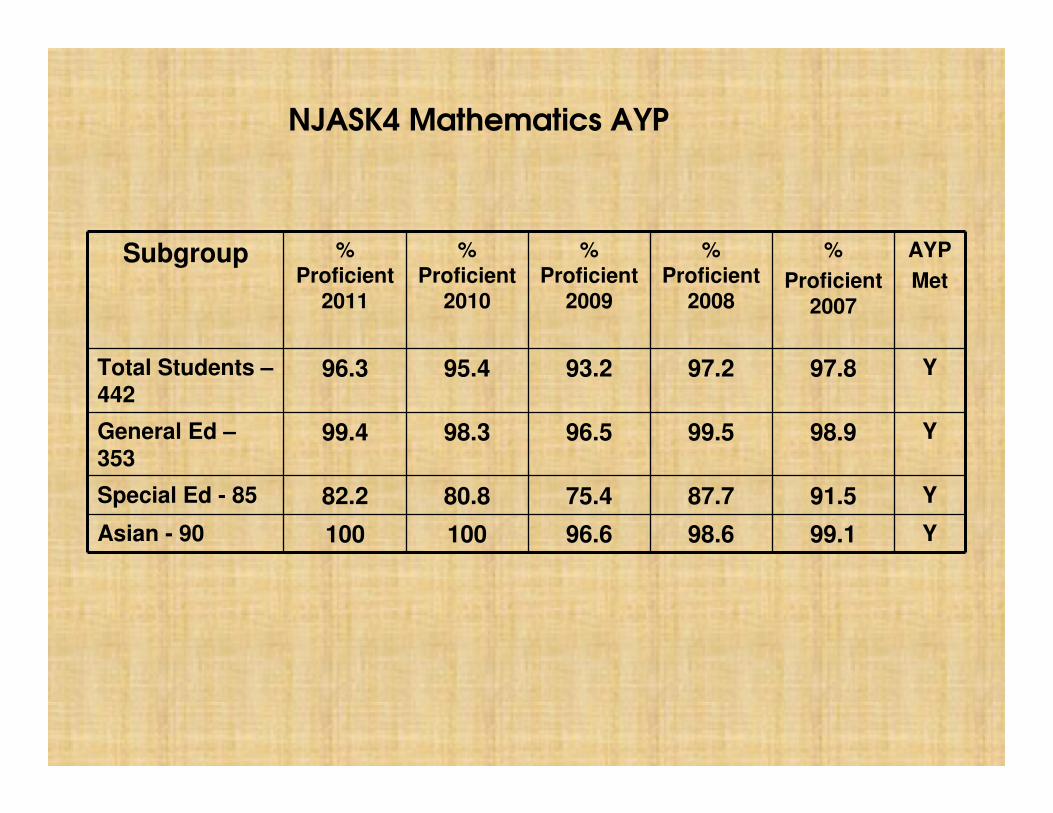
NJASK4 Mathematics AYP
Subgroup %
Proficient
2011
%
Proficient
2010
%
Proficient
2009
%
Proficient
2008
%
Proficient
2007
AYP
Met
Total Students –442
96.3 95.4 93.2 97.2 97.8 Y
General Ed –353
99.4 98.3 96.5 99.5 98.9 Y
Special Ed - 85 82.2 80.8 75.4 87.7 91.5 Y
Asian - 90 100 100 96.6 98.6 99.1 Y

NJASK4 Science
Subgroup % Proficient 2011
% Proficient 2010
Total Students – 442 97.0 98.8
General Ed - 353 98.6 98.8
Special Ed - 85 91.2 98.5
Asian - 90 100 100

NJASK5 Language Arts Literacy AYP
Subgroup % Proficient
2011
% Proficient
2010
% Proficient
2009
% Proficient
2008
AYP
Met
Total Students – 436
91.2 92.3 91.7 90.9 Y
General Ed -357
95.2 96.0 96.9 95.0 Y
Special Ed - 77 71.4 66.1 61.4 59.6 Y
Asian - 96 96.8 97.9 98.8 98.5 Y

NJASK5 Mathematics AYP
Subgroup %
Proficient
2011
%
Proficient
2010
%
Proficient
2009
%
Proficient
2008
AYP
Met
Total Students -436
97.9 98.2 96.6 95.1 Y
General Ed –357
98.9 100 99.7 98.4 Y
Special Ed - 77 94.2 84.8 78.5 70.8 Y
Asian - 96 100 98.9 100 97.1 Y

Mean Scores by Building-ASK 3 LAL

Mean Scores by Building-ASK 3 Math

Mean Scores by Building-ASK 4 LAL

Mean Scores by Building-ASK 4 Math
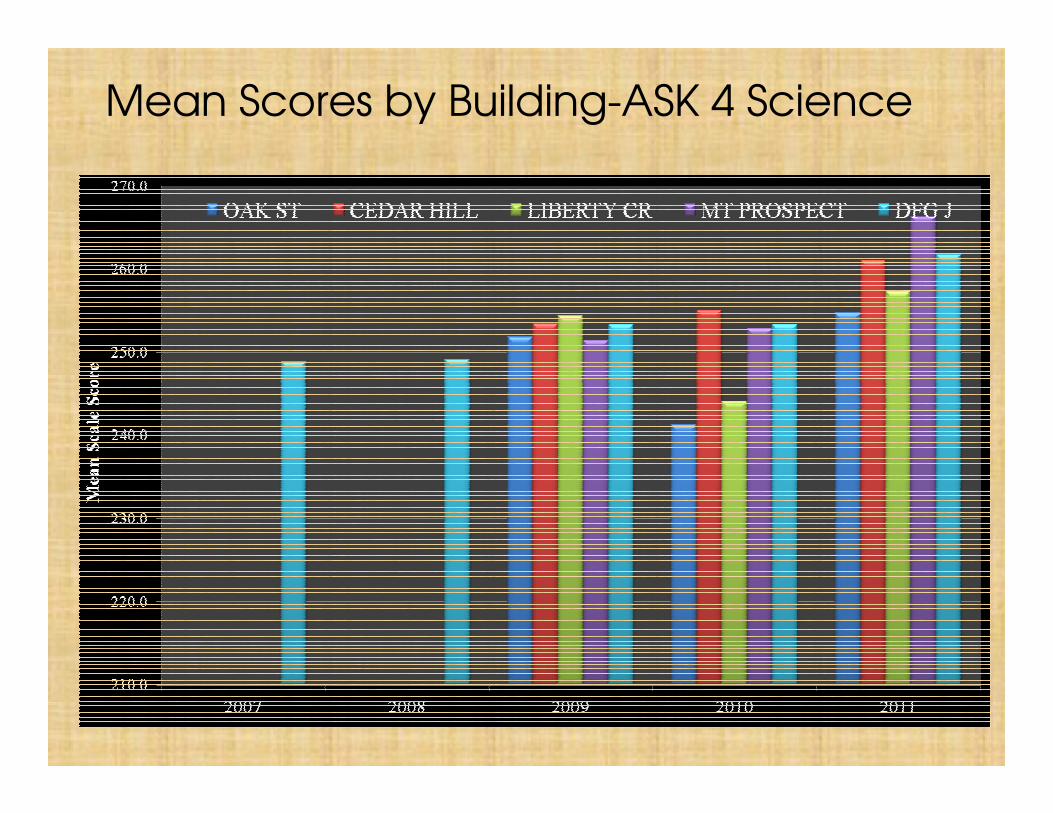
Mean Scores by Building-ASK 4 Science

Mean Scores by Building-ASK 5 LAL

Mean Scores by Building-ASK 5 Math
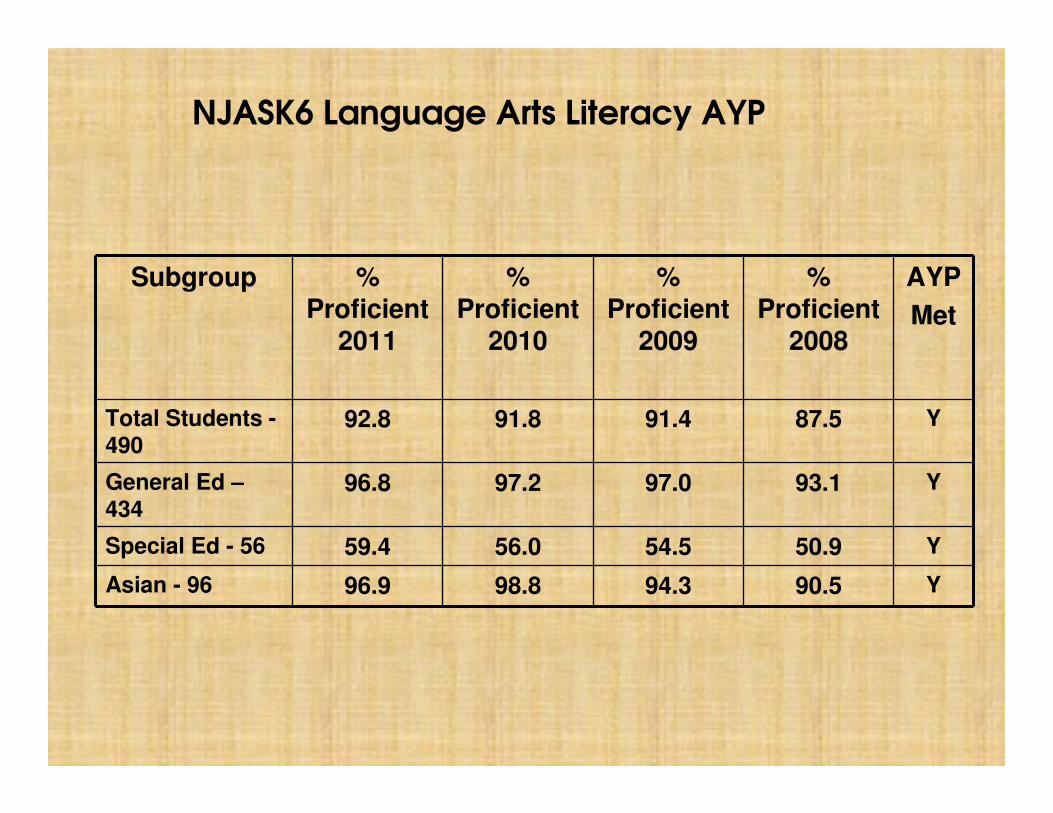
NJASK6 Language Arts Literacy AYP
Subgroup % Proficient
2011
% Proficient
2010
% Proficient
2009
% Proficient
2008
AYP
Met
Total Students -490
92.8 91.8 91.4 87.5 Y
General Ed –434
96.8 97.2 97.0 93.1 Y
Special Ed - 56 59.4 56.0 54.5 50.9 Y
Asian - 96 96.9 98.8 94.3 90.5 Y

NJASK6 Mathematics AYP
Subgroup % Proficient
2011
% Proficient
2010
% Proficient
2009
% Proficient
2008
AYP
Met
Total Students –490
95.9 91.9 91 95.8 Y
General Ed –434
98.9 96.7 96.4 99.2 Y
Special Ed – 56 71.7 62.1 56.4 71.9 Y
Asian - 96 99.0 98.7 98.5 100 Y

NJASK7 Language Arts Literacy AYP
Subgroup % Proficient
2011
% Proficient
2010
% Proficient
2009
% Proficient
2008
AYP
Met
Total Students –486
89.6 95.0 94.4 95.0 Y
General Ed - 415 95.9 98.0 97.3 99.2 Y
Special Ed - 69 50.8 73.6 76.8 68.5 Y
Asian - 84 98.8 98.6 98.6 96.5 Y

NJASK7 Mathematics AYP
Subgroup % Proficient
2011
% Proficient
2010
% Proficient
2009
% Proficient
2008
AYP
Met
Total Students -486
89.0 90.1 93.1 92.4 Y
General Ed - 415 95.9 95.5 96.8 97.3 Y
Special Ed - 69 47.7 49.0 66.1 61.1 Y
Asian – 84 96.3 97.2 100 94.7 Y

NJASK 8 – Language Arts Literacy AYP
Subgroup %
Proficient
2011
%
Proficient
2010
%
Proficient
2009
%
Proficient
2008
%
Proficient
2007
AYP
Met
Total Students -466
97.8 97.6 97.4 96.9 96.8 Y
General Ed - 401 99.8 99.8 99.2 99.0 97.6 Y
Special Ed - 64 86.4 83.6 86.8 87.5 88.9 Y
Asian - 77 98.7 100 98.3 97.1 97.2 Y

NJASK 8 – Mathematics AYP
Subgroup %
Proficient
2011
%
Proficient
2010
%
Proficient
2009
%
Proficient
2008
%
Proficient
2007
AYP
Met
Total Students -466
91.9 92.7 92.2 94.2 93.8 Y
General Ed -401
97.2 97.2 97.8 99.8 96.2 Y
Special Ed - 64 56 53.9 54.7 62.5 72.3 Y
Asian - 77 98.6 100 95 98.6 98.2 Y
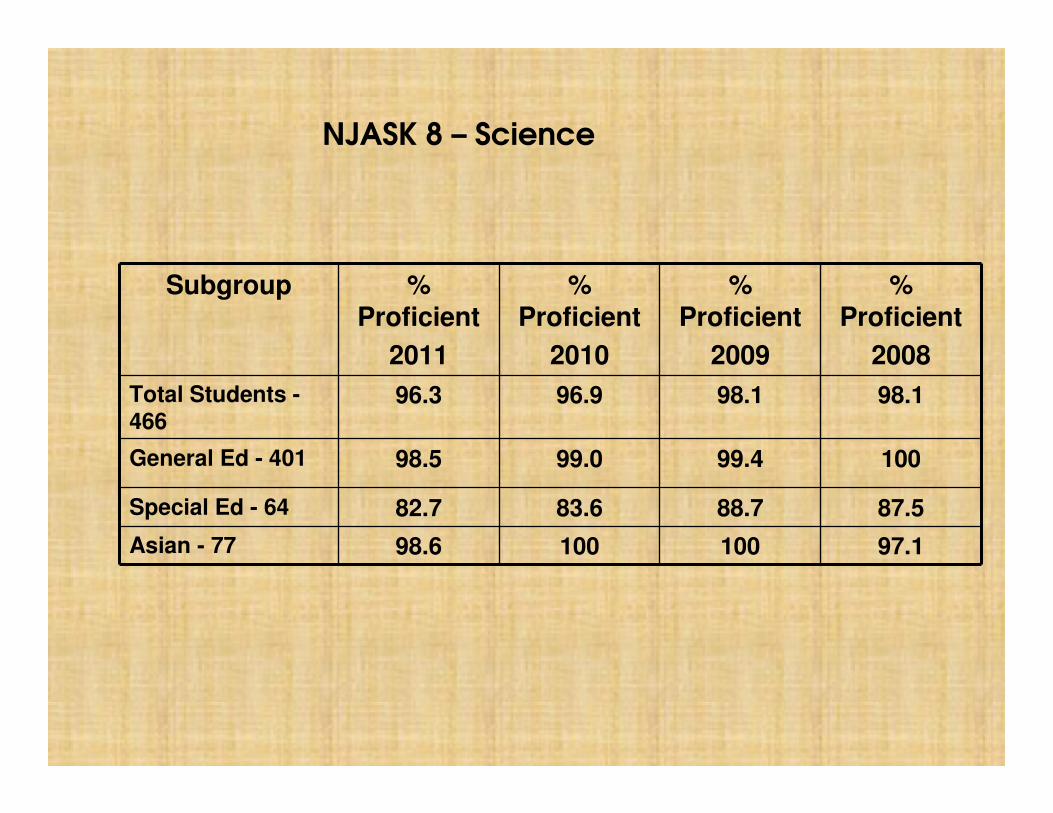
NJASK 8 – Science
Subgroup % Proficient
2011
% Proficient
2010
% Proficient
2009
% Proficient
2008
Total Students -466
96.3 96.9 98.1 98.1
General Ed - 401 98.5 99.0 99.4 100
Special Ed - 64 82.7 83.6 88.7 87.5
Asian - 77 98.6 100 100 97.1

Mean Scores -NJASK 6 LAL
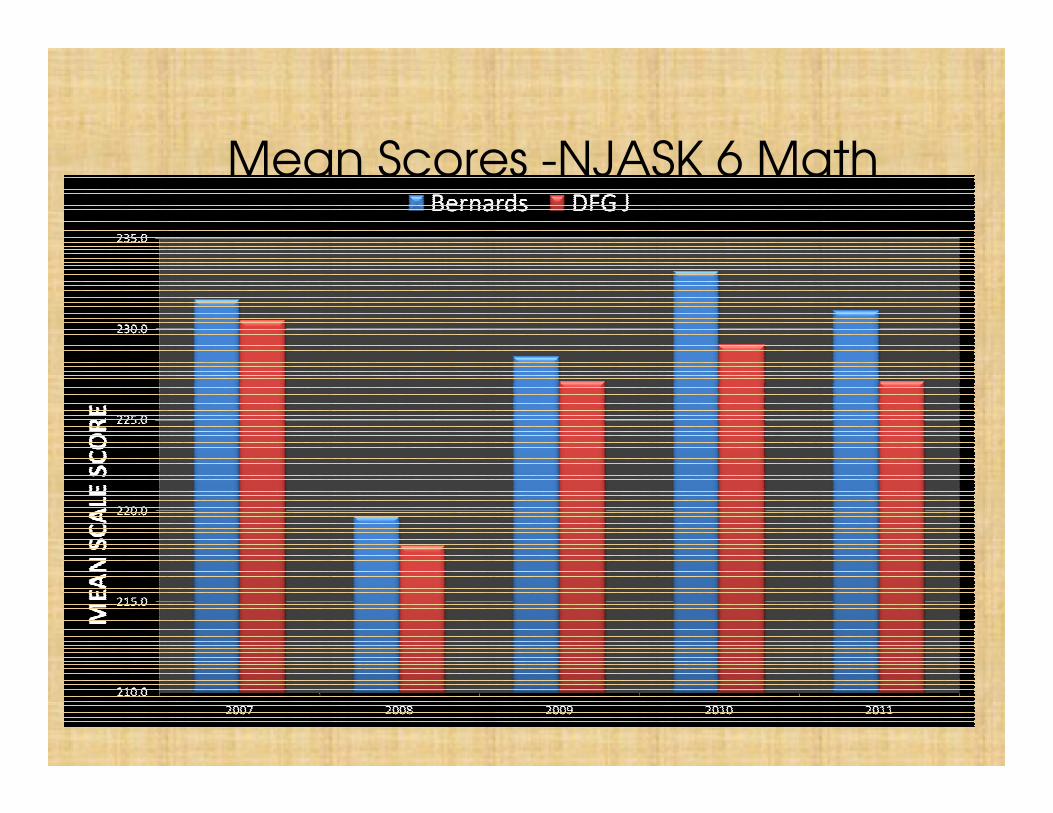
Mean Scores -NJASK 6 Math
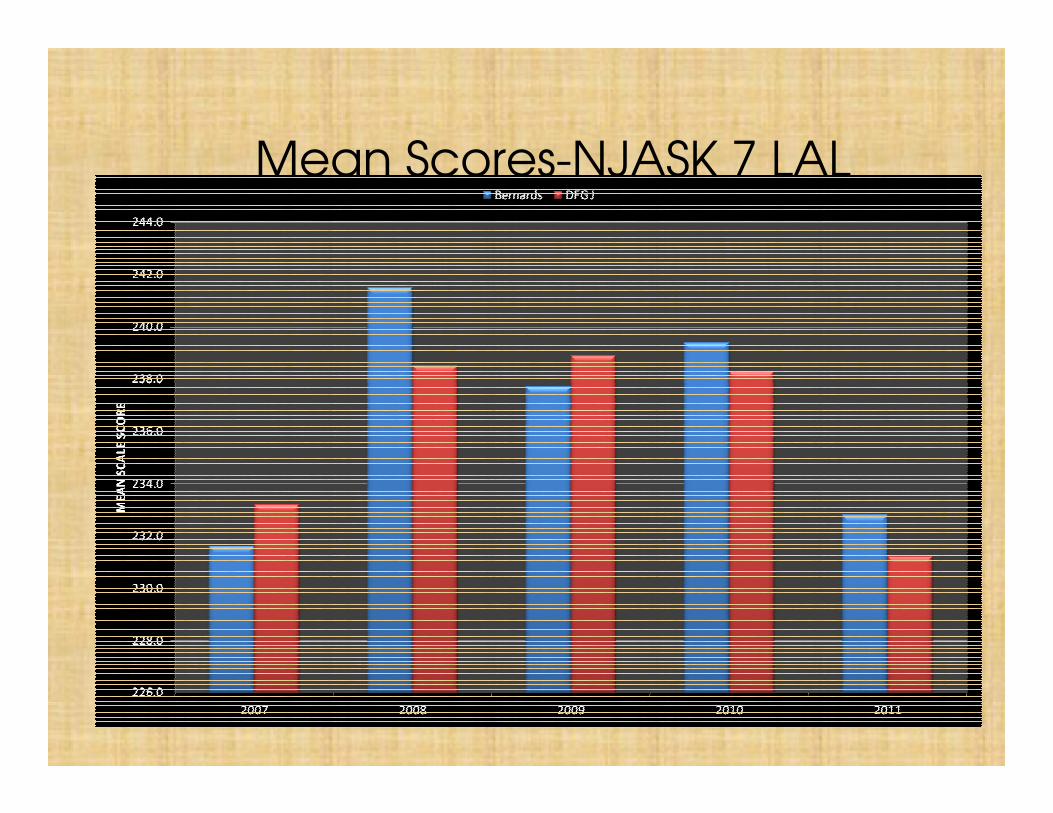
Mean Scores-NJASK 7 LAL

Mean Scores-NJASK 7 Math
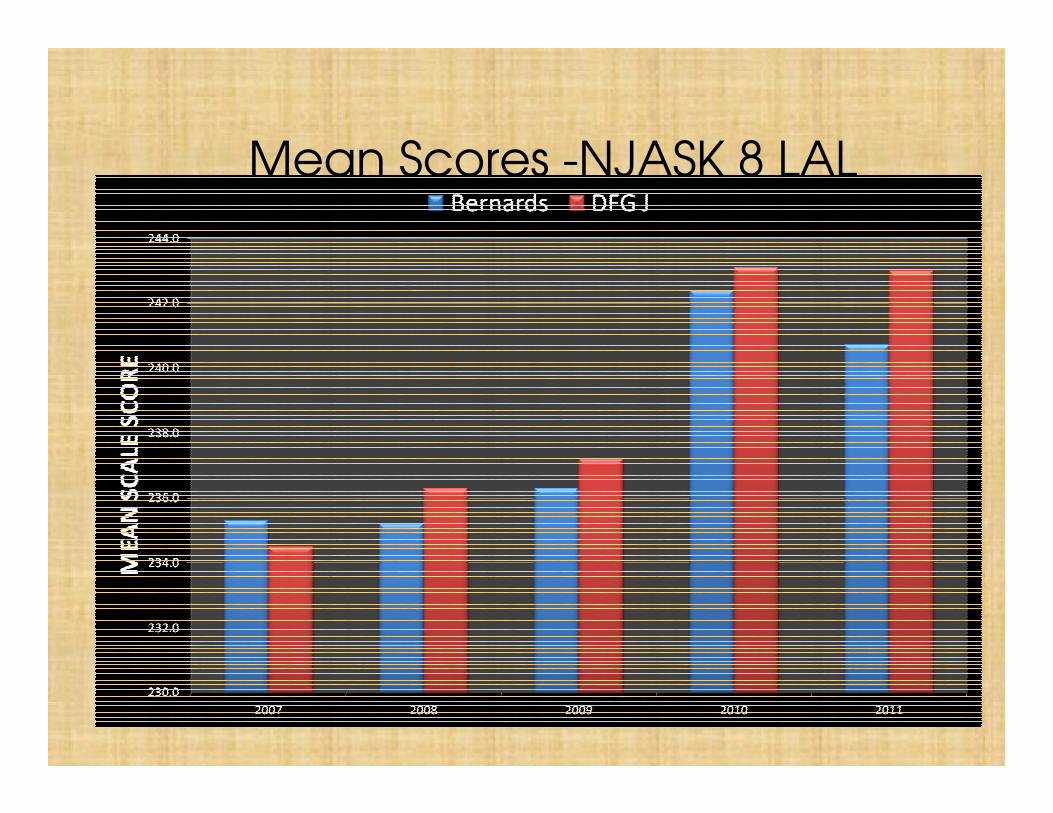
Mean Scores -NJASK 8 LAL

Mean Scores-NJASK 8 Math

Mean Scores-NJASK 8 Science
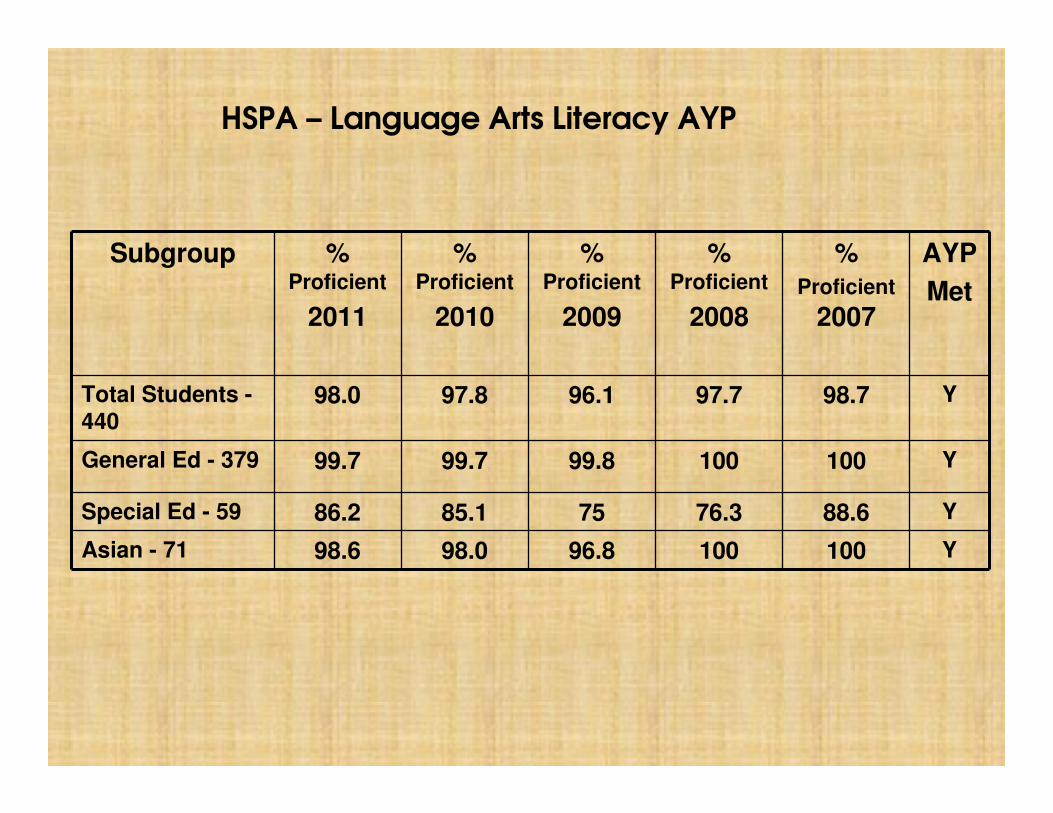
HSPA – Language Arts Literacy AYP
Subgroup % Proficient
2011
% Proficient
2010
% Proficient
2009
% Proficient
2008
% Proficient
2007
AYP
Met
Total Students -440
98.0 97.8 96.1 97.7 98.7 Y
General Ed - 379 99.7 99.7 99.8 100 100 Y
Special Ed - 59 86.2 85.1 75 76.3 88.6 Y
Asian - 71 98.6 98.0 96.8 100 100 Y

HSPA – Mathematics AYP
Subgroup % Proficient
2011
% Proficient
2010
% Proficient
2009
% Proficient
2008
% Proficient
2007
AYP
Met
Total Students -440
95.2 94.6 93.9 94.7 94.8 Y
General Ed -379
99.2 98.9 98.9 98.1 98.6 Y
Special Ed - 59 69.4 63.8 59.3 63.2 65.9 Y
Asian - 71 98.6 98.1 100 98.1 98.5 Y

Mean Scores-HSPA LAL

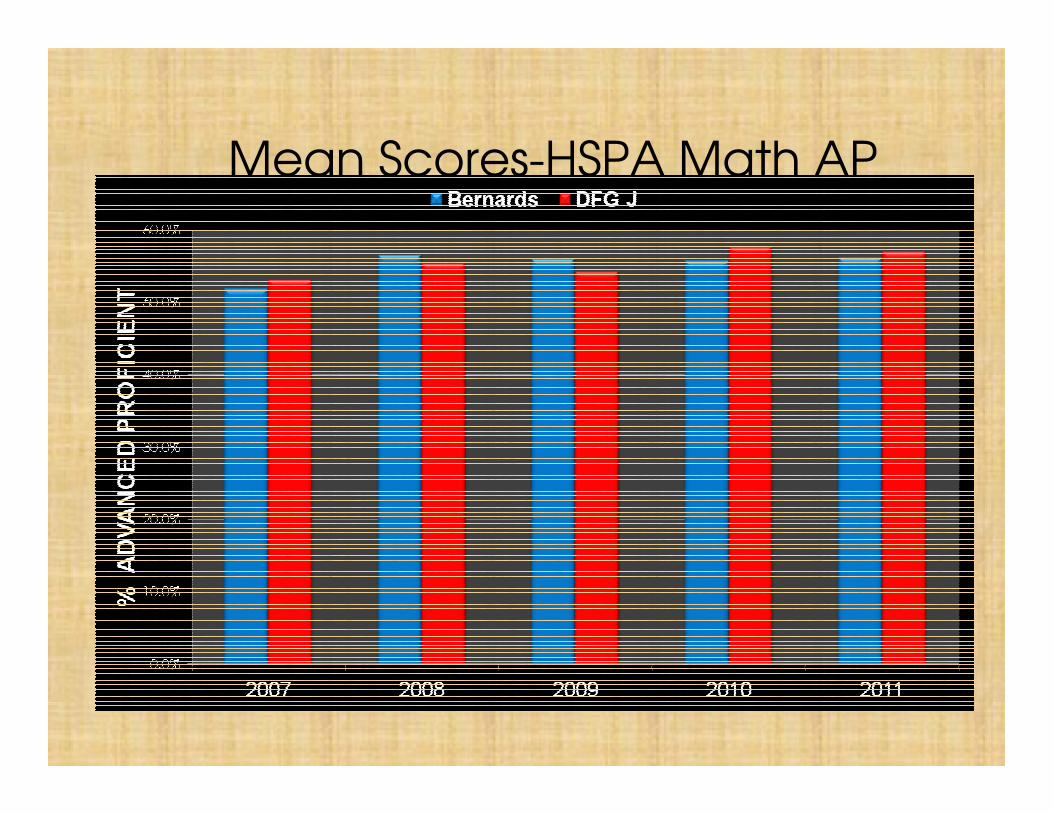
Mean Scores-HSPA LAL AP

Mean Scores-HSPA Math
Mean Scores-HSPA Math AP

EOC Biology
Subgroup % Proficient 2011
% Proficient
2010
Median Scaled Score
2011
Total Students - 453 86.7 86.4 243.3
General Ed – 392 91.4 90.9 248.6
Special Ed - 59 57.7 59.2 210.7
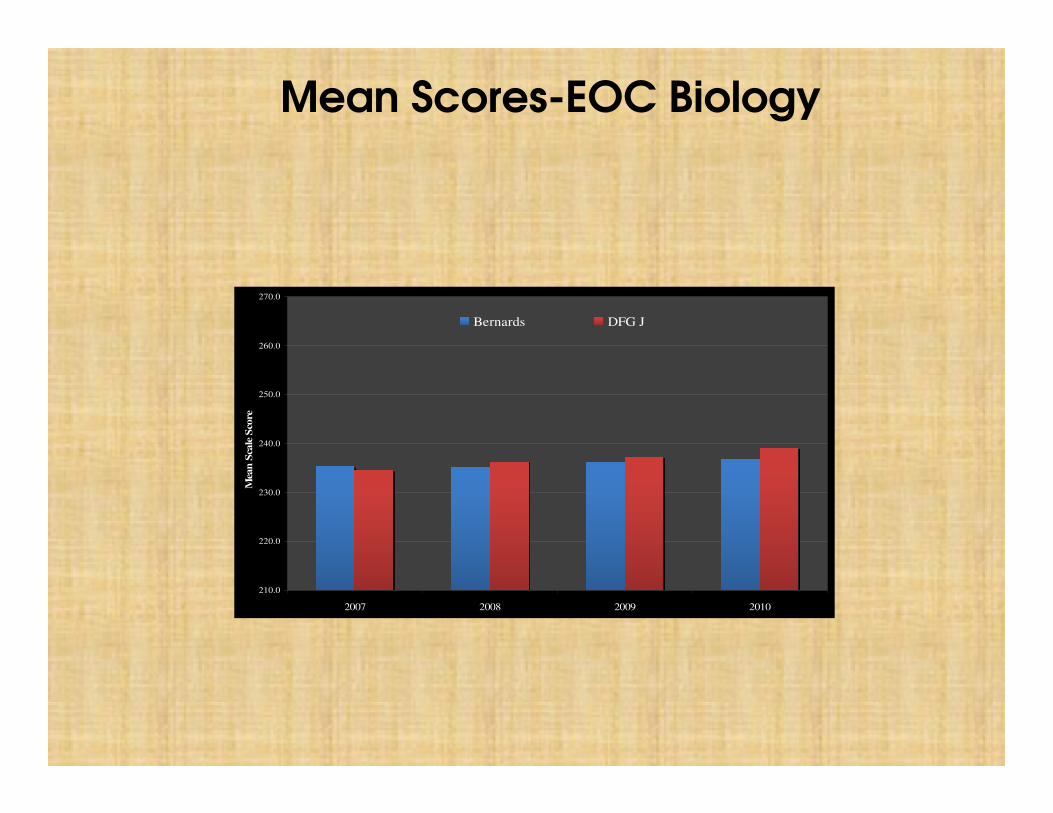
Mean Scores-EOC Biology
210.0
220.0
230.0
240.0
250.0
260.0
270.0
2007 2008 2009 2010
Mea
n S
cale
Sco
re
Bernards DFG J

Areas to address moving forward
• Special Ed. Subgroup
• DFG alignment in HSPA/EOC Biology
• Aligning curriculum with Common Core standards for ‘14-’15 testing cycle
• Setting expectations for students/parents K-8 ( stress reduction)
What are we doing to improve instruction?
• Focus on Literacy
• Reading Specialist and training
• Systematic staff development
– Implementation of K-5 LA Program Evaluation Recs. (Year 2)
– Assessment – Linking assessment to instruction
– Writing process
– Word study
– Reading comprehension/fluency
– Using online data analysis tool
– Align curriculum with Common Core Standards
– Performance Tracker

Goal: To Leave No Child Behind
• Objective: Meet Adequate Yearly Progress (AYP) with all subgroups.– Strategies:
• Determine level of proficiency required for 2012 administration of NJ standardized tests.
• Identify sub-groups in each building who are ‘at-risk’ for not meeting AYP.
• Develop specific objectives to meet the needs of sub-groups.
• Identify resources and personnel needed to achieve objectives.
• Ensure success on APA


