Paul Craven
Head of EMEA Institutional Business, GSAM
Behavioural Finance: from biases to
bubbles
This material is provided for educational purposes only and should not be construed as investment advice or an offer or solicitation to buy or sell securities.

The Jastrow Illusion A question of perspective
Source: Joseph Jastrow (1889). For illustrative purposes only. 1

Today’s talk
A. How Behavioural Finance can help
System 1 vs. System 2 Thinking
Cognitive Biases - The Herd Instinct, Base Rate Neglect and Anchoring
Bubbles - Historical Examples
B. What can we do about our biases?
The Loser’s Game
Market Cap. Indices
The Wisdom of Crowds, Randomness & ‘Nudge’
2
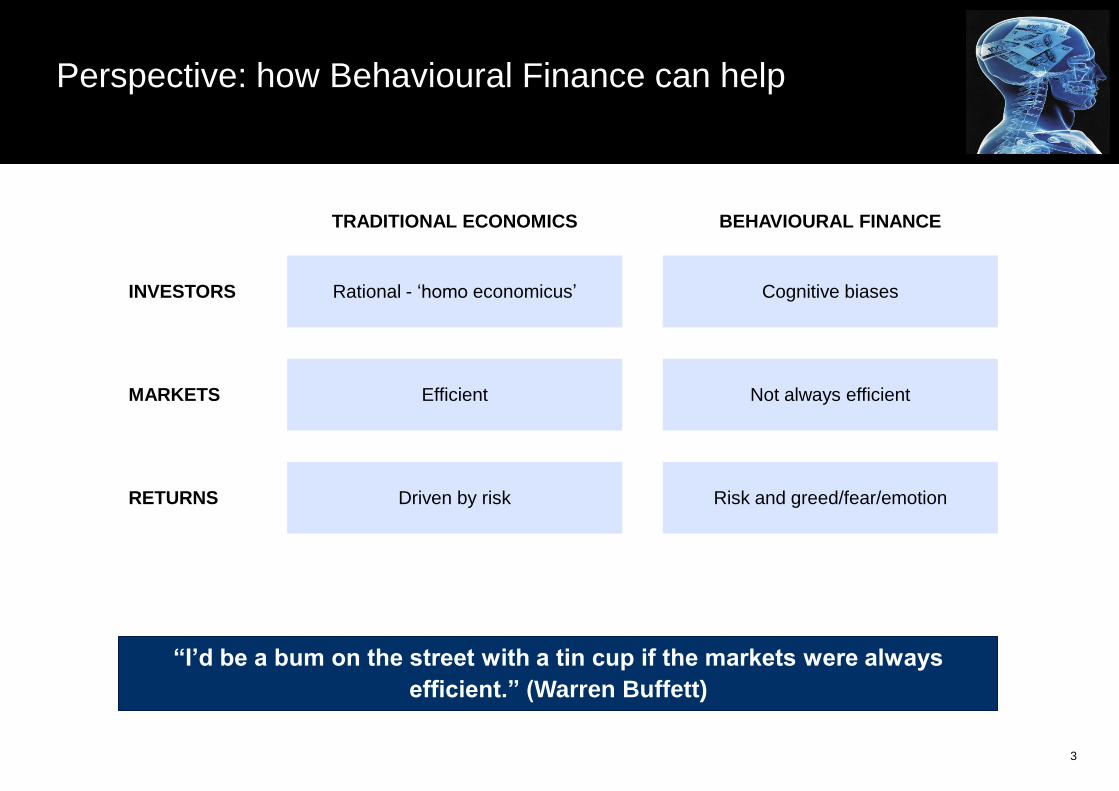
Perspective: how Behavioural Finance can help
3
“I’d be a bum on the street with a tin cup if the markets were always
efficient.” (Warren Buffett)
TRADITIONAL ECONOMICS BEHAVIOURAL FINANCE
INVESTORS
MARKETS
RETURNS
Rational - ‘homo economicus’ Cognitive biases
Efficient Not always efficient
Driven by risk Risk and greed/fear/emotion

System 1 vs. System 2 ‘Dual process’ model of the brain
4
“System 1 can never be switched off…” (Daniel Kahneman)
SYSTEM 2 – THINKING SLOW
Evolutionarily recent, rational, analytical
Source: Individual Differences in Reasoning, Keith Stanovitch and Richard West (2000), Thinking Fast and Slow, Daniel Kahneman (2011).
Hard wired, instinctive, based on intuition
SYSTEM 1 - THINKING FAST
Conscious reasoning, requires effort, slow process Unconscious reasoning, effortless, quick process
Influenced by evidence, facts and logic Influenced by emotions and memories
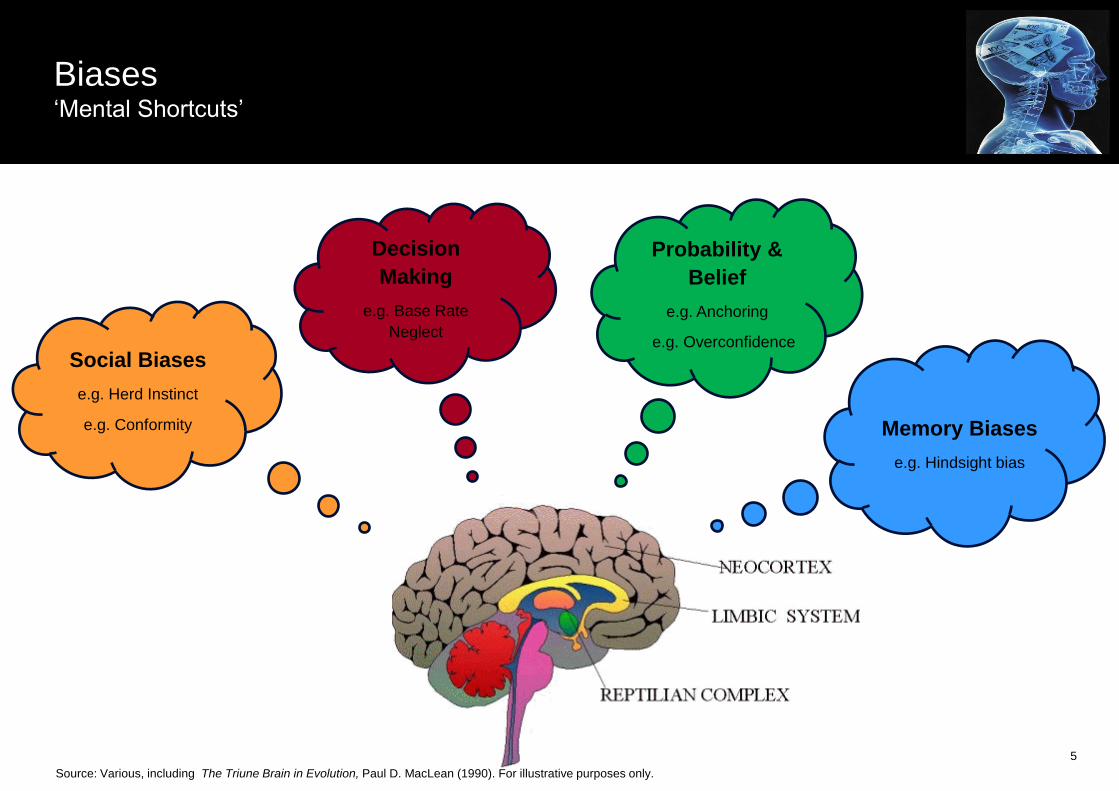
Biases ‘Mental Shortcuts’
5
Probability &
Belief
e.g. Anchoring
e.g. Overconfidence
Decision
Making
e.g. Base Rate
Neglect
Social Biases
e.g. Herd Instinct
e.g. Conformity
Memory Biases
e.g. Hindsight bias
Source: Various, including The Triune Brain in Evolution, Paul D. MacLean (1990). For illustrative purposes only.
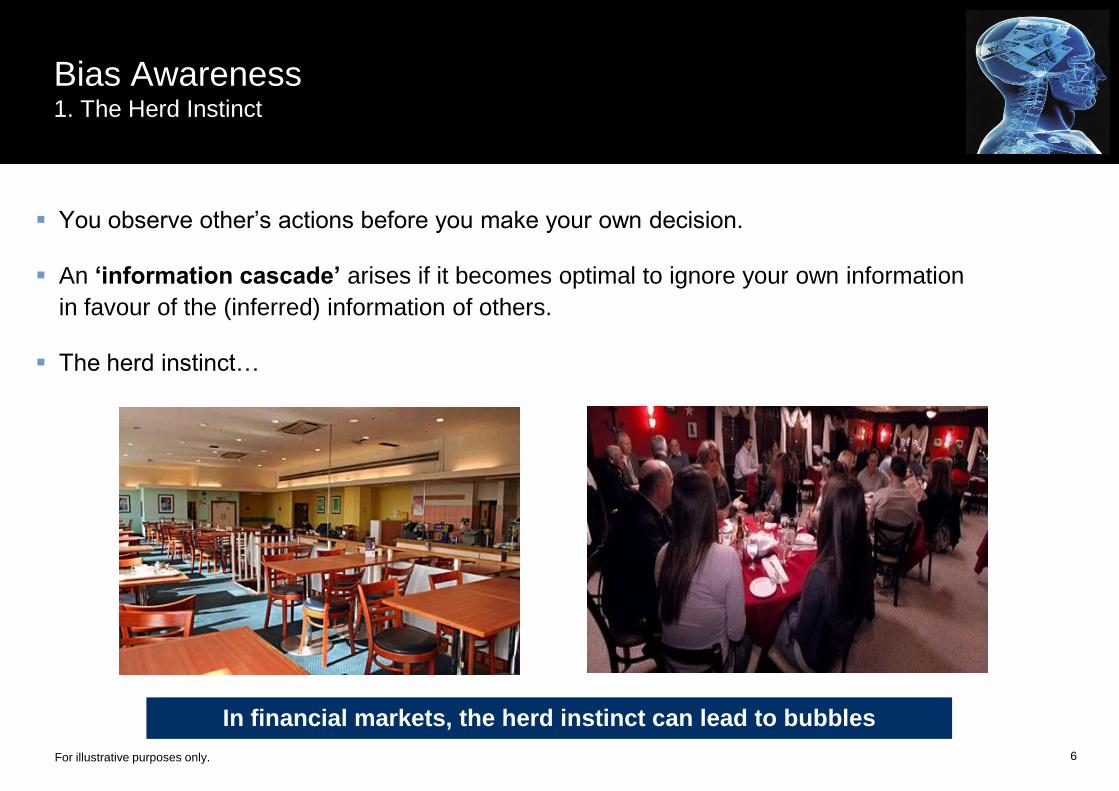
Bias Awareness 1. The Herd Instinct
You observe other’s actions before you make your own decision.
An ‘information cascade’ arises if it becomes optimal to ignore your own information
in favour of the (inferred) information of others.
The herd instinct…
6 For illustrative purposes only.
In financial markets, the herd instinct can lead to bubbles
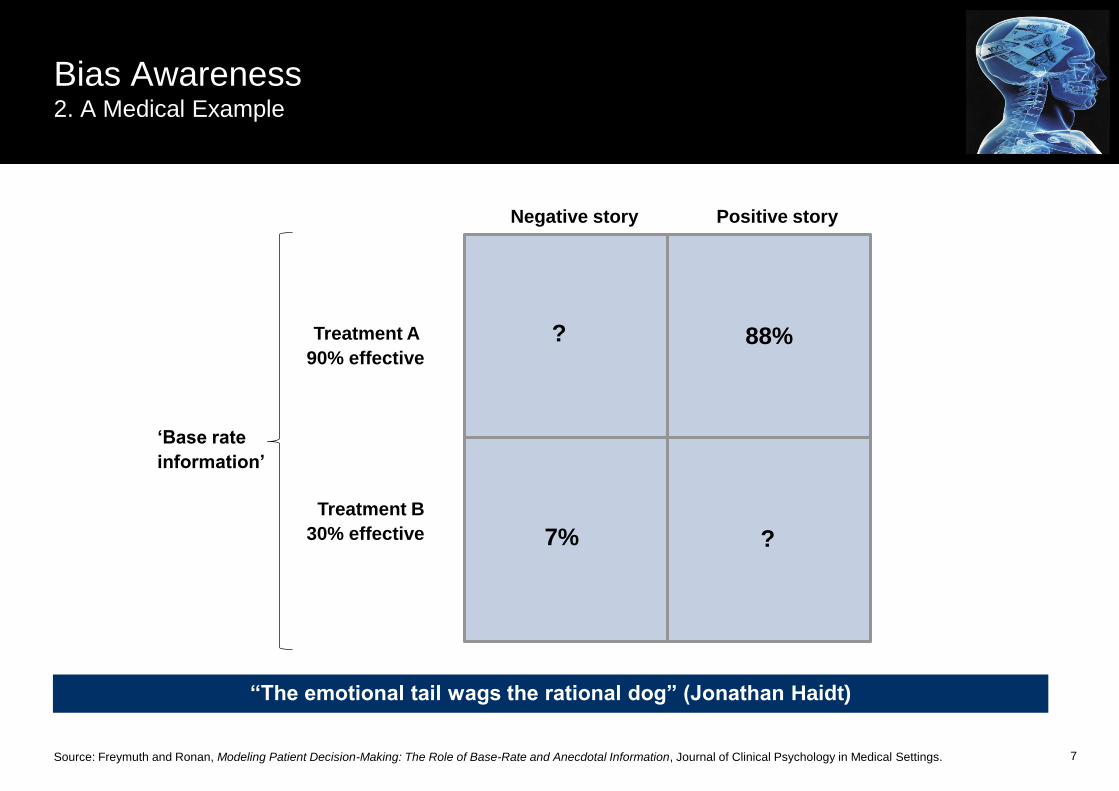
Source: Freymuth and Ronan, Modeling Patient Decision-Making: The Role of Base-Rate and Anecdotal Information, Journal of Clinical Psychology in Medical Settings. 7
“The emotional tail wags the rational dog” (Jonathan Haidt)
Negative story Positive story
88% Treatment A
90% effective
Treatment B
30% effective ? 7%
‘Base rate
information’
Bias Awareness 2. A Medical Example
?

Bias Awareness 3. Anchoring
8
A cognitive bias whereby we rely too heavily on a particular piece of information
Sometimes we unconsciously or illogically anchor on irrelevant information
Important consequences for assessing probabilities
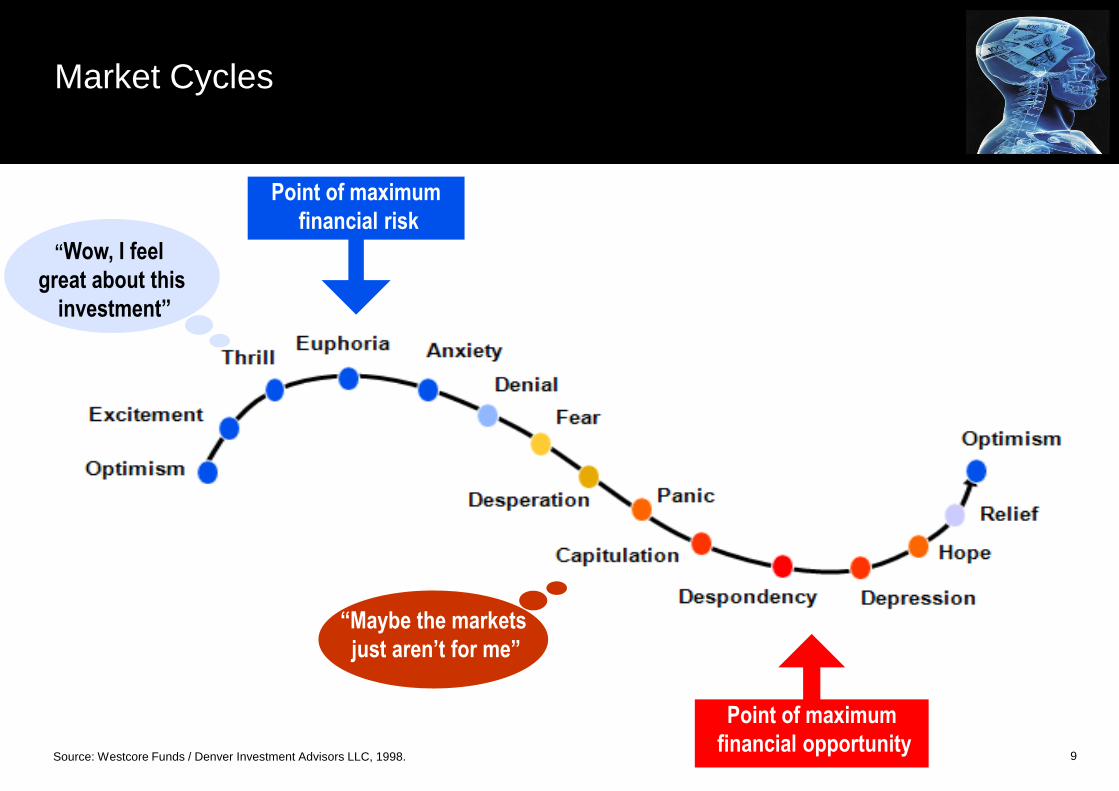
“Wow, I feel
great about this
investment”
Point of maximum
financial risk
“Maybe the markets
just aren’t for me”
Source: Westcore Funds / Denver Investment Advisors LLC, 1998.
Market Cycles
Point of maximum
financial opportunity 9
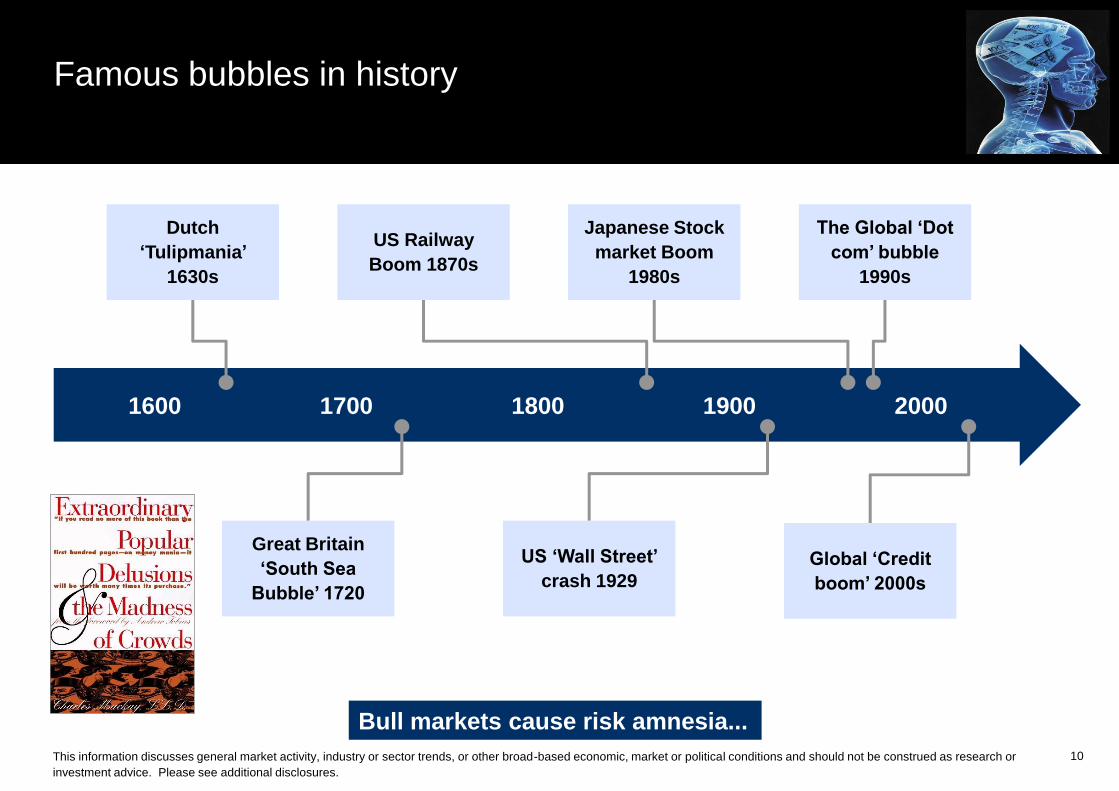
Famous bubbles in history
10
1600 1700 1800 1900 2000
Dutch
‘Tulipmania’
1630s
US Railway
Boom 1870s
Japanese Stock
market Boom
1980s
The Global ‘Dot
com’ bubble
1990s
Great Britain
‘South Sea
Bubble’ 1720
US ‘Wall Street’
crash 1929
Global ‘Credit
boom’ 2000s
Bull markets cause risk amnesia...
This information discusses general market activity, industry or sector trends, or other broad-based economic, market or political conditions and should not be construed as research or
investment advice. Please see additional disclosures.

Recent Bubbles An emotional rollercoaster
11
"History does not repeat itself, but it does rhyme” (Mark Twain)
Source: Dr Jean-Paul Rodrigue, Hofstra University. This information discusses general market activity, industry or sector trends, or other broad-based economic, market or political
conditions and should not be construed as research or investment advice. Please see additional disclosures.

Beware the Lazy Consensus
Source: GMO. This information discusses general market activity, industry or sector trends, or other broad-based economic, market or political conditions and should not be construed
as research or investment advice. For illustrative purposes only.
12
12
10
8
6
4
2
0
-2
-4
-6
-8
Ja
n-8
6
Ja
n-8
7
Ja
n-8
8
Ja
n-8
9
Ja
n-9
0
Ja
n-9
1
Ja
n-9
2
Ja
n-9
3
Jan-9
4
Ja
n-9
5
Ja
n-9
6
Ja
n-9
7
Ja
n-9
8
Ja
n-9
9
Ja
n-0
0
Ja
n-0
1
Ja
n-0
2
Jan-0
3
US
$ d
evia
tio
n f
rom
tre
nd
Earnings
Forecasts
The consensus reflects the herd instinct, base rate neglect and anchoring
B. What can we do about our biases?
The Loser’s Game
Market Cap. Indices
The Wisdom of Crowds, Randomness & ‘Nudge’
13
Tennis: “The victor in a game of tennis gets a higher score than the opponent, but he
gets the higher score because his opponent is losing even more points.” (Charles D. Ellis)
“The Loser’s Game” Market cap. equity and bond indices flawed
The key is to AVOID LOSERS – often more important than picking winners:
Keep it simple
Concentrate on your defences
Don’t take it personally
Play your own game
Source: The Loser’s Game, Charles Ellis, Financial Analysts Journal, July 1975 . http://www.ifa.com/pdf/EllisCharlesThe_Loser's_Game1975.pdf.
This principle can apply to investment, waging war, campaigning for office, flying a plane
Market Cap. Benchmarks: inherently flawed because they contain losers
14
0%
5%
10%
15%
20%
25%
30%
35%
40%
45%
50%
1982
1984
1986
1988
1990
1992
1994
1996
1998
2000
2002
2004
2006
2008
2010
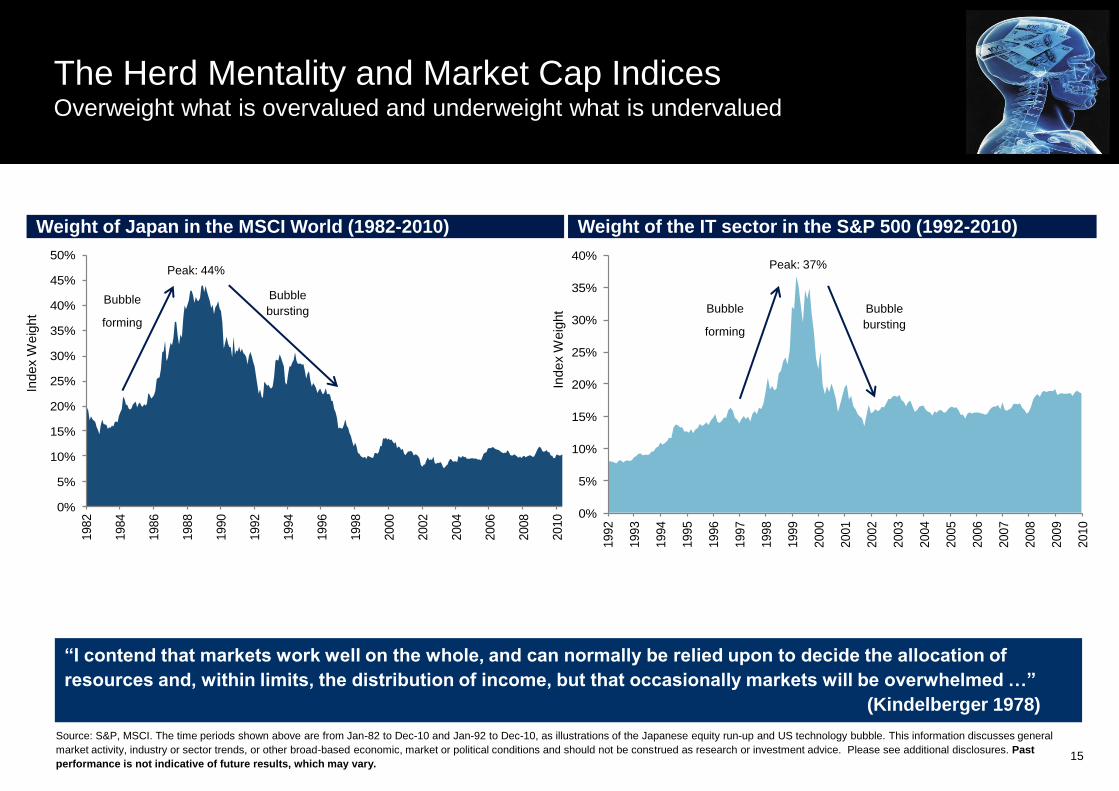
The Herd Mentality and Market Cap Indices Overweight what is overvalued and underweight what is undervalued
Source: S&P, MSCI. The time periods shown above are from Jan-82 to Dec-10 and Jan-92 to Dec-10, as illustrations of the Japanese equity run-up and US technology bubble. This information discusses general
market activity, industry or sector trends, or other broad-based economic, market or political conditions and should not be construed as research or investment advice. Please see additional disclosures. Past
performance is not indicative of future results, which may vary.
0%
5%
10%
15%
20%
25%
30%
35%
40%
1992
1993
1994
1995
1996
1997
1998
1999
2000
2001
2002
2003
2004
2005
2006
2007
2008
2009
2010
Index W
eig
ht
Index W
eig
ht
Weight of Japan in the MSCI World (1982-2010) Weight of the IT sector in the S&P 500 (1992-2010)
Bubble
forming
Bubble
bursting Bubble
forming
Bubble
bursting
Peak: 44% Peak: 37%
“I contend that markets work well on the whole, and can normally be relied upon to decide the allocation of
resources and, within limits, the distribution of income, but that occasionally markets will be overwhelmed …”
(Kindelberger 1978)
15
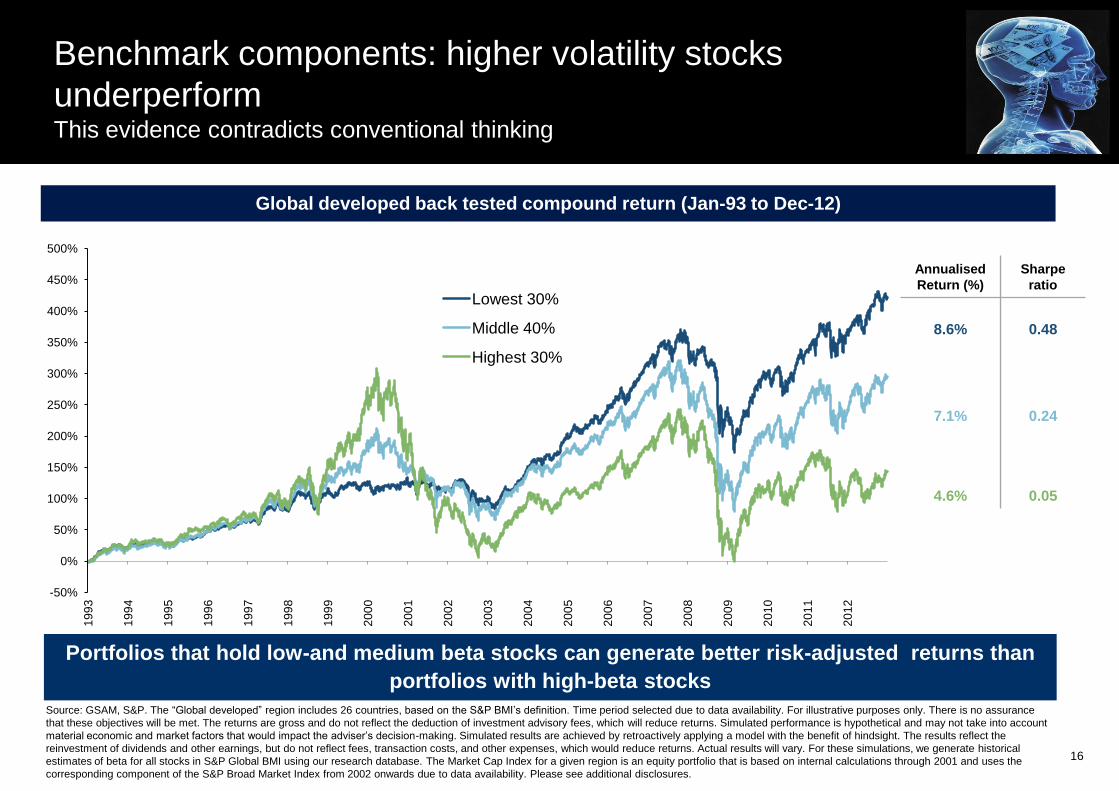
Benchmark components: higher volatility stocks
underperform This evidence contradicts conventional thinking
16
Global developed back tested compound return (Jan-93 to Dec-12)
Portfolios that hold low-and medium beta stocks can generate better risk-adjusted returns than
portfolios with high-beta stocks
-50%
0%
50%
100%
150%
200%
250%
300%
350%
400%
450%
500%
19
93
19
94
19
95
19
96
19
97
19
98
19
99
20
00
20
01
20
02
20
03
20
04
20
05
20
06
20
07
20
08
20
09
20
10
20
11
20
12
Lowest 30%
Middle 40%
Highest 30%
Source: GSAM, S&P. The “Global developed” region includes 26 countries, based on the S&P BMI’s definition. Time period selected due to data availability. For illustrative purposes only. There is no assurance
that these objectives will be met. The returns are gross and do not reflect the deduction of investment advisory fees, which will reduce returns. Simulated performance is hypothetical and may not take into account
material economic and market factors that would impact the adviser’s decision-making. Simulated results are achieved by retroactively applying a model with the benefit of hindsight. The results reflect the
reinvestment of dividends and other earnings, but do not reflect fees, transaction costs, and other expenses, which would reduce returns. Actual results will vary. For these simulations, we generate historical
estimates of beta for all stocks in S&P Global BMI using our research database. The Market Cap Index for a given region is an equity portfolio that is based on internal calculations through 2001 and uses the
corresponding component of the S&P Broad Market Index from 2002 onwards due to data availability. Please see additional disclosures.
Annualised
Return (%)
Sharpe
ratio
8.6%
0.48
7.1%
0.24
4.6%
0.05
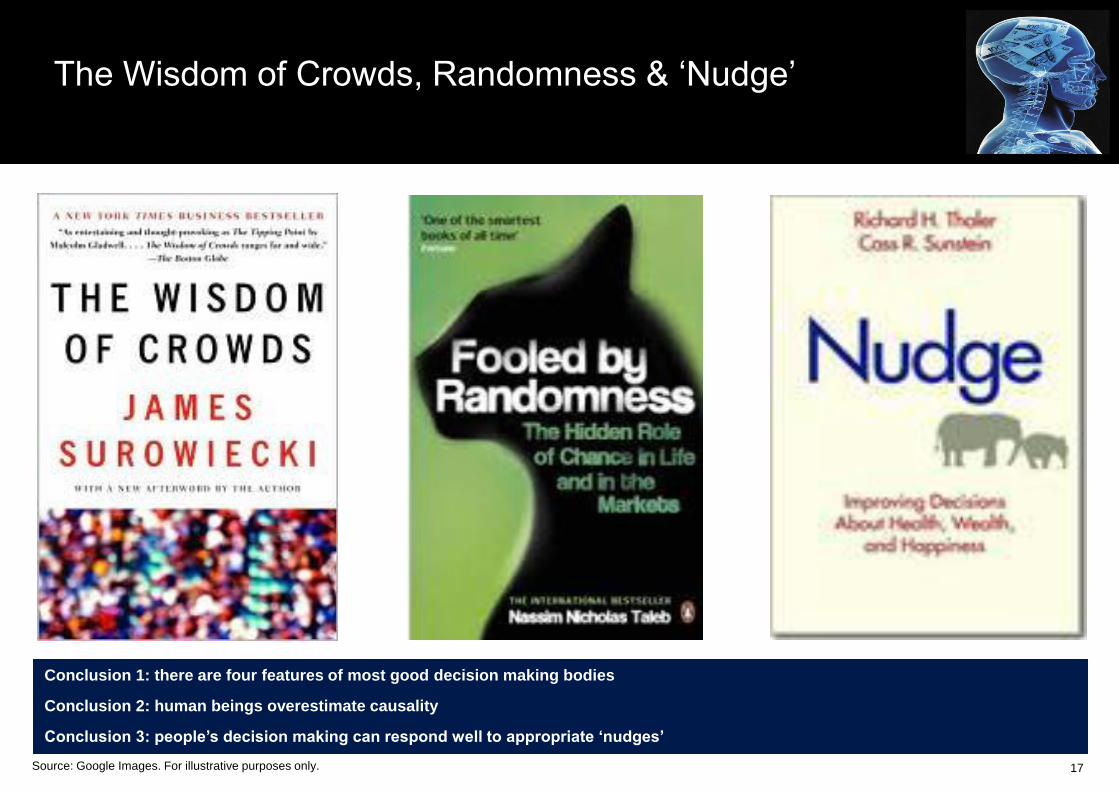
The Wisdom of Crowds, Randomness & ‘Nudge’
17
Conclusion 1: there are four features of most good decision making bodies
Conclusion 2: human beings overestimate causality
Conclusion 3: people’s decision making can respond well to appropriate ‘nudges’
Source: Google Images. For illustrative purposes only.

Diversity of Opinion Ensure there are a diversity of backgrounds, roles, interests and personality types
Independence Due diligence based on independent facts and assign homework
Being part of a Wise Crowd Decision making
Decentralisation Specialist or local knowledge and encourage all members to speak up (incl. devil’s
advocates)
Aggregation Collective decisions: agenda, goals, voting systems etc.
These appear necessary for any effective team…
… including decision making groups and trustee boards
Source: James Surowiecki, The Wisdom of Crowds, 2004. 18
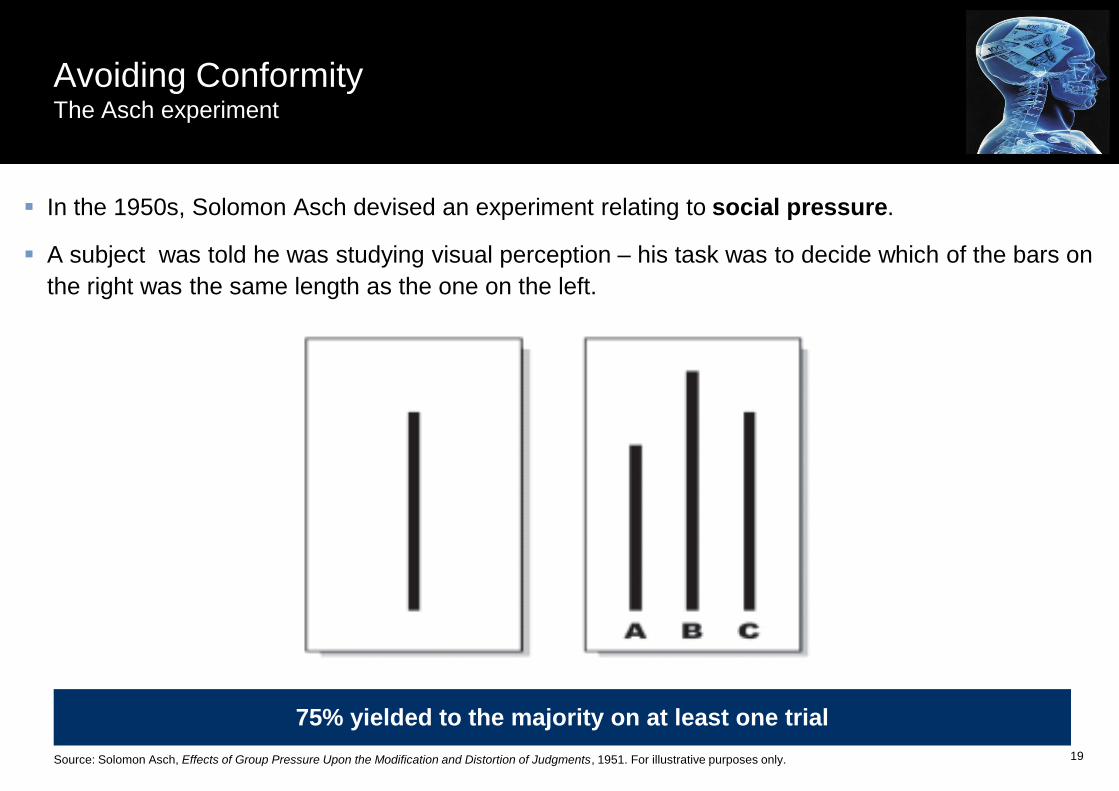
Avoiding Conformity The Asch experiment
In the 1950s, Solomon Asch devised an experiment relating to social pressure.
A subject was told he was studying visual perception – his task was to decide which of the bars on
the right was the same length as the one on the left.
Source: Solomon Asch, Effects of Group Pressure Upon the Modification and Distortion of Judgments, 1951. For illustrative purposes only. 19
75% yielded to the majority on at least one trial
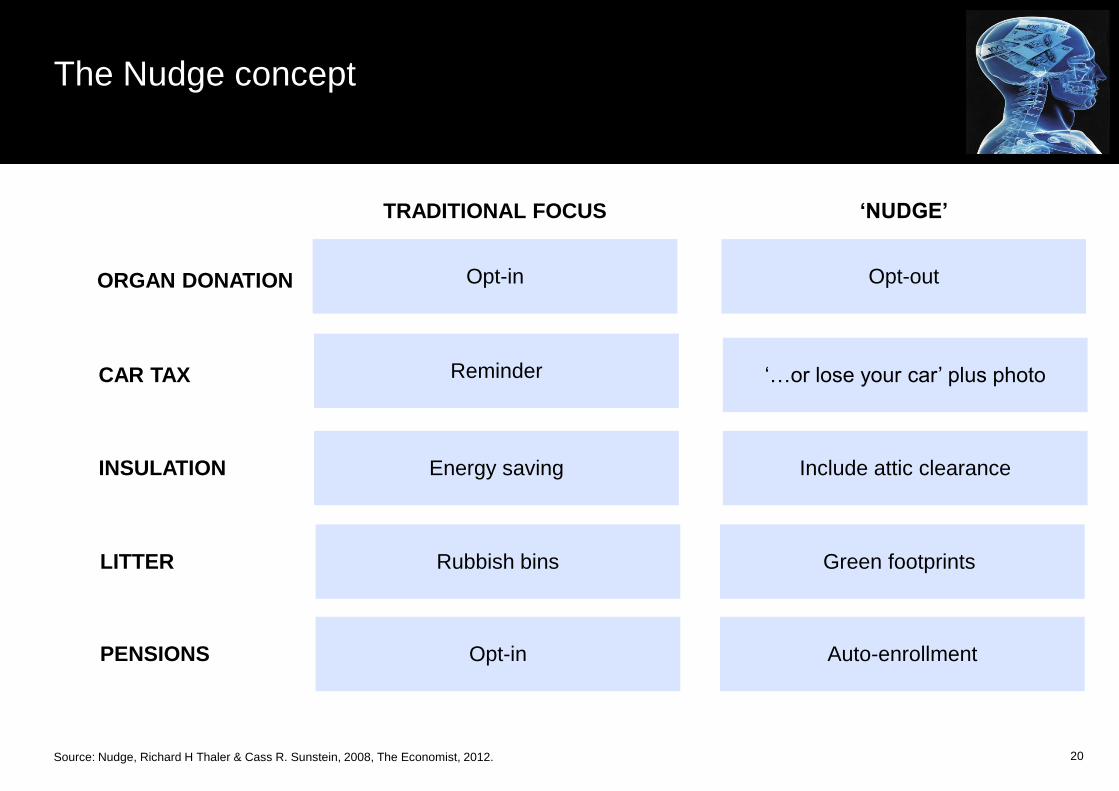
Opt-in Opt-out
Reminder ‘…or lose your car’ plus photo
Energy saving Include attic clearance
Rubbish bins Green footprints
Opt-in Auto-enrollment
The Nudge concept
20 Source: Nudge, Richard H Thaler & Cass R. Sunstein, 2008, The Economist, 2012.
TRADITIONAL FOCUS ‘NUDGE’
ORGAN DONATION
CAR TAX
INSULATION
LITTER
PENSIONS
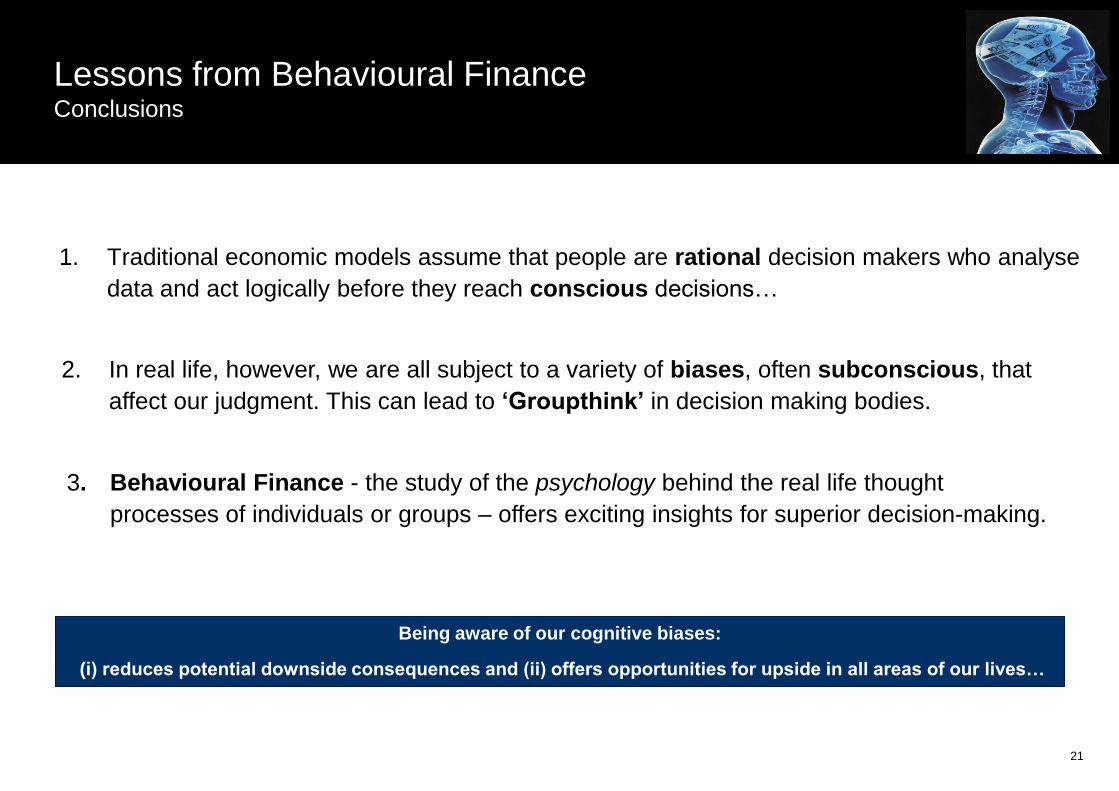
Lessons from Behavioural Finance Conclusions
21
1. Traditional economic models assume that people are rational decision makers who analyse
data and act logically before they reach conscious decisions…
3. Behavioural Finance - the study of the psychology behind the real life thought
processes of individuals or groups – offers exciting insights for superior decision-making.
2. In real life, however, we are all subject to a variety of biases, often subconscious, that
affect our judgment. This can lead to ‘Groupthink’ in decision making bodies.
Being aware of our cognitive biases:
(i) reduces potential downside consequences and (ii) offers opportunities for upside in all areas of our lives…

Shades of Grey...
...do you prefer shade A or shade B?
22
Source: http:// www.moillusions.com. For illustrative purposes only.
Be prepared to challenge your own beliefs…

Appendix

Biography
Paul Craven Head of EMEA Institutional Business,
Goldman Sachs Asset Management
Paul is head of EMEA Institutional Business. He joined Goldman Sachs Asset
Management in 2007 as a managing director. Prior to joining the firm, Paul worked
at PIMCO Europe Ltd for four years, where he was head of UK Business
Development. Previously, he spent seventeen years at Schroders as a portfolio
manager and latterly as head of UK Institutional Sales.
He is a Trustee of the Goldman Sachs Pension Plan and is a regular guest
speaker on the topic of behavioural finance at the Cass and London Business
Schools. Paul has an MA (Hons) in History from St. John’s College, Cambridge
University, is a Freeman of the City of London, and is a member of the CFA Institute
and the Magic Circle.

Additional notes
This material is provided at your request solely for your use. This material is provided for educational purposes only and should not be construed as investment advice or an offer
or solicitation to buy or sell securities.
Views and opinions expressed are for informational purposes only and do not constitute a recommendation by GSAM to buy, sell, or hold any security. Views and opinions are
current as of the date of this presentation and may be subject to change, they should not be construed as investment advice.
These examples are for illustrative purposes only and are not actual results. If any assumptions used do not prove to be true, results may vary substantially.
Past performance does not guarantee future results, which may vary. The value of investments and the income derived from investments will fluctuate and can go
down as well as up. A loss of principal may occur.
Economic and market forecasts presented herein reflect our judgment as of the date of this presentation and are subject to change without notice. These forecasts do not take into
account the specific investment objectives, restrictions, tax and financial situation or other needs of any specific client. Actual data will vary and may not be reflected here. These
forecasts are subject to high levels of uncertainty that may affect actual performance. Accordingly, these forecasts should be viewed as merely representative of a broad range of
possible outcomes. These forecasts are estimated, based on assumptions, and are subject to significant revision and may change materially as economic and market conditions
change. Goldman Sachs has no obligation to provide updates or changes to these forecasts. Case studies and examples are for illustrative purposes only.
Although certain information has been obtained from sources believed to be reliable, we do not guarantee its accuracy, completeness or fairness. We have relied upon and
assumed without independent verification, the accuracy and completeness of all information available from public sources.
Backtested performance results do not represent the results of actual trading using client assets. They do not reflect the reinvestment of dividends, the deduction of any fees,
commissions or any other expenses a client would have to pay. If GSAM had managed your account during the period, it is highly improbable that your account would have been
managed in a similar fashion due to differences in economic and market conditions.
This material has been prepared by GSAM and is not a product of Goldman Sachs Global Investment Research. The views and opinions expressed may differ from those of
Goldman Sachs Global Investment Research or other departments or divisions of Goldman Sachs and its affiliates. Investors are urged to consult with their financial advisors
before buying or selling any securities. This information may not be current and GSAM has no obligation to provide any updates or changes.
In the United Kingdom, this material is a financial promotion and has been approved by Goldman Sachs Asset Management International, which is authorized and regulated in the
United Kingdom by the Financial Conduct Authority.
Confidentiality
No part of this material may, without GSAM’s prior written consent, be (i) copied, photocopied or duplicated in any form, by any means, or (ii) distributed to any person that is not
an employee, officer, director, or authorized agent of the recipient.
© 2013 Goldman Sachs. All rights reserved. 88884.OTHER.TMPL/1/2013 . 110185.OTHER.MED.OTU. 25


