
Ban
glad
esh
Uni
vers
ity o
f E
ngin
eeri
ng a
nd T
ech
nolo
gy
Climate Change Modeling: Climate Change Modeling: An overview An overview
A.K.M. Saiful Islam
Climate Change Training for Water Professionals

Copy right @ Dr. A.K.M. Saiful Islam, IWFM, BUET
Ban
glad
esh
Uni
vers
ity o
f E
ngin
eeri
ng a
nd T
ech
nolo
gy
Presentation outline Overview of climatic system
Green house effect
Global warming
Ice melt and rise of sea level
Climate model and predictions
General Climate Model - GCM
Regional Climate Model – RCM
Climate modeling at BUET
3D models
Copy right @ Dr. A.K.M. Saiful Islam, IWFM, BUET
Ban
glad
esh
Uni
vers
ity o
f E
ngin
eeri
ng a
nd T
ech
nolo
gy
Climate Systems
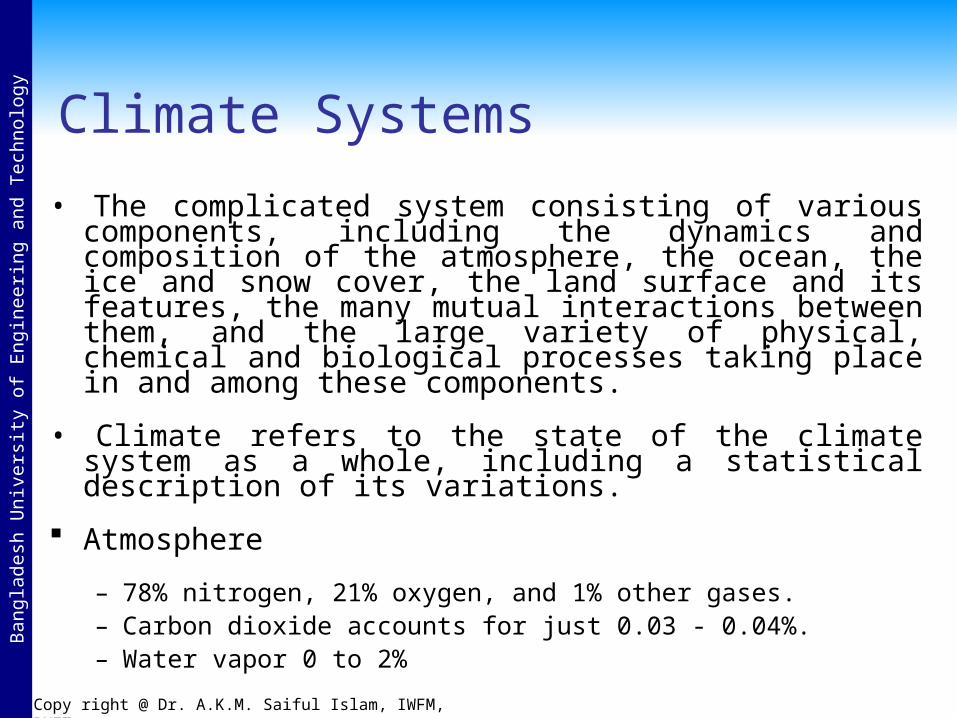
• The complicated system consisting of various components, including the dynamics and composition of the atmosphere, the ocean, the ice and snow cover, the land surface and its features, the many mutual interactions between them, and the large variety of physical, chemical and biological processes taking place in and among these components.
• Climate refers to the state of the climate system as a whole, including a statistical description of its variations.
Atmosphere
– 78% nitrogen, 21% oxygen, and 1% other gases.– Carbon dioxide accounts for just 0.03 - 0.04%. – Water vapor 0 to 2%
Copy right @ Dr. A.K.M. Saiful Islam, IWFM, BUET
Ban
glad
esh
Uni
vers
ity o
f E
ngin
eeri
ng a
nd T
ech
nolo
gy
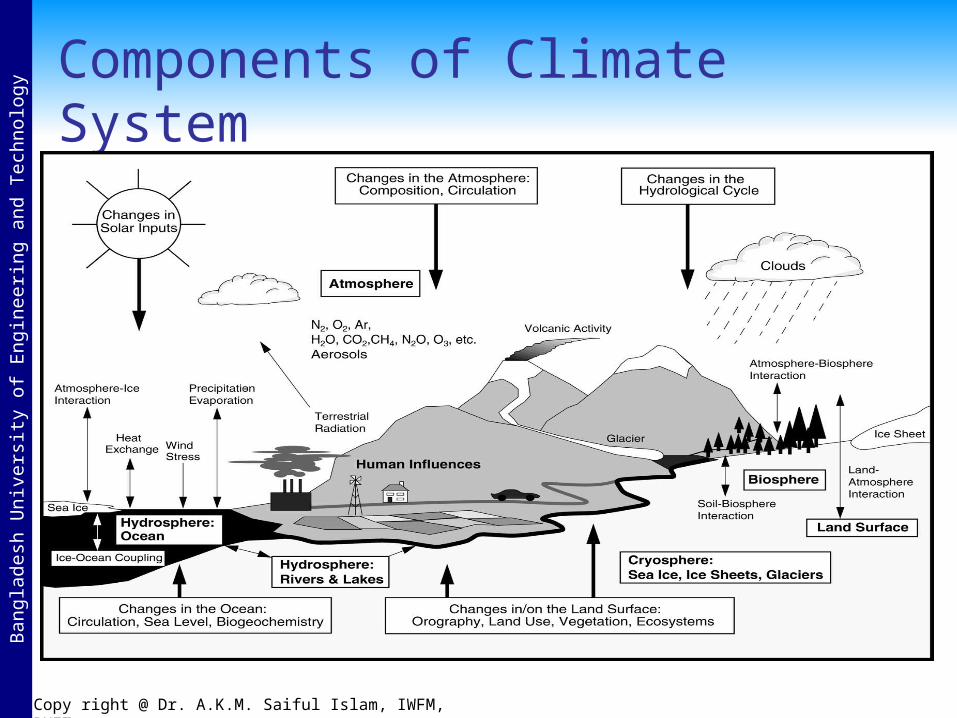
Components of Climate System

Copy right @ Dr. A.K.M. Saiful Islam, IWFM, BUET
Ban
glad
esh
Uni
vers
ity o
f E
ngin
eeri
ng a
nd T
ech
nolo
gy
Green house gases
CO2 and some other minor gases
1. Absorb some of the thermal radiation leaving the surface of the earth.
2. Emit radiation from much higher and colder levels out to space.
These radiatively active gases are known as greenhouse gases.
– They act as a partial blanket for the thermal radiation from the surface which enables it to be substantially warmer than it would otherwise be, analogous to the effect of a greenhouse.

Copy right @ Dr. A.K.M. Saiful Islam, IWFM, BUET
Ban
glad
esh
Uni
vers
ity o
f E
ngin
eeri
ng a
nd T
ech
nolo
gy
Green house effect

Copy right @ Dr. A.K.M. Saiful Islam, IWFM, BUET
Ban
glad
esh
Uni
vers
ity o
f E
ngin
eeri
ng a
nd T
ech
nolo
gy
Green house effect

Copy right @ Dr. A.K.M. Saiful Islam, IWFM, BUET
Ban
glad
esh
Uni
vers
ity o
f E
ngin
eeri
ng a
nd T
ech
nolo
gy
Human induced climate variation Perturbations of the atmospheric composition – the
enhanced greenhouse effect
Effect of aerosols:
– direct effect (scattering of incoming solar radiation)– indirect effect (affecting the radiative properties of clouds)
Land-use change (agriculture, deforestation, reforestation, afforestation, urbanisation, traffic, …)

Copy right @ Dr. A.K.M. Saiful Islam, IWFM, BUET
Ban
glad
esh
Uni
vers
ity o
f E
ngin
eeri
ng a
nd T
ech
nolo
gy
Increasing trends of CO2
Copy right @ Dr. A.K.M. Saiful Islam, IWFM, BUET
Ban
glad
esh
Uni
vers
ity o
f E
ngin
eeri
ng a
nd T
ech
nolo
gy
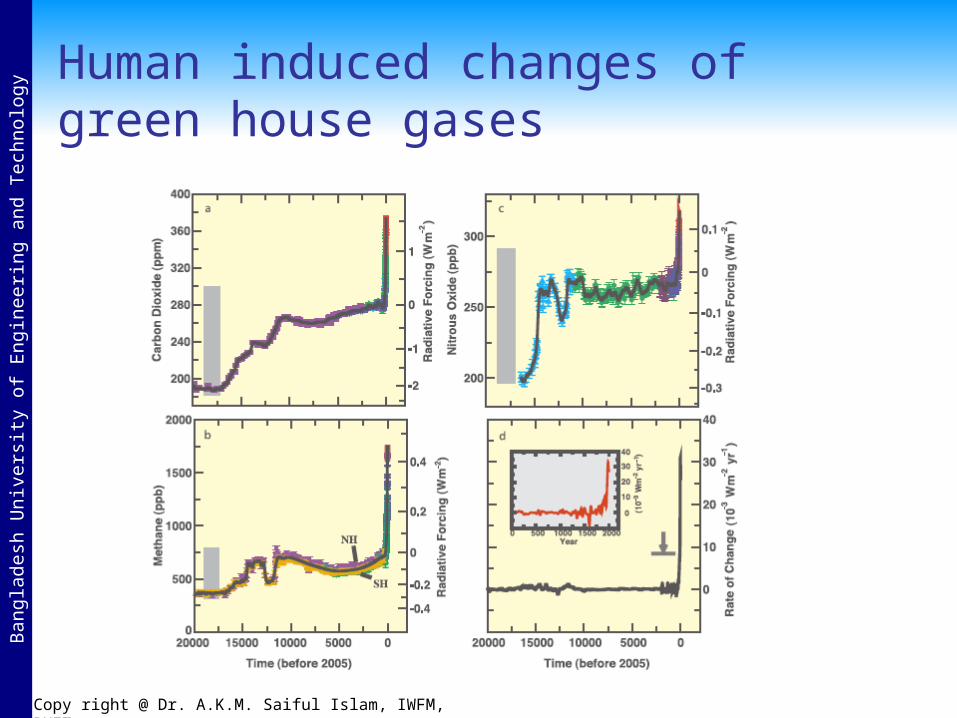
Human induced changes of green house gases

Copy right @ Dr. A.K.M. Saiful Islam, IWFM, BUET
Ban
glad
esh
Uni
vers
ity o
f E
ngin
eeri
ng a
nd T
ech
nolo
gy
Sector wise Green house gas emission
Copy right @ Dr. A.K.M. Saiful Islam, IWFM, BUET
Ban
glad
esh
Uni
vers
ity o
f E
ngin
eeri
ng a
nd T
ech
nolo
gy
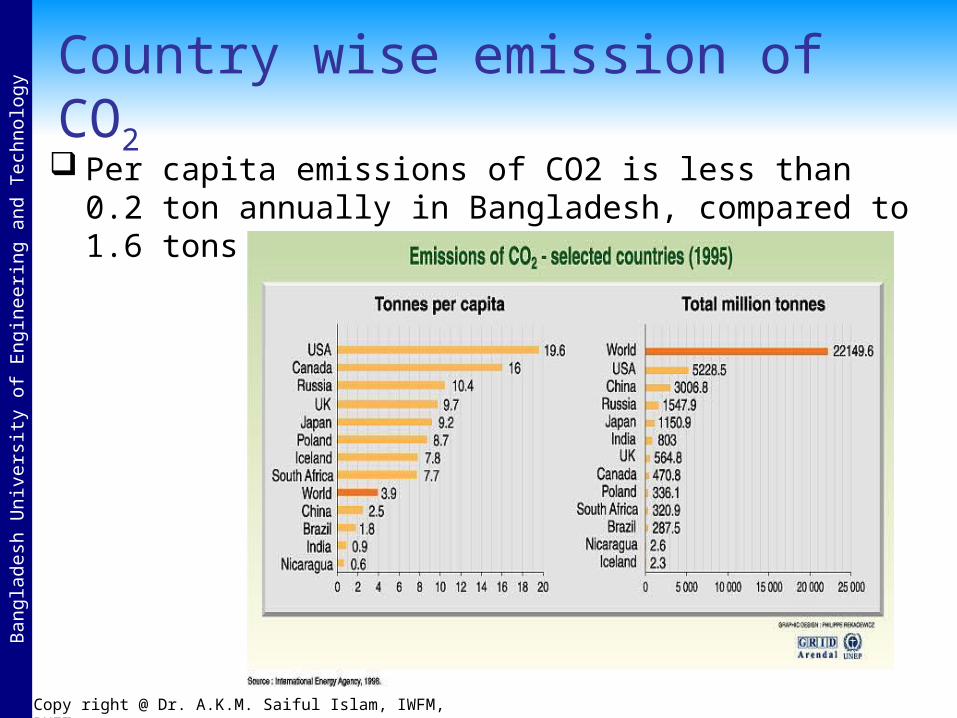
Country wise emission of CO2
Per capita emissions of CO2 is less than 0.2 ton annually in Bangladesh, compared to 1.6 tons in the developing countries
Copy right @ Dr. A.K.M. Saiful Islam, IWFM, BUET
Ban
glad
esh
Uni
vers
ity o
f E
ngin
eeri
ng a
nd T
ech
nolo
gy
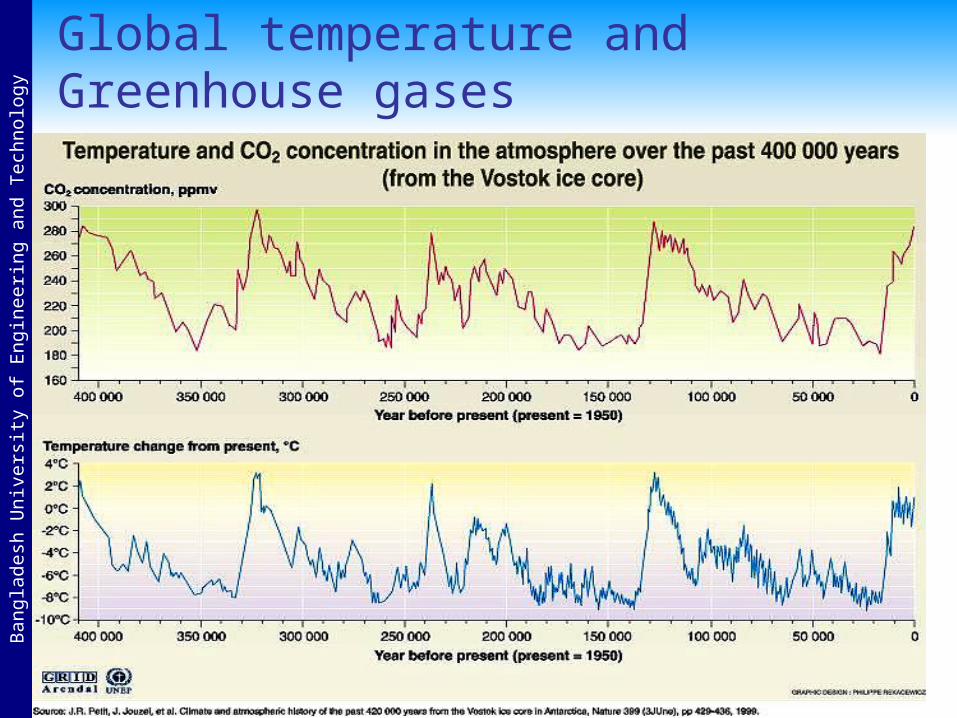
Global temperature and Greenhouse gases

Copy right @ Dr. A.K.M. Saiful Islam, IWFM, BUET
Ban
glad
esh
Uni
vers
ity o
f E
ngin
eeri
ng a
nd T
ech
nolo
gy
Temperature variation past 1,000 years
Copy right @ Dr. A.K.M. Saiful Islam, IWFM, BUET
Ban
glad
esh
Uni
vers
ity o
f E
ngin
eeri
ng a
nd T
ech
nolo
gy
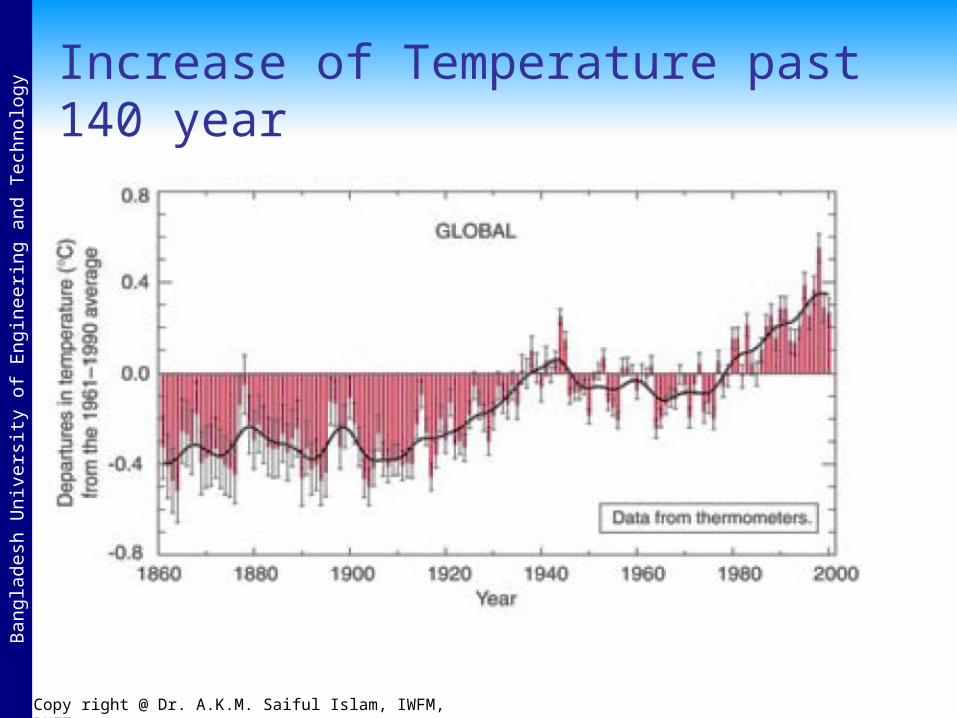
Increase of Temperature past 140 year
Copy right @ Dr. A.K.M. Saiful Islam, IWFM, BUET
Ban
glad
esh
Uni
vers
ity o
f E
ngin
eeri
ng a
nd T
ech
nolo
gy
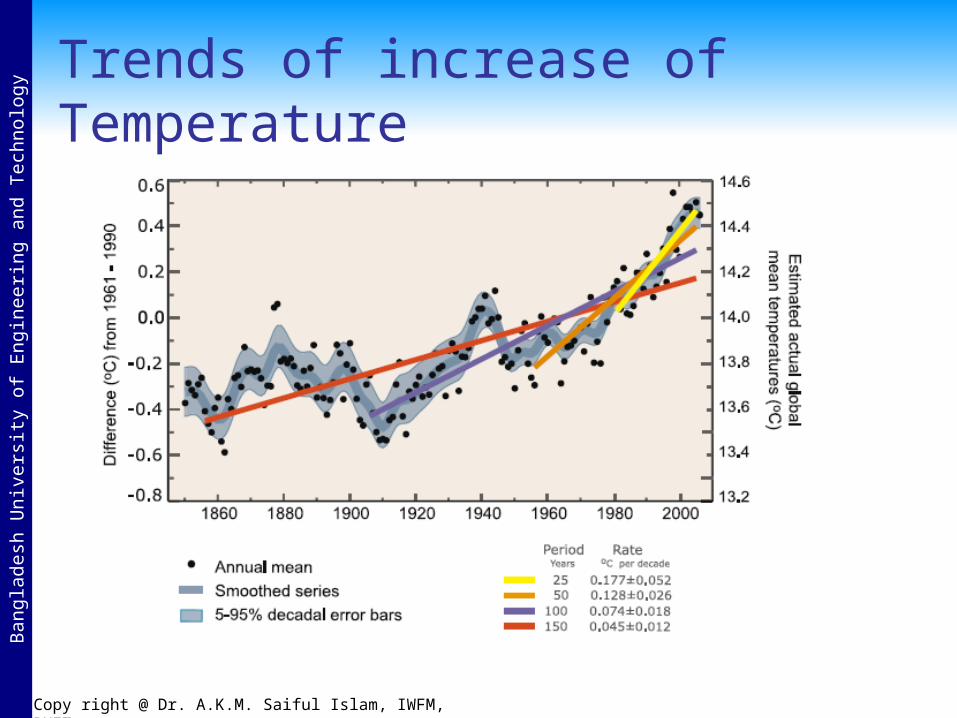
Trends of increase of Temperature
Copy right @ Dr. A.K.M. Saiful Islam, IWFM, BUET
Ban
glad
esh
Uni
vers
ity o
f E
ngin
eeri
ng a
nd T
ech
nolo
gy
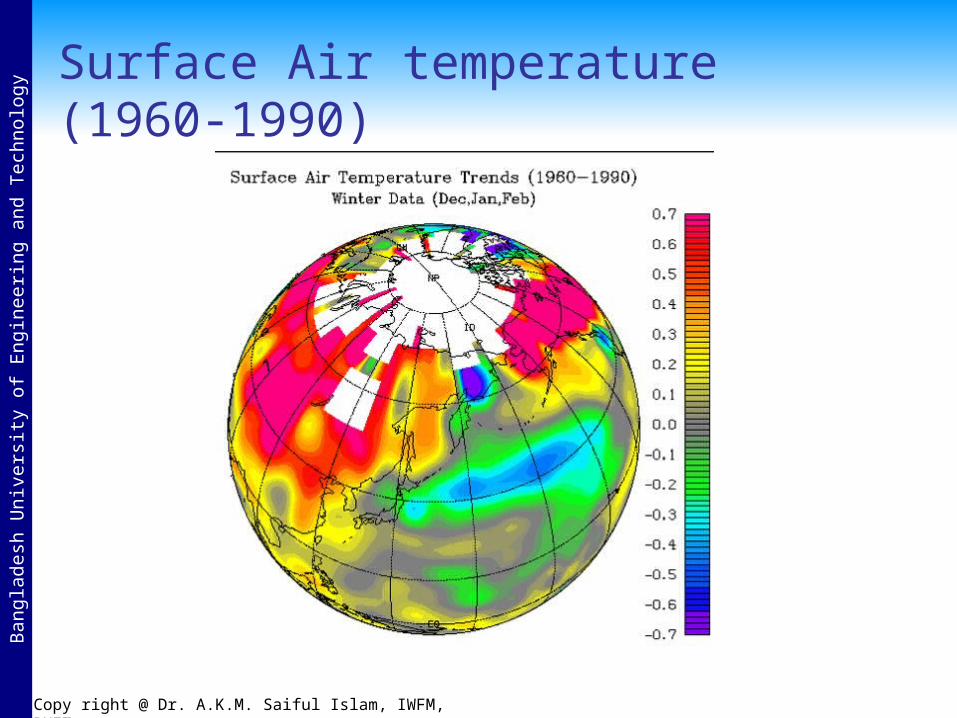
Surface Air temperature (1960-1990)

Copy right @ Dr. A.K.M. Saiful Islam, IWFM, BUET
Ban
glad
esh
Uni
vers
ity o
f E
ngin
eeri
ng a
nd T
ech
nolo
gy
Antarctic Ozone hole
The Antarctic ozone hole forms in the southern hemisphere’s spring (Sept.-Nov) following the bitterly cold and dark Antarctic winter when stratospheric ice clouds promote production of chemically active chlorine and bromine.
This, in turn, leads to ozone destruction when sunlight returns in the Antarctic spring.
The serious thinning of the stratospheric ozone layer is caused by anthropogenic emissions of ozone depleting substances, such as chlorofluorocarbons (CFC) and halons. The atmospheric concentrations of these compounds have increased during the last several decades as a consequence of human activity.

Copy right @ Dr. A.K.M. Saiful Islam, IWFM, BUET
Ban
glad
esh
Uni
vers
ity o
f E
ngin
eeri
ng a
nd T
ech
nolo
gy

Copy right @ Dr. A.K.M. Saiful Islam, IWFM, BUET
Ban
glad
esh
Uni
vers
ity o
f E
ngin
eeri
ng a
nd T
ech
nolo
gy
Ice melting Images from gathered from the Defense Meteorological
Satellite Program of NASA show the minimum Arctic sea ice concentration 1979 (left) and 2003 (right).
1979 2003

Copy right @ Dr. A.K.M. Saiful Islam, IWFM, BUET
Ban
glad
esh
Uni
vers
ity o
f E
ngin
eeri
ng a
nd T
ech
nolo
gy
Cracks in Ice bars
Copy right @ Dr. A.K.M. Saiful Islam, IWFM, BUET
Ban
glad
esh
Uni
vers
ity o
f E
ngin
eeri
ng a
nd T
ech
nolo
gy
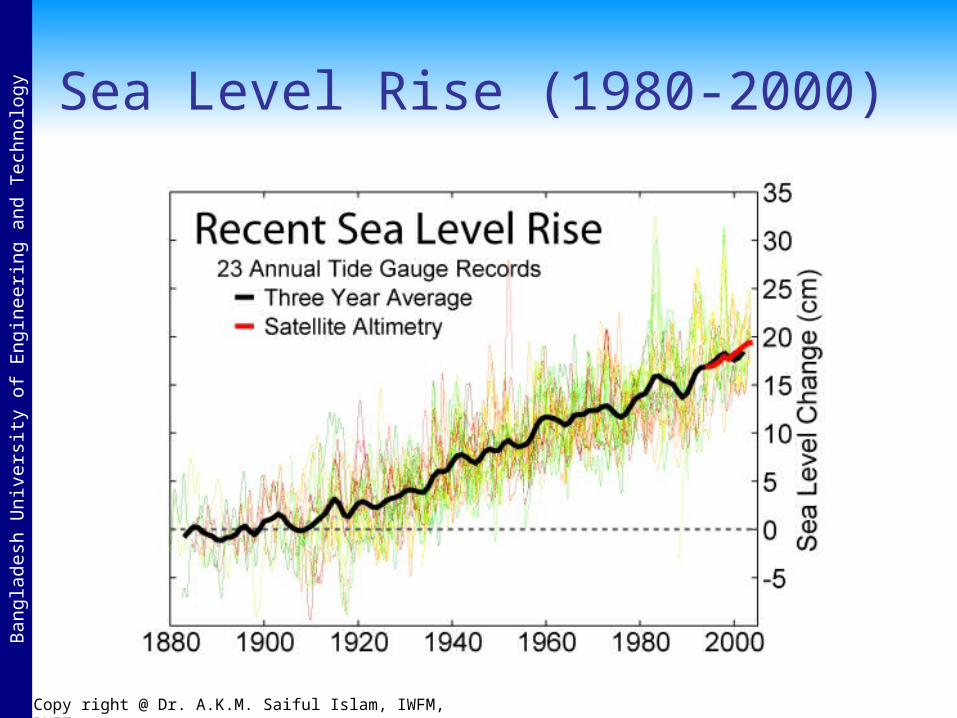
Sea Level Rise (1980-2000)

Copy right @ Dr. A.K.M. Saiful Islam, IWFM, BUET
Ban
glad
esh
Uni
vers
ity o
f E
ngin
eeri
ng a
nd T
ech
nolo
gy
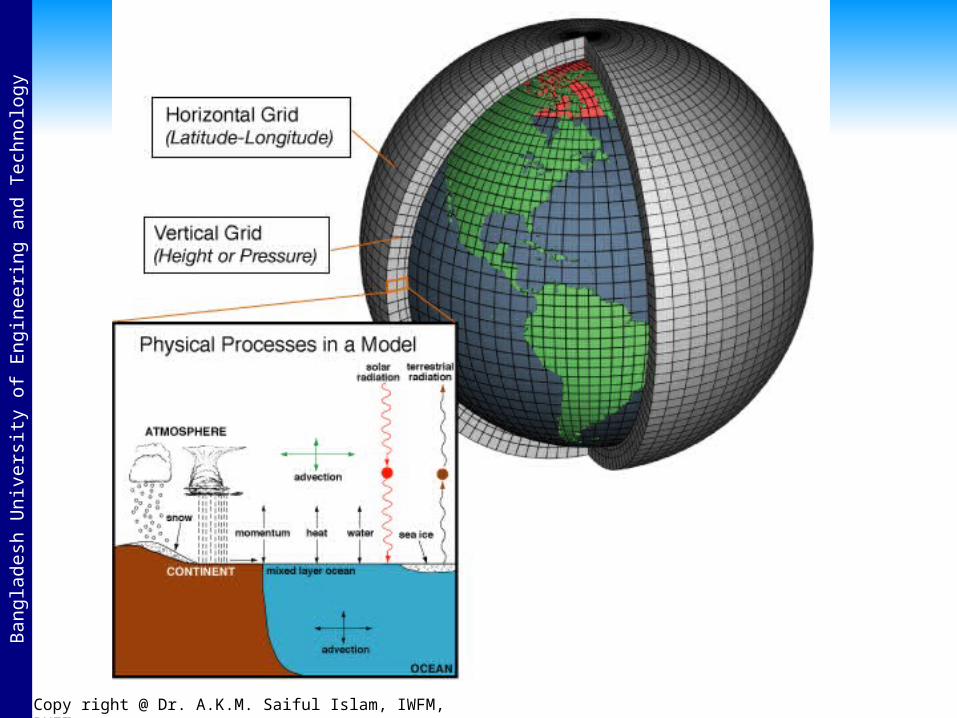
Climate Models Climate models are computer-based simulations that use
mathematical formulas to re-create the chemical and physical processes that drive Earth’s climate.
To “run” a model, scientists divide the planet into a 3-dimensional grid, apply the basic equations, and evaluate the results.
Atmospheric models calculate winds, heat transfer, radiation, relative humidity, and surface hydrology within each grid and evaluate interactions with neighboring points.
Climate models use quantitative methods to simulate the interactions of the atmosphere, oceans, land surface, and ice.
Copy right @ Dr. A.K.M. Saiful Islam, IWFM, BUET
Ban
glad
esh
Uni
vers
ity o
f E
ngin
eeri
ng a
nd T
ech
nolo
gy
Copy right @ Dr. A.K.M. Saiful Islam, IWFM, BUET
Ban
glad
esh
Uni
vers
ity o
f E
ngin
eeri
ng a
nd T
ech
nolo
gy
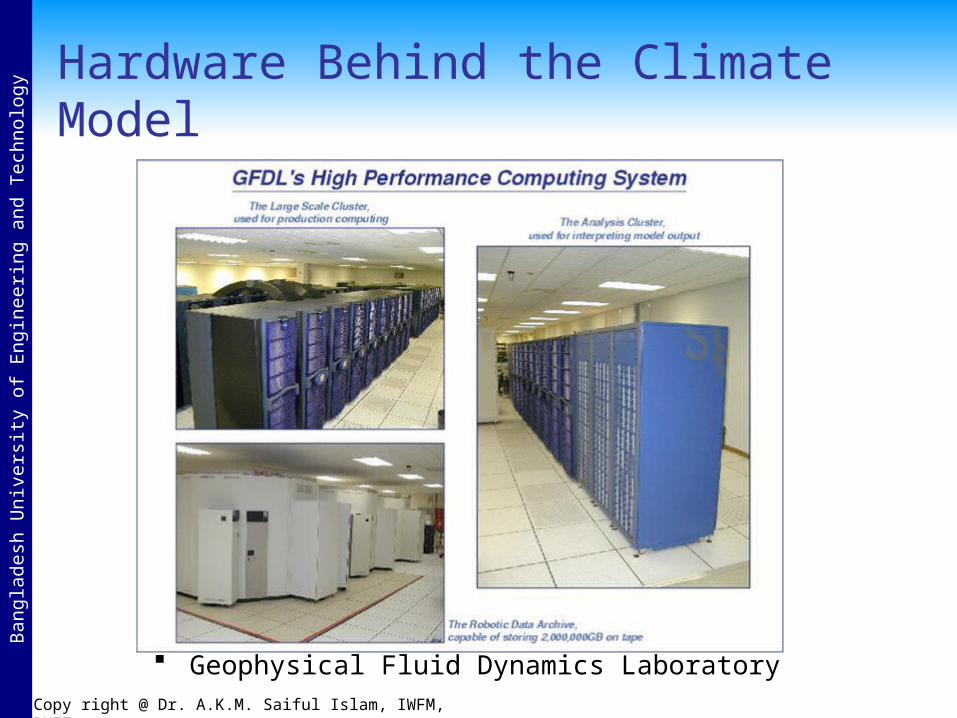
Hardware Behind the Climate Model
Geophysical Fluid Dynamics Laboratory
Copy right @ Dr. A.K.M. Saiful Islam, IWFM, BUET
Ban
glad
esh
Uni
vers
ity o
f E
ngin
eeri
ng a
nd T
ech
nolo
gy
General Circulation Model (GCM) General Circulation Models (GCMs) are a class of
computer-driven models for weather forecasting, understanding climate and projecting climate change, where they are commonly called Global Climate Models.
Three dimensional GCM's discretise the equations for fluid motion and energy transfer and integrate these forward in time. They also contain parametrisations for processes - such as convection - that occur on scales too small to be resolved directly.
Atmospheric GCMs (AGCMs) model the atmosphere and impose sea surface temperatures.
Coupled atmosphere-ocean GCMs (AOGCMs, e.g. HadCM3, EdGCM, GFDL CM2.X, ARPEGE-Climate) combine the two models.

Copy right @ Dr. A.K.M. Saiful Islam, IWFM, BUET
Ban
glad
esh
Uni
vers
ity o
f E
ngin
eeri
ng a
nd T
ech
nolo
gy
GCM typical horizontal resolution of between 250 and 600 km, 10 to 20 vertical layers in the atmosphere and sometimes as many as 30 layers in the oceans.
Copy right @ Dr. A.K.M. Saiful Islam, IWFM, BUET
Ban
glad
esh
Uni
vers
ity o
f E
ngin
eeri
ng a
nd T
ech
nolo
gy
Special Report on Emissions Scenarios (SRES)
The Special Report on Emissions Scenarios (SRES) was a report prepared by the Intergovernmental Panel on Climate Change (IPCC) for the Third Assessment Report (TAR) in 2001, on future emission scenarios to be used for driving global circulation models to develop climate change scenarios.
It was used to replace the IS92 scenarios used for the IPCC Second Assessment Report of 1995. The SRES Scenarios were also used for the Fourth Assessment Report (AR4) in 2007.
Copy right @ Dr. A.K.M. Saiful Islam, IWFM, BUET
Ban
glad
esh
Uni
vers
ity o
f E
ngin
eeri
ng a
nd T
ech
nolo
gy
SERS Emission Scenarios A1 - a future world of very rapid economic growth, global
population that peaks in mid-century and declines thereafter, and the rapid introduction of new and more efficient technologies. Three sub groups: fossil intensive (A1FI), non-fossil energy sources (A1T), or a balance across all sources (A1B).
A2 - A very heterogeneous world. The underlying theme is that of strengthening regional cultural identities, with an emphasis on family values and local traditions, high population growth, and less concern for rapid economic development.
B1 - a convergent world with the same global population, that peaks in mid-century and declines thereafter, as in the A1 storyline.
B2 - a world in which the emphasis is on local solutions to economic, social and environmental sustainability.

Copy right @ Dr. A.K.M. Saiful Islam, IWFM, BUET
Ban
glad
esh
Uni
vers
ity o
f E
ngin
eeri
ng a
nd T
ech
nolo
gy
Non SRES Scenarios Non-SRES Scenario: PICTL
Experiments run with constant pre-industrial levels of greenhouse gasses.
Non-SRES Scenario: 20C3M
Experiments run with greenhouse gasses increasing as observed through the 20th century.
Non-SRES Scenario: COMMIT
An idealised scenario in which the atmospheric burdens of long-lived greenhouse gasses are held fixed at AD2000 levels.
Non-SRES Scenario: 1PTO2X (1% to double)
Experiments run with greenhouse gasses increasing from pre-industrial levels at a rate of 1% per year until the concentration has doubled and held constant thereafter.
Non-SRES Scenario: 1PTO4X (1% to quadruple)
Experiments run with greenhouse gasses increasing from pre-industrial levels at a rate of 1% per year until the concentration has quadrupled and held constant thereafter.

Copy right @ Dr. A.K.M. Saiful Islam, IWFM, BUET
Ban
glad
esh
Uni
vers
ity o
f E
ngin
eeri
ng a
nd T
ech
nolo
gyGCM output described in the 2007 IPCC Fourth Assessment Report (SRES scenarios), multilayer mean
Models Scenarios Variables
BCC:CM1BCCR:BCM2CCCMA:CGCM3_1-T47CCCMA:CGCM3_1-T63CNRM:CM3CONS:ECHO-GCSIRO:MK3GFDL:CM2GFDL:CM2_1INM:CM3IPSL:CM4LASG:FGOALS-G1_0MPIM:ECHAM5MRI:CGCM2_3_2NASA:GISS-AOMNASA:GISS-EHNASA:GISS-ERNCAR:CCSM3NCAR:PCMNIES:MIROC3_2-HINIES:MIROC3_2-MEDUKMO:HADCM3UKMO:HADGEM1
1PTO2X1PTO4X20C3MCOMMITPICTLSRA1BSRA2SRB1
specific humidityprecipitation fluxair pressure at sealevelnet upward shortwaveflux in airair temperatureair temperature dailymaxair temperature dailymineastward windnorthward wind

Copy right @ Dr. A.K.M. Saiful Islam, IWFM, BUET
Ban
glad
esh
Uni
vers
ity o
f E
ngin
eeri
ng a
nd T
ech
nolo
gy
GCM BCC-CM1
– AgencyBeijing Climate Center, National Climate Center, China Meteorological Administration, No.46, S.Road, Zhongguancun Str., Beijing 100081, China
BCCR
– Bjerknes Centre for Climate Research (BCCR), Univ. of Bergen, Norway
CGCM3
– Canadian Centre for Climate Modelling and Analysis (CCCma) CNRM-CM3
– Centre National de Recherches Meteorologiques, Meteo France, France
Copy right @ Dr. A.K.M. Saiful Islam, IWFM, BUET
Ban
glad
esh
Uni
vers
ity o
f E
ngin
eeri
ng a
nd T
ech
nolo
gy
GCM CONS-ECHO-G
– Meteorological Institute of the University of Bonn (Germany), Institute of KMA (Korea), and Model and Data Group.
CSIRO, Australia
INMCM3.0
– Institute of Numerical Mathematics, Russian Academy of Science, Russia.
GFDL
– Geophysical Fluid Dynamics Laboratory, NOAA NASA-GISS-AOM
– NASA Goddard Institute for Space Studies (NASA/GISS), USA

Copy right @ Dr. A.K.M. Saiful Islam, IWFM, BUET
Ban
glad
esh
Uni
vers
ity o
f E
ngin
eeri
ng a
nd T
ech
nolo
gy
GCM MRI-CGCM2_3_2
– Meteorological Research Institute, Japan Meteorological Agency, Japan
NCAR-PCM
– National Center for Atmospheric Research (NCAR), NSF (a primary sponsor), DOE (a primary sponsor), NASA, and NOAA
Model NIES-MIROC3_2-MED
– CCSR/NIES/FRCGC, Japan UKMO-HADCM3
– Hadley Centre for Climate Prediction and Research, Met Office, United Kingdom

Copy right @ Dr. A.K.M. Saiful Islam, IWFM, BUET
Ban
glad
esh
Uni
vers
ity o
f E
ngin
eeri
ng a
nd T
ech
nolo
gy
Prediction of Global Warming Figure shows the distribution of warming during the late
21st century predicted by the HadCM3 climate model. The average warming predicted by this model is 3.0 °C.

Copy right @ Dr. A.K.M. Saiful Islam, IWFM, BUET
Ban
glad
esh
Uni
vers
ity o
f E
ngin
eeri
ng a
nd T
ech
nolo
gy
Predicted Changes of Temperature

Copy right @ Dr. A.K.M. Saiful Islam, IWFM, BUET
Ban
glad
esh
Uni
vers
ity o
f E
ngin
eeri
ng a
nd T
ech
nolo
gy
Temperature increase versus SRES

Copy right @ Dr. A.K.M. Saiful Islam, IWFM, BUET
Ban
glad
esh
Uni
vers
ity o
f E
ngin
eeri
ng a
nd T
ech
nolo
gy
Predicted Sea Level Rise
Copy right @ Dr. A.K.M. Saiful Islam, IWFM, BUET
Ban
glad
esh
Uni
vers
ity o
f E
ngin
eeri
ng a
nd T
ech
nolo
gy
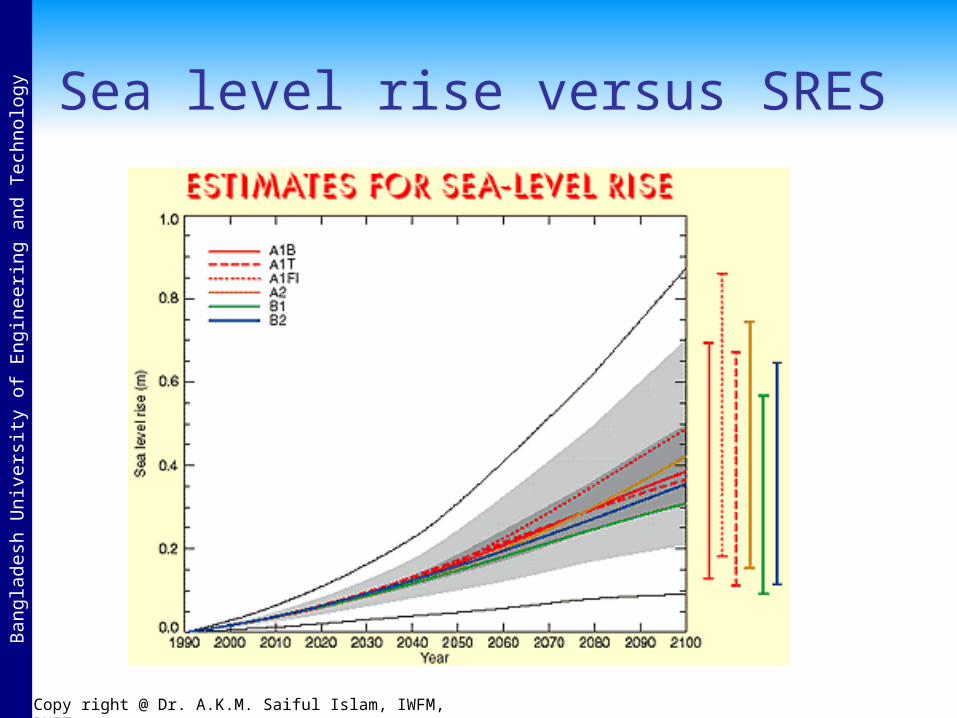
Sea level rise versus SRES

Copy right @ Dr. A.K.M. Saiful Islam, IWFM, BUET
Ban
glad
esh
Uni
vers
ity o
f E
ngin
eeri
ng a
nd T
ech
nolo
gy
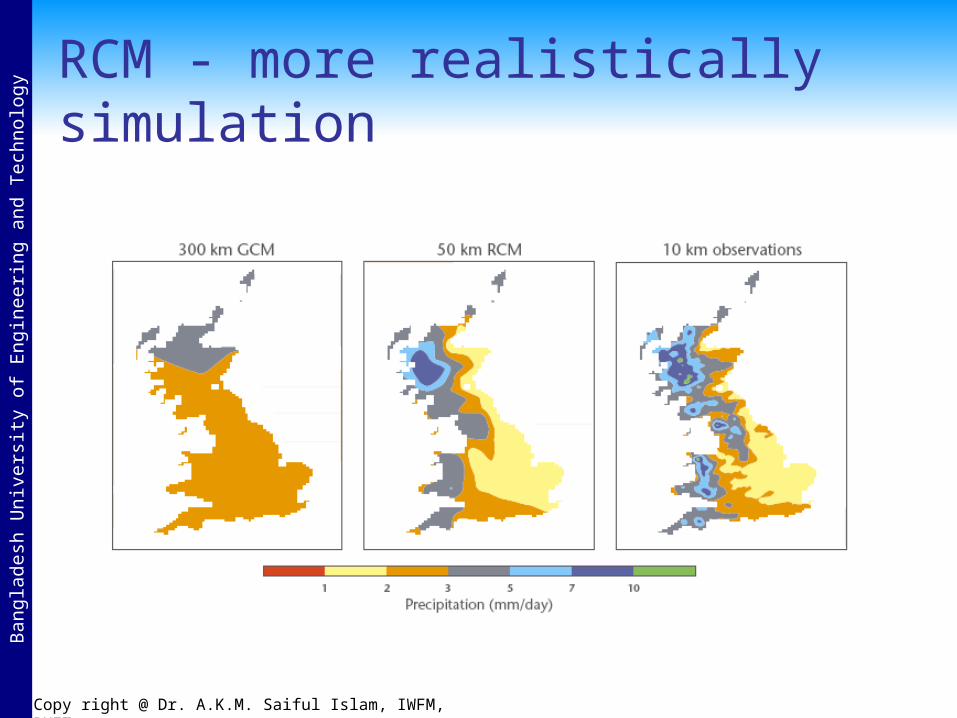
Regional Climate modeling An RCM is a tool to add small-scale detailed information
of future climate change to the large-scale projections of a GCM. RCMs are full climate models and as such are physically based and represent most or all of the processes, interactions and feedbacks between the climate system components that are represented in GCMs.
They take coarse resolution information from a GCM and then develop temporally and spatially fine-scale information consistent with this using their higher resolution representation of the climate system.
The typical resolution of an RCM is about 50 km in the horizontal and GCMs are typically 500~300 km
Copy right @ Dr. A.K.M. Saiful Islam, IWFM, BUET
Ban
glad
esh
Uni
vers
ity o
f E
ngin
eeri
ng a
nd T
ech
nolo
gy
RCM - more realistically simulation

Copy right @ Dr. A.K.M. Saiful Islam, IWFM, BUET
Ban
glad
esh
Uni
vers
ity o
f E
ngin
eeri
ng a
nd T
ech
nolo
gy
RCM can simulate cyclones and hurricanes

Copy right @ Dr. A.K.M. Saiful Islam, IWFM, BUET
Ban
glad
esh
Uni
vers
ity o
f E
ngin
eeri
ng a
nd T
ech
nolo
gy
Steps of assessing impact of climate change

Copy right @ Dr. A.K.M. Saiful Islam, IWFM, BUET
Ban
glad
esh
Uni
vers
ity o
f E
ngin
eeri
ng a
nd T
ech
nolo
gy
Climate change modeling in Bangladesh PRECIS regional
climate modeling is now running in Climate change study cell at IWFM,BUET.
It takes more than 2 months to completely run an experiment of 30 years.
Currently running baseline (1960-1990) and A1B (1949-2100) scenarios over the Bangladesh region.

Copy right @ Dr. A.K.M. Saiful Islam, IWFM, BUET
Ban
glad
esh
Uni
vers
ity o
f E
ngin
eeri
ng a
nd T
ech
nolo
gy
Bangladesh region for PRECIS Grids: 88 x 88
Predict up to 3 hourly
Needs more than 100 GB free space.
Intel Pentium take one day to simulate 6 month.
Uses LBC data from GCM (e.g. HadCM3)
Data available for A2, B2, A1B scenarios.

Copy right @ Dr. A.K.M. Saiful Islam, IWFM, BUET
Ban
glad
esh
Uni
vers
ity o
f E
ngin
eeri
ng a
nd T
ech
nolo
gy
Predicting Rainfall
[Output of PRECIS model using SRES A2 scenario]

Copy right @ Dr. A.K.M. Saiful Islam, IWFM, BUET
Ban
glad
esh
Uni
vers
ity o
f E
ngin
eeri
ng a
nd T
ech
nolo
gy
Predicting Maximum Temperature
[Output of PRECIS model using SRES A2 scenario]

Copy right @ Dr. A.K.M. Saiful Islam, IWFM, BUET
Ban
glad
esh
Uni
vers
ity o
f E
ngin
eeri
ng a
nd T
ech
nolo
gy
Predicting Minimum Temperature
[Output of PRECIS model using SRES A2 scenario]

Copy right @ Dr. A.K.M. Saiful Islam, IWFM, BUET
Ban
glad
esh
Uni
vers
ity o
f E
ngin
eeri
ng a
nd T
ech
nolo
gy
Thank you


