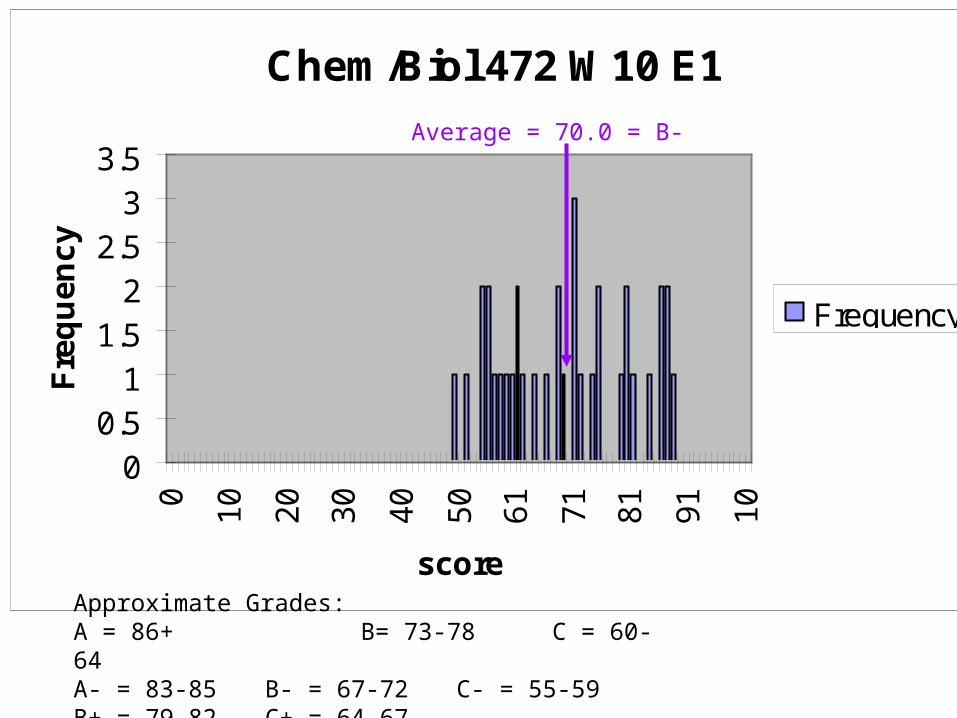
Chem/Biol 472 W10 E1
00.5
11.5
22.5
33.5
0
10
20
30
40
50
61
71
81
91
10
score
Fre
qu
en
cy
Frequency
Average = 70.0 = B-
Approximate Grades:A = 86+ B= 73-78 C = 60-64A- = 83-85 B- = 67-72 C- = 55-59B+ = 79-82 C+ = 64-67
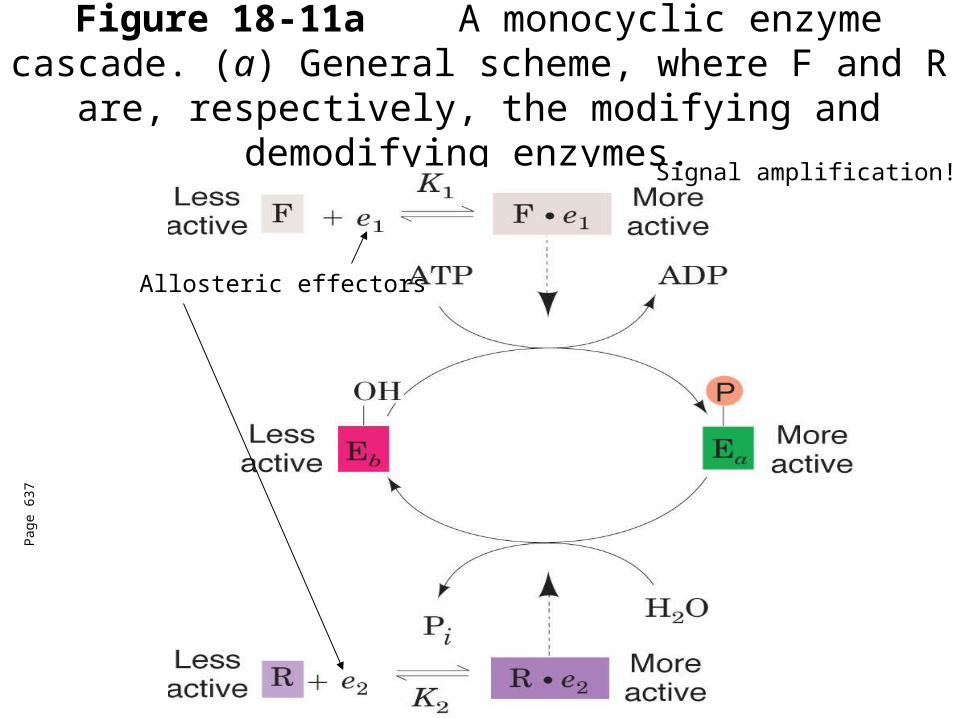
Figure 18-11a A monocyclic enzyme cascade. (a) General scheme, where F and R are, respectively, the
modifying and demodifying enzymes.
Pag
e 63
7
Signal amplification!!
Allosteric effectors
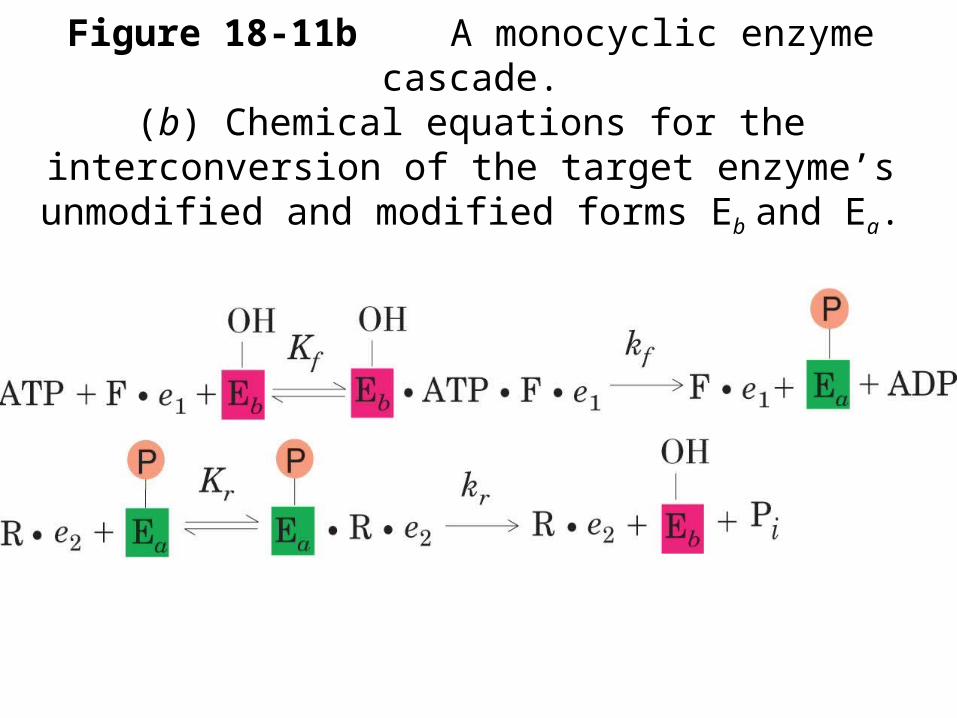
Figure 18-11b A monocyclic enzyme cascade.(b) Chemical equations for the interconversion of the
target enzyme’s unmodified and modified forms Eb and Ea.
Pag
e 63
7
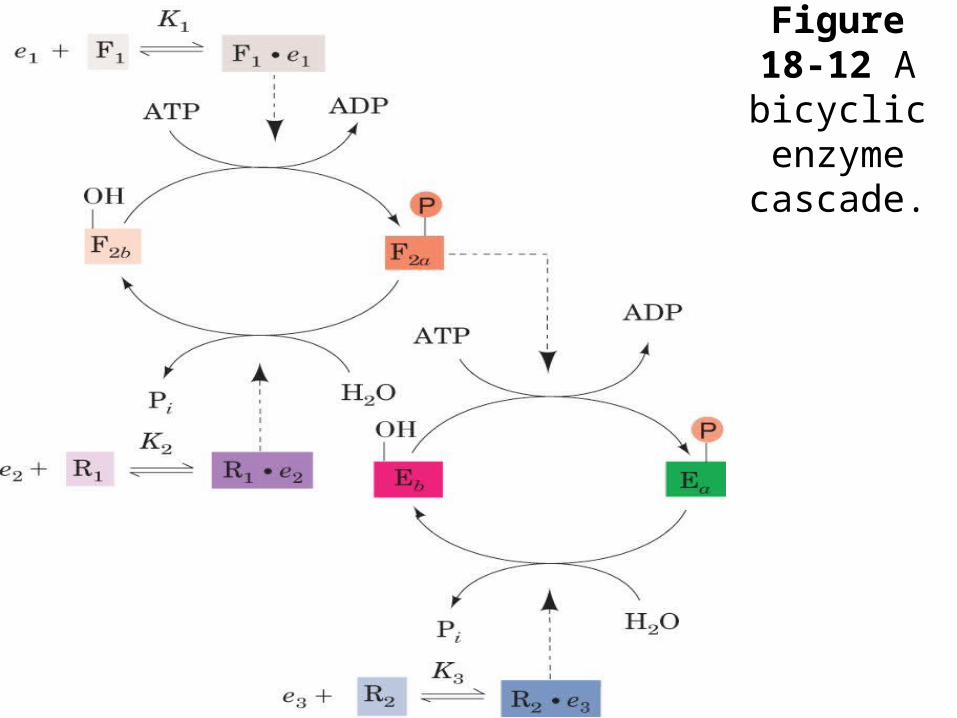
Figure 18-12 A bicyclic enzyme cascade.
Pag
e 63
8
Regulation of Glycogen Phosphorylase
• Allosteric control: AMP activates,Glc, G6P, ATP inhibits(T vs. R)
Signal cascade:Phosphorylase KinaseProtein Kinase APhosphoprotein phosphatase (dephosphorylates Glyc phosphorylase and
Phosphorylase Kinase)
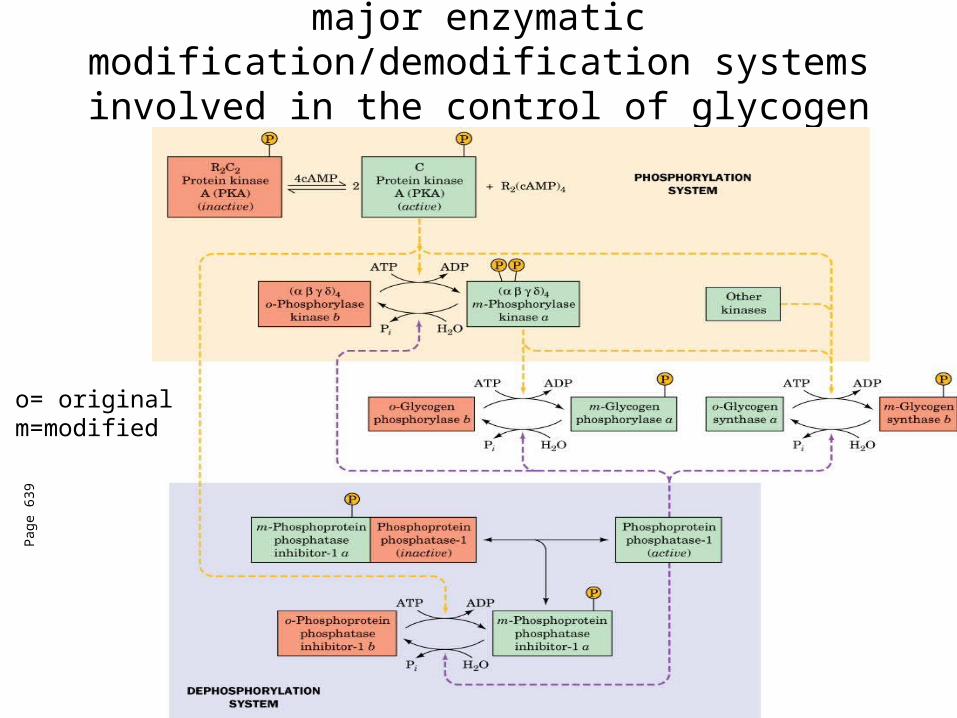
Figure 18-13 Schematic diagram of the major enzymatic modification/demodification systems involved
in the control of glycogen metabolism in muscle.
Pag
e 63
9
o= originalm=modified
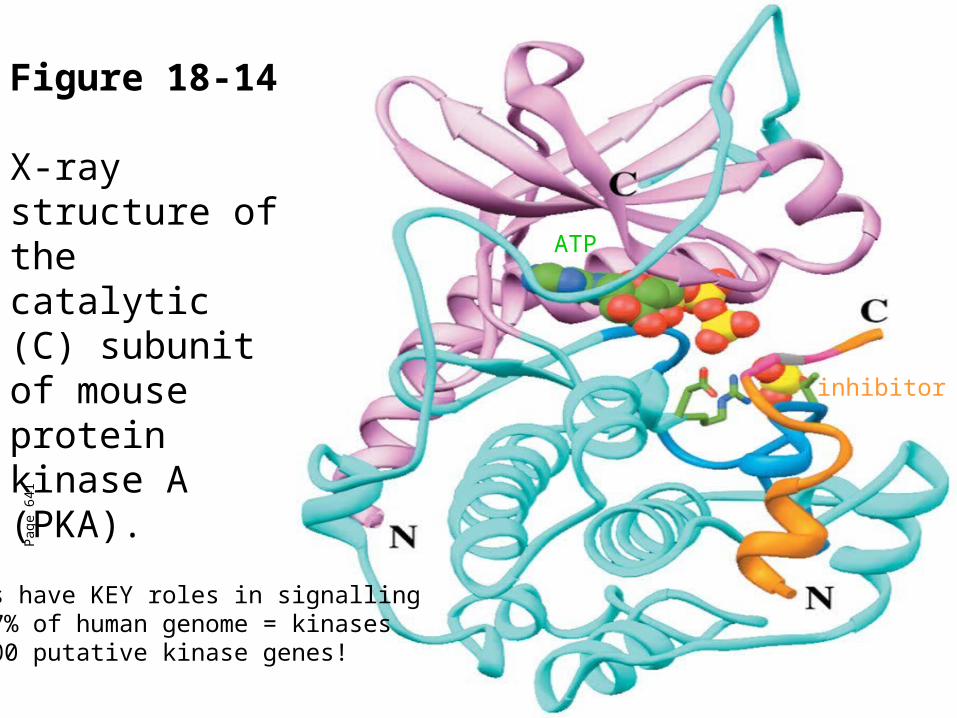
Figure 18-14 X-ray structure of the catalytic (C) subunit of mouse protein kinase A (PKA).
Pag
e 64
1
PKs have KEY roles in signalling1.7% of human genome = kinases1000 putative kinase genes!
inhibitor
ATP
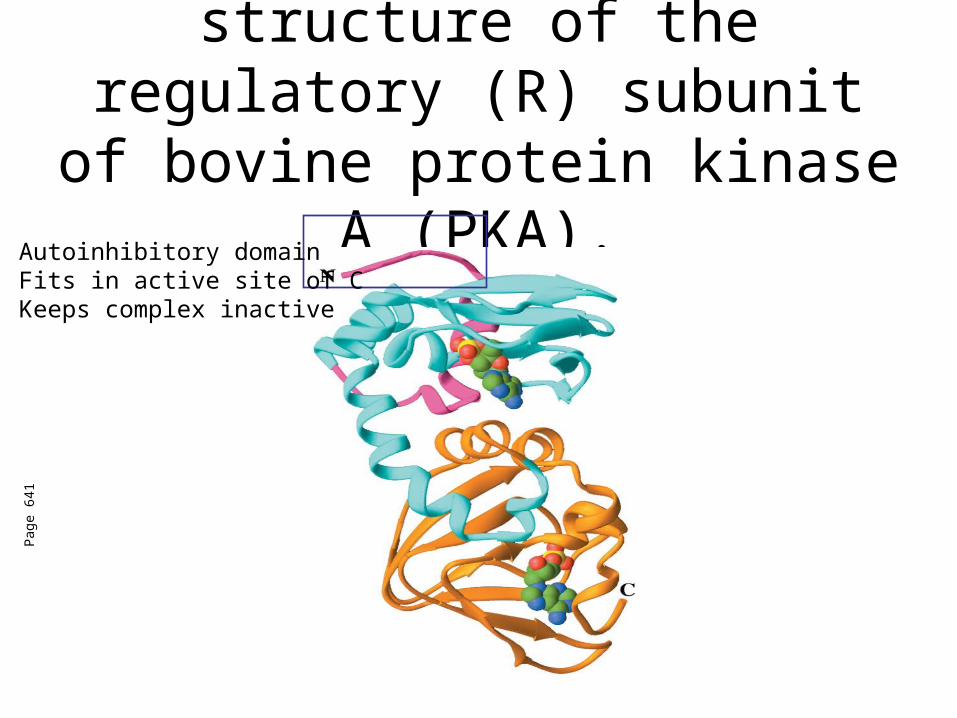
Figure 18-15 X-ray structure of the regulatory (R) subunit of
bovine protein kinase A (PKA).
Pag
e 64
1
Autoinhibitory domainFits in active site of CKeeps complex inactive
Phosphorylase Kinase
• Senses Ca+2
– Activated by [Ca+2] as low as 10-7M!!
– 4 subunits (αβγδ)4 active structure a tetramer of tetramers!
– Subunit γ has catalytic activity– Others are inhibitory– Subunit δ = Calmodulin (CaM)

Figure 18-16 X-Ray structure of rat testis calmodulin.
Pag
e 64
2
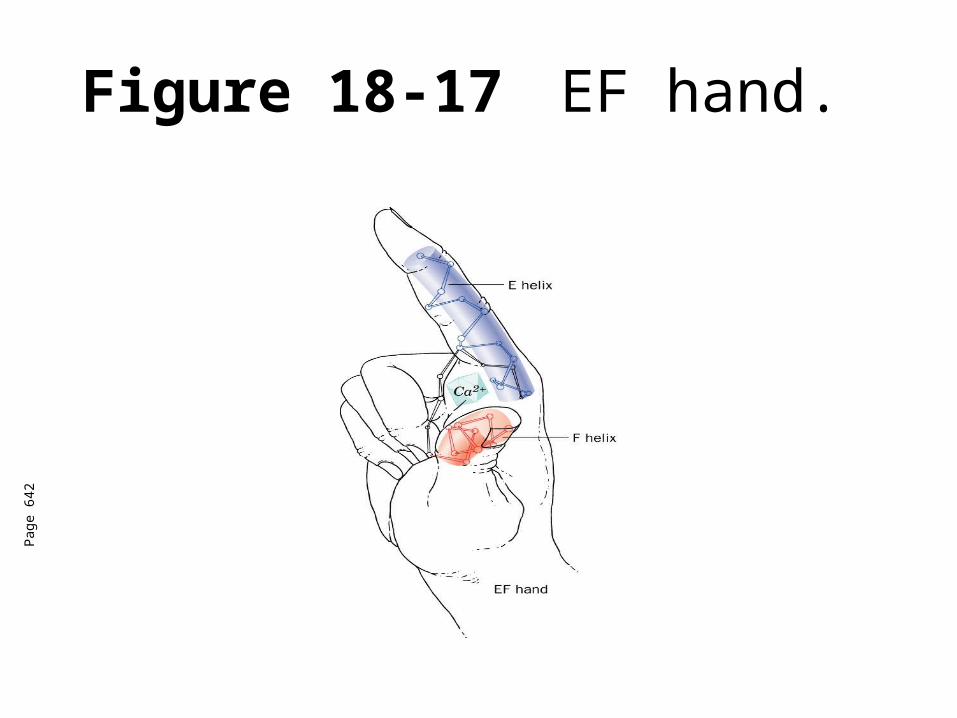
Figure 18-17 EF hand. P
age
642
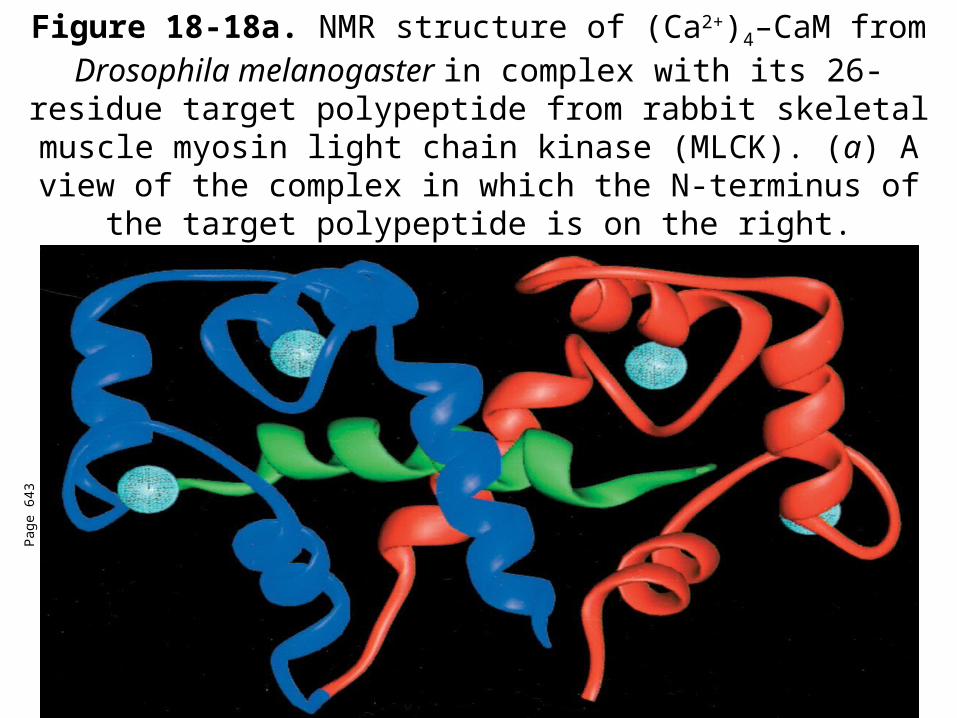
Figure 18-18a. NMR structure of (Ca2+)4–CaM from Drosophila melanogaster in complex with its 26-residue target polypeptide
from rabbit skeletal muscle myosin light chain kinase (MLCK). (a) A view of the complex in which the N-terminus of the target
polypeptide is on the right.
Pag
e 64
3
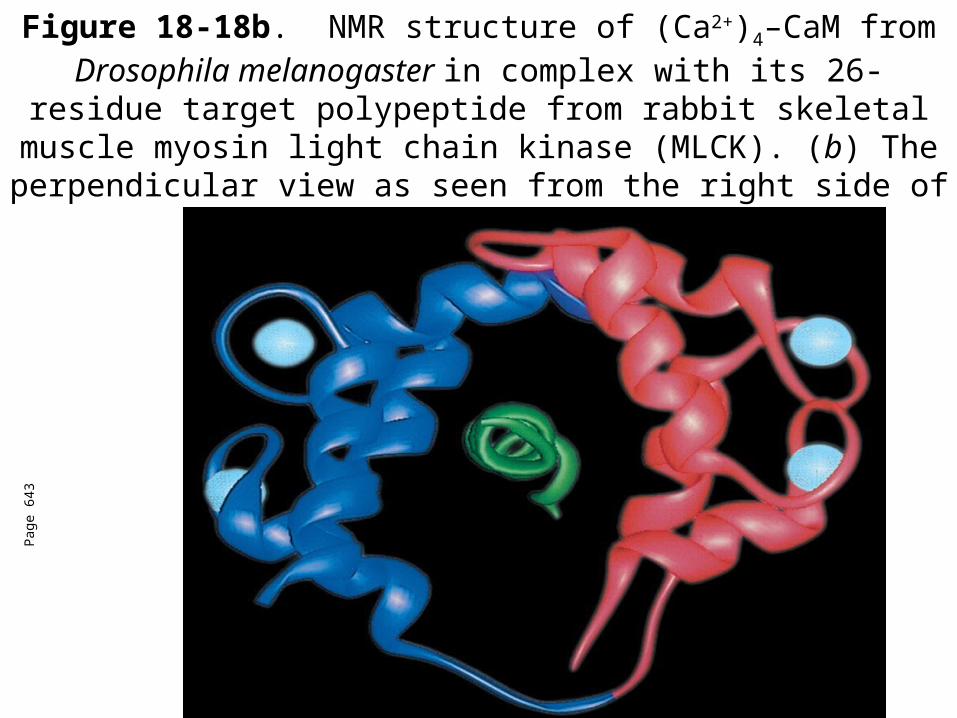
Figure 18-18b. NMR structure of (Ca2+)4–CaM from Drosophila melanogaster in complex with its 26-residue target polypeptide
from rabbit skeletal muscle myosin light chain kinase (MLCK). (b) The perpendicular view as seen from the right side of Part a.
Pag
e 64
3
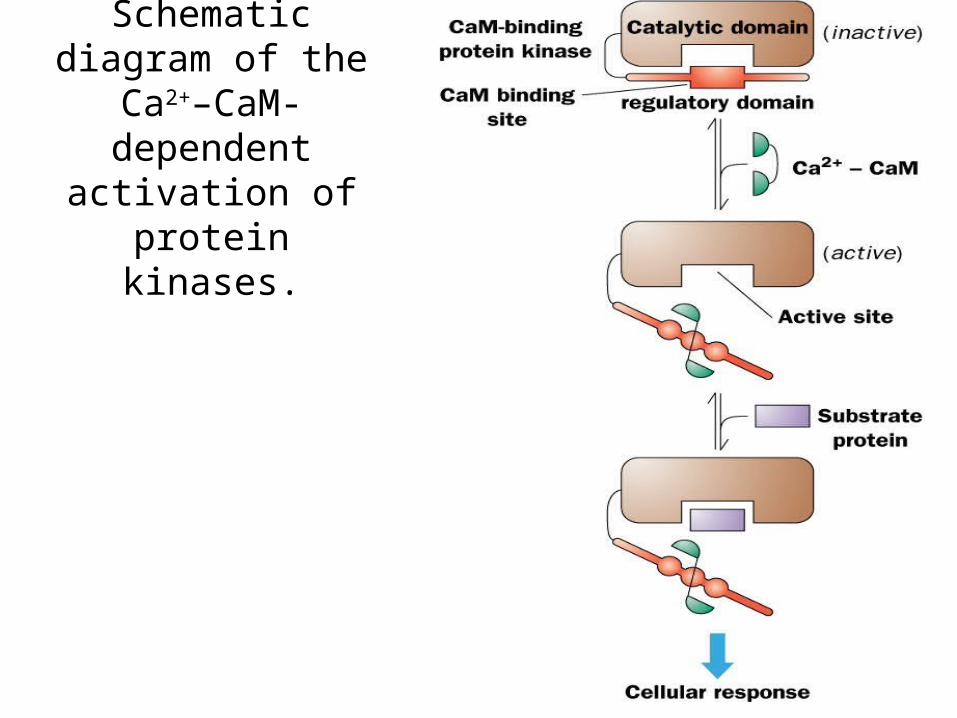
Figure 18-19Schematic diagram of the Ca2+–CaM-
dependent activation of protein kinases.

Figure 18-13 Schematic diagram of the major enzymatic modification/demodification systems involved
in the control of glycogen metabolism in muscle.
Pag
e 63
9
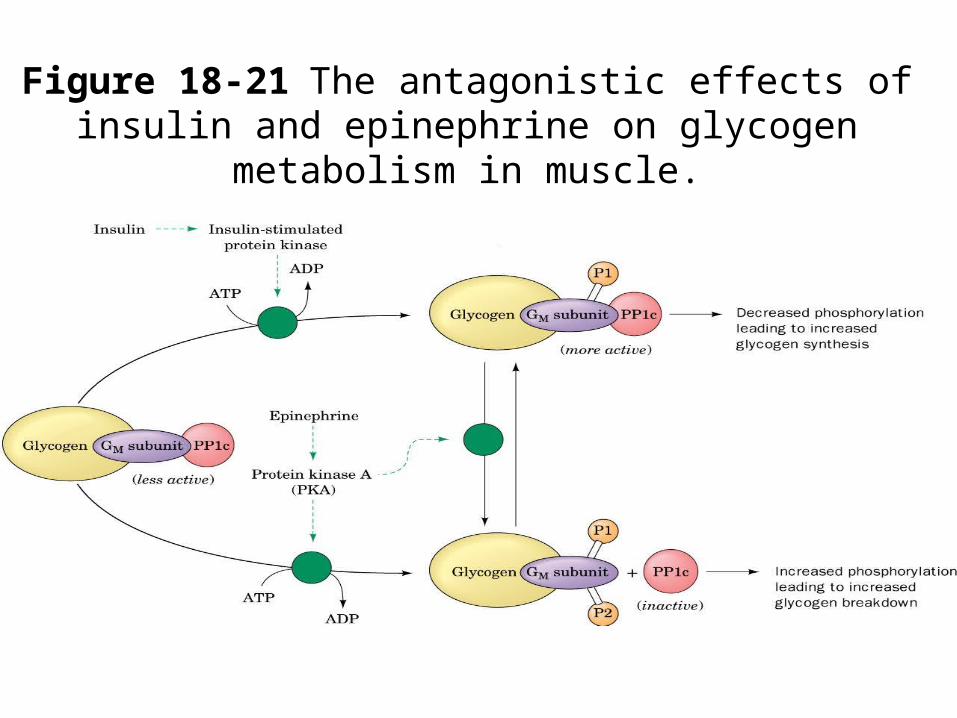
Figure 18-21 The antagonistic effects of insulin and epinephrine on glycogen metabolism in muscle.
Pag
e 64
5
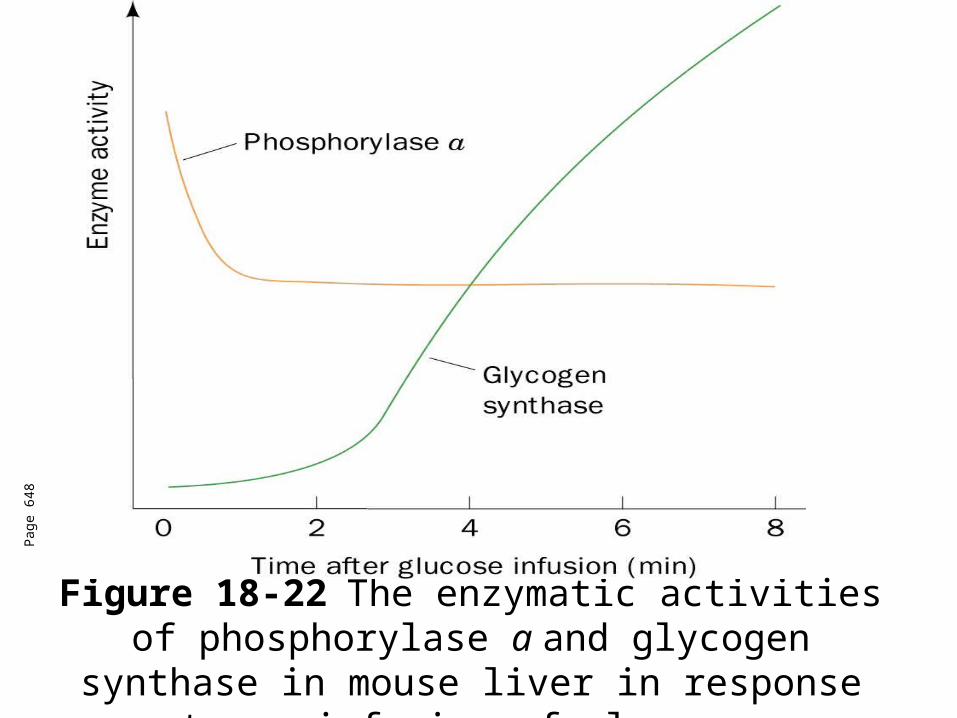
Figure 18-22 The enzymatic activities of phosphorylase a and glycogen synthase in
mouse liver in response to an infusion of glucose.
Pag
e 64
8
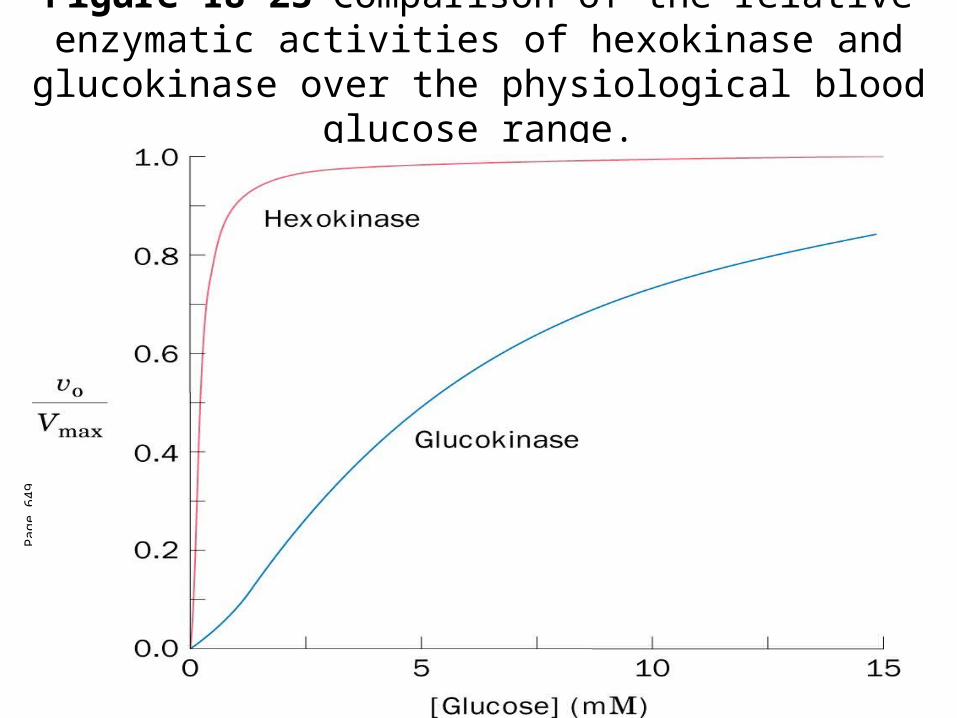
Figure 18-23 Comparison of the relative enzymatic activities of hexokinase and glucokinase over the
physiological blood glucose range.
Pag
e 64
9
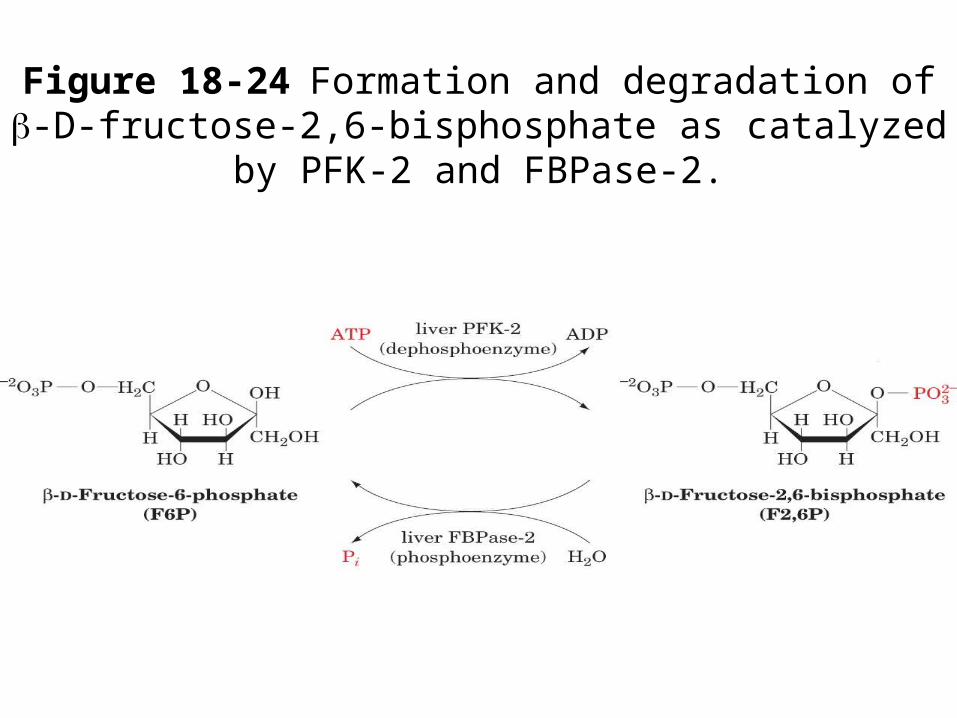
Figure 18-24 Formation and degradation of -D-fructose-2,6-bisphosphate as catalyzed by PFK-2 and
FBPase-2.
Pag
e 64
9
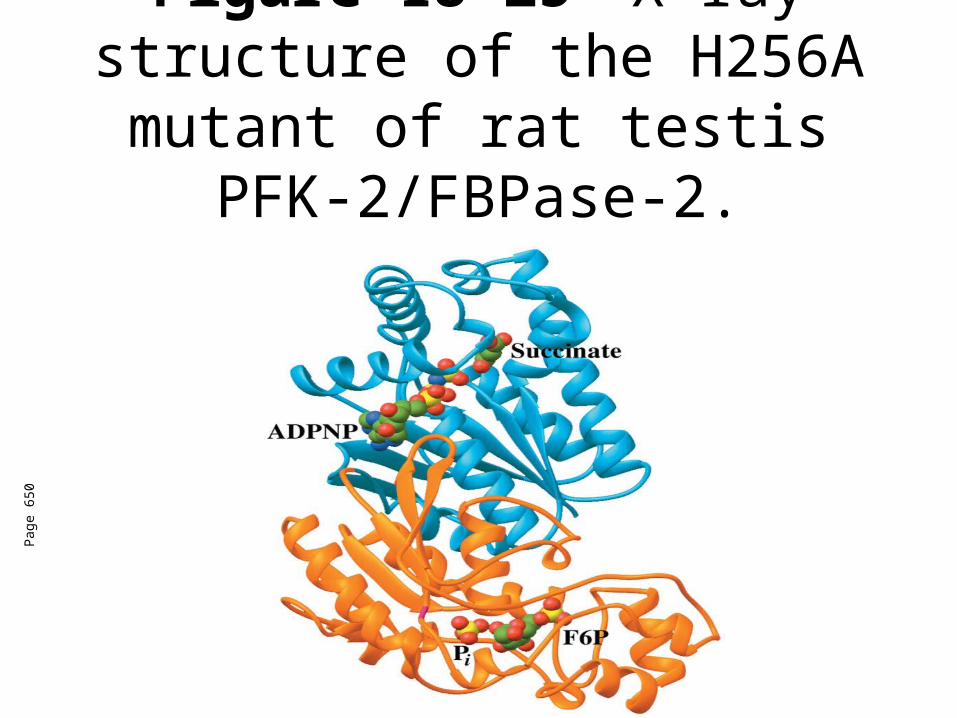
Figure 18-25 X-ray structure of the H256A mutant of rat testis
PFK-2/FBPase-2.
Pag
e 65
0
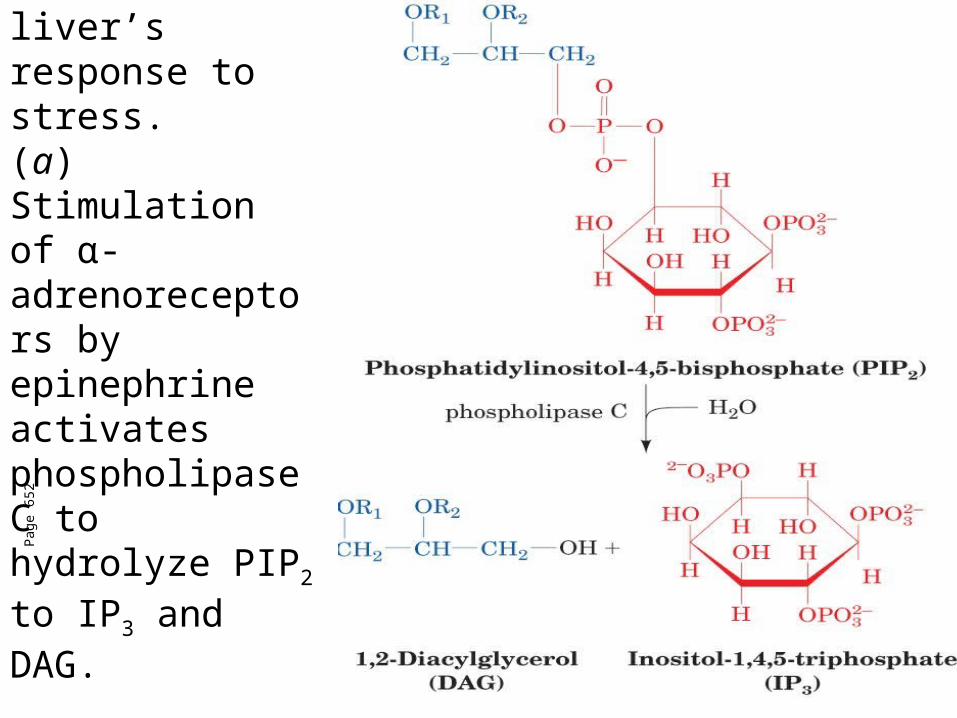
Figure 18-26aThe liver’s response to stress. (a) Stimulation of α-adrenoreceptors by epinephrine activates phospholipase C to hydrolyze PIP2 to IP3 and DAG.
Pag
e 65
2
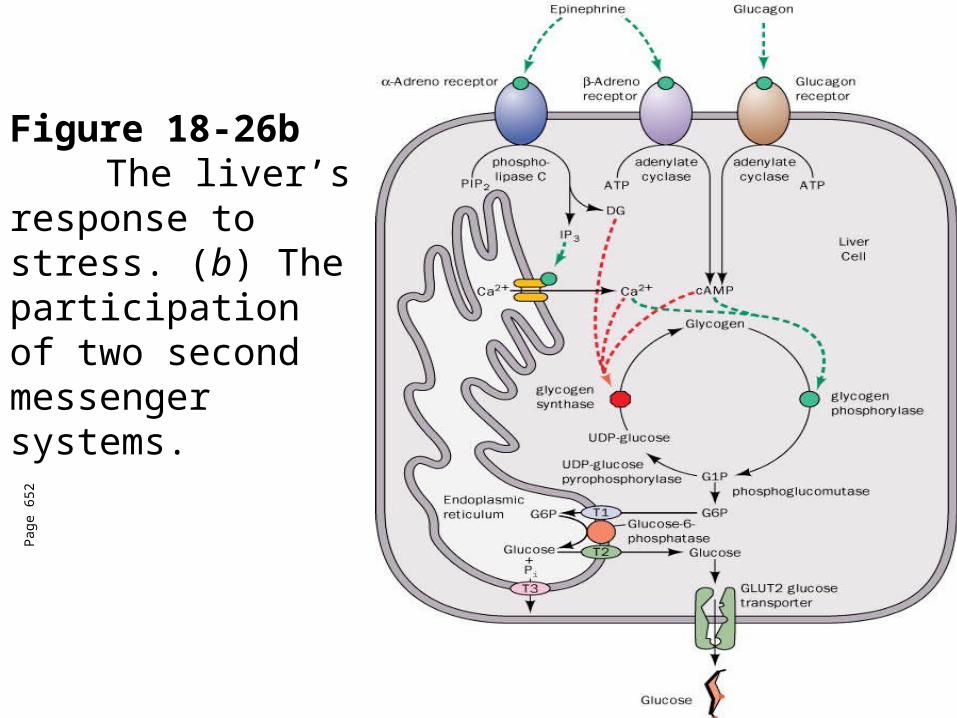
Figure 18-26bThe liver’s response to stress. (b) The participation of two second messenger systems.
Pag
e 65
2
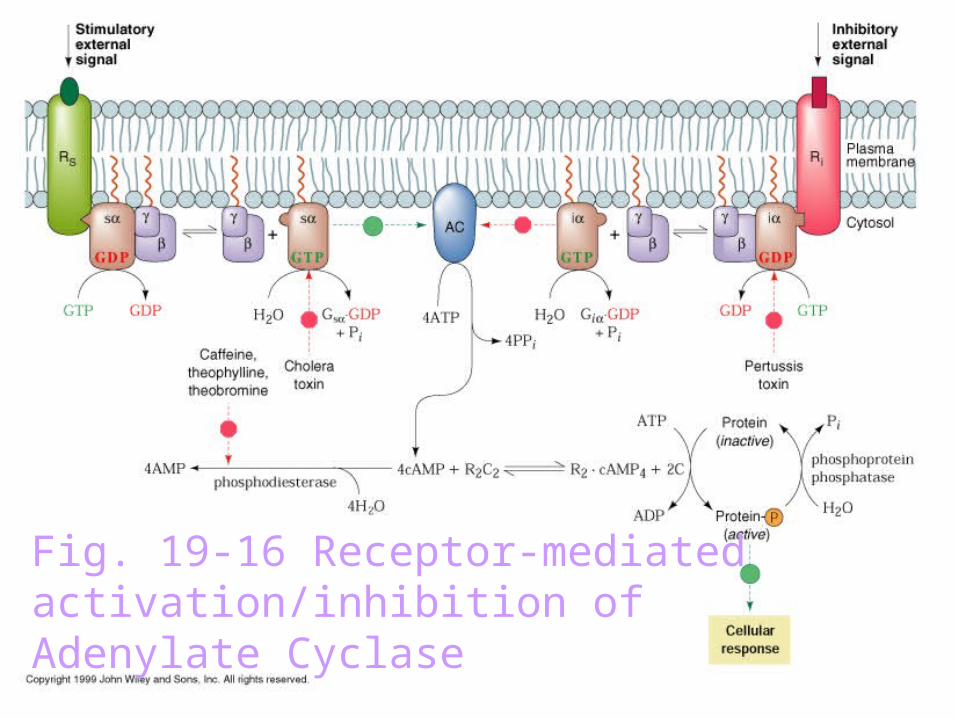
Fig. 19-16 Receptor-mediated activation/inhibition of Adenylate Cyclase
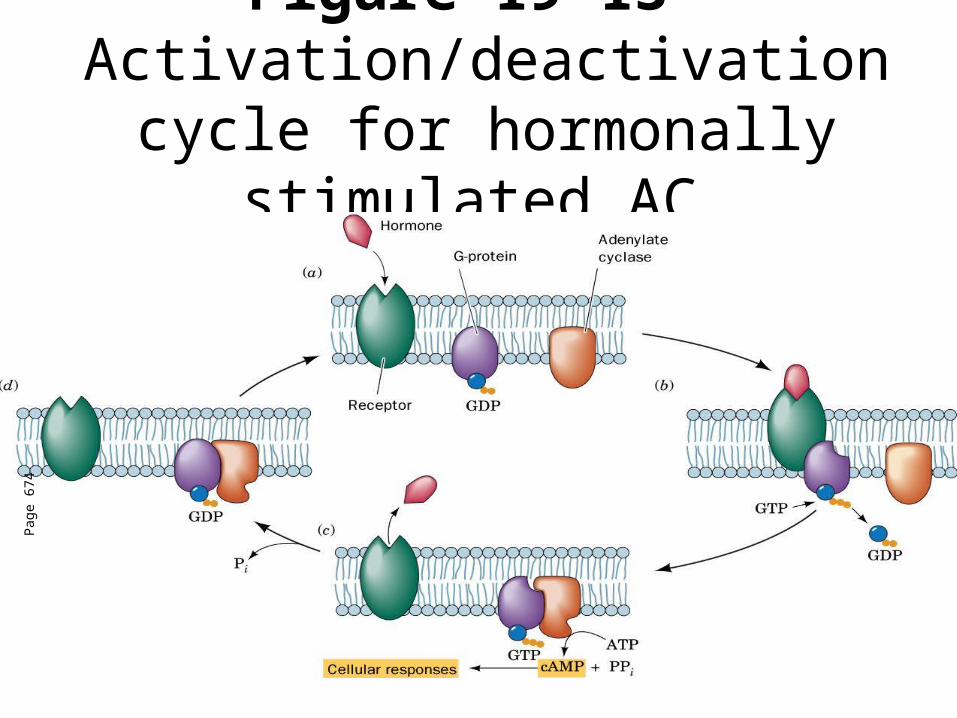
Figure 19-13Activation/deactivation cycle for
hormonally stimulated AC.
Pag
e 67
4
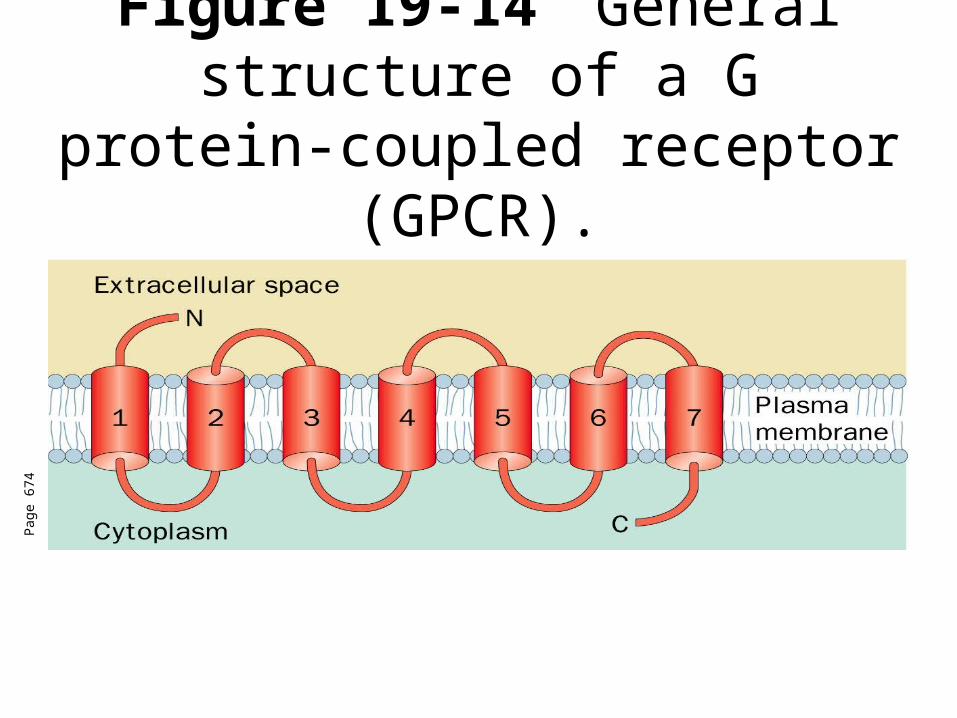
Figure 19-14 General structure of a G protein-coupled receptor
(GPCR).
Pag
e 67
4
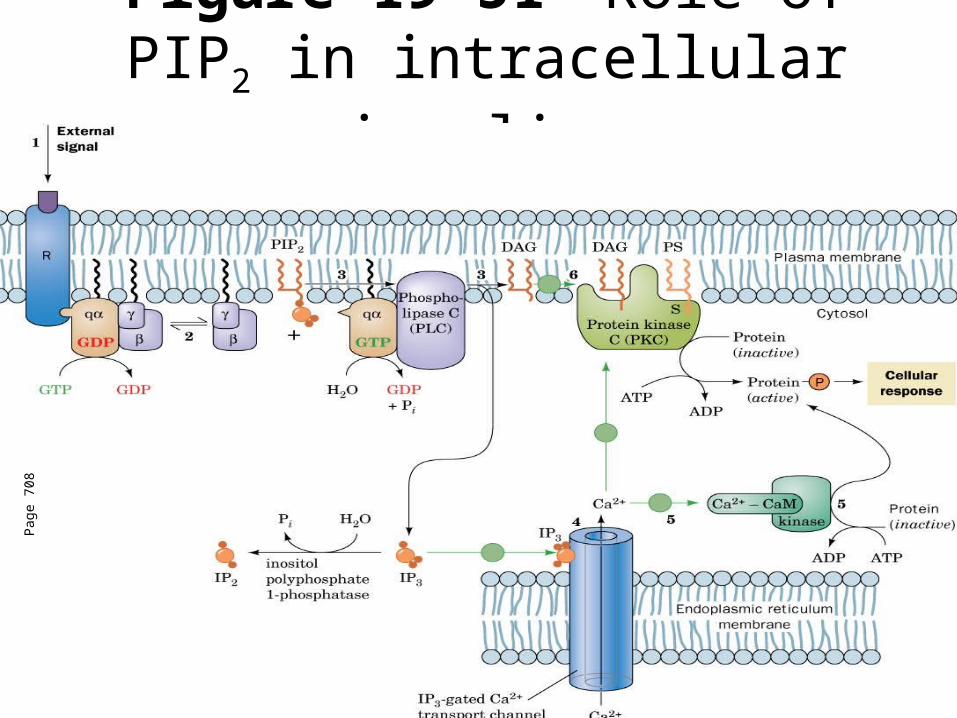
Figure 19-51 Role of PIP2 in intracellular signaling.
Pag
e 70
8
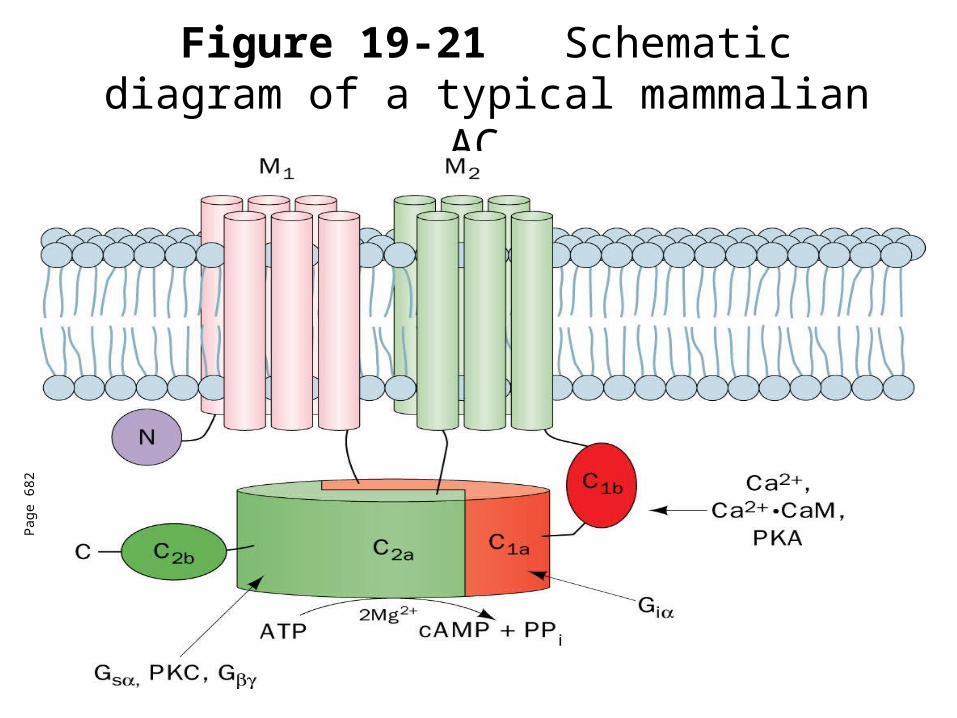
Figure 19-21 Schematic diagram of a typical mammalian AC.
Pag
e 68
2
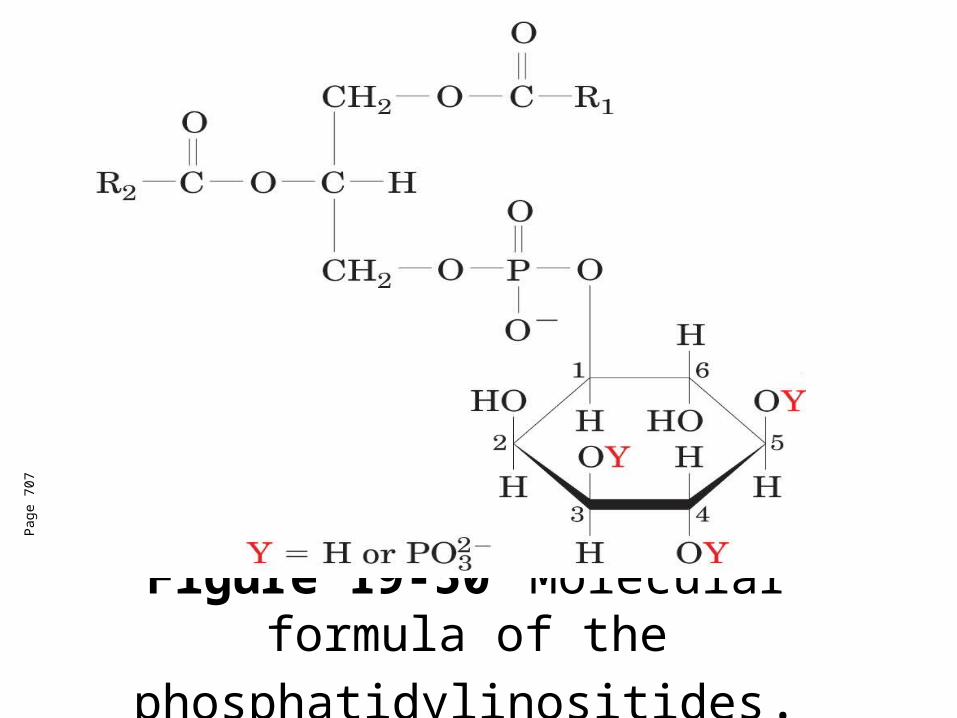
Figure 19-50 Molecular formula of
the phosphatidylinositides.
Pag
e 70
7
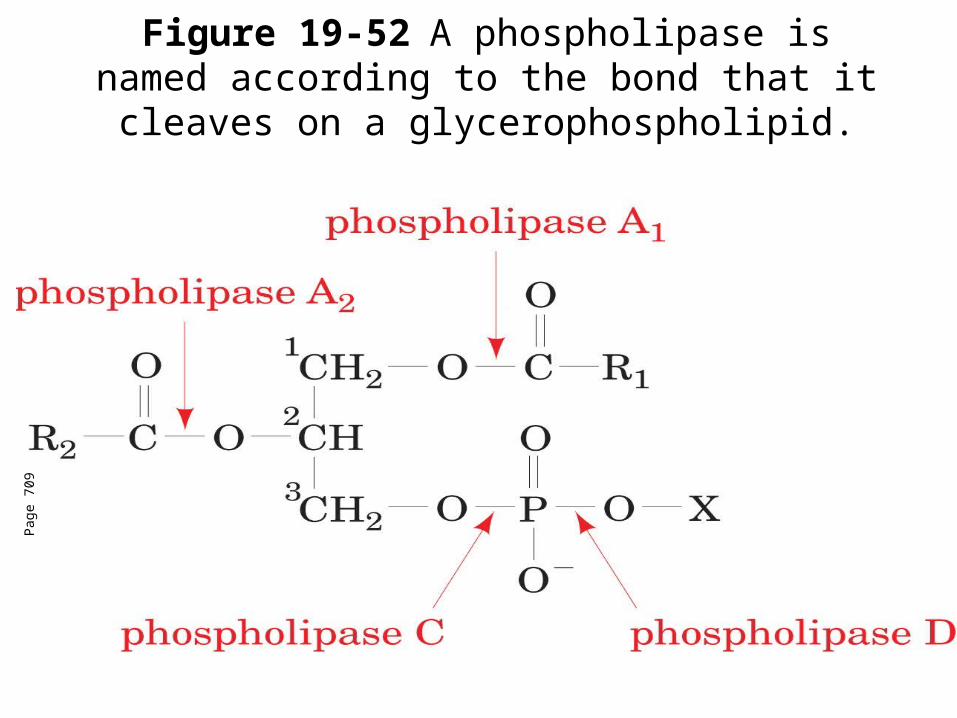
Figure 19-52 A phospholipase is named according to the bond that it cleaves on a
glycerophospholipid.
Pag
e 70
9
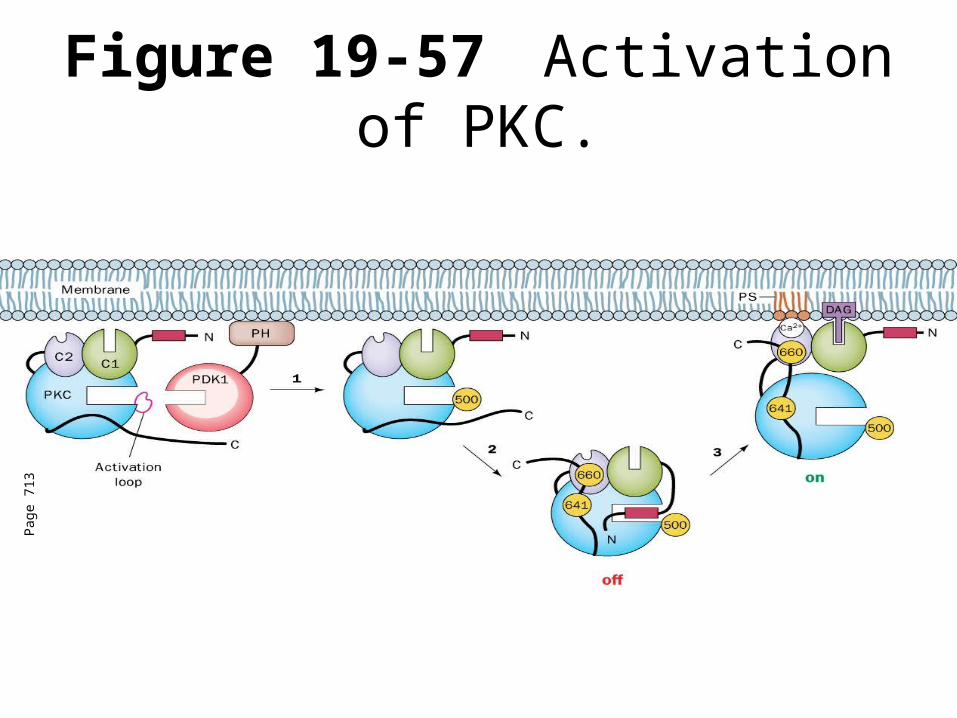
Figure 19-57 Activation of PKC.
Pag
e 71
3
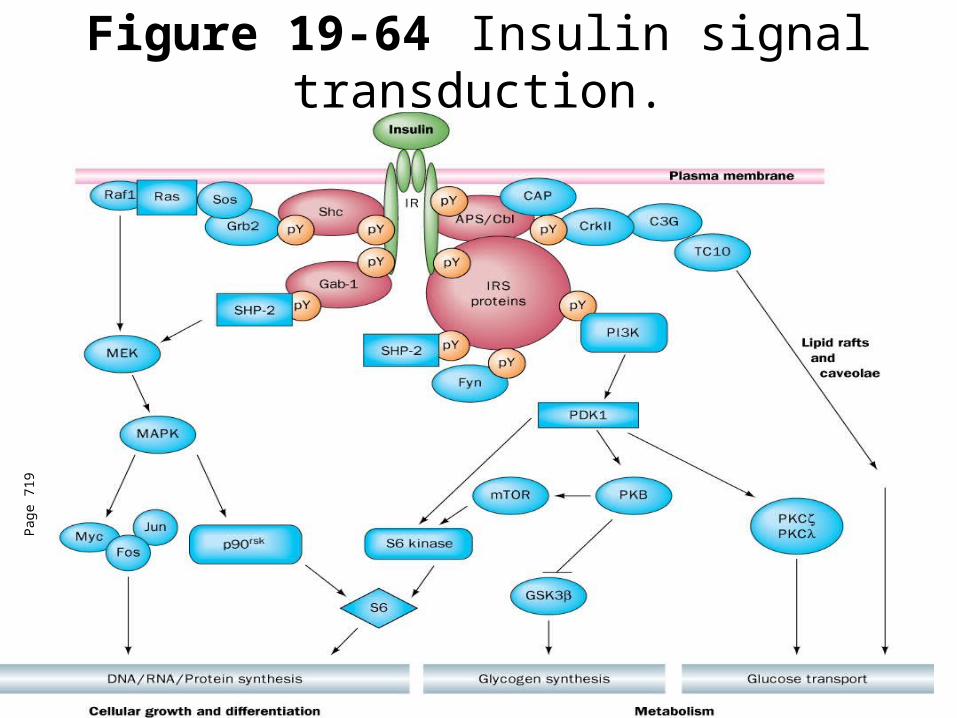
Figure 19-64 Insulin signal transduction.P
age
719
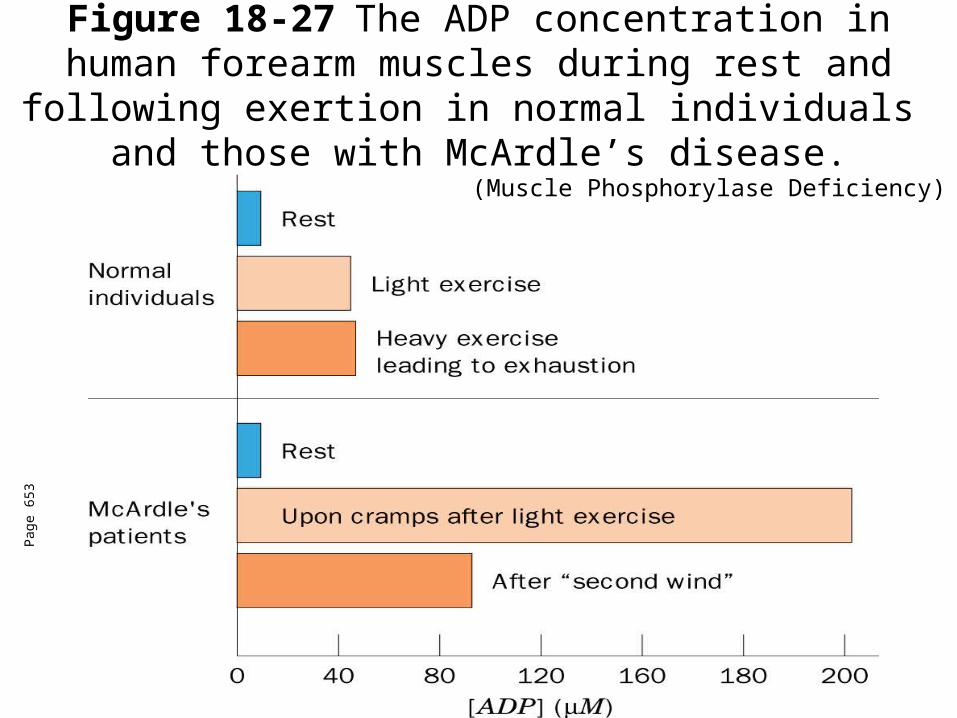
Figure 18-27 The ADP concentration in human forearm muscles during rest and following exertion in normal individuals and those with McArdle’s disease.
Pag
e 65
3
(Muscle Phosphorylase Deficiency)
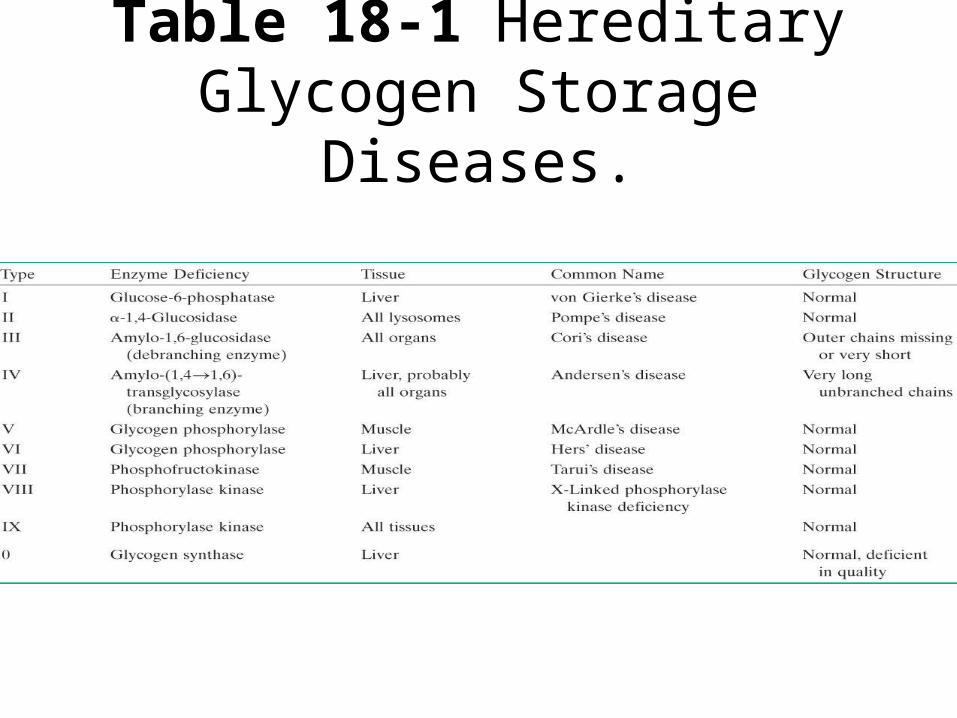
Table 18-1Hereditary Glycogen Storage Diseases.
Pag
e 65
1
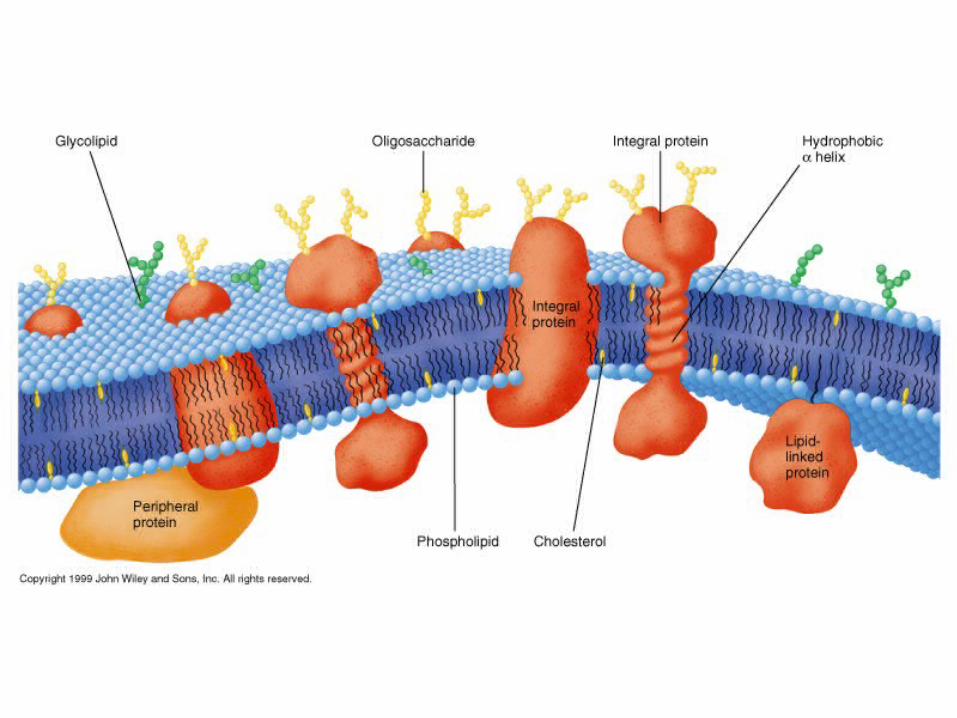
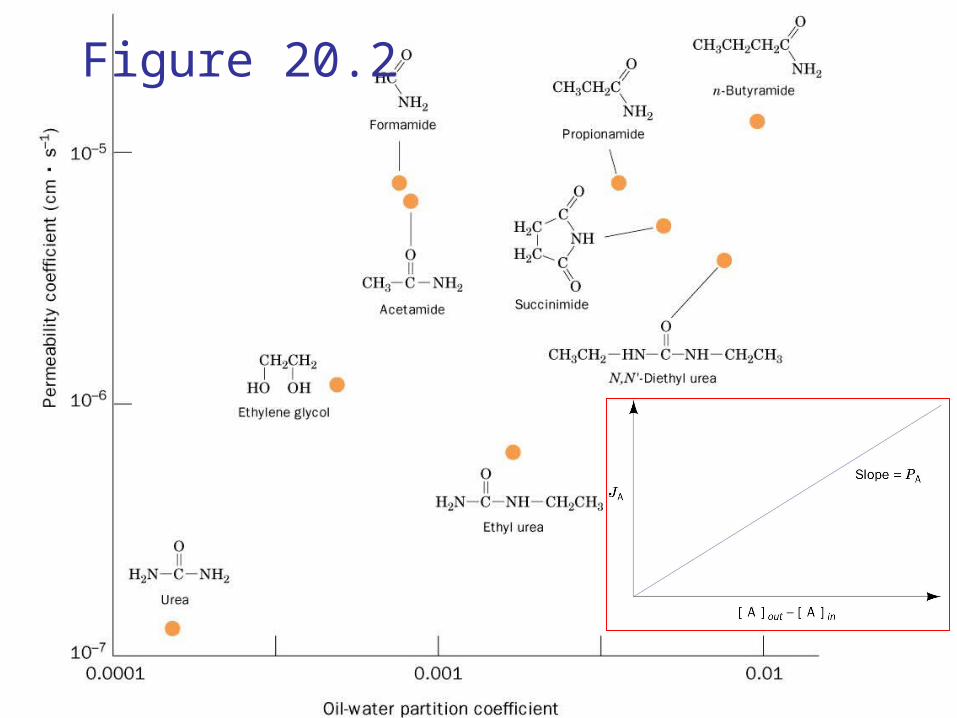
Figure 20.2

For diffusion Keq = 1, thus G°’ = 0
Start of “reaction”
equilibrium
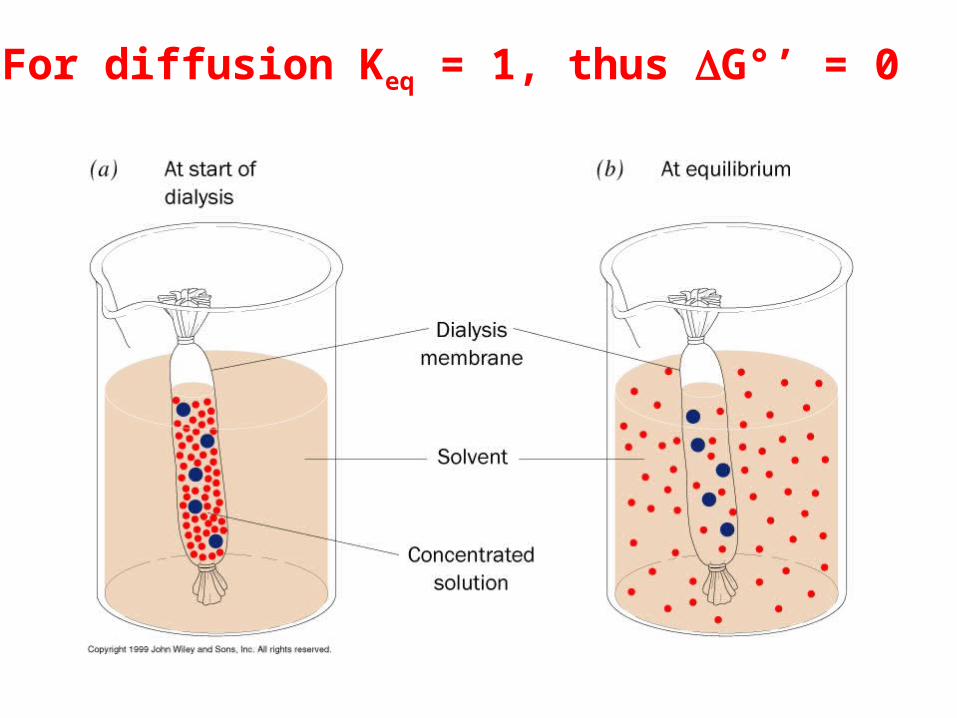
For diffusion Keq = 1, thus G°’ = 0
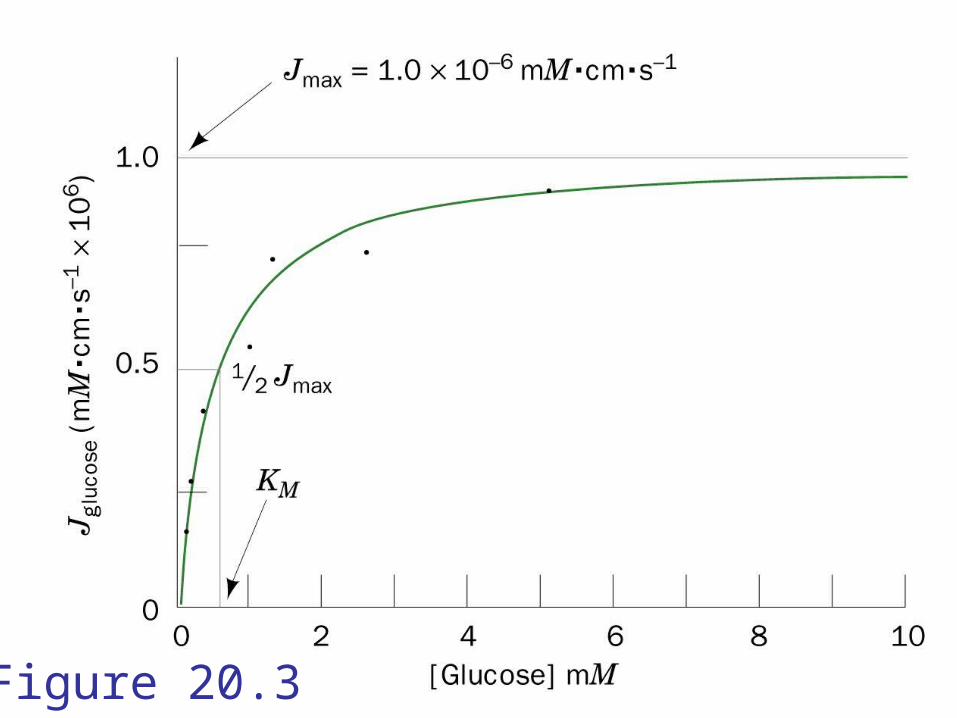
Figure 20.3
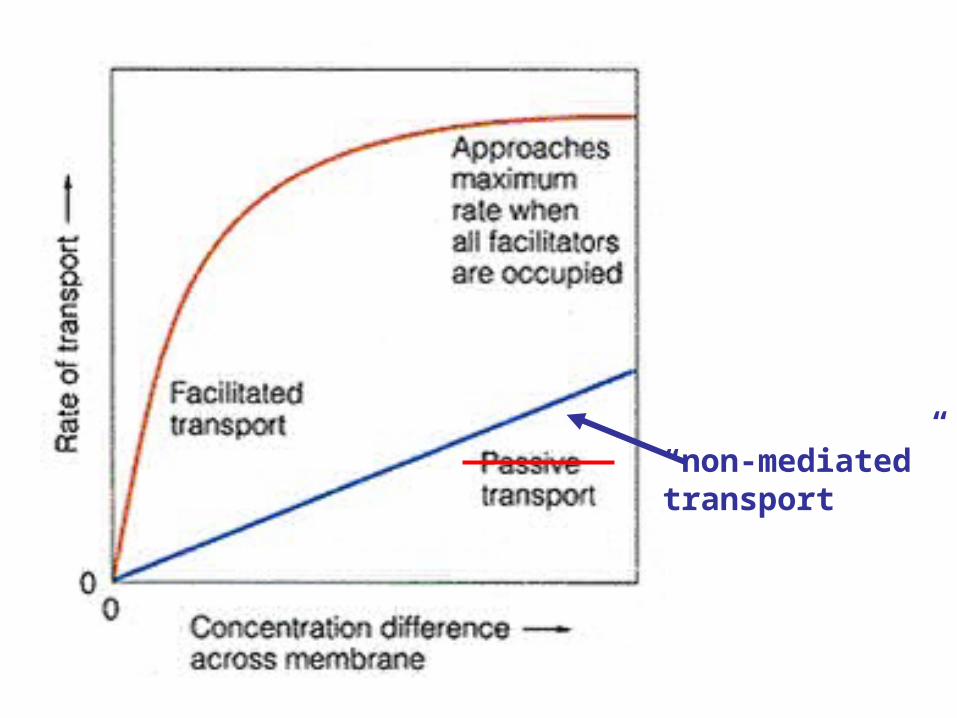
“non-mediated”transport

Table 20-1
Figure 20.4
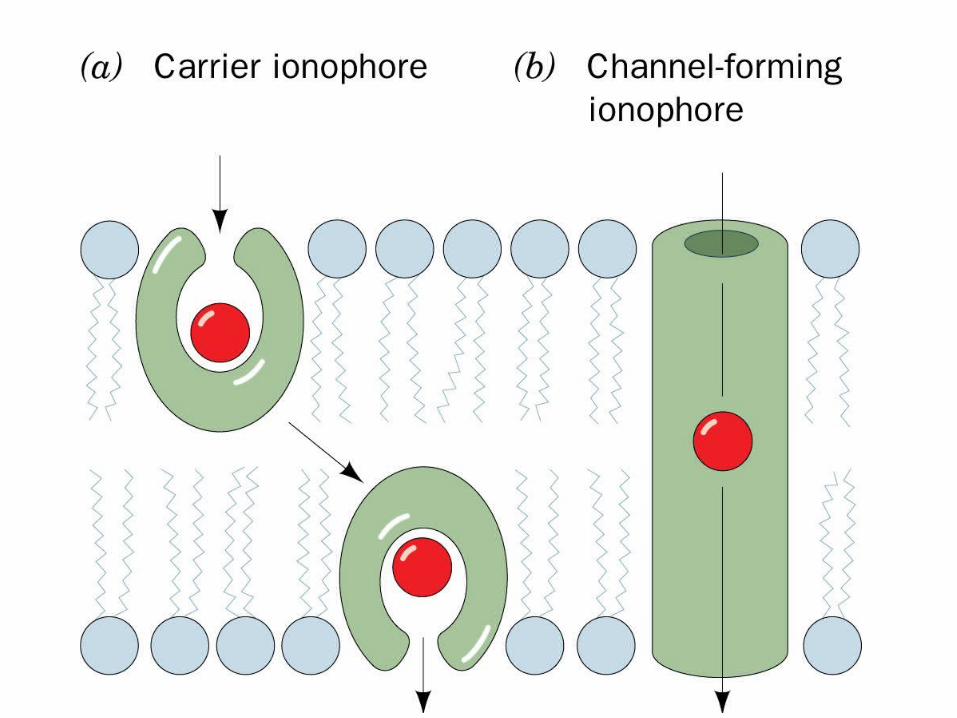
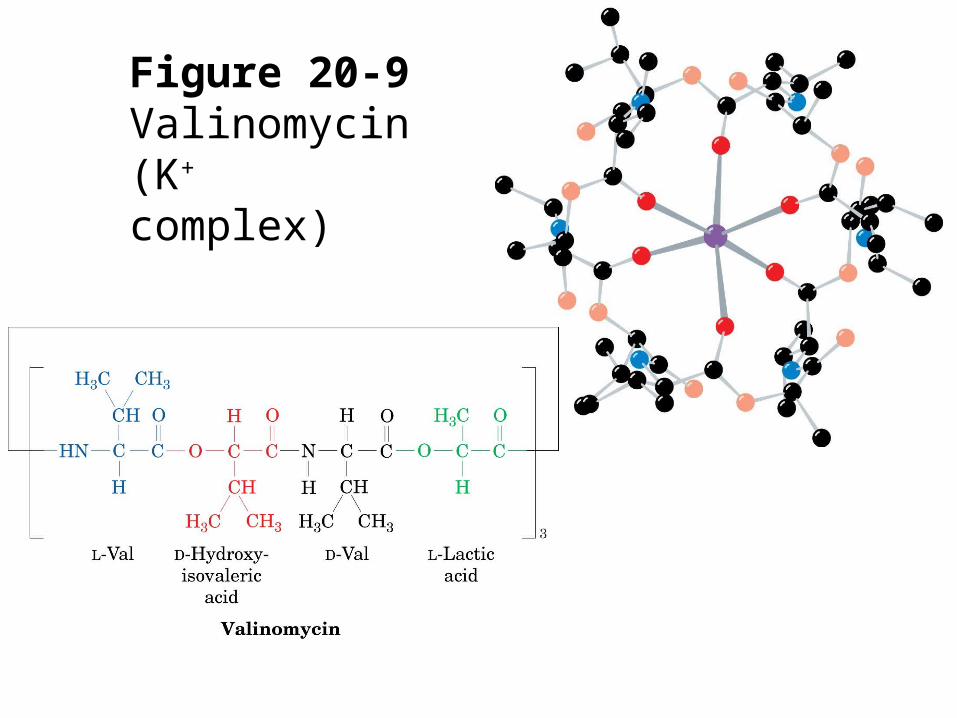
Figure 20-9Valinomycin(K+ complex)
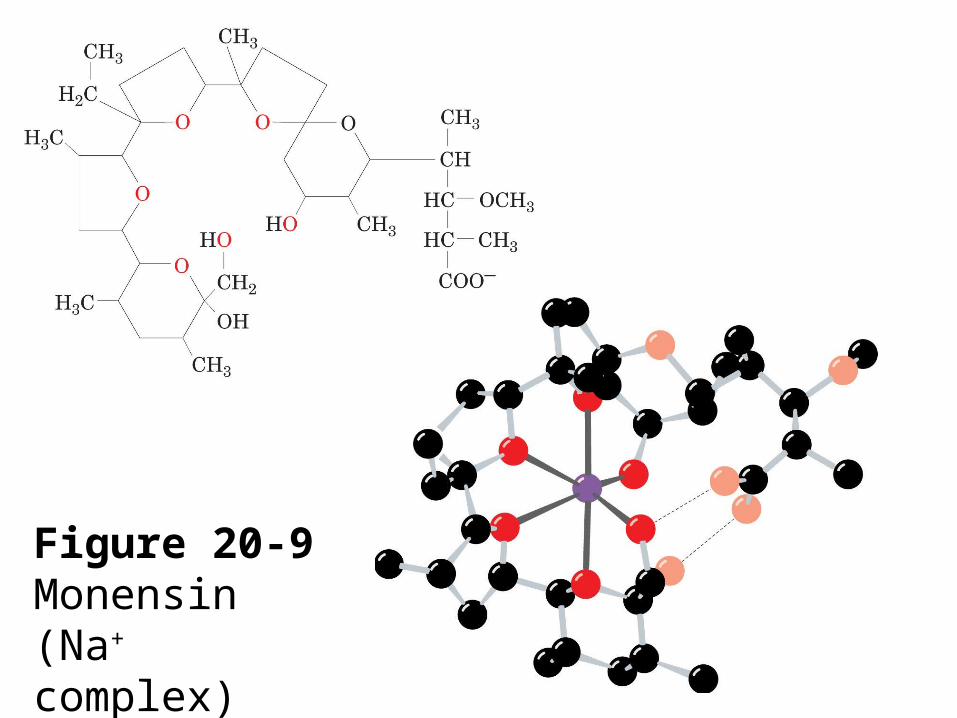
Figure 20-9Monensin(Na+ complex)
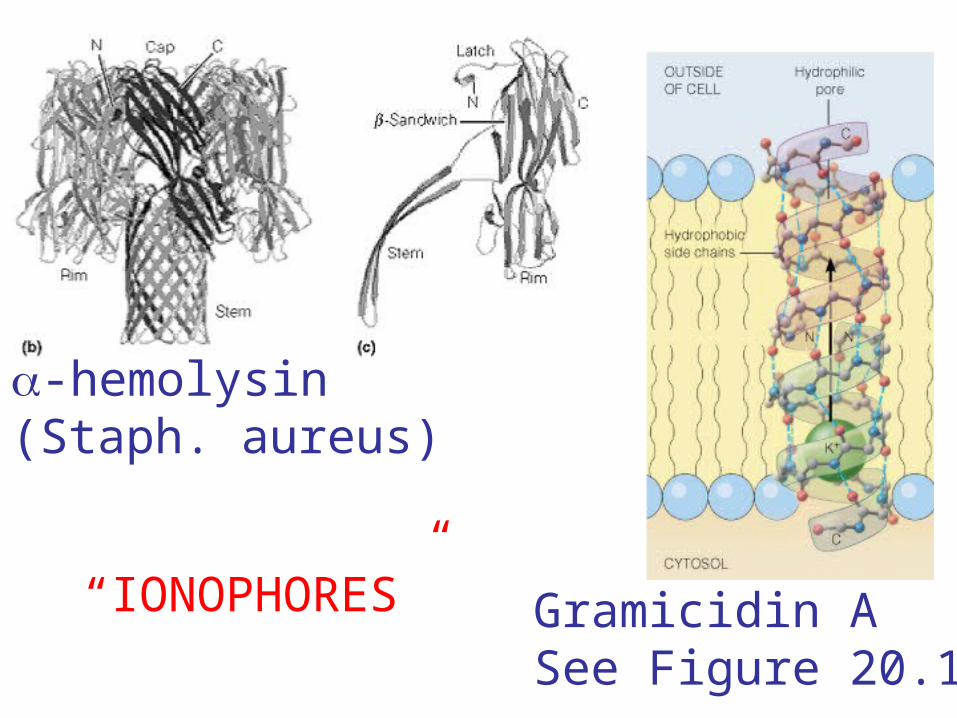
Gramicidin ASee Figure 20.11
-hemolysin(Staph. aureus)
“IONOPHORES”
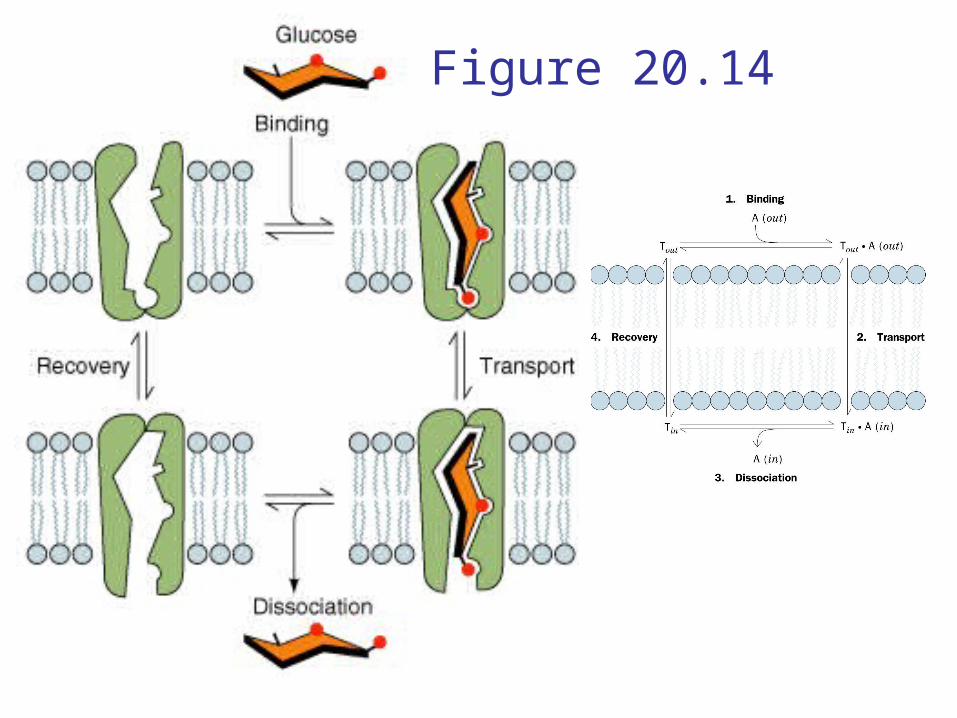
Figure 20.14
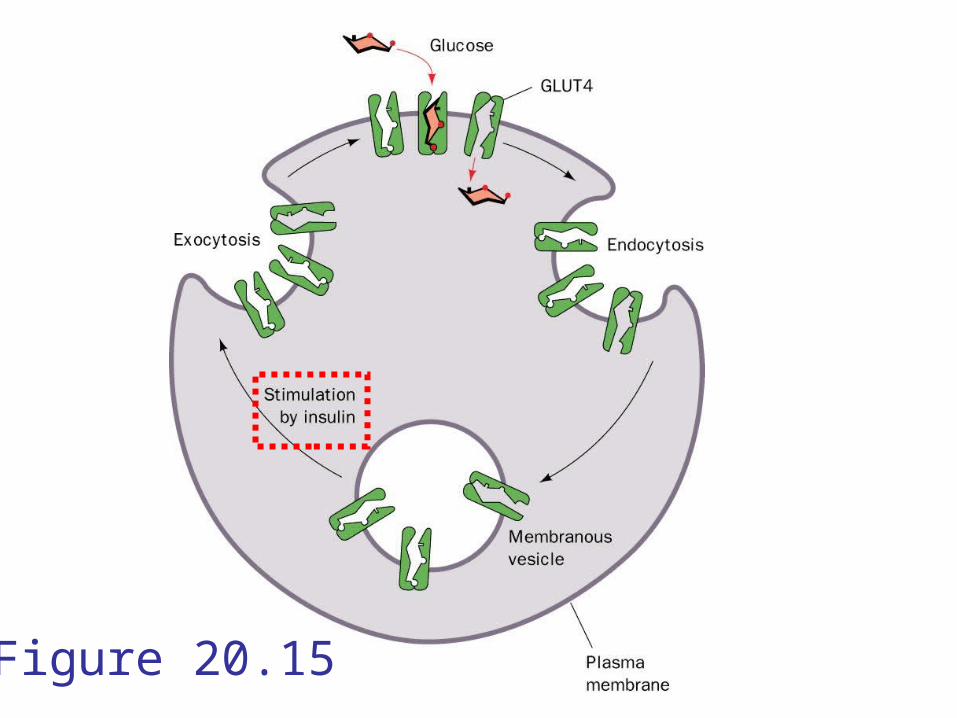
Figure 20.15
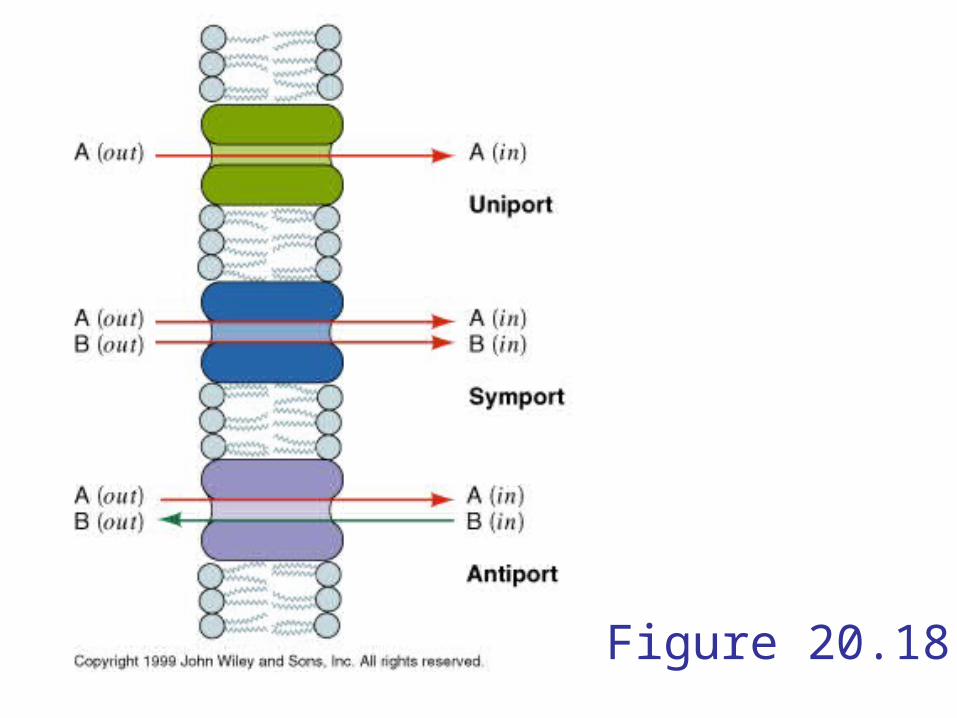
Figure 20.18
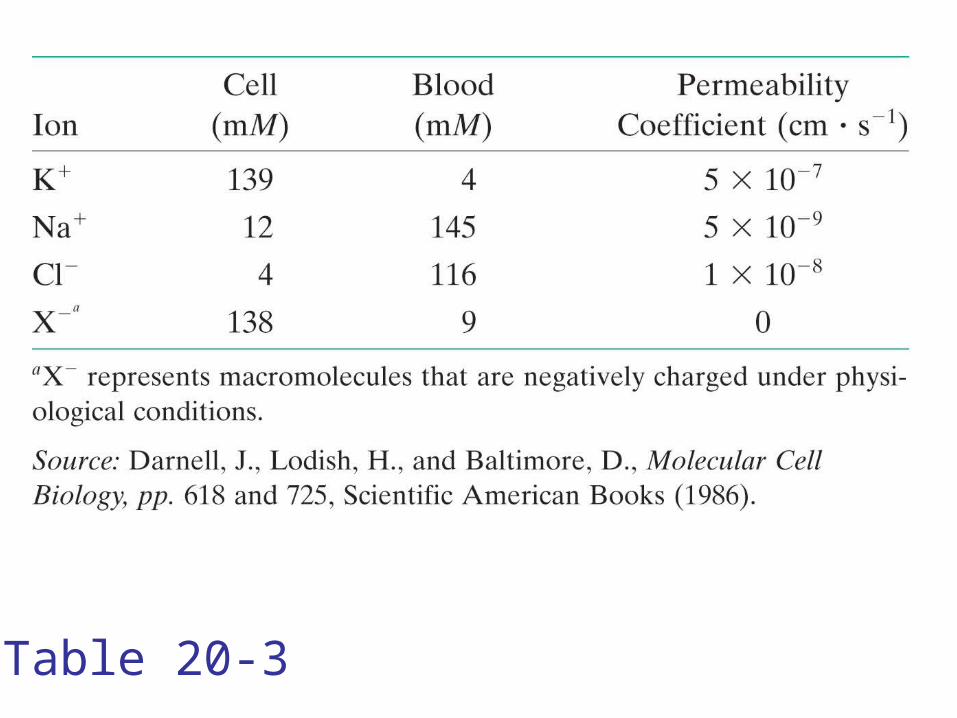
Table 20-3
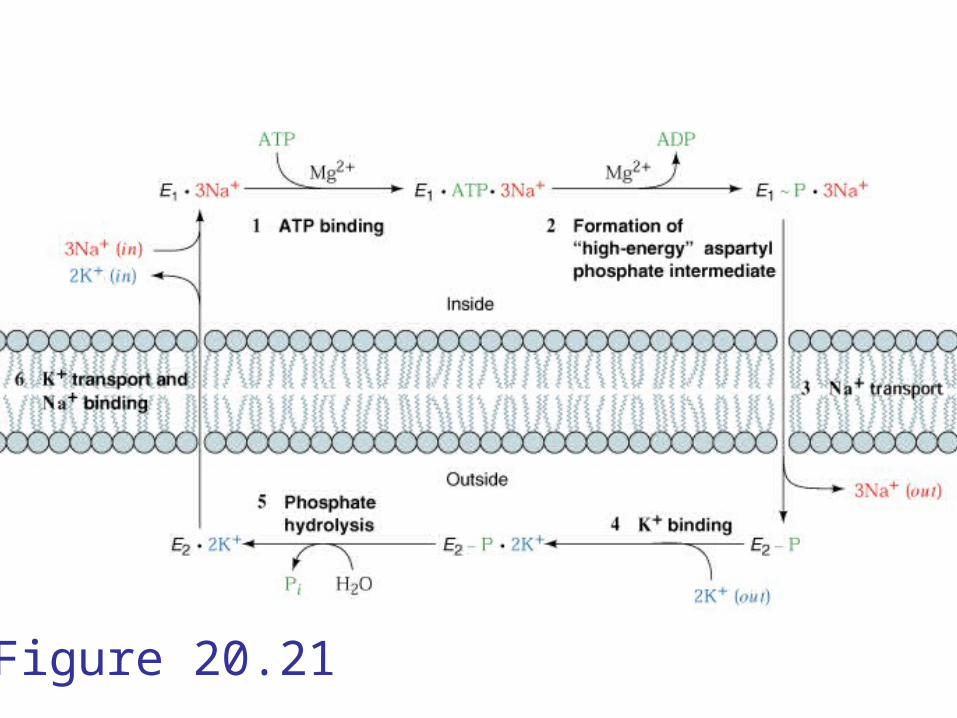
Figure 20.21
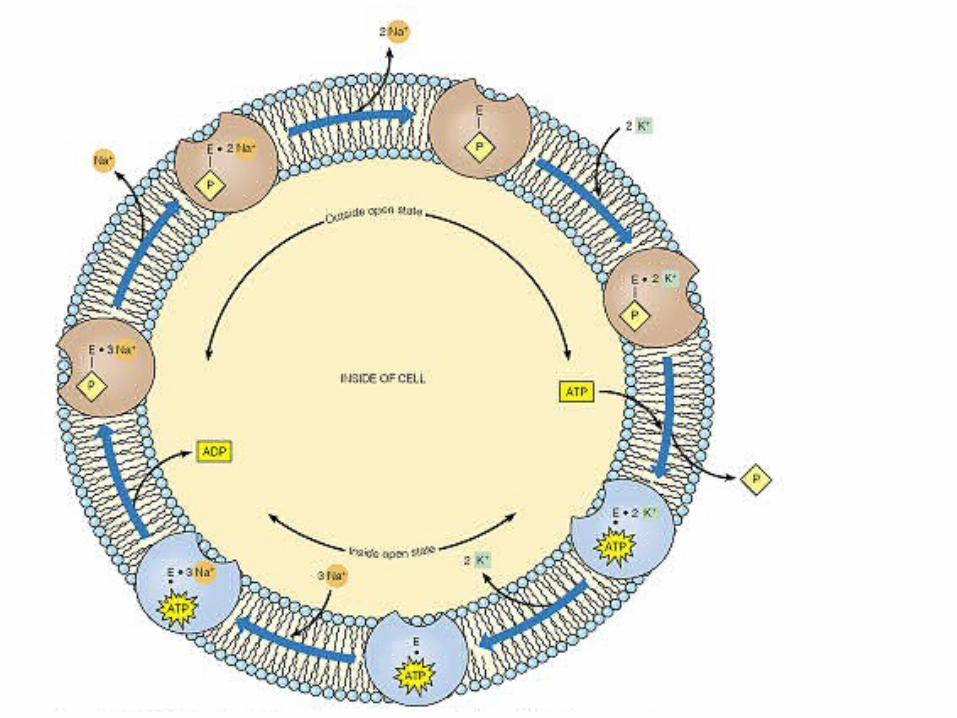
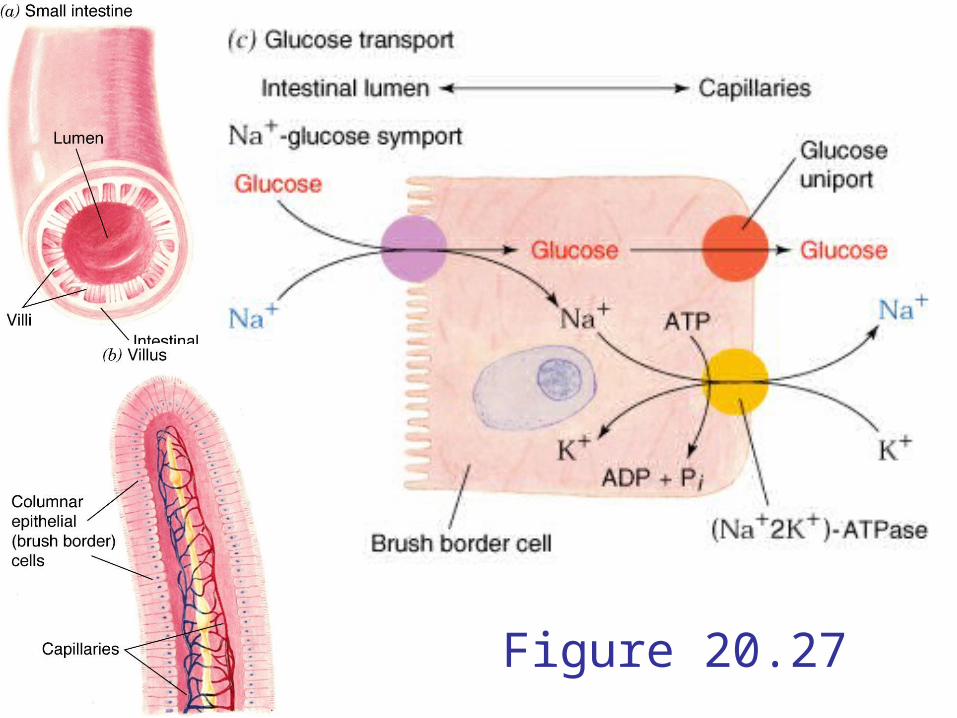
Figure 20.27
“Alfonse, Biochemistry makes my head hurt!!”\


