Download - Autogenous Shrinkage in Cementitious Systems
AUTOGENOUS SHRINKAGE IN CEMENTITIOUS SYSTEMS
by
Vinod Rajayogan B.E (Civil), M.Tech
A thesis submitted in fulfilment
of the requirements for the degree of
Doctor of Philosophy
School of Aerospace, Civil and Mechanical Engineering
The University of New South Wales
Australian Defence Force Academy
Canberra, ACT, 2600, Australia
31 March 2009


ii
iii
ABSTRACT
Thesis Title: Autogenous shrinkage in cementitious systems
Autogenous shrinkage is of concern in high performance concrete mixtures, when
specific properties like strength and durability are enhanced. Factors like low water-
cement ratio, low porosity and increased hydration kinetics which are associated with
high performance concrete mixtures are also responsible for the development of
autogenous shrinkage. With about two decades of research into autogenous shrinkage,
uncertainties still exist with testing procedure, effect of supplementary cementitious
materials, modelling and prediction of autogenous shrinkage.
The primary focus of this study is to understand mechanisms which have been
postulated to cause autogenous shrinkage like chemical shrinkage and self desiccation.
In addition, this study has considered properties like porosity and internal empty voids
in the analysis of the causes of bulk volume deformations of the cementitious paste
systems with and without mineral admixtures.
The study begins with an experimental investigation of chemical shrinkage in hydrating
cementitious paste systems with the addition of fly ash, slag and silica fume using the
test method recently accepted by the ASTM. This was followed by the experimental
investigation of autogenous shrinkage in cementitious paste. The autogenous shrinkage
in paste mixtures is studied from an early age (~1.5 hours after addition of water) for
cementitious systems at a water-cementitious ratio of 0.32 (w/c 0.25 for limited mixture
proportions). A non-contact measurement method using eddy current sensors were
adopted. The hydration mechanism of the cementitious paste systems was then
modelled using CEMHYD3D, which is a 3 dimensional numerical modelling method
successfully used to study, simulate and present the hydration developments in
cementitious systems. Properties like chemical shrinkage, degree of hydration, total
porosity and free water content; all of which have been obtained from the CEMHYD3D
simulation have been cross correlated with the experimental results in order to more
comprehensively understand the mechanism contributing to bulk volume change under
sealed conditions. The experimental investigations are extended to study the
iv
development in concrete with and without mineral admixtures (i.e., silica fume, fly ash
and slag).
Self desiccation driving the development of autogenous shrinkage has been used
extensively across literature but as an alternative the author has proposed using internal
drying factor in modelling autogenous shrinkage. The “internal drying factor” is
described as the ratio of the empty voids (due to chemical shrinkage) to the total
porosity at any point of time of hydration. Independent of the mixture proportions, a
linear trend was observed between the autogenous shrinkage strain and increase in
internal drying factor. Thus the internal drying factor could be incorporated into semi-
empirical models while attempting to predict autogenous shrinkage. An increase in the
compressive strength of matured concrete at 1 year had a strong correlation to the
observed autogenous shrinkage strains irrespective of the cementitious system. It is
believed this could be because of the increase in gel-space ratio which is intern linked to
the degree of hydration and porosity of the microstructure. The author has obtained
strong evidence that the micro-structural changes associated with high strength and
durable concrete have a direct impact on the autogenous shrinkage of concrete. Hence,
the author suggests that autogenous shrinkage should be investigated and allowable
values be stipulated as design criterion in structures that use high strength-high
performance concrete.
v
Publications related to this thesis
Conference Paper
1) Vinod Rajayogan and Obada Kayali “Chemical shrinkage in cementitious
systems with mineral admixture”. The 3rd IMS International conference on :
Application of traditional and high performance materials in harsh
environments. Sharjah - UAE. Jan 2008.
Journal Paper
1) Vinod Rajayogan and Obada Kayali “Autogenous shrinkage in plain cement
paste mixtures” Key Engineering materials Journal Vol 400-402, pages 137-
143, 2009., also presented at the 2nd International conference on advances in
concrete and structures, Hunan University, China , June 2008.

vi
vii
ACKNOWLEDGEMENTS
I would like to thank the constant encouragement and critical reviewing of my work by
the supervisor Dr Obada Kayali. His critical reasoning and discussions during various
stages of candidature truly inspired me. He has also trained me to be independent and
think laterally. The credit also goes to my co-supervisor Associate Professor Stephen
Yeomans on his constructive suggestions and review of my progress during various
stages of the candidature. I am indebted to Dr Warren Smith Head of school, Krishna
Shankar (Research Coordinator) and the Graduate research school (Danica Robinson
and Elvira Berra) for supporting financially and providing access to adequate facilities
to complete my research successfully. I would like to thank the Student Administrative
services and Christa Cordes who has helped me at various time between my candidature
with support with administrative requirements.
I greatly appreciate the commitment and support of our School Senior Technical officer
Mr Wayne Jealous for much of my experimental work. Senior Technical officers Mr
David Sharp and Mr Jim Baxter have helped greatly with all the instrumentation works
of my data loggers and sensors used in this study. I also must express my appreciation
to the School Electronics team and fabrication laboratory team for their support. I would
also like to thank Mr Kurt Barnette who has been very helpful during the initial stages
of my experimental work.
I am thankful to the ANU Microscopic Unit, especially the Late Mr Geoff Hunter and
Dr Frank Brink who have helped with operation and access to the Scanning electron
microscopes at the Australian National University.
I could not have completed this thesis without the constant support of Dale Bentz
(NIST,USA) who has promptly replied to all my emails and queries regarding the
CEMHYD3D (Simulation software) and given constructive comments at various stages.
His attitude, advice, interest and discussion, given his world reputation and extremely
busy schedule, have given me extreme inspiration, confidence and enthusiasm.

viii
Dr O M Jensen is profusely thanked for supplying me with corrugated tubes for carrying
out the experimental study in paste samples and for his valuable advice and discussion.
I would like to thank my friends Pandiyan Govindasamy, Vimal Raj Kumar,
Lakshmikant Kannappan, Khin Thander Soe, Jeyakanthan, Piratheepan, Kamaljit Singh,
Mahendra Kumar Samal, Sharfuddin Ahmed, Abijit, Vishwas and Amitay who have
made my stay at UNSW @ADFA enjoyable.
I would like to thank my parents who have constantly encouraged and supported me and
have been the main inspiration for pursuing my Doctoral study.
And Finally I would like to thank my wife Hari Priya who has been there at the most
crucial moment of my PhD, i.e., my thesis writing and supporting me both emotionally
and financially. She has set a vision for my life and my career ahead.
Table of Contents
ix
TABLE OF CONTENTS
Certificate of Originality .................................................................................................i ABSTRACT....................................................................................................................iii ACKNOWLEDGEMENTS..........................................................................................vii TABLE OF CONTENTS...............................................................................................ix LIST OF FIGURES .....................................................................................................xiii LIST OF TABLES .......................................................................................................xix NOTATIONS and ACRONYMS................................................................................xxi CHAPTER 1 - INTRODUCTION.................................................................................1
1.1 Introduction.............................................................................................................1 1.2 Background and importance of this research..........................................................2 1.3 Objective of the research.........................................................................................3 1.4 Scope of the research ..............................................................................................4 1.5 Outline of the Thesis ...............................................................................................5
CHAPTER 2 - AUTOGENOUS SHRINKAGE – AN OVERVIEW .........................7
2.1 Introduction.............................................................................................................7 2.2 Types of shrinkage ..................................................................................................8
2.2.1 Early age shrinkage..........................................................................................8 2.2.2 Long term shrinkage ........................................................................................8 2.2.3 Plastic shrinkage ..............................................................................................9 2.2.4 Thermal shrinkage............................................................................................9 2.2.5 Drying shrinkage............................................................................................10 2.2.6 Carbonation shrinkage ...................................................................................10 2.2.7 Autogenous shrinkage....................................................................................10
2.3 Autogenous shrinkage...........................................................................................11 2.3.1 Definition of autogenous shrinkage in literature............................................12
2.4 Basic mechanism of autogenous shrinkage ..........................................................12 2.5 Chemical shrinkage...............................................................................................13
2.5.1 Measurement of chemical shrinkage..............................................................14 2.5.2 Factors affecting chemical shrinkage.............................................................17 2.5.3 Fineness of cementitious material..................................................................19 2.5.4 Effect of mineral admixtures..........................................................................19 2.5.5 Effect of water-cement ratio...........................................................................21 2.5.6 Physical effects of chemical shrinkage ..........................................................21 2.5.7 Chemical shrinkage and link to autogenous shrinkage..................................22
2.6 Self desiccation .....................................................................................................23 2.6.1 Basic phenomenon .........................................................................................24 2.6.2 Mechanism of self-desiccation.......................................................................25 2.6.3 Thermodynamics of self-desiccation .............................................................27 2.6.4 Factors influencing self-desiccation...............................................................28
2.7 Measurement methods for autogenous shrinkage.................................................30 2.7.1 Linear measurements of autogenous shrinkage .............................................30 2.7.2 Volumetric measurements of autogenous shrinkage .....................................30
2.8 Autogenous shrinkage in cementitious systems....................................................31 2.8.1 Autogenous shrinkage and degree of hydration.............................................31 2.8.2 Factors influencing autogenous shrinkage.....................................................31
2.9 Basic Mechanism of hydration in cementitious system........................................34
Table of Contents
x
2.9.1 Slag hydration ................................................................................................34 2.10 Estimation and prediction autogenous shrinkage strains ....................................36
2.10.1 Tazawa and Miyazawa model (Tazawa and Miyazawa 1999) ....................37 2.10.2 Modified Tazawa and Miyazawa model ......................................................38
2.11 Modelling autogenous shrinkage ........................................................................39 2.12 Mitigation of Autogenous shrinkage...................................................................40 2.13 Summary .............................................................................................................41
CHAPTER 3 - EXPERIMENTAL PROGRAM AND METHODOLOGY ............43
3.1 Introduction...........................................................................................................43 3.2 Preliminary Studies ...............................................................................................43
3.2.1 Material Properties .........................................................................................44 3.2.2 Sealing of samples .........................................................................................47
3.3 Studies on Paste ....................................................................................................48 3.3.1 Chemical shrinkage........................................................................................48 3.3.2 Autogenous shrinkage....................................................................................51 3.3.3 Autogenous shrinkage measurement using corrugated tubes ........................52
3.4 Studies on Concrete ..............................................................................................57 3.4.1 Mixture Proportions .......................................................................................57 3.4.2 Sample preparation.........................................................................................59 3.4.3 Casting of samples .........................................................................................60 3.4.4 De-moulding ..................................................................................................60 3.4.5 Autogenous shrinkage specimens ..................................................................60 3.4.6 Drying shrinkage............................................................................................61
3.5 Conclusion ............................................................................................................62 CHAPTER 4 - NUMERICAL SIMULATION USING ‘CEMHYD3D’ ..................65
4.1 Introduction...........................................................................................................65 4.2 What is CEMHYD3D? .........................................................................................65 4.3 Background ...........................................................................................................65 4.4 Methodology for CEMHYD3D ............................................................................66
4.4.1 Material characterisation................................................................................67 4.4.2 Phase composition..........................................................................................68 4.4.3 Re-construction of microstructure..................................................................75 4.4.4 Hydration .......................................................................................................76 4.4.5 Numerical simulation .....................................................................................76
4.5 Numerical simulation (Phase I).............................................................................77 4.5.1 Cycle time conversion factor .........................................................................78
4.6 Numerical simulation (Phase 2) ............................................................................78 CHAPTER 5 - CHEMICAL SHRINKAGE – RESULTS and DISCUSSION........79
5.1 Introduction...........................................................................................................79 5.2 Chemical shrinkage - Experimental results...........................................................79
5.2.1 Plain cement paste..........................................................................................79 5.2.2 Cement - silica fume mixture.........................................................................84 5.2.3 Cement – fly ash mixture ...............................................................................90 5.2.4 Cement – slag mixture ...................................................................................94
5.3 Volume stoichiometry...........................................................................................96 5.3.1 Volume Stoichiometry with silicates .............................................................98 5.3.2 Summary of shrinkage (Theoretical) .............................................................99
Table of Contents
xi
5.4 Modelling chemical shrinkage (Theoretical) ......................................................100 5.4.1 Ordinary Portland cement ............................................................................101 5.4.2 Cement – silica fume paste mixtures ...........................................................114 5.4.3 Cement – fly ash paste mixtures ..................................................................120 5.4.4 Cement – slag paste mixtures.......................................................................122
5.5 Effect of water-cement ratio on Chemical shrinkage..........................................124 5.6 Conclusions .........................................................................................................127
CHAPTER 6 - AUTOGENOUS SHRINKAGE IN CEMENTITIOUS PASTE SYSTEMS – RESULTS and DISCUSSION.............................................................129
6.1 Introduction.........................................................................................................129 6.2 Cement paste system...........................................................................................129
6.2.1 Free autogenous deformation (Experimental)..............................................129 6.2.2 Chemical shrinkage and Degree of hydration..............................................136 6.2.3 Free water left in the system ........................................................................143 6.2.4 Relative humidity change.............................................................................156
6.3 Cement – silica fume Paste System ....................................................................162 6.3.1 Chemical shrinkage and Degree of hydration..............................................169 6.3.2 Free Water left in the cement-silica fume system........................................177 6.3.3 Porosity ........................................................................................................179 6.3.4 Ratio of Empty Pores to total Porosity.........................................................181
6.4 Cement – fly ash systems....................................................................................186 6.4.1 Experimental Observation (< 24 hours).......................................................186 6.4.2 Experimental Observation (after 24 hours)..................................................192 6.4.3 Chemical shrinkage......................................................................................195 6.4.4 Degree of hydration .....................................................................................202 6.4.5 Porosity of fly ash paste mixtures ................................................................206 6.4.6 Ratio of Empty Pores to Total Pore Volume ...............................................207 6.4.7 Summary ......................................................................................................210
6.5 Cement – slag systems ........................................................................................212 6.5.1 Experimental observation (<24 hours).........................................................212 6.5.2 Experimental Observation (after 24 hours)..................................................218 6.5.3 Chemical shrinkage......................................................................................221 6.5.4 Hydration kinetics ........................................................................................225 6.5.5 Porosity ........................................................................................................227 6.5.6 Empty Pores to Total Porosity .....................................................................229
6.6 Conclusions .........................................................................................................231 CHAPTER 7 - AUTOGENOUS SHRINKAGE IN CONCRETE – RESULTS and DISCUSSION ..............................................................................................................234
7.1 Introduction.........................................................................................................234 7.2 Plain cement concrete mixtures ..........................................................................234
7.2.1 Free autogenous shrinkage strain .................................................................235 7.2.2 Unsealed shrinkage strains...........................................................................252 7.2.3 Summary ......................................................................................................253
7.3 Cement – silica fume system...............................................................................254 7.3.1 Free autogenous shrinkage strain .................................................................254 7.3.2 Free unsealed shrinkage strain .....................................................................267 7.3.3 Summary ......................................................................................................268
7.4 Cement– fly ash system ......................................................................................269
Table of Contents
xii
7.4.1 Free autogenous shrinkage strain .................................................................270 7.4.2 Free unsealed shrinkage strain .....................................................................277 7.4.3 Summary ......................................................................................................278
7.5 Cement – Slag system .........................................................................................279 7.5.1 Free autogenous shrinkage strain .................................................................279 7.5.2 Free unsealed shrinkage strain .....................................................................286 7.5.3 Summary ......................................................................................................286
CHAPTER 8 - AUTOGENOUS SHRINKAGE - AN OVERVIEW OF CONTROVERSIES ....................................................................................................288
8.1 Introduction.........................................................................................................288 8.2 Early Age deformations (<24 hours) ..................................................................288
8.2.1 Influence of setting time on autogenous shrinkage at early age ..................290 8.2.2 Plastic shrinkage or autogenous shrinkage ..................................................291 8.2.3 Influence of bleeding on early age autogenous shrinkage ...........................293 8.2.4 Summary ......................................................................................................294
8.3 Autogenous deformations (>24 hours)...............................................................294 8.3.1 Relative Humidity ........................................................................................295 8.3.2 Transport Property .......................................................................................297 8.3.3 Internal drying factor....................................................................................299 8.3.4 Aggregate Restraint......................................................................................302 8.3.5 Compressive Strength ..................................................................................302 8.3.6 Autogenous shrinkage Vs Drying shrinkage ...............................................302
8.4 Summary .............................................................................................................303 CHAPTER 9 - CONCLUSIONS AND RECOMMENDATIONS FOR FUTURE STUDY .........................................................................................................................304
9.1 Conclusions .........................................................................................................304 9.1.1 Experimental procedure ...............................................................................304 9.1.2 Numerical simulation using CEMHYD3D ..................................................305 9.1.3 Chemical Shrinkage .....................................................................................305 9.1.4 Autogenous shrinkage in paste samples.......................................................306 9.1.5 Autogenous shrinkage in concrete samples .................................................307 9.1.6 Compressive strength...................................................................................308 9.1.7 Modelling autogenous shrinkage .................................................................309
9.2 Recommendations for future study .....................................................................309 REFERENCES............................................................................................................312 APPENDIX A Chemical shrinkage – Test procedure.......................................328 APPENDIX B Eddy current sensors ..................................................................332 APPENDIX C Autogenous measurement using corrugated tubes ..................338 APPENDIX D Chemical shrinkage – temperature correction.........................344 APPENDIX E Chemical shrinkage (Volume stoichiometry) ...........................348 APPENDIX F Simulations using CEMHYD3D ................................................359 APPENDIX G Mass change in prismatic samples.............................................365
List of Figures
xiii
LIST OF FIGURES
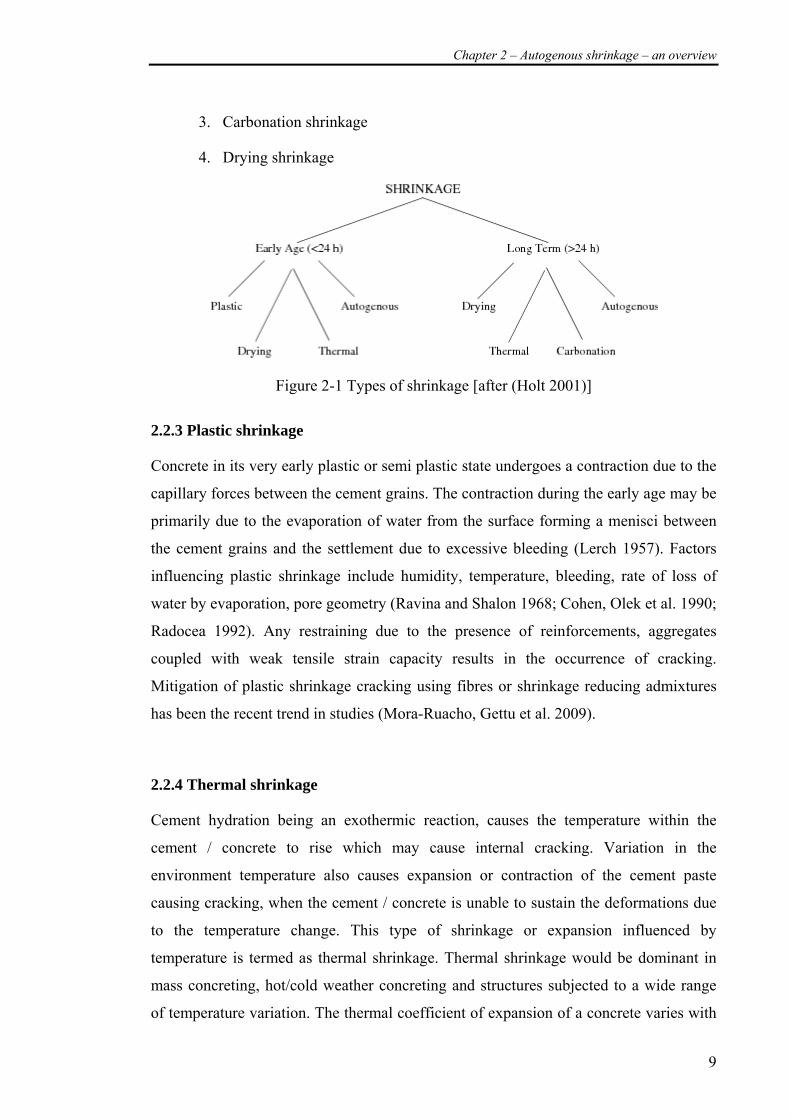
Figure 2-1 Types of shrinkage [after (Holt 2001)]............................................................9
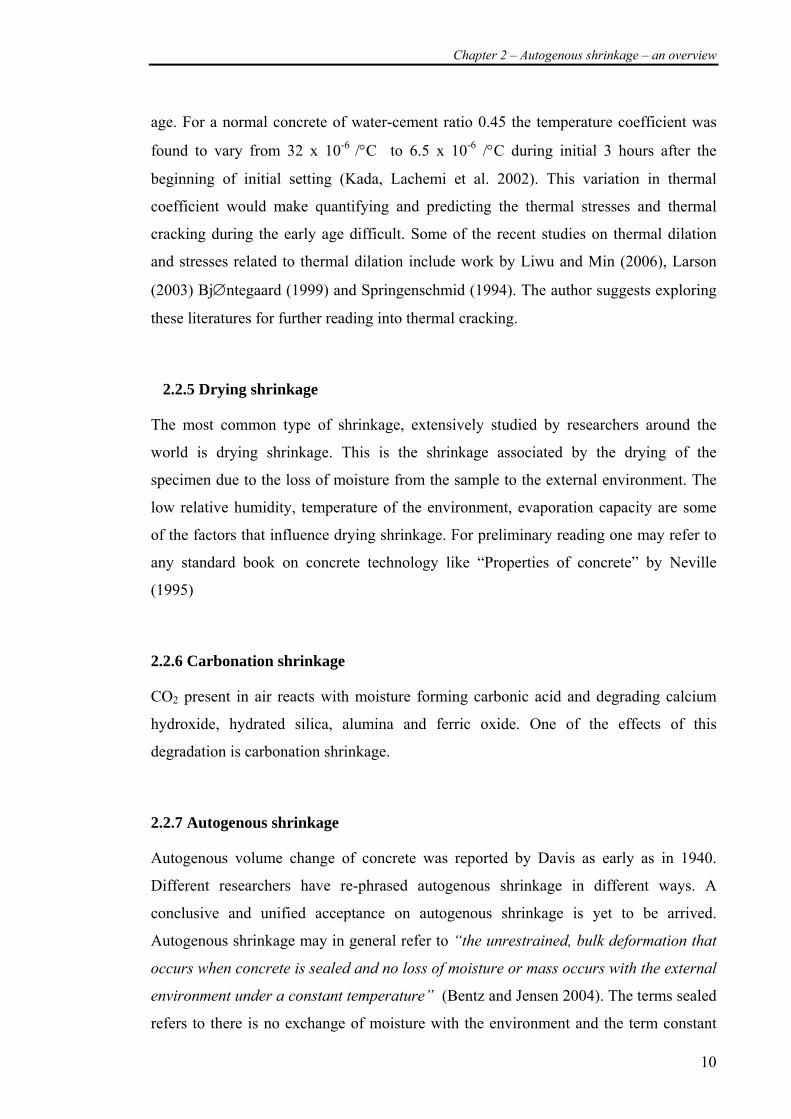
Figure 2-2 Illustration of chemical shrinkage(Tazawa 1999) .........................................14
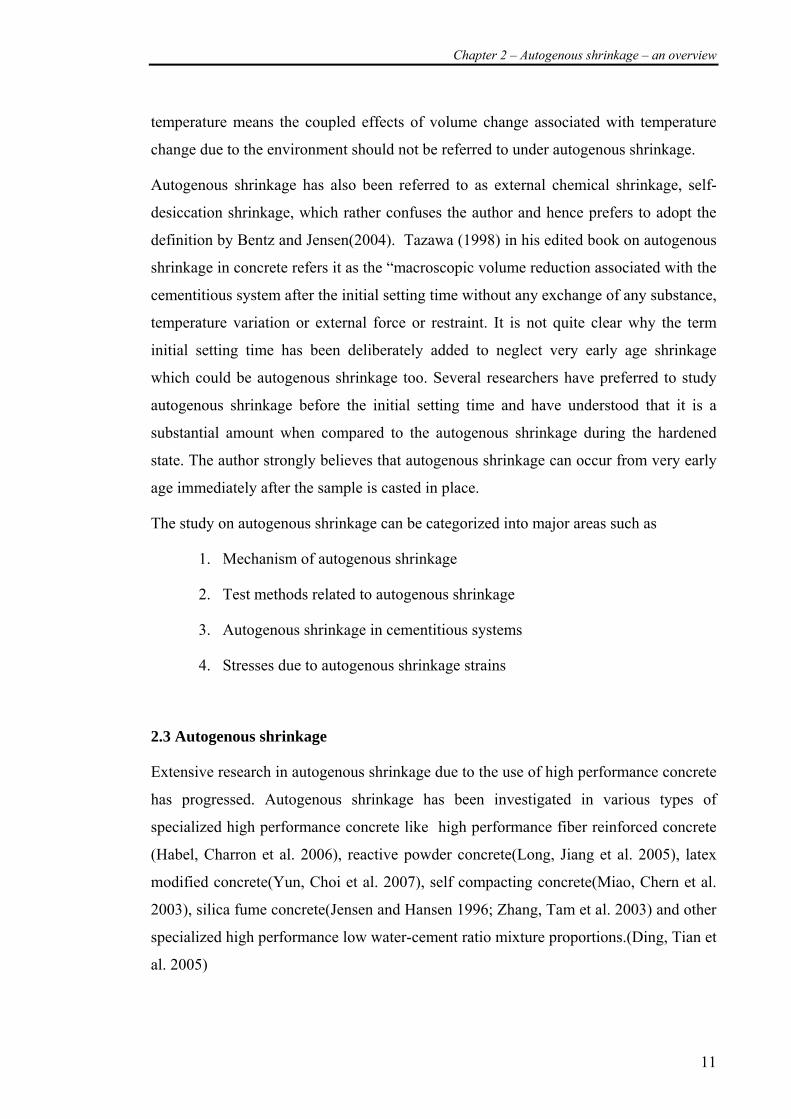
Figure 2-3 Dilatometry method (ASTM-C-1608 2006) .................................................15
Figure 2-4 Density bottle method (ASTM-C-1608 2006) ..............................................15
Figure 2-5 Relationship between Chemical shrinkage and autogenous shrinkage (Tazawa 1998).................................................................................................................23
Figure 2-6 Illustration of Self desiccation shrinkage ......................................................25
Figure 2-7 Relationship between degree of hydration and water –cement ratio when capillary continuity is lost (Powers and Copeland 1959)................................................29
Figure 2-8 Illustration of factors contributing to autogenous shrinkage.........................32
Figure 3-1 Particle size distribution of cementitious material ........................................44
Figure 3-2 Characteristic distribution of cementitious material (Particle size) ..............45
Figure 3-3 Sieve Analysis of Fine aggregate ..................................................................46
Figure 3-4 Illustration of the Chemical shrinkage test setup ..........................................50
Figure 3-5 Paste studies at w/cm 0.32 (Corrugated tubes)..............................................52
Figure 3-6 Eddy Current Sensor Probe ...........................................................................53
Figure 3-7 Frame for measuring autogenous shrinkage after 24 hours (after(Jensen 2005)) ..............................................................................................................................55
Figure 3-8 Vertical comparator for measurement of autogenous shrinkage in paste samples............................................................................................................................57
Figure 3-9 Illustration of Mixture proportions at w/cm of 0.25......................................59
Figure 3-10 Illustration of Mixture proportions at w/cm of 0.32....................................59
Figure 3-11 Vertical Comparator with length gauge for measurement of autogenous shrinkage in concrete.......................................................................................................61
Figure 3-12 Horizontal Comparator with length gauge for measurement of drying shrinkage in concrete.......................................................................................................62
Figure 4-1 Overview of VCCTL which incorporates CEMHYD3D (VCCTL 2009) ....66
Figure 4-2 Back scatter Image of Ordinary Portland Cement (500x magnification)......69
Figure 4-3 XRD Map for different elemental phases of neat cement (500x magnification) .................................................................................................................71
Figure 4-4 Image Segmentation Algorithm (Bentz 1997) ..............................................72
List of Figures
xiv
Figure 4-5 BSE image Vs Reconstructed 2D image from XRD images ........................73
Figure 4-6 Back Scattered Electron image of silica fume...............................................74
Figure 4-7 Back Scattered Image of fly ash particles .....................................................74
Figure 4-8 Back Scattered Electron Image of Slag.........................................................75
Figure 4-9 Work Flow of Numerical Simulation............................................................77
Figure 4-10 Numerical Simulation (Phase I) ..................................................................77
Figure 5-1 Chemical shrinkage of OPC Paste w/c 0.7 (Before temperature correction) 80
Figure 5-2 Chemical shrinkage for OPC w/c 0.7 (After temperature correction) ..........81
Figure 5-3 Chemical shrinkage during initial 48 hours (OPC w/c 0.7) (after temperature correction) .......................................................................................................................81
Figure 5-4 Experimental Data Vs Powers Empirical Model ..........................................82
Figure 5-5 Chemical shrinkage OPC10SF w/c 0.7 (before temperature correction)......84
Figure 5-6 Chemical shrinkage for OPC10SF w/cm = 0.7 (after temperature correction).........................................................................................................................................85
Figure 5-7 Chemical shrinkage in Plain cement mixture Vs OPC-SF mixture ..............87
Figure 5-8 Contribution of chemical shrinkage from silica fume in OPC10SF w/c 0.7.88
Figure 5-9 Chemical shrinkage of OPC30FA (w/cm=0.7) .............................................90
Figure 5-10 Chemical shrinkage of OPC50FA (w/cm 0.7) ............................................91
Figure 5-11 Chemical shrinkage of OPC70FA (w/cm=0.7) ...........................................91
Figure 5-12 Cement with 30% replacement of Slag (w/cm = 0.7) .................................94
Figure 5-13 Cement with 50% replacement of Slag (w/cm = 0.7) .................................95
Figure 5-14 Cement with 70% replacement of Slag (w/cm = 0.7) .................................96
Figure 5-15 Progress of hydration of phases for cement paste w/c 0.7 (Simulation) ...110
Figure 5-16 Value of k computed (in the presence of gypsum)....................................112
Figure 5-17 Chemical shrinkage Vs Degree of hydration of cement paste ..................112
Figure 5-18 Theoritical Calcium hydroxide demand (computed).................................119
Figure 5-19 Maximum degree of hydration (theoretical) of OPC-SF system ..............119
Figure 5-20 Vultimate for different replacements of silica fume (theoretical) .................120
Figure 6-1 Autogenous shrinkage in plain cement mixture w/c 0.25 (OPC25P) .........130
Figure 6-2 Autogenous shrinkage in plain cement mixture w/c 0.32 (OPC32P) .........130
Figure 6-3 Autogenous shrinkage in plain cement mixtures w/c 0.38 (OPC38P) ........131
List of Figures
xv
Figure 6-4 Autogenous shrinkage in corrugated tubes after 24 hours (Plain cement paste) .............................................................................................................................132
Figure 6-5 Autogenous shrinkage in Prismatic samples after 24 hours (Plain Cement Paste) .............................................................................................................................134
Figure 6-6 shrinkage of Plain cement mixtures (Simulated) ........................................137
Figure 6-7 Chemical shrinkage of Plain cement paste (expressed ml/ml of paste volume).......................................................................................................................................137
Figure 6-8 Degree of hydration of Plain cement mixtures (Simulated)........................139
Figure 6-9 Correlation between chemical shrinkage (simulated) and Autogenous shrinkage (corrugated tube - experimental) OPC25P ...................................................141
Figure 6-10 Correlation between chemical shrinkage (simulated) and Autogenous shrinkage (corrugated tube - experimental) OPC32P ...................................................142
Figure 6-11 Correlation between chemical shrinkage (simulated) and Autogenous shrinkage (corrugated tube - experimental) OPC38P ...................................................142
Figure 6-12 Fractional volume of water left (free water) (simulation).........................145
Figure 6-13 Ratio of volume of water consumed to initial water content (denoted here as ‘Rate of Consumption of Initial Water’) (plain cement mixtures)................................146
Figure 6-14 Ratio of water Volume of water left to Initial Volume of water...............147
Figure 6-15 Illustration of Volume of cement and water in various water-cement ratios.......................................................................................................................................148
Figure 6-16 Cement hydrated (absolute volume) of unit volume of cement paste.......152
Figure 6-17 Volume of water consumed per unit volume of cement paste ..................152
Figure 6-18 Fraction of pores connected (Plain cement paste).....................................155
Figure 6-19 Rate of consumption of water from the duration the pores are not connected.......................................................................................................................................156
Figure 6-20 Total Porosity of Plain Cement Paste........................................................158
Figure 6-21 Ratio of Empty Pores to Total Porosity ....................................................158
Figure 6-22 Plot of Autogenous shrinkage (corrugated tubes) Vs ratio of empty pores to total porosity .................................................................................................................159
Figure 6-23 Plot of Autogenous shrinkage (prismatic specimens) Vs ratio of empty pores to total porosity....................................................................................................160
Figure 6-24 Autogenous shrinkage strain in OPC with 10% silica fume (w/cm 0.32).163
Figure 6-25 Autogenous shrinkage in OPC32 and OPC10SF32 mixture (corrugated tubes) .............................................................................................................................163
Figure 6-26 Autogenous shrinkage in OPC32-P and OPC10SF32-P mixture..............164
List of Figures
xvi
Figure 6-27 Setting time and its influence on autogenous strains ................................167
Figure 6-28 Chemical shrinkage for OPC32-P and OPC10SF32-P .............................170
Figure 6-29 Autogenous shrinkage (experimental) vs. Chemical shrinkage (simulation).......................................................................................................................................171
Figure 6-30 Degree of hydration of OPC32-P and OPC10SF32-P ..............................173
Figure 6-31 Degree of hydration of cement and silica fume in OPC32-P and OPC10SF32P ................................................................................................................174
Figure 6-32 Chemical shrinkage zeroing at 24 hours ...................................................176
Figure 6-33 Fractional volume of water left (plain cement mixtures) ..........................178
Figure 6-34 Porosity of OPC10SF-32P and OPC32-P paste mixtures .........................181
Figure 6-35 Ratio of Empty Pores to Total Pores (from time of mixing).....................182
Figure 6-36 Ratio of empty pores to total porosity (simulation) Vs autogenous shrinkage prismatic samples (Experimental).................................................................................182
Figure 6-37 Ratio of empty pores to total porosity (simulation) Vs autogenous shrinkage corrugated samples (Experimental)...............................................................................183
Figure 6-38 Autogenous shrinkage in OPC with 30 % replacement of fly ash ............187
Figure 6-39 Autogenous shrinkage in OPC with 50 % replacement of fly ash ............188
Figure 6-40 Autogenous shrinkage in OPC with 70 % replacement of fly ash ............189
Figure 6-41 Plain Cement fly ash system vs Plain cement system – Autogenous shrinkage strains (<24 hours) ........................................................................................190
Figure 6-42 Autogenous shrinkage strain cement-fly ash paste systems......................193
Figure 6-43 Simulation results for chemical shrinkage of OPC32-P and OPC30FA32-P.......................................................................................................................................197
Figure 6-44 Simulation of chemical shrinkage during the early 24 hours....................197
Figure 6-45 Autogenous shrinkage (experimental) Vs Chemical shrinkage (simulation)*
.......................................................................................................................................200
Figure 6-46 Results of applying the simulation model to reveal the degree of hydration of cement and fly ash in OPC32-P and OPC30FA32-P................................................205
Figure 6-47 Total Porosity ............................................................................................207
Figure 6-48 Ratio of empty pores to total volume of the microstructure......................208
Figure 6-49 Ratio of Empty Pores to Total Porosity ....................................................209
Figure 6-50 Autogenous shrinkage (experimental) vs internal drying factor (simulated).......................................................................................................................................210
Figure 6-51 Autogenous shrinkage in OPC with 30 % replacement of Slag................213
List of Figures
xvii
Figure 6-52 Autogenous shrinkage in OPC with 50 % replacement of Slag................214
Figure 6-53 Autogenous shrinkage in OPC with 70 % replacement of Slag................215
Figure 6-54 Cement-slag system vs Plain cement system – Autogenous shrinkage strains (<24 hours) ........................................................................................................216
Figure 6-55 Autogenous shrinkage strains with various replacements of slag (Corrugated tubes).........................................................................................................219
Figure 6-56 Chemical shrinkage of OPC30SL32-P and OPC32-P...............................222
Figure 6-57 Early 24 hours chemical shrinkage of OPC30SL32-P and OPC32-P.......223
Figure 6-58 Cumulative heat release for OPC32-P and OPC30SL32-P.......................225
Figure 6-59 Degree of hydration in OPC32-P and OPC30SL32-P ..............................227
Figure 6-60 Total Porosity of OPC32-P and OPC30Sl32-P .........................................229
Figure 6-61 Internal drying factor OPC32-P and OPC30SL32-P.................................230
Figure 6-62 Internal drying factor (Simulation) Vs Autogenous shrinkage (Experimental) ..............................................................................................................231
Figure 7-1 Sealed and unsealed shrinkage strains in OPC25........................................236
Figure 7-2 Sealed and unsealed shrinkage in OPC32 ...................................................236
Figure 7-3 Sealed and unsealed shrinkage in OPC38 ...................................................237
Figure 7-4 Comparison of autogenous shrinkage strains in plain cement concrete mixtures.........................................................................................................................238
Figure 7-5 Comparison of drying shrinkage strains in plain cement concrete mixtures.......................................................................................................................................239
Figure 7-6 Autogenous shrinkage strain – up to 28 days for plain cement concrete ....241
Figure 7-7 Hobbs Model - linking paste shrinkage and aggregate volume ..................244
Figure 7-8 Compressive strength for plain cement concrete mixtures .........................247
Figure 7-9 Increase in compressive strength after 1 Day in plain cement concrete .....248
Figure 7-10 Correlation between compressive strength and Autogenous shrinkage strain at 1 Year ........................................................................................................................249
Figure 7-11 Sealed and unsealed shrinkage of OPC10SF25 ........................................254
Figure 7-12 Sealed and unsealed shrinkage of OPC10SF32 ........................................255
Figure 7-13 Sealed and unsealed shrinkage of OPC20SF32 ........................................255
Figure 7-14 Comparison of autogenous shrinkage strains of cement-silica fume systems.......................................................................................................................................256
Figure 7-15 Comparison of drying shrinkage strains of cement-silica fume systems ..257

List of Figures
xviii
Figure 7-16 Compressive strength in cement-silica fume system ................................262
Figure 7-17 Correlation of autogenous shrinkage strain at 1 year and compressive strength at 1 year ...........................................................................................................264
Figure 7-18 Self desiccation through pores (Bentz and Jensen 2004) ..........................267
Figure 7-19 Sealed and unsealed shrinkage strains in OPC30FA25 ............................270
Figure 7-20 Sealed and unsealed shrinkage strains in OPC30FA32 ............................270
Figure 7-21 Sealed and unsealed shrinkage strains in OPC50FA32 ............................271
Figure 7-22 Sealed and unsealed shrinkage strains in OPC70FA32 ............................271
Figure 7-23 Summary of autogenous shrinkage strains in cement-fly ash mixtures ....272
Figure 7-24 Effect of fly ash replacement on autogenous shrinkage............................274
Figure 7-25 Compressive strength of cement-fly ash concrete mixtures......................277
Figure 7-26 Correlation of autogenous shrinkage strain at 1 year and compressive strength at 1 year for cement – fly ash concrete mixtures.............................................277
Figure 7-27 Sealed and unsealed shrinkage strains in OPC30SL25.............................280
Figure 7-28 Sealed and unsealed shrinkage strains in OPC30SL32.............................280
Figure 7-29 Sealed and unsealed shrinkage strains in OPC50SL32.............................281
Figure 7-30 Sealed and unsealed shrinkage strains in OPC70SL32.............................281
Figure 7-31 Summary of autogenous shrinkage strains in cement-slag mixtures ........282
Figure 7-32 Compressive strength of cement-slag concrete mixtures ..........................285
Figure 7-33 Correlation of autogenous shrinkage strain at 1 year and compressive strength at 1 year for all cementitious mixtures ............................................................286
Figure 8-1 RH Change Vs Radius of meniscus in the largest water filled pore ...........298
List of Tables
xix
LIST OF TABLES
Table 2-1 Powers empirical coefficients for chemical shrinkage ...................................18
Table 2-2 Coefficients of ‘a’ and ‘b’(Tazawa and Miyazawa 1999) ..............................38
Table 3-1 Chemical composition of cementitious materials...........................................43
Table 3-2 Potential Bogue Composition.........................................................................46
Table 3-3 Nomenclature of chemical shrinkage test samples.........................................49
Table 3-4 Nomenclature of cementitious paste systems .................................................52
Table 3-5 Water loss from the corrugated tubes .............................................................54
Table 3-6: Brief details of mixture proportions ..............................................................58
Table 4-1 Number of particles of cement of different diameter for OPC w/c 0.7 ..........68
Table 4-2 Image Analysis for Ordinary Portland Cement ..............................................73
Table 4-3 Phase Composition of fly ash particles...........................................................75
Table 5-1 Molar Volume and specific gravity (Bentz 2007; Chen and Brouwers 2007)97
Table 5-2 Summary of chemical shrinkage (Theoretical)...............................................99
Table 5-3 Values of “k” for each major phase..............................................................102
Table 5-4 Phase composition from Image analysis of XRD Maps...............................105
Table 5-5 Degree of hydration (α) of paste hydration at ambient temperature(expressed as %) (Odler 2001) .......................................................................................................108
Table 5-6 Computed value of ‘k’ for values of α from Table 5-5 ................................108
Table 5-7 Degree of hydration of each phase for plain cement paste w/c 0.7 (simulation).......................................................................................................................................111
Table 5-8 Calculation for amount of C3A and C4AF reacting with gypsum ................113
Table 5-9 Phase composition for a OPC with 10% replacement of SF ........................116
Table 6-1 Volume of water and cement in Paste ..........................................................148
Table 6-2 Actual cement hydrated and water consumed at 7 days ...............................150
Table 6-3 Actual cement hydrated and water consumed at 28 days .............................150
Table 6-4 Actual cement hydrated and water consumed at 60 days .............................151
Table 6-5 Actual cement hydrated and water consumed at 90 days .............................151
Table 6-6 Consumption of water by each phase (from Stoichiometry) ........................179
Table 7-1 Plain cement concrete mixtures ....................................................................235

List of Tables
xx
Table 7-2 Aggregate Volume proportions in plain concrete mixtures..........................243
Table 7-3 Cement – Silica fume concrete mixtures ......................................................254
Table 7-4 Nomenclature for cement-fly ash cementitious system................................269
Table 7-5 Nomenclature for cement-slag ash cementitious system..............................279
Notations and Acronyms
xxi
NOTATIONS and ACRONYMS
Notations
V = volume or chemical shrinkage
Vt = chemical shrinkage at time ‘t’ ml/gm
Vult = ultimate value of chemical shrinkage ml/gm
α = degree of hydration
k = proportionality constant
r = radius of largest water-filled pore
R = Ideal gas constant
T = absolute temperature in Kelvin
γ = Surface tension of the pre solution (N/m)
Vm = molar volume (m3/mol)
σcap = capillary tension in pore fluid
S = saturation factor
K = bulk modulus of pore fluid
Ks = bulk modulus of solid
Ka = bulk modulus of aggregate
ε = strains
t = time
t0 = time at point of set or time at “zero point”
εc, Sc = strain in concrete
εp, Sp = strain paste
wn = non-evaporable water content
kc3a = theoretical value of chemical shrinkage for c3a hydration
k*c3a = theoretical value of chemical shrinkage for c3a hydration in presence of
gypsum
Notations and Acronyms
xxii
[C3S] = mass fraction of C3S in whole cement
The square bracket is used to refer to the mass fraction.
Acronyms
CEMHYD3D Cement hydration model (3D) developed by NIST, USA
VCCTL Virtual cement and concrete testing laboratory
BSE Back scattered electron microscope
XRD X-ray diffraction
SEM Scanning Electron microscope
PSD Particle size distribution
idf Internal drying factor
OPC Ordinary Portland Cement
FA Fly ash
SF Silica fume
SL Slag
ASG Alumina silica glass
CH Calcium hydroxide
C CaO
A Al2O3
S SiO2
F Fe2O3
C3S 3CaO.SiO2
C2S 2CaO.SiO2
C3A 3CaO.Al2O3
C4AF 4CaO.Al3O3.Fe2O3
H H2O
AFm 124 HSAC (monosulfate)
AFt 326 HSAC (Ettringite)
CSH Calcium silicate hydrate
SC Calcium sulphate
C3AH6 hydrogarnet phase
Notations and Acronyms
xxiii
Mix Design Designation
OPC30FA32-P Paste sample of plain cement paste with water-cement ratio 0.32
P represents Paste mixture
OPC represents ordinary portland cement
30 represent replacement percentage by weight of cement
FA represents fly ash which is added as replacement
32 represents the water-cementitious ratio
Similarly,
OPC30FA32 Concrete mixtures with 30 % replacement of fly ash and water-
cementitious ratio 0.32
Chapter 1 – Introduction
1
CHAPTER 1 -INTRODUCTION
1.1 Introduction
Infrastructure developments around the world have led to new trends in concrete
technology that often required the combination of high strength and better performance
under adverse environmental conditions. There is also a growing need to build
sustainable structures while still complying with these requirements. The change or shift
towards high performance and very high strength concretes in early 80’s was one of the
major milestones in concrete technology, fulfilling the needs of the growth of the
infrastructure industry. But seldom was enough attention given to the fact that with the
new requirements and the advance in cement manufacture, newer problems emerged.
Concrete undergoes several types of contraction, generally referred to as shrinkage.
Shrinkage occurs at various stages of the concrete hydration. Achieving high strength
and high performance structures while still creating sustainable construction is a big
challenge to concrete technologists. The progress towards higher strengths with lower
water-cementitious ratio mixtures have resulted in making the problem of autogenous
shrinkage much more important than it was in lower strength concrete. The addition of
supplementary cementitious materials has only created further necessity to better
understand the phenomenon so as to accomplish sustainable high performance and high
strength materials.
Although autogenous shrinkage was noted and reported much earlier by Davis (1940),
in low and medium strength concretes it was considered insignificant when compared
to drying shrinkage or other forms of shrinkage. But with the development of higher
concrete grades, changes to cement characteristics and the addition of supplementary
cementitious materials this was no longer the case. Autogenous shrinkage gained
importance among researchers who are concerned on combining the progress towards
high strength and high performance together with achieving sustainable concrete
structures.
Chapter 1 – Introduction
2
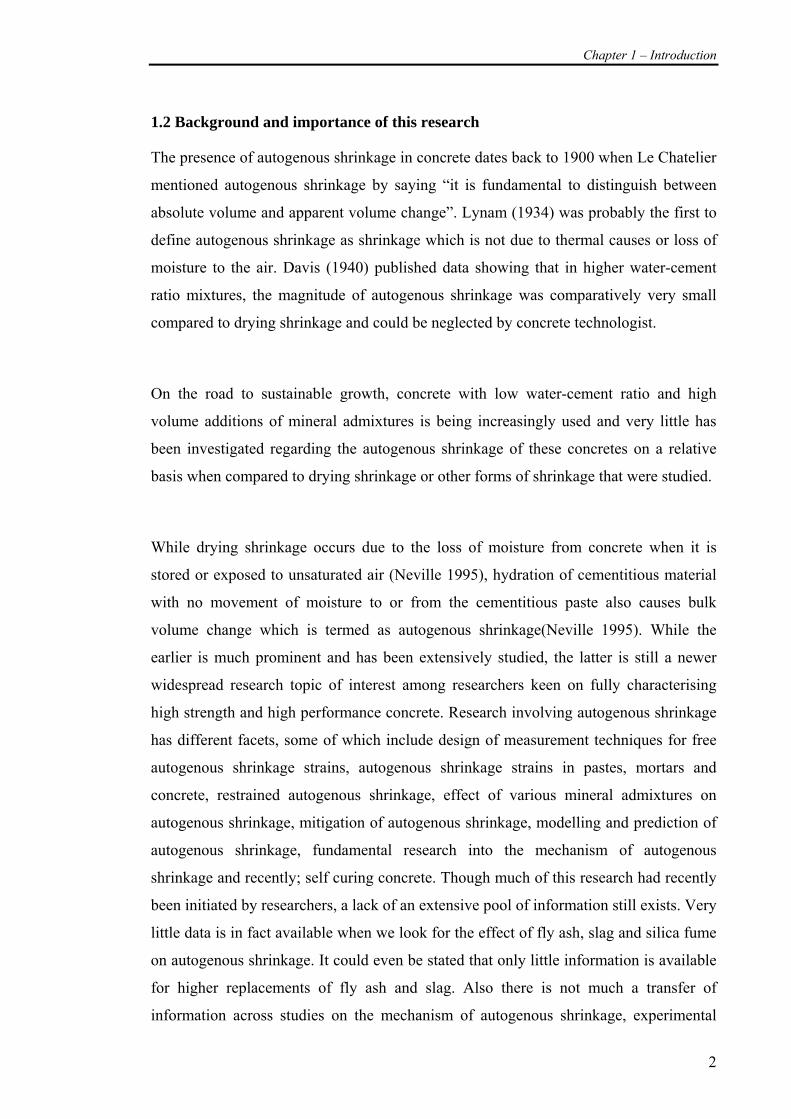
1.2 Background and importance of this research
The presence of autogenous shrinkage in concrete dates back to 1900 when Le Chatelier
mentioned autogenous shrinkage by saying “it is fundamental to distinguish between
absolute volume and apparent volume change”. Lynam (1934) was probably the first to
define autogenous shrinkage as shrinkage which is not due to thermal causes or loss of
moisture to the air. Davis (1940) published data showing that in higher water-cement
ratio mixtures, the magnitude of autogenous shrinkage was comparatively very small
compared to drying shrinkage and could be neglected by concrete technologist.
On the road to sustainable growth, concrete with low water-cement ratio and high
volume additions of mineral admixtures is being increasingly used and very little has
been investigated regarding the autogenous shrinkage of these concretes on a relative
basis when compared to drying shrinkage or other forms of shrinkage that were studied.
While drying shrinkage occurs due to the loss of moisture from concrete when it is
stored or exposed to unsaturated air (Neville 1995), hydration of cementitious material
with no movement of moisture to or from the cementitious paste also causes bulk
volume change which is termed as autogenous shrinkage(Neville 1995). While the
earlier is much prominent and has been extensively studied, the latter is still a newer
widespread research topic of interest among researchers keen on fully characterising
high strength and high performance concrete. Research involving autogenous shrinkage
has different facets, some of which include design of measurement techniques for free
autogenous shrinkage strains, autogenous shrinkage strains in pastes, mortars and
concrete, restrained autogenous shrinkage, effect of various mineral admixtures on
autogenous shrinkage, mitigation of autogenous shrinkage, modelling and prediction of
autogenous shrinkage, fundamental research into the mechanism of autogenous
shrinkage and recently; self curing concrete. Though much of this research had recently
been initiated by researchers, a lack of an extensive pool of information still exists. Very
little data is in fact available when we look for the effect of fly ash, slag and silica fume
on autogenous shrinkage. It could even be stated that only little information is available
for higher replacements of fly ash and slag. Also there is not much a transfer of
information across studies on the mechanism of autogenous shrinkage, experimental
Chapter 1 – Introduction
3
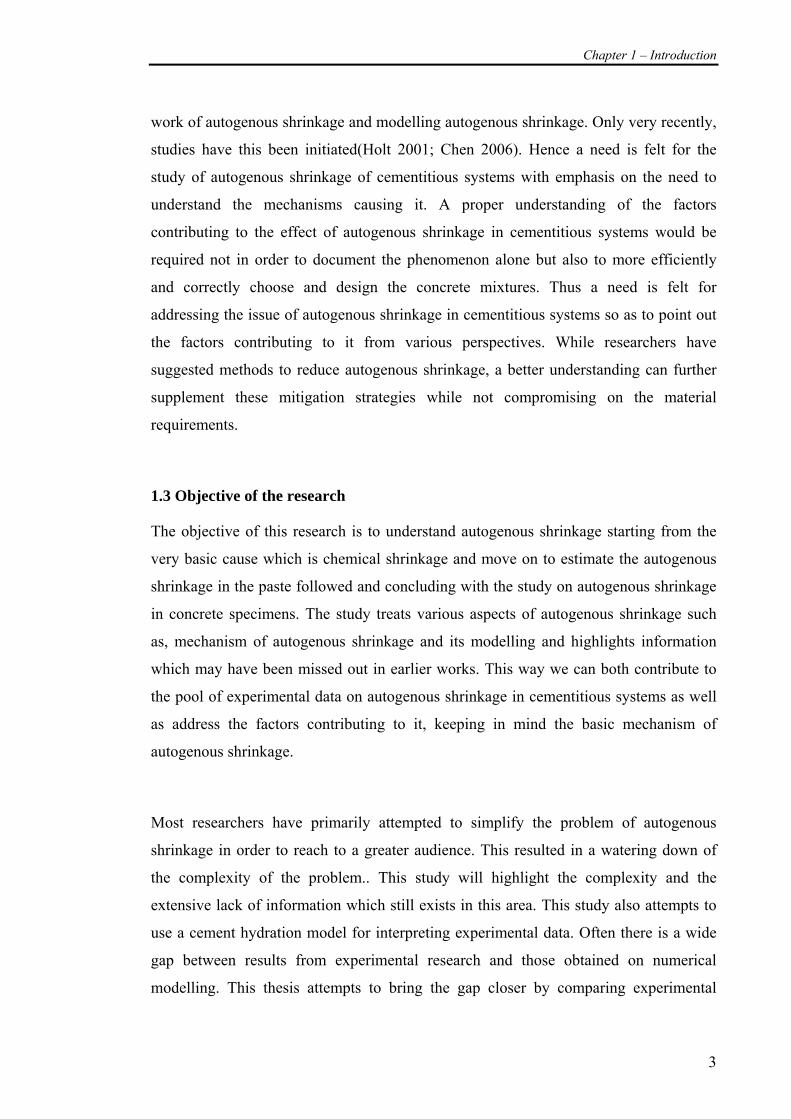
work of autogenous shrinkage and modelling autogenous shrinkage. Only very recently,
studies have this been initiated(Holt 2001; Chen 2006). Hence a need is felt for the
study of autogenous shrinkage of cementitious systems with emphasis on the need to
understand the mechanisms causing it. A proper understanding of the factors
contributing to the effect of autogenous shrinkage in cementitious systems would be
required not in order to document the phenomenon alone but also to more efficiently
and correctly choose and design the concrete mixtures. Thus a need is felt for
addressing the issue of autogenous shrinkage in cementitious systems so as to point out
the factors contributing to it from various perspectives. While researchers have
suggested methods to reduce autogenous shrinkage, a better understanding can further
supplement these mitigation strategies while not compromising on the material
requirements.
1.3 Objective of the research
The objective of this research is to understand autogenous shrinkage starting from the
very basic cause which is chemical shrinkage and move on to estimate the autogenous
shrinkage in the paste followed and concluding with the study on autogenous shrinkage
in concrete specimens. The study treats various aspects of autogenous shrinkage such
as, mechanism of autogenous shrinkage and its modelling and highlights information
which may have been missed out in earlier works. This way we can both contribute to
the pool of experimental data on autogenous shrinkage in cementitious systems as well
as address the factors contributing to it, keeping in mind the basic mechanism of
autogenous shrinkage.
Most researchers have primarily attempted to simplify the problem of autogenous
shrinkage in order to reach to a greater audience. This resulted in a watering down of
the complexity of the problem.. This study will highlight the complexity and the
extensive lack of information which still exists in this area. This study also attempts to
use a cement hydration model for interpreting experimental data. Often there is a wide
gap between results from experimental research and those obtained on numerical
modelling. This thesis attempts to bring the gap closer by comparing experimental
Chapter 1 – Introduction
4
results with well established numerical model and hence suggesting modifications that
may be appropriately applied.
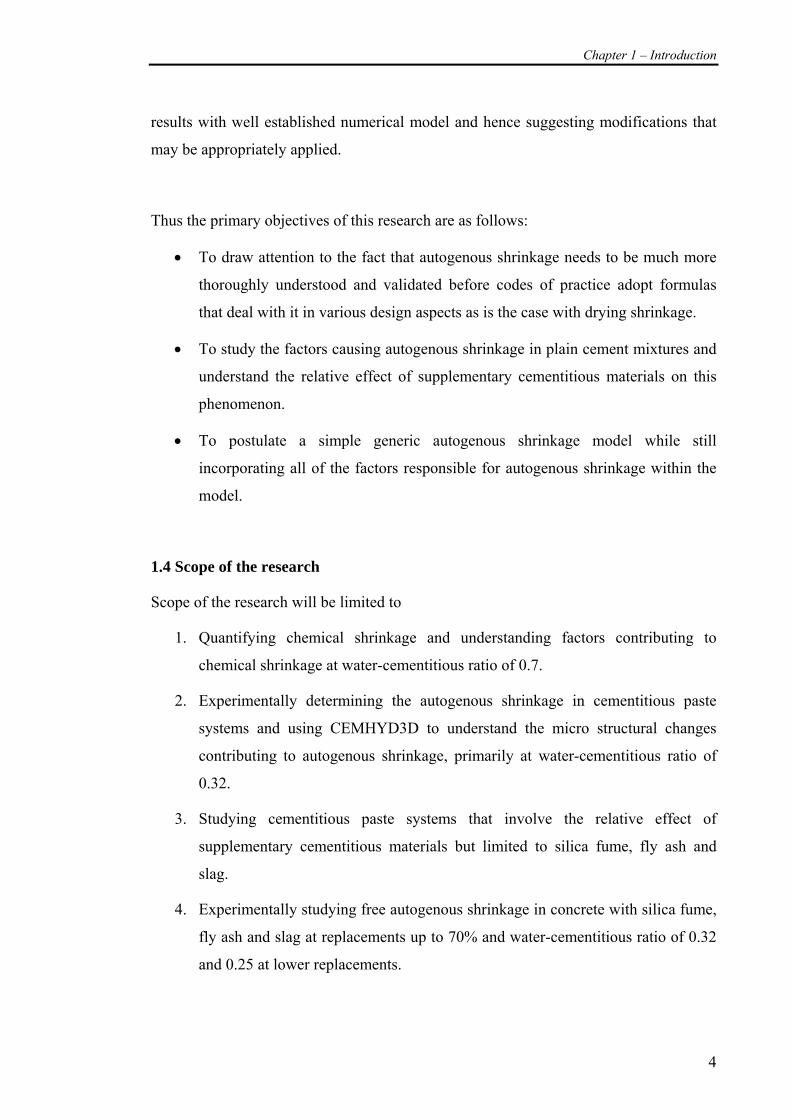
Thus the primary objectives of this research are as follows:
• To draw attention to the fact that autogenous shrinkage needs to be much more
thoroughly understood and validated before codes of practice adopt formulas
that deal with it in various design aspects as is the case with drying shrinkage.
• To study the factors causing autogenous shrinkage in plain cement mixtures and
understand the relative effect of supplementary cementitious materials on this
phenomenon.
• To postulate a simple generic autogenous shrinkage model while still
incorporating all of the factors responsible for autogenous shrinkage within the
model.
1.4 Scope of the research
Scope of the research will be limited to
1. Quantifying chemical shrinkage and understanding factors contributing to
chemical shrinkage at water-cementitious ratio of 0.7.
2. Experimentally determining the autogenous shrinkage in cementitious paste
systems and using CEMHYD3D to understand the micro structural changes
contributing to autogenous shrinkage, primarily at water-cementitious ratio of
0.32.
3. Studying cementitious paste systems that involve the relative effect of
supplementary cementitious materials but limited to silica fume, fly ash and
slag.
4. Experimentally studying free autogenous shrinkage in concrete with silica fume,
fly ash and slag at replacements up to 70% and water-cementitious ratio of 0.32
and 0.25 at lower replacements.
Chapter 1 – Introduction
5
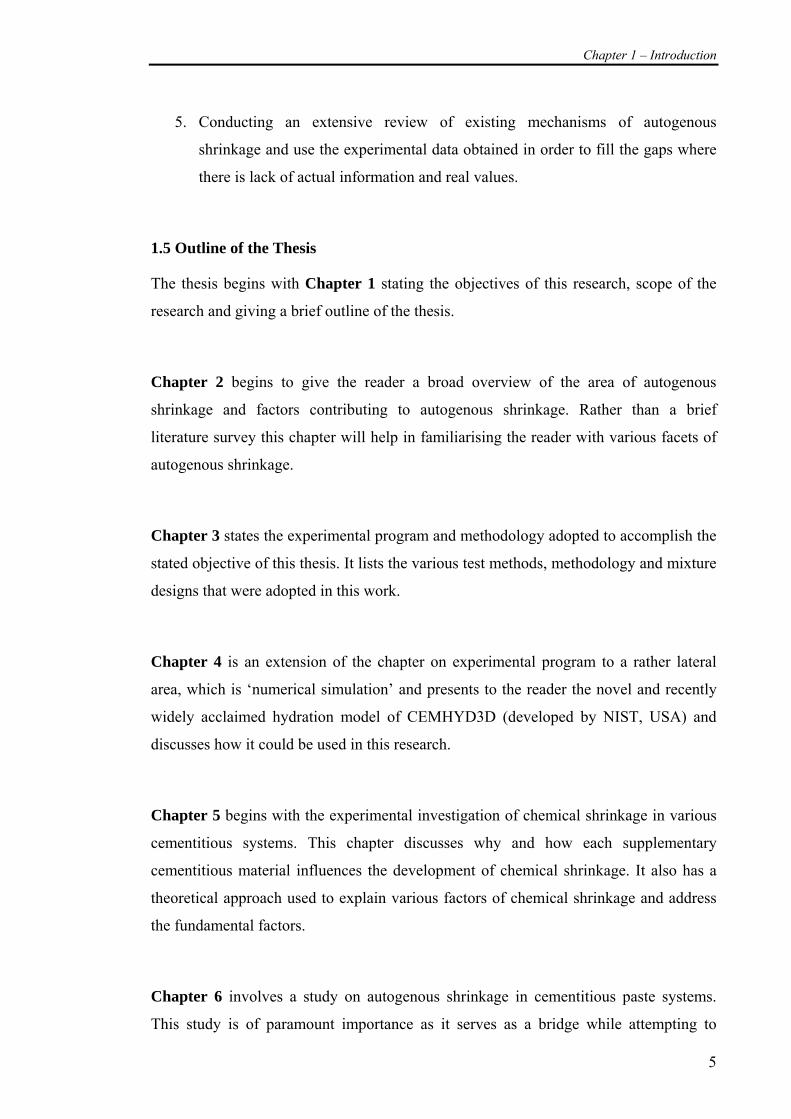
5. Conducting an extensive review of existing mechanisms of autogenous
shrinkage and use the experimental data obtained in order to fill the gaps where
there is lack of actual information and real values.
1.5 Outline of the Thesis
The thesis begins with Chapter 1 stating the objectives of this research, scope of the
research and giving a brief outline of the thesis.
Chapter 2 begins to give the reader a broad overview of the area of autogenous
shrinkage and factors contributing to autogenous shrinkage. Rather than a brief
literature survey this chapter will help in familiarising the reader with various facets of
autogenous shrinkage.
Chapter 3 states the experimental program and methodology adopted to accomplish the
stated objective of this thesis. It lists the various test methods, methodology and mixture
designs that were adopted in this work.
Chapter 4 is an extension of the chapter on experimental program to a rather lateral
area, which is ‘numerical simulation’ and presents to the reader the novel and recently
widely acclaimed hydration model of CEMHYD3D (developed by NIST, USA) and
discusses how it could be used in this research.
Chapter 5 begins with the experimental investigation of chemical shrinkage in various
cementitious systems. This chapter discusses why and how each supplementary
cementitious material influences the development of chemical shrinkage. It also has a
theoretical approach used to explain various factors of chemical shrinkage and address
the fundamental factors.
Chapter 6 involves a study on autogenous shrinkage in cementitious paste systems.
This study is of paramount importance as it serves as a bridge while attempting to
Chapter 1 – Introduction
6
explain results on autogenous shrinkage in concrete. Basic matrix and micro structural
properties contributing to autogenous shrinkage can be pinpointed before a rather
heterogeneous and a complex material ‘concrete’ is studied.
Chapter 7 involves the study of autogenous shrinkage on concrete with the addition of
supplementary cementitious materials. The mechanical properties and paste properties
of the relevant cementitious systems are used to interpret and understand the behaviour
of autogenous shrinkage in concrete specimens.
Chapter 8 serves as a summary chapter which reveals the actual complexity in this
study. What started as an overview of autogenous shrinkage in cementitious systems in
Chapter 2 has progressed to a rather more complex ‘heterogeneous matrix’
characteristics for concrete. Various sources in the literature are hence back cited in a
critique dealing with the theories and the generalization adopted by other researchers.
This chapter serves to highlight and present to the reader the complexity of the
phenomenon while bringing out issues and suggested answers to some of the problems.
Chapter 9 summarises the conclusions from this study and explains in simple terms the
effect of various admixtures added to cementitious materials. It serves as a direct answer
to the objectives outlined in Chapter 1 and concludes by bringing to the attention of the
research community the importance of collaborative research in this area so as a more
comprehensive research data is available and highlights various aspects of autogenous
shrinkage which requires detailed future investigations.
Chapter 2 – Autogenous shrinkage – an overview
7
CHAPTER 2 -AUTOGENOUS SHRINKAGE – AN OVERVIEW
2.1 Introduction
As the title suggests, this chapter will serve as an overview of the existing research in
the field of autogenous shrinkage. This chapter would not intend to be a full
comprehensive review of the literature on autogenous shrinkage, instead would bring
out the important findings in the state of art research happening in the area of
autogenous shrinkage which would make the reader aware before understanding the
complexity of this type of shrinkage.
Shrinkage has been the interest of study among researchers owing to its relative effect
on micro and macro cracking resulting in non-structural damage to concrete structures.
Shrinkage and shrinkage related stresses have been studied over several decades
alongside with the progress of cement and concrete technology. Even though extensive
research is constantly carried out by various researchers around the world, a complete
understanding of the phenomenon has not been achieved yet (Kovler and Zhutovsky
2006).
Autogenous shrinkage has been reported as one of the factors contributing to shrinkage
cracks in high performance or low water-cement ratio mixtures (Bentz and Jensen
2004). Cracking by itself is a very complex phenomenon which may be the mechanical
response to restrained shrinkage i.e., response of matrix to internal or external restraint,
creep relaxation, rate of shrinkage, material property (Weiss 1999) and is influenced by
several factors which may be physical, chemical, thermal, or mechanical each of which
contribute to a different types of shrinkage.
Autogenous shrinkage is a combination of a chemical, physical and thermodynamic
process (Powers 1935; Jensen 1995; Tazawa 1998), making the phenomenon rather
more complex than it may appear.
Chapter 2 – Autogenous shrinkage – an overview
8
2.2 Types of shrinkage
Concrete is susceptible to early age cracking both in its plastic, semi plastic and
hardened stages. The cracking may occur mainly due to the shrinkage of concrete at
various stages of hydration or strength development of concrete. Shrinkage is hence
broadly classified into
• Early age shrinkage
• Long term shrinkage
Another type of study of shrinkage classifies shrinkage broadly into restrained
shrinkage and unrestrained shrinkage studies. In this study the primary focus is on
unrestrained shrinkage or free shrinkage.
2.2.1 Early age shrinkage
“The exact definition of ‘early age’ depends on the context and time frame of the
measurements” (Holt 2001). Mostly early age shrinkage refers to durations up to 24
hours or when the cementitious matrix has rather not achieved sufficient strength.
During the early age there are several factors that can contribute to the shrinkage of the
cementitious system and various types of early age shrinkage are
1. Plastic shrinkage
2. Thermal shrinkage
3. Autogenous shrinkage
4. Drying shrinkage
2.2.2 Long term shrinkage
Long term shrinkage would generally involve shrinkage in concrete > 24 hours and
mostly after the cementitious system has gained sufficient strength. The various types of
long term shrinkage would be
1. Thermal shrinkage
2. Autogenous shrinkage
Chapter 2 – Autogenous shrinkage – an overview
9
3. Carbonation shrinkage
4. Drying shrinkage
Figure 2-1 Types of shrinkage [after (Holt 2001)]
2.2.3 Plastic shrinkage
Concrete in its very early plastic or semi plastic state undergoes a contraction due to the
capillary forces between the cement grains. The contraction during the early age may be
primarily due to the evaporation of water from the surface forming a menisci between
the cement grains and the settlement due to excessive bleeding (Lerch 1957). Factors
influencing plastic shrinkage include humidity, temperature, bleeding, rate of loss of
water by evaporation, pore geometry (Ravina and Shalon 1968; Cohen, Olek et al. 1990;
Radocea 1992). Any restraining due to the presence of reinforcements, aggregates
coupled with weak tensile strain capacity results in the occurrence of cracking.
Mitigation of plastic shrinkage cracking using fibres or shrinkage reducing admixtures
has been the recent trend in studies (Mora-Ruacho, Gettu et al. 2009).
2.2.4 Thermal shrinkage
Cement hydration being an exothermic reaction, causes the temperature within the
cement / concrete to rise which may cause internal cracking. Variation in the
environment temperature also causes expansion or contraction of the cement paste
causing cracking, when the cement / concrete is unable to sustain the deformations due
to the temperature change. This type of shrinkage or expansion influenced by
temperature is termed as thermal shrinkage. Thermal shrinkage would be dominant in
mass concreting, hot/cold weather concreting and structures subjected to a wide range
of temperature variation. The thermal coefficient of expansion of a concrete varies with
Chapter 2 – Autogenous shrinkage – an overview
10
age. For a normal concrete of water-cement ratio 0.45 the temperature coefficient was
found to vary from 32 x 10-6 /°C to 6.5 x 10⁻⁶ /°C during initial 3 hours after the
beginning of initial setting (Kada, Lachemi et al. 2002). This variation in thermal
coefficient would make quantifying and predicting the thermal stresses and thermal
cracking during the early age difficult. Some of the recent studies on thermal dilation
and stresses related to thermal dilation include work by Liwu and Min (2006), Larson
(2003) Bj∅ntegaard (1999) and Springenschmid (1994). The author suggests exploring
these literatures for further reading into thermal cracking.
2.2.5 Drying shrinkage
The most common type of shrinkage, extensively studied by researchers around the
world is drying shrinkage. This is the shrinkage associated by the drying of the
specimen due to the loss of moisture from the sample to the external environment. The
low relative humidity, temperature of the environment, evaporation capacity are some
of the factors that influence drying shrinkage. For preliminary reading one may refer to
any standard book on concrete technology like “Properties of concrete” by Neville
(1995)
2.2.6 Carbonation shrinkage
CO2 present in air reacts with moisture forming carbonic acid and degrading calcium
hydroxide, hydrated silica, alumina and ferric oxide. One of the effects of this
degradation is carbonation shrinkage.
2.2.7 Autogenous shrinkage
Autogenous volume change of concrete was reported by Davis as early as in 1940.
Different researchers have re-phrased autogenous shrinkage in different ways. A
conclusive and unified acceptance on autogenous shrinkage is yet to be arrived.
Autogenous shrinkage may in general refer to “the unrestrained, bulk deformation that
occurs when concrete is sealed and no loss of moisture or mass occurs with the external
environment under a constant temperature” (Bentz and Jensen 2004). The terms sealed
refers to there is no exchange of moisture with the environment and the term constant
Chapter 2 – Autogenous shrinkage – an overview
11
temperature means the coupled effects of volume change associated with temperature
change due to the environment should not be referred to under autogenous shrinkage.
Autogenous shrinkage has also been referred to as external chemical shrinkage, self-
desiccation shrinkage, which rather confuses the author and hence prefers to adopt the
definition by Bentz and Jensen(2004). Tazawa (1998) in his edited book on autogenous
shrinkage in concrete refers it as the “macroscopic volume reduction associated with the
cementitious system after the initial setting time without any exchange of any substance,
temperature variation or external force or restraint. It is not quite clear why the term
initial setting time has been deliberately added to neglect very early age shrinkage
which could be autogenous shrinkage too. Several researchers have preferred to study
autogenous shrinkage before the initial setting time and have understood that it is a
substantial amount when compared to the autogenous shrinkage during the hardened
state. The author strongly believes that autogenous shrinkage can occur from very early
age immediately after the sample is casted in place.
The study on autogenous shrinkage can be categorized into major areas such as
1. Mechanism of autogenous shrinkage
2. Test methods related to autogenous shrinkage
3. Autogenous shrinkage in cementitious systems
4. Stresses due to autogenous shrinkage strains
2.3 Autogenous shrinkage
Extensive research in autogenous shrinkage due to the use of high performance concrete
has progressed. Autogenous shrinkage has been investigated in various types of
specialized high performance concrete like high performance fiber reinforced concrete
(Habel, Charron et al. 2006), reactive powder concrete(Long, Jiang et al. 2005), latex
modified concrete(Yun, Choi et al. 2007), self compacting concrete(Miao, Chern et al.
2003), silica fume concrete(Jensen and Hansen 1996; Zhang, Tam et al. 2003) and other
specialized high performance low water-cement ratio mixture proportions.(Ding, Tian et
al. 2005)

Chapter 2 – Autogenous shrinkage – an overview
12
2.3.1 Definition of autogenous shrinkage in literature
Across the literature the words autogenous shrinkage and self-desiccation shrinkage
have been used widely (Jensen and Hansen 2001). There is a necessity to differentiate
clearly what each of the words refers to.
Autogenous shrinkage refers to shrinkage without the exchange of moisture with the
environment, while self-desiccation shrinkage is one of the types of autogenous
shrinkage commonly referred to by researchers and the primary cause of autogenous
shrinkage. Self desiccation is the drop or change in relative humidity within the closed
cementitious system or termed as internal drying without any exchange of moisture with
the external environment. This results in shrinkage and is termed as self-desiccation
shrinkage.
2.4 Basic mechanism of autogenous shrinkage
The basic mechanism of autogenous shrinkage has been explained in simpler terms at
the JCI book on autogenous shrinkage.
When cementitious material comes in contact with water, they react to form newer
products of hydration. These newer products of hydration are porous. Various pore sizes
are formed. The formation of fine pores in the microstructure of hardened concrete
coupled with the consumption of water by the hydration of the cementitious material are
the causes of autogenous shrinkage. To understand the mechanism of autogenous
shrinkage one should understand what the various factors causing autogenous shrinkage
are
• Chemical shrinkage
• Microstructure of the hardened cementitious paste
• Self Desiccation or Relative humidity change
Chemical shrinkage – when cement or other mineral admixtures are involved in the
process of hydration, the resultant absolute volume of the solids is less than the actual

Chapter 2 – Autogenous shrinkage – an overview
13
initial volume of the reactants. This progress in development/increase of chemical
shrinkage is a continuous phenomenon associated with the hydration mechanism.
Microstructure - The development of the skeleton of the hardened cementitious paste
which includes the setting of the cementitious paste system and formation of a solid
hydrated matrix, the development of porosity and pore size distribution, mechanical
strength influence autogenous shrinkage development.
Self Desiccation – The initial water present in the cementitious system decreases with
the progress of hydration as it is consumed by the reactants. The reduction of free water
present in the system causes an internal drying also termed as self-desiccation. This
internal drying is synonymous to the drop in relative humidity within the closed
hydrating system. This drop in humidity results in stresses being generated at the
meniscus of the water formed within the capillary pores, resulting in shrinkage.
The above three phenomenon / properties all in conjunction with one another, together
contribute to self desiccation shrinkage or autogenous shrinkage. They are discussed
further in the subsequent sections.
2.5 Chemical shrinkage
Chemical shrinkage is a volume balance at a microscopic scale while it causes
autogenous shrinkage at a macroscopic scale (Barcelo 2002). It is reported in literature
as one of the driving factors contributing to self-desiccation. Hence understanding the
development of chemical shrinkage would explain the self-desiccation in a closed
system. Other names to by which chemical shrinkage has been referenced in literature
include total chemical shrinkage, water absorption, volume contraction, Le Chatelier
shrinkage (Boivin, Acker et al. 1999).
Chapter 2 – Autogenous shrinkage – an overview
14
Figure 2-2 Illustration of chemical shrinkage(Tazawa 1999)
2.5.1 Measurement of chemical shrinkage
The determination of chemical shrinkage is the foremost step in the study of chemical
shrinkage. Several authors have attempted to develop various test methods for chemical
shrinkage. Over the years of research, two distinct methods have been outlined in the
literature.
• Dilatometry method
• Pyconometry or Density method
Dilatometry measures the decrease in the water in a closed system of a hydrating paste
system. The drop in level of water is measured using a measuring pipette or a suitable
graduated tube.
Pyconometry measures the increase in weight of a sample of a hydrating cementitious
paste. As the volume of the hydrating paste decreases, the total volume of the system
would decrease and the volume of the total system is kept constant by adding water.
This causes the weight of the sample to increase and equals the chemical shrinkage of
the system
Chapter 2 – Autogenous shrinkage – an overview
15
Figure 2-3 Dilatometry method (ASTM-C-1608 2006)
Figure 2-4 Density bottle method (ASTM-C-1608 2006)
Both these methods have been proposed by ASTM C 1608 and both the test methods
have been used by various researchers as a reliable test method for determination of
chemical shrinkage.
Before the above test methods were formulated by ASTM, several researchers adopted
different test methods. Justnes et al (1994) attempted a very basic study into the factors
Chapter 2 – Autogenous shrinkage – an overview
16
that could contribute to the test method before a viable test method can be chosen. A
summary of the various factors is below.
Material characteristics of vial – Earlier studies with plastic vials were studied as
cement would be non-reactive with plastic but, plastic was found not to be a viable
alternative owing to its nature of softening. Glass vials were preferred even though a
definite study was not carried out to investigate the reaction of the alkalis in cement
with the glass. The reproducibility of data in glass vials was much better.
Vial shape – Tubular shaped vials were earlier used in the study; later Erlenmeyer
flask with a broad base was preferred as a larger surface area meant more contact of
the paste with water.
Type of liquid use to fill the vial – studies included the use of lime saturated water,
de-aired water and even immiscible liquids like kerosene or oil used to top up the
vial. Majority of the studies have used de-aired water.
Stopper – In most studies the stopper in the vial was made of rubber. It was found
that most of the deformation /relaxation of the rubber stopper if any happened
during the first hour of the experiment and it was negligible when compared to the
accuracy of the measurement of the system / measuring pipette in most cases
(~0.005 ml is the accuracy of most pipettes from manufacturers)
Sample thickness – The thickness of the sample was found to influence the
measurement of chemical shrinkage. All the water was to be available for the entire
system and unhindered hydration was to occur for the accurate measurement of
chemical shrinkage. This was achieved by keeping the sample thickness ~ 1 cm in
the vial. At higher thickness a drop in the measured chemical shrinkage was
observed.
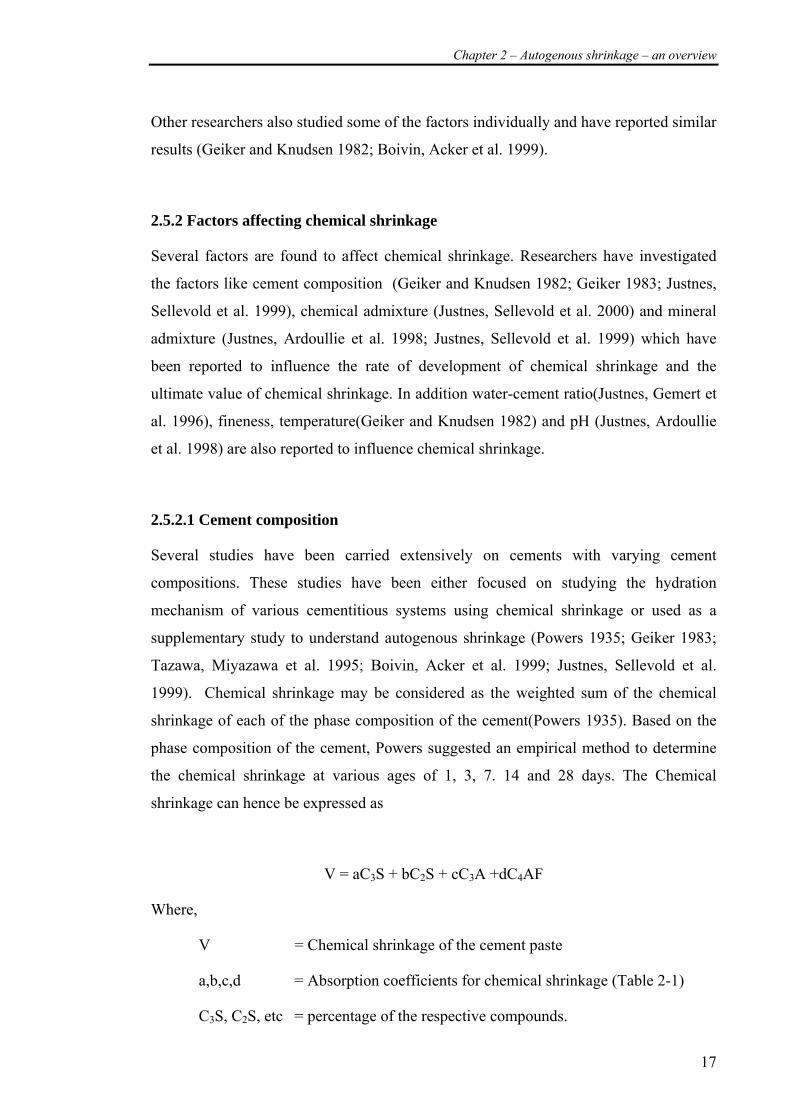
Chapter 2 – Autogenous shrinkage – an overview
17
Other researchers also studied some of the factors individually and have reported similar
results (Geiker and Knudsen 1982; Boivin, Acker et al. 1999).
2.5.2 Factors affecting chemical shrinkage
Several factors are found to affect chemical shrinkage. Researchers have investigated
the factors like cement composition (Geiker and Knudsen 1982; Geiker 1983; Justnes,
Sellevold et al. 1999), chemical admixture (Justnes, Sellevold et al. 2000) and mineral
admixture (Justnes, Ardoullie et al. 1998; Justnes, Sellevold et al. 1999) which have
been reported to influence the rate of development of chemical shrinkage and the
ultimate value of chemical shrinkage. In addition water-cement ratio(Justnes, Gemert et
al. 1996), fineness, temperature(Geiker and Knudsen 1982) and pH (Justnes, Ardoullie
et al. 1998) are also reported to influence chemical shrinkage.
2.5.2.1 Cement composition
Several studies have been carried extensively on cements with varying cement
compositions. These studies have been either focused on studying the hydration
mechanism of various cementitious systems using chemical shrinkage or used as a
supplementary study to understand autogenous shrinkage (Powers 1935; Geiker 1983;
Tazawa, Miyazawa et al. 1995; Boivin, Acker et al. 1999; Justnes, Sellevold et al.
1999). Chemical shrinkage may be considered as the weighted sum of the chemical
shrinkage of each of the phase composition of the cement(Powers 1935). Based on the
phase composition of the cement, Powers suggested an empirical method to determine
the chemical shrinkage at various ages of 1, 3, 7. 14 and 28 days. The Chemical
shrinkage can hence be expressed as
V = aC3S + bC2S + cC3A +dC4AF
Where,
V = Chemical shrinkage of the cement paste
a,b,c,d = Absorption coefficients for chemical shrinkage (Table 2-1)
C3S, C2S, etc = percentage of the respective compounds.
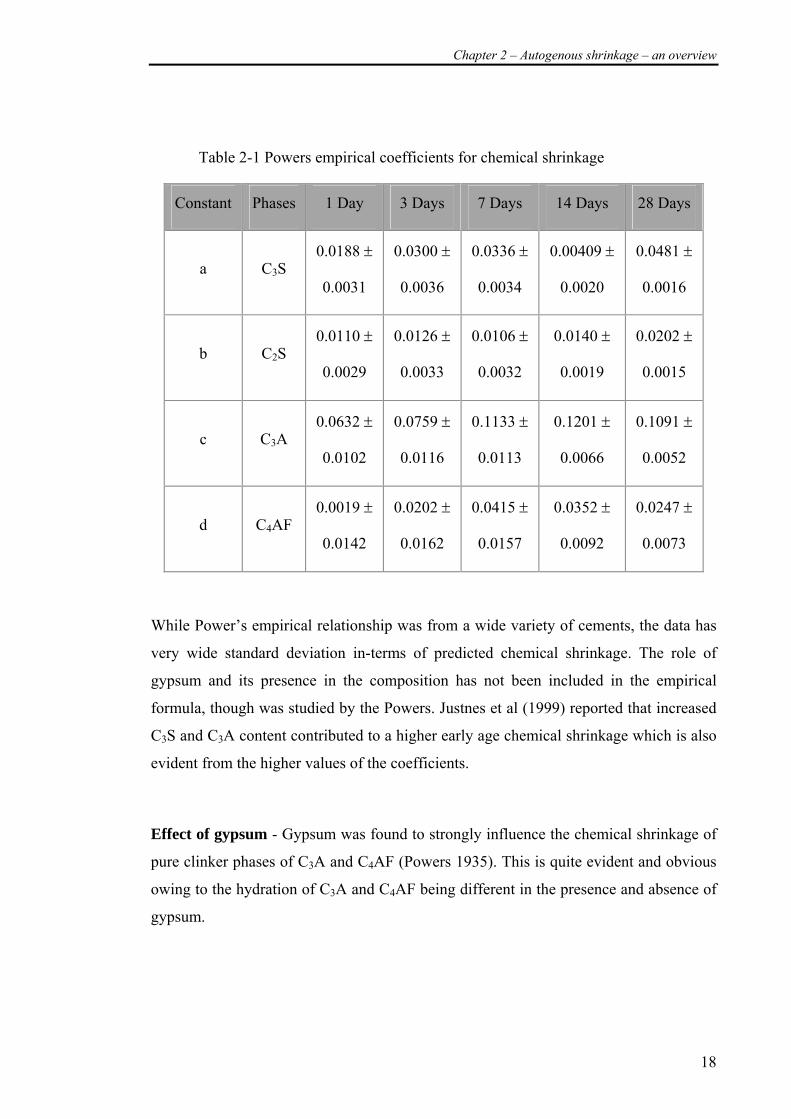
Chapter 2 – Autogenous shrinkage – an overview
18
Table 2-1 Powers empirical coefficients for chemical shrinkage
Constant Phases 1 Day 3 Days 7 Days 14 Days 28 Days
a C3S 0.0188 ±
0.0031
0.0300 ±
0.0036
0.0336 ±
0.0034
0.00409 ±
0.0020
0.0481 ±
0.0016
b C2S 0.0110 ±
0.0029
0.0126 ±
0.0033
0.0106 ±
0.0032
0.0140 ±
0.0019
0.0202 ±
0.0015
c C3A 0.0632 ±
0.0102
0.0759 ±
0.0116
0.1133 ±
0.0113
0.1201 ±
0.0066
0.1091 ±
0.0052
d C4AF 0.0019 ±
0.0142
0.0202 ±
0.0162
0.0415 ±
0.0157
0.0352 ±
0.0092
0.0247 ±
0.0073
While Power’s empirical relationship was from a wide variety of cements, the data has
very wide standard deviation in-terms of predicted chemical shrinkage. The role of
gypsum and its presence in the composition has not been included in the empirical
formula, though was studied by the Powers. Justnes et al (1999) reported that increased
C3S and C3A content contributed to a higher early age chemical shrinkage which is also
evident from the higher values of the coefficients.
Effect of gypsum - Gypsum was found to strongly influence the chemical shrinkage of
pure clinker phases of C3A and C4AF (Powers 1935). This is quite evident and obvious
owing to the hydration of C3A and C4AF being different in the presence and absence of
gypsum.
Chapter 2 – Autogenous shrinkage – an overview
19
Early Dissolution
Alkali’s Na2O, K2O dissolves and form Na+, K+, -OH which contributes to a volume
reduction of 0.43 ml/g (Justnes, Reyniers et al. 1994; Beltzung and Wittmann 2002).
Dissolution of C3S also results in chemical shrinkage. These may be considered as false
representation of chemical shrinkage as without actual formation of hydration products,
at the intermediate stage there is chemical shrinkage being measured (Beltzung and
Wittmann 2002).
2.5.3 Fineness of cementitious material
A review of literature on chemical shrinkage demonstrates that factors which did
influence the hydration of the cementitious system also influenced chemical shrinkage
and hence was used to study hydration characteristics (Geiker 1983). The fineness of
cement is well known to influence the hydration characteristics of the cement. (Locher,
Sprung et al. 1973; Knudsen 1980; Lawrence 2001) while the ultimate strength
developments are reported not to be influenced by the specific surface area of the
cement paste (Lawrence 2001). Similarly studies with cementitious material of varying
fineness was investigated and found to influence the development of the chemical
shrinkage (Justnes, Sellevold et al. 1999) but a definite study for the ultimate chemical
shrinkage has not been reported as achieving complete hydration of the cementitious
material may require very long duration of testing but the author believes that ultimate
chemical shrinkage would not be influenced by the difference in fineness. Power (1935)
was able to determine a viable empirical formula for this reason with the standard
deviation in data across various cement compositions reducing at 28 days when
compared to 1 and 3 days data thus demonstrating that the ultimate chemical shrinkage
converges to a definite value but achieving complete hydration for this purpose is a
totally different issue.
2.5.4 Effect of mineral admixtures
In comparison to studies on plain cement systems, limited study has been carried out on
the effect of mineral admixtures on chemical shrinkage. Mineral admixtures mainly
include silica fume, fly ash and slag. Not much study has been carried out on other
natural pozzolana.
Chapter 2 – Autogenous shrinkage – an overview
20
Silica fume - The chemical shrinkage of the pozzolanic reaction in silica fume has
been investigated (Justnes, Ardoullie et al. 1998) and was estimated to be roughly
about 8.8 ml / 100 gm of reacted silica. It was reported that the total chemical
shrinkage increases with increasing replacements of silica fume. Many researchers
have reported chemical shrinkage of cement-silica fume system as ml / gm of
cement and not cementitious system. This may be misleading. Silica fume is
expected to be highly reactive and hence would constitute to high early reaction
driving high chemical shrinkage causing high autogenous shrinkage.
Fly ash – Studies by (Justnes, Ardoullie et al. 1998) with lime fly ash mixtures
and cement fly ash mixtures, showed the relative effect of fly ash on chemical
shrinkage. In the lime-fly ash mixtures, the total chemical shrinkage for a pH
between 13.0 and 13.5 after 28 days was about 7ml/gm of fly ash. At about 56
days the chemical shrinkage increased to 9ml/gm of fly ash. The reaction of fly
ash was found to continue beyond this period even though the reaction rates were
much slower. In the cement – fly ash mixtures the 20% fly ash replacement
mixture had a higher amount of chemical shrinkage reported and slightly lower
than 20% opc- silica fume mixture. But the reported values are expressed as
ml/gm of cement and not cementitious material. This can confuse the reader of
interest as at 20% replacements there is lesser cement when compared to OPC
alone mixtures. Several authors have adopted to express chemical shrinkage as
ml/gm of cement (Justnes, Ardoullie et al. 1998) rather than ml/gm of
cementitious material. The author feels this is quite deceiving.
Slag - Studies with slag is very limited. A study by Mills (1984) was carried out
on chemical shrinkage with two types of cement and four types of blast furnace
slag showing that the increase in replacement of slag resulted in higher chemical
shrinkage. But it is still unclear as to the relative effect of slag as the chemical
shrinkage was expressed as gm/gm of cement content rather than the cementitious
content.. Chen (2006) had also conducted numerical modelling of the hydration of
the slag and predicted chemical shrinkage. Chen demonstrated that the degree of
Chapter 2 – Autogenous shrinkage – an overview
21
hydration of the slag was a function of the chemical shrinkage of the whole system
and for medium reactive slag the chemical shrinkage was found not to differ
significantly from that of the ordinary Portland cement and in fact reduce as the
degree of substitution increased.
2.5.5 Effect of water-cement ratio
Water-cement ratio has been found to strongly influence the chemical shrinkage
developed.. The decrease in water-cement ratio has reflected a decrease in the chemical
shrinkage a given time interval (Justnes, Gemert et al. 1996). A good correlation was
found between decrease in chemical shrinkage and decrease in water-cement ratio
(Geiker and Knudsen 1982). The decrease in chemical shrinkage may be attributed to
various factors but is mainly due to the reduced degree of hydration achieved by the
system i.e., the hydration kinetics strongly influenced the development of the chemical
shrinkage(Geiker 1983; Boivin, Acker et al. 1999). The “rate of development” of
chemical shrinkage has also been reported to be influenced by the change in water-
cement ratio ie., an increase in the water-cement ratio resulted in an increase in the rate
of development of chemical shrinkage.
2.5.6 Physical effects of chemical shrinkage
Chemical shrinkage is a result of a chemical process, i.e., reactants reacting to form
products. Yet the process has other physical effects on the hydrated specimens. Several
questions on the state of water in the system are to be answered.
In a hydrated cement paste water may exist in three forms, mainly(Neville 1995)
• Capillary water
• Gel water and Interlayer water
• Chemically combined water
Yet a more simpler classification is based on the method of separating the water from
the hydrated paste and is termed as
• Evaporable water content
• Non-evaporable water content
Chapter 2 – Autogenous shrinkage – an overview
22
The non-evaporable water mainly comprises of the chemically combined water, which
cannot be removed from the hydrated system. Thus the non-evaporable hence is a direct
function of the chemical shrinkage. This is because as more of the hydrated paste is
formed more of non-evaporable water content increases and so does the chemical
shrinkage which is a function of amount of reactants formed.
Within a closed system does the interlayer water present between CSH sheets really
form a part of the CSH or is it a part of the evaporable water? The physically adsorbed
water is a part of the gel water. But the first monolayer adsorbed does it form a part of
the hydrated product or a part of the gel water are yet questions mis-understood.
Owing to the method of testing employed to determine the test method, the following
questions are drawn on the nature of effect of the state of water on the measurement of
true chemical shrinkage.
1. The interlayer water between the hydrated products (CSH sheets) may result in
swelling. Does this influence the measured chemical shrinkage
2. Chemically combined water which is an integral part of the microstructure, does
the amount of chemically combined water combined to form a certain product
alter the chemical shrinkage of a certain reactant and product.
Hence it may be said that while the state of water and the way water is available in the
system may ambiguous , one may have to consider these and look at the problem at a
more detailed level when extending the study to understand self-desiccation.
2.5.7 Chemical shrinkage and link to autogenous shrinkage
Chemical shrinkage may account for one of the important factors contributing to self-
desiccation and hence autogenous shrinkage. Until the initial set of the cement paste has
occurred the chemical shrinkage is the same as the autogenous shrinkage of the total
paste system. This is because until the initial set, any chemical deformation is directly
translated into the bulk deformation of the paste system. But after the cementitious

Chapter 2 – Autogenous shrinkage – an overview
23
system has set, all of the chemical shrinkage is not translated into the autogenous
deformation. Any further chemical shrinkage may be transformed into empty voids in
the system contributing to self-desiccation. This is shown in Figure 2-5. Though Figure
2-5 is good in visualizing the link between chemical shrinkage and autogenous
shrinkage, autogenous shrinkage is represented from the point of initial set. This is not
quite convincing as then the actual point of set is not the same for every mix. Moreover
as Lura et al (2003) pointed out, autogenous shrinkage is the volume change associated
without the loss or exchange of moisture with the external environment, setting time
may be deceiving while expressing autogenous shrinkage. Furthermore, chemical
shrinkage is one of the primary causes of autogenous shrinkage hence chemical
shrinkage earlier to initial set has to be also a part of the autogenous shrinkage of the
cementitious paste system. Nevertheless the measurement of autogenous shrinkage in
paste and concrete specimens requires specialized measurement techniques.
Figure 2-5 Relationship between Chemical shrinkage and autogenous shrinkage
(Tazawa 1998)
2.6 Self desiccation
Adam Neville refers to self desiccation in his book (Neville 1995) as the phenomenon in
which “If no water movement to or from the cement paste is permitted, the reactions of
hydration use up the water until too little is left to saturate the solid surfaces, and the
Chapter 2 – Autogenous shrinkage – an overview
24
relative humidity within the paste decreases.” The concrete begins to dry by itself from
the inside. The reduction in relative humidity from within the sample would result in the
hydration to cease as the reactants are not saturated to proceed with the hydration. The
development of chemical shrinkage and formation of empty pores also supplements the
process of self-desiccation.
2.6.1 Basic phenomenon
While Figure 2-2 shows an illustration of the chemical shrinkage, I suggest to illustrate
self desiccation by the Figure 2-6. This figure shows the various stages before self-
desiccation shrinkage occurs. In a closed system with cement and water, the initial
volume changes with the progress of hydration; (a) represents the initial volume of the
closed system before the beginning of hydration. As cement and water reacts, hydrated
cement paste is formed. This occupies less space than that of the volume of the initial
reacted cement and water hence resulting in chemical shrinkage shown in Figure 2-6(b).
This chemical shrinkage is not translated into the bulk deformation of the system, after
the hydrated cement paste has set or gained sufficient strength. Instead the volume of
chemical shrinkage is translated into empty pores within the system as show in Figure
2-6(c). Water within the closed system is being consumed by the cement and empty
pores are being formed. This causes the relative humidity within the porous network of
the hydrated cement paste to drop. This drop in relative humidity due to the equilibrium
between the empty pores being formed and water left, causes tensile stresses generated
at the meniscus of the water causing the matrix to shrink. Hence resulting in bulk
deformation of the system called self-desiccation shrinkage also referred to as
autogenous shrinkage as shown in Figure 2-6(d).
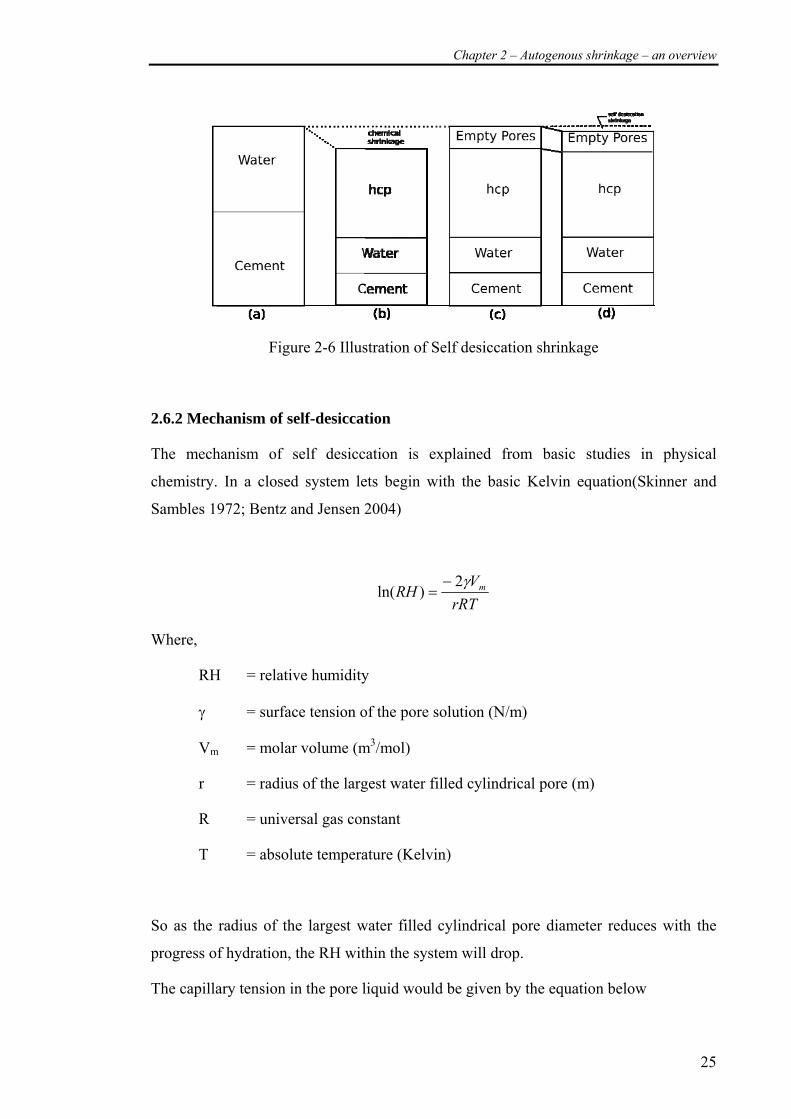
Chapter 2 – Autogenous shrinkage – an overview
25
Figure 2-6 Illustration of Self desiccation shrinkage
2.6.2 Mechanism of self-desiccation
The mechanism of self desiccation is explained from basic studies in physical
chemistry. In a closed system lets begin with the basic Kelvin equation(Skinner and
Sambles 1972; Bentz and Jensen 2004)
rRTV
RH mγ2)ln(
−=
Where,
RH = relative humidity
γ = surface tension of the pore solution (N/m)
Vm = molar volume (m3/mol)
r = radius of the largest water filled cylindrical pore (m)
R = universal gas constant
T = absolute temperature (Kelvin)
So as the radius of the largest water filled cylindrical pore diameter reduces with the
progress of hydration, the RH within the system will drop.
The capillary tension in the pore liquid would be given by the equation below
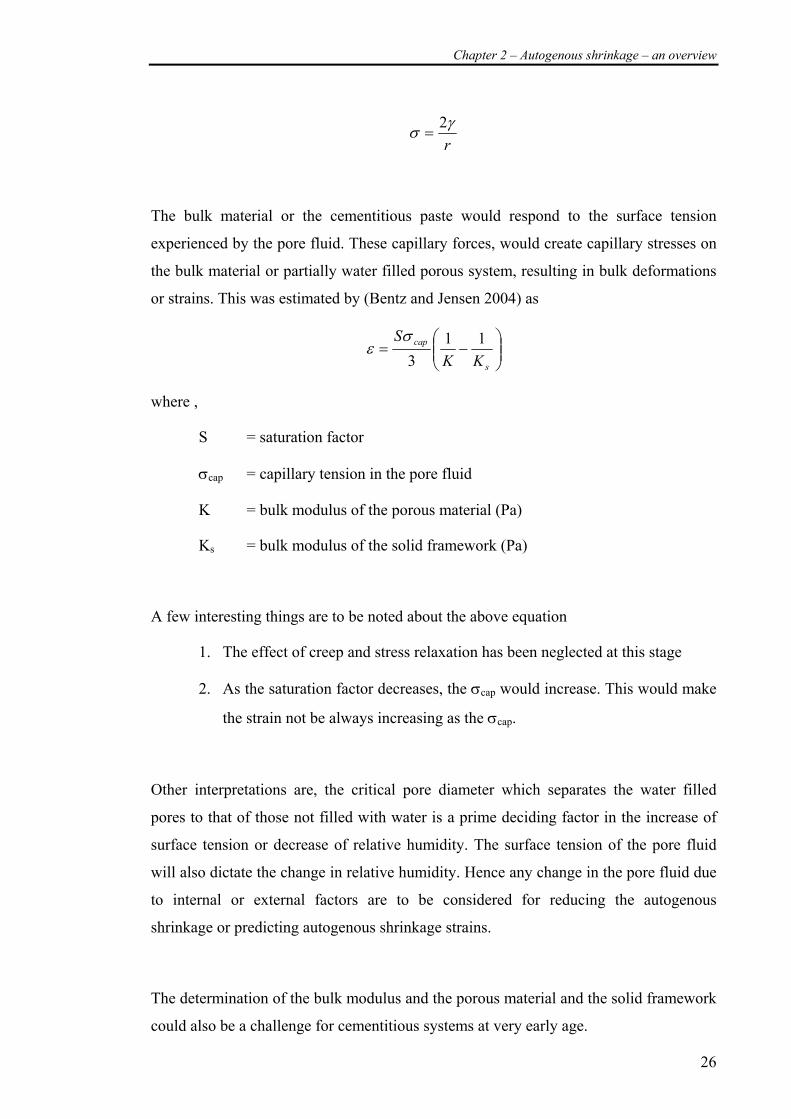
Chapter 2 – Autogenous shrinkage – an overview
26
rγσ 2
=
The bulk material or the cementitious paste would respond to the surface tension
experienced by the pore fluid. These capillary forces, would create capillary stresses on
the bulk material or partially water filled porous system, resulting in bulk deformations
or strains. This was estimated by (Bentz and Jensen 2004) as
⎟⎟⎠
⎞⎜⎜⎝
⎛−=
s
cap
KKS 11
3σ
ε
where ,
S = saturation factor
σcap = capillary tension in the pore fluid
K = bulk modulus of the porous material (Pa)
Ks = bulk modulus of the solid framework (Pa)
A few interesting things are to be noted about the above equation
1. The effect of creep and stress relaxation has been neglected at this stage
2. As the saturation factor decreases, the σcap would increase. This would make
the strain not be always increasing as the σcap.
Other interpretations are, the critical pore diameter which separates the water filled
pores to that of those not filled with water is a prime deciding factor in the increase of
surface tension or decrease of relative humidity. The surface tension of the pore fluid
will also dictate the change in relative humidity. Hence any change in the pore fluid due
to internal or external factors are to be considered for reducing the autogenous
shrinkage or predicting autogenous shrinkage strains.
The determination of the bulk modulus and the porous material and the solid framework
could also be a challenge for cementitious systems at very early age.
Chapter 2 – Autogenous shrinkage – an overview
27
Though several reliable theories have emerged to explain the general mechanism of
autogenous shrinkage, several questions are yet unanswered
1. When the capillary network system is highly discontinuous, how can the trend of
largest pore emptying be valid
2. The discontinuous capillary system and movement of moisture within the closed
system.
2.6.3 Thermodynamics of self-desiccation
While the capillary tension of the pore fluid in conjunction with the pore diameter is
both crucial and dictates the development of self-desiccation. This change in relative
humidity has other influences on the hydration reactions. It is reported in literature that
hydration ceases at relative humidity’s below 75%. Careful studies by Powers on
cement hydration at various relative humidity had revealed that each of the pure clinker
phases would cease to hydrate when the relative humidity dropped below a certain
threshold value. a thermodynamic analysis was done by Jensen (1995). The lowest
relative humidity at which hydration will proceed was determined from thermodynamic
analysis of the reactants and the products. While these ranged from values of 14% -
74%. C2S hydration is greatly influenced by low relative humidity, which hence will
restrict self-desiccation. A similar experimental study on clinker hydration (Jensen,
Hansen et al. 1999) demonstrated that the hydration of pure clinker phases were
sensitive to relative humidity. The study concluded that C3S, C2S and C3A had limiting
relative humidity of 85%, 90% and 60 % at which hydration was to occur. Hence ,
• If the relative humidity was influencing the hydration of each of the
mineralogical phases, does the resulting hydration product be also dependent on
the type of humidity the clinker was exposed to from within?
• If relative humidity of the whole cementitious system would not generally drop
below 75% we would be able to quantify the maximum and minimum radius of
the pore diameter at which water is emptied and the maximum and minimum
capillary stresses that can be generated. This aspect has been dealt in detail in
Chapter 8.
Chapter 2 – Autogenous shrinkage – an overview
28
2.6.4 Factors influencing self-desiccation.
An understanding of the above mechanism clearly explains that the primary factors
which contribute to or influence self-desiccation are
• Pore volume
• Pore distribution.
• Discontinuous capillary network
Pore volume - The pore volume is a measure of the total amount / volume of pores
present in the total bulk material. The pores serve as reservoirs for water for hydration
and at the same time the pores are critical in the formation of the meniscus. The ratio of
the amount of water present to the total pore volume is the degree of saturation of the
pores. The degree of saturation of the pores is a function of the internal drying within
the porous network
Pore distribution - As hydration proceeds, in addition to the porosity being altered, so
does the pore structure change. The filling of the capillary pores with the hydrated
products results in the cementitious system to be more denser and intern large amounts
of micro pores are formed. There is a shift from the pore size distribution being
dominated by large sized pores to very small sized pores as the hydration proceeds.
Discontinuous capillary network – Power and Copeland (1959) demonstrated that as
the hydration of the cementitious system proceeds, based on the initial water cement
ratio, the degree of interconnected pores decreases and at a certain duration of
hydration, the amount of interconnected capillary pore network is very low or zero in
some cases. This time required for the formation of discontinuous capillary network
reduces with the reduction in water-cement ratio. A relationship between fraction of
cement hydration required to achieve a discontinuous capillary network is shown in
Figure 2-7(Powers and Copeland 1959).

Chapter 2 – Autogenous shrinkage – an overview
29
Figure 2-7 Relationship between degree of hydration and water –cement ratio when
capillary continuity is lost (Powers and Copeland 1959)
A closer look at the above methods gives rise to many questions to the author
1. If the capillary pores are completely discontinuous at very low water-cement
ratios, how is the movement of the water within the cementitious system?
2. The formed micro pores as a result of the hydration, are they formed
independent of the existing capillary network?
3. Does movement of the water if restricted due to lack of a capillary network
result in localized drop in relative humidity?
4. Does there exist equilibrium in the intrinsic relative humidity within the
discontinuous porous?
5. Are there possibilities that diffusion of water vapor with the pores in the
microstructure be present during the progress of hydration through the hardened
non-continuous porous structure?
Several questions are not yet clear into why and how self-desiccation occurs at the
micro-level and the relative influence of this at the macro level deformations.
Chapter 2 – Autogenous shrinkage – an overview
30
2.7 Measurement methods for autogenous shrinkage
Various measurement methods have been proposed by researchers tailored to there
measurement needs. But all measurement techniques had one of many of the following
characteristics
1. Measurements were conducted on sealed specimen
2. Measurements were conducted with the least restraint to capture free shrinkage
3. Linear or volumetric methods of measurement
4. Contact or non contact measurement
5. External or internal measurements were made
2.7.1 Linear measurements of autogenous shrinkage
Traditionally linear measurements have been adopted by researchers for the
measurement of autogenous shrinkage. Methods include the casting of prismatic
specimens and sealing them with a suitable sealing agent. The shrinkage measurements
were at regular intervals using contact type or non-contact type techniques to record the
deformation. While this method is more convenient and can be easily conducted at any
basic concrete laboratory, the major limitation is that the sample can be sealed only after
the specimens have achieved sufficient strength, this result’s in the inability to record or
determine the autogenous shrinkage strains prior to sealing. Also the type of sealing
method also influence the test results. Linear measurements have been conducted as
vertical or horizontal deformations. (Jensen and Hansen 1995; Barcelo, Boivin et al.
1999; Gagne, Aouad et al. 1999; Hammer 1999; Hedlund and Westman 1999)
2.7.2 Volumetric measurements of autogenous shrinkage
A second school of thought (Jensen and Hansen 1995; Aitcin 1999; Loukili, Chopin et
al. 2000) among researchers was that autogenous shrinkage is a more volumetric
deformation and hence a more realistic approach would be measure autogenous
shrinkage in terms of the bulk volume deformation. To determine volumetric
deformations, measurements were carried out with sample immediately after
preparation place within an elastic membrane or a condom. The elastic membrane along
Chapter 2 – Autogenous shrinkage – an overview
31
with the sample was the weighed under water at regular intervals or using a continuous
weighing system (buoyancy approach) for the capturing the volume change of the bulk
material for autogenous shrinkage, mostly referred to researchers as external chemical
shrinkage in there paper. Studies have also been conducted to compare linear and
volumetric measurement methods (Barcelo, Boivin et al. 1999; Charron, Marchand et
al. 2001).
2.8 Autogenous shrinkage in cementitious systems
Earliest study on autogenous shrinkage can be referenced to an article by H E Davis
(Davis 1940). As concrete mostly involved higher water cement ratio until high
performance concrete was more dominantly used across, autogenous shrinkage was
found to be not a dominant factor and most studies were on drying shrinkage instead.
But with the thrust on high performance concrete since the early 1980’s, autogenous
shrinkage is become a dominant within these low water cement ratio, high performance
concrete. Hence subsequently many researchers had become interested in studying
autogenous shrinkage in cementitious systems.
2.8.1 Autogenous shrinkage and degree of hydration
The hydration ratio, though was one of the important factors influencing autogenous
shrinkage (Koenders and Breugel 1999), researchers have also demonstrated that the
hydration ratio alone does not solely contribute or explain autogenous shrinkage. There
is a period when the autogenous shrinkage increases with no or little increase in the
hydration ratio and was explained to the changes in the pore structure resulting in the
increase in surface tension(Park, Noguchi et al. 1999).
2.8.2 Factors influencing autogenous shrinkage
Factors affecting chemical shrinkage, self desiccation would also influence the
autogenous shrinkage (Persson 1997; Tazawa 1999). I have shown the major factors
influencing the development of autogenous shrinkage strains in Figure 2-8. Each of
these factors individually and collectively influences the development of autogenous
shrinkage strains while the basic cause still being chemical shrinkage, self desiccation
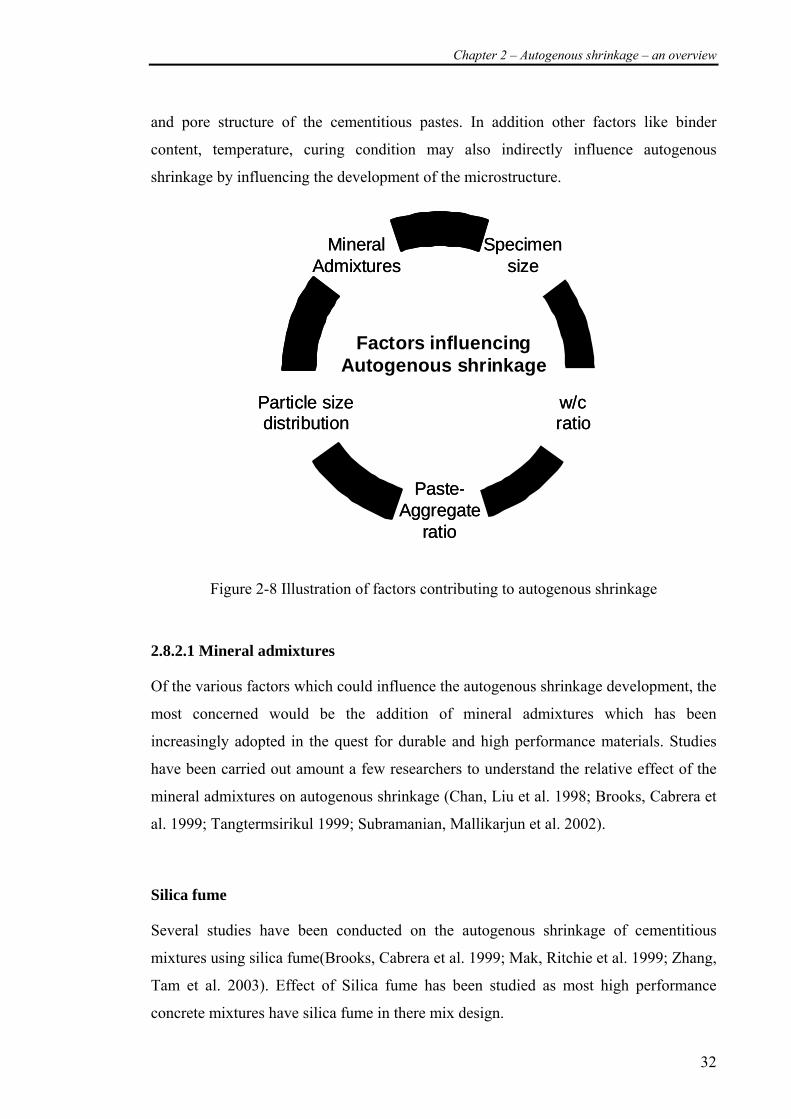
Chapter 2 – Autogenous shrinkage – an overview
32
and pore structure of the cementitious pastes. In addition other factors like binder
content, temperature, curing condition may also indirectly influence autogenous
shrinkage by influencing the development of the microstructure.
Specimensize
w/cratio
Paste-Aggregate
ratio
Particle sizedistribution
MineralAdmixtures
Specimensize
w/cratio
Paste-Aggregate
ratio
Particle sizedistribution
MineralAdmixtures
Factors influencing Autogenous shrinkage
Figure 2-8 Illustration of factors contributing to autogenous shrinkage
2.8.2.1 Mineral admixtures
Of the various factors which could influence the autogenous shrinkage development, the
most concerned would be the addition of mineral admixtures which has been
increasingly adopted in the quest for durable and high performance materials. Studies
have been carried out amount a few researchers to understand the relative effect of the
mineral admixtures on autogenous shrinkage (Chan, Liu et al. 1998; Brooks, Cabrera et
al. 1999; Tangtermsirikul 1999; Subramanian, Mallikarjun et al. 2002).
Silica fume
Several studies have been conducted on the autogenous shrinkage of cementitious
mixtures using silica fume(Brooks, Cabrera et al. 1999; Mak, Ritchie et al. 1999; Zhang,
Tam et al. 2003). Effect of Silica fume has been studied as most high performance
concrete mixtures have silica fume in there mix design.

Chapter 2 – Autogenous shrinkage – an overview
33
Fly ash
Fly ash added as replacements have showed mixed results among the literature(Chan,
Liu et al. 1999; Tangtermsirikul 1999; Lee, Lee et al. 2003; Akkaya, Konsta-Gdoutas et
al. 2004; Termkhajornkit, Nawa et al. 2005). Fly ash when added as replacements of
cement at a constant water-cement ratio has shown reduction in autogenous shrinkage.
This was studied at replacements of up to 30% of fly ash by Lee et al (2003). Similar
results were observed by Chan et al (1998) with fly ash replacements of 20% and 40%.
The type of fly ash used in this study was Class F and had a lower fineness index. This
reduces the reactivity of the fly ash and was attributed as the factors contributing to
relative effect of fly ash on autogenous shrinkage. Contrary results were observed by
(Termkhajornkit, Nawa et al. 2005) an increase in fly ash at 25% replacement followed
by a decrease in autogenous shrinkage at 50% replacements. The hydration degree of fly
ash was reported to influence the autogenous shrinkage strains. While studies with
different fly ash sources has revealed that the chemical composition, particle size
distribution of the fly ash and pore size of hydrated cementitious system influence the
autogenous shrinkage strains. Mixed results were obtained for different fly ash systems
with some mitigating autogenous shrinkage while some types of fly ash increasing the
autogenous shrinkage.
Based on literature with mixed results for the effect of fly ash on autogenous shrinkage,
the importance of the reactivity of fly ash and its fineness are to be understood before it
can be said that the fly ash is truly reducing autogenous shrinkage.
Slag
Studies on cements blended with granulated blast furnace slag and activated slag
cements have been done(Chan, Liu et al. 1999; Lim and Wee 2000; Aldred and Lee
2004; Lee, Lee et al. 2006; Melo Neto, Cincotto et al. 2008). Studies by Lee et al (2006)
have shown that at a water-cementitious ratio of 0.27 – 0.42, the measured autogenous
shrinkage was much higher for replacements of 30% and 50% that plain cement
mixtures. The test method adopted for the study was similar to that of the JCI Method of
measurement of autogenous shrinkage. A similar study by (Chan, Liu et al. 1998)
showed at 40% the autogenous shrinkage of concrete from slag blended cements was
Chapter 2 – Autogenous shrinkage – an overview
34
much higher than that constituting ordinary portland cement alone. At higher
replacements of 60% a marginal decrease in autogenous shrinkage was found to the
40% replacements but was still higher than the cement alone mixtures. Study has been
limited when compared to research on autogenous shrinkage with silica fume. Similar
results were also observed by (Lim and Wee 2000; Aldred and Lee 2004) with
shrinkage of slag blends reducing at higher replacements yet slag blended concrete
exhibiting higher autogenous shrinkage strains than normal ordinary portland concrete.
Metakaolin
Very limited study has begun in the study of effects of Metakaolin on autogenous
shrinkage in cement pastes. Preliminary studies have revealed replacements of
Metakaolin by 5, 10 , 15 and 20% has shown a decrease in the overall autogenous
shrinkage compared to cement paste systems(Gleize, Cyr et al. 2007).
2.9 Basic Mechanism of hydration in cementitious system
As autogenous shrinkage, chemical shrinkage or self-desiccation is greatly a function or
dependent on the hydration of the cementitious systems, a basic insight would help to
understand the factors of hydration which contribute. Enough literature exists regarding
hydration of cement, cement-fly ash systems and cement – silica fume systems. Hence
emphasis is given on cement-slag hydration in the chapter.
2.9.1 Slag hydration
The present study, author has limited his work to only study related to cement blended
with granulated blast furnace slag as replacements of cement. The hydration of slag is
different to that silica fume or fly ash owing to its latent hydraulic nature of the slag
(Chen 2006).
The major products of hydration products of slag blended cements would include the
calcium silicate hydrate, hydrotalcite (M5AH13), ettringite ( 3236 HSAC ), Calcium
hydroxide (CH) and calcium aluminate hydrate (C4AF13).
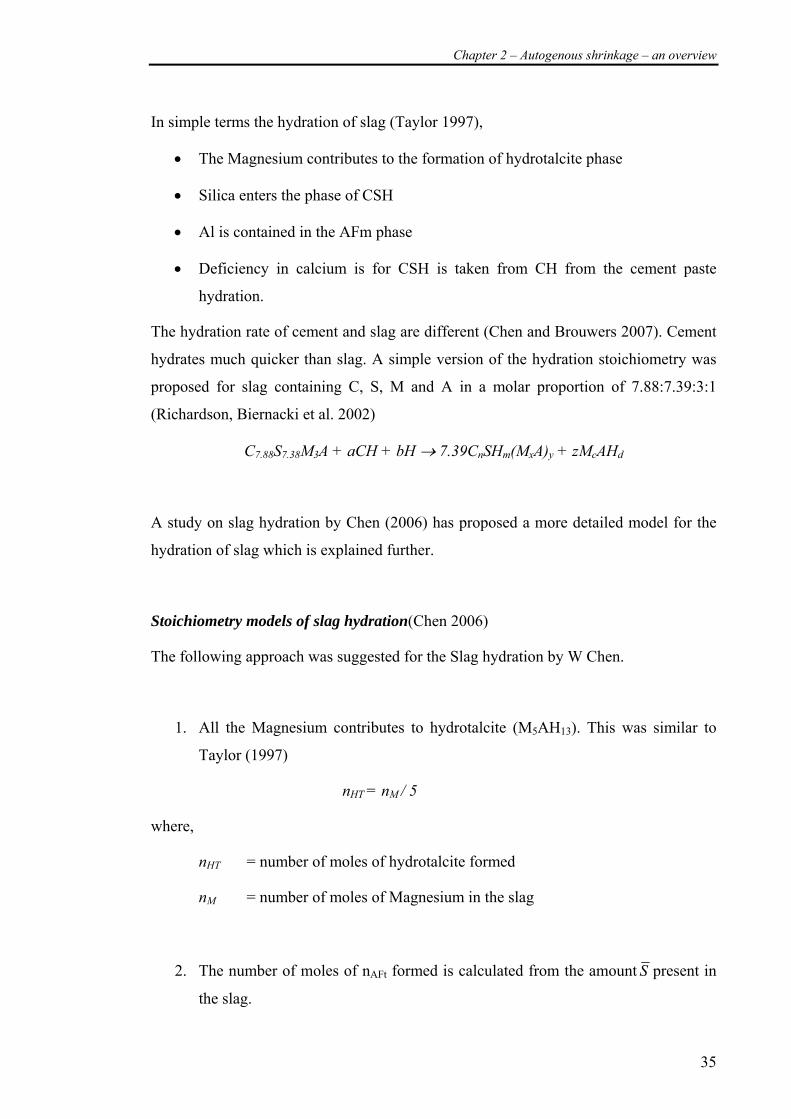
Chapter 2 – Autogenous shrinkage – an overview
35
In simple terms the hydration of slag (Taylor 1997),
• The Magnesium contributes to the formation of hydrotalcite phase
• Silica enters the phase of CSH
• Al is contained in the AFm phase
• Deficiency in calcium is for CSH is taken from CH from the cement paste
hydration.
The hydration rate of cement and slag are different (Chen and Brouwers 2007). Cement
hydrates much quicker than slag. A simple version of the hydration stoichiometry was
proposed for slag containing C, S, M and A in a molar proportion of 7.88:7.39:3:1
(Richardson, Biernacki et al. 2002)
C7.88S7.38M3A + aCH + bH → 7.39CnSHm(MxA)y + zMcAHd
A study on slag hydration by Chen (2006) has proposed a more detailed model for the
hydration of slag which is explained further.
Stoichiometry models of slag hydration(Chen 2006)
The following approach was suggested for the Slag hydration by W Chen.
1. All the Magnesium contributes to hydrotalcite (M5AH13). This was similar to
Taylor (1997)
nHT = nM / 5
where,
nHT = number of moles of hydrotalcite formed
nM = number of moles of Magnesium in the slag
2. The number of moles of nAFt formed is calculated from the amount S present in
the slag.
Chapter 2 – Autogenous shrinkage – an overview
36
3/SAFt nn =
Only the remaining of C and A was available for the formation of CSH.
The number moles of C*and A* can be determined subtracting the number moles
consumed in the formation of AFt and hydrotalcite.
AFtHTAA
AFtCC
nnnn
nnn
−−=
−=*
* 6
Where,
=*Cn number of moles of remaining C
=*An number of moles of remaining A
=Cn initial number of moles of C
=An initial number of moles of A
3. The remaining of C and A are involved in the formation of CSH. The formation
of CSH from slag hydration has been based on three scenarios.
• No CH formed from cement hydration is consumed during the hydration
of Slag to form CSH
• CH from cement hydration is consumed by slag to form CSH
maintaining a C/S of 1.8
• CH from cement hydration only enters the slag hydration partially.
2.10 Estimation and prediction autogenous shrinkage strains
Several approaches have been used by researchers for the estimation or prediction of
autogenous shrinkage strains. Some of the methods used for prediction include,
numerical simulations, analytical modelling or regression analysis (empirical models)
Chapter 2 – Autogenous shrinkage – an overview
37
Several empirical relationships have been developed for autogenous shrinkage strains.
The influence of C3A and C4AF was demonstrated to dominate the autogenous
shrinkage strains.
ε(t) = -0.12 * αC3S * [%C3S] -0.070 * αC2S * [%C2S] +2.256 * αC3A * [%C3A] +0.859 *
αC4AF * [%C4AF]
Where,
ε(t) = Autogenous shrinkage at time‘t’
α(t) = degree of hydration of individual phases at time‘t’
The subsequent section explains empirical models for prediction of autogenous
shrinkage in concrete
2.10.1 Tazawa and Miyazawa model (Tazawa and Miyazawa 1999)
Tazawa developed an empirical relationship to predict autogenous shrinkage in
hardened concrete. This was based on extensive study on various water-cement ratio
and the water-cementitious ratio.
εc(t) = γ . εc0 (w/b). β(t) x 106
For 0.2 ≤ w/b ≤ 0.5 : εc0 (w/b) = 3070 exp [-7.2(w/b)]
For w/b > 0.5 : εc0 (w/b) = 80
β(t) = [1-exp(-a(t-to)b)]
Where,
εc(t) = autogenous shrinkage strain in concrete at time ‘t’
γ = Co-efficient which depends on the type of cement. γ=1 for OPC
εc0 (w/b)= Ultimate autogenous shrinkage strain in concrete
β(t) = Coefficient to describe the development of autogenous shrinkage strain
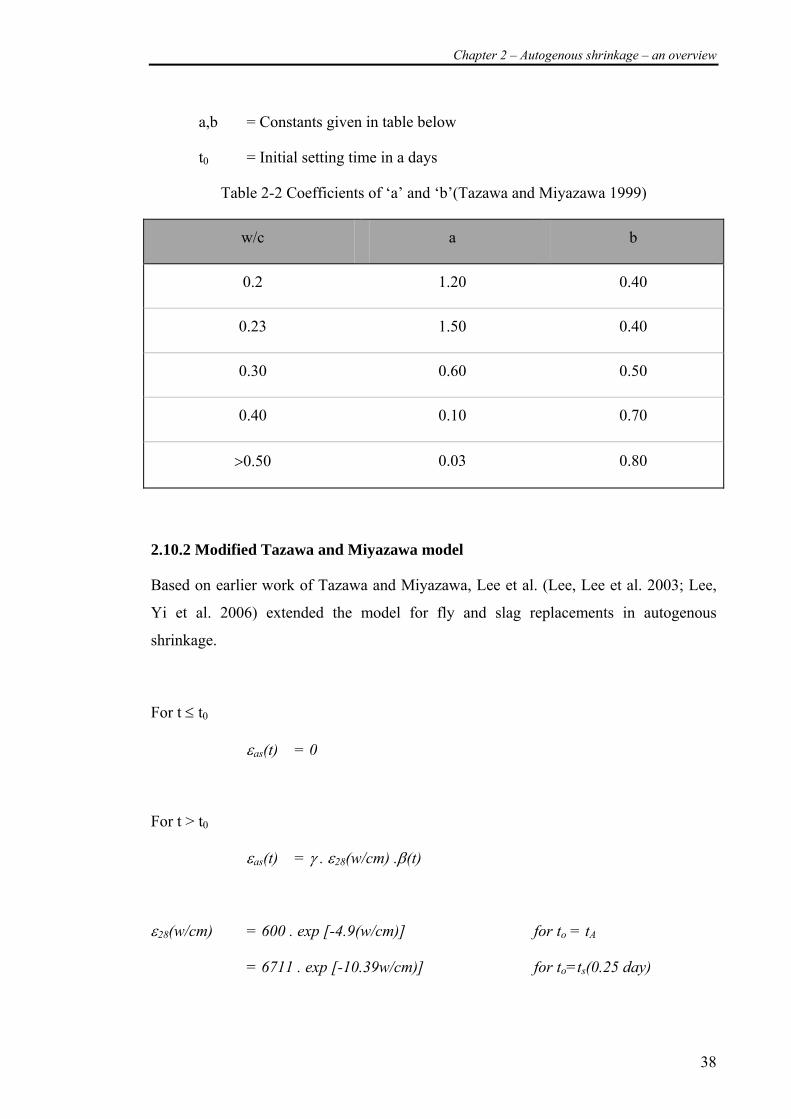
Chapter 2 – Autogenous shrinkage – an overview
38
a,b = Constants given in table below
t0 = Initial setting time in a days
Table 2-2 Coefficients of ‘a’ and ‘b’(Tazawa and Miyazawa 1999)
w/c a b
0.2 1.20 0.40
0.23 1.50 0.40
0.30 0.60 0.50
0.40 0.10 0.70
>0.50 0.03 0.80
2.10.2 Modified Tazawa and Miyazawa model
Based on earlier work of Tazawa and Miyazawa, Lee et al. (Lee, Lee et al. 2003; Lee,
Yi et al. 2006) extended the model for fly and slag replacements in autogenous
shrinkage.
For t ≤ t0
εas(t) = 0
For t > t0
εas(t) = γ . ε28(w/cm) .β(t)
ε28(w/cm) = 600 . exp [-4.9(w/cm)] for to = tA
= 6711 . exp [-10.39w/cm)] for to=ts(0.25 day)
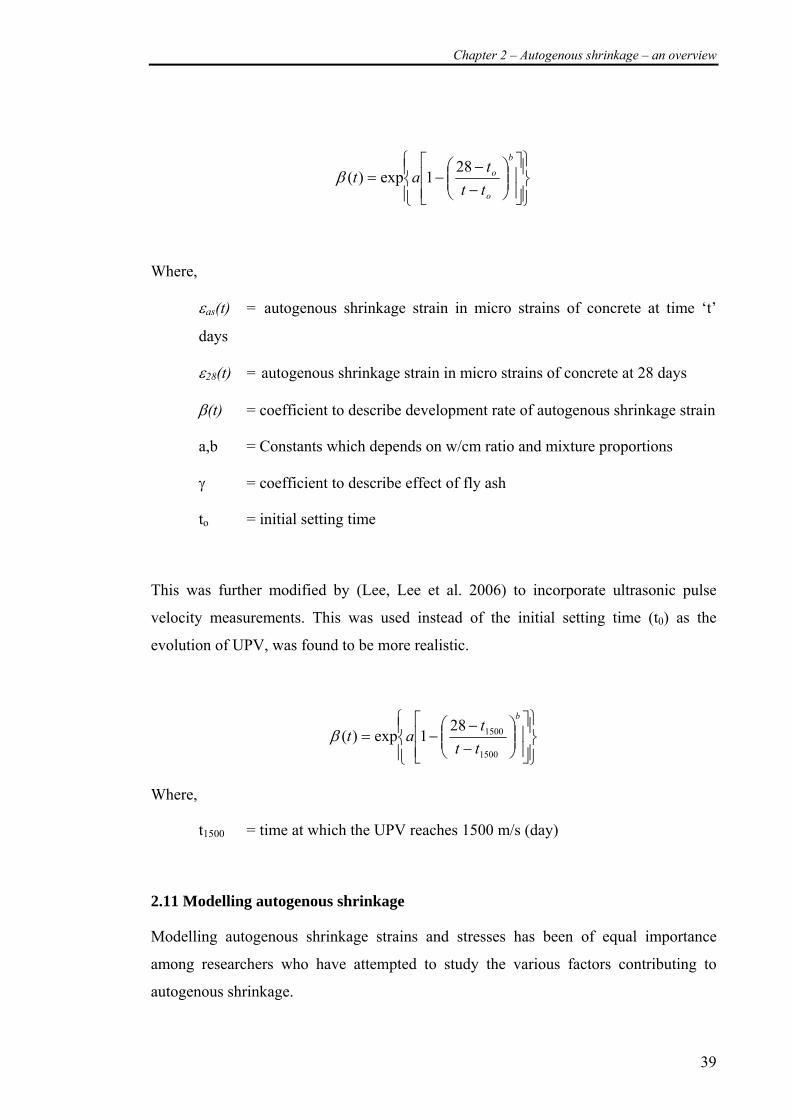
Chapter 2 – Autogenous shrinkage – an overview
39
⎪⎭
⎪⎬⎫
⎪⎩
⎪⎨⎧
⎥⎥⎦
⎤
⎢⎢⎣
⎡⎟⎟⎠
⎞⎜⎜⎝
⎛−−
−=b
o
o
ttt
at28
1exp)(β
Where,
εas(t) = autogenous shrinkage strain in micro strains of concrete at time ‘t’
days
ε28(t) = autogenous shrinkage strain in micro strains of concrete at 28 days
β(t) = coefficient to describe development rate of autogenous shrinkage strain
a,b = Constants which depends on w/cm ratio and mixture proportions
γ = coefficient to describe effect of fly ash
to = initial setting time
This was further modified by (Lee, Lee et al. 2006) to incorporate ultrasonic pulse
velocity measurements. This was used instead of the initial setting time (t0) as the
evolution of UPV, was found to be more realistic.
⎪⎭
⎪⎬⎫
⎪⎩
⎪⎨⎧
⎥⎥⎦
⎤
⎢⎢⎣
⎡⎟⎟⎠
⎞⎜⎜⎝
⎛−−
−=b
ttt
at1500
1500281exp)(β
Where,
t1500 = time at which the UPV reaches 1500 m/s (day)
2.11 Modelling autogenous shrinkage
Modelling autogenous shrinkage strains and stresses has been of equal importance
among researchers who have attempted to study the various factors contributing to
autogenous shrinkage.
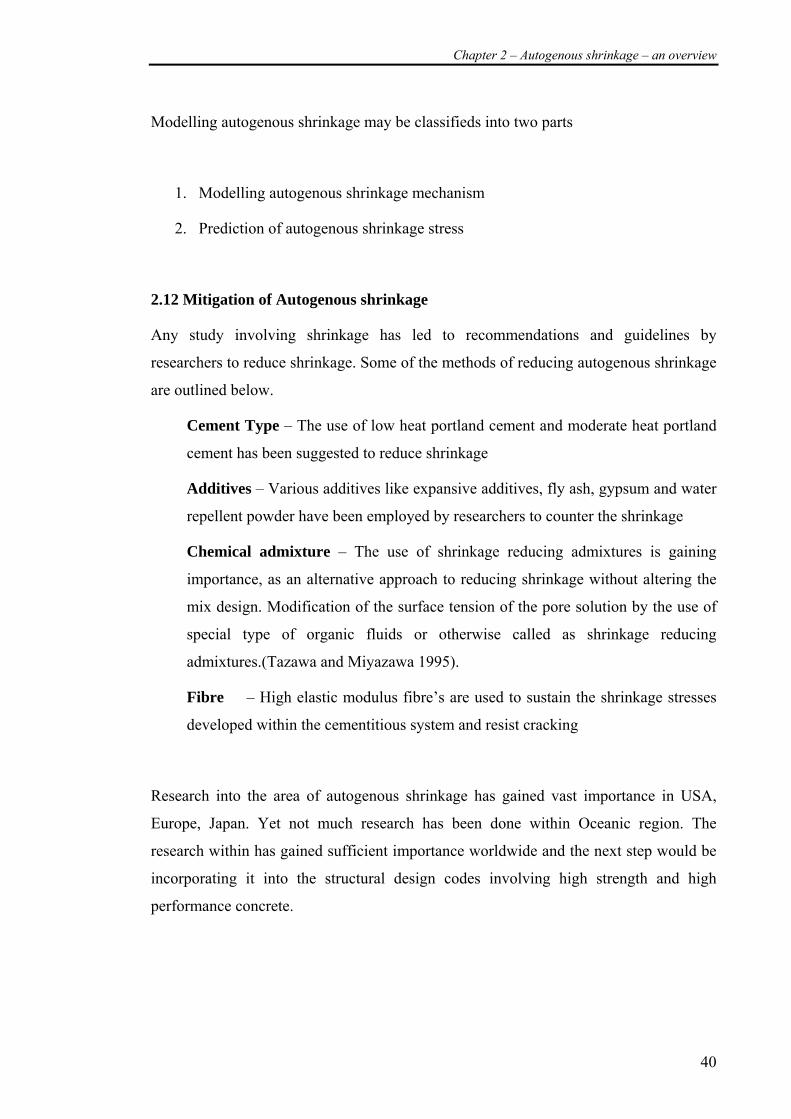
Chapter 2 – Autogenous shrinkage – an overview
40
Modelling autogenous shrinkage may be classifieds into two parts
1. Modelling autogenous shrinkage mechanism
2. Prediction of autogenous shrinkage stress
2.12 Mitigation of Autogenous shrinkage
Any study involving shrinkage has led to recommendations and guidelines by
researchers to reduce shrinkage. Some of the methods of reducing autogenous shrinkage
are outlined below.
Cement Type – The use of low heat portland cement and moderate heat portland
cement has been suggested to reduce shrinkage
Additives – Various additives like expansive additives, fly ash, gypsum and water
repellent powder have been employed by researchers to counter the shrinkage
Chemical admixture – The use of shrinkage reducing admixtures is gaining
importance, as an alternative approach to reducing shrinkage without altering the
mix design. Modification of the surface tension of the pore solution by the use of
special type of organic fluids or otherwise called as shrinkage reducing
admixtures.(Tazawa and Miyazawa 1995).
Fibre – High elastic modulus fibre’s are used to sustain the shrinkage stresses
developed within the cementitious system and resist cracking
Research into the area of autogenous shrinkage has gained vast importance in USA,
Europe, Japan. Yet not much research has been done within Oceanic region. The
research within has gained sufficient importance worldwide and the next step would be
incorporating it into the structural design codes involving high strength and high
performance concrete.
Chapter 2 – Autogenous shrinkage – an overview
41
2.13 Summary
Studies involving autogenous shrinkage have been undergoing for the last two decades,
with it gaining importance recently. Though there is a substantial importance being
given, fundamentals mechanisms of autogenous shrinkage are still not clear and well
defined at the micro-level and its relative impact macroscopically hence this current
study. This research is aimed at being a fundamental study into chemical shrinkage and
autogenous shrinkage of cementitious systems with mineral admixtures and re-
exploring the existing theories for the mechanism.

Chapter 2 – Autogenous shrinkage – an overview
42
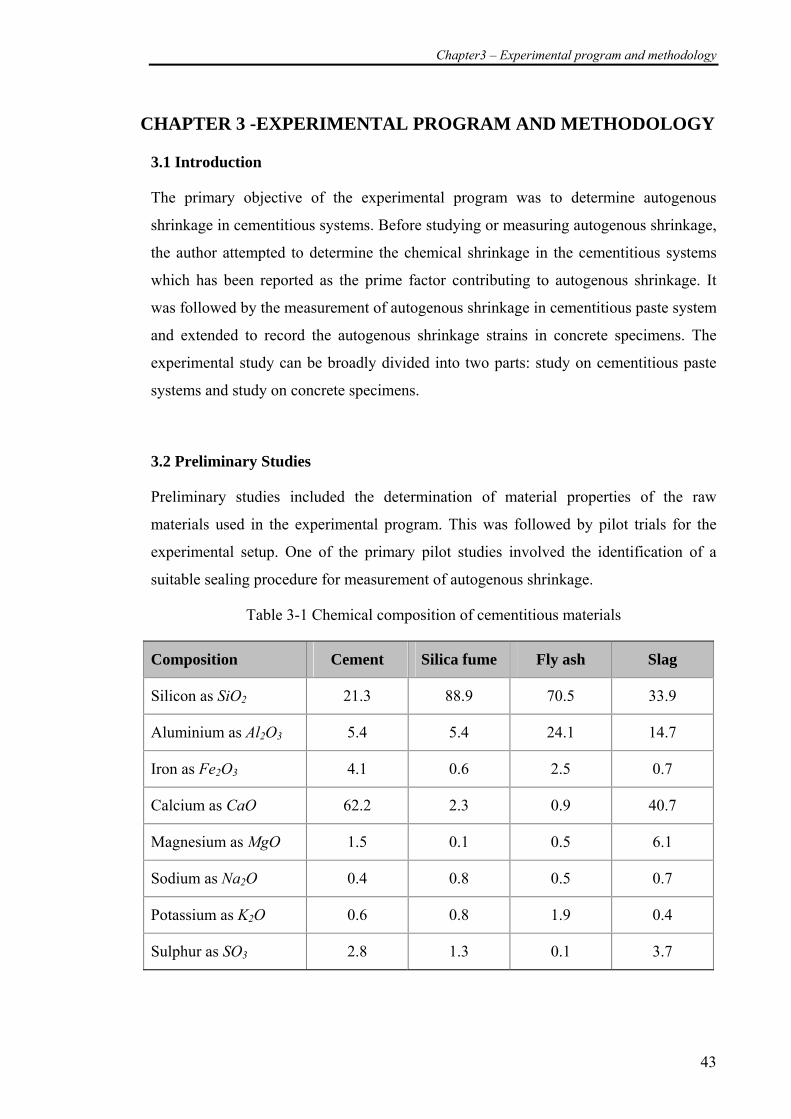
Chapter3 – Experimental program and methodology
43
CHAPTER 3 -EXPERIMENTAL PROGRAM AND METHODOLOGY
3.1 Introduction
The primary objective of the experimental program was to determine autogenous
shrinkage in cementitious systems. Before studying or measuring autogenous shrinkage,
the author attempted to determine the chemical shrinkage in the cementitious systems
which has been reported as the prime factor contributing to autogenous shrinkage. It
was followed by the measurement of autogenous shrinkage in cementitious paste system
and extended to record the autogenous shrinkage strains in concrete specimens. The
experimental study can be broadly divided into two parts: study on cementitious paste
systems and study on concrete specimens.
3.2 Preliminary Studies
Preliminary studies included the determination of material properties of the raw
materials used in the experimental program. This was followed by pilot trials for the
experimental setup. One of the primary pilot studies involved the identification of a
suitable sealing procedure for measurement of autogenous shrinkage.
Table 3-1 Chemical composition of cementitious materials
Composition Cement Silica fume Fly ash Slag
Silicon as SiO2 21.3 88.9 70.5 33.9
Aluminium as Al2O3 5.4 5.4 24.1 14.7
Iron as Fe2O3 4.1 0.6 2.5 0.7
Calcium as CaO 62.2 2.3 0.9 40.7
Magnesium as MgO 1.5 0.1 0.5 6.1
Sodium as Na2O 0.4 0.8 0.5 0.7
Potassium as K2O 0.6 0.8 1.9 0.4
Sulphur as SO3 2.8 1.3 0.1 3.7
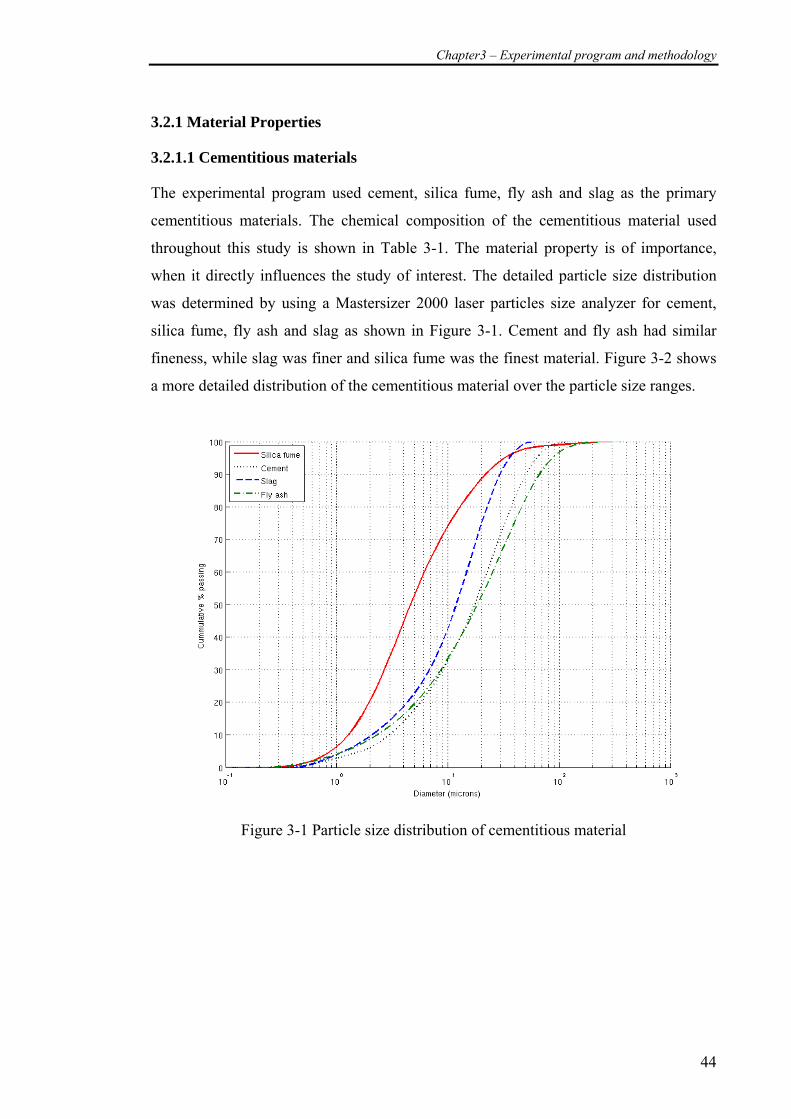
Chapter3 – Experimental program and methodology
44
3.2.1 Material Properties
3.2.1.1 Cementitious materials
The experimental program used cement, silica fume, fly ash and slag as the primary
cementitious materials. The chemical composition of the cementitious material used
throughout this study is shown in Table 3-1. The material property is of importance,
when it directly influences the study of interest. The detailed particle size distribution
was determined by using a Mastersizer 2000 laser particles size analyzer for cement,
silica fume, fly ash and slag as shown in Figure 3-1. Cement and fly ash had similar
fineness, while slag was finer and silica fume was the finest material. Figure 3-2 shows
a more detailed distribution of the cementitious material over the particle size ranges.
Figure 3-1 Particle size distribution of cementitious material

Chapter3 – Experimental program and methodology
45
Figure 3-2 Characteristic distribution of cementitious material (Particle size)
3.2.1.2 Aggregate
Locally available fine and coarse aggregate was used for the study. The specific gravity
and absorption measured for fine aggregate determined in accordance with ASTM C
128 were 2.62 and 2.00 % respectively, and for coarse aggregate, in accordance with
ASTM C127, were 2.82 and 1.3% respectively. Coarse aggregate had a nominal size of
10 mm while the gradation of the fine aggregate is shown in Figure 3-3.
3.2.1.3 Cement
Commercially available general purpose cement conforming to AS 3972 (1997) has
been used in this study. From the chemical composition shown in Table 3-1, the
potential bogue composition can be found and is shown in Table 3-2. Cement from a
single batch was used for the experiments. The fineness of cement was in the range of
350 -400 m2/kg. The relative density of cement determined using AS 3583.5 (1991) was
3.16. The fineness determined using AS 2350.9(2006) by the 45μm criterion was 8.5%
retained.
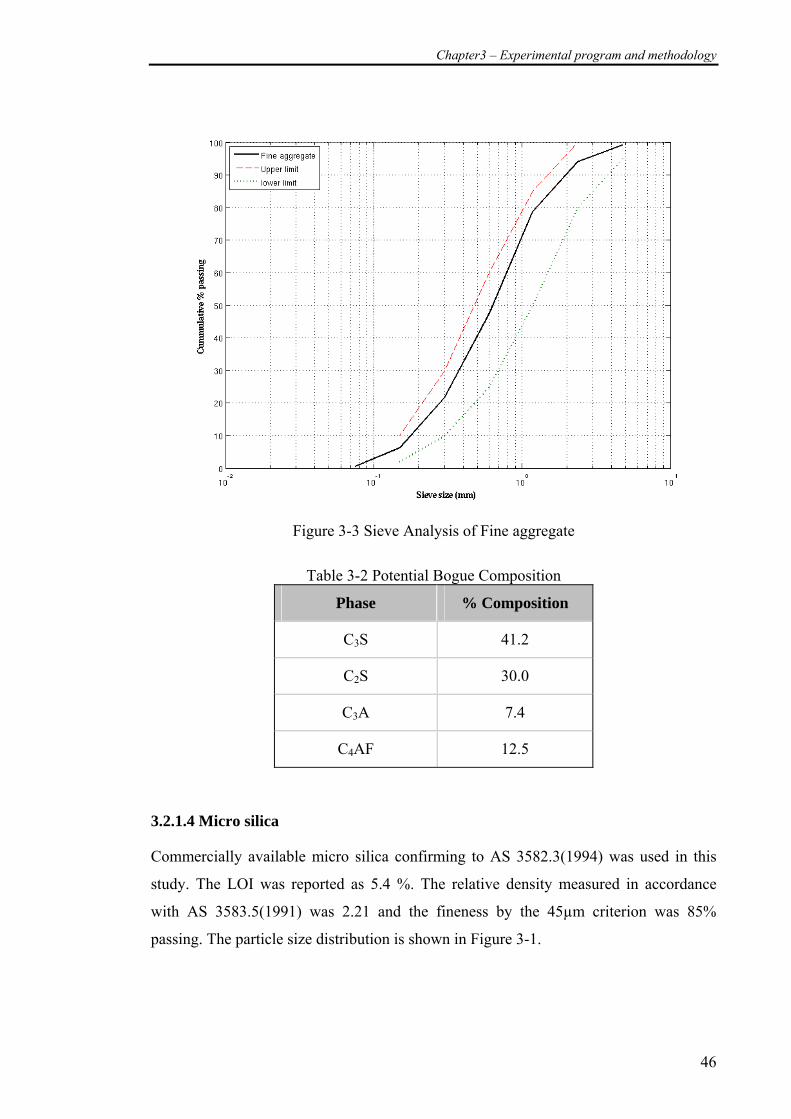
Chapter3 – Experimental program and methodology
46
Figure 3-3 Sieve Analysis of Fine aggregate
Table 3-2 Potential Bogue Composition
Phase % Composition
C3S 41.2
C2S 30.0
C3A 7.4
C4AF 12.5
3.2.1.4 Micro silica
Commercially available micro silica confirming to AS 3582.3(1994) was used in this
study. The LOI was reported as 5.4 %. The relative density measured in accordance
with AS 3583.5(1991) was 2.21 and the fineness by the 45µm criterion was 85%
passing. The particle size distribution is shown in Figure 3-1.
Chapter3 – Experimental program and methodology
47
3.2.1.5 Fly ash
Commercially available fly ash conforming to AS 3582.1 was used in this study. The
relative density of fly ash determined in accordance with AS 3585.5(1991) was 2.12 and
the fineness determined using AS 3583.1(1998) by the 45µm criterion was 84%
passing. The particle size distribution is shown in Figure 3-1.
3.2.1.6 Slag
Ground granulated blast furnace slag was provided by the Australian Slag Association.
The relative density of fly ash determined in accordance with AS 3585.5(1991) was
2.90 and the fineness determined using AS 3583.1(1998) by the 45 µm criterion was
99% passing. The particle size distribution is shown in Figure 3-1.
3.2.1.7 High range water reducer
Commercially available polycarboxylic based super plasticizer was used as a high range
water reducer. It conforms to AS 1478.1 Type HWR (2000).
3.2.2 Sealing of samples
The right type of sealing technique was to be determined for the measurement of
autogenous shrinkage. While complete sealing of a material is impossible, the goal was
to keep the loss of moisture to minimal and negligible compared to that of sample
exposed to an external environment with RH 50%. Trials were carried out with
polythene wraps, rubber sealants and aluminium foil tapes. After several trials, the
factors considered for suitability of the sealing method involved puncture resistance,
evaporation losses through the sealing membrane and ease of application. The
aluminium foil duct tape was concluded as the most suitable method of sealing for
measurement of autogenous shrinkage. This method of sealing necessitated that the
sample should have hardened to a sufficient extent before the sealing can be carried out.
Hence all sealing of samples was carried out at 24 hours from the time of adding mixing
water to the sample, except the ones with high replacements of fly ash where setting
was delayed hence sealing of the samples was possible only after 48 hours.
Chapter3 – Experimental program and methodology
48
3.3 Studies on Paste
Primary study was limited to only cement pastes, later extending the study on to
concrete samples. The two main parameters which were of interest in the cement paste
were namely chemical shrinkage and autogenous shrinkage.
3.3.1 Chemical shrinkage
The chemical shrinkage test method was based on ASTM C 1608 (2006). The test
involves a simple flat bottomed flask of 50 ml capacity filled with a cementitious paste
of known quantity. For reasons that will be discussed below the water cementitious ratio
in this study was fixed at 0.7. The prime objective of the test was to determine the actual
volume change associated with the reactions of cement and cementitious material.
Powers and Copeland (1959) demonstrated that at higher water-cement ratio, the time
required for curing to produce a discontinuous capillary pore system is much longer
than that at lower water cement ratio. The experimental method of determination of
chemical shrinkage requires the submergence of the sample under water, and the
capillary pores to be accessible and continuous so that no self-desiccation occurs within
the duration of the test. A discontinuous capillary network or self desiccation within the
sample would mask the true absolute volume change associated only with the hydration
reaction. Hence it becomes important that the measurement of chemical shrinkage is
not influenced by other physical effects within the sample. Hence the author believes
that paste with a high water cementitious ratio, when submerged under water under
continuous curing, has a very low possibility for the formation of a discontinuous
capillary pore network, which is more favourable to the accurate determination of
chemical shrinkage rather than a lower water-cementitious ratio mixture. For the
standard laboratory conditions and Type I cement with specific surface area of 1800
cm2/gm and water-cement ratio of 0.7, the duration required for formation of a
discontinuous capillary network was reported to be about 1 year of curing (Powers and
Copeland 1959). Therefore it is interpreted that water-cement ratio of 0.7 with today’s
modern cements, cured for 90 days should still have a continuous capillary pore system
and hydration proceeding unhindered. A detail of the chemical shrinkage test samples is
shown in Table 3-3.

Chapter3 – Experimental program and methodology
49
Sample Preparation
A paste mixture of a water-cementitious ratio of 0.7 was prepared with a cementitious
content of 200 gm and 140 ml of distilled water. About 0.5% by weight of cementitious
content of high range water reducer was added to the sample. The sample was then
mixed in a small paste mixer for a minute. It is understood that the sample would likely
have had enormous amount of air due to aeration effect of the mixing. When paste
mixtures with other mineral admixtures were prepared they were added as weight
replacements of the original cement content. Hence an OPC10SF07 mixture will be
prepared with 180gm of cement, 20 gm of silica fume and 140 ml of distilled water.
Similar procedure is adopted for fly ash and slag replacements.
Table 3-3 Nomenclature of chemical shrinkage test samples
Name Description
OPC07 Ordinary Portland cement with w/c 0.7
OPC10SF07 OPC with 10% replacement of SF and w/cm 0.7
OPC30FA07 OPC with 30% replacement of fly ash and w/cm 0.7
OPC50FA07 OPC with 50% replacement of fly ash and w/cm 0.7
OPC70FA07 OPC with 70% replacement of fly ash and w/cm 0.7
OPC30SL07 OPC with 30% replacement of Slag and w/cm 0.7
OPC50SL07 OPC with 50% replacement of Slag and w/cm 0.7
OPC70SL07 OPC with 70% replacement of Slag and w/cm 0.7
Experimental Procedure
10 Flat bottomed 50 ml flasks were washed with distilled water and dried. These were
then left in the environmental chamber so as to be in equilibrium with its temperature.
The environmental chamber is maintained at a constant temperature and relative
humidity of 23.5°C and 50% respectively. Of the 10 flasks, 9 flasks were filled with the
actual sample, while the 10th was filled with a replica to monitor temperature within the
sample and water. Each sample was filled with about 15gm of the paste. The sample
was then allowed to stand for about 45 minutes. This was done so that the sample was

Chapter3 – Experimental program and methodology
50
given a certain time to settle and allow for the visible air bubbles to disappear. Later the
vials were topped with clean distilled de-aired water with a temperature in equilibrium
with the environmental chamber. Utmost care was taken not to disturb the sample while
it was filled with distilled water from the top. Pouring of the water was done at a
minimal rate thereby avoiding turbulence of the paste sample. Once the vials were
topped with distilled water, it is then sealed with rubber cork (stopper) and a measuring
pipette whose accuracy is 0.01 ml. A rubber seal was also placed with liquid rubber
around the rubber cork and the glass vial from the top and at the junction of the pipette
and stopper. An illustration of the setup for one of the flasks is shown in Figure 3-4. As
soon as the pipette is placed, a small drop of paraffin oil is place on top of the water
level in the pipette.
Figure 3-4 Illustration of the Chemical shrinkage test setup
Observations
Observations were commenced from 1.5 hours from the start of contact of cement with
water i.e., from the moment the mixing water comes in contact with the dry cement.
This ‘time’ of initial start of 1.5 hours was to allow for sufficient time for the cement
paste to be mixed, place in the vial, topped with more distilled water, sealed with the
rubber stopper and the pipette with a drop of paraffin oil inserted. Measurements during
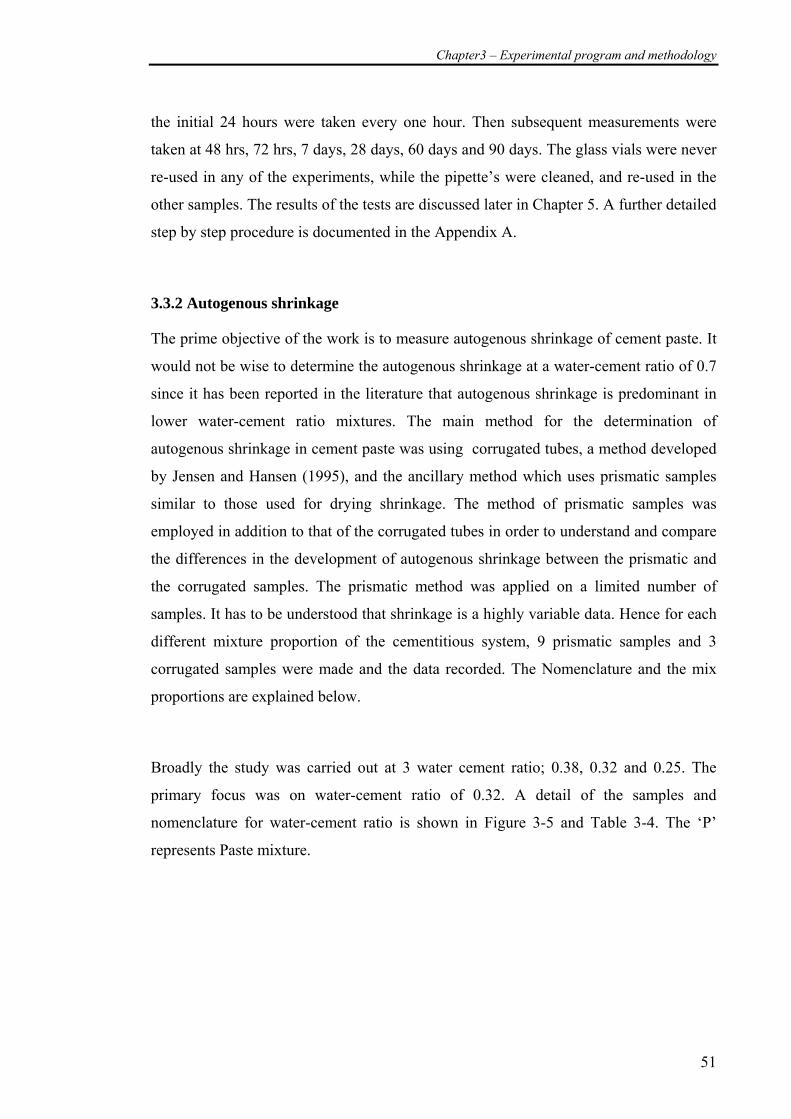
Chapter3 – Experimental program and methodology
51
the initial 24 hours were taken every one hour. Then subsequent measurements were
taken at 48 hrs, 72 hrs, 7 days, 28 days, 60 days and 90 days. The glass vials were never
re-used in any of the experiments, while the pipette’s were cleaned, and re-used in the
other samples. The results of the tests are discussed later in Chapter 5. A further detailed
step by step procedure is documented in the Appendix A.
3.3.2 Autogenous shrinkage
The prime objective of the work is to measure autogenous shrinkage of cement paste. It
would not be wise to determine the autogenous shrinkage at a water-cement ratio of 0.7
since it has been reported in the literature that autogenous shrinkage is predominant in
lower water-cement ratio mixtures. The main method for the determination of
autogenous shrinkage in cement paste was using corrugated tubes, a method developed
by Jensen and Hansen (1995), and the ancillary method which uses prismatic samples
similar to those used for drying shrinkage. The method of prismatic samples was
employed in addition to that of the corrugated tubes in order to understand and compare
the differences in the development of autogenous shrinkage between the prismatic and
the corrugated samples. The prismatic method was applied on a limited number of
samples. It has to be understood that shrinkage is a highly variable data. Hence for each
different mixture proportion of the cementitious system, 9 prismatic samples and 3
corrugated samples were made and the data recorded. The Nomenclature and the mix
proportions are explained below.
Broadly the study was carried out at 3 water cement ratio; 0.38, 0.32 and 0.25. The
primary focus was on water-cement ratio of 0.32. A detail of the samples and
nomenclature for water-cement ratio is shown in Figure 3-5 and Table 3-4. The ‘P’
represents Paste mixture.
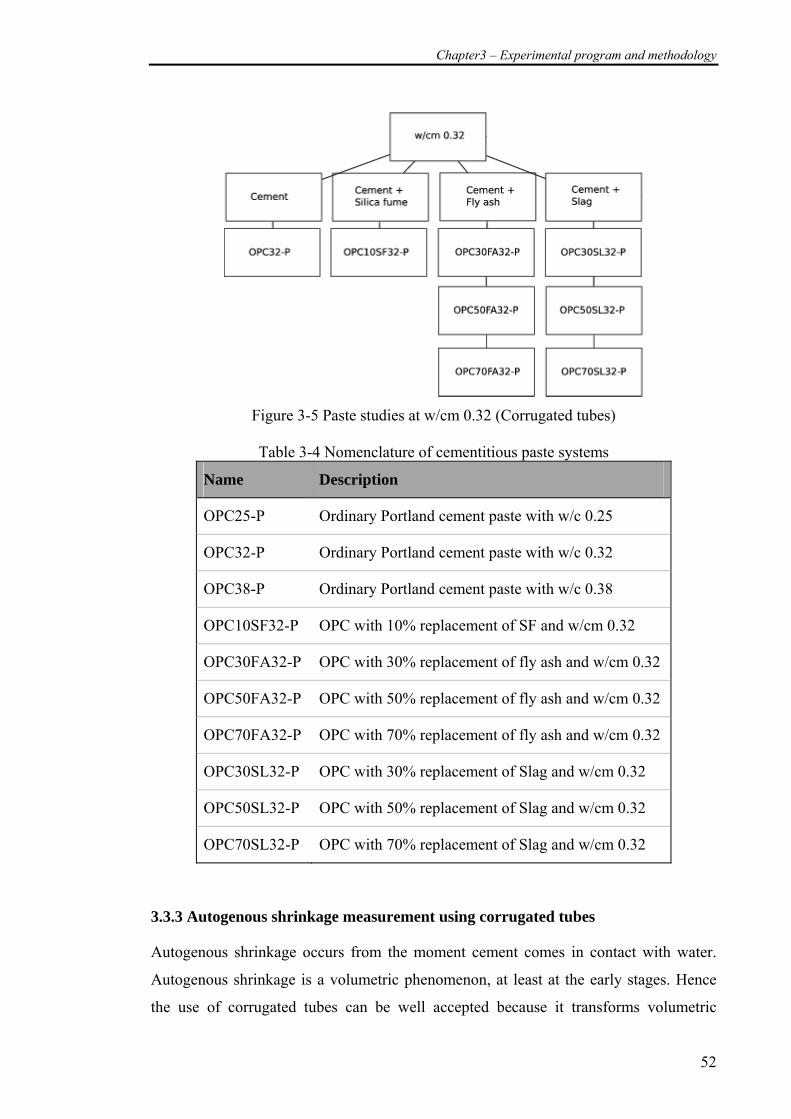
Chapter3 – Experimental program and methodology
52
Figure 3-5 Paste studies at w/cm 0.32 (Corrugated tubes)
Table 3-4 Nomenclature of cementitious paste systems
Name Description
OPC25-P Ordinary Portland cement paste with w/c 0.25
OPC32-P Ordinary Portland cement paste with w/c 0.32
OPC38-P Ordinary Portland cement paste with w/c 0.38
OPC10SF32-P OPC with 10% replacement of SF and w/cm 0.32
OPC30FA32-P OPC with 30% replacement of fly ash and w/cm 0.32
OPC50FA32-P OPC with 50% replacement of fly ash and w/cm 0.32
OPC70FA32-P OPC with 70% replacement of fly ash and w/cm 0.32
OPC30SL32-P OPC with 30% replacement of Slag and w/cm 0.32
OPC50SL32-P OPC with 50% replacement of Slag and w/cm 0.32
OPC70SL32-P OPC with 70% replacement of Slag and w/cm 0.32
3.3.3 Autogenous shrinkage measurement using corrugated tubes
Autogenous shrinkage occurs from the moment cement comes in contact with water.
Autogenous shrinkage is a volumetric phenomenon, at least at the early stages. Hence
the use of corrugated tubes can be well accepted because it transforms volumetric
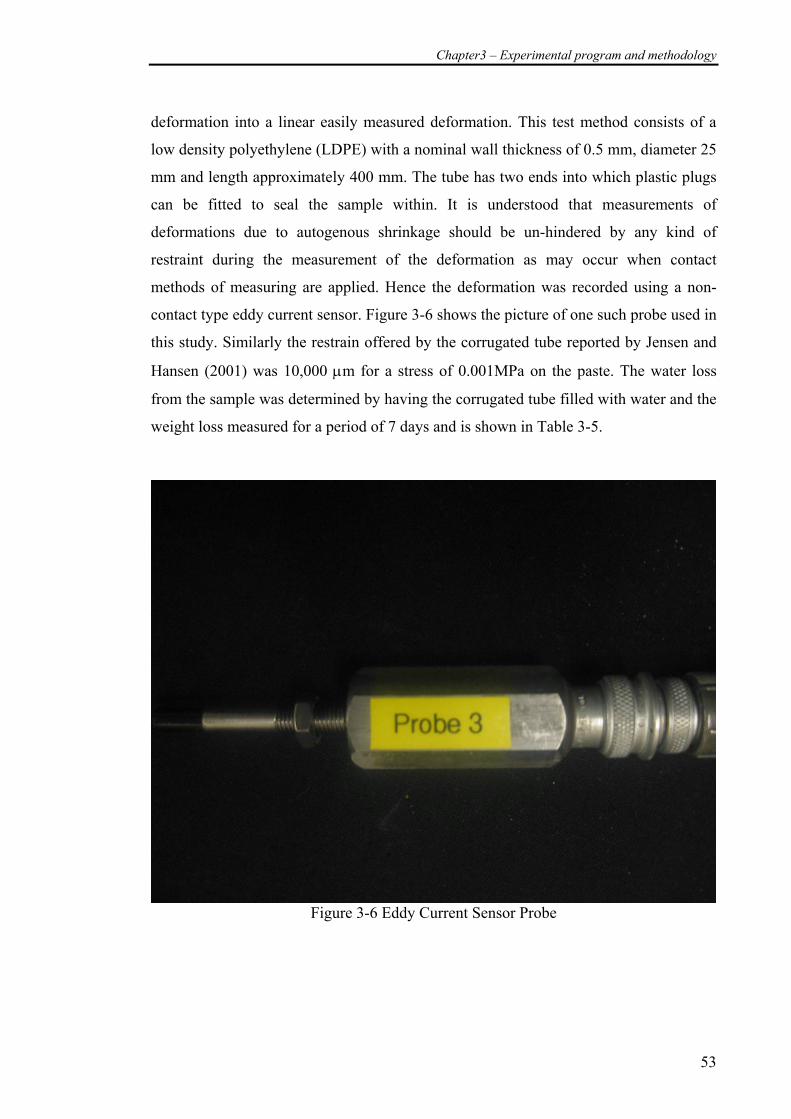
Chapter3 – Experimental program and methodology
53
deformation into a linear easily measured deformation. This test method consists of a
low density polyethylene (LDPE) with a nominal wall thickness of 0.5 mm, diameter 25
mm and length approximately 400 mm. The tube has two ends into which plastic plugs
can be fitted to seal the sample within. It is understood that measurements of
deformations due to autogenous shrinkage should be un-hindered by any kind of
restraint during the measurement of the deformation as may occur when contact
methods of measuring are applied. Hence the deformation was recorded using a non-
contact type eddy current sensor. Figure 3-6 shows the picture of one such probe used in
this study. Similarly the restrain offered by the corrugated tube reported by Jensen and
Hansen (2001) was 10,000 μm for a stress of 0.001MPa on the paste. The water loss
from the sample was determined by having the corrugated tube filled with water and the
weight loss measured for a period of 7 days and is shown in Table 3-5.
Figure 3-6 Eddy Current Sensor Probe
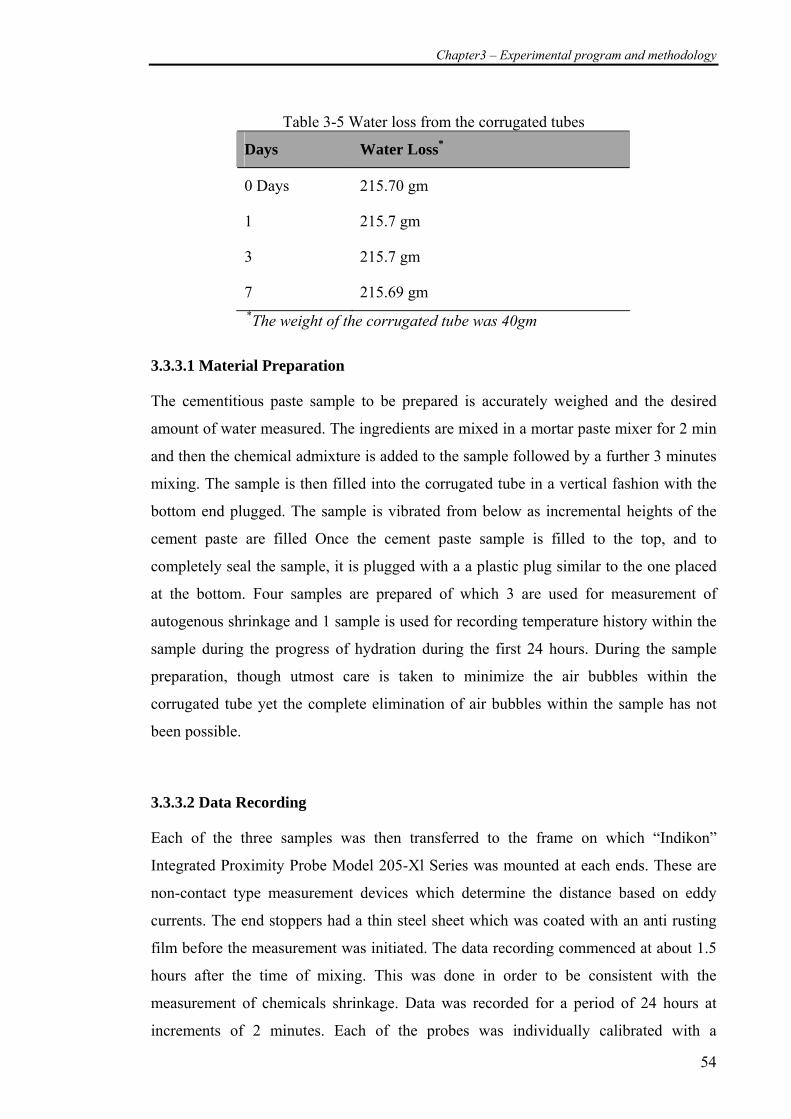
Chapter3 – Experimental program and methodology
54
Table 3-5 Water loss from the corrugated tubes
Days Water Loss*
0 Days 215.70 gm
1 215.7 gm
3 215.7 gm
7 215.69 gm *The weight of the corrugated tube was 40gm
3.3.3.1 Material Preparation
The cementitious paste sample to be prepared is accurately weighed and the desired
amount of water measured. The ingredients are mixed in a mortar paste mixer for 2 min
and then the chemical admixture is added to the sample followed by a further 3 minutes
mixing. The sample is then filled into the corrugated tube in a vertical fashion with the
bottom end plugged. The sample is vibrated from below as incremental heights of the
cement paste are filled Once the cement paste sample is filled to the top, and to
completely seal the sample, it is plugged with a a plastic plug similar to the one placed
at the bottom. Four samples are prepared of which 3 are used for measurement of
autogenous shrinkage and 1 sample is used for recording temperature history within the
sample during the progress of hydration during the first 24 hours. During the sample
preparation, though utmost care is taken to minimize the air bubbles within the
corrugated tube yet the complete elimination of air bubbles within the sample has not
been possible.
3.3.3.2 Data Recording
Each of the three samples was then transferred to the frame on which “Indikon”
Integrated Proximity Probe Model 205-Xl Series was mounted at each ends. These are
non-contact type measurement devices which determine the distance based on eddy
currents. The end stoppers had a thin steel sheet which was coated with an anti rusting
film before the measurement was initiated. The data recording commenced at about 1.5
hours after the time of mixing. This was done in order to be consistent with the
measurement of chemicals shrinkage. Data was recorded for a period of 24 hours at
increments of 2 minutes. Each of the probes was individually calibrated with a
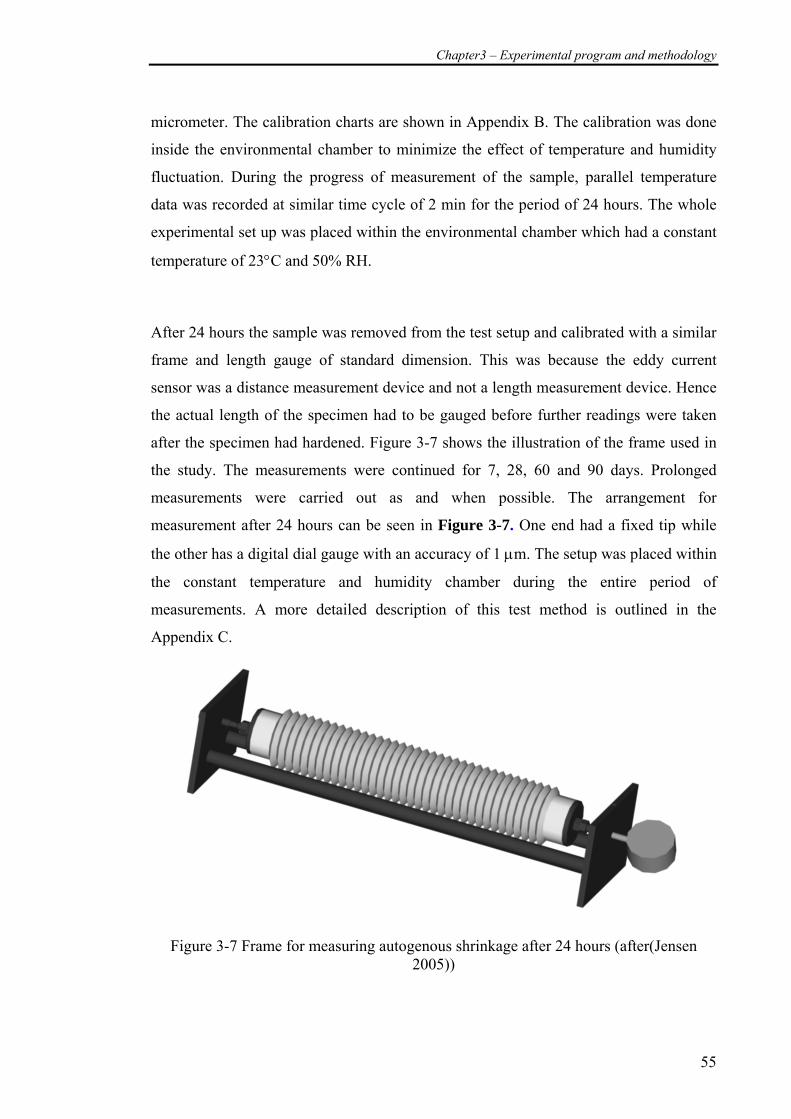
Chapter3 – Experimental program and methodology
55
micrometer. The calibration charts are shown in Appendix B. The calibration was done
inside the environmental chamber to minimize the effect of temperature and humidity
fluctuation. During the progress of measurement of the sample, parallel temperature
data was recorded at similar time cycle of 2 min for the period of 24 hours. The whole
experimental set up was placed within the environmental chamber which had a constant
temperature of 23°C and 50% RH.
After 24 hours the sample was removed from the test setup and calibrated with a similar
frame and length gauge of standard dimension. This was because the eddy current
sensor was a distance measurement device and not a length measurement device. Hence
the actual length of the specimen had to be gauged before further readings were taken
after the specimen had hardened. Figure 3-7 shows the illustration of the frame used in
the study. The measurements were continued for 7, 28, 60 and 90 days. Prolonged
measurements were carried out as and when possible. The arrangement for
measurement after 24 hours can be seen in Figure 3-7. One end had a fixed tip while
the other has a digital dial gauge with an accuracy of 1 μm. The setup was placed within
the constant temperature and humidity chamber during the entire period of
measurements. A more detailed description of this test method is outlined in the
Appendix C.
Figure 3-7 Frame for measuring autogenous shrinkage after 24 hours (after(Jensen
2005))
Chapter3 – Experimental program and methodology
56
3.3.3.3 Measurement of autogenous shrinkage using prismatic samples for cement
pastes
Prismatic samples of dimension 40 mm x 40 mm x 160 mm were used for this study.
This sample size was in accordance with AS 2350.13 (2006) –test method for drying
shrinkage in mortars. Gauge studs in accordance with AS1012.13. were used. A vertical
comparator (shown in Figure 3-8) was used with a digital dial gauge of 1μm accuracy
and a standard length gauge of 150mm. Cement samples were filled into the mould
immediately after mixing. The moulds were then covered with a plastic film to
minimize the evaporation losses. The samples were demoulded after 24 hours. They
were then sealed with a layer of aluminium foil tape all around. The samples were then
measured on the vertical comparator at 1, 3, 7, 28 and 90 days from the date of casting.
The mass of the sample was also noted at each duration to monitor the mass loss. Too
frequent measurements were avoided because of fear that the end studs may be
disturbed during measurement. The samples were kept in sealed plastic bags in the
environmental chamber during the entire test duration. This experiment was also done
in order to explore if there was a possible link between measurements in corrugated
tubes and prismatic samples as far as measuring autogenous shrinkage of paste system
is concerned.

Chapter3 – Experimental program and methodology
57
Figure 3-8 Vertical comparator for measurement of autogenous shrinkage in paste
samples
3.4 Studies on Concrete
Studies on concrete were limited to measurement of autogenous shrinkage. But the
study was also conducted in parallel with measuring drying shrinkage and compressive
strength.
3.4.1 Mixture Proportions
Similar to the study on cementitious pastes, the study was extended to concrete. The
study was conducted at a water cement ratio of 0.32. It was then extended partially to
water cement ratio of 0.25. The various mixture proportions are given below in the
flowchart (refer to Figure 3-9 and Figure 3-10). A detail of the mixture proportion
adopted is also shown in Table 3-6.
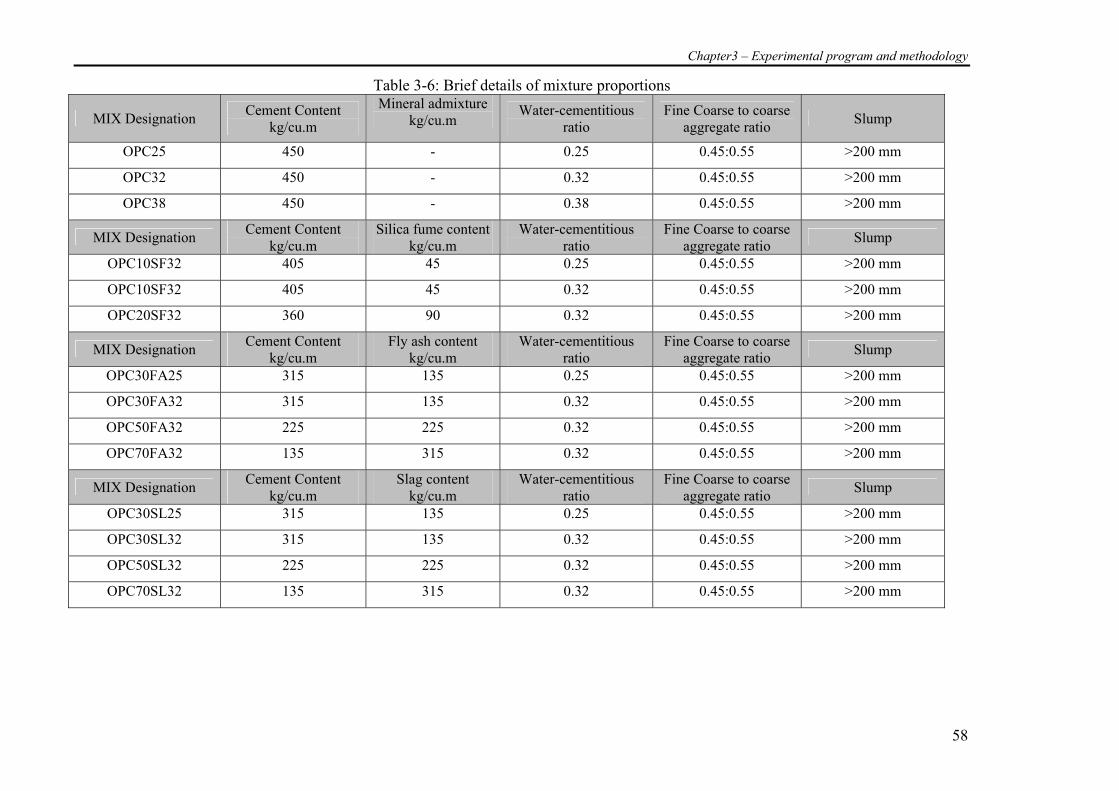
Chapter3 – Experimental program and methodology
58
Table 3-6: Brief details of mixture proportions
MIX Designation Cement Content kg/cu.m
Mineral admixture kg/cu.m
Water-cementitious ratio
Fine Coarse to coarse aggregate ratio Slump
OPC25 450 - 0.25 0.45:0.55 >200 mm
OPC32 450 - 0.32 0.45:0.55 >200 mm
OPC38 450 - 0.38 0.45:0.55 >200 mm
MIX Designation Cement Content kg/cu.m
Silica fume content kg/cu.m
Water-cementitious ratio
Fine Coarse to coarse aggregate ratio Slump
OPC10SF32 405 45 0.25 0.45:0.55 >200 mm
OPC10SF32 405 45 0.32 0.45:0.55 >200 mm
OPC20SF32 360 90 0.32 0.45:0.55 >200 mm
MIX Designation Cement Content kg/cu.m
Fly ash content kg/cu.m
Water-cementitious ratio
Fine Coarse to coarse aggregate ratio Slump
OPC30FA25 315 135 0.25 0.45:0.55 >200 mm
OPC30FA32 315 135 0.32 0.45:0.55 >200 mm
OPC50FA32 225 225 0.32 0.45:0.55 >200 mm
OPC70FA32 135 315 0.32 0.45:0.55 >200 mm
MIX Designation Cement Content kg/cu.m
Slag content kg/cu.m
Water-cementitious ratio
Fine Coarse to coarse aggregate ratio Slump
OPC30SL25 315 135 0.25 0.45:0.55 >200 mm
OPC30SL32 315 135 0.32 0.45:0.55 >200 mm
OPC50SL32 225 225 0.32 0.45:0.55 >200 mm
OPC70SL32 135 315 0.32 0.45:0.55 >200 mm
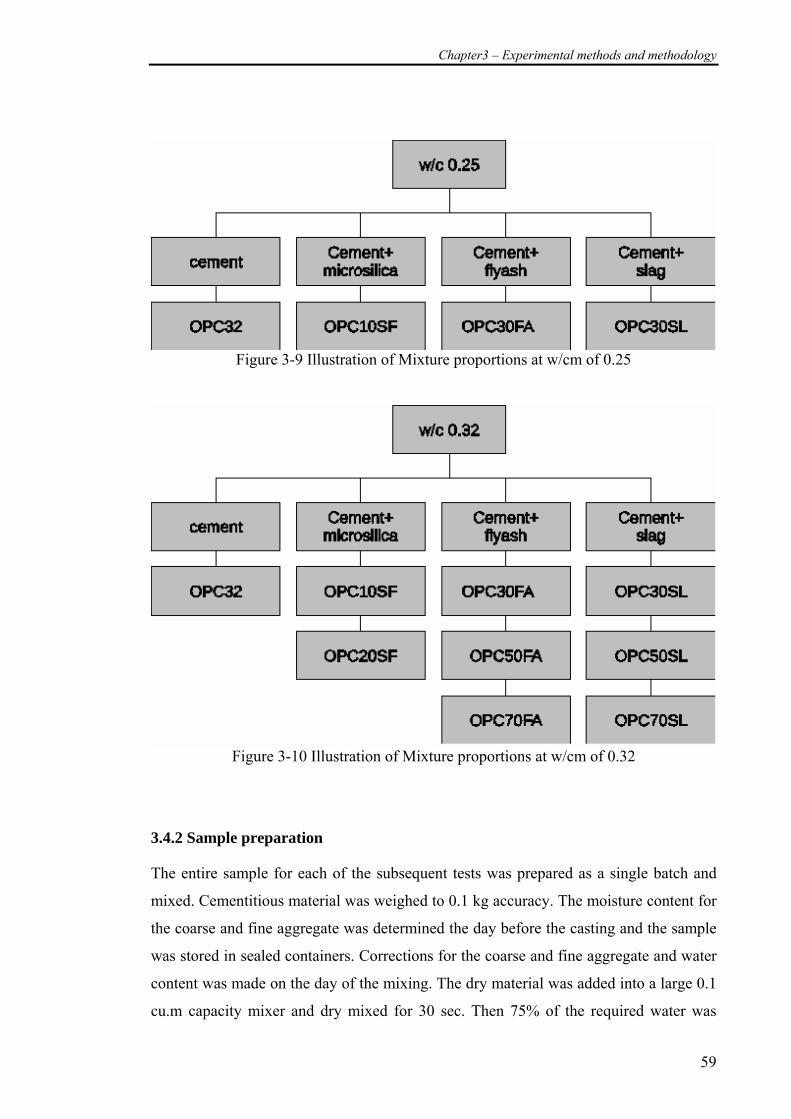
Chapter3 – Experimental methods and methodology
59
Figure 3-9 Illustration of Mixture proportions at w/cm of 0.25
Figure 3-10 Illustration of Mixture proportions at w/cm of 0.32
3.4.2 Sample preparation
The entire sample for each of the subsequent tests was prepared as a single batch and
mixed. Cementitious material was weighed to 0.1 kg accuracy. The moisture content for
the coarse and fine aggregate was determined the day before the casting and the sample
was stored in sealed containers. Corrections for the coarse and fine aggregate and water
content was made on the day of the mixing. The dry material was added into a large 0.1
cu.m capacity mixer and dry mixed for 30 sec. Then 75% of the required water was
Chapter3 – Experimental methods and methodology
60
added and mixed for a further 30 sec. HRWR was added to the mixture to
predetermined dosage and the remaining water added. The dosage of the admixture was
adjusted for a slump of about 200 mm or greater. This procedure was repeated for each
of the mixtures.
3.4.3 Casting of samples
Concrete was placed into 9 autogenous shrinkage moulds, 3 drying shrinkage moulds, 9
compressive strength moulds. Samples were also cast for tensile strength and Elastic
modulus as a supplementary study. The samples were vibrated and placed into the
moulds with a table vibrator. After placing concrete in the moulds they were covered
with a polyethylene sheet to minimize the moisture loss. All moulds were applied with a
suitable release agent prior to sample being cast. The moulds for drying shrinkage and
autogenous shrinkage were fitted with end studs prior to placement.
3.4.4 De-moulding
All samples were demoulded after 24 hours except for the cementitious system with fly
ash at replacements of 70% where the concrete had not achieved sufficient strength at
24 hours to de-mould the samples. In that case, OPC70FA32 was demoulded after 48
hours.
3.4.5 Autogenous shrinkage specimens
Measurement of autogenous shrinkage in concrete specimens was limited to prismatic
samples owing to the difficulty in fabricating a larger corrugated tube and the effect of
aggregate size on the behaviour of the moulds. For corrugated tubes to be successfully
used for concrete specimens we would require a much larger diameter size corrugated
tube such that the effect of aggregate on the specimen moulds can be minimised. The
prismatic samples were in accordance with ASTM C 490 (1996), i.e., 75 mm x 75 mm x
285 mm prisms with a standard gauge length of 250 mm. Hence with only prismatic
samples available the measurement of the strains commenced from 24±2 hours after the
time of casting. The samples after demoulding were sealed with the same aluminium
foil tape as was used in the plain cement paste samples. After sealing, the mass of the
sample was recorded to an accuracy of 0.01gm. The samples were then transferred to
the humidity chamber, were the first measurements of strain was made with a vertical

Chapter3 – Experimental methods and methodology
61
comparator. A horizontal comparator was avoided due to the thickness of the
aluminium foil tape not permitting to place the mould correctly on the comparator. The
arrangement for the vertical comparator is shown in Figure 3-11. The samples were then
left within the environmental chamber which was maintained at 23.5°C and a constant
humidity of 50%. Further measurement of autogenous shrinkage was carried out at 7
days, 28 days, ~90 days and ~1 year. Such a long term measurement was carried out as
it was believed that the autogenous shrinkage beyond the point of 28 days could be of
importance as to its effect and magnitude.
Figure 3-11 Vertical Comparator with length gauge for measurement of autogenous
shrinkage in concrete
3.4.6 Drying shrinkage
In addition to autogenous shrinkage, drying shrinkage was measured for each of the
mixture proportions. While one may argue the necessity for measurement of drying
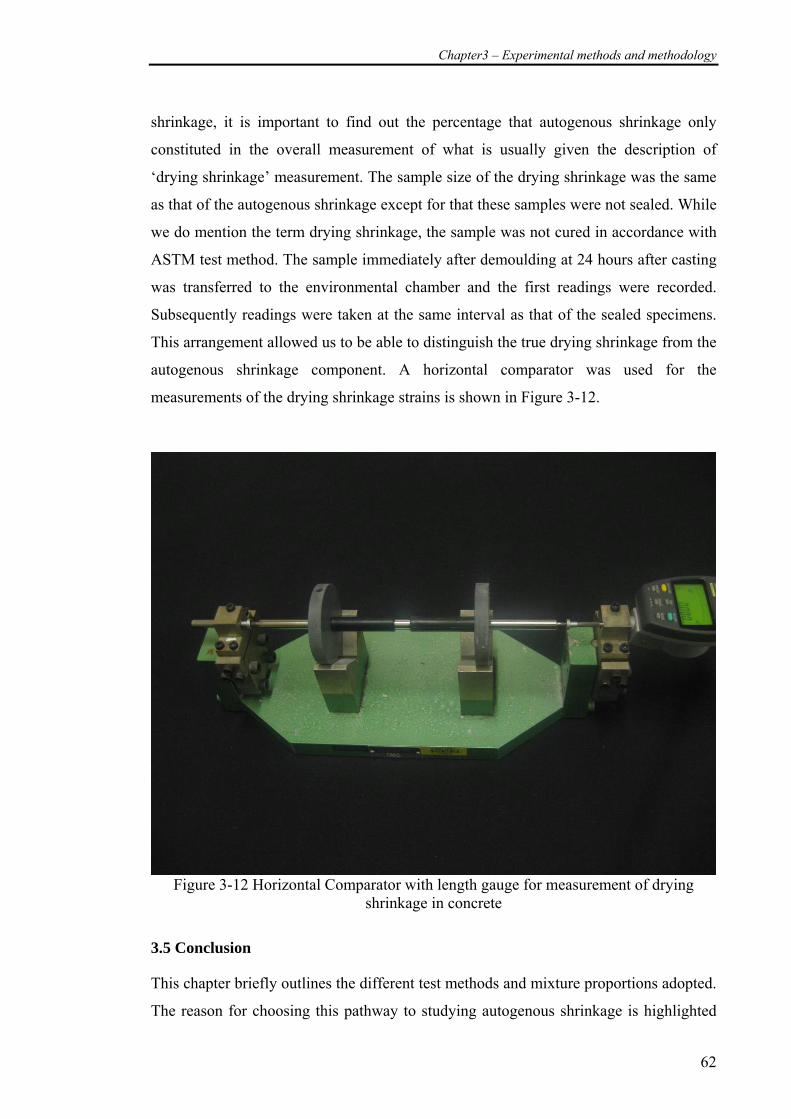
Chapter3 – Experimental methods and methodology
62
shrinkage, it is important to find out the percentage that autogenous shrinkage only
constituted in the overall measurement of what is usually given the description of
‘drying shrinkage’ measurement. The sample size of the drying shrinkage was the same
as that of the autogenous shrinkage except for that these samples were not sealed. While
we do mention the term drying shrinkage, the sample was not cured in accordance with
ASTM test method. The sample immediately after demoulding at 24 hours after casting
was transferred to the environmental chamber and the first readings were recorded.
Subsequently readings were taken at the same interval as that of the sealed specimens.
This arrangement allowed us to be able to distinguish the true drying shrinkage from the
autogenous shrinkage component. A horizontal comparator was used for the
measurements of the drying shrinkage strains is shown in Figure 3-12.
Figure 3-12 Horizontal Comparator with length gauge for measurement of drying
shrinkage in concrete
3.5 Conclusion
This chapter briefly outlines the different test methods and mixture proportions adopted.
The reason for choosing this pathway to studying autogenous shrinkage is highlighted
Chapter3 – Experimental methods and methodology
63
and the author strongly believes that a complete and exhaustive experimental method if
adopted to study all the parameters influencing the autogenous shrinkage would only
make the experimental program too complicated and time consuming. To further adopt
an alternative approach, the experimental method is supported by a numerical
simulation of the hydration of the cementitious system where possible to bridge the gap
between the results obtained and the factors causing autogenous shrinkage. The details
of the numerical simulation program are explained in the following chapter.

Chapter3 – Experimental methods and methodology
64
Chapter4 – Numerical simulation using ‘CEMHYD3D’
65
CHAPTER 4 -NUMERICAL SIMULATION USING ‘CEMHYD3D’
4.1 Introduction
CEMHYD3D is used as a tool to model the microstructure of a hydrating cementitious
paste in order to reveal vital information and better interpret experimental results. This
chapter is a continuation to the earlier chapter on experimental methodology.
4.2 What is CEMHYD3D?
CEMHYD3D is acronym for Cement Hydration 3D model developed by National
Institute of Standards and Testing (NIST), USA with more than a decade of research in
numerical simulation of cement hydration. Continuous research is ongoing into the
development of a complete and robust model to predict cement hydration and its
microstructure characteristics.
4.3 Background
Extensive physical testing of the properties of cement is carried out at most concrete
materials laboratories worldwide. The need for a virtual test environment was felt, and
led to the formation of a Virtual Cement and Concrete Testing Laboratory (VCCTL) in
the USA. This was to create a database of various cements used in the US and undertake
virtual testing the properties of these cements and compare them with the experimental
data. CEMHYD3D is a major part of this virtual testing program which helps in
establishing the degree of hydration, heat of hydration, chemical shrinkage, setting time,
compressive strength development, and pore solution concentration provided accurate
characterization of the initial material properties are carried out (Bentz, Haecker et al.
2002). The model or modified versions of the model has been extended to predict Rapid
Chloride permeability (Bentz 2007), capillary porosity repercolation / repercolation in
hydrating cement pastes (Bentz 2006), slag hydration (Chen 2006) and transport
properties of concrete(Bentz 2009). The model is currently being widely used among
researchers and industry partners from 60 countries (referenced from the usage statistics
of VCCTL of 2008). An overview of the VCCTL is shown below
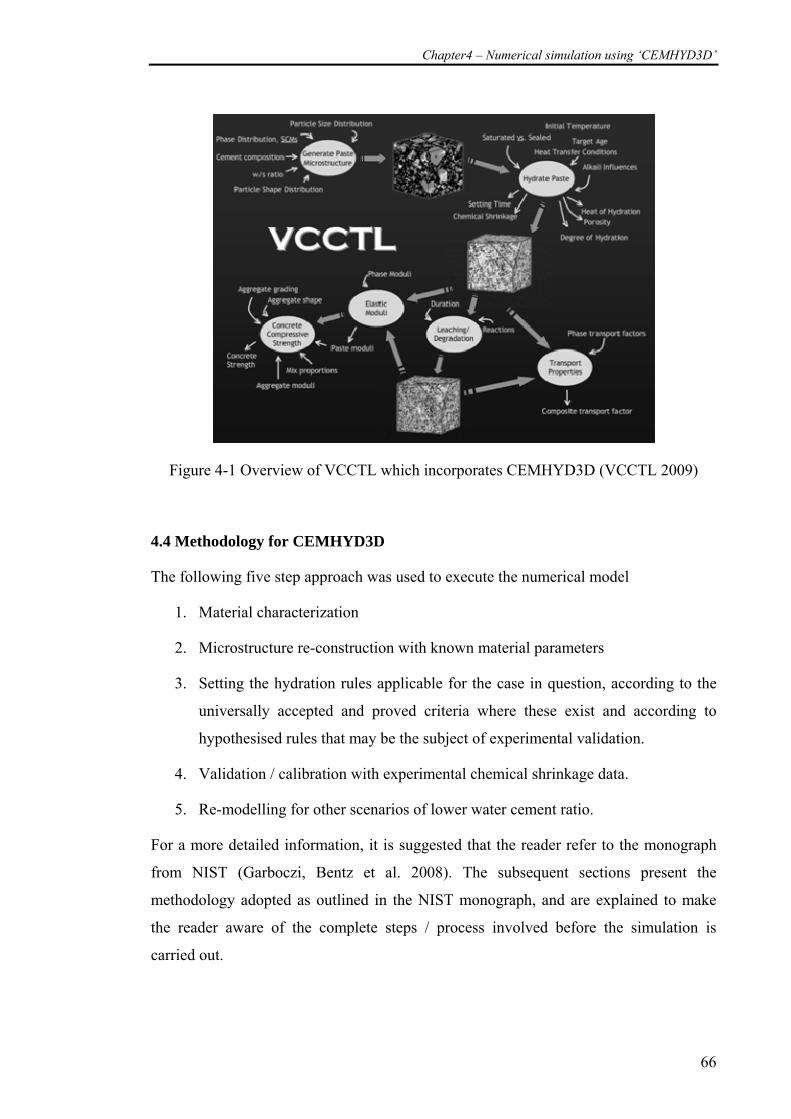
Chapter4 – Numerical simulation using ‘CEMHYD3D’
66
Figure 4-1 Overview of VCCTL which incorporates CEMHYD3D (VCCTL 2009)
4.4 Methodology for CEMHYD3D
The following five step approach was used to execute the numerical model
1. Material characterization
2. Microstructure re-construction with known material parameters
3. Setting the hydration rules applicable for the case in question, according to the
universally accepted and proved criteria where these exist and according to
hypothesised rules that may be the subject of experimental validation.
4. Validation / calibration with experimental chemical shrinkage data.
5. Re-modelling for other scenarios of lower water cement ratio.
For a more detailed information, it is suggested that the reader refer to the monograph
from NIST (Garboczi, Bentz et al. 2008). The subsequent sections present the
methodology adopted as outlined in the NIST monograph, and are explained to make
the reader aware of the complete steps / process involved before the simulation is
carried out.
Chapter4 – Numerical simulation using ‘CEMHYD3D’
67
4.4.1 Material characterisation
In order for a better modelling of the actual hydration process it is necessary to have
valid and realistic information regarding
1. Particle size distribution
2. Phase composition
3. Correlation function for each phase in the cement
4.4.1.1 Particle size distribution
The cumulative particle size distribution (PSD) for cement, silica fume, fly ash and slag
are shown in Chapter 3. This data is used to arrive at the particle size distribution for
discrete particle sizes of diameter 1 to 36 µm to be incorporated in the microstructure.
These particles are voxel particles (a voxel is digitized cube of 1µm x 1µm x 1µm). For
a finite volume of 100µm x 100µm x 100µm in the microstructure there would be only a
deterministic value of the number of particles, that may exist in that volume, from each
particle size for any of cement, silica fume, fly ash and slag at a given water-
cementitious ratio and desired replacement of mineral admixture. A typical discretized
number of particles available in one finite size volume (i.e., 100µm x 100µm x 100µm)
of a cement paste with water-cement ratio 0.7 and PSD as in Figure 3-1 is given below
in Table 4-1.
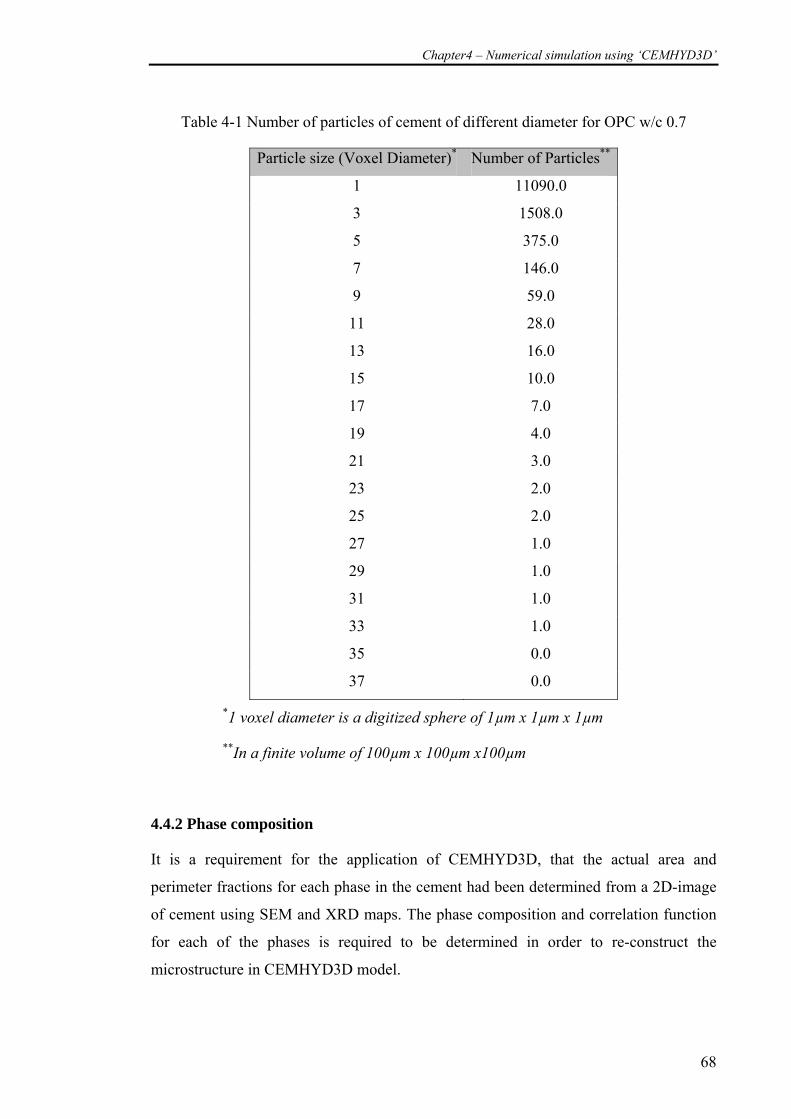
Chapter4 – Numerical simulation using ‘CEMHYD3D’
68
Table 4-1 Number of particles of cement of different diameter for OPC w/c 0.7
Particle size (Voxel Diameter)* Number of Particles**
1 11090.0
3 1508.0
5 375.0
7 146.0
9 59.0
11 28.0
13 16.0
15 10.0
17 7.0
19 4.0
21 3.0
23 2.0
25 2.0
27 1.0
29 1.0
31 1.0
33 1.0
35 0.0
37 0.0
*1 voxel diameter is a digitized sphere of 1µm x 1µm x 1µm
**In a finite volume of 100µm x 100µm x100µm
4.4.2 Phase composition
It is a requirement for the application of CEMHYD3D, that the actual area and
perimeter fractions for each phase in the cement had been determined from a 2D-image
of cement using SEM and XRD maps. The phase composition and correlation function
for each of the phases is required to be determined in order to re-construct the
microstructure in CEMHYD3D model.
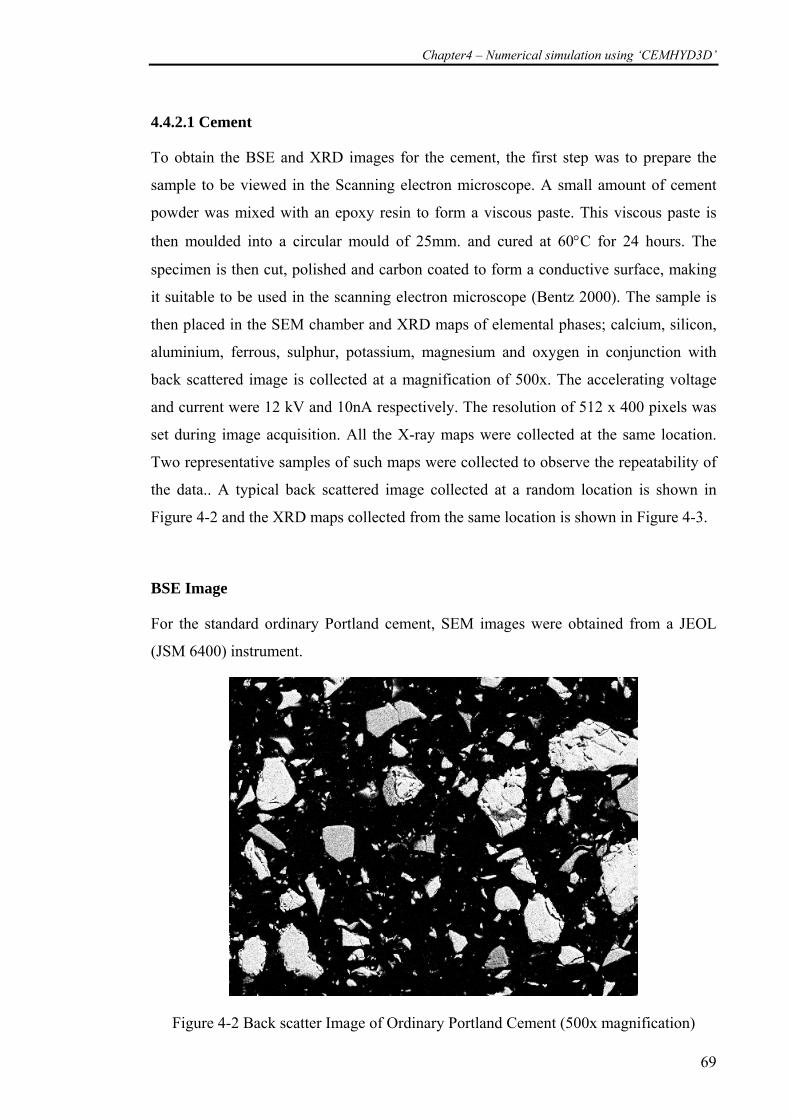
Chapter4 – Numerical simulation using ‘CEMHYD3D’
69
4.4.2.1 Cement
To obtain the BSE and XRD images for the cement, the first step was to prepare the
sample to be viewed in the Scanning electron microscope. A small amount of cement
powder was mixed with an epoxy resin to form a viscous paste. This viscous paste is
then moulded into a circular mould of 25mm. and cured at 60°C for 24 hours. The
specimen is then cut, polished and carbon coated to form a conductive surface, making
it suitable to be used in the scanning electron microscope (Bentz 2000). The sample is
then placed in the SEM chamber and XRD maps of elemental phases; calcium, silicon,
aluminium, ferrous, sulphur, potassium, magnesium and oxygen in conjunction with
back scattered image is collected at a magnification of 500x. The accelerating voltage
and current were 12 kV and 10nA respectively. The resolution of 512 x 400 pixels was
set during image acquisition. All the X-ray maps were collected at the same location.
Two representative samples of such maps were collected to observe the repeatability of
the data.. A typical back scattered image collected at a random location is shown in
Figure 4-2 and the XRD maps collected from the same location is shown in Figure 4-3.
BSE Image
For the standard ordinary Portland cement, SEM images were obtained from a JEOL
(JSM 6400) instrument.
Figure 4-2 Back scatter Image of Ordinary Portland Cement (500x magnification)
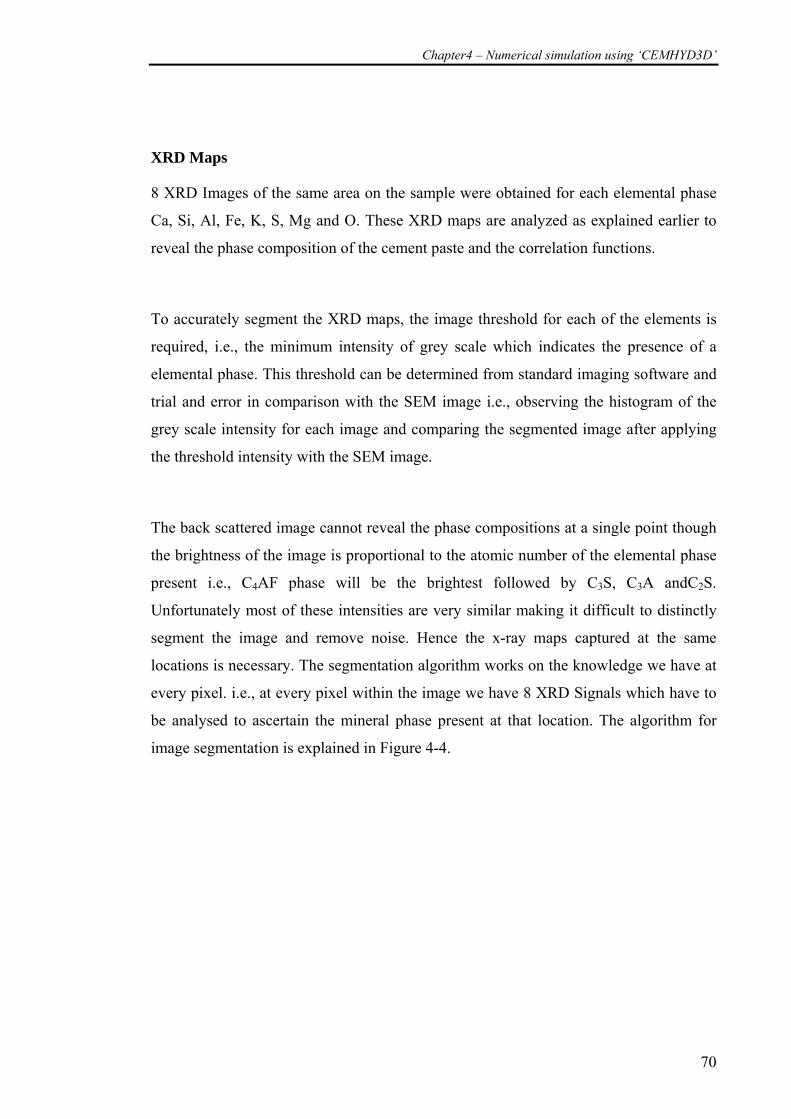
Chapter4 – Numerical simulation using ‘CEMHYD3D’
70
XRD Maps
8 XRD Images of the same area on the sample were obtained for each elemental phase
Ca, Si, Al, Fe, K, S, Mg and O. These XRD maps are analyzed as explained earlier to
reveal the phase composition of the cement paste and the correlation functions.
To accurately segment the XRD maps, the image threshold for each of the elements is
required, i.e., the minimum intensity of grey scale which indicates the presence of a
elemental phase. This threshold can be determined from standard imaging software and
trial and error in comparison with the SEM image i.e., observing the histogram of the
grey scale intensity for each image and comparing the segmented image after applying
the threshold intensity with the SEM image.
The back scattered image cannot reveal the phase compositions at a single point though
the brightness of the image is proportional to the atomic number of the elemental phase
present i.e., C4AF phase will be the brightest followed by C3S, C3A andC2S.
Unfortunately most of these intensities are very similar making it difficult to distinctly
segment the image and remove noise. Hence the x-ray maps captured at the same
locations is necessary. The segmentation algorithm works on the knowledge we have at
every pixel. i.e., at every pixel within the image we have 8 XRD Signals which have to
be analysed to ascertain the mineral phase present at that location. The algorithm for
image segmentation is explained in Figure 4-4.
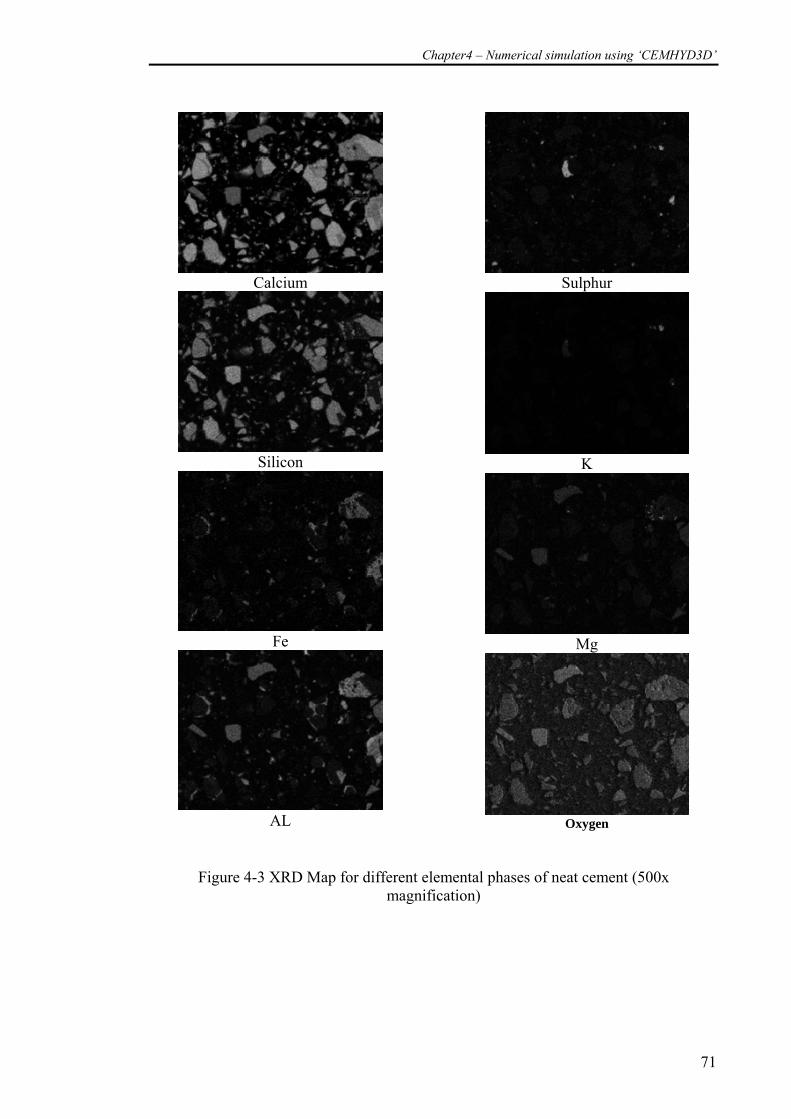
Chapter4 – Numerical simulation using ‘CEMHYD3D’
71
Calcium
Silicon
Fe
AL
Sulphur
K
Mg
Oxygen
Figure 4-3 XRD Map for different elemental phases of neat cement (500x magnification)
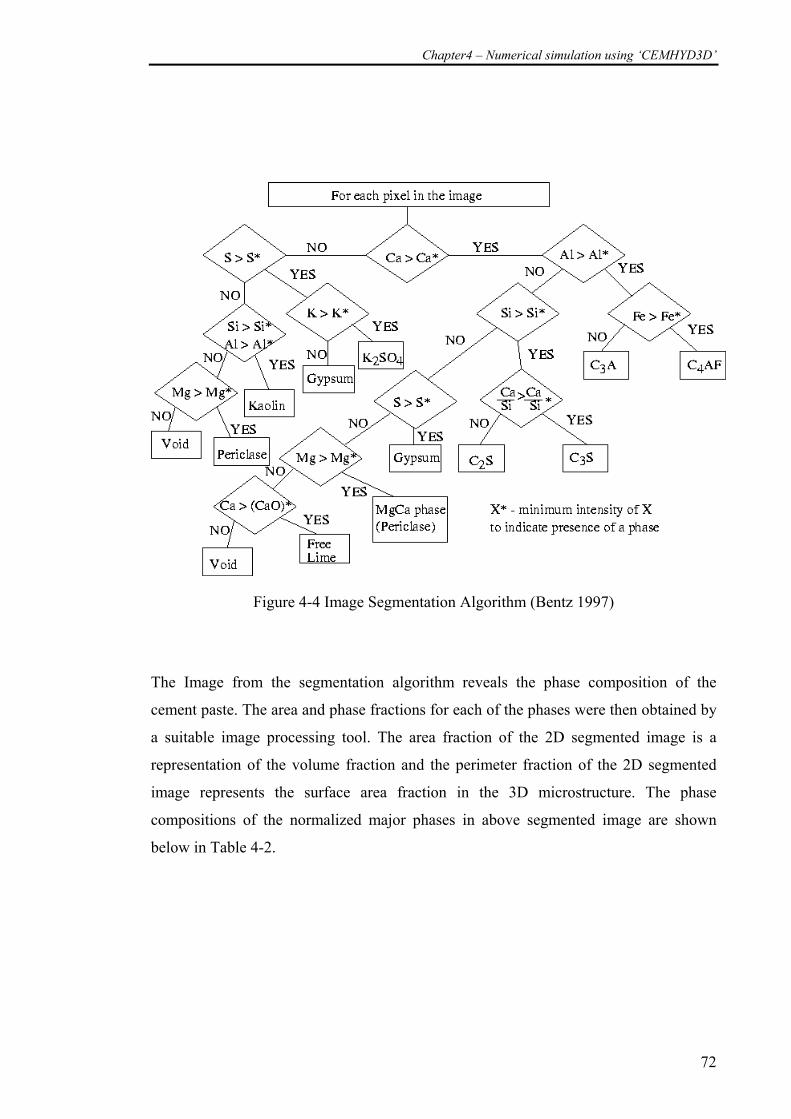
Chapter4 – Numerical simulation using ‘CEMHYD3D’
72
Figure 4-4 Image Segmentation Algorithm (Bentz 1997)
The Image from the segmentation algorithm reveals the phase composition of the
cement paste. The area and phase fractions for each of the phases were then obtained by
a suitable image processing tool. The area fraction of the 2D segmented image is a
representation of the volume fraction and the perimeter fraction of the 2D segmented
image represents the surface area fraction in the 3D microstructure. The phase
compositions of the normalized major phases in above segmented image are shown
below in Table 4-2.
Chapter4 – Numerical simulation using ‘CEMHYD3D’
73
Table 4-2 Image Analysis for Ordinary Portland Cement
Phases Area fraction Perimeter fraction
C3S 0.4549 0.4375
C2S 0.3893 0.3878
C3A 0.0474 0.0491
C4AF 0.1083 0.1256
A two point correlation function was then obtained in addition to the area and perimeter
fractions of each phase. This two point correlation function is then used in the
regeneration of the 3D microstructure in the CEMHYD3D model (Bentz 1997).
Figure 4-5 BSE image Vs Reconstructed 2D image from XRD images
4.4.2.2 Silica fume
While simulating the hydration of OPC-silica fume mixture, the percentage by weight
of pozzolon (Silica) present in the material (silica fume) is required. This was taken as
90% by weight of the total silica fume content based on chemical analysis and image
analysis of the powder sample. The rest of the silica fume was treated as inert materials.
This is an assumption and is similar to that made by Bentz (1997). The determination
of correlation function for CEMHYD3D was not required for the silica fume. A BSE
image for silica fume is shown in Figure 4-6.
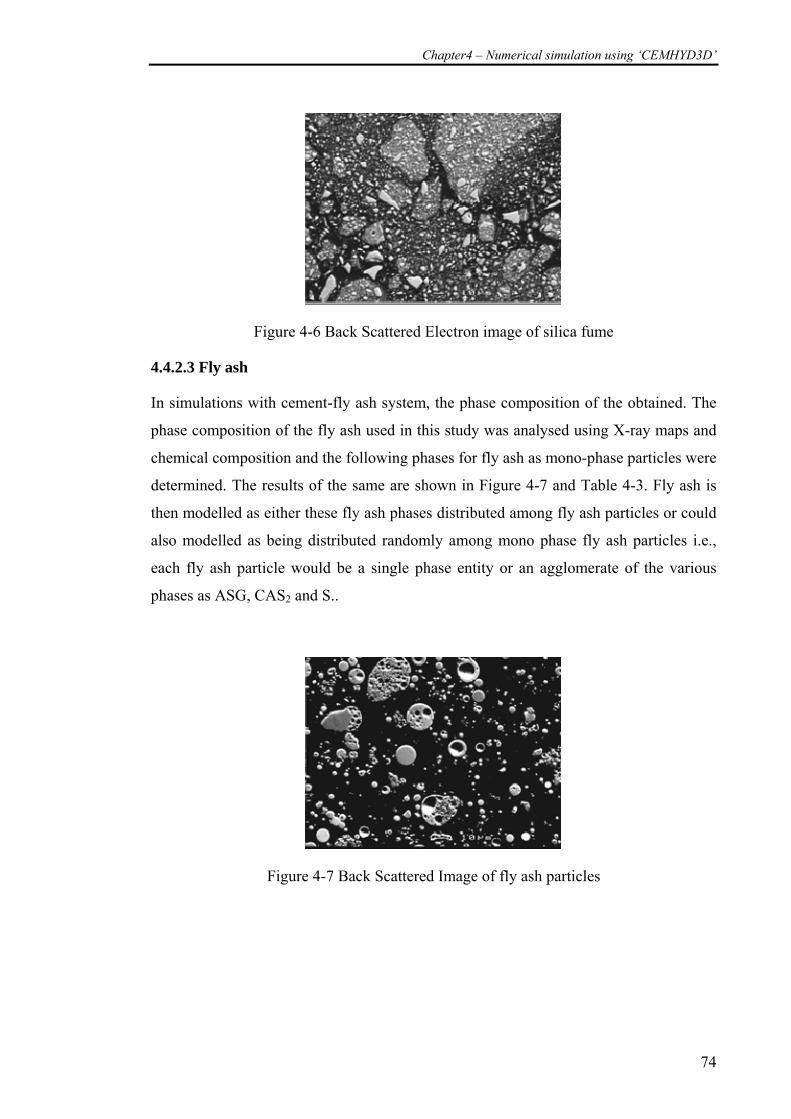
Chapter4 – Numerical simulation using ‘CEMHYD3D’
74
Figure 4-6 Back Scattered Electron image of silica fume
4.4.2.3 Fly ash
In simulations with cement-fly ash system, the phase composition of the obtained. The
phase composition of the fly ash used in this study was analysed using X-ray maps and
chemical composition and the following phases for fly ash as mono-phase particles were
determined. The results of the same are shown in Figure 4-7 and Table 4-3. Fly ash is
then modelled as either these fly ash phases distributed among fly ash particles or could
also modelled as being distributed randomly among mono phase fly ash particles i.e.,
each fly ash particle would be a single phase entity or an agglomerate of the various
phases as ASG, CAS2 and S..
Figure 4-7 Back Scattered Image of fly ash particles
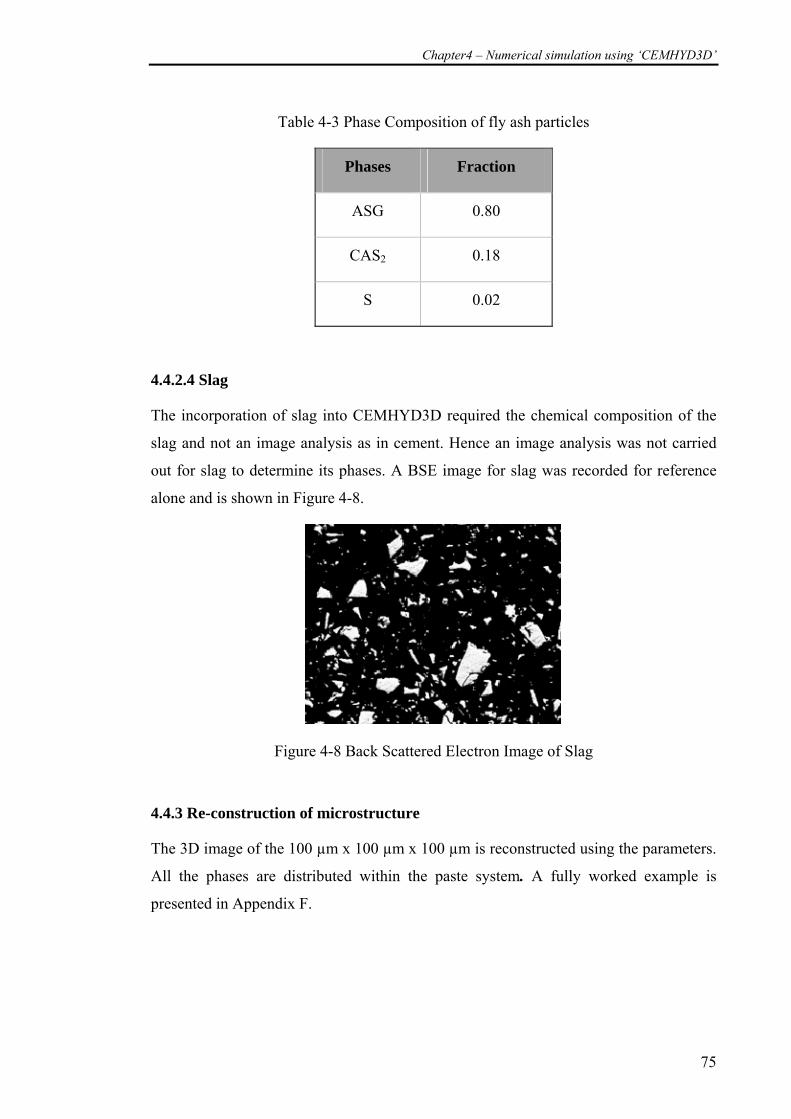
Chapter4 – Numerical simulation using ‘CEMHYD3D’
75
Table 4-3 Phase Composition of fly ash particles
Phases Fraction
ASG 0.80
CAS2 0.18
S 0.02
4.4.2.4 Slag
The incorporation of slag into CEMHYD3D required the chemical composition of the
slag and not an image analysis as in cement. Hence an image analysis was not carried
out for slag to determine its phases. A BSE image for slag was recorded for reference
alone and is shown in Figure 4-8.
Figure 4-8 Back Scattered Electron Image of Slag
4.4.3 Re-construction of microstructure
The 3D image of the 100 µm x 100 µm x 100 µm is reconstructed using the parameters.
All the phases are distributed within the paste system. A fully worked example is
presented in Appendix F.
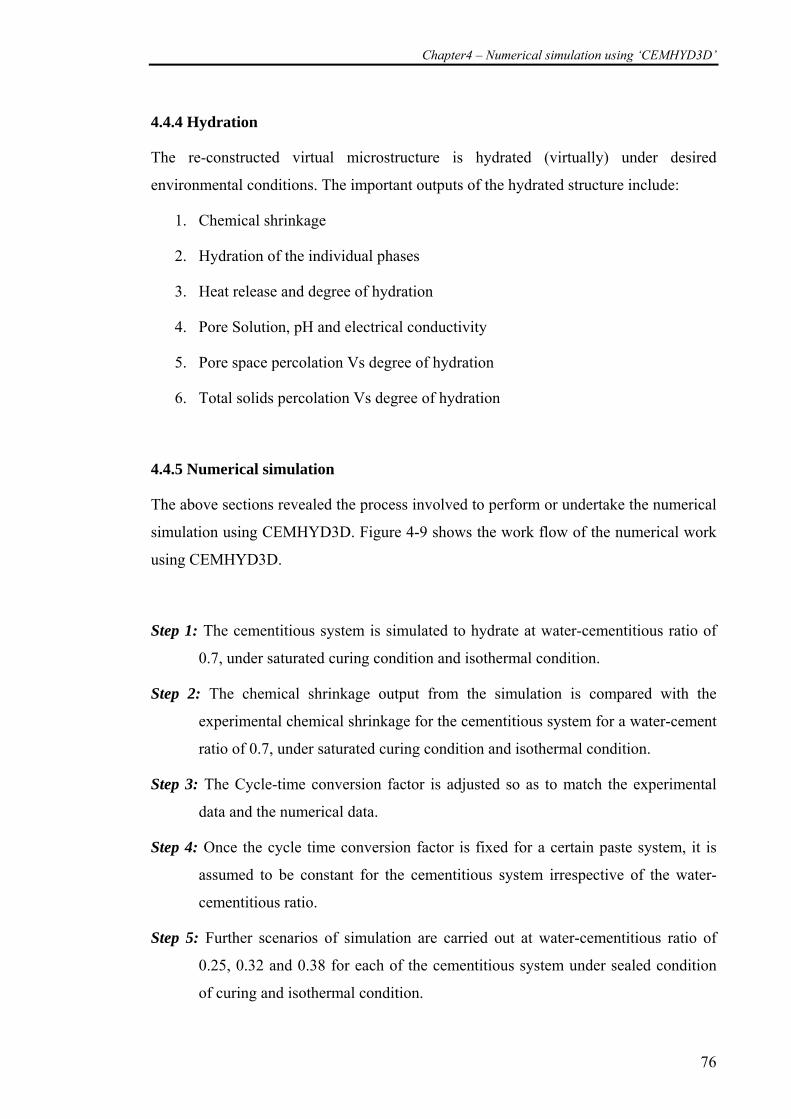
Chapter4 – Numerical simulation using ‘CEMHYD3D’
76
4.4.4 Hydration
The re-constructed virtual microstructure is hydrated (virtually) under desired
environmental conditions. The important outputs of the hydrated structure include:
1. Chemical shrinkage
2. Hydration of the individual phases
3. Heat release and degree of hydration
4. Pore Solution, pH and electrical conductivity
5. Pore space percolation Vs degree of hydration
6. Total solids percolation Vs degree of hydration
4.4.5 Numerical simulation
The above sections revealed the process involved to perform or undertake the numerical
simulation using CEMHYD3D. Figure 4-9 shows the work flow of the numerical work
using CEMHYD3D.
Step 1: The cementitious system is simulated to hydrate at water-cementitious ratio of
0.7, under saturated curing condition and isothermal condition.
Step 2: The chemical shrinkage output from the simulation is compared with the
experimental chemical shrinkage for the cementitious system for a water-cement
ratio of 0.7, under saturated curing condition and isothermal condition.
Step 3: The Cycle-time conversion factor is adjusted so as to match the experimental
data and the numerical data.
Step 4: Once the cycle time conversion factor is fixed for a certain paste system, it is
assumed to be constant for the cementitious system irrespective of the water-
cementitious ratio.
Step 5: Further scenarios of simulation are carried out at water-cementitious ratio of
0.25, 0.32 and 0.38 for each of the cementitious system under sealed condition
of curing and isothermal condition.
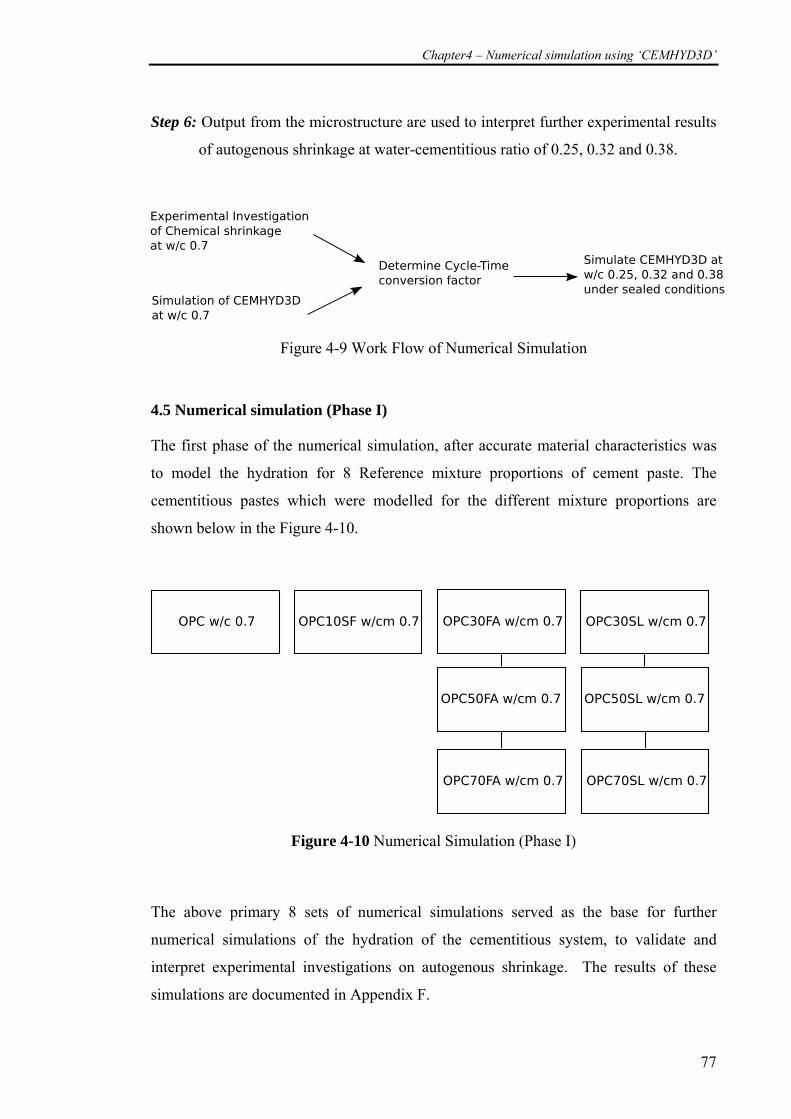
Chapter4 – Numerical simulation using ‘CEMHYD3D’
77
Step 6: Output from the microstructure are used to interpret further experimental results
of autogenous shrinkage at water-cementitious ratio of 0.25, 0.32 and 0.38.
Figure 4-9 Work Flow of Numerical Simulation
4.5 Numerical simulation (Phase I)
The first phase of the numerical simulation, after accurate material characteristics was
to model the hydration for 8 Reference mixture proportions of cement paste. The
cementitious pastes which were modelled for the different mixture proportions are
shown below in the Figure 4-10.
Figure 4-10 Numerical Simulation (Phase I)
The above primary 8 sets of numerical simulations served as the base for further
numerical simulations of the hydration of the cementitious system, to validate and
interpret experimental investigations on autogenous shrinkage. The results of these
simulations are documented in Appendix F.
Chapter4 – Numerical simulation using ‘CEMHYD3D’
78
4.5.1 Cycle time conversion factor
The simulation in CEMHYD3D was carried out using cycle steps. The number of cycle
steps to be simulated is entered at the beginning of simulation. This is not a direct
measure of the actual real time of the hydration. The actual real-time is determined by a
simple equation (Bentz 1995)
Time(β) = B * cycles2
where ‘cycle’ is the number steps of execution of the hydration program and the value
B (a constant) is the cycle time conversion factor which serves a crucial role in the
calibration of the model with real-time experimental data and the time ‘β’ is obtained in
hours. The value ‘B’ was reported to be constant for certain cement (Bentz 2006).
Hence this allows for an option to further model different scenarios actually having the
necessity to recalibrate the numerical model for each of the modified water-
cementitious ratio or curing condition.
4.6 Numerical simulation (Phase 2)
The second phase of numerical simulation with CEMHYD3D involves the modelling of
the hydration of the cementitious systems for the water-cementitious ratio of 0.25, 0.32
and 0.38, with the input being the same experimental conditions of the autogenous
shrinkage testing and measurements undertaken in this work. This simulation was
carried out for samples which were kept under sealed curing condition and ambient
temperature of 24°C. For detailed results of the simulations the author suggests that the
reader refer to the Chapter 6 where these data’s have been presented.
From these simulations, the output data was used to further interpret autogenous
shrinkage strains experienced by the relevant cementitious paste system.
The Next chapter deals with the experimental investigation of Chemical shrinkage for
various cementitious systems. These results are the vital information necessary for
calibrating the numerical model. They are, nevertheless vital for explaining the
fundamental mechanisms of autogenous shrinkage.
Chapter 5 – Chemical shrinkage – Results and Discussion
79
CHAPTER 5 -CHEMICAL SHRINKAGE – RESULTS and
DISCUSSION
5.1 Introduction
Chemical shrinkage has been reported as one of the important factor contributing to
autogenous shrinkage. Hence the first phase of the experimental program was to
investigate the development of chemical shrinkage in cementitious systems. It is also to
provide insight into the understanding of the development of autogenous shrinkage in
the cementitious systems and the influence of various mineral admixtures like silica
fume, fly ash and slag on the development of chemical shrinkage.
This chapter will discus in detail the basic experimental investigations of chemical
shrinkage and the factor’s influencing the development of chemical shrinkage. The link
to autogenous shrinkage is explained later in subsequent chapters. This chapter has been
broadly divided into two parts.
1. Experimental results and interpretations
2. A simple stoichiometry based model to understand the development of chemical
shrinkage.
5.2 Chemical shrinkage - Experimental results
The experimental program has been discussed in detail in Chapter 3. The step by step
procedure for performing the test is explained in Appendix A
5.2.1 Plain cement paste
The chemical shrinkage of ordinary Portland cement paste at a water-cement ratio of 0.7
(denoted as OPC07) is shown in Figure 5-1. The average of 9 samples is shown in this
figure. During the experimental program, the temperature of the water in the vial was
measured using an independent sample under the same conditions with a T type
thermocouple and a suitable data logger. Measurements related to shrinkage are directly
influenced by temperature variation during the test. It would be required that the true
chemical shrinkage component is separated out from shrinkage which would have
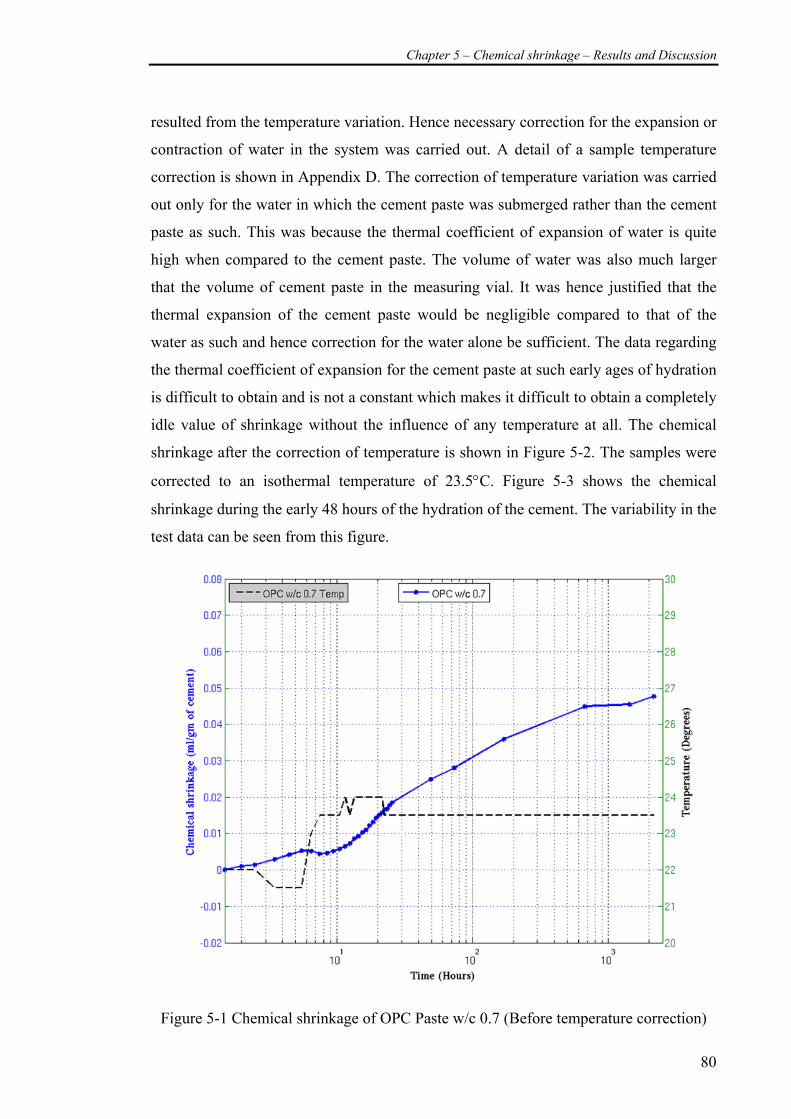
Chapter 5 – Chemical shrinkage – Results and Discussion
80
resulted from the temperature variation. Hence necessary correction for the expansion or
contraction of water in the system was carried out. A detail of a sample temperature
correction is shown in Appendix D. The correction of temperature variation was carried
out only for the water in which the cement paste was submerged rather than the cement
paste as such. This was because the thermal coefficient of expansion of water is quite
high when compared to the cement paste. The volume of water was also much larger
that the volume of cement paste in the measuring vial. It was hence justified that the
thermal expansion of the cement paste would be negligible compared to that of the
water as such and hence correction for the water alone be sufficient. The data regarding
the thermal coefficient of expansion for the cement paste at such early ages of hydration
is difficult to obtain and is not a constant which makes it difficult to obtain a completely
idle value of shrinkage without the influence of any temperature at all. The chemical
shrinkage after the correction of temperature is shown in Figure 5-2. The samples were
corrected to an isothermal temperature of 23.5°C. Figure 5-3 shows the chemical
shrinkage during the early 48 hours of the hydration of the cement. The variability in the
test data can be seen from this figure.
Figure 5-1 Chemical shrinkage of OPC Paste w/c 0.7 (Before temperature correction)
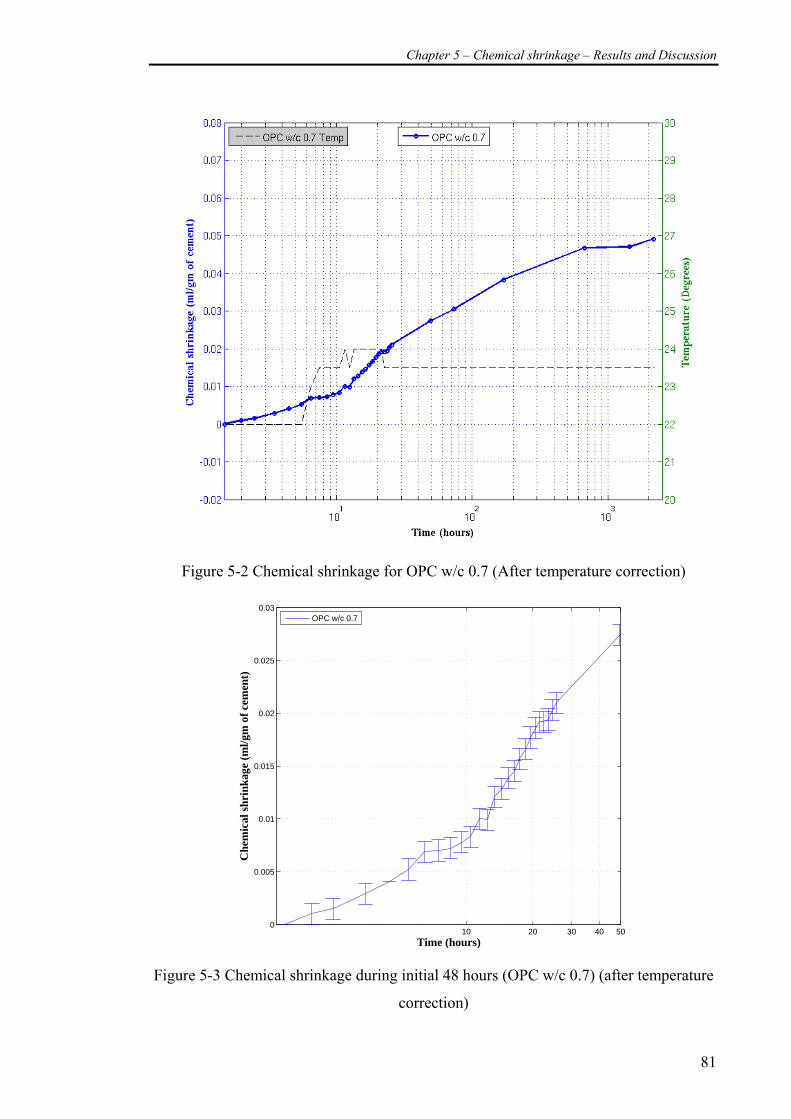
Chapter 5 – Chemical shrinkage – Results and Discussion
81
Figure 5-2 Chemical shrinkage for OPC w/c 0.7 (After temperature correction)
10 20 30 40 500
0.005
0.01
0.015
0.02
0.025
0.03
Time (hours)
Che
mic
al s
hrin
kage
(m
l/gm
of
cem
ent)
OPC w/c 0.7
Figure 5-3 Chemical shrinkage during initial 48 hours (OPC w/c 0.7) (after temperature
correction)
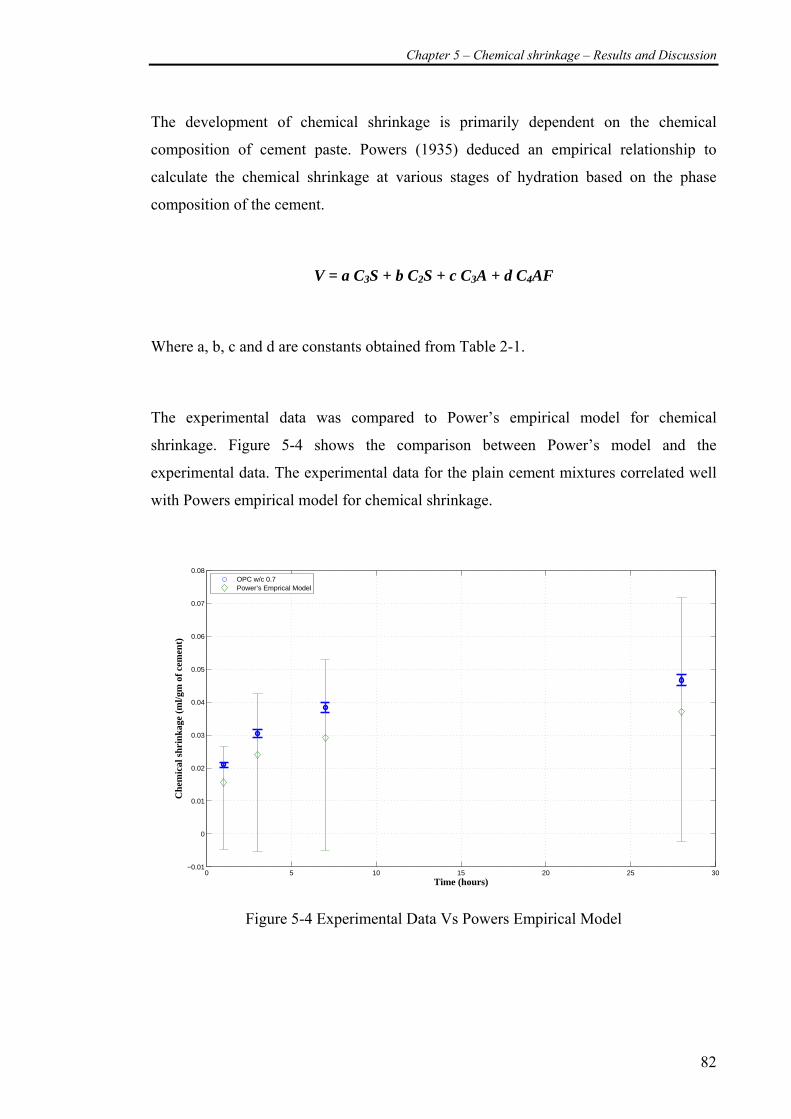
Chapter 5 – Chemical shrinkage – Results and Discussion
82
The development of chemical shrinkage is primarily dependent on the chemical
composition of cement paste. Powers (1935) deduced an empirical relationship to
calculate the chemical shrinkage at various stages of hydration based on the phase
composition of the cement.
V = a C3S + b C2S + c C3A + d C4AF
Where a, b, c and d are constants obtained from Table 2-1.
The experimental data was compared to Power’s empirical model for chemical
shrinkage. Figure 5-4 shows the comparison between Power’s model and the
experimental data. The experimental data for the plain cement mixtures correlated well
with Powers empirical model for chemical shrinkage.
0 5 10 15 20 25 30−0.01
0
0.01
0.02
0.03
0.04
0.05
0.06
0.07
0.08
Time (hours)
Che
mic
al s
hrin
kage
(m
l/gm
of
cem
ent)
OPC w/c 0.7Power’s Emprical Model
Figure 5-4 Experimental Data Vs Powers Empirical Model
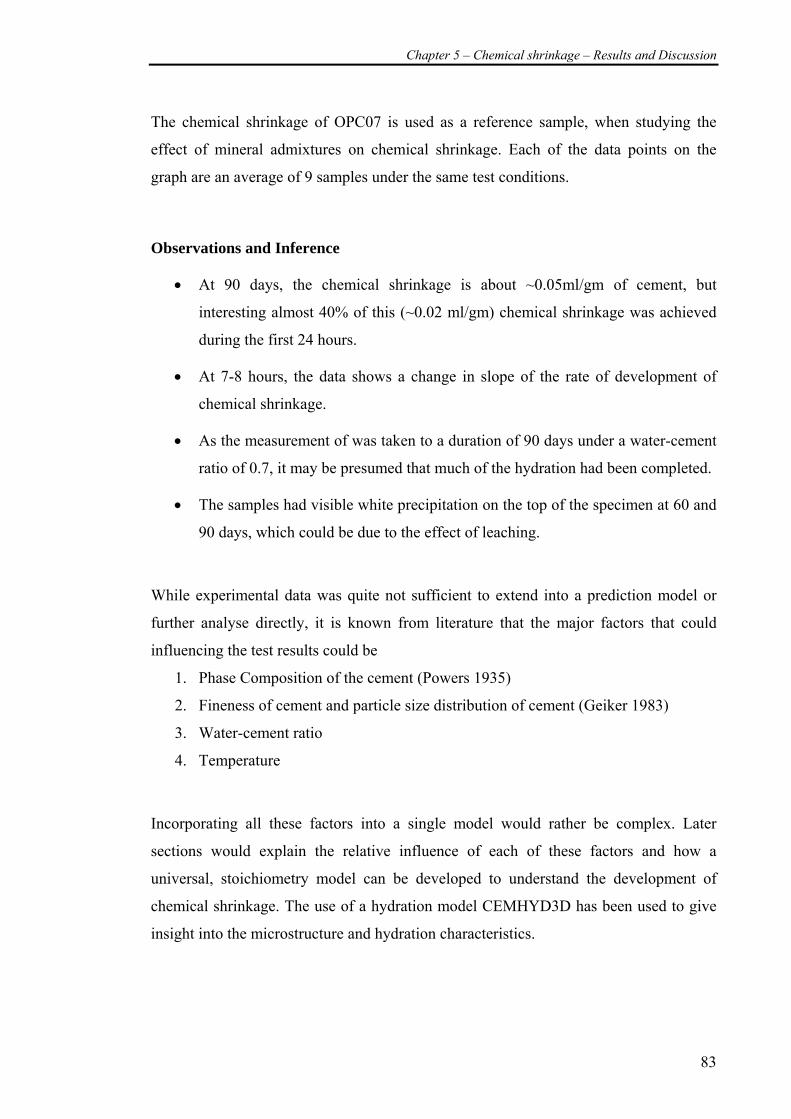
Chapter 5 – Chemical shrinkage – Results and Discussion
83
The chemical shrinkage of OPC07 is used as a reference sample, when studying the
effect of mineral admixtures on chemical shrinkage. Each of the data points on the
graph are an average of 9 samples under the same test conditions.
Observations and Inference
• At 90 days, the chemical shrinkage is about ~0.05ml/gm of cement, but
interesting almost 40% of this (~0.02 ml/gm) chemical shrinkage was achieved
during the first 24 hours.
• At 7-8 hours, the data shows a change in slope of the rate of development of
chemical shrinkage.
• As the measurement of was taken to a duration of 90 days under a water-cement
ratio of 0.7, it may be presumed that much of the hydration had been completed.
• The samples had visible white precipitation on the top of the specimen at 60 and
90 days, which could be due to the effect of leaching.
While experimental data was quite not sufficient to extend into a prediction model or
further analyse directly, it is known from literature that the major factors that could
influencing the test results could be
1. Phase Composition of the cement (Powers 1935)
2. Fineness of cement and particle size distribution of cement (Geiker 1983)
3. Water-cement ratio
4. Temperature
Incorporating all these factors into a single model would rather be complex. Later
sections would explain the relative influence of each of these factors and how a
universal, stoichiometry model can be developed to understand the development of
chemical shrinkage. The use of a hydration model CEMHYD3D has been used to give
insight into the microstructure and hydration characteristics.
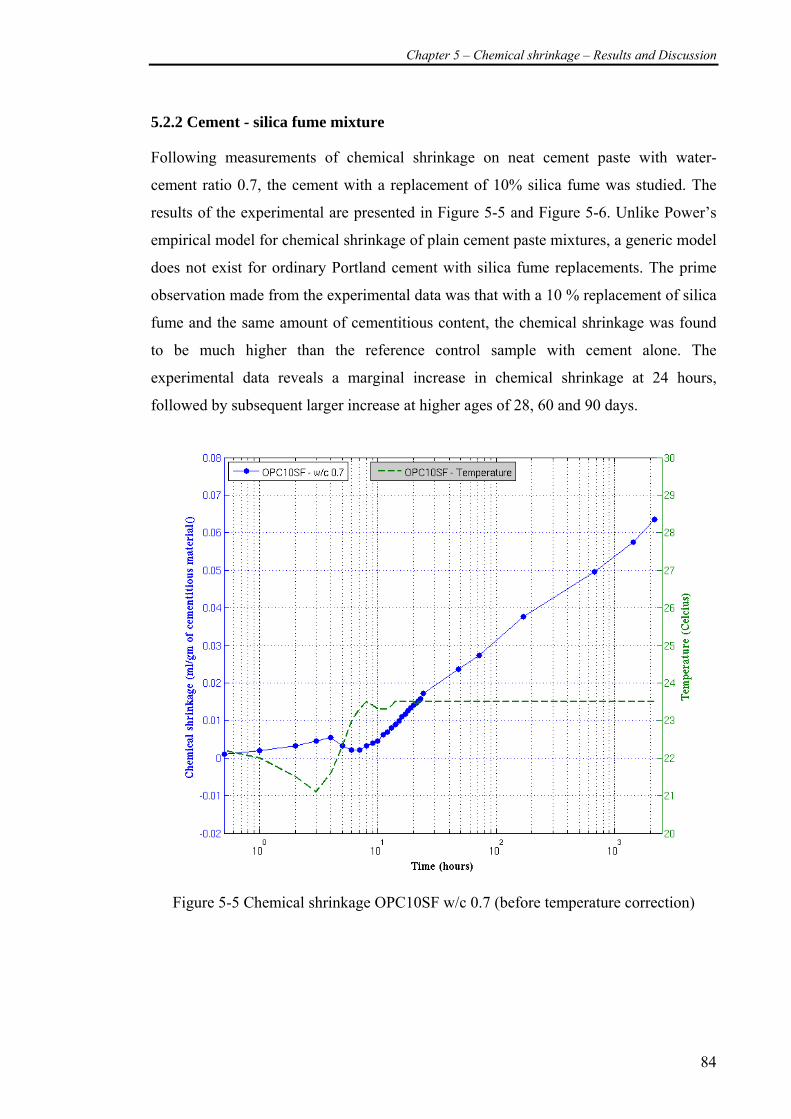
Chapter 5 – Chemical shrinkage – Results and Discussion
84
5.2.2 Cement - silica fume mixture
Following measurements of chemical shrinkage on neat cement paste with water-
cement ratio 0.7, the cement with a replacement of 10% silica fume was studied. The
results of the experimental are presented in Figure 5-5 and Figure 5-6. Unlike Power’s
empirical model for chemical shrinkage of plain cement paste mixtures, a generic model
does not exist for ordinary Portland cement with silica fume replacements. The prime
observation made from the experimental data was that with a 10 % replacement of silica
fume and the same amount of cementitious content, the chemical shrinkage was found
to be much higher than the reference control sample with cement alone. The
experimental data reveals a marginal increase in chemical shrinkage at 24 hours,
followed by subsequent larger increase at higher ages of 28, 60 and 90 days.
Figure 5-5 Chemical shrinkage OPC10SF w/c 0.7 (before temperature correction)
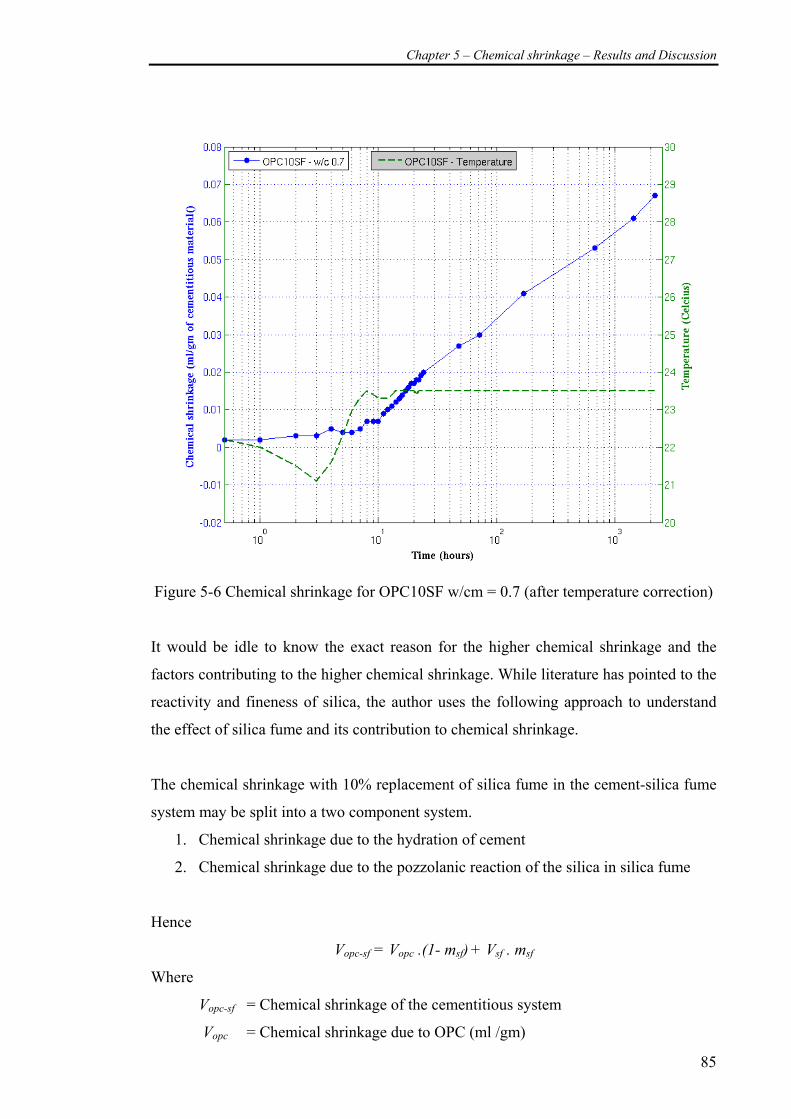
Chapter 5 – Chemical shrinkage – Results and Discussion
85
Figure 5-6 Chemical shrinkage for OPC10SF w/cm = 0.7 (after temperature correction)
It would be idle to know the exact reason for the higher chemical shrinkage and the
factors contributing to the higher chemical shrinkage. While literature has pointed to the
reactivity and fineness of silica, the author uses the following approach to understand
the effect of silica fume and its contribution to chemical shrinkage.
The chemical shrinkage with 10% replacement of silica fume in the cement-silica fume
system may be split into a two component system.
1. Chemical shrinkage due to the hydration of cement
2. Chemical shrinkage due to the pozzolanic reaction of the silica in silica fume
Hence
Vopc-sf = Vopc .(1- msf) + Vsf . msf
Where
Vopc-sf = Chemical shrinkage of the cementitious system
Vopc = Chemical shrinkage due to OPC (ml /gm)
Chapter 5 – Chemical shrinkage – Results and Discussion
86
Vsf = Chemical shrinkage due to Silica fume (ml /gm)
msf = mass replacement of silica fume in the per gram of the cementitious
system
We may from a theoretical point of view and for the simplicity to model assume that the
hydration kinetics of the cement is not directly influenced by the silica fume but the
hydration of silica fume depends on the hydration and the hydration products formed
from the cement hydration. Experimental evidence has shown that roughly the total
chemical shrinkage would amount to about 8.8 ml / 100 gm of reacted silica fume
(Justnes, Ardoullie et al. 1998), which is larger than the idle value of chemical
shrinkage due to the hydration of cement (~6 ml / 100gm of reacted cement). Yet how a
10% replacement of silica fume is able to have more than 20% increase when compared
to the reference OPC07 alone is a question to be discussed (Refer Figure 5-7).
At any time ‘t’ the reaction of silica fume in the presence of cement would be different
from the silica fume reaction in a lime saturated solution, it may be presumed for
simplicity, the kinetics of hydration of each of the individual constituents are not greatly
influenced by the other. Under the assumption that the kinetics of the pozzolanic
reaction is not influenced directly by cement, we can separate the component of
chemical shrinkage of the silica fume in the cement-silica fume mixture as below.
sf
sfopcsfopcsf m
mVVV
)1( −−= −
The chemical shrinkage from the control reference mix OPC07, is assumed to be equal
to ‘Vopc’. Hence the relative effect of the silica fume on chemical shrinkage due its
pozzolanic reaction alone at any time‘t’ is computed according to the above equation
and plotted in Figure 5-8.
Figure 5-8 reveals the hydration kinetic of the individual silica fume alone in the opc-sf
mixture. At 90 days the value of chemical shrinkage contributed from silica fume is
nearly 0.2 ml/gm (20ml/100gm) of silica fume present in the paste. This value is much
higher to that of 8.8 ml /100gm of silica fume as reported by (Justnes, Ardoullie et al.
1998). The theoretical value of chemical shrinkage for a silica fume-calcium hydroxide
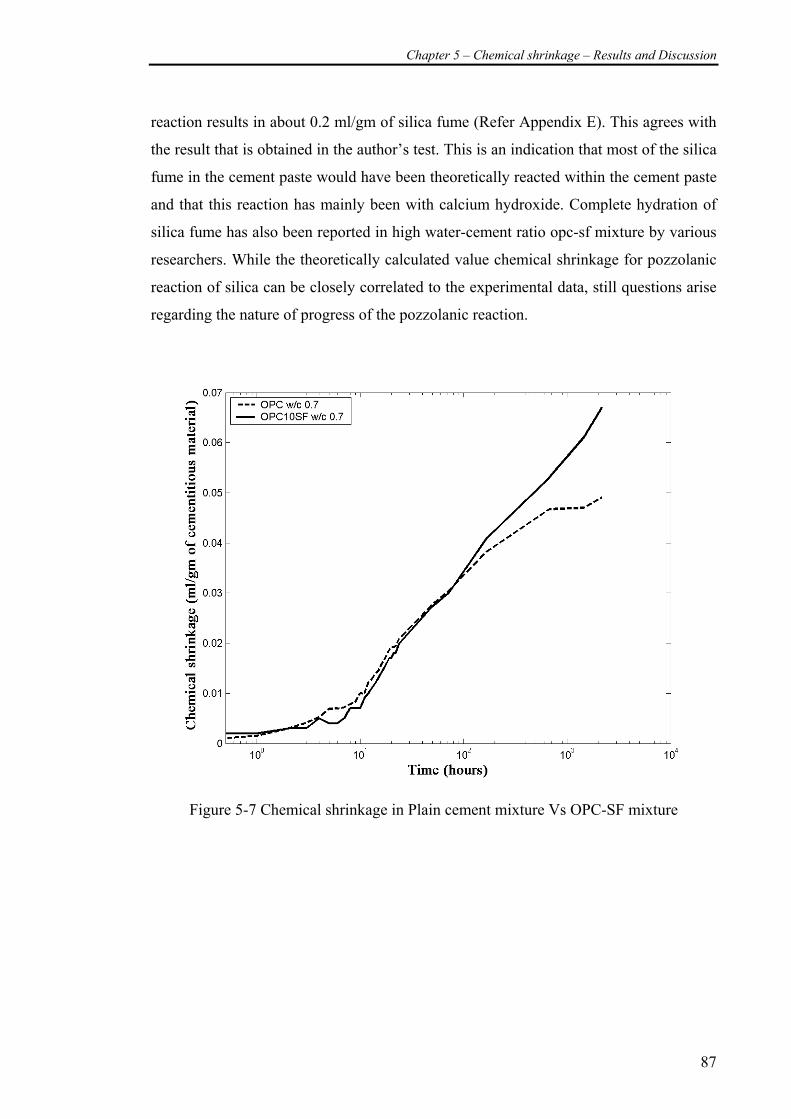
Chapter 5 – Chemical shrinkage – Results and Discussion
87
reaction results in about 0.2 ml/gm of silica fume (Refer Appendix E). This agrees with
the result that is obtained in the author’s test. This is an indication that most of the silica
fume in the cement paste would have been theoretically reacted within the cement paste
and that this reaction has mainly been with calcium hydroxide. Complete hydration of
silica fume has also been reported in high water-cement ratio opc-sf mixture by various
researchers. While the theoretically calculated value chemical shrinkage for pozzolanic
reaction of silica can be closely correlated to the experimental data, still questions arise
regarding the nature of progress of the pozzolanic reaction.
Figure 5-7 Chemical shrinkage in Plain cement mixture Vs OPC-SF mixture
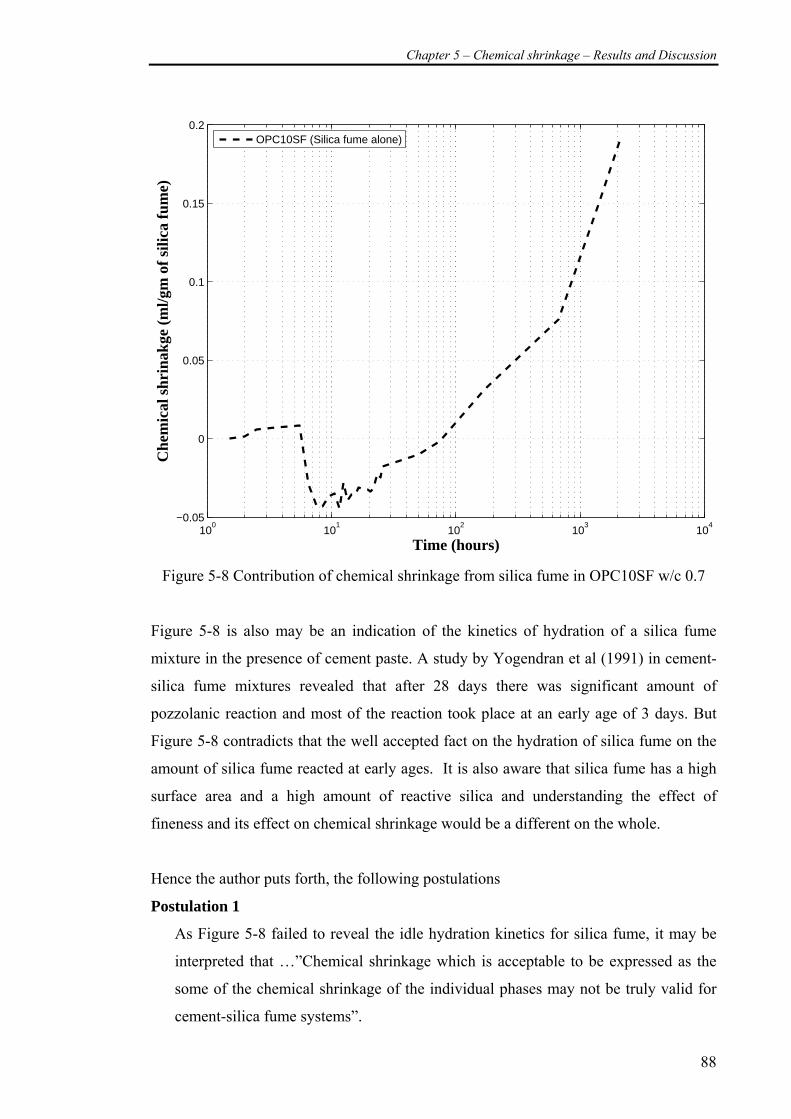
Chapter 5 – Chemical shrinkage – Results and Discussion
88
100
101
102
103
104
−0.05
0
0.05
0.1
0.15
0.2
Time (hours)
Che
mic
al s
hrin
akge
(m
l/gm
of
silic
a fu
me)
OPC10SF (Silica fume alone)
Figure 5-8 Contribution of chemical shrinkage from silica fume in OPC10SF w/c 0.7
Figure 5-8 is also may be an indication of the kinetics of hydration of a silica fume
mixture in the presence of cement paste. A study by Yogendran et al (1991) in cement-
silica fume mixtures revealed that after 28 days there was significant amount of
pozzolanic reaction and most of the reaction took place at an early age of 3 days. But
Figure 5-8 contradicts that the well accepted fact on the hydration of silica fume on the
amount of silica fume reacted at early ages. It is also aware that silica fume has a high
surface area and a high amount of reactive silica and understanding the effect of
fineness and its effect on chemical shrinkage would be a different on the whole.
Hence the author puts forth, the following postulations
Postulation 1
As Figure 5-8 failed to reveal the idle hydration kinetics for silica fume, it may be
interpreted that …”Chemical shrinkage which is acceptable to be expressed as the
some of the chemical shrinkage of the individual phases may not be truly valid for
cement-silica fume systems”.
Chapter 5 – Chemical shrinkage – Results and Discussion
89
Postulation 2
The kinetics of hydration of the cement in the cement-silica fume mixture could
have been altered and experimental evidence from control mixture of opc alone
cannot be used for the interpretation of the kinetics of the same cement in opc-sf
mixture. i.e., αcement(t) (in OPC alone paste) ≠ αcement(t) (in OPC-SF paste). Hence the
earlier assumption of expressing chemical as a sum of chemical of opc and silica
fume may be valid but the actual amount contribution of chemical shrinkage of opc
is not the same as that from the OPC alone mixture.
Nevertheless, experimental evidence shows that the replacement of silica fume at 10%
replacement by weight in a cement - silica fume mixture has a higher amount of
chemical shrinkage compared to that of a cement alone mixture. The increase in
chemical shrinkage of the cement-silica fume system may only be due to the additional
pozzolanic reactions of silica fume as which is also evident from stoichiometry
equations as shown in Appendix E.
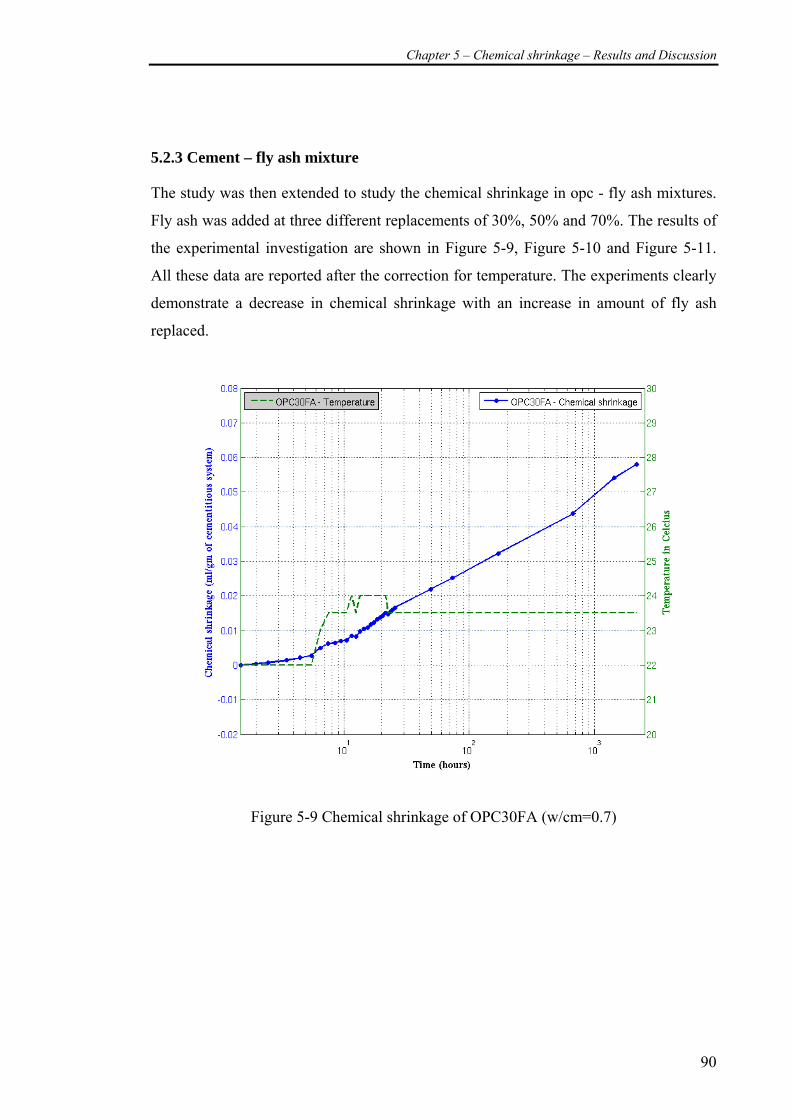
Chapter 5 – Chemical shrinkage – Results and Discussion
90
5.2.3 Cement – fly ash mixture
The study was then extended to study the chemical shrinkage in opc - fly ash mixtures.
Fly ash was added at three different replacements of 30%, 50% and 70%. The results of
the experimental investigation are shown in Figure 5-9, Figure 5-10 and Figure 5-11.
All these data are reported after the correction for temperature. The experiments clearly
demonstrate a decrease in chemical shrinkage with an increase in amount of fly ash
replaced.
Figure 5-9 Chemical shrinkage of OPC30FA (w/cm=0.7)
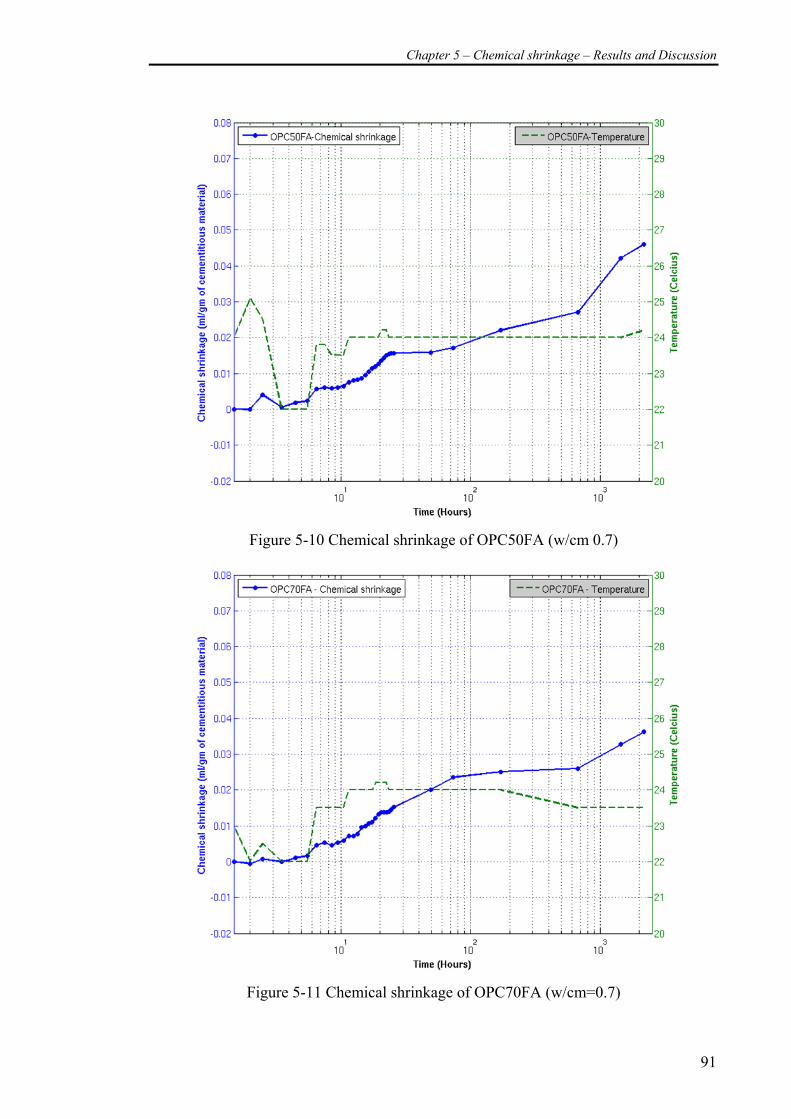
Chapter 5 – Chemical shrinkage – Results and Discussion
91
Figure 5-10 Chemical shrinkage of OPC50FA (w/cm 0.7)
Figure 5-11 Chemical shrinkage of OPC70FA (w/cm=0.7)
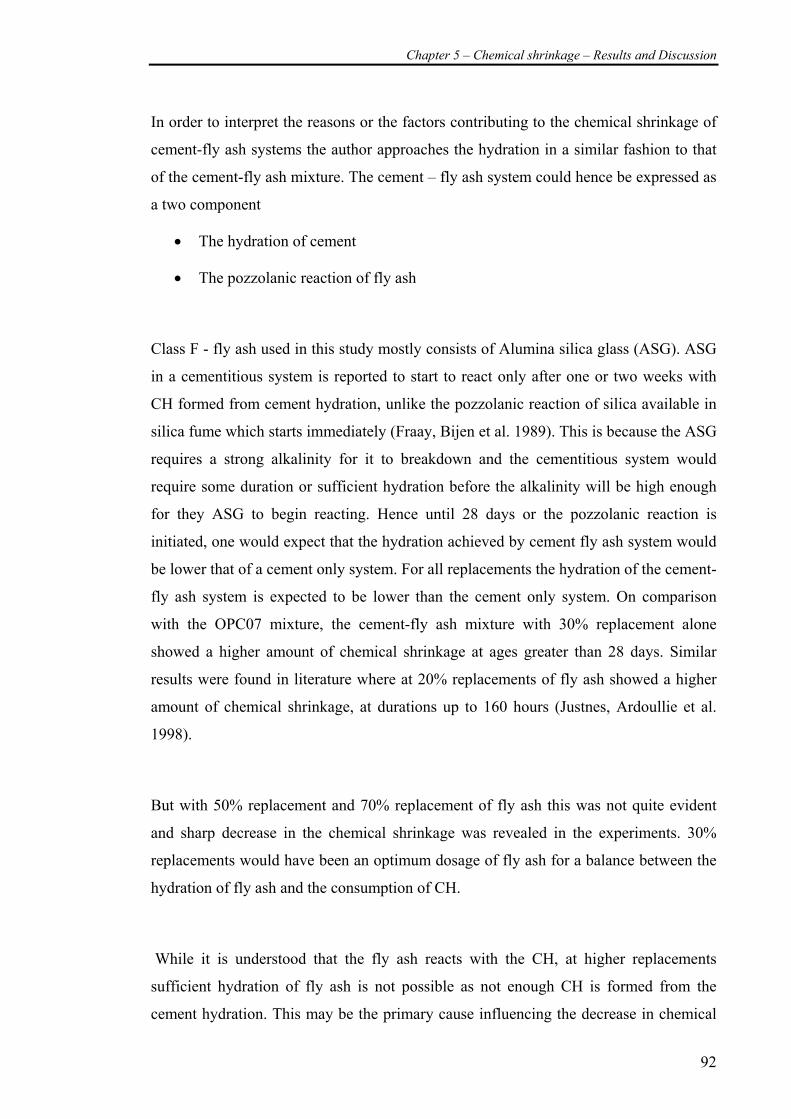
Chapter 5 – Chemical shrinkage – Results and Discussion
92
In order to interpret the reasons or the factors contributing to the chemical shrinkage of
cement-fly ash systems the author approaches the hydration in a similar fashion to that
of the cement-fly ash mixture. The cement – fly ash system could hence be expressed as
a two component
• The hydration of cement
• The pozzolanic reaction of fly ash
Class F - fly ash used in this study mostly consists of Alumina silica glass (ASG). ASG
in a cementitious system is reported to start to react only after one or two weeks with
CH formed from cement hydration, unlike the pozzolanic reaction of silica available in
silica fume which starts immediately (Fraay, Bijen et al. 1989). This is because the ASG
requires a strong alkalinity for it to breakdown and the cementitious system would
require some duration or sufficient hydration before the alkalinity will be high enough
for they ASG to begin reacting. Hence until 28 days or the pozzolanic reaction is
initiated, one would expect that the hydration achieved by cement fly ash system would
be lower that of a cement only system. For all replacements the hydration of the cement-
fly ash system is expected to be lower than the cement only system. On comparison
with the OPC07 mixture, the cement-fly ash mixture with 30% replacement alone
showed a higher amount of chemical shrinkage at ages greater than 28 days. Similar
results were found in literature where at 20% replacements of fly ash showed a higher
amount of chemical shrinkage, at durations up to 160 hours (Justnes, Ardoullie et al.
1998).
But with 50% replacement and 70% replacement of fly ash this was not quite evident
and sharp decrease in the chemical shrinkage was revealed in the experiments. 30%
replacements would have been an optimum dosage of fly ash for a balance between the
hydration of fly ash and the consumption of CH.
While it is understood that the fly ash reacts with the CH, at higher replacements
sufficient hydration of fly ash is not possible as not enough CH is formed from the
cement hydration. This may be the primary cause influencing the decrease in chemical
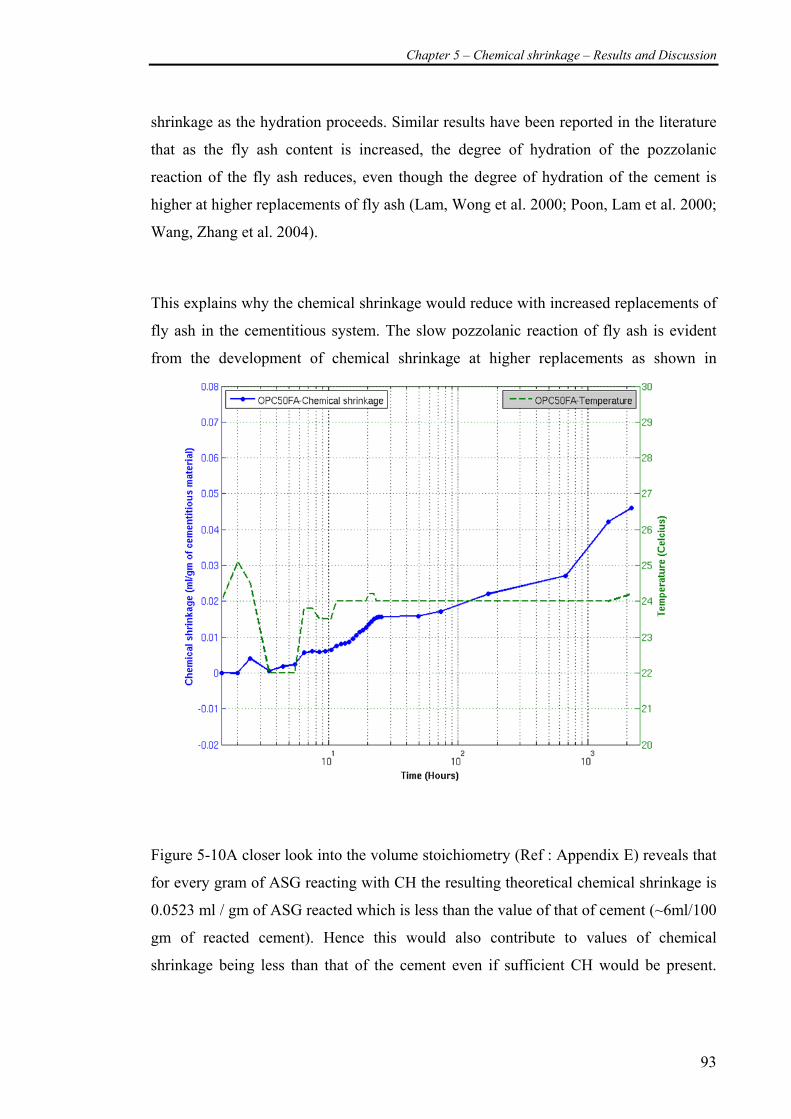
Chapter 5 – Chemical shrinkage – Results and Discussion
93
shrinkage as the hydration proceeds. Similar results have been reported in the literature
that as the fly ash content is increased, the degree of hydration of the pozzolanic
reaction of the fly ash reduces, even though the degree of hydration of the cement is
higher at higher replacements of fly ash (Lam, Wong et al. 2000; Poon, Lam et al. 2000;
Wang, Zhang et al. 2004).
This explains why the chemical shrinkage would reduce with increased replacements of
fly ash in the cementitious system. The slow pozzolanic reaction of fly ash is evident
from the development of chemical shrinkage at higher replacements as shown in
Figure 5-10A closer look into the volume stoichiometry (Ref : Appendix E) reveals that
for every gram of ASG reacting with CH the resulting theoretical chemical shrinkage is
0.0523 ml / gm of ASG reacted which is less than the value of that of cement (~6ml/100
gm of reacted cement). Hence this would also contribute to values of chemical
shrinkage being less than that of the cement even if sufficient CH would be present.
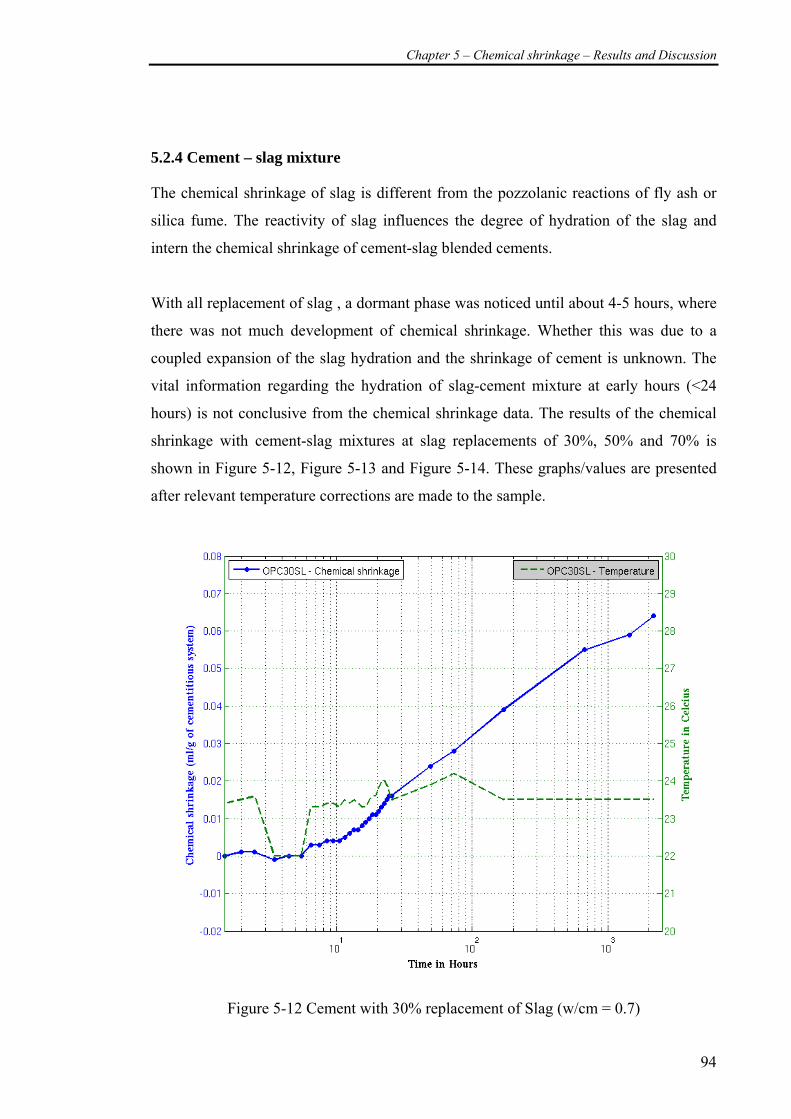
Chapter 5 – Chemical shrinkage – Results and Discussion
94
5.2.4 Cement – slag mixture
The chemical shrinkage of slag is different from the pozzolanic reactions of fly ash or
silica fume. The reactivity of slag influences the degree of hydration of the slag and
intern the chemical shrinkage of cement-slag blended cements.
With all replacement of slag , a dormant phase was noticed until about 4-5 hours, where
there was not much development of chemical shrinkage. Whether this was due to a
coupled expansion of the slag hydration and the shrinkage of cement is unknown. The
vital information regarding the hydration of slag-cement mixture at early hours (<24
hours) is not conclusive from the chemical shrinkage data. The results of the chemical
shrinkage with cement-slag mixtures at slag replacements of 30%, 50% and 70% is
shown in Figure 5-12, Figure 5-13 and Figure 5-14. These graphs/values are presented
after relevant temperature corrections are made to the sample.
Figure 5-12 Cement with 30% replacement of Slag (w/cm = 0.7)
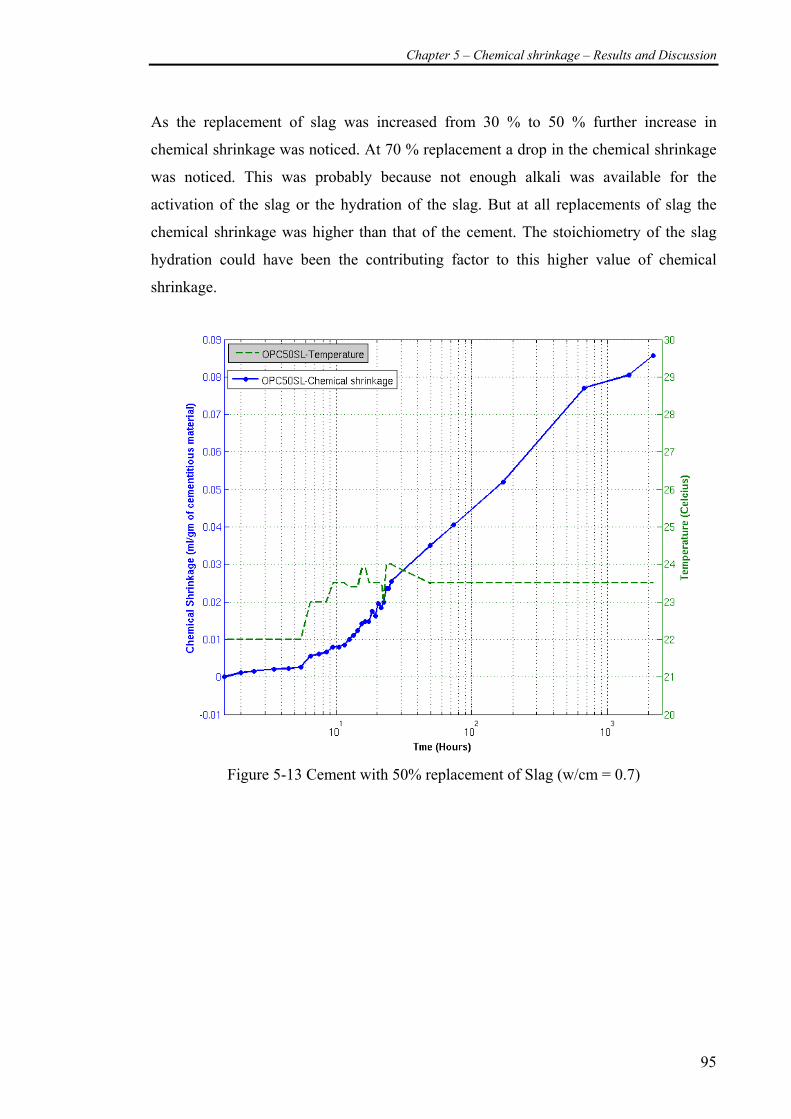
Chapter 5 – Chemical shrinkage – Results and Discussion
95
As the replacement of slag was increased from 30 % to 50 % further increase in
chemical shrinkage was noticed. At 70 % replacement a drop in the chemical shrinkage
was noticed. This was probably because not enough alkali was available for the
activation of the slag or the hydration of the slag. But at all replacements of slag the
chemical shrinkage was higher than that of the cement. The stoichiometry of the slag
hydration could have been the contributing factor to this higher value of chemical
shrinkage.
Figure 5-13 Cement with 50% replacement of Slag (w/cm = 0.7)
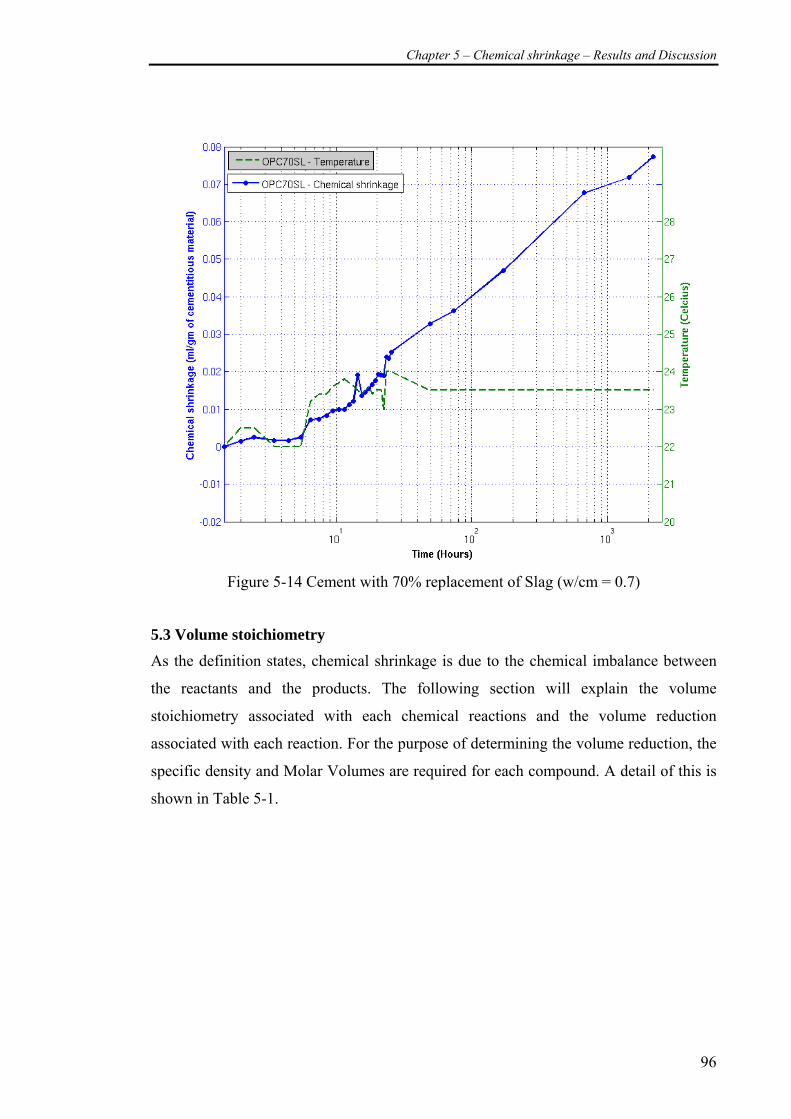
Chapter 5 – Chemical shrinkage – Results and Discussion
96
Figure 5-14 Cement with 70% replacement of Slag (w/cm = 0.7)
5.3 Volume stoichiometry
As the definition states, chemical shrinkage is due to the chemical imbalance between
the reactants and the products. The following section will explain the volume
stoichiometry associated with each chemical reactions and the volume reduction
associated with each reaction. For the purpose of determining the volume reduction, the
specific density and Molar Volumes are required for each compound. A detail of this is
shown in Table 5-1.
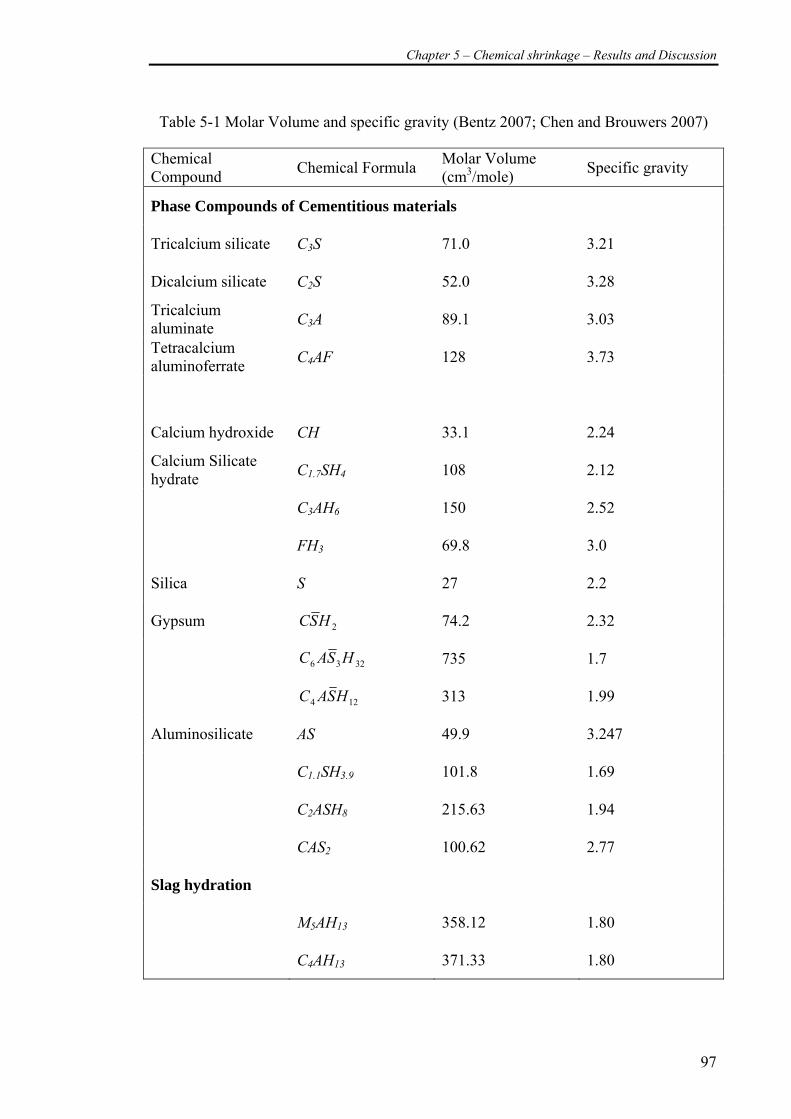
Chapter 5 – Chemical shrinkage – Results and Discussion
97
Table 5-1 Molar Volume and specific gravity (Bentz 2007; Chen and Brouwers 2007)
Chemical Compound Chemical Formula Molar Volume
(cm3/mole) Specific gravity
Phase Compounds of Cementitious materials
Tricalcium silicate C3S 71.0 3.21
Dicalcium silicate C2S 52.0 3.28
Tricalcium aluminate C3A 89.1 3.03
Tetracalcium aluminoferrate C4AF 128 3.73
Calcium hydroxide CH 33.1 2.24
Calcium Silicate hydrate C1.7SH4 108 2.12
C3AH6 150 2.52
FH3 69.8 3.0
Silica S 27 2.2
Gypsum 2HSC 74.2 2.32
3236 HSAC 735 1.7
124 HSAC 313 1.99
Aluminosilicate AS 49.9 3.247
C1.1SH3.9 101.8 1.69
C2ASH8 215.63 1.94
CAS2 100.62 2.77
Slag hydration
M5AH13 358.12 1.80
C4AH13 371.33 1.80
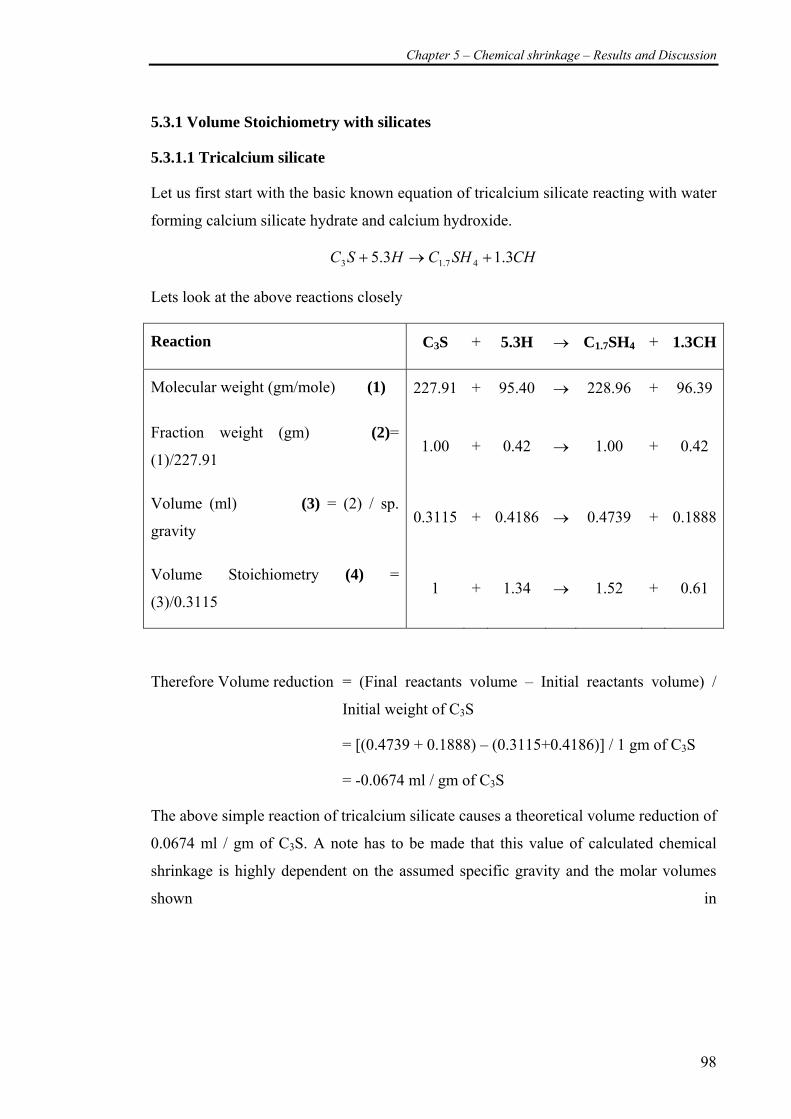
Chapter 5 – Chemical shrinkage – Results and Discussion
98
5.3.1 Volume Stoichiometry with silicates
5.3.1.1 Tricalcium silicate
Let us first start with the basic known equation of tricalcium silicate reacting with water
forming calcium silicate hydrate and calcium hydroxide.
CHSHCHSC 3.13.5 47.13 +→+
Lets look at the above reactions closely
Reaction C3S + 5.3H → C1.7SH4 + 1.3CH
Molecular weight (gm/mole) (1) 227.91 + 95.40 → 228.96 + 96.39
Fraction weight (gm) (2)=
(1)/227.91 1.00 + 0.42 → 1.00 + 0.42
Volume (ml) (3) = (2) / sp.
gravity 0.3115 + 0.4186 → 0.4739 + 0.1888
Volume Stoichiometry (4) =
(3)/0.3115 1 + 1.34 → 1.52 + 0.61
Therefore Volume reduction = (Final reactants volume – Initial reactants volume) /
Initial weight of C3S
= [(0.4739 + 0.1888) – (0.3115+0.4186)] / 1 gm of C3S
= -0.0674 ml / gm of C3S
The above simple reaction of tricalcium silicate causes a theoretical volume reduction of
0.0674 ml / gm of C3S. A note has to be made that this value of calculated chemical
shrinkage is highly dependent on the assumed specific gravity and the molar volumes
shown in
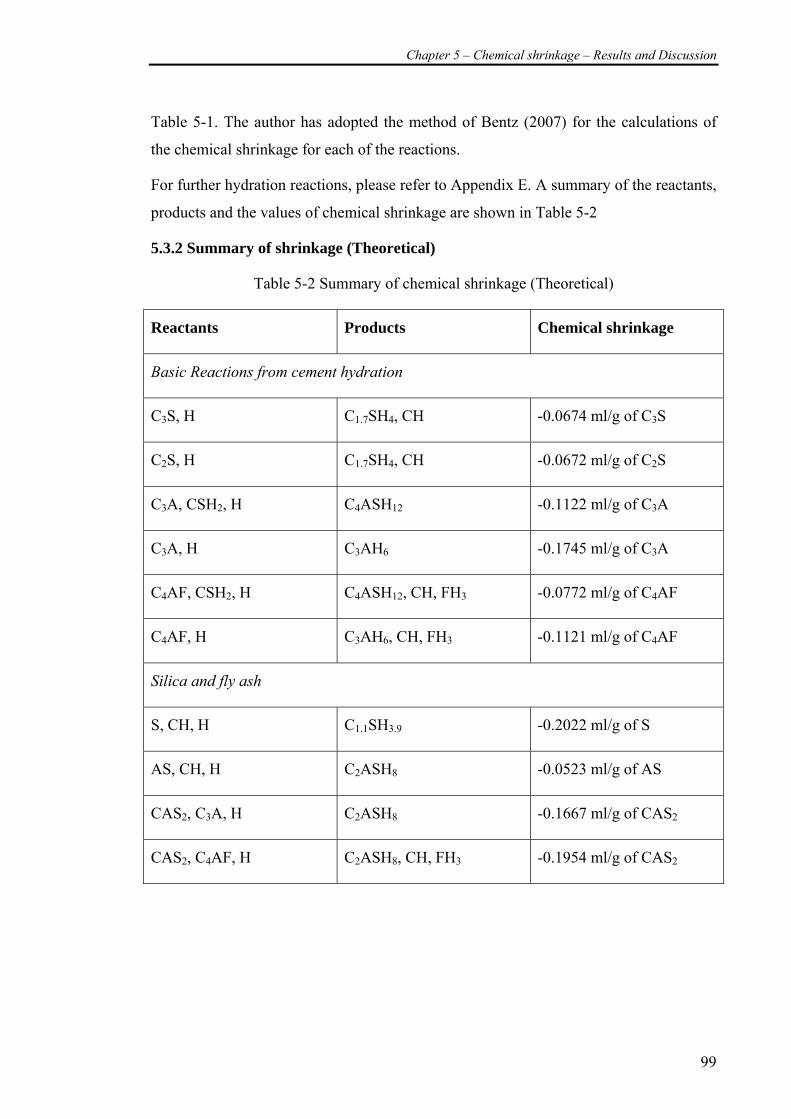
Chapter 5 – Chemical shrinkage – Results and Discussion
99
Table 5-1. The author has adopted the method of Bentz (2007) for the calculations of
the chemical shrinkage for each of the reactions.
For further hydration reactions, please refer to Appendix E. A summary of the reactants,
products and the values of chemical shrinkage are shown in Table 5-2
5.3.2 Summary of shrinkage (Theoretical)
Table 5-2 Summary of chemical shrinkage (Theoretical)
Reactants Products Chemical shrinkage
Basic Reactions from cement hydration
C3S, H C1.7SH4, CH -0.0674 ml/g of C3S
C2S, H C1.7SH4, CH -0.0672 ml/g of C2S
C3A, CSH2, H C4ASH12 -0.1122 ml/g of C3A
C3A, H C3AH6 -0.1745 ml/g of C3A
C4AF, CSH2, H C4ASH12, CH, FH3 -0.0772 ml/g of C4AF
C4AF, H C3AH6, CH, FH3 -0.1121 ml/g of C4AF
Silica and fly ash
S, CH, H C1.1SH3.9 -0.2022 ml/g of S
AS, CH, H C2ASH8 -0.0523 ml/g of AS
CAS2, C3A, H C2ASH8 -0.1667 ml/g of CAS2
CAS2, C4AF, H C2ASH8, CH, FH3 -0.1954 ml/g of CAS2
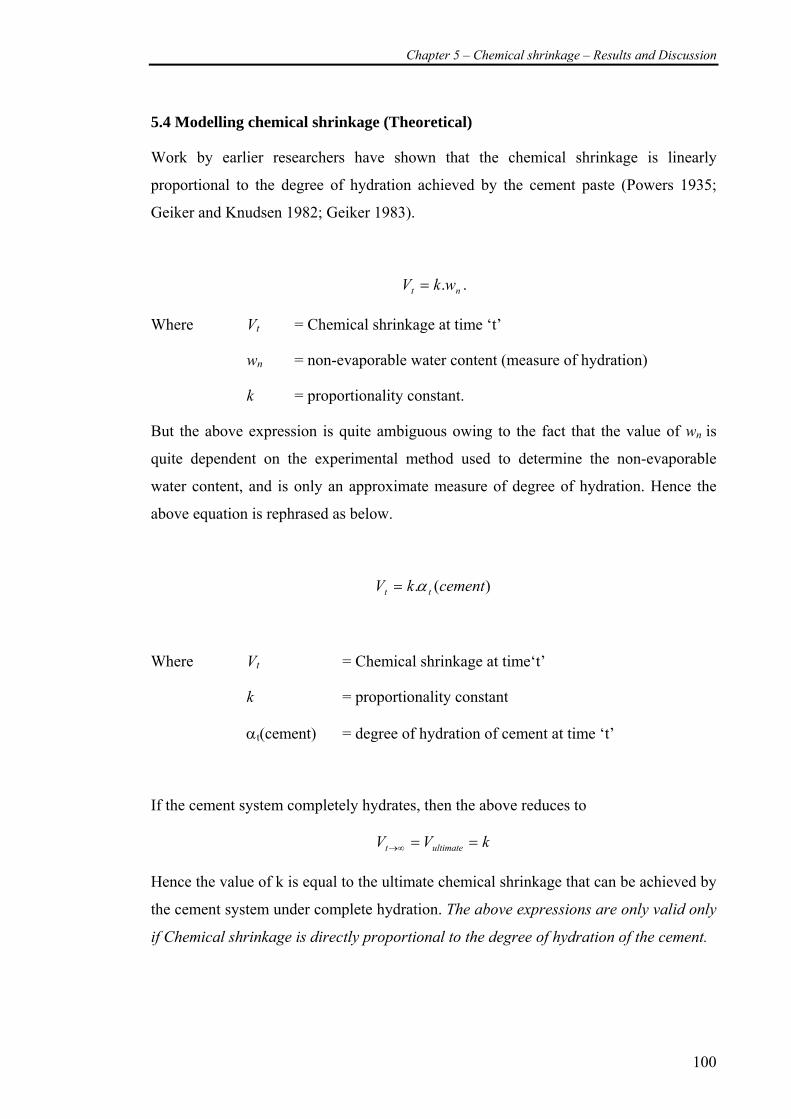
Chapter 5 – Chemical shrinkage – Results and Discussion
100
5.4 Modelling chemical shrinkage (Theoretical)
Work by earlier researchers have shown that the chemical shrinkage is linearly
proportional to the degree of hydration achieved by the cement paste (Powers 1935;
Geiker and Knudsen 1982; Geiker 1983).
nt wkV .= .
Where Vt = Chemical shrinkage at time ‘t’
wn = non-evaporable water content (measure of hydration)
k = proportionality constant.
But the above expression is quite ambiguous owing to the fact that the value of wn is
quite dependent on the experimental method used to determine the non-evaporable
water content, and is only an approximate measure of degree of hydration. Hence the
above equation is rephrased as below.
)(. cementkV tt α=
Where Vt = Chemical shrinkage at time‘t’
k = proportionality constant
αt(cement) = degree of hydration of cement at time ‘t’
If the cement system completely hydrates, then the above reduces to
kVV ultimatet ==∞→
Hence the value of k is equal to the ultimate chemical shrinkage that can be achieved by
the cement system under complete hydration. The above expressions are only valid only
if Chemical shrinkage is directly proportional to the degree of hydration of the cement.
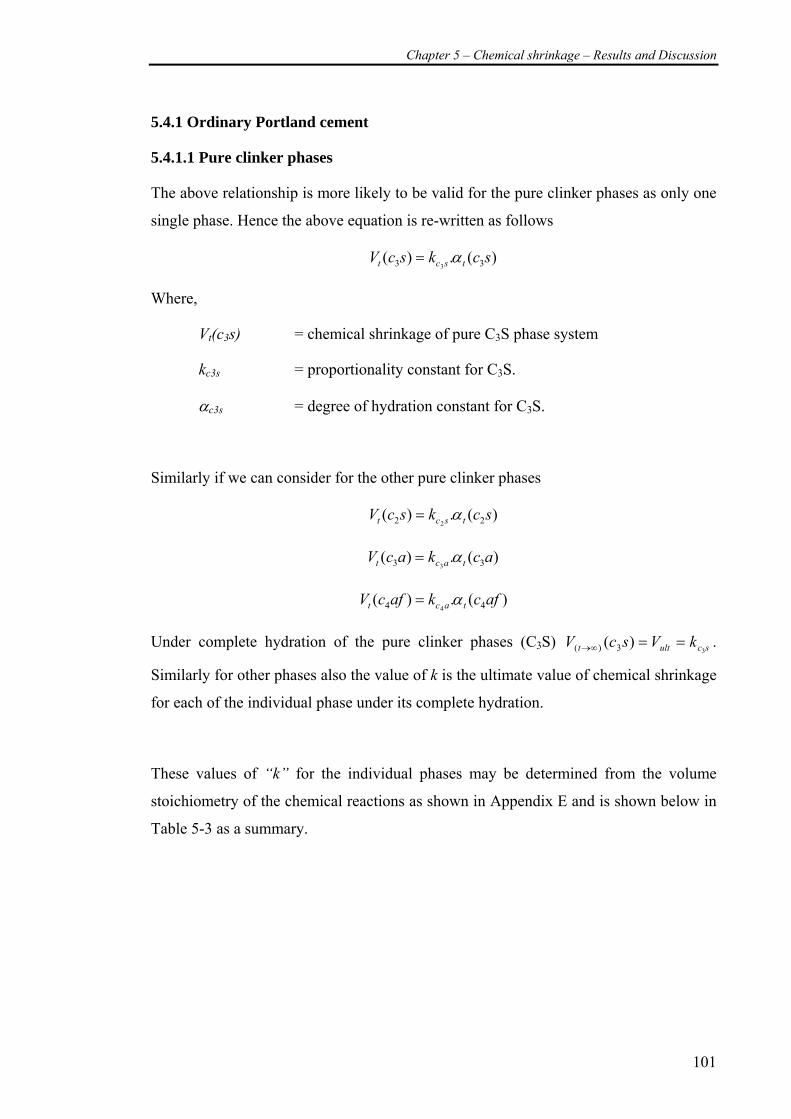
Chapter 5 – Chemical shrinkage – Results and Discussion
101
5.4.1 Ordinary Portland cement
5.4.1.1 Pure clinker phases
The above relationship is more likely to be valid for the pure clinker phases as only one
single phase. Hence the above equation is re-written as follows
)(.)( 33 3sckscV tsct α=
Where,
Vt(c3s) = chemical shrinkage of pure C3S phase system
kc3s = proportionality constant for C3S.
αc3s = degree of hydration constant for C3S.
Similarly if we can consider for the other pure clinker phases
)(.)( 22 2sckscV tsct α=
)(.)( 33 3ackacV tact α=
)(.)( 44 4afckafcV tact α=
Under complete hydration of the pure clinker phases (C3S) scultt kVscV3
)( 3)( ==∞→ .
Similarly for other phases also the value of k is the ultimate value of chemical shrinkage
for each of the individual phase under its complete hydration.
These values of “k” for the individual phases may be determined from the volume
stoichiometry of the chemical reactions as shown in Appendix E and is shown below in
Table 5-3 as a summary.
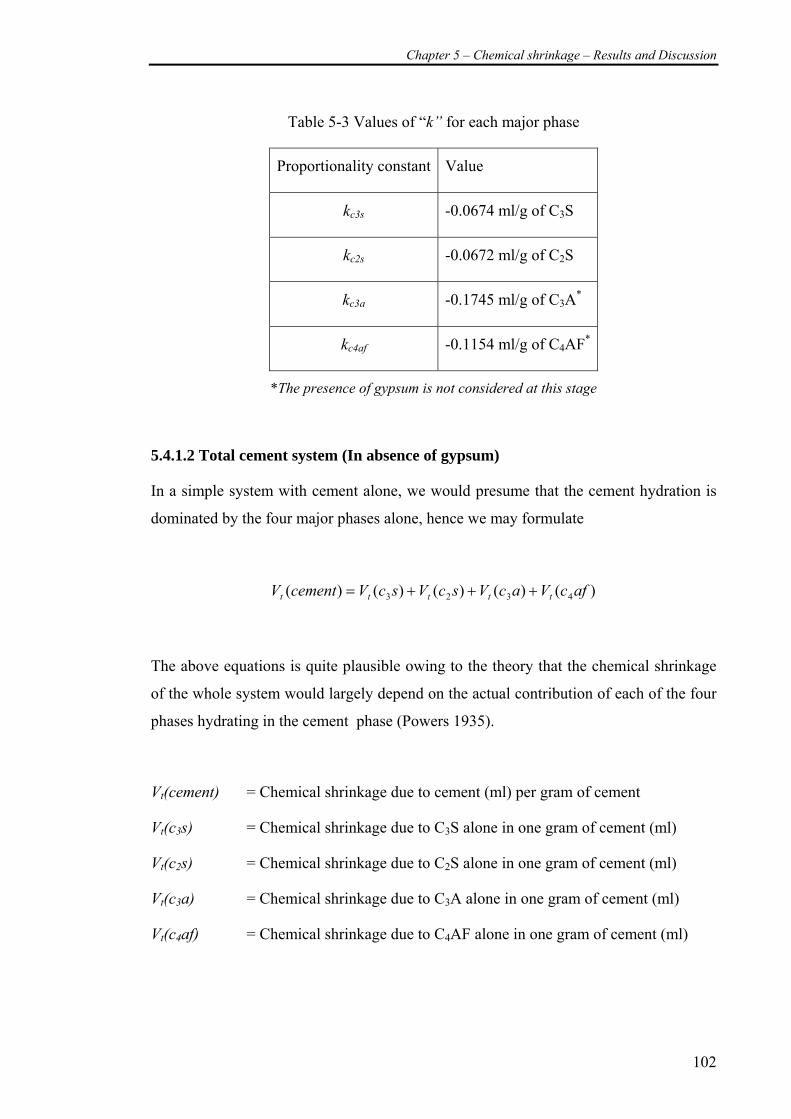
Chapter 5 – Chemical shrinkage – Results and Discussion
102
Table 5-3 Values of “k” for each major phase
Proportionality constant Value
kc3s -0.0674 ml/g of C3S
kc2s -0.0672 ml/g of C2S
kc3a -0.1745 ml/g of C3A*
kc4af -0.1154 ml/g of C4AF*
*The presence of gypsum is not considered at this stage
5.4.1.2 Total cement system (In absence of gypsum)
In a simple system with cement alone, we would presume that the cement hydration is
dominated by the four major phases alone, hence we may formulate
)()()()()( 4323 afcVacVscVscVcementV ttttt +++=
The above equations is quite plausible owing to the theory that the chemical shrinkage
of the whole system would largely depend on the actual contribution of each of the four
phases hydrating in the cement phase (Powers 1935).
Vt(cement) = Chemical shrinkage due to cement (ml) per gram of cement
Vt(c3s) = Chemical shrinkage due to C3S alone in one gram of cement (ml)
Vt(c2s) = Chemical shrinkage due to C2S alone in one gram of cement (ml)
Vt(c3a) = Chemical shrinkage due to C3A alone in one gram of cement (ml)
Vt(c4af) = Chemical shrinkage due to C4AF alone in one gram of cement (ml)
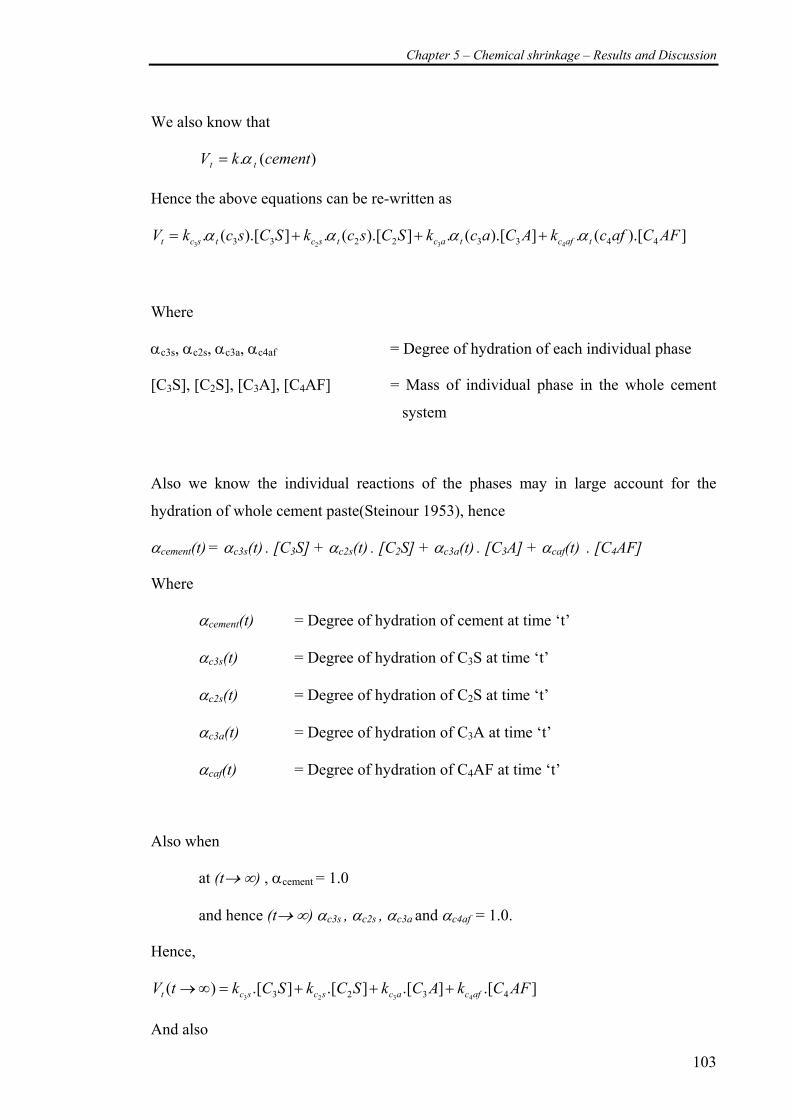
Chapter 5 – Chemical shrinkage – Results and Discussion
103
We also know that
)(. cementkV tt α=
Hence the above equations can be re-written as
]).[(.]).[(.]).[(.]).[(. 44332233 4323AFCafckACackSCsckSCsckV tafctactsctsct αααα +++=
Where
αc3s, αc2s, αc3a, αc4af = Degree of hydration of each individual phase
[C3S], [C2S], [C3A], [C4AF] = Mass of individual phase in the whole cement
system
Also we know the individual reactions of the phases may in large account for the
hydration of whole cement paste(Steinour 1953), hence
αcement(t) = αc3s(t) . [C3S] + αc2s(t) . [C2S] + αc3a(t) . [C3A] + αcaf(t) . [C4AF]
Where
αcement(t) = Degree of hydration of cement at time ‘t’
αc3s(t) = Degree of hydration of C3S at time ‘t’
αc2s(t) = Degree of hydration of C2S at time ‘t’
αc3a(t) = Degree of hydration of C3A at time ‘t’
αcaf(t) = Degree of hydration of C4AF at time ‘t’
Also when
at (t→ ∞) , αcement = 1.0
and hence (t→ ∞) αc3s , αc2s , αc3a and αc4af = 1.0.
Hence,
].[].[].[].[)( 4323 4323AFCkACkSCkSCktV afcacscsct +++=∞→
And also
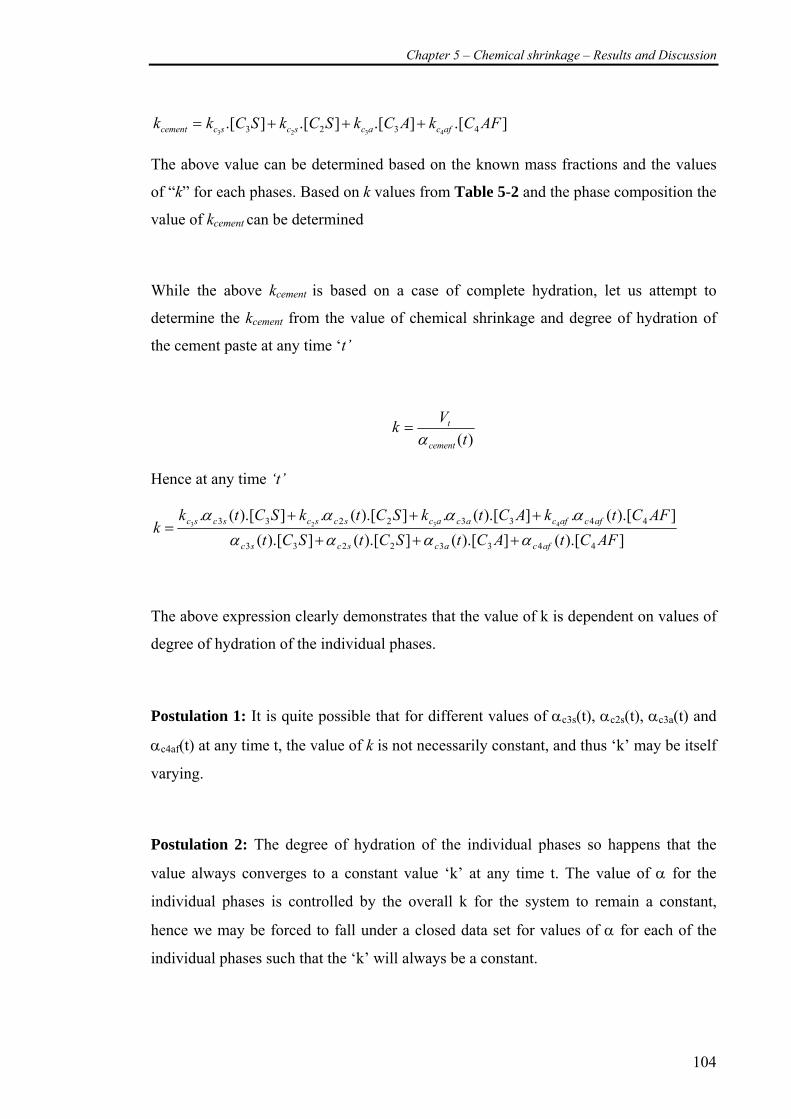
Chapter 5 – Chemical shrinkage – Results and Discussion
104
].[].[].[].[ 4323 4323AFCkACkSCkSCkk afcacscsccement +++=
The above value can be determined based on the known mass fractions and the values
of “k” for each phases. Based on k values from Table 5-2 and the phase composition the
value of kcement can be determined
While the above kcement is based on a case of complete hydration, let us attempt to
determine the kcement from the value of chemical shrinkage and degree of hydration of
the cement paste at any time ‘t’
)(tVk
cement
t
α=
Hence at any time ‘t’
]).[(]).[(]).[(]).[(]).[(.]).[(.]).[(.]).[(.
44332233
44332233 4323
AFCtACtSCtSCtAFCtkACtkSCtkSCtk
kafcacscsc
afcafcacacscscscsc
αααααααα
+++
+++=
The above expression clearly demonstrates that the value of k is dependent on values of
degree of hydration of the individual phases.
Postulation 1: It is quite possible that for different values of αc3s(t), αc2s(t), αc3a(t) and
αc4af(t) at any time t, the value of k is not necessarily constant, and thus ‘k’ may be itself
varying.
Postulation 2: The degree of hydration of the individual phases so happens that the
value always converges to a constant value ‘k’ at any time t. The value of α for the
individual phases is controlled by the overall k for the system to remain a constant,
hence we may be forced to fall under a closed data set for values of α for each of the
individual phases such that the ‘k’ will always be a constant.
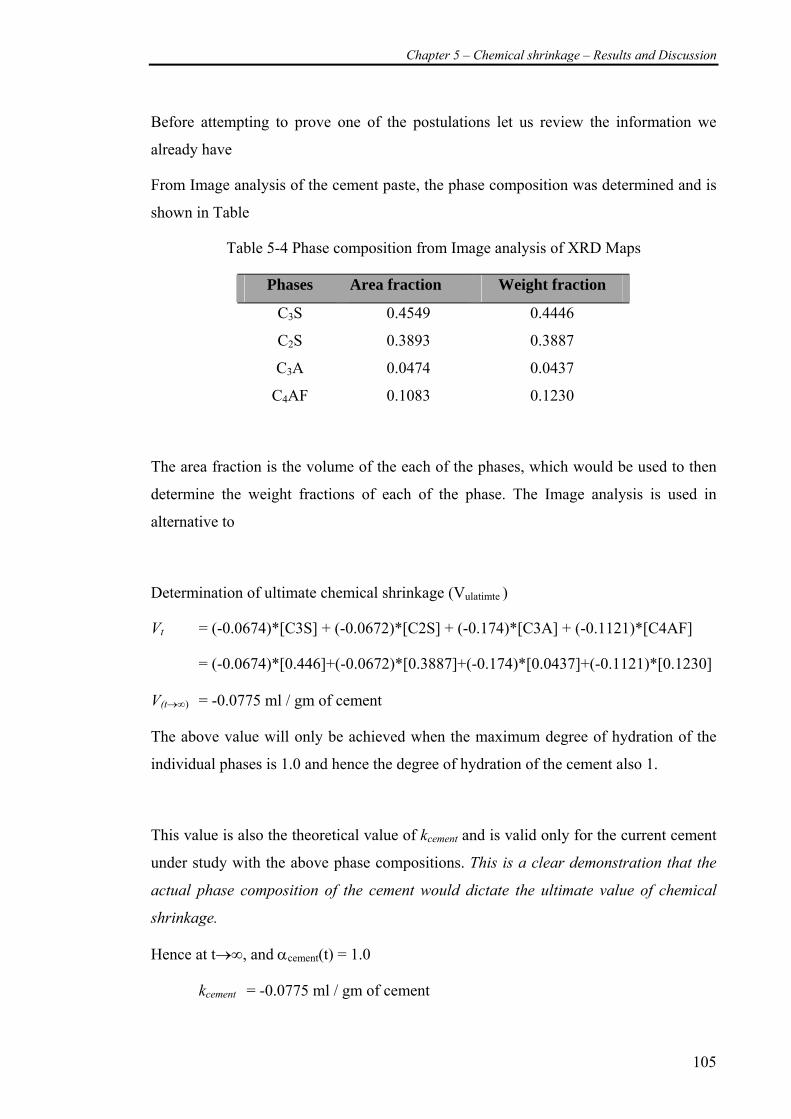
Chapter 5 – Chemical shrinkage – Results and Discussion
105
Before attempting to prove one of the postulations let us review the information we
already have
From Image analysis of the cement paste, the phase composition was determined and is
shown in Table
Table 5-4 Phase composition from Image analysis of XRD Maps
Phases Area fraction Weight fraction
C3S 0.4549 0.4446
C2S 0.3893 0.3887
C3A 0.0474 0.0437
C4AF 0.1083 0.1230
The area fraction is the volume of the each of the phases, which would be used to then
determine the weight fractions of each of the phase. The Image analysis is used in
alternative to
Determination of ultimate chemical shrinkage (Vulatimte )
Vt = (-0.0674)*[C3S] + (-0.0672)*[C2S] + (-0.174)*[C3A] + (-0.1121)*[C4AF]
= (-0.0674)*[0.446]+(-0.0672)*[0.3887]+(-0.174)*[0.0437]+(-0.1121)*[0.1230]
V(t→∞) = -0.0775 ml / gm of cement
The above value will only be achieved when the maximum degree of hydration of the
individual phases is 1.0 and hence the degree of hydration of the cement also 1.
This value is also the theoretical value of kcement and is valid only for the current cement
under study with the above phase compositions. This is a clear demonstration that the
actual phase composition of the cement would dictate the ultimate value of chemical
shrinkage.
Hence at t→∞, and αcement(t) = 1.0
kcement = -0.0775 ml / gm of cement
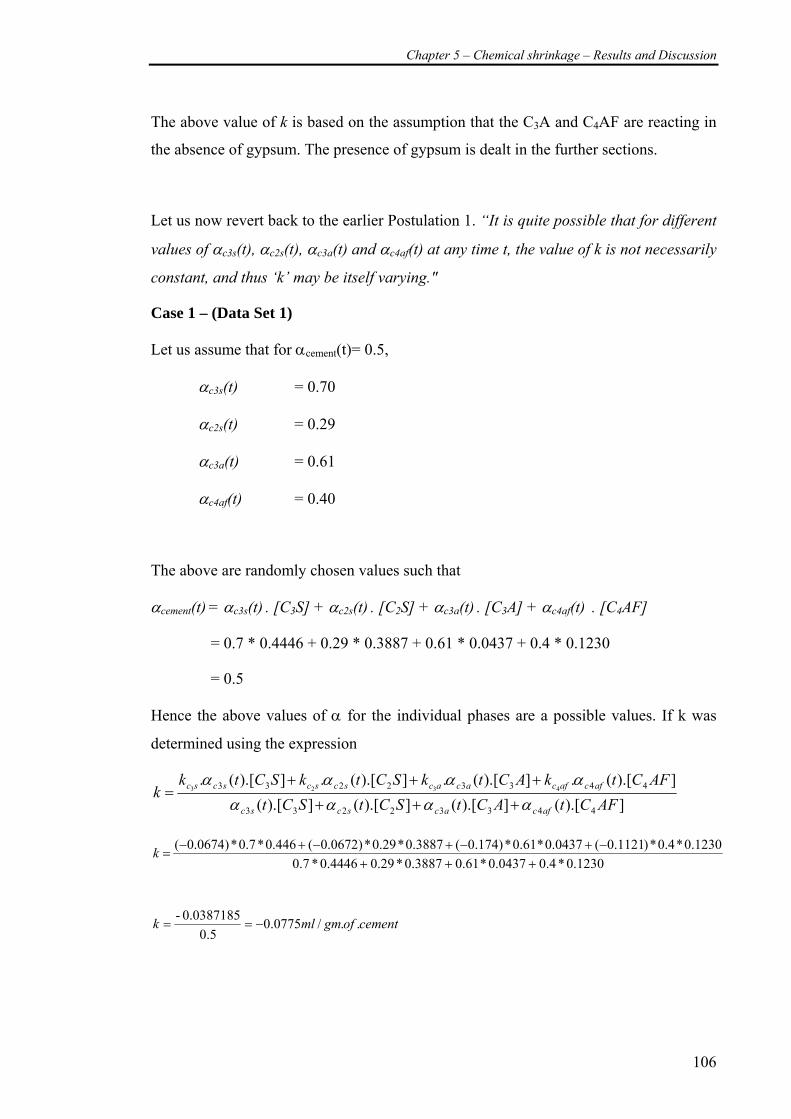
Chapter 5 – Chemical shrinkage – Results and Discussion
106
The above value of k is based on the assumption that the C3A and C4AF are reacting in
the absence of gypsum. The presence of gypsum is dealt in the further sections.
Let us now revert back to the earlier Postulation 1. “It is quite possible that for different
values of αc3s(t), αc2s(t), αc3a(t) and αc4af(t) at any time t, the value of k is not necessarily
constant, and thus ‘k’ may be itself varying."
Case 1 – (Data Set 1)
Let us assume that for αcement(t)= 0.5,
αc3s(t) = 0.70
αc2s(t) = 0.29
αc3a(t) = 0.61
αc4af(t) = 0.40
The above are randomly chosen values such that
αcement(t) = αc3s(t) . [C3S] + αc2s(t) . [C2S] + αc3a(t) . [C3A] + αc4af(t) . [C4AF]
= 0.7 * 0.4446 + 0.29 * 0.3887 + 0.61 * 0.0437 + 0.4 * 0.1230
= 0.5
Hence the above values of α for the individual phases are a possible values. If k was
determined using the expression
]).[(]).[(]).[(]).[(]).[(.]).[(.]).[(.]).[(.
44332233
44332233 4323
AFCtACtSCtSCtAFCtkACtkSCtkSCtk
kafcacscsc
afcafcacacscscscsc
αααααααα
+++
+++=
0.1230 * 0.4 0.0437 * 0.61 0.3887 * 0.29 0.4446 * 0.71230.0*4.0*)1121.0(0437.0*61.0*)174.0(3887.0*29.0*)0672.0(446.0*7.0*)0674.0(
+++−+−+−+−
=k
cementofgmmlk ../0775.05.0
0.0387185-−==
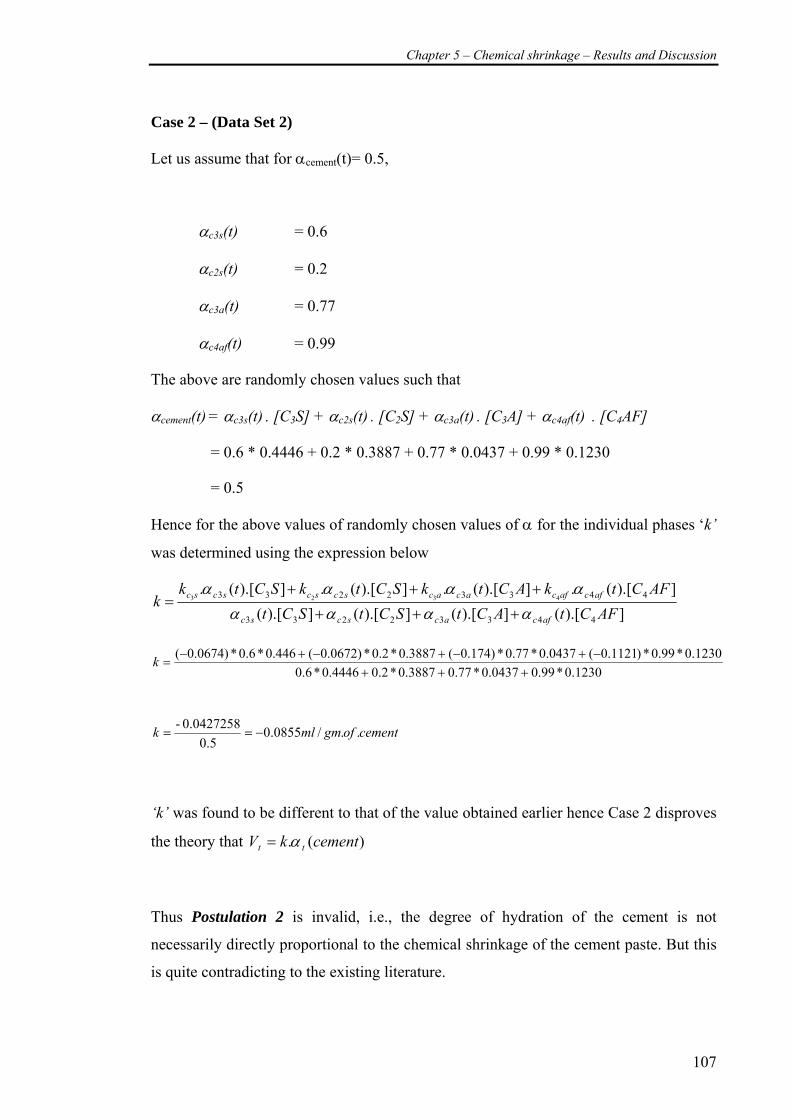
Chapter 5 – Chemical shrinkage – Results and Discussion
107
Case 2 – (Data Set 2)
Let us assume that for αcement(t)= 0.5,
αc3s(t) = 0.6
αc2s(t) = 0.2
αc3a(t) = 0.77
αc4af(t) = 0.99
The above are randomly chosen values such that
αcement(t) = αc3s(t) . [C3S] + αc2s(t) . [C2S] + αc3a(t) . [C3A] + αc4af(t) . [C4AF]
= 0.6 * 0.4446 + 0.2 * 0.3887 + 0.77 * 0.0437 + 0.99 * 0.1230
= 0.5
Hence for the above values of randomly chosen values of α for the individual phases ‘k’
was determined using the expression below
]).[(]).[(]).[(]).[(]).[(.]).[(.]).[(.]).[(.
44332233
44332233 4323
AFCtACtSCtSCtAFCtkACtkSCtkSCtk
kafcacscsc
afcafcacacscscscsc
αααααααα
+++
+++=
0.1230 *0.990.0437*0.770.3887*0.20.4446 * 0.61230.0*99.0*)1121.0(0437.0*77.0*)174.0(3887.0*2.0*)0672.0(446.0*6.0*)0674.0(
+++−+−+−+−
=k
cementofgmmlk ../0855.05.0
0.0427258-−==
‘k’ was found to be different to that of the value obtained earlier hence Case 2 disproves
the theory that )(. cementkV tt α=
Thus Postulation 2 is invalid, i.e., the degree of hydration of the cement is not
necessarily directly proportional to the chemical shrinkage of the cement paste. But this
is quite contradicting to the existing literature.
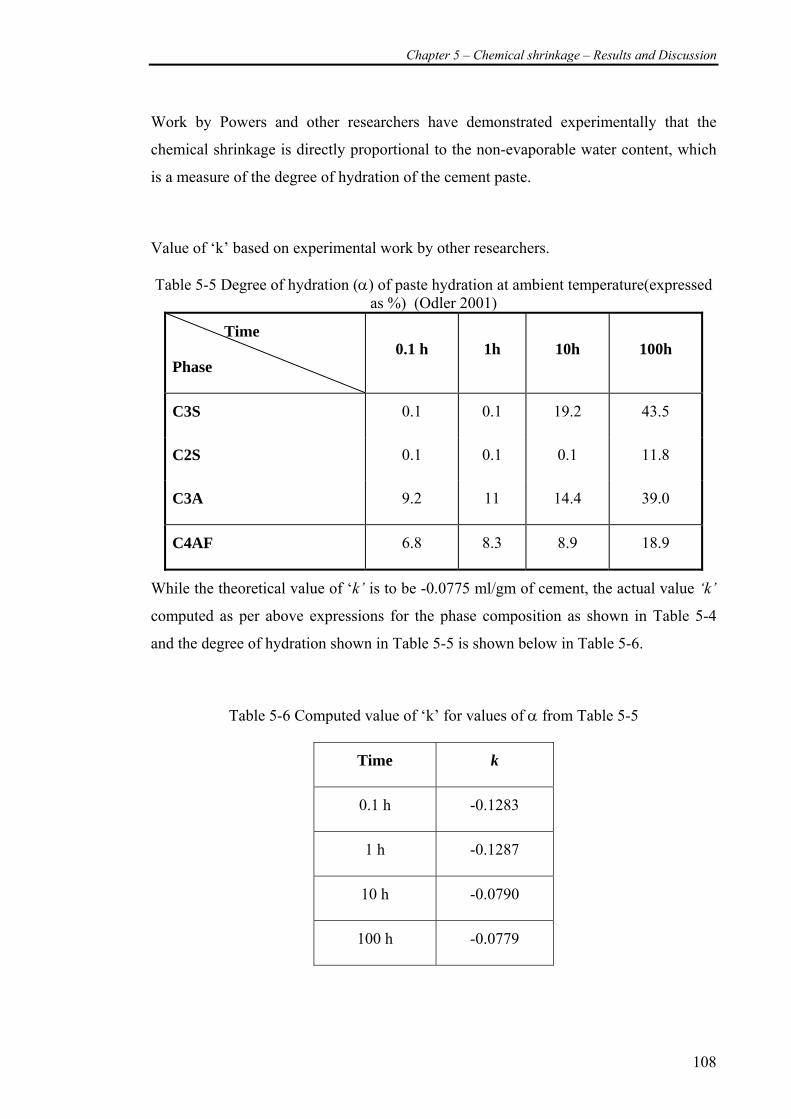
Chapter 5 – Chemical shrinkage – Results and Discussion
108
Work by Powers and other researchers have demonstrated experimentally that the
chemical shrinkage is directly proportional to the non-evaporable water content, which
is a measure of the degree of hydration of the cement paste.
Value of ‘k’ based on experimental work by other researchers.
Table 5-5 Degree of hydration (α) of paste hydration at ambient temperature(expressed as %) (Odler 2001)
Time
Phase 0.1 h 1h 10h 100h
C3S 0.1 0.1 19.2 43.5
C2S 0.1 0.1 0.1 11.8
C3A 9.2 11 14.4 39.0
C4AF 6.8 8.3 8.9 18.9
While the theoretical value of ‘k’ is to be -0.0775 ml/gm of cement, the actual value ‘k’
computed as per above expressions for the phase composition as shown in Table 5-4
and the degree of hydration shown in Table 5-5 is shown below in Table 5-6.
Table 5-6 Computed value of ‘k’ for values of α from Table 5-5
Time k
0.1 h -0.1283
1 h -0.1287
10 h -0.0790
100 h -0.0779
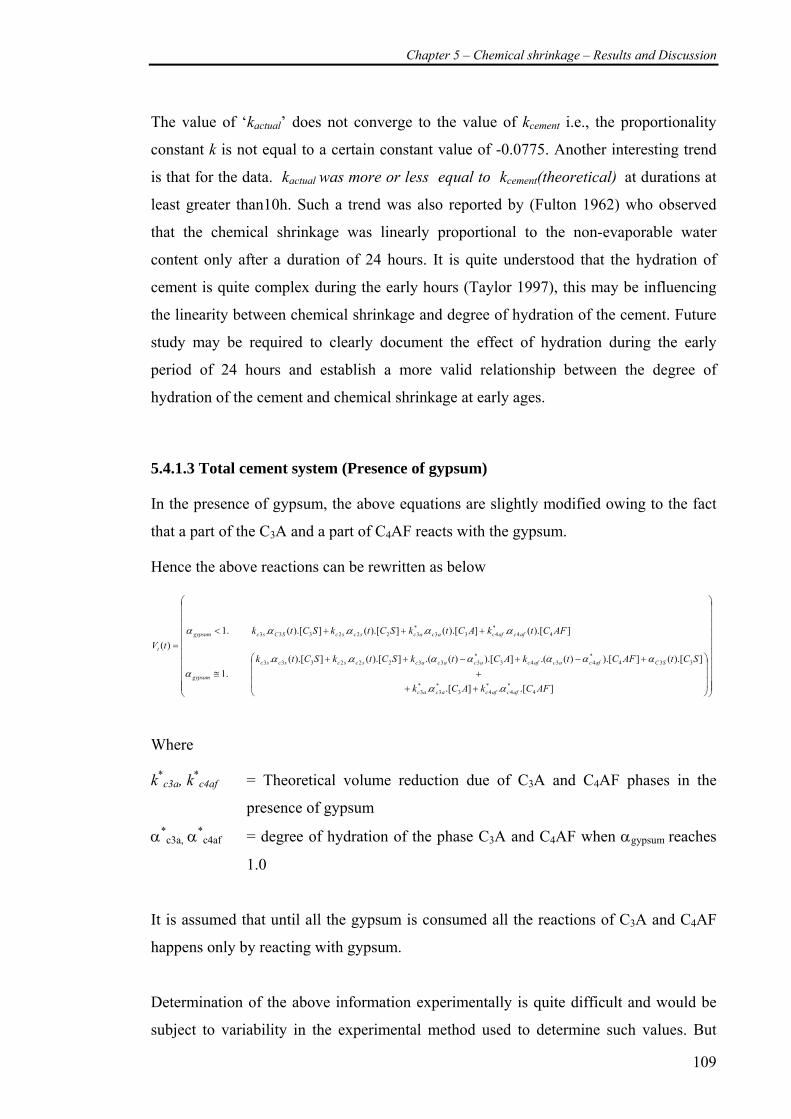
Chapter 5 – Chemical shrinkage – Results and Discussion
109
The value of ‘kactual’ does not converge to the value of kcement i.e., the proportionality
constant k is not equal to a certain constant value of -0.0775. Another interesting trend
is that for the data. kactual was more or less equal to kcement(theoretical) at durations at
least greater than10h. Such a trend was also reported by (Fulton 1962) who observed
that the chemical shrinkage was linearly proportional to the non-evaporable water
content only after a duration of 24 hours. It is quite understood that the hydration of
cement is quite complex during the early hours (Taylor 1997), this may be influencing
the linearity between chemical shrinkage and degree of hydration of the cement. Future
study may be required to clearly document the effect of hydration during the early
period of 24 hours and establish a more valid relationship between the degree of
hydration of the cement and chemical shrinkage at early ages.
5.4.1.3 Total cement system (Presence of gypsum)
In the presence of gypsum, the above equations are slightly modified owing to the fact
that a part of the C3A and a part of C4AF reacts with the gypsum.
Hence the above reactions can be rewritten as below
⎟⎟⎟⎟⎟⎟⎟⎟⎟⎟
⎠
⎞
⎜⎜⎜⎜⎜⎜⎜⎜⎜⎜
⎝
⎛
⎟⎟⎟
⎠
⎞
⎜⎜⎜
⎝
⎛
+++
+−+−++≅
+++<=
].[.].[.
]).[(]).[)(.(]).[)(.(]).[(.]).[(..1
]).[(.]).[(.]).[(.]).[(..1)(
4*4
*43
*3
*3
334*4343
*333222333
44*433
*3222333
AFCkACk
SCtAFCtkACtkSCtkSCtk
AFCtkACtkSCtkSCtktV
afcafcacac
SCafcacafcacacacscscscsc
gypsum
afcafcacacscscSCscgypsum
t
αα
αααααααα
ααααα
Where
k*c3a, k*
c4af = Theoretical volume reduction due of C3A and C4AF phases in the
presence of gypsum
α*c3a, α*
c4af = degree of hydration of the phase C3A and C4AF when αgypsum reaches
1.0
It is assumed that until all the gypsum is consumed all the reactions of C3A and C4AF
happens only by reacting with gypsum.
Determination of the above information experimentally is quite difficult and would be
subject to variability in the experimental method used to determine such values. But
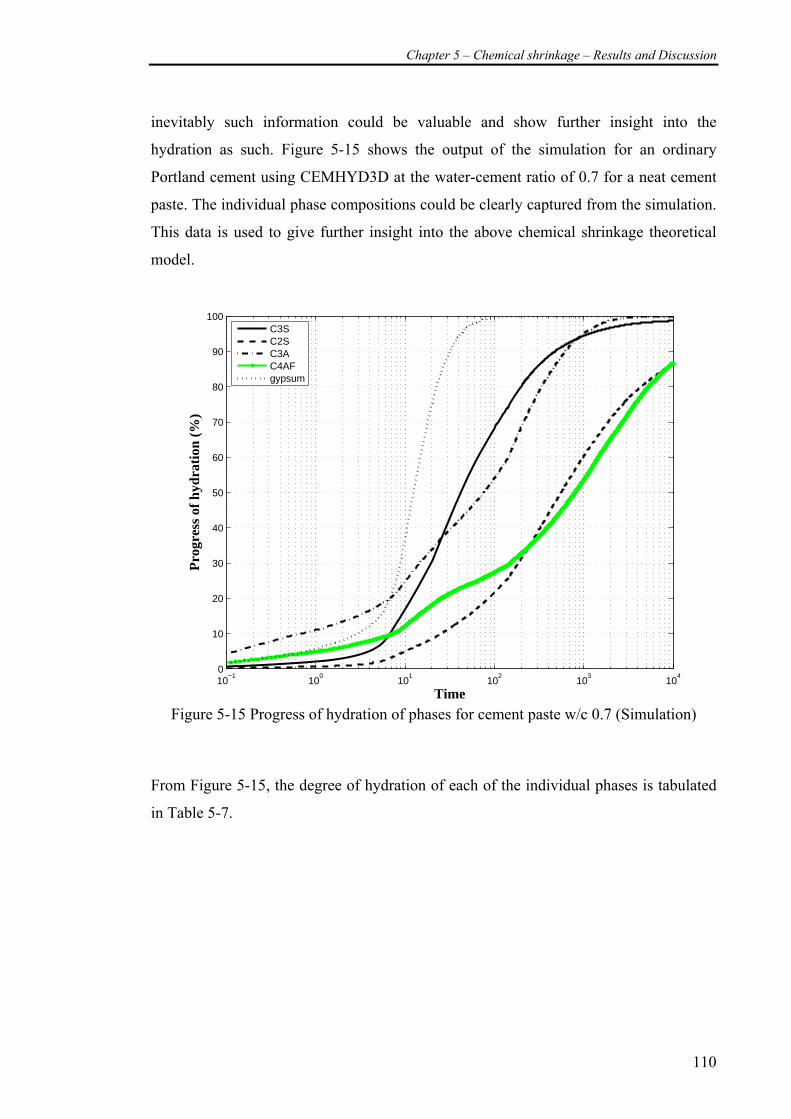
Chapter 5 – Chemical shrinkage – Results and Discussion
110
inevitably such information could be valuable and show further insight into the
hydration as such. Figure 5-15 shows the output of the simulation for an ordinary
Portland cement using CEMHYD3D at the water-cement ratio of 0.7 for a neat cement
paste. The individual phase compositions could be clearly captured from the simulation.
This data is used to give further insight into the above chemical shrinkage theoretical
model.
10−1
100
101
102
103
104
0
10
20
30
40
50
60
70
80
90
100
Time
Pro
gres
s of
hyd
rati
on (
%)
C3SC2SC3AC4AFgypsum
Figure 5-15 Progress of hydration of phases for cement paste w/c 0.7 (Simulation)
From Figure 5-15, the degree of hydration of each of the individual phases is tabulated
in Table 5-7.
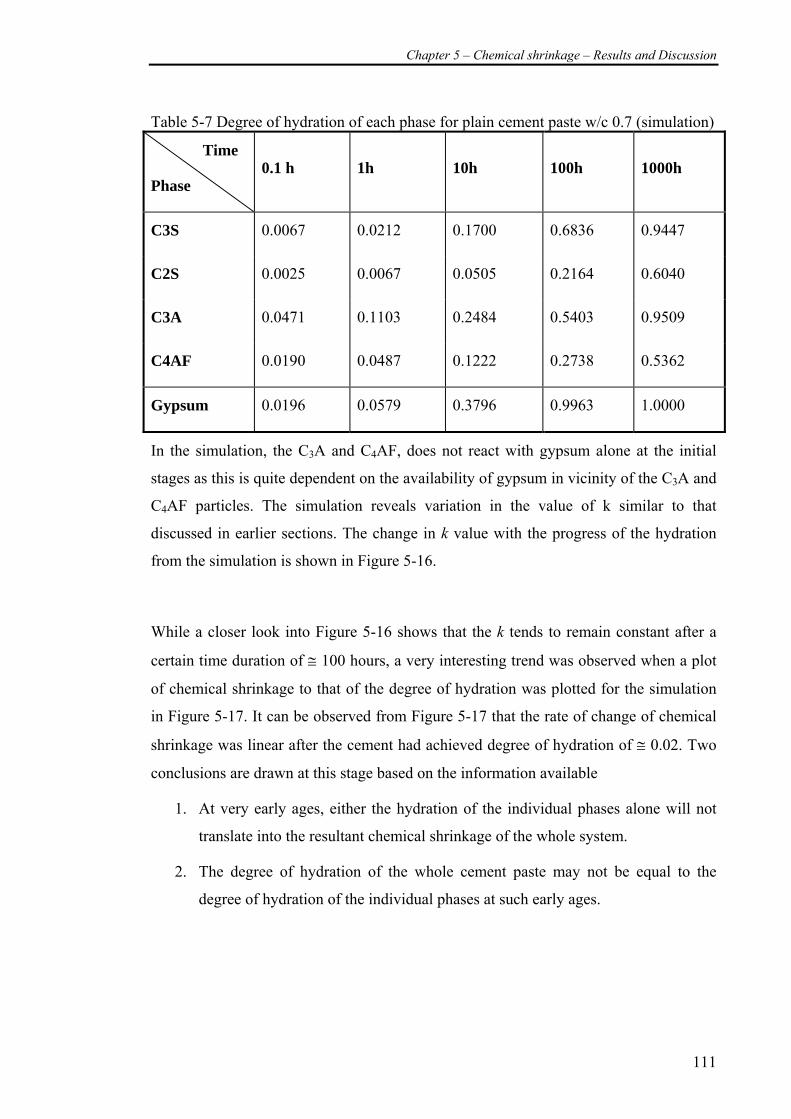
Chapter 5 – Chemical shrinkage – Results and Discussion
111
Table 5-7 Degree of hydration of each phase for plain cement paste w/c 0.7 (simulation)
Time
Phase 0.1 h 1h 10h 100h 1000h
C3S 0.0067 0.0212 0.1700 0.6836 0.9447
C2S 0.0025 0.0067 0.0505 0.2164 0.6040
C3A 0.0471 0.1103 0.2484 0.5403 0.9509
C4AF 0.0190 0.0487 0.1222 0.2738 0.5362
Gypsum 0.0196 0.0579 0.3796 0.9963 1.0000
In the simulation, the C3A and C4AF, does not react with gypsum alone at the initial
stages as this is quite dependent on the availability of gypsum in vicinity of the C3A and
C4AF particles. The simulation reveals variation in the value of k similar to that
discussed in earlier sections. The change in k value with the progress of the hydration
from the simulation is shown in Figure 5-16.
While a closer look into Figure 5-16 shows that the k tends to remain constant after a
certain time duration of ≅ 100 hours, a very interesting trend was observed when a plot
of chemical shrinkage to that of the degree of hydration was plotted for the simulation
in Figure 5-17. It can be observed from Figure 5-17 that the rate of change of chemical
shrinkage was linear after the cement had achieved degree of hydration of ≅ 0.02. Two
conclusions are drawn at this stage based on the information available
1. At very early ages, either the hydration of the individual phases alone will not
translate into the resultant chemical shrinkage of the whole system.
2. The degree of hydration of the whole cement paste may not be equal to the
degree of hydration of the individual phases at such early ages.
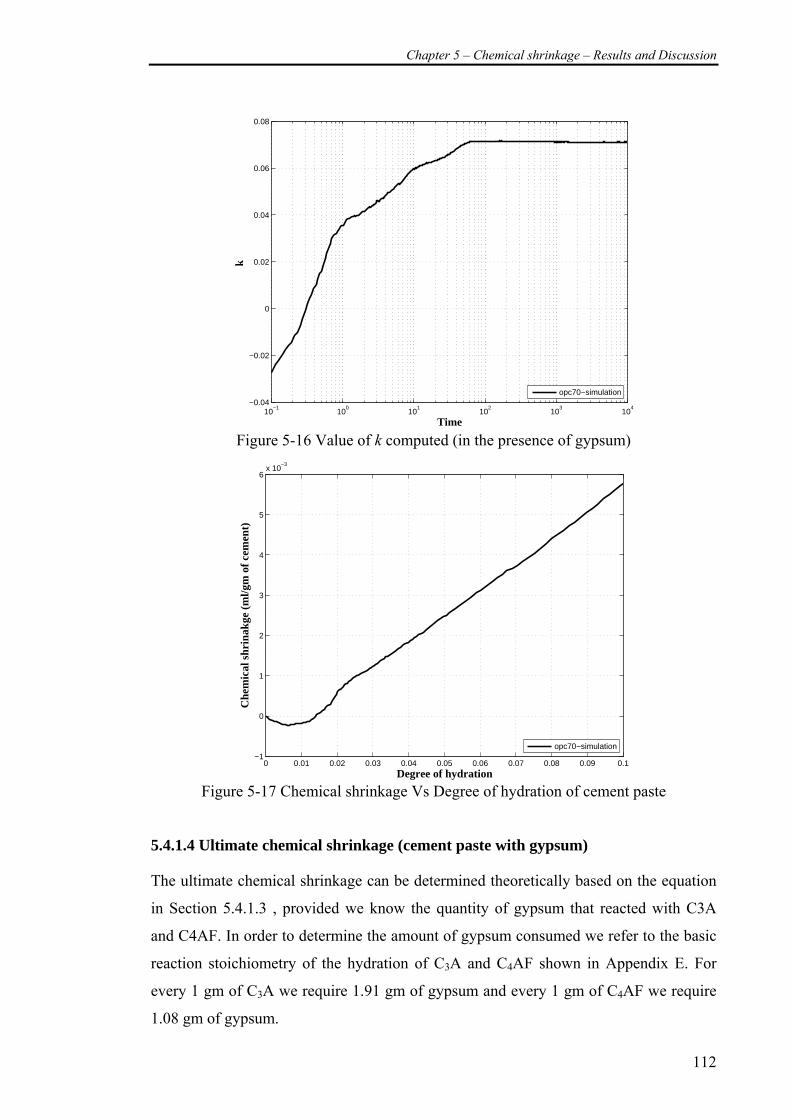
Chapter 5 – Chemical shrinkage – Results and Discussion
112
10−1
100
101
102
103
104
−0.04
−0.02
0
0.02
0.04
0.06
0.08
Time
k
opc70−simulation
Figure 5-16 Value of k computed (in the presence of gypsum)
0 0.01 0.02 0.03 0.04 0.05 0.06 0.07 0.08 0.09 0.1−1
0
1
2
3
4
5
6x 10
−3
Degree of hydration
Che
mic
al s
hrin
akge
(m
l/gm
of
cem
ent)
opc70−simulation
Figure 5-17 Chemical shrinkage Vs Degree of hydration of cement paste
5.4.1.4 Ultimate chemical shrinkage (cement paste with gypsum)
The ultimate chemical shrinkage can be determined theoretically based on the equation
in Section 5.4.1.3 , provided we know the quantity of gypsum that reacted with C3A
and C4AF. In order to determine the amount of gypsum consumed we refer to the basic
reaction stoichiometry of the hydration of C3A and C4AF shown in Appendix E. For
every 1 gm of C3A we require 1.91 gm of gypsum and every 1 gm of C4AF we require
1.08 gm of gypsum.
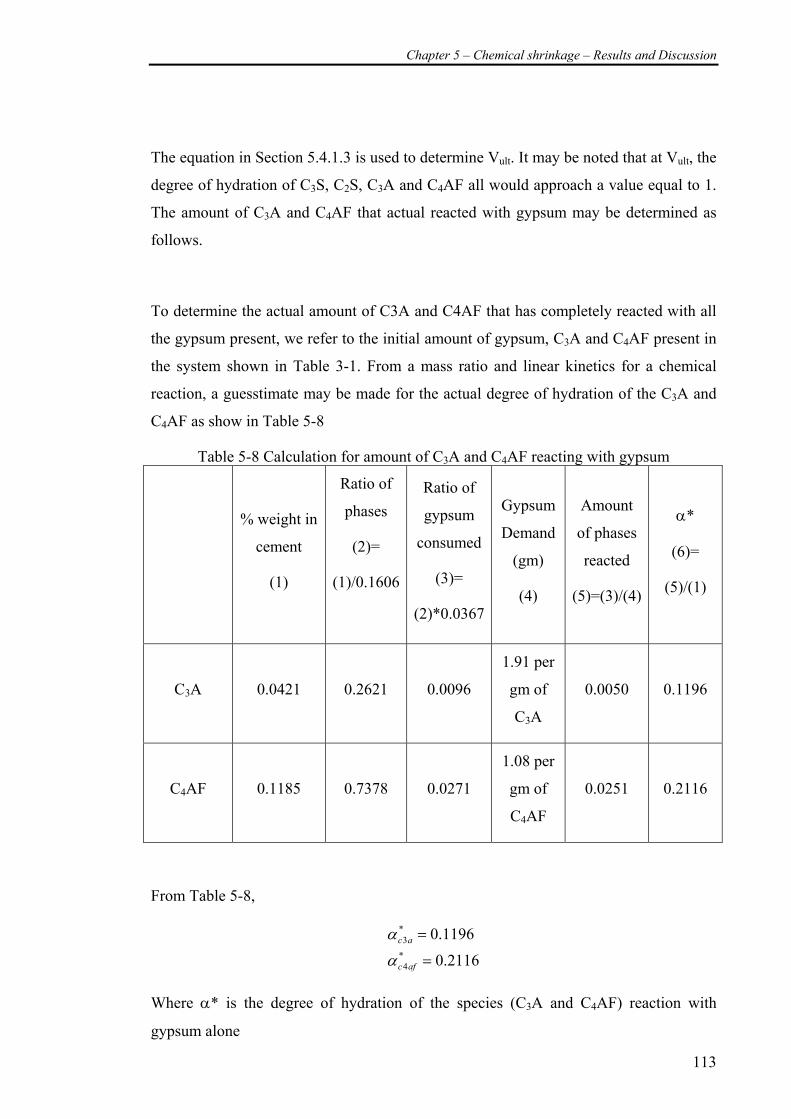
Chapter 5 – Chemical shrinkage – Results and Discussion
113
The equation in Section 5.4.1.3 is used to determine Vult. It may be noted that at Vult, the
degree of hydration of C3S, C2S, C3A and C4AF all would approach a value equal to 1.
The amount of C3A and C4AF that actual reacted with gypsum may be determined as
follows.
To determine the actual amount of C3A and C4AF that has completely reacted with all
the gypsum present, we refer to the initial amount of gypsum, C3A and C4AF present in
the system shown in Table 3-1. From a mass ratio and linear kinetics for a chemical
reaction, a guesstimate may be made for the actual degree of hydration of the C3A and
C4AF as show in Table 5-8
Table 5-8 Calculation for amount of C3A and C4AF reacting with gypsum
% weight in
cement
(1)
Ratio of
phases
(2)=
(1)/0.1606
Ratio of
gypsum
consumed
(3)=
(2)*0.0367
Gypsum
Demand
(gm)
(4)
Amount
of phases
reacted
(5)=(3)/(4)
α*
(6)=
(5)/(1)
C3A 0.0421 0.2621 0.0096
1.91 per
gm of
C3A
0.0050 0.1196
C4AF 0.1185 0.7378 0.0271
1.08 per
gm of
C4AF
0.0251 0.2116
From Table 5-8,
2116.0
1196.0*4
*3
=
=
afc
ac
α
α
Where α* is the degree of hydration of the species (C3A and C4AF) reaction with
gypsum alone
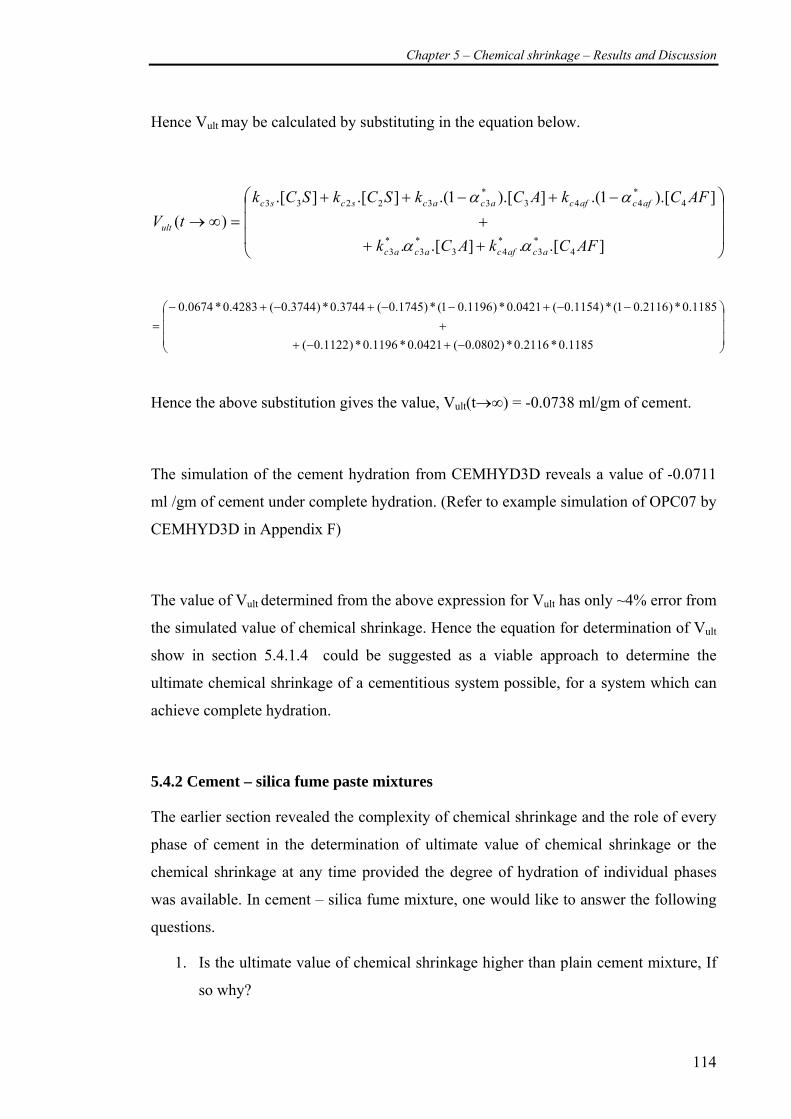
Chapter 5 – Chemical shrinkage – Results and Discussion
114
Hence Vult may be calculated by substituting in the equation below.
⎟⎟⎟
⎠
⎞
⎜⎜⎜
⎝
⎛
+++
−+−++=∞→
].[.].[.
]).[1.(]).[1.(].[].[)(
4*3
*43
*3
*3
4*443
*332233
AFCkACk
AFCkACkSCkSCktV
acafcacac
afcafcacacscsc
ult
αα
αα
⎟⎟⎟
⎠
⎞
⎜⎜⎜
⎝
⎛
−+−++
−−+−−+−+−=
1185.0*2116.0*)0802.0(0421.0*1196.0*)1122.0(
1185.0*)2116.01(*)1154.0(0421.0*)1196.01(*)1745.0(3744.0*)3744.0(4283.0*0674.0
Hence the above substitution gives the value, Vult(t→∞) = -0.0738 ml/gm of cement.
The simulation of the cement hydration from CEMHYD3D reveals a value of -0.0711
ml /gm of cement under complete hydration. (Refer to example simulation of OPC07 by
CEMHYD3D in Appendix F)
The value of Vult determined from the above expression for Vult has only ~4% error from
the simulated value of chemical shrinkage. Hence the equation for determination of Vult
show in section 5.4.1.4 could be suggested as a viable approach to determine the
ultimate chemical shrinkage of a cementitious system possible, for a system which can
achieve complete hydration.
5.4.2 Cement – silica fume paste mixtures
The earlier section revealed the complexity of chemical shrinkage and the role of every
phase of cement in the determination of ultimate value of chemical shrinkage or the
chemical shrinkage at any time provided the degree of hydration of individual phases
was available. In cement – silica fume mixture, one would like to answer the following
questions.
1. Is the ultimate value of chemical shrinkage higher than plain cement mixture, If
so why?
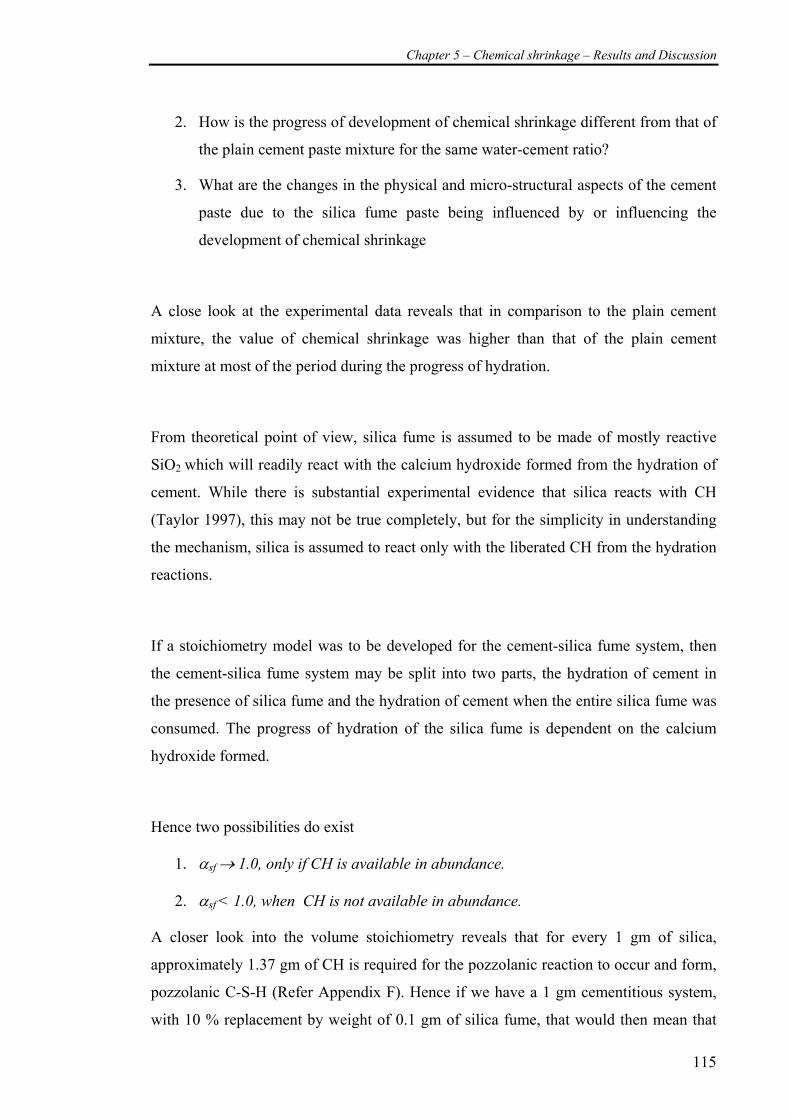
Chapter 5 – Chemical shrinkage – Results and Discussion
115
2. How is the progress of development of chemical shrinkage different from that of
the plain cement paste mixture for the same water-cement ratio?
3. What are the changes in the physical and micro-structural aspects of the cement
paste due to the silica fume paste being influenced by or influencing the
development of chemical shrinkage
A close look at the experimental data reveals that in comparison to the plain cement
mixture, the value of chemical shrinkage was higher than that of the plain cement
mixture at most of the period during the progress of hydration.
From theoretical point of view, silica fume is assumed to be made of mostly reactive
SiO2 which will readily react with the calcium hydroxide formed from the hydration of
cement. While there is substantial experimental evidence that silica reacts with CH
(Taylor 1997), this may not be true completely, but for the simplicity in understanding
the mechanism, silica is assumed to react only with the liberated CH from the hydration
reactions.
If a stoichiometry model was to be developed for the cement-silica fume system, then
the cement-silica fume system may be split into two parts, the hydration of cement in
the presence of silica fume and the hydration of cement when the entire silica fume was
consumed. The progress of hydration of the silica fume is dependent on the calcium
hydroxide formed.
Hence two possibilities do exist
1. αsf → 1.0, only if CH is available in abundance.
2. αsf < 1.0, when CH is not available in abundance.
A closer look into the volume stoichiometry reveals that for every 1 gm of silica,
approximately 1.37 gm of CH is required for the pozzolanic reaction to occur and form,
pozzolanic C-S-H (Refer Appendix F). Hence if we have a 1 gm cementitious system,
with 10 % replacement by weight of 0.1 gm of silica fume, that would then mean that
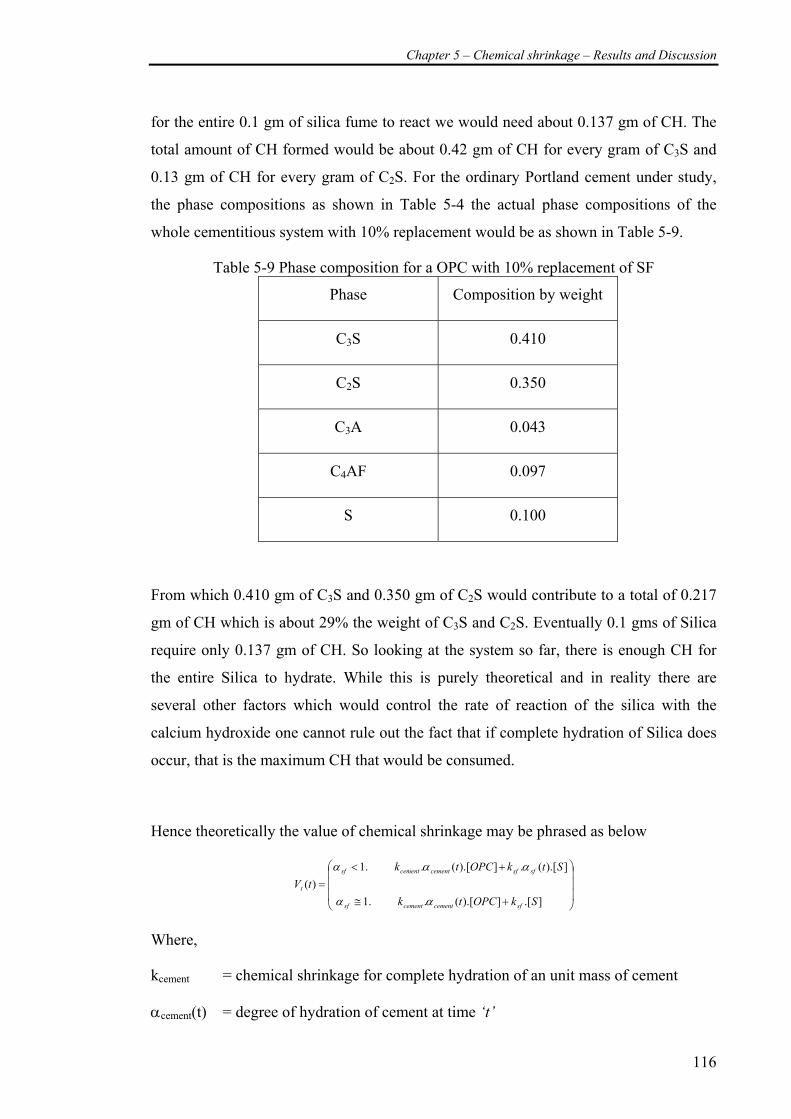
Chapter 5 – Chemical shrinkage – Results and Discussion
116
for the entire 0.1 gm of silica fume to react we would need about 0.137 gm of CH. The
total amount of CH formed would be about 0.42 gm of CH for every gram of C3S and
0.13 gm of CH for every gram of C2S. For the ordinary Portland cement under study,
the phase compositions as shown in Table 5-4 the actual phase compositions of the
whole cementitious system with 10% replacement would be as shown in Table 5-9.
Table 5-9 Phase composition for a OPC with 10% replacement of SF
Phase Composition by weight
C3S 0.410
C2S 0.350
C3A 0.043
C4AF 0.097
S 0.100
From which 0.410 gm of C3S and 0.350 gm of C2S would contribute to a total of 0.217
gm of CH which is about 29% the weight of C3S and C2S. Eventually 0.1 gms of Silica
require only 0.137 gm of CH. So looking at the system so far, there is enough CH for
the entire Silica to hydrate. While this is purely theoretical and in reality there are
several other factors which would control the rate of reaction of the silica with the
calcium hydroxide one cannot rule out the fact that if complete hydration of Silica does
occur, that is the maximum CH that would be consumed.
Hence theoretically the value of chemical shrinkage may be phrased as below
⎟⎟⎟
⎠
⎞
⎜⎜⎜
⎝
⎛
+≅
+<=
].[]).[(..1
]).[(.]).[(..1)(
SkOPCtk
StkOPCtktV
sfcementcementsf
sfsfcementcementsf
t
αα
ααα
Where,
kcement = chemical shrinkage for complete hydration of an unit mass of cement
αcement(t) = degree of hydration of cement at time ‘t’
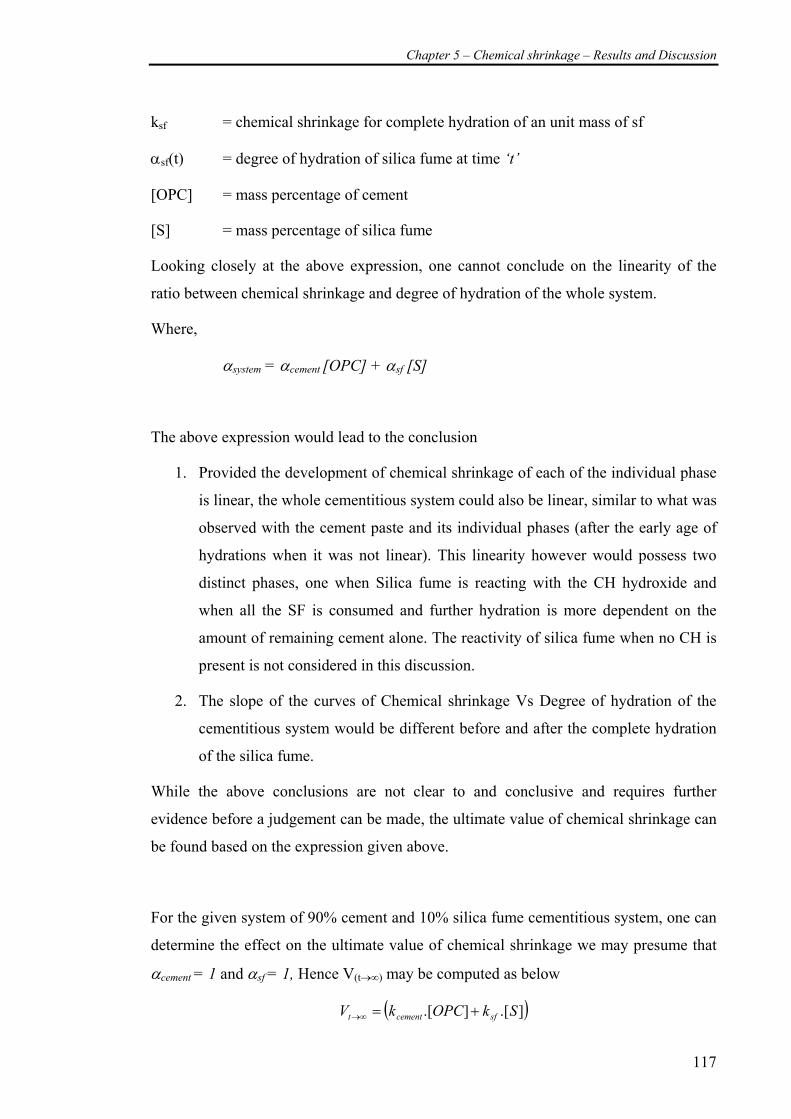
Chapter 5 – Chemical shrinkage – Results and Discussion
117
ksf = chemical shrinkage for complete hydration of an unit mass of sf
αsf(t) = degree of hydration of silica fume at time ‘t’
[OPC] = mass percentage of cement
[S] = mass percentage of silica fume
Looking closely at the above expression, one cannot conclude on the linearity of the
ratio between chemical shrinkage and degree of hydration of the whole system.
Where,
αsystem = αcement [OPC] + αsf [S]
The above expression would lead to the conclusion
1. Provided the development of chemical shrinkage of each of the individual phase
is linear, the whole cementitious system could also be linear, similar to what was
observed with the cement paste and its individual phases (after the early age of
hydrations when it was not linear). This linearity however would possess two
distinct phases, one when Silica fume is reacting with the CH hydroxide and
when all the SF is consumed and further hydration is more dependent on the
amount of remaining cement alone. The reactivity of silica fume when no CH is
present is not considered in this discussion.
2. The slope of the curves of Chemical shrinkage Vs Degree of hydration of the
cementitious system would be different before and after the complete hydration
of the silica fume.
While the above conclusions are not clear to and conclusive and requires further
evidence before a judgement can be made, the ultimate value of chemical shrinkage can
be found based on the expression given above.
For the given system of 90% cement and 10% silica fume cementitious system, one can
determine the effect on the ultimate value of chemical shrinkage we may presume that
αcement = 1 and αsf = 1, Hence V(t→∞) may be computed as below
( )].[].[ SkOPCkV sfcementt +=∞→
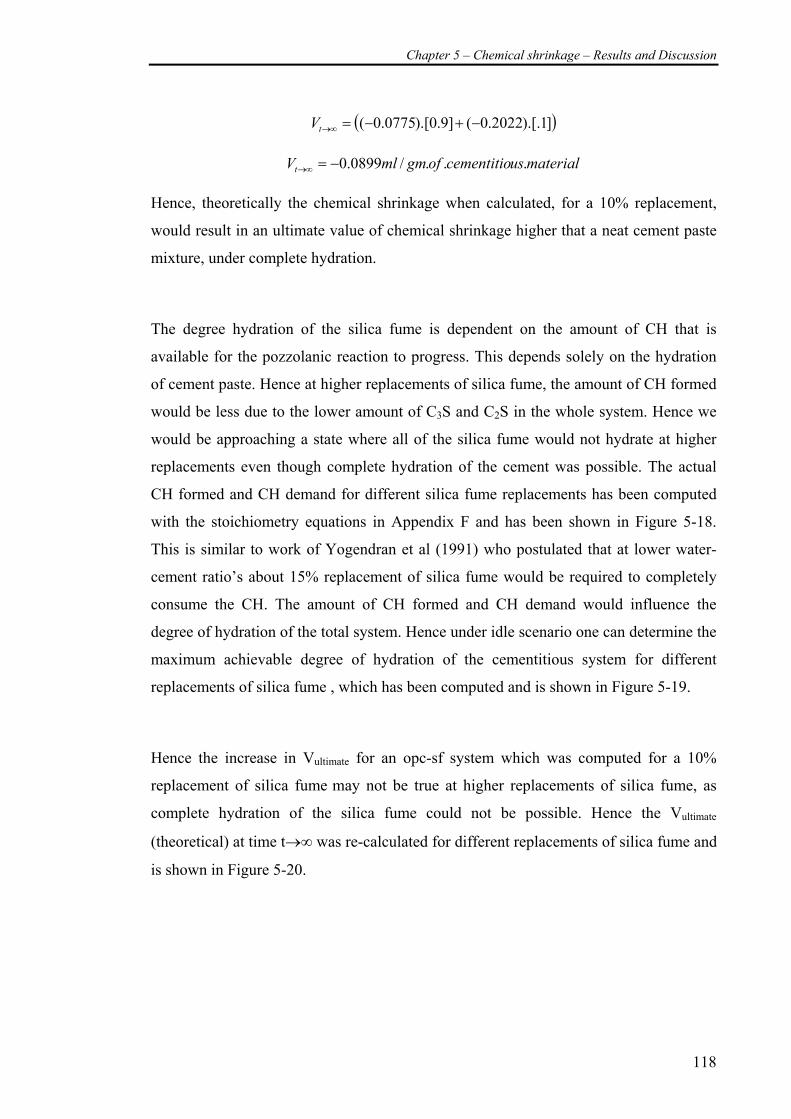
Chapter 5 – Chemical shrinkage – Results and Discussion
118
( )]1).[.2022.0(]9.0).[0775.0( −+−=∞→tV
materialuscementitioofgmmlVt .../0899.0−=∞→
Hence, theoretically the chemical shrinkage when calculated, for a 10% replacement,
would result in an ultimate value of chemical shrinkage higher that a neat cement paste
mixture, under complete hydration.
The degree hydration of the silica fume is dependent on the amount of CH that is
available for the pozzolanic reaction to progress. This depends solely on the hydration
of cement paste. Hence at higher replacements of silica fume, the amount of CH formed
would be less due to the lower amount of C3S and C2S in the whole system. Hence we
would be approaching a state where all of the silica fume would not hydrate at higher
replacements even though complete hydration of the cement was possible. The actual
CH formed and CH demand for different silica fume replacements has been computed
with the stoichiometry equations in Appendix F and has been shown in Figure 5-18.
This is similar to work of Yogendran et al (1991) who postulated that at lower water-
cement ratio’s about 15% replacement of silica fume would be required to completely
consume the CH. The amount of CH formed and CH demand would influence the
degree of hydration of the total system. Hence under idle scenario one can determine the
maximum achievable degree of hydration of the cementitious system for different
replacements of silica fume , which has been computed and is shown in Figure 5-19.
Hence the increase in Vultimate for an opc-sf system which was computed for a 10%
replacement of silica fume may not be true at higher replacements of silica fume, as
complete hydration of the silica fume could not be possible. Hence the Vultimate
(theoretical) at time t→∞ was re-calculated for different replacements of silica fume and
is shown in Figure 5-20.
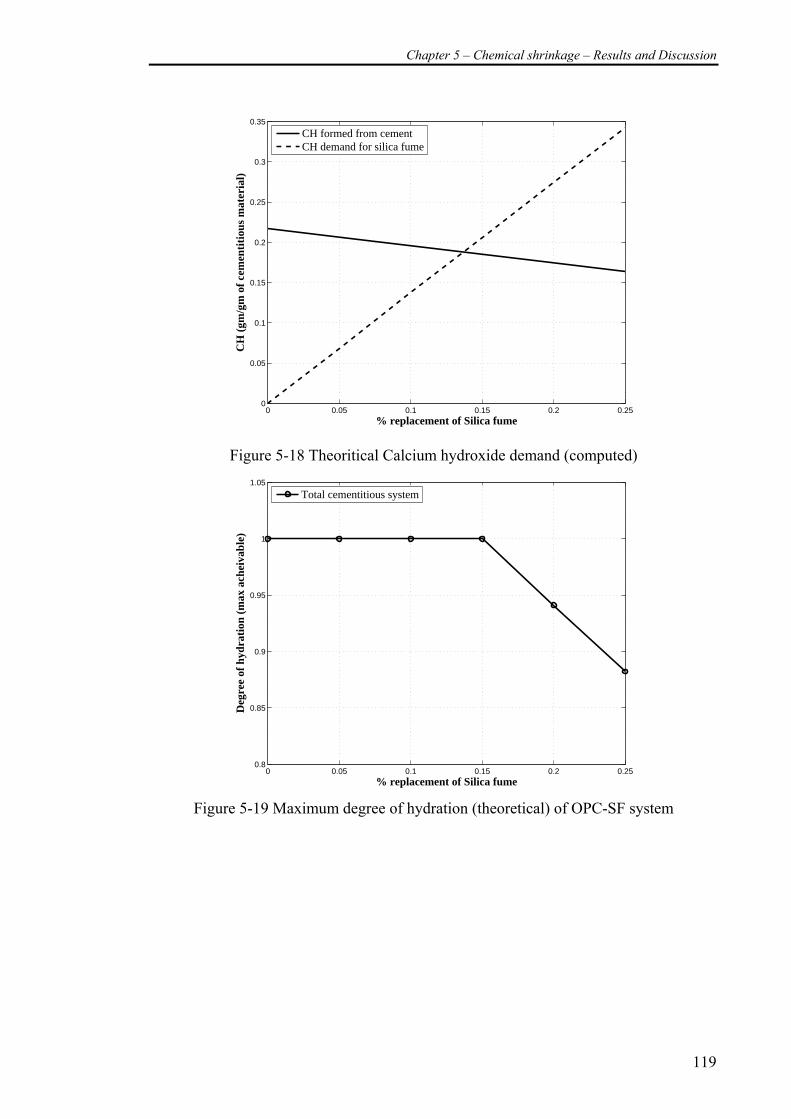
Chapter 5 – Chemical shrinkage – Results and Discussion
119
0 0.05 0.1 0.15 0.2 0.250
0.05
0.1
0.15
0.2
0.25
0.3
0.35
% replacement of Silica fume
CH
(gm
/gm
of
cem
enti
tiou
s m
ater
ial)
CH formed from cementCH demand for silica fume
Figure 5-18 Theoritical Calcium hydroxide demand (computed)
0 0.05 0.1 0.15 0.2 0.250.8
0.85
0.9
0.95
1
1.05
% replacement of Silica fume
Deg
ree
of h
ydra
tion
(m
ax a
chei
vabl
e)
Total cementitious system
Figure 5-19 Maximum degree of hydration (theoretical) of OPC-SF system
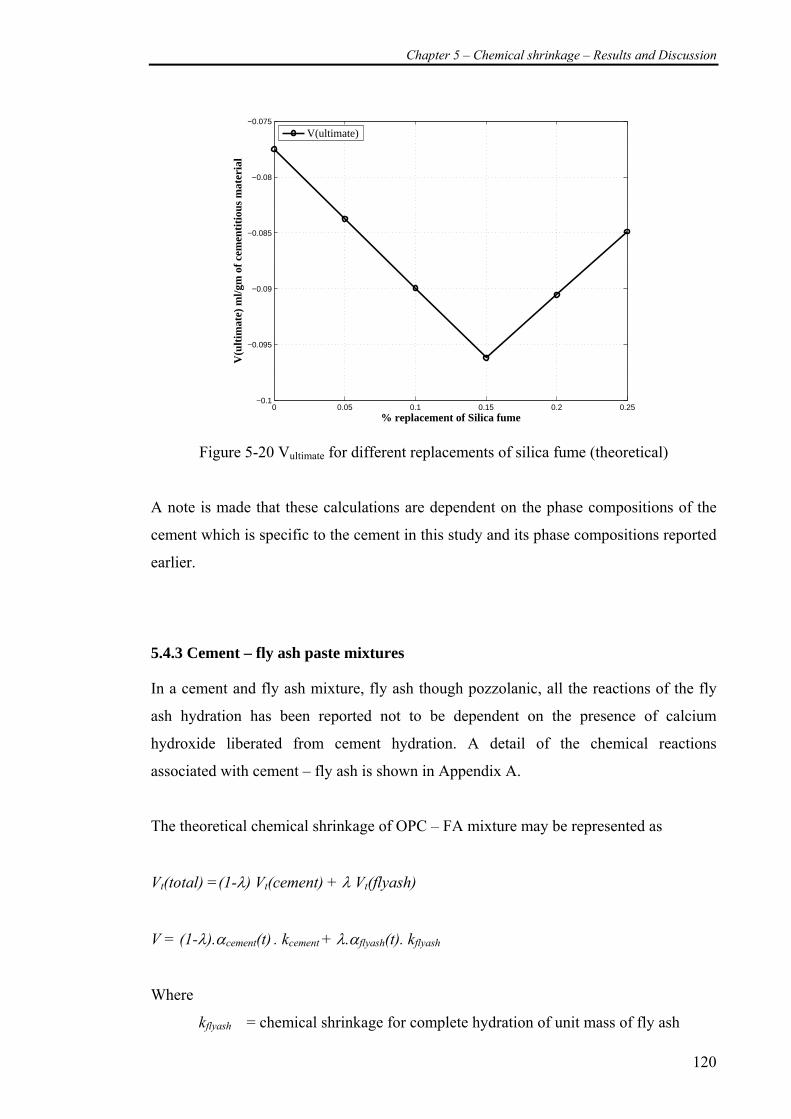
Chapter 5 – Chemical shrinkage – Results and Discussion
120
0 0.05 0.1 0.15 0.2 0.25−0.1
−0.095
−0.09
−0.085
−0.08
−0.075
% replacement of Silica fume
V(u
ltim
ate)
ml/g
m o
f ce
men
titi
ous
mat
eria
l
V(ultimate)
Figure 5-20 Vultimate for different replacements of silica fume (theoretical)
A note is made that these calculations are dependent on the phase compositions of the
cement which is specific to the cement in this study and its phase compositions reported
earlier.
5.4.3 Cement – fly ash paste mixtures
In a cement and fly ash mixture, fly ash though pozzolanic, all the reactions of the fly
ash hydration has been reported not to be dependent on the presence of calcium
hydroxide liberated from cement hydration. A detail of the chemical reactions
associated with cement – fly ash is shown in Appendix A.
The theoretical chemical shrinkage of OPC – FA mixture may be represented as
Vt(total) =(1-λ) Vt(cement) + λ Vt(flyash)
V = (1-λ).αcement(t) . kcement + λ.αflyash(t). kflyash
Where
kflyash = chemical shrinkage for complete hydration of unit mass of fly ash
Chapter 5 – Chemical shrinkage – Results and Discussion
121
λ = % replacement of fly ash
The fly ash under study was found to be made of three major min eral phases Calcium
alumino silicate (CAS2), Alumino silicate glass (ASG) and Silica (S). For each of these
phases hydration is influenced by a different parameter. Hence the hydration of fly ash
is not straight forward unlike that of silica fume. Each phase has a different influence on
the total hydration. Though one might be inclined to express the chemical shrinkage of
fly ash as
Vt(flyash) = Vt(CAS2) + Vt(AS) + Vt(S)
The author should understand that each of these phase hydration are interdependent on
the phases of cement themselves, making the hydration mechanism more complex and
hence difficult to model completely using a stoichiometry model.
Table 5-2 shows that of the various phases present in fly ash and there chemical
shrinkage on hydration. Silica contributes to the highest amount of chemical shrinkage.
But the amount of pure silica present is very little and most silica is present in the form
of ASG or CAS2. ASG shows chemical shrinkage of -0.0523 ml/gm of ASG which is a
lower chemical shrinkage value when compared to normal Portland cement. The CAS2
is comparatively very low and hence its higher chemical shrinkage value does not
directly influence the overall chemical shrinkage. Also unlike silica fume, where the
silica fume starts reacting immediately with the available CH, the pozzolanic reactions
of fly ash is slower compared to Silica fume. Hence this would further contribute to a
lower chemical shrinkage early ages upto 28days compared to that the system with
cement alone, while at later ages > 28 days the chemical shrinkage should be much
higher than that of cement due to hydration of fly ash.
The hydration mechanism would be dependent on the amount of CH formed from the
hydration of cement as was for silica fume. In the cement – fly ash system, CH formed
from the hydration of cement is consumed by the fly ash phases mainly Silica and ASG.
The CAS2 is generally very low in the Class F fly ash hence its relative influence is
much lower and the contribution of chemical shrinkage of ASG (-0.0523 ml/gm of
ASG) is dominant. Hence the total chemical shrinkage would be lower than a pure
cement system. At higher replacements, there would be very little CH available formed
Chapter 5 – Chemical shrinkage – Results and Discussion
122
from the hydration of cement, making the overall hydration of fly ash achievable also
lower.
A major equilibrium would try to exist between the CH formed and CH demand. This
would control the resulting chemical shrinkage in fly ash system.
The actual phase composition of the fly ash can be determined from the mole fractions
of the major constituents C, S, A
1. All the Calcium would be CAS2
2. The remaining of Al2O3 available would be Alumino Silicate Glass
3. The reset of Silica available would be available in pure form. The actual ASG, CAS2 and the silica phases was determined using image analysis of
XRD maps of fly ash which is reported in Chapter 3.
5.4.4 Cement – slag paste mixtures
Slag hydration is quite different to the hydration of silica fume and fly ash with cement.
Slag is known to possess latent hydraulic property i.e., that it is reactive with water, but
only at such a slow rate and in the presence of an activator the reaction rates can be
accelerated (Chen 2006).
While it is understood that the Slag hydration is quite different from fly ash or silica
fume hydration owing to its hydraulic property, it can be assumed at a preliminary stage
that the hydration of slag is pozzolanic, i.e., slag reacts with the CH to form CSH and
hydrotalcite.
)(.)().1()( slagVcementVtotalV ttt λλ +−=
Where,
Vt(cement) = chemical shrinkage of cement ml/gm
Vt(slag) = chemical shrinkage of slag ml/gm
λ = mass replacement of slag in cementitious system
Chapter 5 – Chemical shrinkage – Results and Discussion
123
Not enough evidence exists to express
)(..)(.).1()( slagkcementktotalV tslagtcementt αλαλ +−=
If slag is assumed to have a latent hydraulic property, the following interpretations can
be drawn on the development of chemical shrinkage.
1. At early ages or until sufficient CH is present for the activation of slag in the
cement, the whole system will be driven mostly by the hydration of cement. The
contribution of chemical shrinkage from the slag at early age would be
minimum. The author is aware the term ‘early age’ is quite ambiguous.
2. The Ca/Si ratio in the CSH formed from slag hydration would be approximately
1.35 (Richardson, Biernacki et al. 2002)
While earlier literature has shown that that chemical shrinkage is 12 ml / gm of reacted
slag, this is quite higher than that of normal portland cement which is around 7 ml/gm
of reacted cement. This quite puts the researcher to assume that the replacements of slag
in a blended cement would increase the overall chemical shrinkage of the cementitious
system. But one should be aware of the slow rate of reaction of slag, influencing the
development of chemical shrinkage. Compared with cementitious systems with fly ash
and silica fume, the slag would react at a much later period and yet have sufficient slag
to react even when most of the cement has hydrated, hence the time required to achieve
a complete hydration of both the cement and slag would be larger than the normal
ordinary portland cement at the same water-cement ratio.
Based on (Richardson, Biernacki et al. 2002) the reaction stoichiometry of slag
hydration can be postulated as
C5.03S3.91M1.04A + aCH +bH →3.91CnSHmAy+zMcAHd
As the degree of hydration of slag would be influencing the system, of measurement of
the chemical shrinkage. i.e., the relative effect of slag on the total chemical shrinkage of
the system is influenced not only by the mass replacement of cement by slag by also the
Chapter 5 – Chemical shrinkage – Results and Discussion
124
maximum degree of hydration of slag achieved. Hence the author puts forward the
forward questions before a clear understanding can be made.
1. Whether the maximum degree of hydration of slag can reach 1.0
2. Even if the maximum degree of hydration of slag can reach 1.0, is the time
required to reach this high degree of hydration very long when compared to a
cement in the system.
3. Can at higher replacements we assume that the hydration of slag is controlled by
CH/Slag hydration or should Slag’s hydraulic property be also considered into
the modelling.
4. Experimental evidence shows that Ca/Si ratio is different near the vicinity of the
slag grains and near the cement grains.
5.5 Effect of water-cement ratio on Chemical shrinkage
While the experimental design was focussed on a water-cement ratio of 0.7, the
experimental study was limited to the water-cementitious ratio of 0.7. Most
cementitious systems which are prone to autogenous shrinkage would have a water-
cement ratio / water-cementitious ratio of much less that 0.4. Hence the importance of
the effect of water-cement ratio on the reduction in water-cement ratio is felt. It would
have been idle for the author to have measured the chemical shrinkage at a low water-
cement ratio but this is not possible to reasons explained in earlier Chapter 3 While
experimental evidence does exists that the reduction in water-cement ratio is augmented
by the reduction in chemical shrinkage an understanding of the factors contributing to
the reduction of chemical shrinkage will be explained.
A closer look at Table 5-6 and Figure 5-17 shows that the “k” can be assumed to be a
constant under a long term scenario.
Hence for paste with cement alone it may be assumed with confidence that,
1. ‘k’ may be assumed to be constant as it is dependent on the cement composition.
2. Vult depends on degree of hydration (α) of cement.
The above assumption sparks the author, into the following interpretation
Chapter 5 – Chemical shrinkage – Results and Discussion
125
Vult = kcmenet .αcmenet(t→∞)
Where,
Vult = Ultimate chemical shrinkage of the system.
kcement = Ultimate value of chemical shrinkage for α=1
αcmenet(t→∞) = maximum achievable α for a certain degree of hydration
This narrows down, to the point that if one could be able to determine the maximum
degree of hydration achievable under saturated curing or sealed curing, which intern can
help to quantify the maximum amount of self-desiccation pores that will be formed for
the estimation of maximum autogenous shrinkage. Hence once we can know the
maximum amount of chemical shrinkage that a certain mixture is going to have at an
infinite period of time, one would be able to quantity its effect on the self-desiccation
pores being formed.
The maximum degree of hydration achievable can be calculated based on Neville
(Neville 1995) for both curing regime either saturated or sealed condition.
For saturated condition
αmax(w/c 0.25) = 0.69
αmax(w/c 0.32) = 0.89
αmax(w/c 0.38) = 1.00
For sealed condition
αmax(w/c 0.25) = 0.59
αmax(w/c 0.32) = 0.76
αmax(w/c 0.38) = 0.90
Chapter 5 – Chemical shrinkage – Results and Discussion
126
So, theoretically the ultimate chemical shrinkage achievable for different curing regime,
would result in a different value. A logical perception of the author is that the ultimate
chemical shrinkage (ml/gm of cement) decreases with decrease in water-cement ratio.
Also the ultimate chemical shrinkage shall be lower for a cement paste under sealed
curing condition than that of a saturated curing for the same water-cement ratio. The
reader may be sparked with the question that in reality as chemical shrinkage is
expressed as ml/gm of cement rather than the ml/ml of paste volume, what would be the
relative effect of the presence of more cement in a lower water-cement ratio mixture.
The result of the same has also been calculated and shown below for a unit volume of
cement paste.
The computed ultimate chemical shrinkage (theoretical) is found to be
For saturated condition
Vult(w/c 0.25) = -0.0775 * 0.69 = -0.0535 ml / gm of cement
Vult(w/c 0.32) = -0.0775 * 0.89 = -0.0690 ml /gm of cement
Vult(w/c 0.38) = -0.0775 * 1.00 = -0.0775 ml /gm of cement
For sealed condition
Vult(w/c 0.25) = -0.0775 * 0.59 = -0.0457 ml / gm of cement
Vult(w/c 0.32) = -0.0775 * 0.76 = -0.0589 ml /gm of cement
Vult(w/c 0.38) = -0.0775 * 0.90 = -0.06975 ml /gm of cement
For a unit volume of cement paste say 1ml of paste, the amount of cement present
(sp.gravity of cement = 3.15 and sp. gravity of water =1.0 ) would be
Cement content
w/c 0.25 = 1.762 gm / ml of paste
w/c 0.32 = 1.569 gm / ml of paste
w/c 0.38 = 1.434 gm / ml of paste
Chapter 5 – Chemical shrinkage – Results and Discussion
127
Hence the computed ultimate chemical shrinkage would be
For saturated condition
Vult(w/c 0.25) = -0.0535*1.762 = -0.0943 ml / ml of cement paste
Vult(w/c 0.32) = -0.0690*1.569 = -0.1083 ml /ml of cement paste
Vult(w/c 0.38) = -0.0775*1.434 = -0.1111 ml /ml of cement paste
For sealed condition
Vult(w/c 0.25) = -0.0457*1.762 = -0.0805 ml / ml of cement paste
Vult(w/c 0.32) = -0.0589*1.569 = -0.0924 ml /ml of cement paste
Vult(w/c 0.38) = -0.06975*1.434 = 0.1000 ml /ml of cement paste
The trend of the ultimate value of chemical shrinkage continues to be lower with lower
water-cement ratio. The appropriate method of expressing chemical shrinkage may be
debatable but the author continues to use the widely used norm to express chemical
shrinkage as ml/gm of cementitious system rather than ml/ml of the cementitious paste
volume.
While the ultimate chemical shrinkage achievable can be determined, this would not
help in concluding on the development of chemical shrinkage during the progress of
hydration of the cement paste. The actual kinetics of hydration at different water-cement
ratio may not be explained from the chemical shrinkage at a higher water-cement ratio.
5.6 Conclusions
The following conclusions are drawn based on the experimental investigation and the
stoichiometry model for chemical shrinkage
Chapter 5 – Chemical shrinkage – Results and Discussion
128
1. It is valid to express the Chemical shrinkage as the sum of the hydration of the
individual phases, but this is valid only for a simple cement alone system. The
presence of mineral additives alters the hydration to an extent that the individual
phase composition cannot be alone used to determine the chemical shrinkage.
2. The ratio of chemical shrinkage to that of the degree of hydration of the cement
paste is not constant during the early hours.
3. The presence of mineral admixtures makes modelling using a stoichiometry
approach quite difficult and hence a model as CEMHYD3D would be much of
an easier approach where the laws of stoichiometry are set as hydration rules
during the progress of hydration.
The next chapter will talk about the development of autogenous shrinkage in cement
pastes. An insight into the relative effect of each mineral additive on the chemical
shrinkage and possibly hydration as such, thereby to answer the mechanism of
autogenous shrinkage with different mineral admixtures.
Chapter 6 – Autogenous shrinkage in cementitious paste systems- Results and Discussion
129
CHAPTER 6 -AUTOGENOUS SHRINKAGE IN CEMENTITIOUS
PASTE SYSTEMS – RESULTS and DISCUSSION
6.1 Introduction Following the study on chemical shrinkage and modelling the hydration of the
cementitious systems using CEMHYD3D (Refer Appendix G), the next step was to
study the development of autogenous shrinkage in cementitious paste systems. While
chapter 3 explains the test method used in this study for the measurement of autogenous
shrinkage in cementitious paste, this chapter will discuss the experimental results of this
study on paste mixtures. This chapter has been primarily categorised into
• Plain cement paste systems
• Cement- silica fume paste systems
• Cement – fly ash paste systems
• Cement – slag paste systems.
6.2 Cement paste system
The autogenous shrinkage of plain cement paste mixtures at 3 different water-cement
ratios, i.e., 0.25, 0.32 and 0.38 was measured. The test was carried out using two
distinctly different test moulds / specimen size i.e., corrugated tubes and prismatic
specimens. The development of autogenous shrinkage during the first 24 hours in
corrugated tubes was measured while measurement during the first 24 hours for the
prismatic specimens was not possible due to the limitation of the test method. The test
results and the discussion follow in the subsequent subsections.
6.2.1 Free autogenous deformation (Experimental)
6.2.1.1 Experimental observations (<24 hours)
Figure 6-1, Figure 6-2 and Figure 6-3 show the development of autogenous shrinkage
during the first 24 hours of hydration for the three plain cement mixtures at water-
cement ratio of 0.25, 0.32 and 0.38 using the corrugated tube test method.
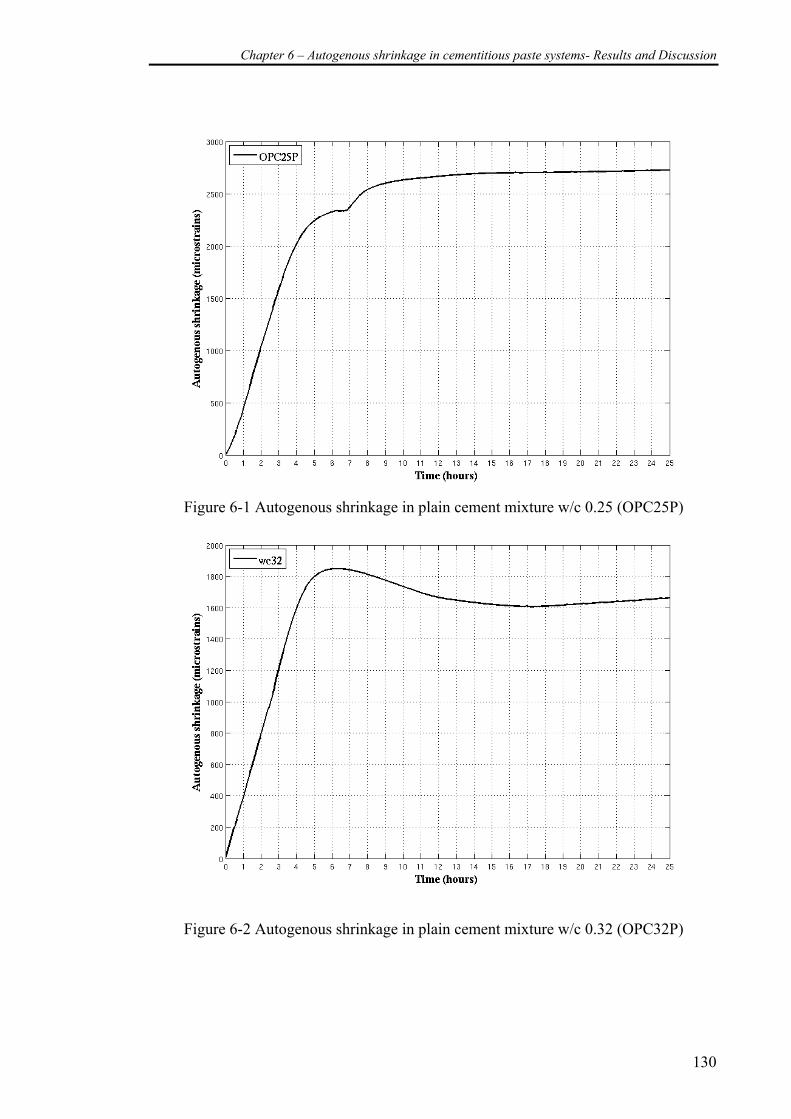
Chapter 6 – Autogenous shrinkage in cementitious paste systems- Results and Discussion
130
Figure 6-1 Autogenous shrinkage in plain cement mixture w/c 0.25 (OPC25P)
Figure 6-2 Autogenous shrinkage in plain cement mixture w/c 0.32 (OPC32P)
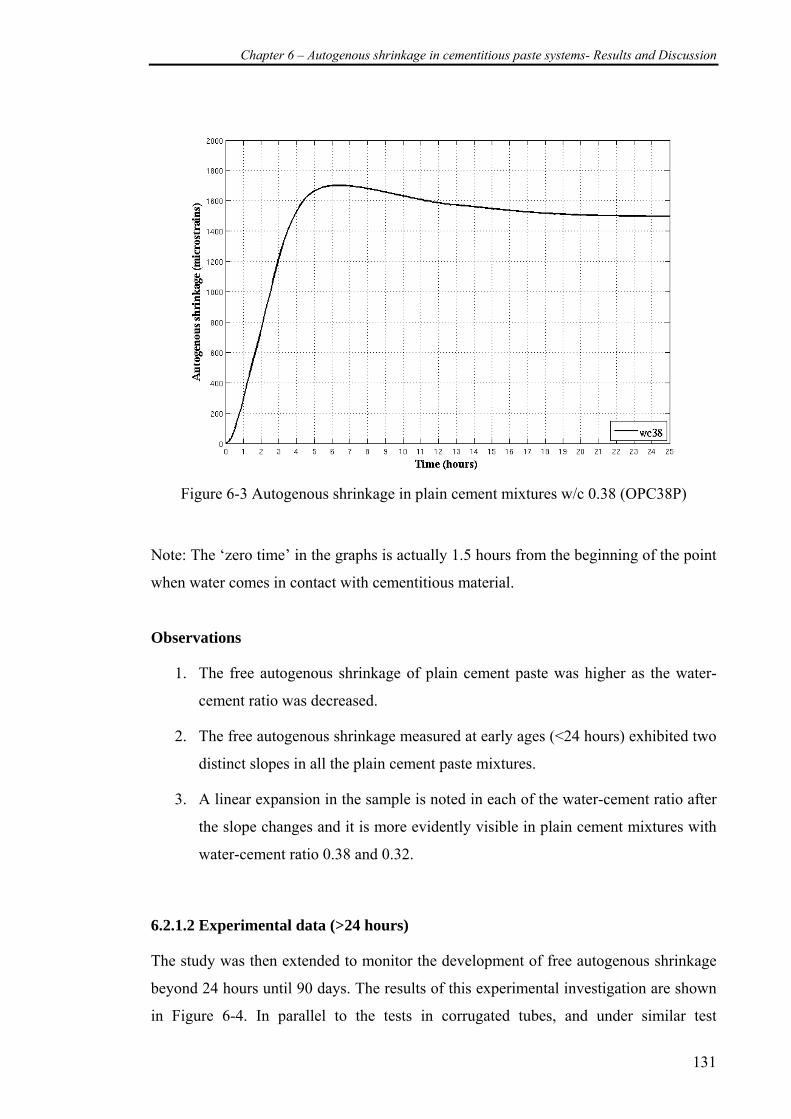
Chapter 6 – Autogenous shrinkage in cementitious paste systems- Results and Discussion
131
Figure 6-3 Autogenous shrinkage in plain cement mixtures w/c 0.38 (OPC38P)
Note: The ‘zero time’ in the graphs is actually 1.5 hours from the beginning of the point
when water comes in contact with cementitious material.
Observations
1. The free autogenous shrinkage of plain cement paste was higher as the water-
cement ratio was decreased.
2. The free autogenous shrinkage measured at early ages (<24 hours) exhibited two
distinct slopes in all the plain cement paste mixtures.
3. A linear expansion in the sample is noted in each of the water-cement ratio after
the slope changes and it is more evidently visible in plain cement mixtures with
water-cement ratio 0.38 and 0.32.
6.2.1.2 Experimental data (>24 hours)
The study was then extended to monitor the development of free autogenous shrinkage
beyond 24 hours until 90 days. The results of this experimental investigation are shown
in Figure 6-4. In parallel to the tests in corrugated tubes, and under similar test
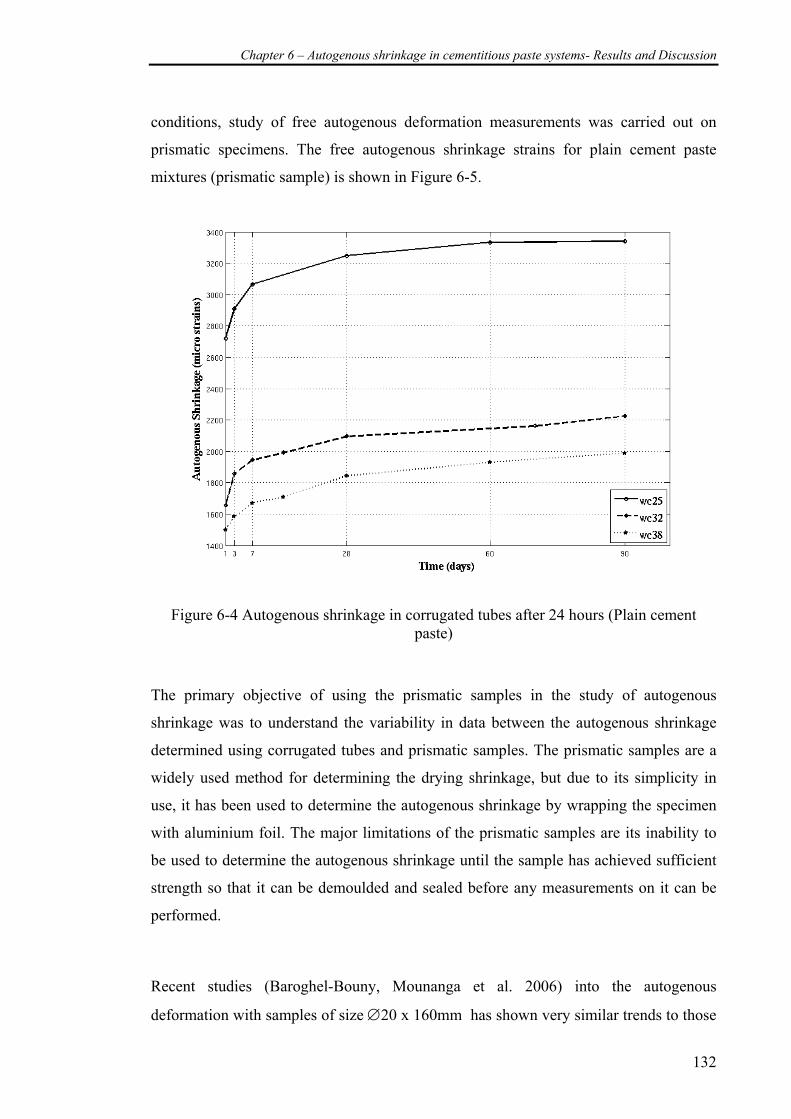
Chapter 6 – Autogenous shrinkage in cementitious paste systems- Results and Discussion
132
conditions, study of free autogenous deformation measurements was carried out on
prismatic specimens. The free autogenous shrinkage strains for plain cement paste
mixtures (prismatic sample) is shown in Figure 6-5.
Figure 6-4 Autogenous shrinkage in corrugated tubes after 24 hours (Plain cement paste)
The primary objective of using the prismatic samples in the study of autogenous
shrinkage was to understand the variability in data between the autogenous shrinkage
determined using corrugated tubes and prismatic samples. The prismatic samples are a
widely used method for determining the drying shrinkage, but due to its simplicity in
use, it has been used to determine the autogenous shrinkage by wrapping the specimen
with aluminium foil. The major limitations of the prismatic samples are its inability to
be used to determine the autogenous shrinkage until the sample has achieved sufficient
strength so that it can be demoulded and sealed before any measurements on it can be
performed.
Recent studies (Baroghel-Bouny, Mounanga et al. 2006) into the autogenous
deformation with samples of size ∅20 x 160mm has shown very similar trends to those
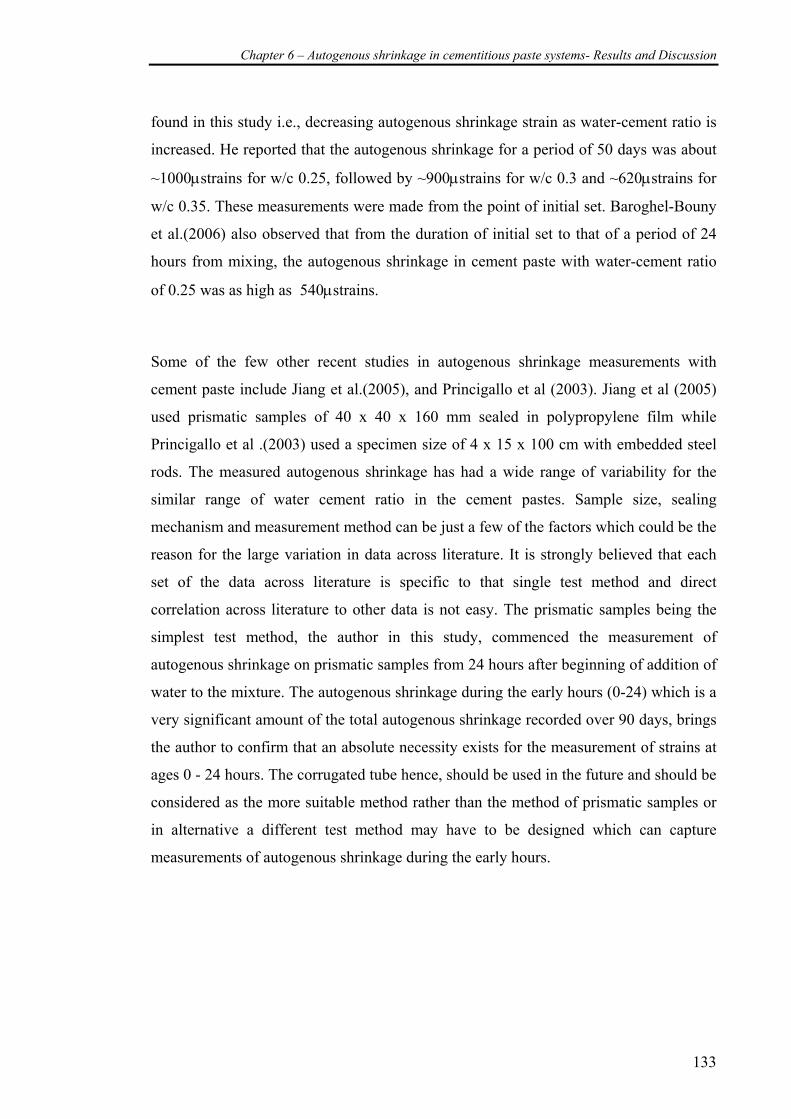
Chapter 6 – Autogenous shrinkage in cementitious paste systems- Results and Discussion
133
found in this study i.e., decreasing autogenous shrinkage strain as water-cement ratio is
increased. He reported that the autogenous shrinkage for a period of 50 days was about
~1000μstrains for w/c 0.25, followed by ~900μstrains for w/c 0.3 and ~620μstrains for
w/c 0.35. These measurements were made from the point of initial set. Baroghel-Bouny
et al.(2006) also observed that from the duration of initial set to that of a period of 24
hours from mixing, the autogenous shrinkage in cement paste with water-cement ratio
of 0.25 was as high as 540μstrains.
Some of the few other recent studies in autogenous shrinkage measurements with
cement paste include Jiang et al.(2005), and Princigallo et al (2003). Jiang et al (2005)
used prismatic samples of 40 x 40 x 160 mm sealed in polypropylene film while
Princigallo et al .(2003) used a specimen size of 4 x 15 x 100 cm with embedded steel
rods. The measured autogenous shrinkage has had a wide range of variability for the
similar range of water cement ratio in the cement pastes. Sample size, sealing
mechanism and measurement method can be just a few of the factors which could be the
reason for the large variation in data across literature. It is strongly believed that each
set of the data across literature is specific to that single test method and direct
correlation across literature to other data is not easy. The prismatic samples being the
simplest test method, the author in this study, commenced the measurement of
autogenous shrinkage on prismatic samples from 24 hours after beginning of addition of
water to the mixture. The autogenous shrinkage during the early hours (0-24) which is a
very significant amount of the total autogenous shrinkage recorded over 90 days, brings
the author to confirm that an absolute necessity exists for the measurement of strains at
ages 0 - 24 hours. The corrugated tube hence, should be used in the future and should be
considered as the more suitable method rather than the method of prismatic samples or
in alternative a different test method may have to be designed which can capture
measurements of autogenous shrinkage during the early hours.
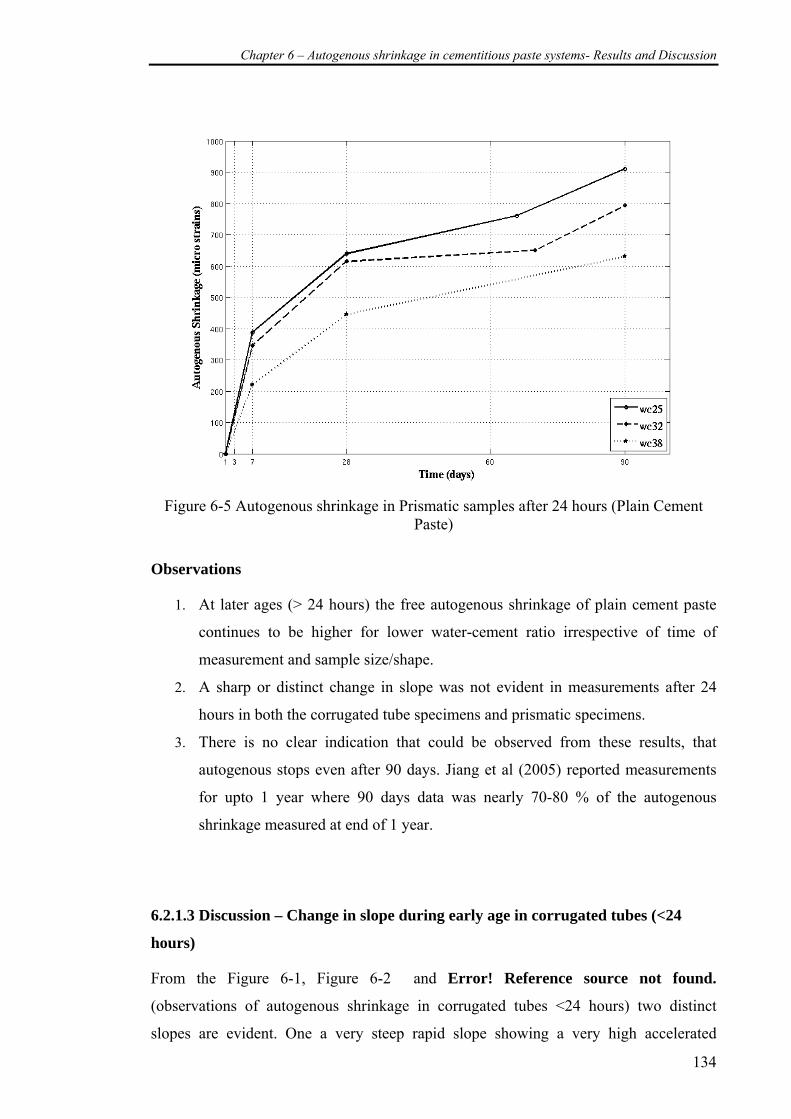
Chapter 6 – Autogenous shrinkage in cementitious paste systems- Results and Discussion
134
Figure 6-5 Autogenous shrinkage in Prismatic samples after 24 hours (Plain Cement
Paste)
Observations
1. At later ages (> 24 hours) the free autogenous shrinkage of plain cement paste
continues to be higher for lower water-cement ratio irrespective of time of
measurement and sample size/shape.
2. A sharp or distinct change in slope was not evident in measurements after 24
hours in both the corrugated tube specimens and prismatic specimens.
3. There is no clear indication that could be observed from these results, that
autogenous stops even after 90 days. Jiang et al (2005) reported measurements
for upto 1 year where 90 days data was nearly 70-80 % of the autogenous
shrinkage measured at end of 1 year.
6.2.1.3 Discussion – Change in slope during early age in corrugated tubes (<24
hours)
From the Figure 6-1, Figure 6-2 and Error! Reference source not found.
(observations of autogenous shrinkage in corrugated tubes <24 hours) two distinct
slopes are evident. One a very steep rapid slope showing a very high accelerated
Chapter 6 – Autogenous shrinkage in cementitious paste systems- Results and Discussion
135
development of autogenous shrinkage followed by a smaller gradual slope showing the
development of shrinkage. This change in slope of the development of free autogenous
shrinkage strain during the early hours of hydration has been observed by other
researchers too (Beltzung and Wittmann 2002; Charron, Marchand et al. 2002). Jensen
and Hansen (1995) demonstrated that there was a distinct change in slope close to the
time of setting of the cement paste while measuring autogenous shrinkage using
corrugated tube. This distinct phenomenon has not been limited to corrugated tubes but
can be observed in the volumetric autogenous shrinkage measurements conducted using
rubber condoms by Justnes et al. (Justnes, Gemert et al. 1996; Justnes, Sellevold et al.
1999). The change in slope of the deformation has been attributed to the setting time of
cement (Jensen and Hansen 1995). While discrepancies exist whether it is precisely the
initial set or final setting of the cement which causes this change in slope it is accepted
that the evolution of the solid skeleton is the primary cause of this phenomenon. The
evolution of the solid skeleton has been discussed under ‘mineral percolation’ in
literature (Bisschop 2002). During the early hours the causes of free autogenous
deformation have been postulated due to chemical shrinkage, dissolution of salts (Lura,
Jensen et al. 2003). While self desiccation is also a primary cause of autogenous
shrinkage, whether self-desiccation occurs from very early hours is not clear in
literature but it is suspected that self-desiccation would occur from the moment cement
begins to hydrate and will be discussed in a later chapter in detail. Lura et al. (2001)
found that the RH of the sample was about 98% before setting but postulated the RH
drop was due to the dissolved salts rather than self-desiccation. Plastic shrinkage may
not be considered to cause free autogenous shrinkage during the early hours as plastic
shrinkage occurs when there is loss of moisture from the sample during the early hours
and is influenced by the external environment (Lerch 1957).
6.2.1.4 Discussion – Expansion after slope change
A noticeable linear expansion in the cement paste is observed after the change in slope
of the free autogenous deformation. This expansion is also noticed in cementitious paste
mixtures with fly ash, slag and silica fume as replacements. Justnes (2004) stated that
this expansion may be due to re-suction of bleed water within the sample
Chapter 6 – Autogenous shrinkage in cementitious paste systems- Results and Discussion
136
Before any interpretations is drawn on the reasons of the reported autogenous shrinkage
measurements for the author’s test methods, let us begin with the basic microstructure
and the factors contributing to autogenous shrinkage.
6.2.1.5 Discussion – Mechanical properties
It is quite interesting though, if one referred to the mechanical properties and made a
statement that as water-cement ratio is decreased the strength (mechanical property) of
the paste samples would be higher. But one should remember measurements carried out
are in fact under free unrestrained condition, hence compressive strength or other
mechanical property directly would not influence the response of the material for
shrinkage in alternative if measurements were made under a restrained condition the
mechanical properties would play a more significant role on the behaviour of the
cementitious matrix under restrained shrinkage conditions.
6.2.2 Chemical shrinkage and Degree of hydration
Chemical shrinkage has been reported as an important factor driving the mechanism of
autogenous shrinkage in cementitious systems(Tazawa 1999). The simulated chemical
shrinkage for the three plain water-cement ratios under sealed condition of curing is
shown below in Figure 6-6 and Figure 6-7. [Note : Please refer to earlier chapter &
Appendix on details of how the simulation was carried out]
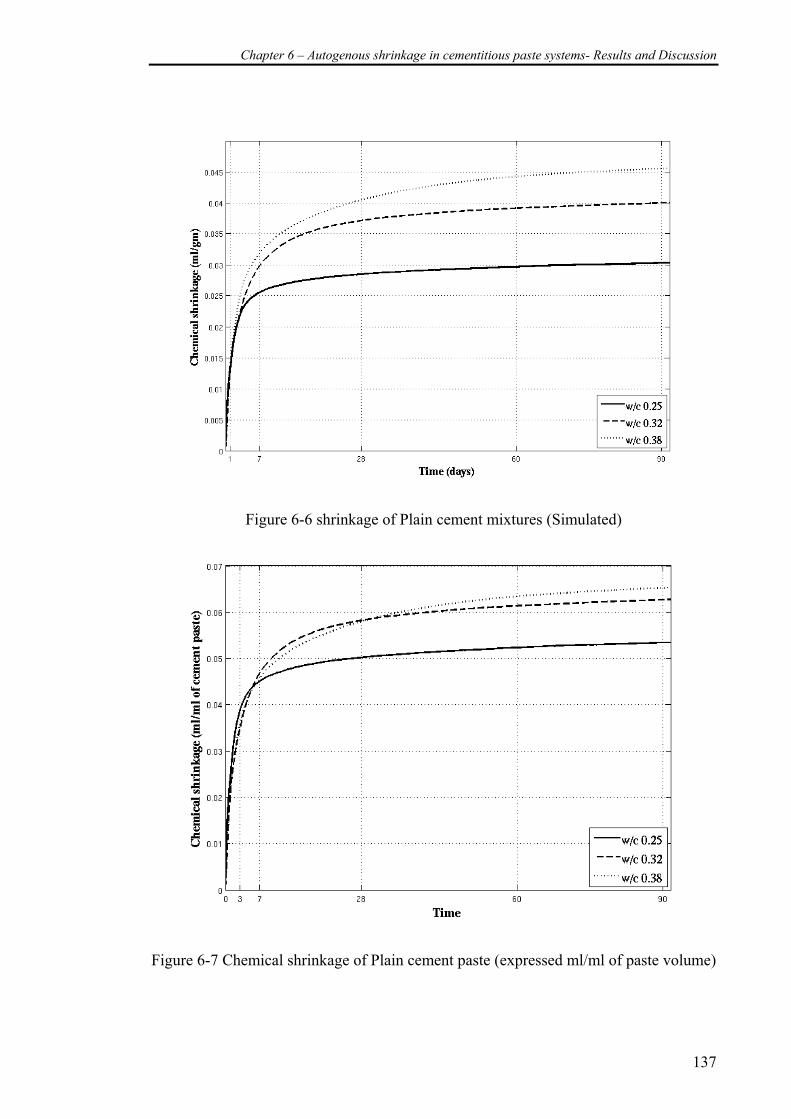
Chapter 6 – Autogenous shrinkage in cementitious paste systems- Results and Discussion
137
Figure 6-6 shrinkage of Plain cement mixtures (Simulated)
Figure 6-7 Chemical shrinkage of Plain cement paste (expressed ml/ml of paste volume)
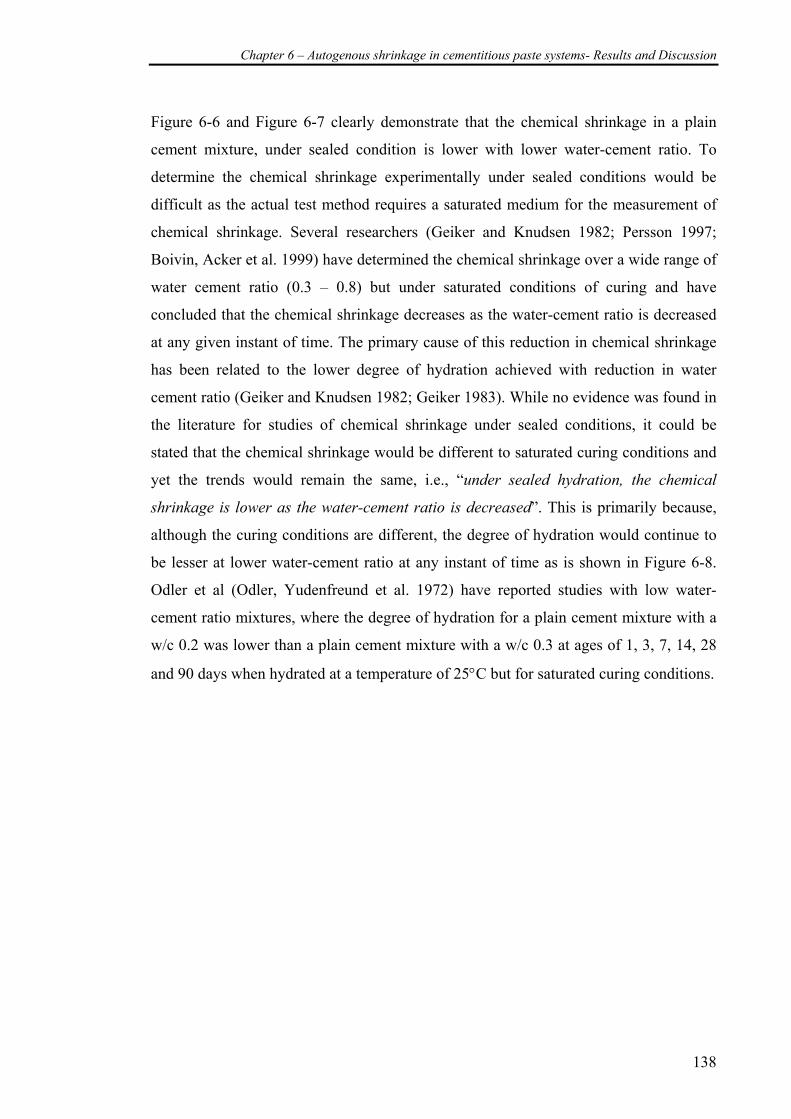
Chapter 6 – Autogenous shrinkage in cementitious paste systems- Results and Discussion
138
Figure 6-6 and Figure 6-7 clearly demonstrate that the chemical shrinkage in a plain
cement mixture, under sealed condition is lower with lower water-cement ratio. To
determine the chemical shrinkage experimentally under sealed conditions would be
difficult as the actual test method requires a saturated medium for the measurement of
chemical shrinkage. Several researchers (Geiker and Knudsen 1982; Persson 1997;
Boivin, Acker et al. 1999) have determined the chemical shrinkage over a wide range of
water cement ratio (0.3 – 0.8) but under saturated conditions of curing and have
concluded that the chemical shrinkage decreases as the water-cement ratio is decreased
at any given instant of time. The primary cause of this reduction in chemical shrinkage
has been related to the lower degree of hydration achieved with reduction in water
cement ratio (Geiker and Knudsen 1982; Geiker 1983). While no evidence was found in
the literature for studies of chemical shrinkage under sealed conditions, it could be
stated that the chemical shrinkage would be different to saturated curing conditions and
yet the trends would remain the same, i.e., “under sealed hydration, the chemical
shrinkage is lower as the water-cement ratio is decreased”. This is primarily because,
although the curing conditions are different, the degree of hydration would continue to
be lesser at lower water-cement ratio at any instant of time as is shown in Figure 6-8.
Odler et al (Odler, Yudenfreund et al. 1972) have reported studies with low water-
cement ratio mixtures, where the degree of hydration for a plain cement mixture with a
w/c 0.2 was lower than a plain cement mixture with a w/c 0.3 at ages of 1, 3, 7, 14, 28
and 90 days when hydrated at a temperature of 25°C but for saturated curing conditions.
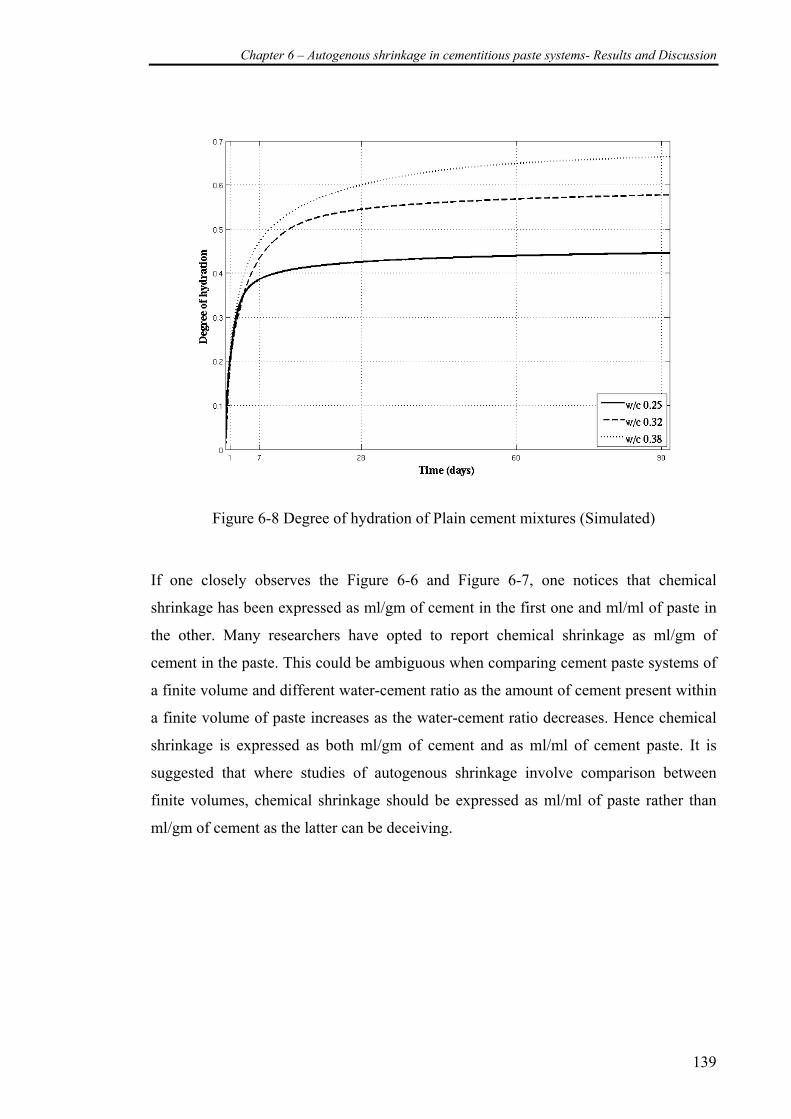
Chapter 6 – Autogenous shrinkage in cementitious paste systems- Results and Discussion
139
Figure 6-8 Degree of hydration of Plain cement mixtures (Simulated)
If one closely observes the Figure 6-6 and Figure 6-7, one notices that chemical
shrinkage has been expressed as ml/gm of cement in the first one and ml/ml of paste in
the other. Many researchers have opted to report chemical shrinkage as ml/gm of
cement in the paste. This could be ambiguous when comparing cement paste systems of
a finite volume and different water-cement ratio as the amount of cement present within
a finite volume of paste increases as the water-cement ratio decreases. Hence chemical
shrinkage is expressed as both ml/gm of cement and as ml/ml of cement paste. It is
suggested that where studies of autogenous shrinkage involve comparison between
finite volumes, chemical shrinkage should be expressed as ml/ml of paste rather than
ml/gm of cement as the latter can be deceiving.
Chapter 6 – Autogenous shrinkage in cementitious paste systems- Results and Discussion
140
The importance of chemical shrinkage is listed below
1. At early ages, chemical shrinkage is considered in large to be the dominating
factor contributing to autogenous shrinkage strains.
2. Chemical shrinkage after the hardening of the cement paste will translate into
internal voids, in the system (Lura, Jensen et al. 2003).
3. Chemical shrinkage will promote self-desiccation by the formation of empty
pores in addition to the hydration itself in which more and more water is
consumed from within the cement paste.
Hence understanding the influence of chemical shrinkage is imperative while attempting
to explain autogenous shrinkage strains. Summarising Figure 6-6, Figure 6-7 and Figure
6-8 it is inferred that
“The total volume of internal voids formed as a result of chemical shrinkage
would decrease with decrease in water-cement ratio in plain cement paste system”
and hence revealing the chemical shrinkage alone does not answer several questions:
1. At lower water cement ratio how does the formation of fewer internal voids
cause an increased autogenous deformation, as noticed in the results shown in
Figs. 6.1-6.5?
2. During early hours (before setting of the cement paste) does the chemical
shrinkage completely translate into bulk deformations and is it solely responsible
for the measured autogenous shrinkage strains? and therefore, is the net
autogenous shrinkage supposed to be the resultant of the chemical shrinkage
whether measured or simulated, and the measured autogenous shrinkage which
is shown in Figs. 6.1-6.5 ?
3. What are the factors which augment or explain the phenomenon of increase in
autogenous shrinkage?
4. With lesser degree of hydration of cement as the water-cement ratio is
decreased, how can one explain the increase in autogenous shrinkage?
Chapter 6 – Autogenous shrinkage in cementitious paste systems- Results and Discussion
141
There is substantial evidence that until the time of setting of the cement paste, all the
chemical shrinkage would be translated into bulk volume deformation or autogenous
shrinkage. The experimental autogenous volume change was compared with the
simulated chemical shrinkage during the early hours for water-cement ratio of 0.25,
0.32 and 0.38 and reported in Figure 6-9,Figure 6-10 and Figure 6-11. While a
reasonable correlation exists between chemical shrinkage and autogenous volume
change during the early hours confirming the autogenous shrinkage measurement is
predominantly influenced by chemical shrinkage.
Figure 6-9 Correlation between chemical shrinkage (simulated) and Autogenous shrinkage (corrugated tube - experimental) OPC25P
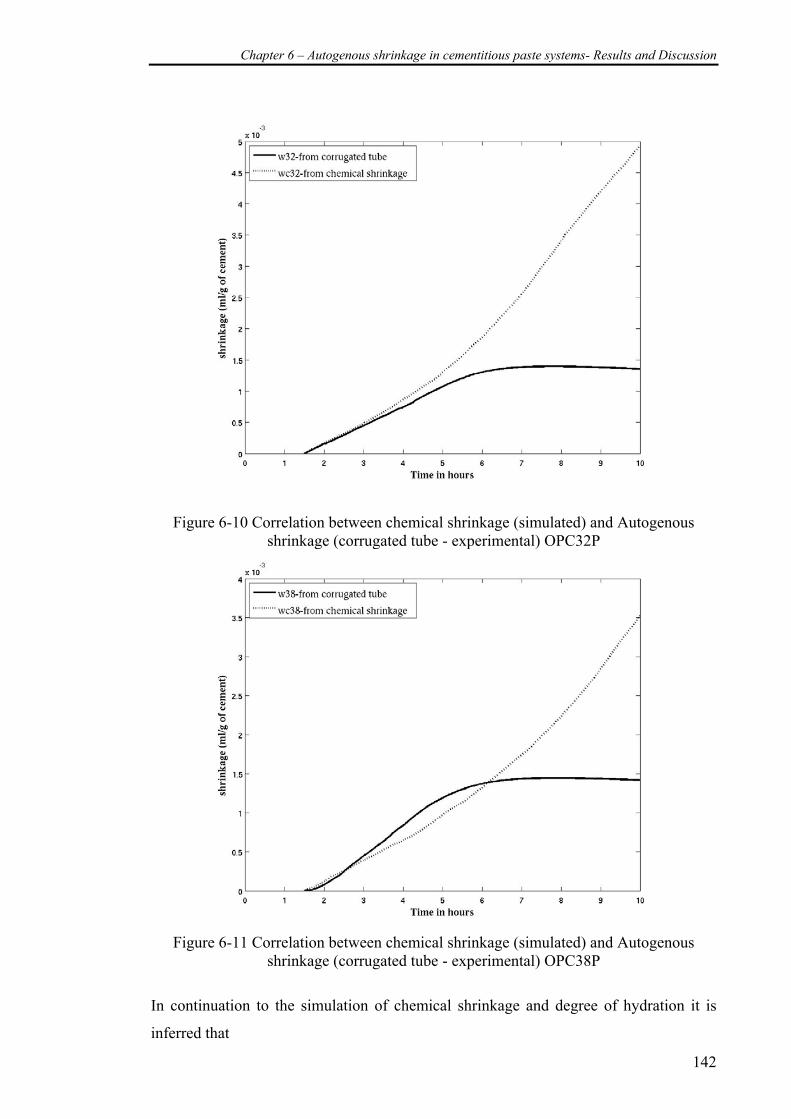
Chapter 6 – Autogenous shrinkage in cementitious paste systems- Results and Discussion
142
Figure 6-10 Correlation between chemical shrinkage (simulated) and Autogenous shrinkage (corrugated tube - experimental) OPC32P
Figure 6-11 Correlation between chemical shrinkage (simulated) and Autogenous
shrinkage (corrugated tube - experimental) OPC38P In continuation to the simulation of chemical shrinkage and degree of hydration it is
inferred that
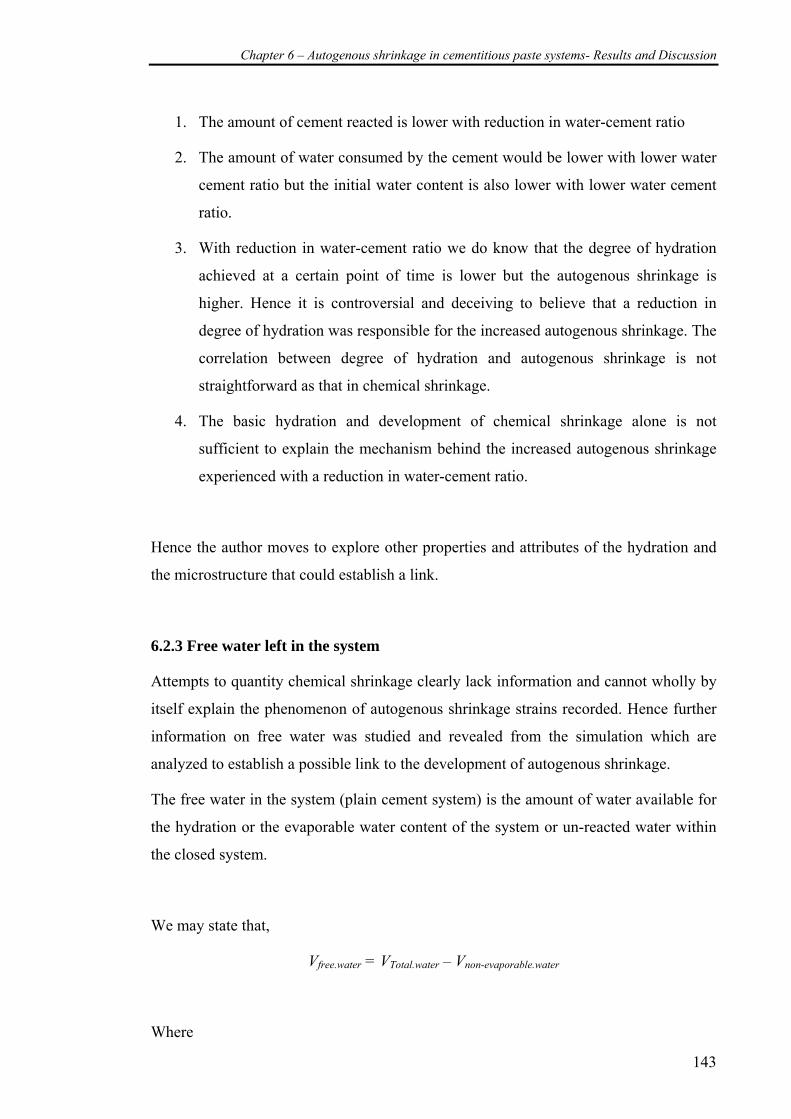
Chapter 6 – Autogenous shrinkage in cementitious paste systems- Results and Discussion
143
1. The amount of cement reacted is lower with reduction in water-cement ratio
2. The amount of water consumed by the cement would be lower with lower water
cement ratio but the initial water content is also lower with lower water cement
ratio.
3. With reduction in water-cement ratio we do know that the degree of hydration
achieved at a certain point of time is lower but the autogenous shrinkage is
higher. Hence it is controversial and deceiving to believe that a reduction in
degree of hydration was responsible for the increased autogenous shrinkage. The
correlation between degree of hydration and autogenous shrinkage is not
straightforward as that in chemical shrinkage.
4. The basic hydration and development of chemical shrinkage alone is not
sufficient to explain the mechanism behind the increased autogenous shrinkage
experienced with a reduction in water-cement ratio.
Hence the author moves to explore other properties and attributes of the hydration and
the microstructure that could establish a link.
6.2.3 Free water left in the system
Attempts to quantity chemical shrinkage clearly lack information and cannot wholly by
itself explain the phenomenon of autogenous shrinkage strains recorded. Hence further
information on free water was studied and revealed from the simulation which are
analyzed to establish a possible link to the development of autogenous shrinkage.
The free water in the system (plain cement system) is the amount of water available for
the hydration or the evaporable water content of the system or un-reacted water within
the closed system.
We may state that,
Vfree.water = VTotal.water – Vnon-evaporable.water
Where
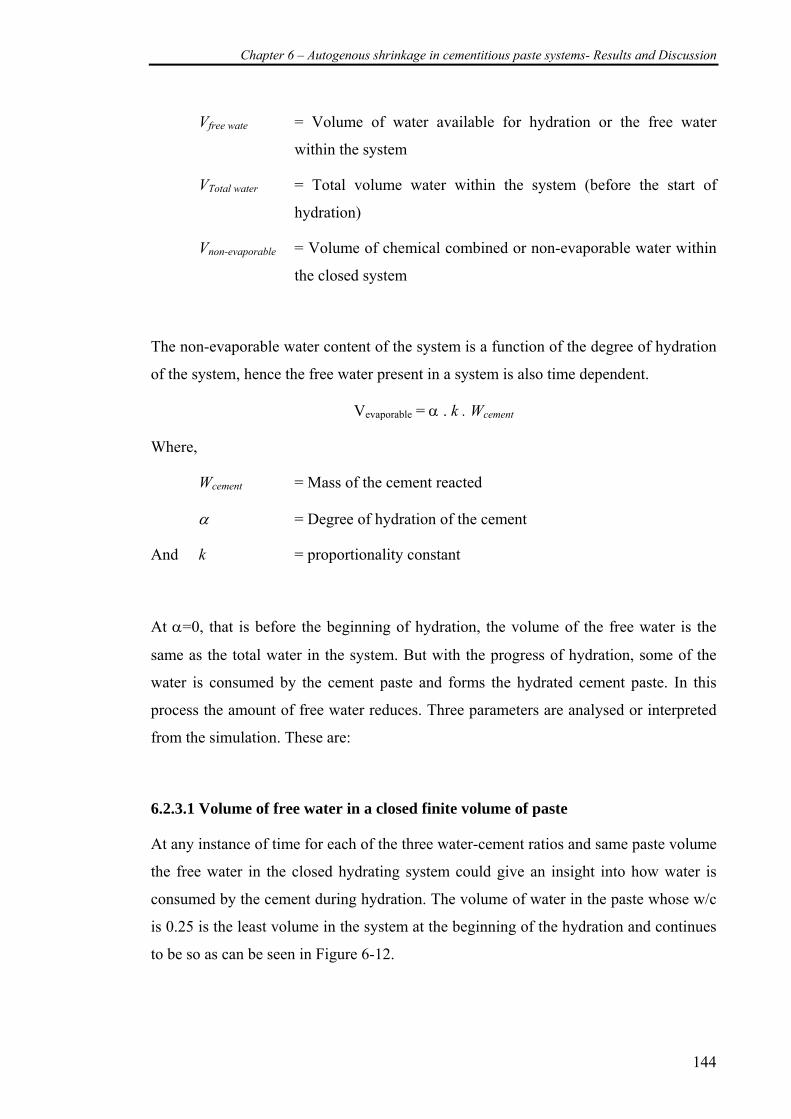
Chapter 6 – Autogenous shrinkage in cementitious paste systems- Results and Discussion
144
Vfree wate = Volume of water available for hydration or the free water
within the system
VTotal water = Total volume water within the system (before the start of
hydration)
Vnon-evaporable = Volume of chemical combined or non-evaporable water within
the closed system
The non-evaporable water content of the system is a function of the degree of hydration
of the system, hence the free water present in a system is also time dependent.
Vevaporable = α . k . Wcement
Where,
Wcement = Mass of the cement reacted
α = Degree of hydration of the cement
And k = proportionality constant
At α=0, that is before the beginning of hydration, the volume of the free water is the
same as the total water in the system. But with the progress of hydration, some of the
water is consumed by the cement paste and forms the hydrated cement paste. In this
process the amount of free water reduces. Three parameters are analysed or interpreted
from the simulation. These are:
6.2.3.1 Volume of free water in a closed finite volume of paste
At any instance of time for each of the three water-cement ratios and same paste volume
the free water in the closed hydrating system could give an insight into how water is
consumed by the cement during hydration. The volume of water in the paste whose w/c
is 0.25 is the least volume in the system at the beginning of the hydration and continues
to be so as can be seen in Figure 6-12.
Chapter 6 – Autogenous shrinkage in cementitious paste systems- Results and Discussion
145
Figure 6-12 Fractional volume of water left (free water) (simulation)
6.2.3.2 Consumption of Initial water content
The free water present as a ratio of the total volume of the paste may also not be
indicative of the rate at which water is consumed as the initial water content is different
for each of the water-cement ratio mixtures. The ratio of free water consumed to initial
free water may be a better indication of the rate of consumption. The cement paste with
water-cement ratio 0.25 continues to have a higher rate of consumption of the free water
as can be seen in Figure 6-13 despite lower degree of hydration for water-cement ratio
0.25 and lower water content to begin with. This is interesting and will be elaborated at
later sections as why this happens.
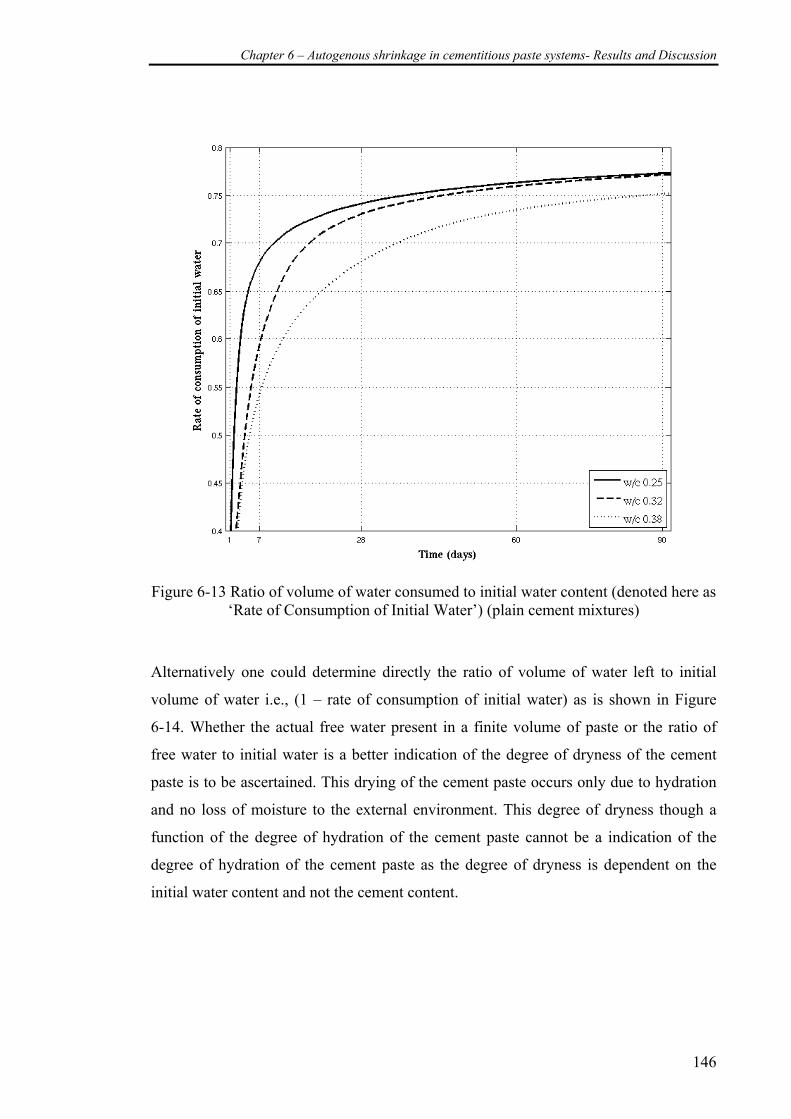
Chapter 6 – Autogenous shrinkage in cementitious paste systems- Results and Discussion
146
Figure 6-13 Ratio of volume of water consumed to initial water content (denoted here as
‘Rate of Consumption of Initial Water’) (plain cement mixtures)
Alternatively one could determine directly the ratio of volume of water left to initial
volume of water i.e., (1 – rate of consumption of initial water) as is shown in Figure
6-14. Whether the actual free water present in a finite volume of paste or the ratio of
free water to initial water is a better indication of the degree of dryness of the cement
paste is to be ascertained. This drying of the cement paste occurs only due to hydration
and no loss of moisture to the external environment. This degree of dryness though a
function of the degree of hydration of the cement paste cannot be a indication of the
degree of hydration of the cement paste as the degree of dryness is dependent on the
initial water content and not the cement content.
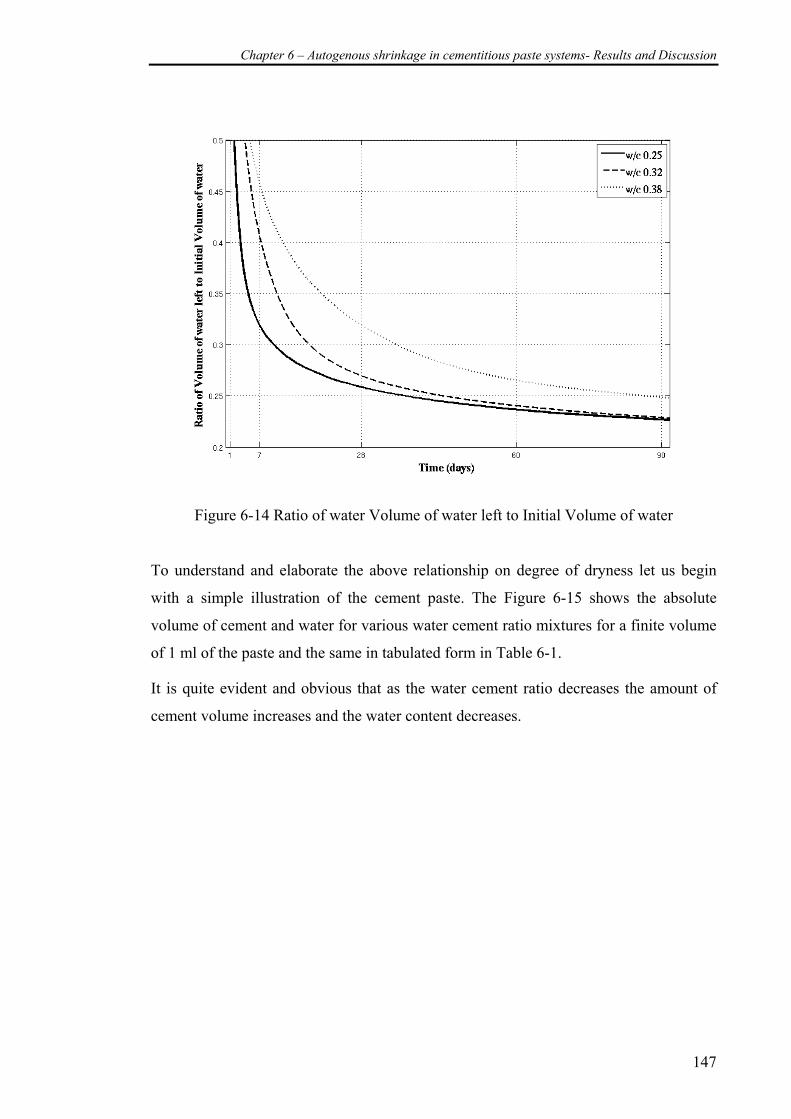
Chapter 6 – Autogenous shrinkage in cementitious paste systems- Results and Discussion
147
Figure 6-14 Ratio of water Volume of water left to Initial Volume of water To understand and elaborate the above relationship on degree of dryness let us begin
with a simple illustration of the cement paste. The Figure 6-15 shows the absolute
volume of cement and water for various water cement ratio mixtures for a finite volume
of 1 ml of the paste and the same in tabulated form in Table 6-1.
It is quite evident and obvious that as the water cement ratio decreases the amount of
cement volume increases and the water content decreases.
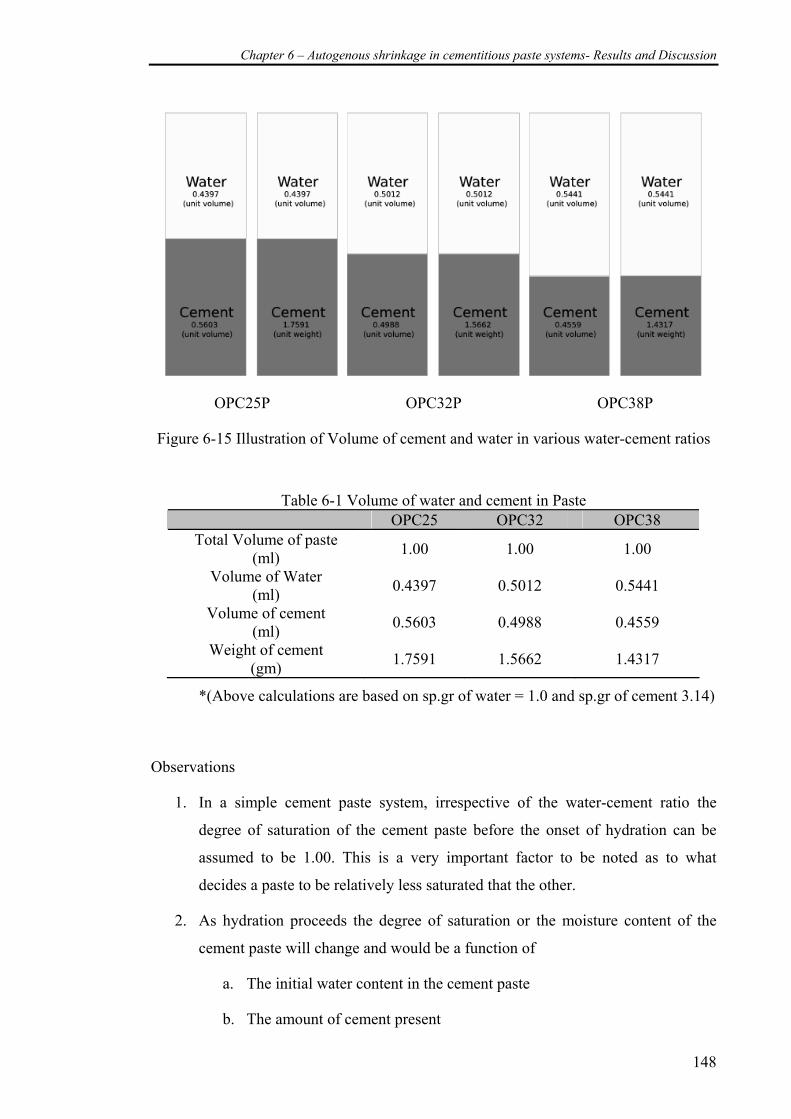
Chapter 6 – Autogenous shrinkage in cementitious paste systems- Results and Discussion
148
OPC25P OPC32P OPC38P
Figure 6-15 Illustration of Volume of cement and water in various water-cement ratios
Table 6-1 Volume of water and cement in Paste OPC25 OPC32 OPC38
Total Volume of paste (ml) 1.00 1.00 1.00
Volume of Water (ml) 0.4397 0.5012 0.5441
Volume of cement (ml) 0.5603 0.4988 0.4559
Weight of cement (gm) 1.7591 1.5662 1.4317
*(Above calculations are based on sp.gr of water = 1.0 and sp.gr of cement 3.14)
Observations
1. In a simple cement paste system, irrespective of the water-cement ratio the
degree of saturation of the cement paste before the onset of hydration can be
assumed to be 1.00. This is a very important factor to be noted as to what
decides a paste to be relatively less saturated that the other.
2. As hydration proceeds the degree of saturation or the moisture content of the
cement paste will change and would be a function of
a. The initial water content in the cement paste
b. The amount of cement present
Chapter 6 – Autogenous shrinkage in cementitious paste systems- Results and Discussion
149
c. The degree of hydration achieved by the cement
d. The amount of water consumed for hydration
3. These factors while though are very simple and easy to determine, when closely
observed reveals very interesting information on how water is consumed within
a hydrating cement paste system.
Hence a detailed calculations of change in volume of water and cement are shown in
Table 6-2, Table 6-3, Table 6-4 and Table 6-5 for 7, 28, 60 and 90 days and also
represented in Figure 6-16 and Figure 6-17. Note: The data in the table involves
theoretical calculations of the cement and water consumed for a finite volume based on
the simulated degree of hydration.
In the table below
• Volume of cement is expressed as absolute volume of unit cement paste volume
• Volume of water is expressed as absolute volume of unit cement paste volume
• ‘α’ degree of hydration of cement (determined from simulation)
• Rate of consumption of initial water (determined from simulation)
• Actual cement volume consumed expressed as absolute volume of unit cement
paste
• Actual water volume consumed expressed as absolute volume of unit cement
paste
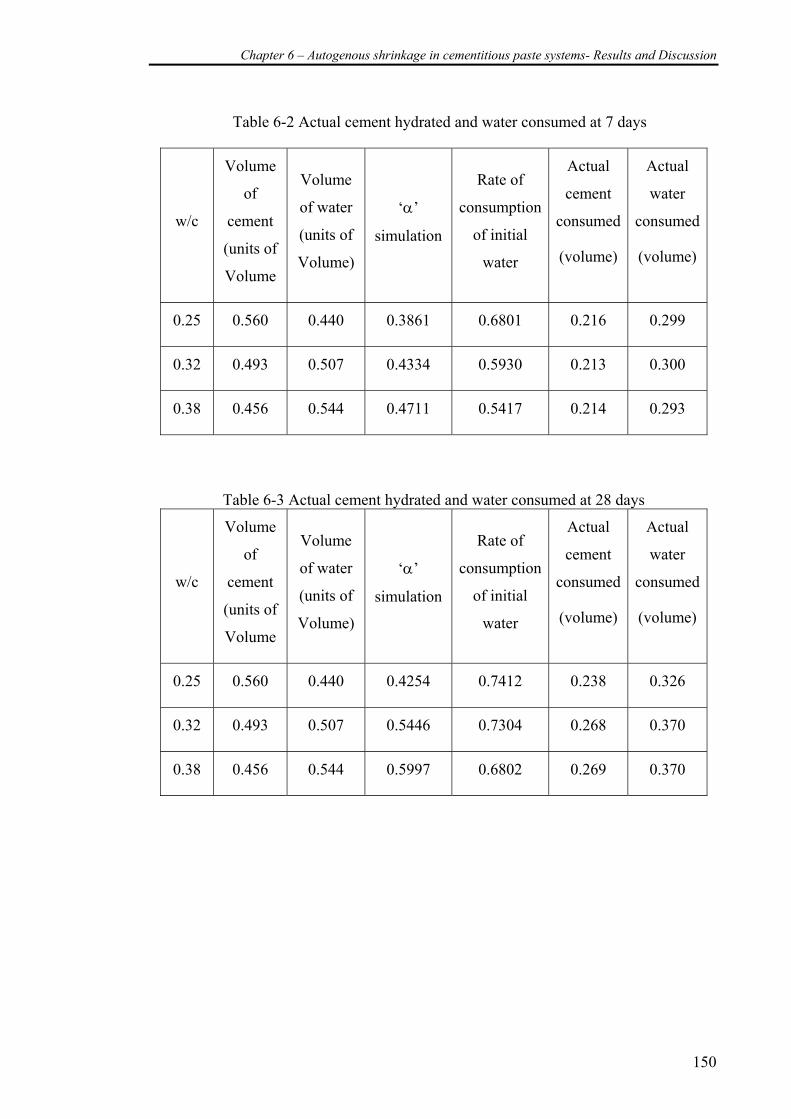
Chapter 6 – Autogenous shrinkage in cementitious paste systems- Results and Discussion
150
Table 6-2 Actual cement hydrated and water consumed at 7 days
w/c
Volume
of
cement
(units of
Volume
Volume
of water
(units of
Volume)
‘α’
simulation
Rate of
consumption
of initial
water
Actual
cement
consumed
(volume)
Actual
water
consumed
(volume)
0.25 0.560 0.440 0.3861 0.6801 0.216 0.299
0.32 0.493 0.507 0.4334 0.5930 0.213 0.300
0.38 0.456 0.544 0.4711 0.5417 0.214 0.293
Table 6-3 Actual cement hydrated and water consumed at 28 days
w/c
Volume
of
cement
(units of
Volume
Volume
of water
(units of
Volume)
‘α’
simulation
Rate of
consumption
of initial
water
Actual
cement
consumed
(volume)
Actual
water
consumed
(volume)
0.25 0.560 0.440 0.4254 0.7412 0.238 0.326
0.32 0.493 0.507 0.5446 0.7304 0.268 0.370
0.38 0.456 0.544 0.5997 0.6802 0.269 0.370
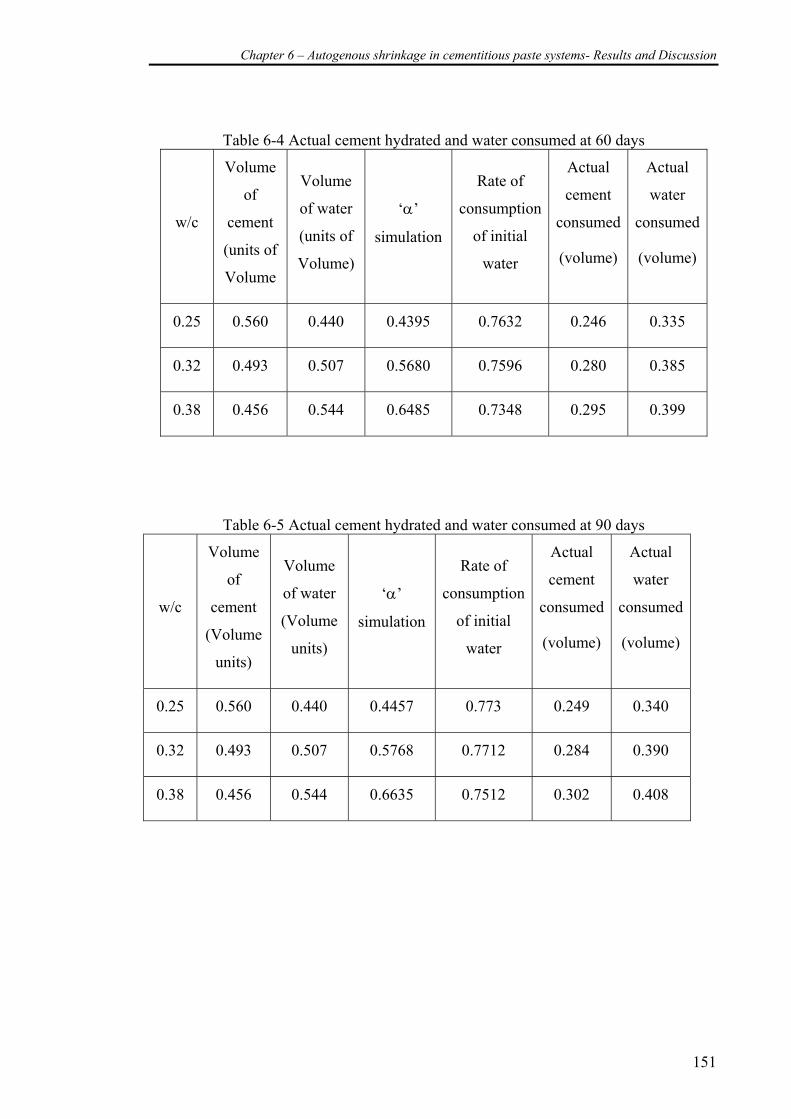
Chapter 6 – Autogenous shrinkage in cementitious paste systems- Results and Discussion
151
Table 6-4 Actual cement hydrated and water consumed at 60 days
w/c
Volume
of
cement
(units of
Volume
Volume
of water
(units of
Volume)
‘α’
simulation
Rate of
consumption
of initial
water
Actual
cement
consumed
(volume)
Actual
water
consumed
(volume)
0.25 0.560 0.440 0.4395 0.7632 0.246 0.335
0.32 0.493 0.507 0.5680 0.7596 0.280 0.385
0.38 0.456 0.544 0.6485 0.7348 0.295 0.399
Table 6-5 Actual cement hydrated and water consumed at 90 days
w/c
Volume
of
cement
(Volume
units)
Volume
of water
(Volume
units)
‘α’
simulation
Rate of
consumption
of initial
water
Actual
cement
consumed
(volume)
Actual
water
consumed
(volume)
0.25 0.560 0.440 0.4457 0.773 0.249 0.340
0.32 0.493 0.507 0.5768 0.7712 0.284 0.390
0.38 0.456 0.544 0.6635 0.7512 0.302 0.408
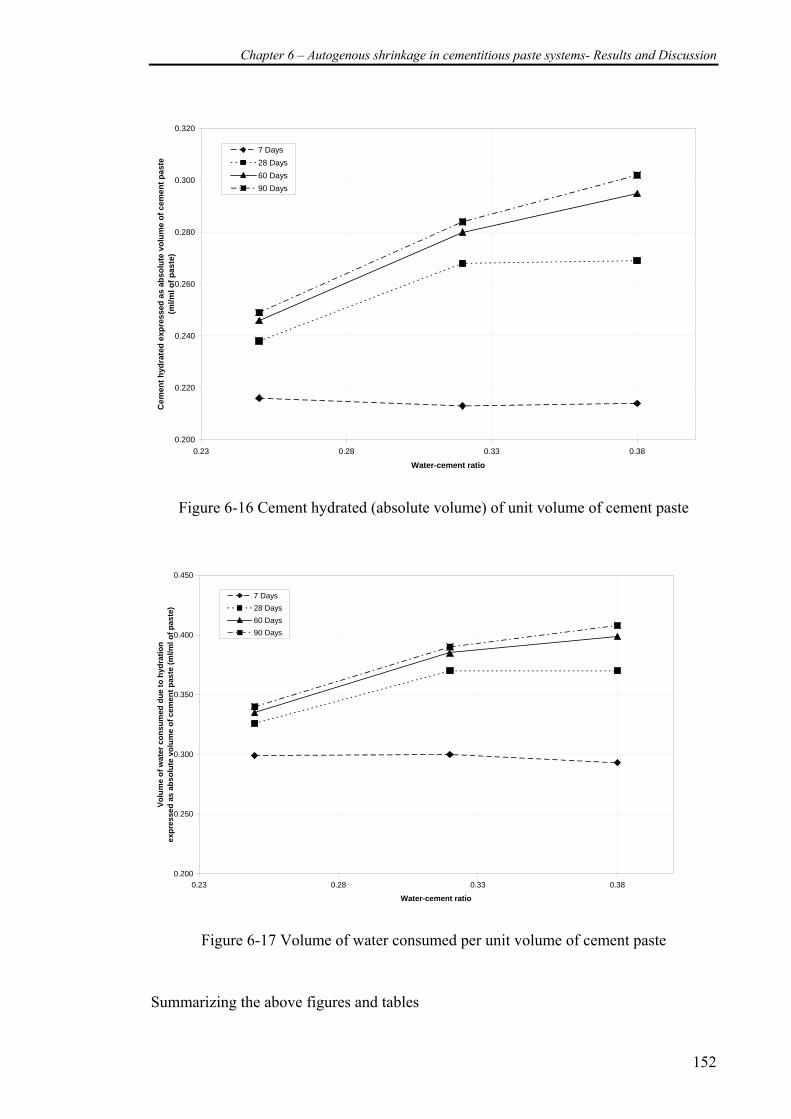
Chapter 6 – Autogenous shrinkage in cementitious paste systems- Results and Discussion
152
0.200
0.220
0.240
0.260
0.280
0.300
0.320
0.23 0.28 0.33 0.38
Water-cement ratio
Cem
ent h
ydra
ted
expr
esse
d as
abs
olut
e vo
lum
e of
cem
ent p
aste
(m
l/ml o
f pas
te)
7 Days28 Days60 Days90 Days
Figure 6-16 Cement hydrated (absolute volume) of unit volume of cement paste
0.200
0.250
0.300
0.350
0.400
0.450
0.23 0.28 0.33 0.38
Water-cement ratio
Volu
me
of w
ater
con
sum
ed d
ue to
hyd
ratio
n ex
pres
sed
as a
bsol
ute
volu
me
of c
emen
t pas
te (m
l/ml o
f pas
te)
7 Days28 Days60 Days90 Days
Figure 6-17 Volume of water consumed per unit volume of cement paste
Summarizing the above figures and tables
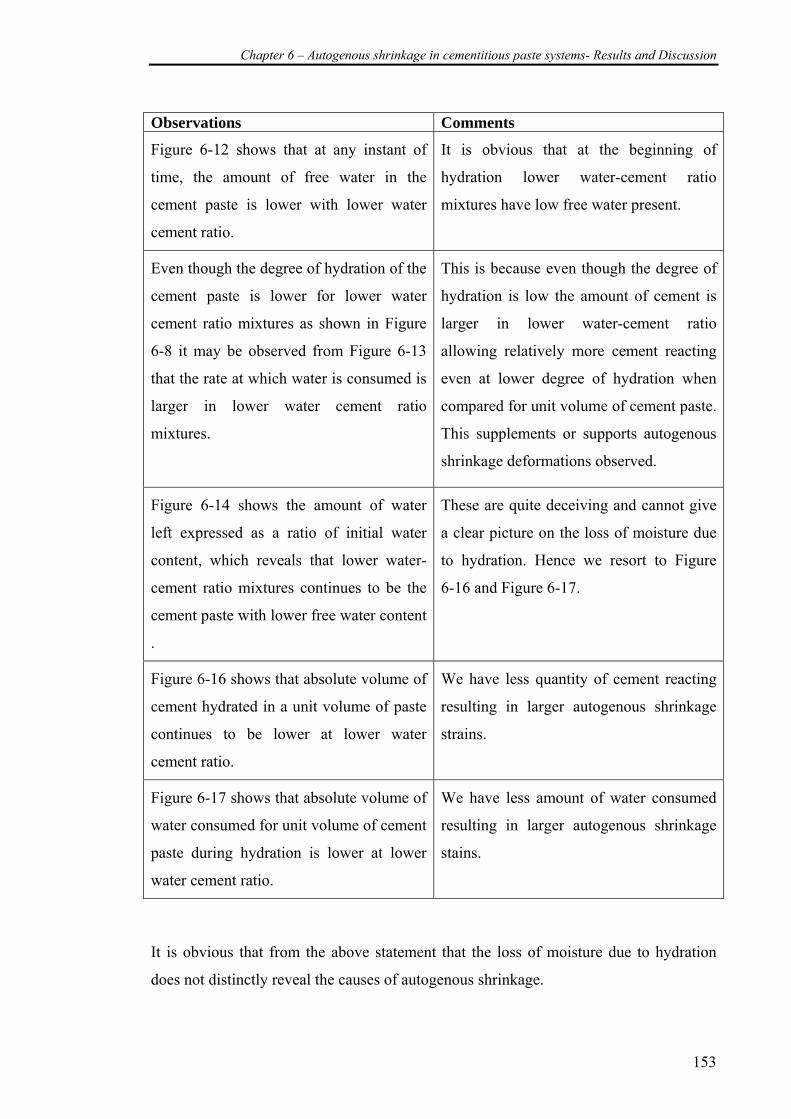
Chapter 6 – Autogenous shrinkage in cementitious paste systems- Results and Discussion
153
Observations Comments
Figure 6-12 shows that at any instant of
time, the amount of free water in the
cement paste is lower with lower water
cement ratio.
It is obvious that at the beginning of
hydration lower water-cement ratio
mixtures have low free water present.
Even though the degree of hydration of the
cement paste is lower for lower water
cement ratio mixtures as shown in Figure
6-8 it may be observed from Figure 6-13
that the rate at which water is consumed is
larger in lower water cement ratio
mixtures.
This is because even though the degree of
hydration is low the amount of cement is
larger in lower water-cement ratio
allowing relatively more cement reacting
even at lower degree of hydration when
compared for unit volume of cement paste.
This supplements or supports autogenous
shrinkage deformations observed.
Figure 6-14 shows the amount of water
left expressed as a ratio of initial water
content, which reveals that lower water-
cement ratio mixtures continues to be the
cement paste with lower free water content
.
These are quite deceiving and cannot give
a clear picture on the loss of moisture due
to hydration. Hence we resort to Figure
6-16 and Figure 6-17.
Figure 6-16 shows that absolute volume of
cement hydrated in a unit volume of paste
continues to be lower at lower water
cement ratio.
We have less quantity of cement reacting
resulting in larger autogenous shrinkage
strains.
Figure 6-17 shows that absolute volume of
water consumed for unit volume of cement
paste during hydration is lower at lower
water cement ratio.
We have less amount of water consumed
resulting in larger autogenous shrinkage
stains.
It is obvious that from the above statement that the loss of moisture due to hydration
does not distinctly reveal the causes of autogenous shrinkage.
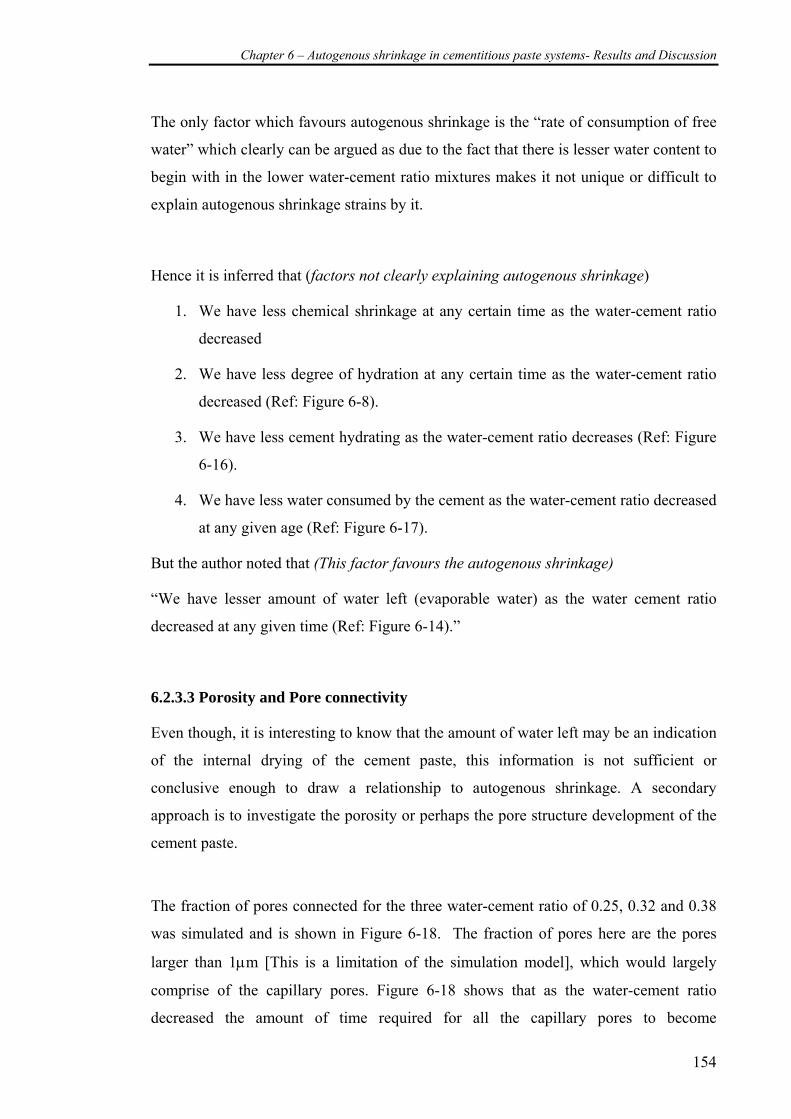
Chapter 6 – Autogenous shrinkage in cementitious paste systems- Results and Discussion
154
The only factor which favours autogenous shrinkage is the “rate of consumption of free
water” which clearly can be argued as due to the fact that there is lesser water content to
begin with in the lower water-cement ratio mixtures makes it not unique or difficult to
explain autogenous shrinkage strains by it.
Hence it is inferred that (factors not clearly explaining autogenous shrinkage)
1. We have less chemical shrinkage at any certain time as the water-cement ratio
decreased
2. We have less degree of hydration at any certain time as the water-cement ratio
decreased (Ref: Figure 6-8).
3. We have less cement hydrating as the water-cement ratio decreases (Ref: Figure
6-16).
4. We have less water consumed by the cement as the water-cement ratio decreased
at any given age (Ref: Figure 6-17).
But the author noted that (This factor favours the autogenous shrinkage)
“We have lesser amount of water left (evaporable water) as the water cement ratio
decreased at any given time (Ref: Figure 6-14).”
6.2.3.3 Porosity and Pore connectivity
Even though, it is interesting to know that the amount of water left may be an indication
of the internal drying of the cement paste, this information is not sufficient or
conclusive enough to draw a relationship to autogenous shrinkage. A secondary
approach is to investigate the porosity or perhaps the pore structure development of the
cement paste.
The fraction of pores connected for the three water-cement ratio of 0.25, 0.32 and 0.38
was simulated and is shown in Figure 6-18. The fraction of pores here are the pores
larger than 1μm [This is a limitation of the simulation model], which would largely
comprise of the capillary pores. Figure 6-18 shows that as the water-cement ratio
decreased the amount of time required for all the capillary pores to become
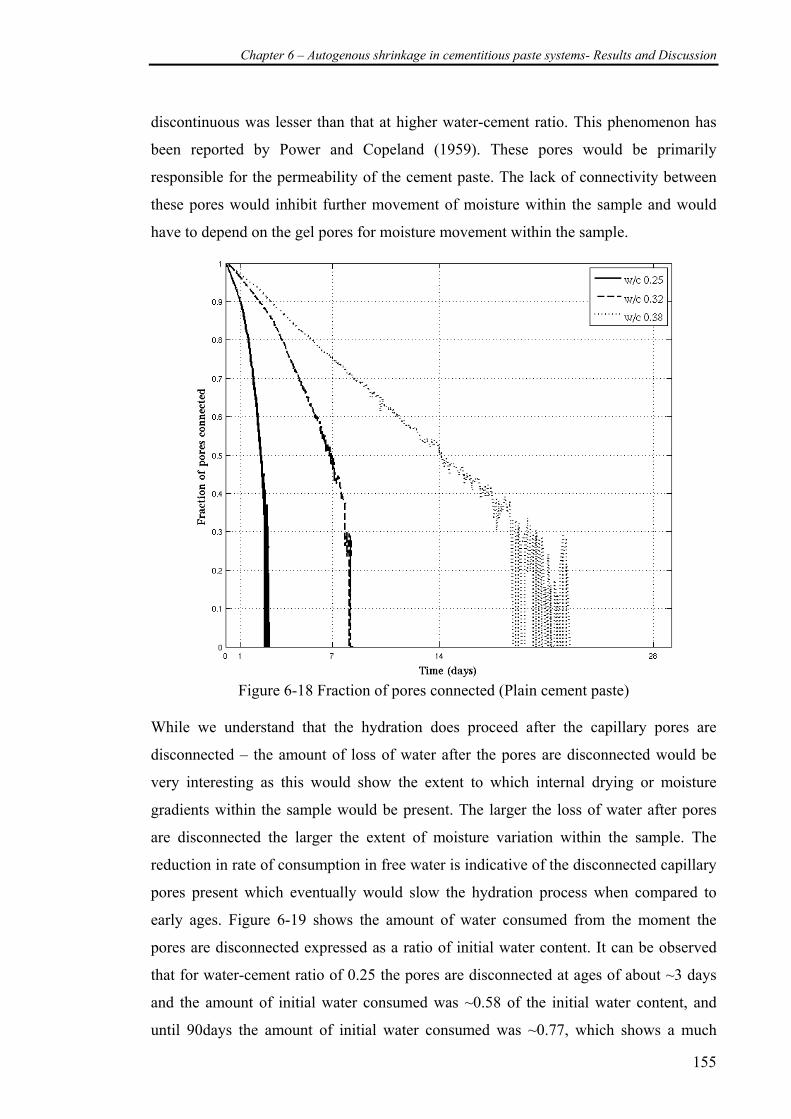
Chapter 6 – Autogenous shrinkage in cementitious paste systems- Results and Discussion
155
discontinuous was lesser than that at higher water-cement ratio. This phenomenon has
been reported by Power and Copeland (1959). These pores would be primarily
responsible for the permeability of the cement paste. The lack of connectivity between
these pores would inhibit further movement of moisture within the sample and would
have to depend on the gel pores for moisture movement within the sample.
Figure 6-18 Fraction of pores connected (Plain cement paste)
While we understand that the hydration does proceed after the capillary pores are
disconnected – the amount of loss of water after the pores are disconnected would be
very interesting as this would show the extent to which internal drying or moisture
gradients within the sample would be present. The larger the loss of water after pores
are disconnected the larger the extent of moisture variation within the sample. The
reduction in rate of consumption in free water is indicative of the disconnected capillary
pores present which eventually would slow the hydration process when compared to
early ages. Figure 6-19 shows the amount of water consumed from the moment the
pores are disconnected expressed as a ratio of initial water content. It can be observed
that for water-cement ratio of 0.25 the pores are disconnected at ages of about ~3 days
and the amount of initial water consumed was ~0.58 of the initial water content, and
until 90days the amount of initial water consumed was ~0.77, which shows a much
Chapter 6 – Autogenous shrinkage in cementitious paste systems- Results and Discussion
156
slower rate of consumption of water compared to when the capillary pores were
connected. Similar trends are visible in higher water-cement ratio of 0.32 and 0.38.
However
The rate of consumption of water after the sample has no connected capillary pores
is higher in lower-water cement ratio mixture than that of the higher water-cement
ratio mixtures
This may be one of the important factors contributing to the drop in relative humidity
being larger in lower water-cement ratio mixtures.
Figure 6-19 Rate of consumption of water from the duration the pores are not connected
6.2.4 Relative humidity change
The author is well aware that the relative humidity (RH) is an important factor
contributing to the development of autogenous shrinkage. The relationship to relative
humidity change is linked to the menisci formation within the pore structure of the
cement paste at the interface between the air and water phase. Hence it becomes a
function of the amount of water present in the closed system and also a function of
porosity and pore structure.
Chapter 6 – Autogenous shrinkage in cementitious paste systems- Results and Discussion
157
While not much information can be gained regarding the pores smaller than the 1 μm
from the simulation, the volume of empty pores can serve as an indication of the degree
of saturation of the existing pores.
The basic Kelvin equation for the relative humidity change within a porous system
(Bentz and Jensen 2004) is:
rRTV
RH m..2)ln(
γ−=
Where the relative humidity within a closed system is related to the radius of the pore
where the meniscus is formed. This was also reported by Hua et al. (1995), where he
makes a mention that an access radius ro exists such that where all the pores of radius
larger that ro will be empty and the pores of radius smaller than ro will be filled with
water.
While a detailed pore size analysis of the microstructure would be required to adopt the
above theory and determine the relative humidity, an alternative approach is proposed to
interpret the phenomenon of autogenous shrinkage, if not exactly the autogenous strains
experienced by the cement paste.
Porosity is expressed as ratio of volume of voids to that total volume. The voids would
comprise of both the water filled pores and empty pores. The porosity of the
microstructure can be determined from the simulation and is plotted in Figure 6-20. At
any instance of time we can find the total porosity in the system. Of this total pores
available, a certain proportion would be filled with water and and another portion would
be empty. We can determine the ratio of empty pores to that of the total pores in the
system and as shown in Figure 6-21. The total pores comprise of the water filled pores
and the empty pores.
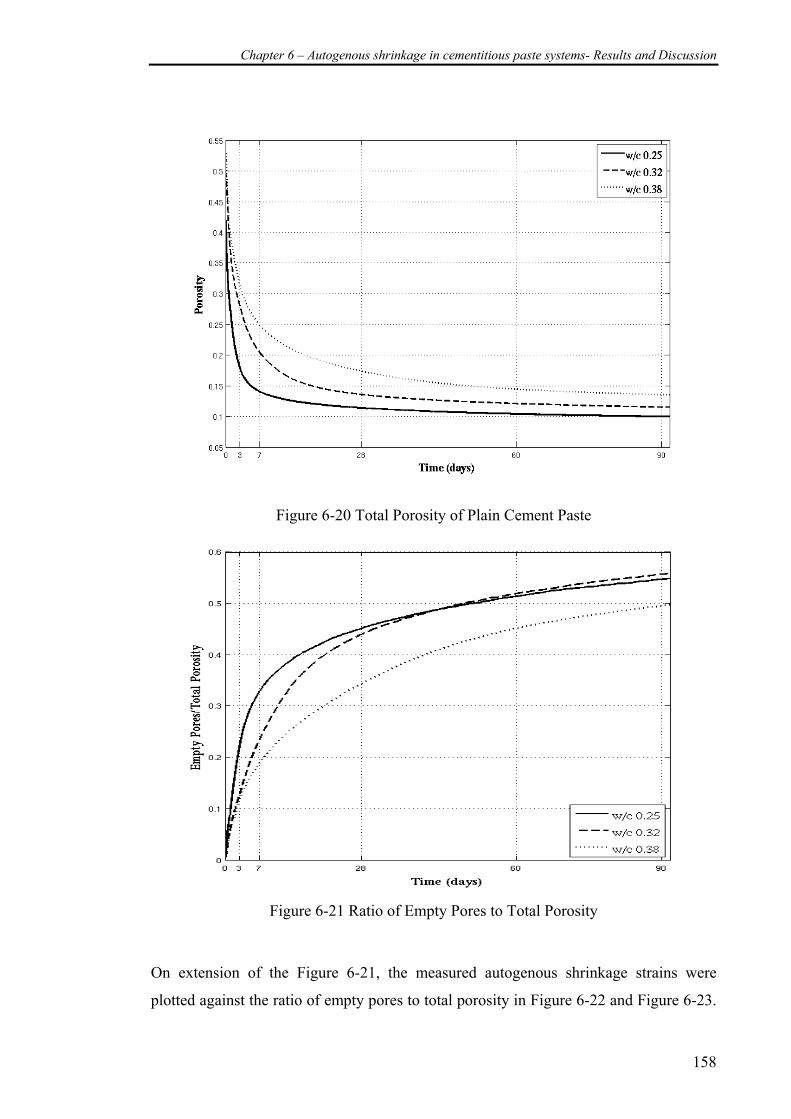
Chapter 6 – Autogenous shrinkage in cementitious paste systems- Results and Discussion
158
Figure 6-20 Total Porosity of Plain Cement Paste
Figure 6-21 Ratio of Empty Pores to Total Porosity
On extension of the Figure 6-21, the measured autogenous shrinkage strains were
plotted against the ratio of empty pores to total porosity in Figure 6-22 and Figure 6-23.
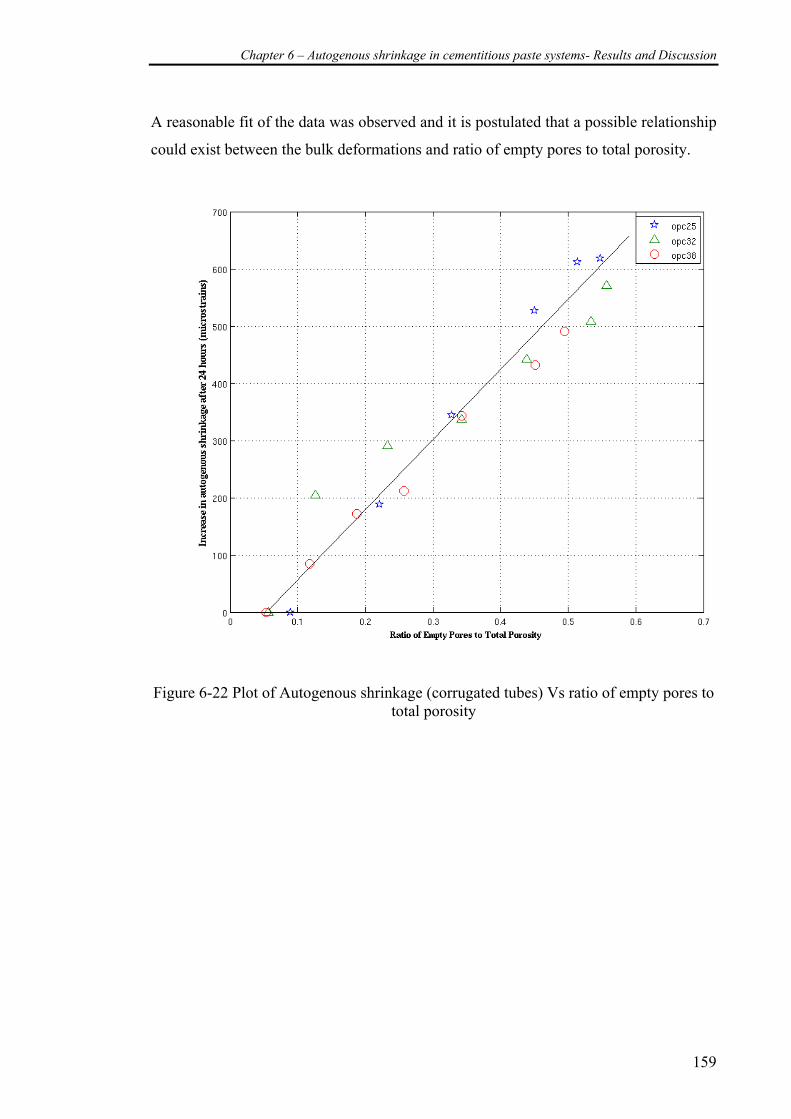
Chapter 6 – Autogenous shrinkage in cementitious paste systems- Results and Discussion
159
A reasonable fit of the data was observed and it is postulated that a possible relationship
could exist between the bulk deformations and ratio of empty pores to total porosity.
Figure 6-22 Plot of Autogenous shrinkage (corrugated tubes) Vs ratio of empty pores to total porosity
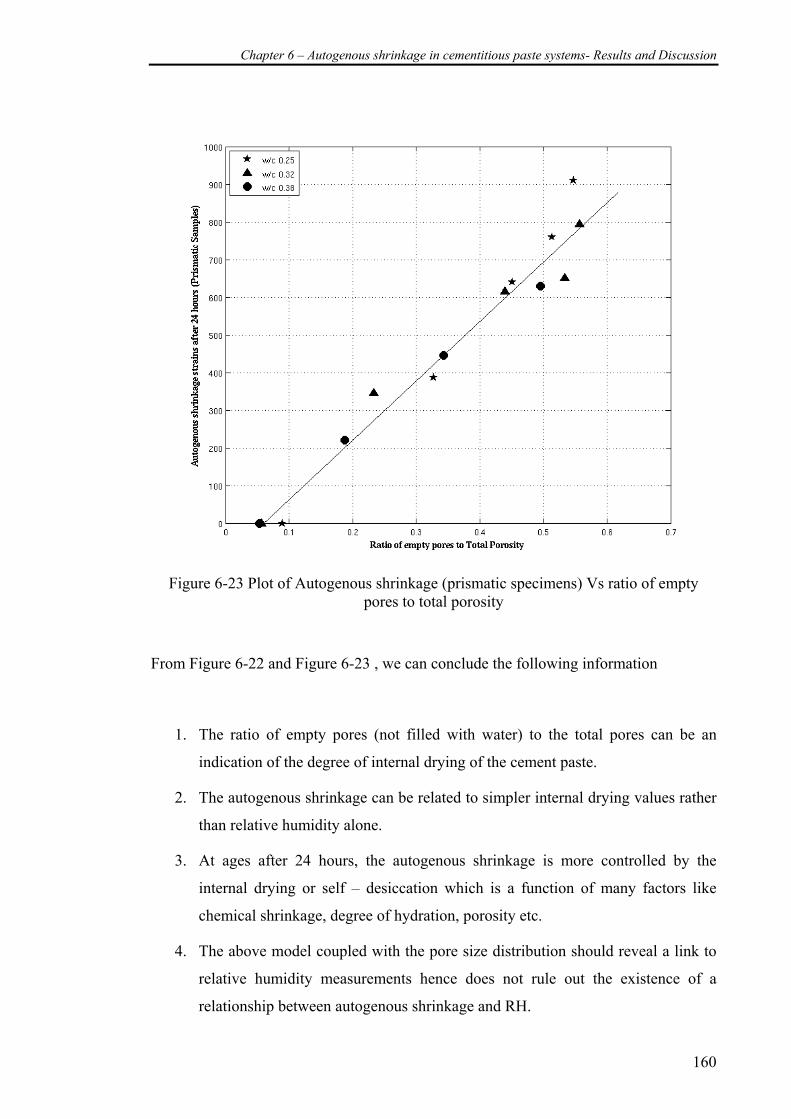
Chapter 6 – Autogenous shrinkage in cementitious paste systems- Results and Discussion
160
Figure 6-23 Plot of Autogenous shrinkage (prismatic specimens) Vs ratio of empty
pores to total porosity
From Figure 6-22 and Figure 6-23 , we can conclude the following information
1. The ratio of empty pores (not filled with water) to the total pores can be an
indication of the degree of internal drying of the cement paste.
2. The autogenous shrinkage can be related to simpler internal drying values rather
than relative humidity alone.
3. At ages after 24 hours, the autogenous shrinkage is more controlled by the
internal drying or self – desiccation which is a function of many factors like
chemical shrinkage, degree of hydration, porosity etc.
4. The above model coupled with the pore size distribution should reveal a link to
relative humidity measurements hence does not rule out the existence of a
relationship between autogenous shrinkage and RH.
Chapter 6 – Autogenous shrinkage in cementitious paste systems- Results and Discussion
161
5. The use of measurement of relative humidity which is also the degree of internal
drying within the system, though a more accurate and realistic approach, is very
difficult to determine.
6. The amount of empty pores can be determined from chemical shrinkage data and
the amount of total porosity could be revealed from the degree of hydration of
the system and are easier to determine and can serve as a good indication of
autogenous shrinkage development.
7. This approach has been applied only to deformations after 24 hours. At ages <24
hours the phenomenon of autogenous shrinkage is not due to self desiccation
alone and hence this approach cannot be applied.
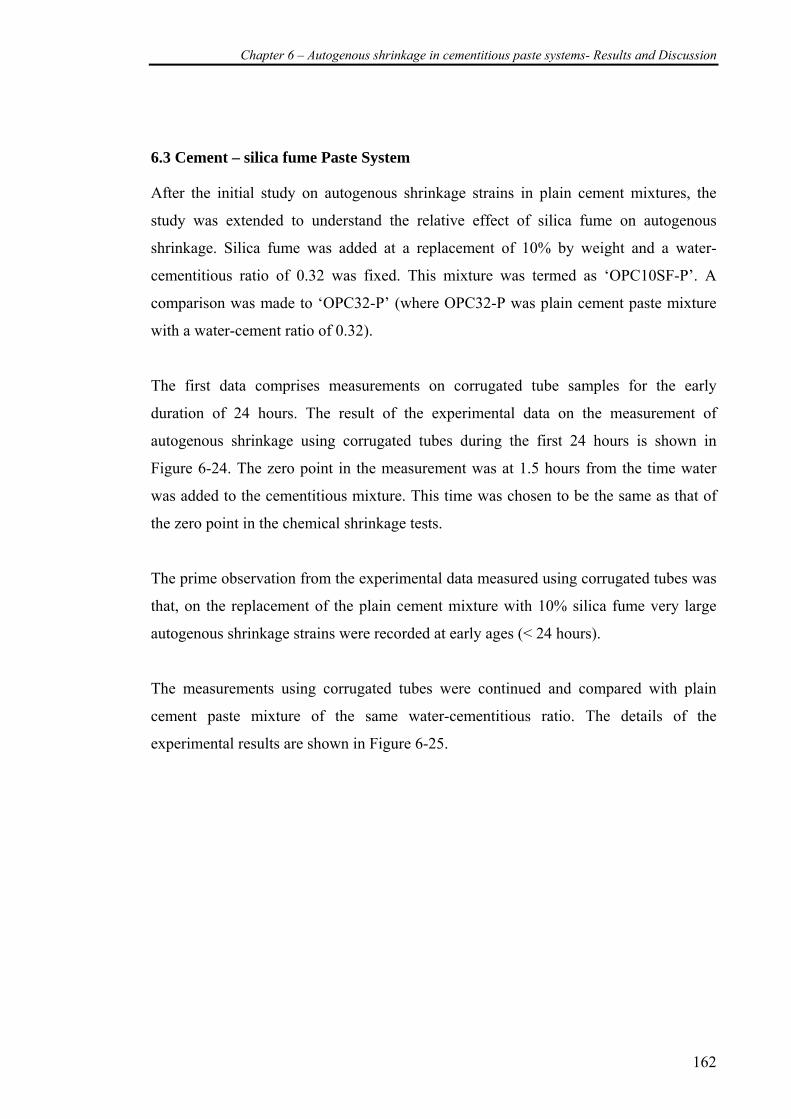
Chapter 6 – Autogenous shrinkage in cementitious paste systems- Results and Discussion
162
6.3 Cement – silica fume Paste System
After the initial study on autogenous shrinkage strains in plain cement mixtures, the
study was extended to understand the relative effect of silica fume on autogenous
shrinkage. Silica fume was added at a replacement of 10% by weight and a water-
cementitious ratio of 0.32 was fixed. This mixture was termed as ‘OPC10SF-P’. A
comparison was made to ‘OPC32-P’ (where OPC32-P was plain cement paste mixture
with a water-cement ratio of 0.32).
The first data comprises measurements on corrugated tube samples for the early
duration of 24 hours. The result of the experimental data on the measurement of
autogenous shrinkage using corrugated tubes during the first 24 hours is shown in
Figure 6-24. The zero point in the measurement was at 1.5 hours from the time water
was added to the cementitious mixture. This time was chosen to be the same as that of
the zero point in the chemical shrinkage tests.
The prime observation from the experimental data measured using corrugated tubes was
that, on the replacement of the plain cement mixture with 10% silica fume very large
autogenous shrinkage strains were recorded at early ages (< 24 hours).
The measurements using corrugated tubes were continued and compared with plain
cement paste mixture of the same water-cementitious ratio. The details of the
experimental results are shown in Figure 6-25.
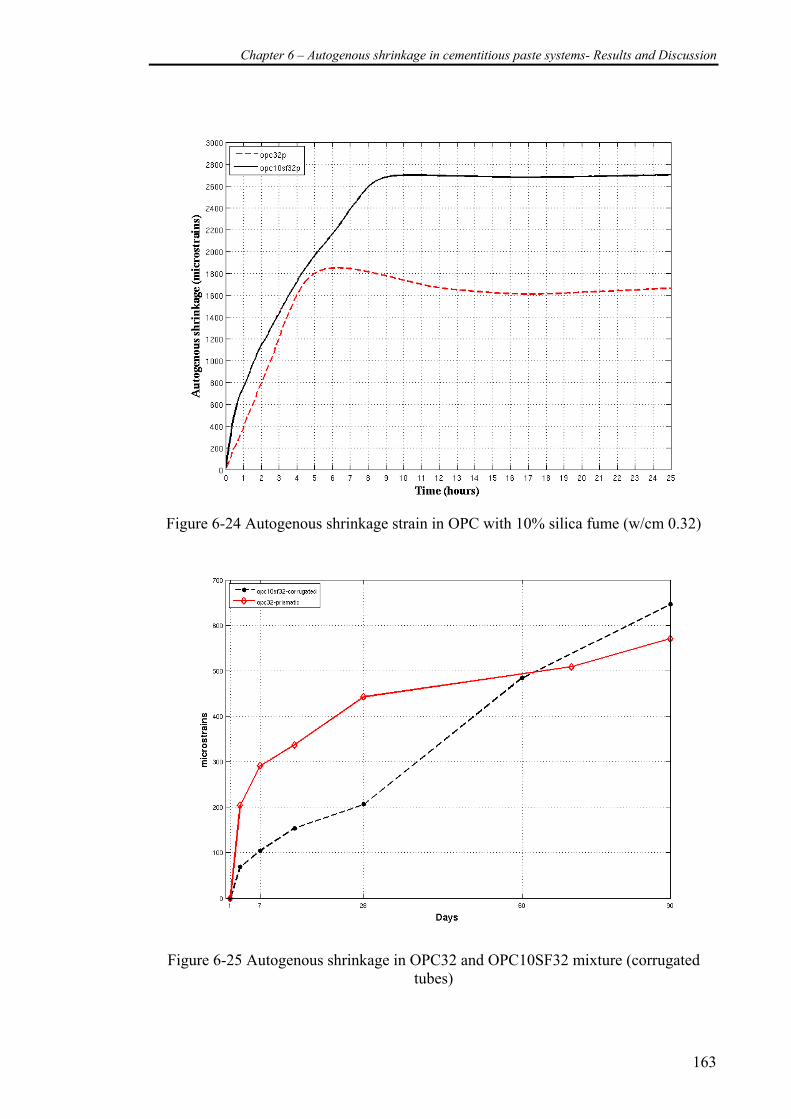
Chapter 6 – Autogenous shrinkage in cementitious paste systems- Results and Discussion
163
Figure 6-24 Autogenous shrinkage strain in OPC with 10% silica fume (w/cm 0.32)
Figure 6-25 Autogenous shrinkage in OPC32 and OPC10SF32 mixture (corrugated
tubes)
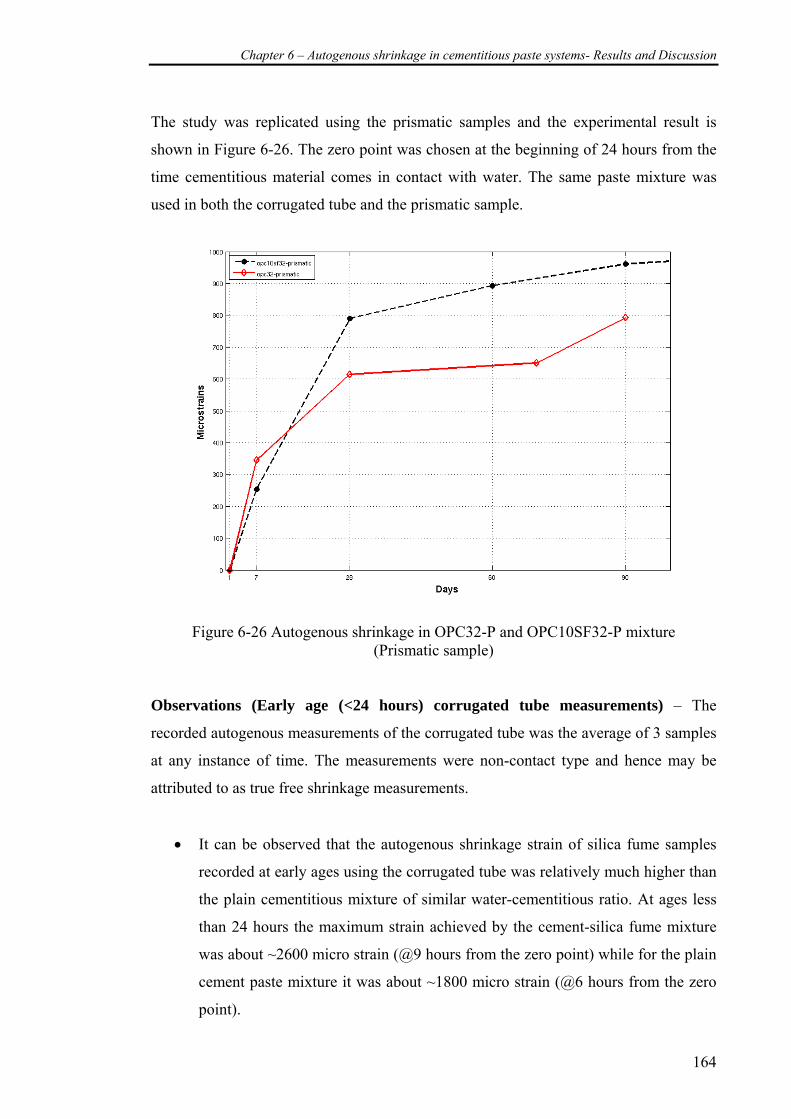
Chapter 6 – Autogenous shrinkage in cementitious paste systems- Results and Discussion
164
The study was replicated using the prismatic samples and the experimental result is
shown in Figure 6-26. The zero point was chosen at the beginning of 24 hours from the
time cementitious material comes in contact with water. The same paste mixture was
used in both the corrugated tube and the prismatic sample.
Figure 6-26 Autogenous shrinkage in OPC32-P and OPC10SF32-P mixture
(Prismatic sample) Observations (Early age (<24 hours) corrugated tube measurements) – The
recorded autogenous measurements of the corrugated tube was the average of 3 samples
at any instance of time. The measurements were non-contact type and hence may be
attributed to as true free shrinkage measurements.
• It can be observed that the autogenous shrinkage strain of silica fume samples
recorded at early ages using the corrugated tube was relatively much higher than
the plain cementitious mixture of similar water-cementitious ratio. At ages less
than 24 hours the maximum strain achieved by the cement-silica fume mixture
was about ~2600 micro strain (@9 hours from the zero point) while for the plain
cement paste mixture it was about ~1800 micro strain (@6 hours from the zero
point).
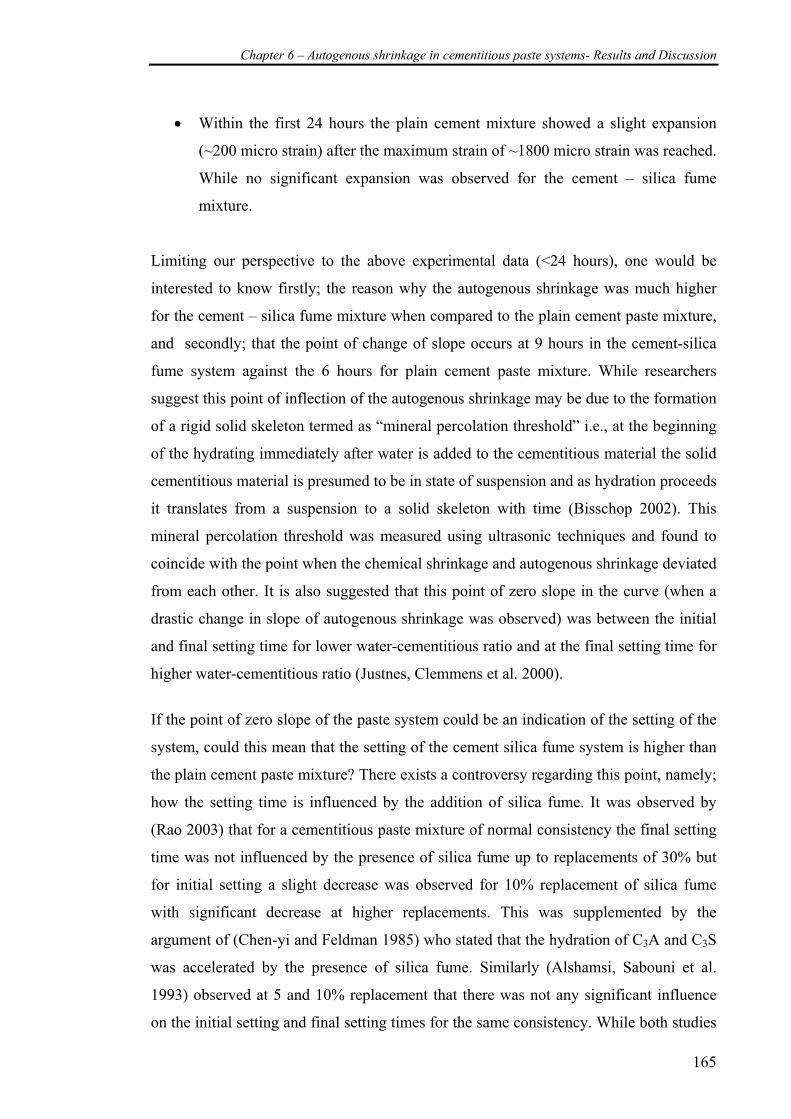
Chapter 6 – Autogenous shrinkage in cementitious paste systems- Results and Discussion
165
• Within the first 24 hours the plain cement mixture showed a slight expansion
(~200 micro strain) after the maximum strain of ~1800 micro strain was reached.
While no significant expansion was observed for the cement – silica fume
mixture.
Limiting our perspective to the above experimental data (<24 hours), one would be
interested to know firstly; the reason why the autogenous shrinkage was much higher
for the cement – silica fume mixture when compared to the plain cement paste mixture,
and secondly; that the point of change of slope occurs at 9 hours in the cement-silica
fume system against the 6 hours for plain cement paste mixture. While researchers
suggest this point of inflection of the autogenous shrinkage may be due to the formation
of a rigid solid skeleton termed as “mineral percolation threshold” i.e., at the beginning
of the hydrating immediately after water is added to the cementitious material the solid
cementitious material is presumed to be in state of suspension and as hydration proceeds
it translates from a suspension to a solid skeleton with time (Bisschop 2002). This
mineral percolation threshold was measured using ultrasonic techniques and found to
coincide with the point when the chemical shrinkage and autogenous shrinkage deviated
from each other. It is also suggested that this point of zero slope in the curve (when a
drastic change in slope of autogenous shrinkage was observed) was between the initial
and final setting time for lower water-cementitious ratio and at the final setting time for
higher water-cementitious ratio (Justnes, Clemmens et al. 2000).
If the point of zero slope of the paste system could be an indication of the setting of the
system, could this mean that the setting of the cement silica fume system is higher than
the plain cement paste mixture? There exists a controversy regarding this point, namely;
how the setting time is influenced by the addition of silica fume. It was observed by
(Rao 2003) that for a cementitious paste mixture of normal consistency the final setting
time was not influenced by the presence of silica fume up to replacements of 30% but
for initial setting a slight decrease was observed for 10% replacement of silica fume
with significant decrease at higher replacements. This was supplemented by the
argument of (Chen-yi and Feldman 1985) who stated that the hydration of C3A and C3S
was accelerated by the presence of silica fume. Similarly (Alshamsi, Sabouni et al.
1993) observed at 5 and 10% replacement that there was not any significant influence
on the initial setting and final setting times for the same consistency. While both studies
Chapter 6 – Autogenous shrinkage in cementitious paste systems- Results and Discussion
166
where done by comparing paste mixtures of similar consistencies and not similar water-
cementitious ratio it becomes difficult to conclude whether the setting time is retarded
as the accepted perception is that the water demand is increased with the addition of
silica fume. Nevertheless in this experimental study the super plasticizer dosage was
adjusted (higher than the plain cement paste mixture) to obtain the same flow
characteristics while maintaining the same water-cementitious ratio. This would have
increased the setting times for the silica fume though the additional super plasticizer
was a counter measure to the water demand. Whether the increased setting time
influenced the measured autogenous shrinkage or was it purely chemical shrinkage
coupled with self-desiccation is yet arguable.
Hence, from the above early age measurements on corrugated tubes at early ages (<24
hours) several questions arise:
1. While researchers have debated and postulated that most of the chemical
shrinkage is translated to autogenous shrinkage during the early hours (before
the time of set of the paste), did a higher chemical shrinkage of cement-silica
fume mixture alone contribute to the higher autogenous shrinkage strains in
early age measurements?
2. If the setting time is to influence the point of first plateau of the autogenous
shrinkage strains, can this mean that when accelerators are used or the setting
time is prolonged due to use of super-plasticizer or retarders in high fluid
mixtures that the chemical shrinkage would continue to translate into autogenous
shrinkage until sufficient strength is achieved, resulting in different autogenous
shrinkage strains for the same paste mixture with different setting characteristics
(as illustrated in Figure 6-27)? In short, can the same mixture with different
setting characteristics have a varied response to autogenous shrinkage during
early ages?
3. What are the hydration characteristics which caused the higher autogenous
shrinkage strain values for the cement – silica fume mixtures?
4. What is the importance of the slope of the deformation curve at early ages?
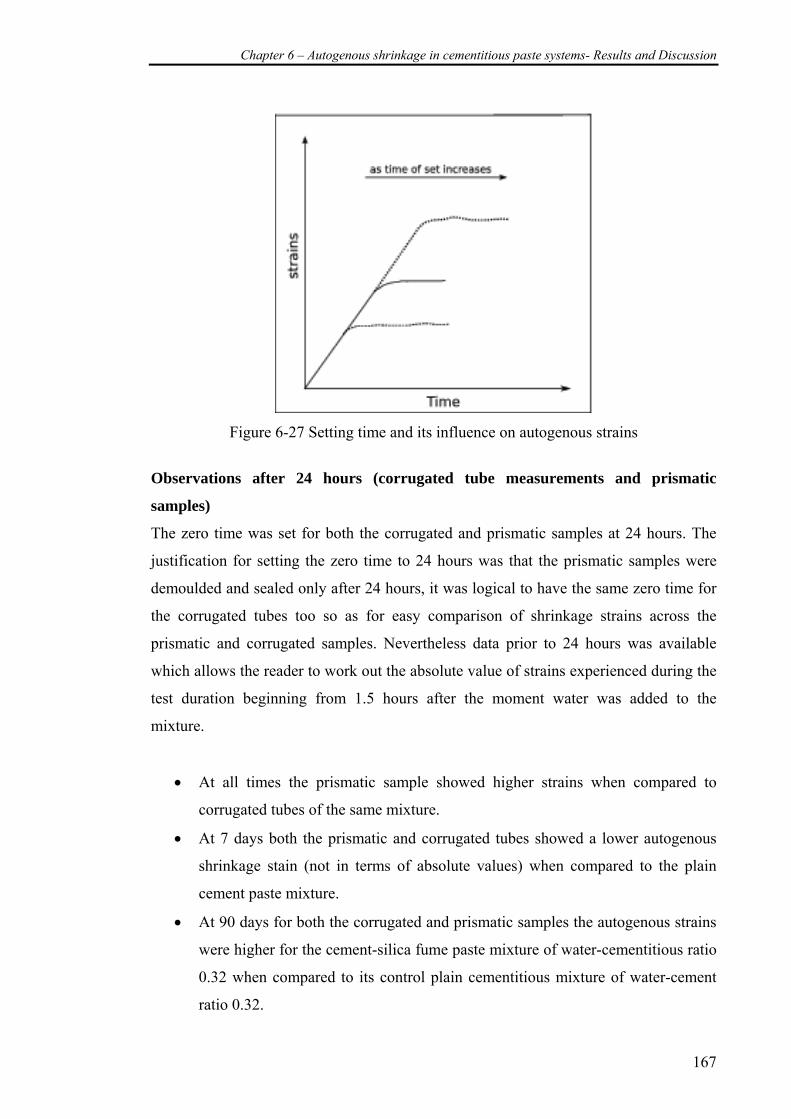
Chapter 6 – Autogenous shrinkage in cementitious paste systems- Results and Discussion
167
Figure 6-27 Setting time and its influence on autogenous strains
Observations after 24 hours (corrugated tube measurements and prismatic
samples)
The zero time was set for both the corrugated and prismatic samples at 24 hours. The
justification for setting the zero time to 24 hours was that the prismatic samples were
demoulded and sealed only after 24 hours, it was logical to have the same zero time for
the corrugated tubes too so as for easy comparison of shrinkage strains across the
prismatic and corrugated samples. Nevertheless data prior to 24 hours was available
which allows the reader to work out the absolute value of strains experienced during the
test duration beginning from 1.5 hours after the moment water was added to the
mixture.
• At all times the prismatic sample showed higher strains when compared to
corrugated tubes of the same mixture.
• At 7 days both the prismatic and corrugated tubes showed a lower autogenous
shrinkage stain (not in terms of absolute values) when compared to the plain
cement paste mixture.
• At 90 days for both the corrugated and prismatic samples the autogenous strains
were higher for the cement-silica fume paste mixture of water-cementitious ratio
0.32 when compared to its control plain cementitious mixture of water-cement
ratio 0.32.
Chapter 6 – Autogenous shrinkage in cementitious paste systems- Results and Discussion
168
• It is observed that the rate of gain of autogenous shrinkage strains for cement-
silica fume is slower when compared to plain cement paste mixture at water-
cement ratio of 0.32 while at later ages the strains of cement – silica fume
surpass the plain cement paste mixture.
This data is contrary to the work by (Jensen and Hansen 1996) where they demonstrated
that for white portland cement paste (Danish cement), at a constant water-cement ratio
of 0.35 and additions of 10% of silica fume the strains recorded were higher irrespective
of time for both when readings were made by fixing the deformation ‘zero’ at the time
of set until a duration of 14 days. But in our study we did not compare to the same
water-cement ratio and it was a constant water-cementitious ratio. It is quite obvious
when we compare mixtures with the same water-cementitious ratio that we are ending
up with a higher water-cement ratio in the cement-silica fume mixture. So effectively in
the paper by (Jensen and Hansen 1996) the comparison was made between plain cement
mixture of water-cement ratio of 0.35 and plain cement with 10% addition of silica
fume with water-cement ratio of 0.35 which effectively is a lower water-cementitious
ratio than 0.35 which makes comparison quite decisive ie., it becomes difficult for the
reader to interpret the reason for higher autogenous shrinkage was primarily due to the
presence of silica fume or the lower water-cementitious ratio hence decisive. Hence
such a study may not be an evidence to conclude whether the water-demand of silica
fume had an effect or it was due to the effect of self-desiccation (controlled by total
porosity and chemical shrinkage) alone. Similarly was the case with studies by (Tazawa
and Miyazawa 1992; Tazawa and Miyazawa 1995) where they made a comparison with
plain cement and cement silica fume mixtures of the same water-cement ratio of 0.23.
Tazawa had conducted the studies on prismatic samples of 4 x 4 x 16 cm and yet found
that at 10 replacements silica fume showed higher autogenous strains only at ages of 21
days and greater.
In attempts to understand and clarify the uncertainty in the reason for the observed
autogenous shrinkage strain it is required to better understand the micro structural
changes happening within the cementitious paste system and interpret the observed
autogenous shrinkage strains. Hence a numerical simulation of the hydration of cement
Chapter 6 – Autogenous shrinkage in cementitious paste systems- Results and Discussion
169
– silica fume mixture was carried out at water-cementitious ratio of 0.32. This was
compared with the numerical simulation of plain cement paste mixture of water-cement
ratio 0.32 and the experimental data available, in order to postulate reasons for the
observed autogenous shrinkage strains.
Note: The graphs in subsequent subsections unless stated would refer to data from the simulation
6.3.1 Chemical shrinkage and Degree of hydration
While it was understood from earlier section of plain cement mixtures that chemical
shrinkage did influence indirectly the autogenous shrinkage, the simulation of ordinary
Portland cement with 10% silica fume replacement and w/cm ratio of 0.32 was carried
out in order to understand chemical shrinkage and its relative effect. CEMHYD3D was
used to model the cement-silica fume paste hydration. The numerical model was
calibrated with chemical shrinkage (experimental data) of w/cm 0.7 prior to simulating
at water-cementitious ratio of 0.32 under sealed curing conditions. The curing
temperature was set to 23ºC.
The primary result of the simulation is the chemical shrinkage data expressed in ml/gm
of cementitious material in the paste volume. It could be observed from Figure 6-28 that
the chemical shrinkage is higher for cementitious paste mixtures with silica fume when
compared to the plain cement paste mixtures of similar water-cementitious ratio. This is
quite consistent with literature (Tazawa and Miyazawa 1995; Persson 1997).
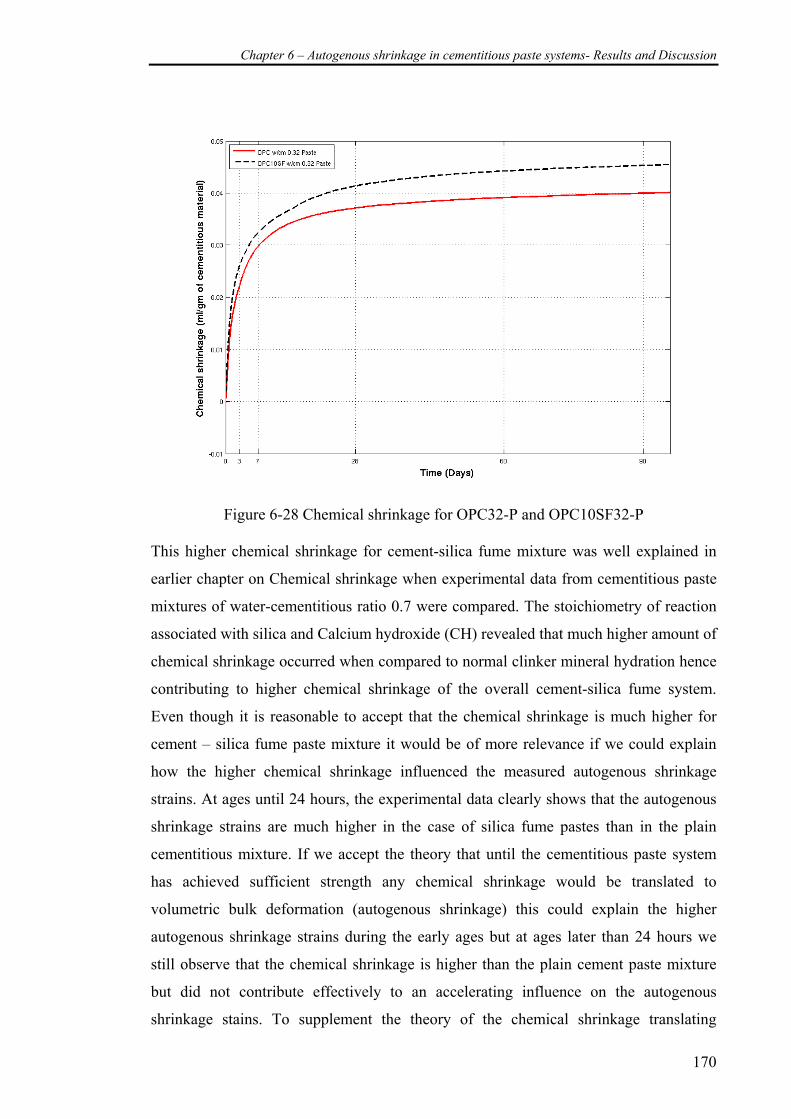
Chapter 6 – Autogenous shrinkage in cementitious paste systems- Results and Discussion
170
Figure 6-28 Chemical shrinkage for OPC32-P and OPC10SF32-P
This higher chemical shrinkage for cement-silica fume mixture was well explained in
earlier chapter on Chemical shrinkage when experimental data from cementitious paste
mixtures of water-cementitious ratio 0.7 were compared. The stoichiometry of reaction
associated with silica and Calcium hydroxide (CH) revealed that much higher amount of
chemical shrinkage occurred when compared to normal clinker mineral hydration hence
contributing to higher chemical shrinkage of the overall cement-silica fume system.
Even though it is reasonable to accept that the chemical shrinkage is much higher for
cement – silica fume paste mixture it would be of more relevance if we could explain
how the higher chemical shrinkage influenced the measured autogenous shrinkage
strains. At ages until 24 hours, the experimental data clearly shows that the autogenous
shrinkage strains are much higher in the case of silica fume pastes than in the plain
cementitious mixture. If we accept the theory that until the cementitious paste system
has achieved sufficient strength any chemical shrinkage would be translated to
volumetric bulk deformation (autogenous shrinkage) this could explain the higher
autogenous shrinkage strains during the early ages but at ages later than 24 hours we
still observe that the chemical shrinkage is higher than the plain cement paste mixture
but did not contribute effectively to an accelerating influence on the autogenous
shrinkage stains. To supplement the theory of the chemical shrinkage translating
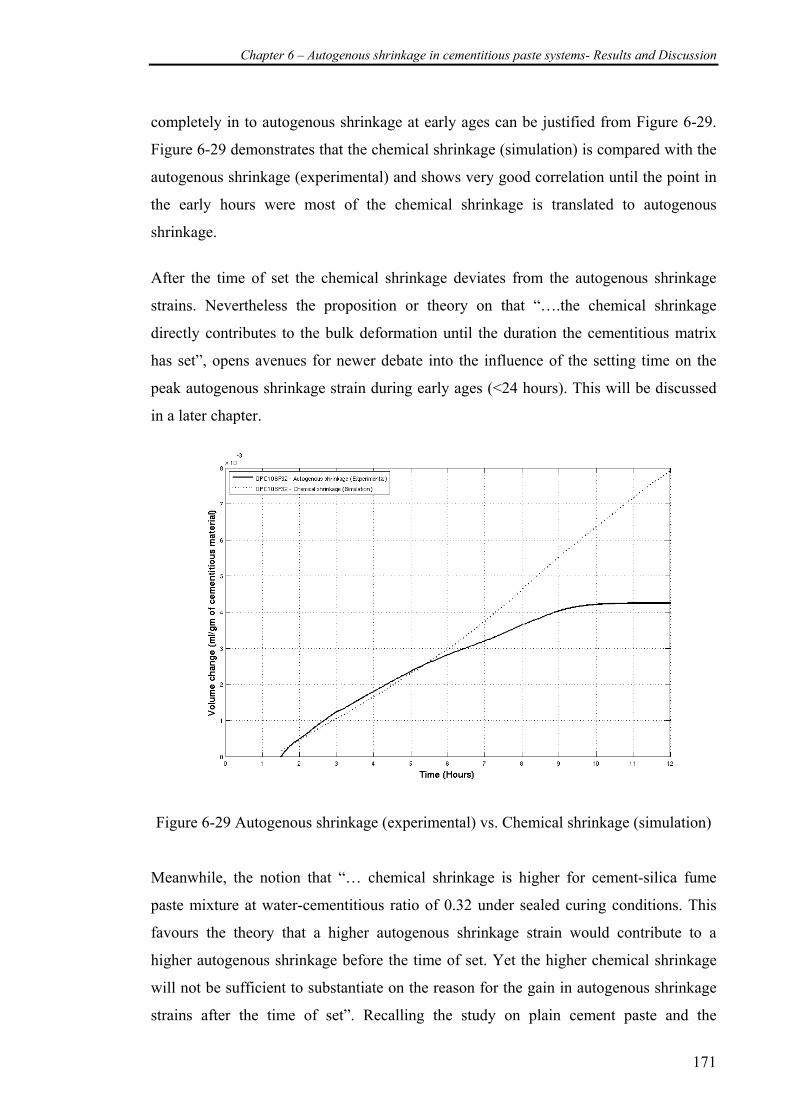
Chapter 6 – Autogenous shrinkage in cementitious paste systems- Results and Discussion
171
completely in to autogenous shrinkage at early ages can be justified from Figure 6-29.
Figure 6-29 demonstrates that the chemical shrinkage (simulation) is compared with the
autogenous shrinkage (experimental) and shows very good correlation until the point in
the early hours were most of the chemical shrinkage is translated to autogenous
shrinkage.
After the time of set the chemical shrinkage deviates from the autogenous shrinkage
strains. Nevertheless the proposition or theory on that “….the chemical shrinkage
directly contributes to the bulk deformation until the duration the cementitious matrix
has set”, opens avenues for newer debate into the influence of the setting time on the
peak autogenous shrinkage strain during early ages (<24 hours). This will be discussed
in a later chapter.
Figure 6-29 Autogenous shrinkage (experimental) vs. Chemical shrinkage (simulation)
Meanwhile, the notion that “… chemical shrinkage is higher for cement-silica fume
paste mixture at water-cementitious ratio of 0.32 under sealed curing conditions. This
favours the theory that a higher autogenous shrinkage strain would contribute to a
higher autogenous shrinkage before the time of set. Yet the higher chemical shrinkage
will not be sufficient to substantiate on the reason for the gain in autogenous shrinkage
strains after the time of set”. Recalling the study on plain cement paste and the
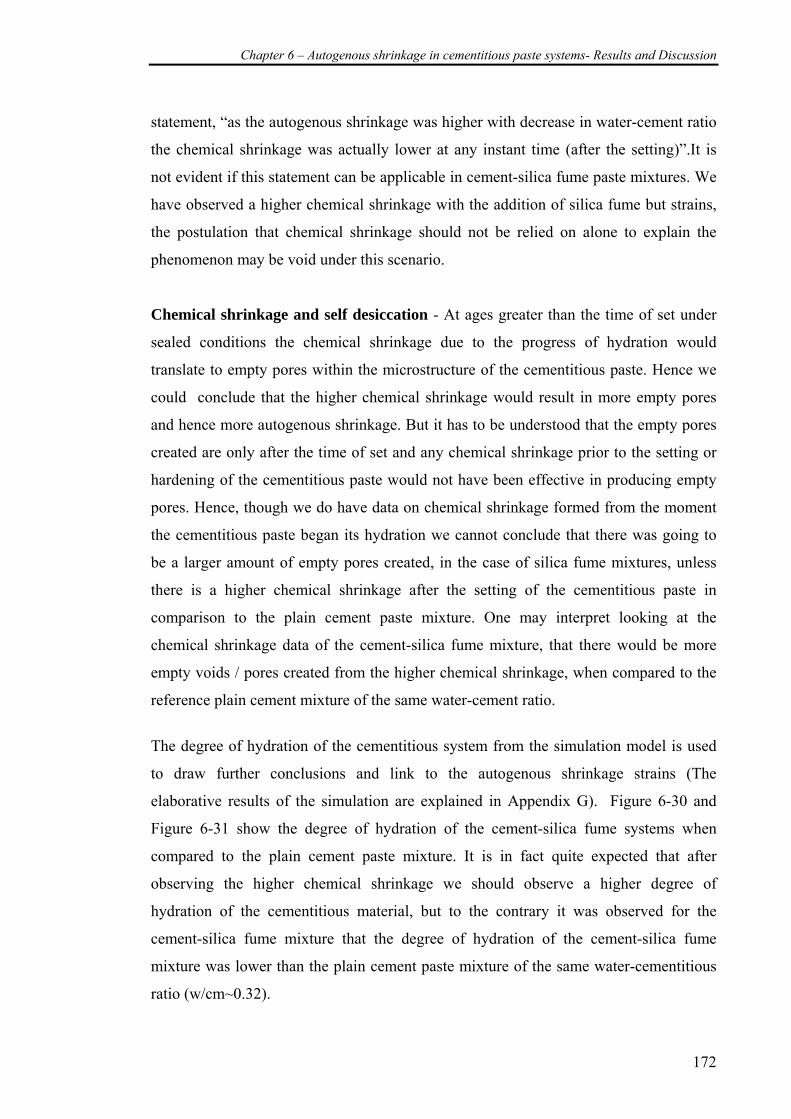
Chapter 6 – Autogenous shrinkage in cementitious paste systems- Results and Discussion
172
statement, “as the autogenous shrinkage was higher with decrease in water-cement ratio
the chemical shrinkage was actually lower at any instant time (after the setting)”.It is
not evident if this statement can be applicable in cement-silica fume paste mixtures. We
have observed a higher chemical shrinkage with the addition of silica fume but strains,
the postulation that chemical shrinkage should not be relied on alone to explain the
phenomenon may be void under this scenario.
Chemical shrinkage and self desiccation - At ages greater than the time of set under
sealed conditions the chemical shrinkage due to the progress of hydration would
translate to empty pores within the microstructure of the cementitious paste. Hence we
could conclude that the higher chemical shrinkage would result in more empty pores
and hence more autogenous shrinkage. But it has to be understood that the empty pores
created are only after the time of set and any chemical shrinkage prior to the setting or
hardening of the cementitious paste would not have been effective in producing empty
pores. Hence, though we do have data on chemical shrinkage formed from the moment
the cementitious paste began its hydration we cannot conclude that there was going to
be a larger amount of empty pores created, in the case of silica fume mixtures, unless
there is a higher chemical shrinkage after the setting of the cementitious paste in
comparison to the plain cement paste mixture. One may interpret looking at the
chemical shrinkage data of the cement-silica fume mixture, that there would be more
empty voids / pores created from the higher chemical shrinkage, when compared to the
reference plain cement mixture of the same water-cement ratio.
The degree of hydration of the cementitious system from the simulation model is used
to draw further conclusions and link to the autogenous shrinkage strains (The
elaborative results of the simulation are explained in Appendix G). Figure 6-30 and
Figure 6-31 show the degree of hydration of the cement-silica fume systems when
compared to the plain cement paste mixture. It is in fact quite expected that after
observing the higher chemical shrinkage we should observe a higher degree of
hydration of the cementitious material, but to the contrary it was observed for the
cement-silica fume mixture that the degree of hydration of the cement-silica fume
mixture was lower than the plain cement paste mixture of the same water-cementitious
ratio (w/cm~0.32).
Chapter 6 – Autogenous shrinkage in cementitious paste systems- Results and Discussion
173
Figure 6-30 Degree of hydration of OPC32-P and OPC10SF32-P
While chemical shrinkage has been postulated as a measure of the degree of hydration
(Geiker 1983) of a certain paste mixture, when comparing two paste mixtures with
different ingredients the above Figure 6-30 negates this theory and proposes that
chemical shrinkage would not be a viable indication of the degree of hydration. Thus
this hypothesis that chemical shrinkage is a good indication of the degree of hydration is
here restated as “… chemical shrinkage can be used as a measure for the hydration
characteristics including the degree of hydration of a certain cementitious system, but it
cannot be used to compare different cementitious mixtures with different mineral
admixtures or ingredients”.
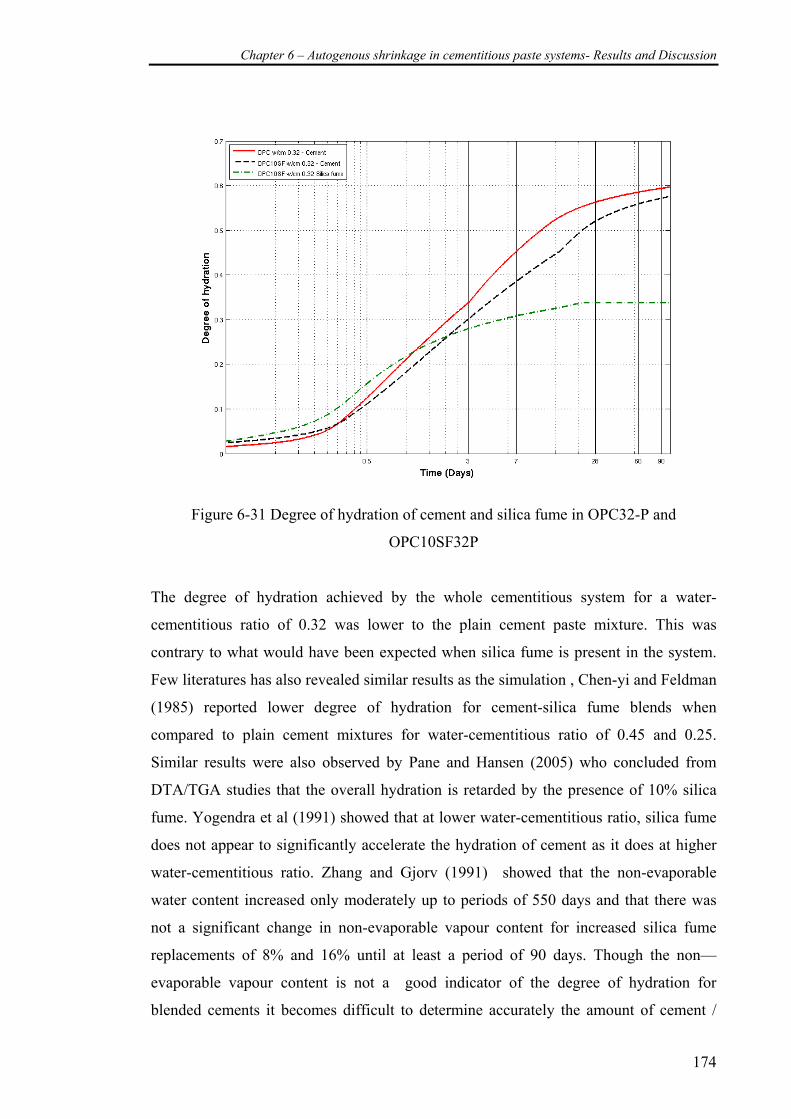
Chapter 6 – Autogenous shrinkage in cementitious paste systems- Results and Discussion
174
Figure 6-31 Degree of hydration of cement and silica fume in OPC32-P and
OPC10SF32P
The degree of hydration achieved by the whole cementitious system for a water-
cementitious ratio of 0.32 was lower to the plain cement paste mixture. This was
contrary to what would have been expected when silica fume is present in the system.
Few literatures has also revealed similar results as the simulation , Chen-yi and Feldman
(1985) reported lower degree of hydration for cement-silica fume blends when
compared to plain cement mixtures for water-cementitious ratio of 0.45 and 0.25.
Similar results were also observed by Pane and Hansen (2005) who concluded from
DTA/TGA studies that the overall hydration is retarded by the presence of 10% silica
fume. Yogendra et al (1991) showed that at lower water-cementitious ratio, silica fume
does not appear to significantly accelerate the hydration of cement as it does at higher
water-cementitious ratio. Zhang and Gjorv (1991) showed that the non-evaporable
water content increased only moderately up to periods of 550 days and that there was
not a significant change in non-evaporable vapour content for increased silica fume
replacements of 8% and 16% until at least a period of 90 days. Though the non—
evaporable vapour content is not a good indicator of the degree of hydration for
blended cements it becomes difficult to determine accurately the amount of cement /

Chapter 6 – Autogenous shrinkage in cementitious paste systems- Results and Discussion
175
silica fume hydrated in the system at a certain point of time and conclude the cause of
in-significant change in non-evaporable water content. Hence the results of numerical
simulation in Figure 6-30 could be justifiable. The increased chemical shrinkage hence
may be attributed only to the high amount of chemical shrinkage from the pozzolanic
reaction as can be seen from the stoichiometry for the pozzolanic reaction shown in
Appendix A which is nearly 3 times that of a normal Portland cement paste. Hence it is
quite plausible that in spite a lower degree of hydration achieved we still have a higher
chemical shrinkage in the cement-silica fume mixture
The phenomenon of autogenous shrinkage is explained in two steps :
1. Duration prior to time of set
2. Duration after the time of set
Duration before the time of set – Autogenous shrinkage is much higher for the
cement-silica fume system when compared to the plain cement paste mixture. The
reason can be summarized as:
• A high chemical shrinkage at early ages before the time of set translates
into bulk volume deformation as the matrix or the cementitious paste is
too weak to resist the volume change.
• Supplementing this information is the high reactivity of silica fume
during early hours (Figure 6-31).
• Whether the setting time had an influence on the higher value is unclear
at this stage. However it is clearly seen that the slope of the autogenous
shrinkage (experimental) is larger than that of the plain cement mixture.
This reveals that the rate of autogenous shrinkage rate gain is higher than
that of the plain cement paste mixture. Thus, if the setting time is longer
in the case of silica fume mixture, it becomes expected that the final
autogenous shrinkage will be larger.
Duration after the time of set – If the zero time is shifted to 24 hours from the time
water is added, the autogenous shrinkage strain’s are lower for the cement-silica fume
system when compared to the plain cement paste system until 28 days. It is followed by
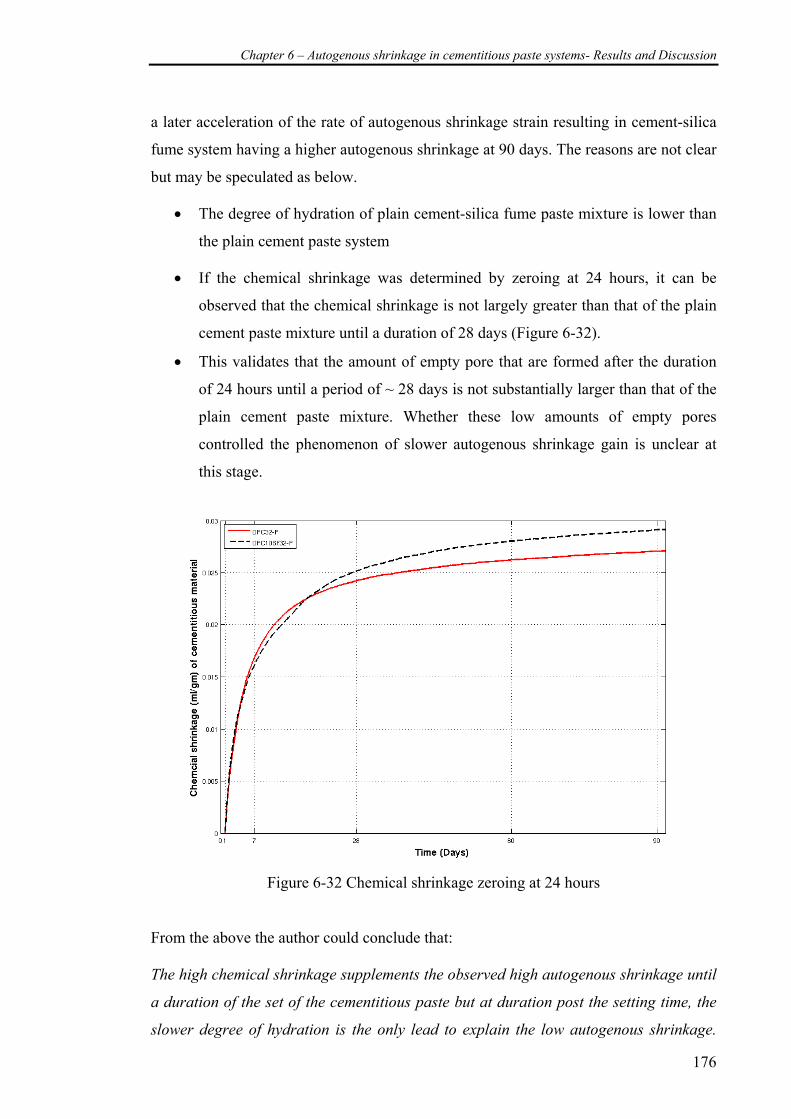
Chapter 6 – Autogenous shrinkage in cementitious paste systems- Results and Discussion
176
a later acceleration of the rate of autogenous shrinkage strain resulting in cement-silica
fume system having a higher autogenous shrinkage at 90 days. The reasons are not clear
but may be speculated as below.
• The degree of hydration of plain cement-silica fume paste mixture is lower than
the plain cement paste system
• If the chemical shrinkage was determined by zeroing at 24 hours, it can be
observed that the chemical shrinkage is not largely greater than that of the plain
cement paste mixture until a duration of 28 days (Figure 6-32).
• This validates that the amount of empty pore that are formed after the duration
of 24 hours until a period of ~ 28 days is not substantially larger than that of the
plain cement paste mixture. Whether these low amounts of empty pores
controlled the phenomenon of slower autogenous shrinkage gain is unclear at
this stage.
Figure 6-32 Chemical shrinkage zeroing at 24 hours
From the above the author could conclude that: The high chemical shrinkage supplements the observed high autogenous shrinkage until
a duration of the set of the cementitious paste but at duration post the setting time, the
slower degree of hydration is the only lead to explain the low autogenous shrinkage.
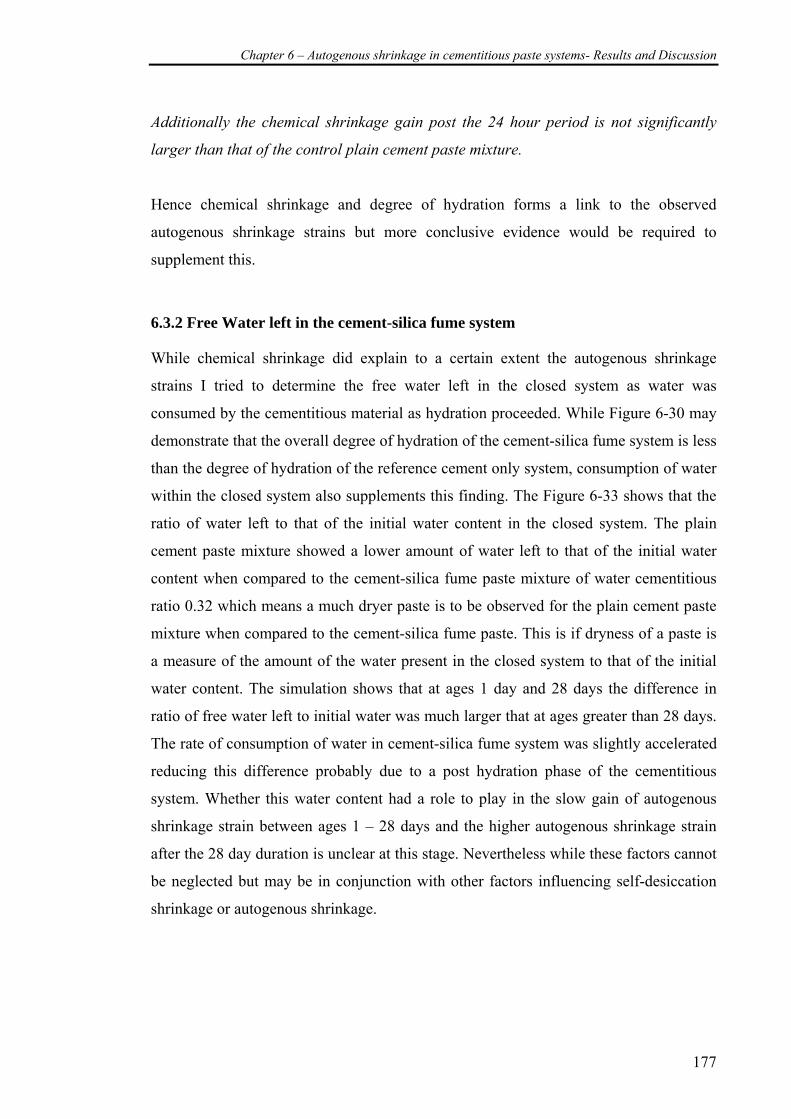
Chapter 6 – Autogenous shrinkage in cementitious paste systems- Results and Discussion
177
Additionally the chemical shrinkage gain post the 24 hour period is not significantly
larger than that of the control plain cement paste mixture.
Hence chemical shrinkage and degree of hydration forms a link to the observed
autogenous shrinkage strains but more conclusive evidence would be required to
supplement this.
6.3.2 Free Water left in the cement-silica fume system
While chemical shrinkage did explain to a certain extent the autogenous shrinkage
strains I tried to determine the free water left in the closed system as water was
consumed by the cementitious material as hydration proceeded. While Figure 6-30 may
demonstrate that the overall degree of hydration of the cement-silica fume system is less
than the degree of hydration of the reference cement only system, consumption of water
within the closed system also supplements this finding. The Figure 6-33 shows that the
ratio of water left to that of the initial water content in the closed system. The plain
cement paste mixture showed a lower amount of water left to that of the initial water
content when compared to the cement-silica fume paste mixture of water cementitious
ratio 0.32 which means a much dryer paste is to be observed for the plain cement paste
mixture when compared to the cement-silica fume paste. This is if dryness of a paste is
a measure of the amount of the water present in the closed system to that of the initial
water content. The simulation shows that at ages 1 day and 28 days the difference in
ratio of free water left to initial water was much larger that at ages greater than 28 days.
The rate of consumption of water in cement-silica fume system was slightly accelerated
reducing this difference probably due to a post hydration phase of the cementitious
system. Whether this water content had a role to play in the slow gain of autogenous
shrinkage strain between ages 1 – 28 days and the higher autogenous shrinkage strain
after the 28 day duration is unclear at this stage. Nevertheless while these factors cannot
be neglected but may be in conjunction with other factors influencing self-desiccation
shrinkage or autogenous shrinkage.
Chapter 6 – Autogenous shrinkage in cementitious paste systems- Results and Discussion
178
Figure 6-33 Fractional volume of water left (plain cement mixtures)
Justifying the reason for the simulated results, It is also observed that during the early
stages of hydration < 24 hours the rate at which the water is consumed is much higher
than that of the plain cement paste mixtures. From simple volume stoichiometry the
amount of water consumed per gram of each phase for the complete reactions to
proceed is shown in Table 6-6. The rate of consumption of water by the pozzolanic
silica reaction is higher than any of the individual phase composition. Yet as the degree
of hydration of silica fume is reduced at ages after 3 days as can be seen in Figure 6-31,
the actual contribution to the consumption of water is not predominantly increased.
Moreover silica fume contributes to only 10% of the total weight of the cementitious
material in the cement – silica fume system, thereby at least at ages after 3 days the rate
of water loss or hydration is predominantly dependent on the cement consumed and not
the silica fume as such. Hence this could explain the higher ratio of water present to that
of the initial water content. Also in the literature Yogendra et. al (1991) concluded in his
study on hydration of cement-silica fume system that the major part of the hydration of
the pozzolana (silica) takes place at ages as early as 3 days and the amount of
pozzolanic reaction occurring after 28 days is insignificant.
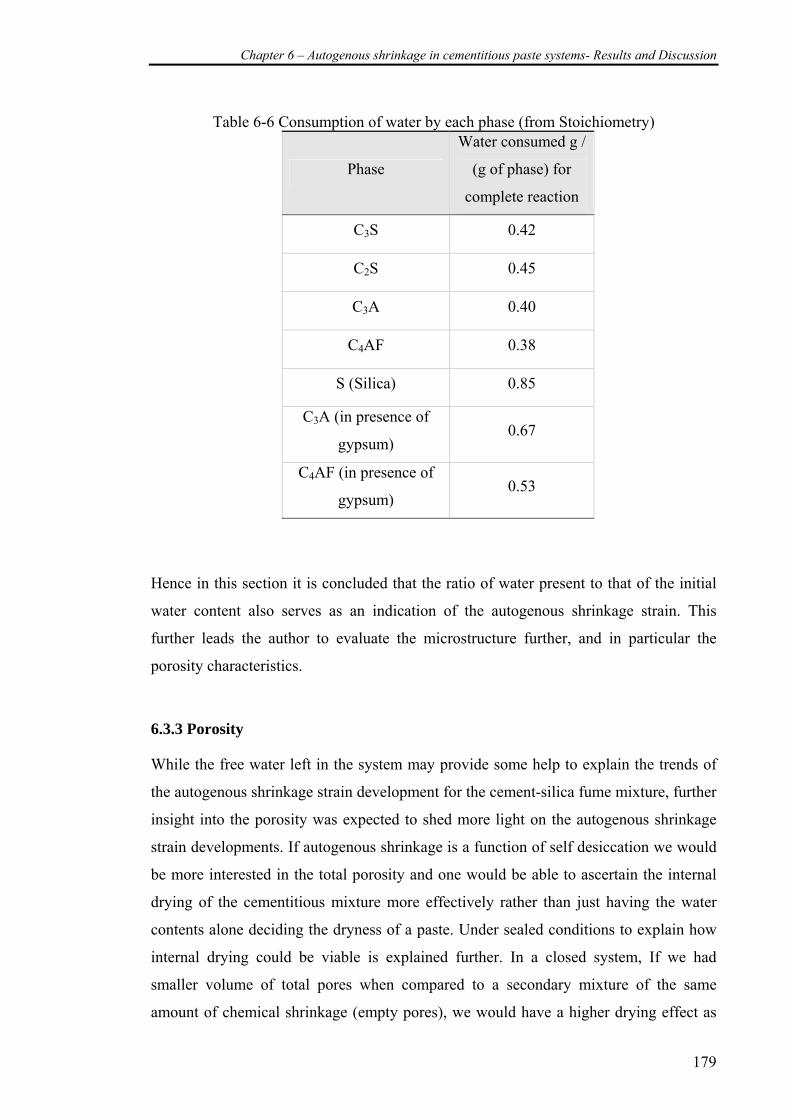
Chapter 6 – Autogenous shrinkage in cementitious paste systems- Results and Discussion
179
Table 6-6 Consumption of water by each phase (from Stoichiometry)
Phase
Water consumed g /
(g of phase) for
complete reaction
C3S 0.42
C2S 0.45
C3A 0.40
C4AF 0.38
S (Silica) 0.85
C3A (in presence of
gypsum) 0.67
C4AF (in presence of
gypsum) 0.53
Hence in this section it is concluded that the ratio of water present to that of the initial
water content also serves as an indication of the autogenous shrinkage strain. This
further leads the author to evaluate the microstructure further, and in particular the
porosity characteristics.
6.3.3 Porosity
While the free water left in the system may provide some help to explain the trends of
the autogenous shrinkage strain development for the cement-silica fume mixture, further
insight into the porosity was expected to shed more light on the autogenous shrinkage
strain developments. If autogenous shrinkage is a function of self desiccation we would
be more interested in the total porosity and one would be able to ascertain the internal
drying of the cementitious mixture more effectively rather than just having the water
contents alone deciding the dryness of a paste. Under sealed conditions to explain how
internal drying could be viable is explained further. In a closed system, If we had
smaller volume of total pores when compared to a secondary mixture of the same
amount of chemical shrinkage (empty pores), we would have a higher drying effect as
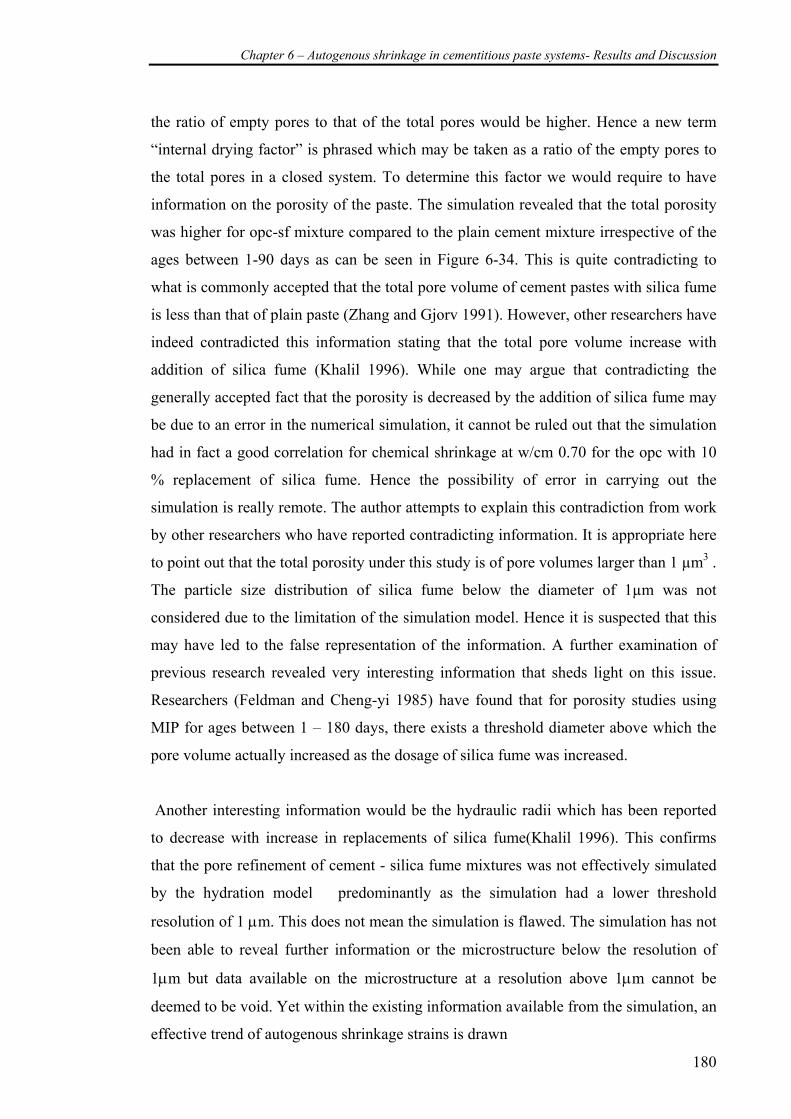
Chapter 6 – Autogenous shrinkage in cementitious paste systems- Results and Discussion
180
the ratio of empty pores to that of the total pores would be higher. Hence a new term
“internal drying factor” is phrased which may be taken as a ratio of the empty pores to
the total pores in a closed system. To determine this factor we would require to have
information on the porosity of the paste. The simulation revealed that the total porosity
was higher for opc-sf mixture compared to the plain cement mixture irrespective of the
ages between 1-90 days as can be seen in Figure 6-34. This is quite contradicting to
what is commonly accepted that the total pore volume of cement pastes with silica fume
is less than that of plain paste (Zhang and Gjorv 1991). However, other researchers have
indeed contradicted this information stating that the total pore volume increase with
addition of silica fume (Khalil 1996). While one may argue that contradicting the
generally accepted fact that the porosity is decreased by the addition of silica fume may
be due to an error in the numerical simulation, it cannot be ruled out that the simulation
had in fact a good correlation for chemical shrinkage at w/cm 0.70 for the opc with 10
% replacement of silica fume. Hence the possibility of error in carrying out the
simulation is really remote. The author attempts to explain this contradiction from work
by other researchers who have reported contradicting information. It is appropriate here
to point out that the total porosity under this study is of pore volumes larger than 1 µm3 .
The particle size distribution of silica fume below the diameter of 1µm was not
considered due to the limitation of the simulation model. Hence it is suspected that this
may have led to the false representation of the information. A further examination of
previous research revealed very interesting information that sheds light on this issue.
Researchers (Feldman and Cheng-yi 1985) have found that for porosity studies using
MIP for ages between 1 – 180 days, there exists a threshold diameter above which the
pore volume actually increased as the dosage of silica fume was increased.
Another interesting information would be the hydraulic radii which has been reported
to decrease with increase in replacements of silica fume(Khalil 1996). This confirms
that the pore refinement of cement - silica fume mixtures was not effectively simulated
by the hydration model predominantly as the simulation had a lower threshold
resolution of 1 μm. This does not mean the simulation is flawed. The simulation has not
been able to reveal further information or the microstructure below the resolution of
1μm but data available on the microstructure at a resolution above 1μm cannot be
deemed to be void. Yet within the existing information available from the simulation, an
effective trend of autogenous shrinkage strains is drawn
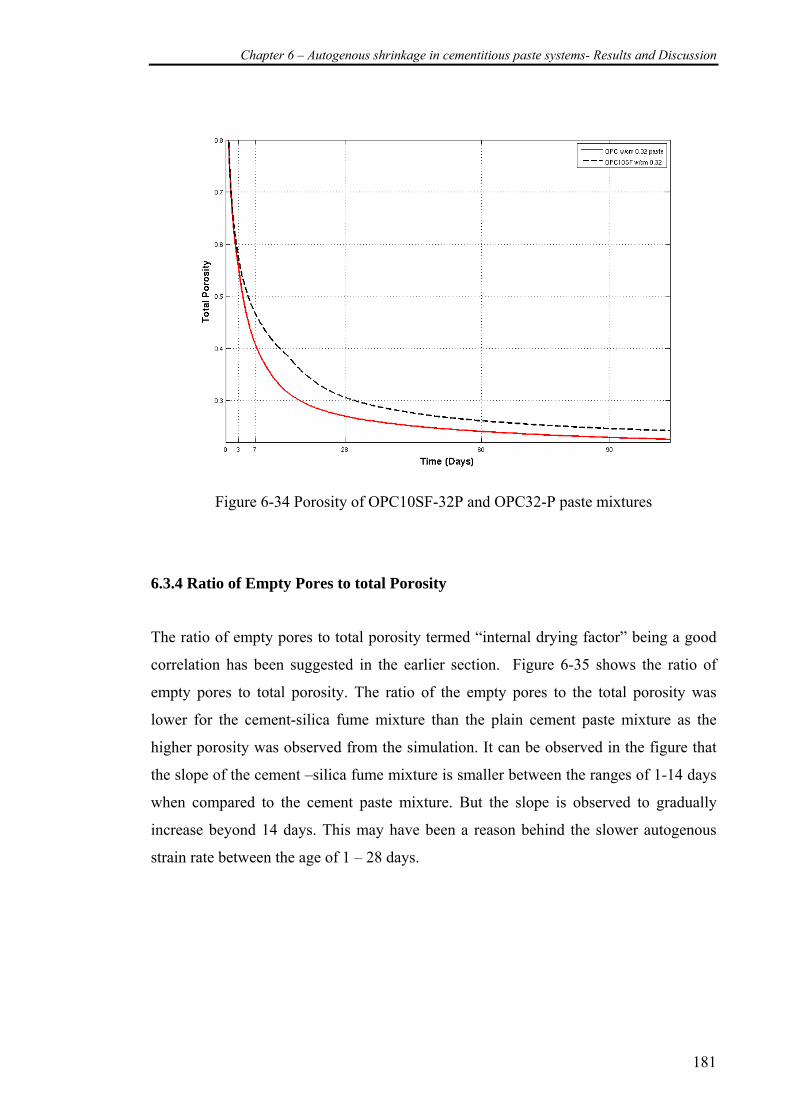
Chapter 6 – Autogenous shrinkage in cementitious paste systems- Results and Discussion
181
Figure 6-34 Porosity of OPC10SF-32P and OPC32-P paste mixtures
6.3.4 Ratio of Empty Pores to total Porosity
The ratio of empty pores to total porosity termed “internal drying factor” being a good
correlation has been suggested in the earlier section. Figure 6-35 shows the ratio of
empty pores to total porosity. The ratio of the empty pores to the total porosity was
lower for the cement-silica fume mixture than the plain cement paste mixture as the
higher porosity was observed from the simulation. It can be observed in the figure that
the slope of the cement –silica fume mixture is smaller between the ranges of 1-14 days
when compared to the cement paste mixture. But the slope is observed to gradually
increase beyond 14 days. This may have been a reason behind the slower autogenous
strain rate between the age of 1 – 28 days.
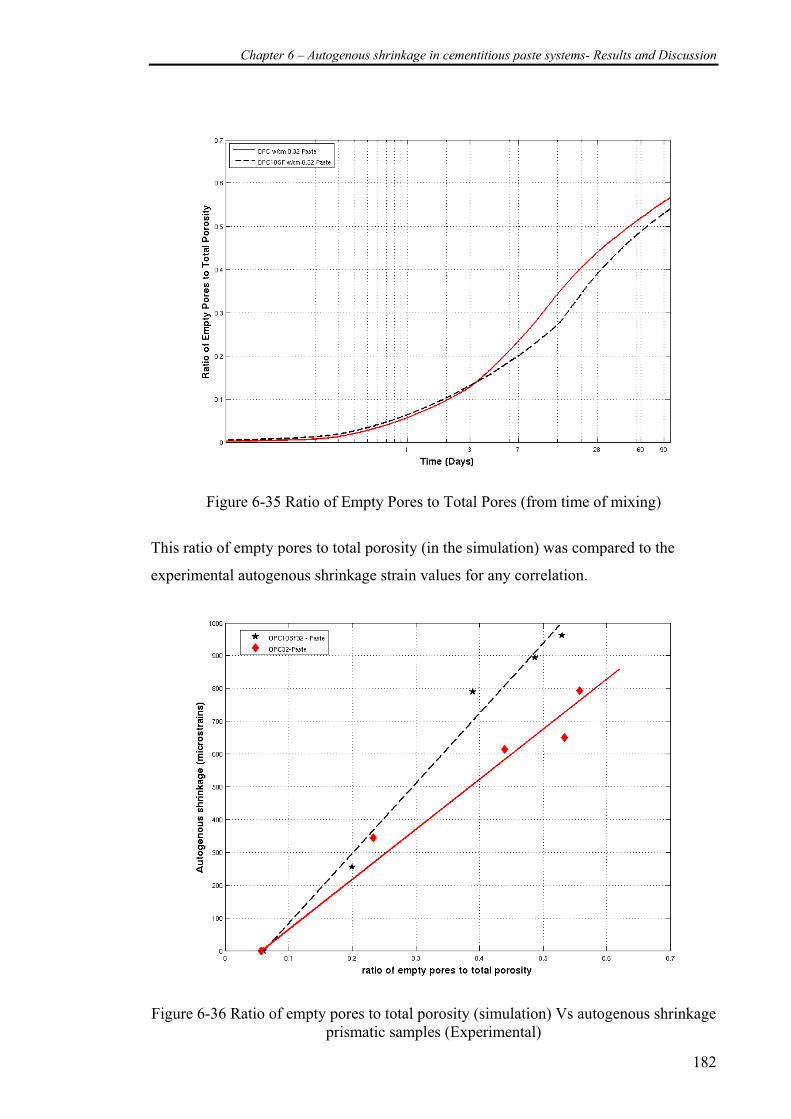
Chapter 6 – Autogenous shrinkage in cementitious paste systems- Results and Discussion
182
Figure 6-35 Ratio of Empty Pores to Total Pores (from time of mixing)
This ratio of empty pores to total porosity (in the simulation) was compared to the
experimental autogenous shrinkage strain values for any correlation.
Figure 6-36 Ratio of empty pores to total porosity (simulation) Vs autogenous shrinkage
prismatic samples (Experimental)
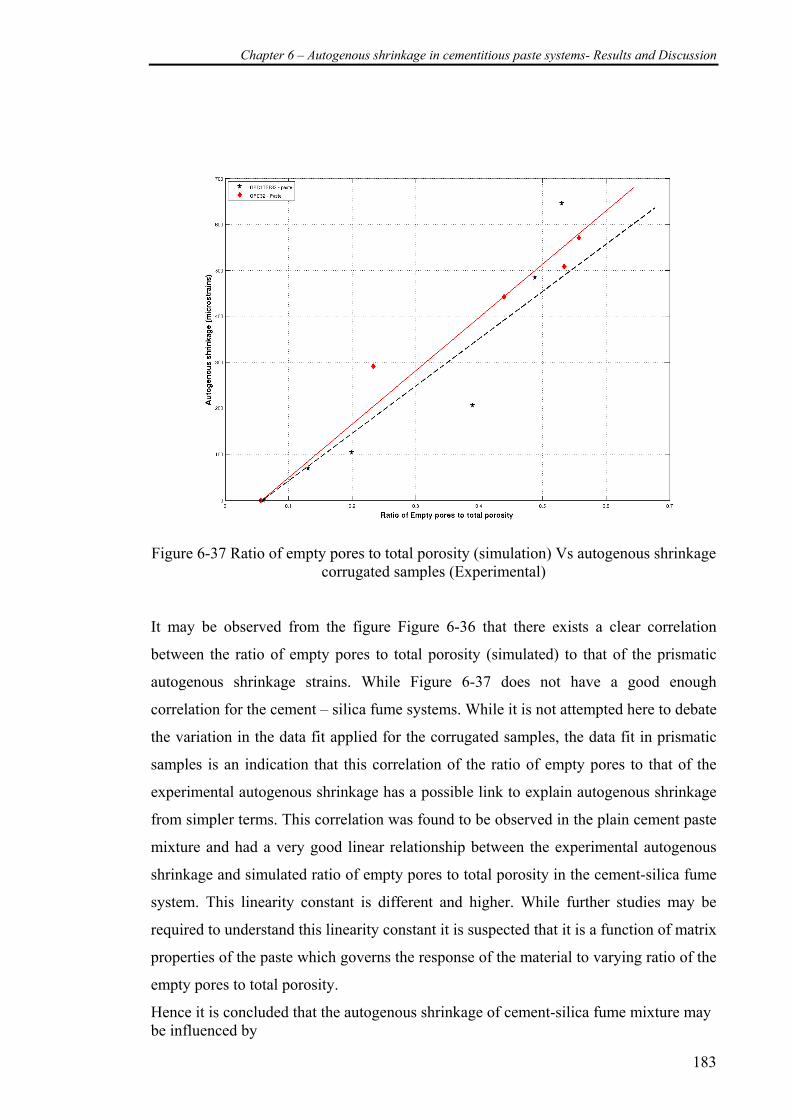
Chapter 6 – Autogenous shrinkage in cementitious paste systems- Results and Discussion
183
Figure 6-37 Ratio of empty pores to total porosity (simulation) Vs autogenous shrinkage
corrugated samples (Experimental) It may be observed from the figure Figure 6-36 that there exists a clear correlation
between the ratio of empty pores to total porosity (simulated) to that of the prismatic
autogenous shrinkage strains. While Figure 6-37 does not have a good enough
correlation for the cement – silica fume systems. While it is not attempted here to debate
the variation in the data fit applied for the corrugated samples, the data fit in prismatic
samples is an indication that this correlation of the ratio of empty pores to that of the
experimental autogenous shrinkage has a possible link to explain autogenous shrinkage
from simpler terms. This correlation was found to be observed in the plain cement paste
mixture and had a very good linear relationship between the experimental autogenous
shrinkage and simulated ratio of empty pores to total porosity in the cement-silica fume
system. This linearity constant is different and higher. While further studies may be
required to understand this linearity constant it is suspected that it is a function of matrix
properties of the paste which governs the response of the material to varying ratio of the
empty pores to total porosity.
Hence it is concluded that the autogenous shrinkage of cement-silica fume mixture may be influenced by

Chapter 6 – Autogenous shrinkage in cementitious paste systems- Results and Discussion
184
1. The pozzolanic reactivity of the silica fume and its relative influence at the early
age explains the high chemical shrinkage and thereby the high autogenous
shrinkage before the setting of the paste.
2. The slower reactivity of the cement-silica fume paste after the 24 hour period
may have been a cause of the slower autogenous shrinkage strain gain after 24
hours.
3. The cement-silica fume system at age of 90 days demonstrated a higher
autogenous shrinkage when compared to the plain cement paste mixture
irrespective of the zeroing at 24 hours and this could have been influenced by
the cement matrix predominantly or the pore refinement which occurs and
which the simulation fails to provide adequate explanation.
4. A correlation does exist between the experimental autogenous shrinkage and
simulated “internal drying factor” which is the ratio of empty pores to the total
pores in the cement-silica fume matrix, but further independent study may be
required before it is accepted universally.
Other factors – Mechanical Strength (from literature) Review of data on the compressive strength and hydration characteristics revealed by
researchers is presented here. Feldman et al (1985) showed that at a water-cementitious
ratio of 0.25, 10 % replacement of silica fume to plain cement paste mixtures did not
increase the compressive strength very significantly. In fact at ages greater than 90 days
10% silica fume showed a lower compressive strength when compared to plain cement
paste mixture of same water cementitious ratio of 0.25.
Toutanji and El-Korchi (1995) observed that regardless of the water-cement ratio
significant increase in the compressive strength was not observed by the addition of
silica fume at replacements of 16% and 25% by weight to plain cement paste mixtures
at water-cementitious ratio of 0.25, 039, 0.31 and 0.34. At lower water-cementitious
ratio of 0.22 a decrease in compressive strength was observed due to the addition of
silica fume. The compressive strength was by cubes of 51 x 51 x 51 mm (2 in x 2 in x
2in) recorded after moist curing for 56 days. The reason for the decrease in compressive
Chapter 6 – Autogenous shrinkage in cementitious paste systems- Results and Discussion
185
strength in the case of silica fume more than 10% is due to the fact that silica fume
reacts quickly and prevents the access of the slower still unhydrated C3S and C2S to get
hydrated. When silica fume is less than 10%, it is not enough to hinder hydration but it
is enough to fill in the pores. Hence less than 10% increases strength while more than
that starts to do the opposite but it may be suspected the inhibited pozzolanic reactions
due to self-desiccation be the case as well a cause for reduction in compressive strength
at higher replacements.
Chapter 6 – Autogenous shrinkage in cementitious paste systems- Results and Discussion
186
6.4 Cement – fly ash systems
The previous section brought in the relative effect of the presence of silica fume in plain
cementitious paste mixtures. This section would outline the study on fly ash added as
replacements to plain cementitious paste mixtures.
The study consisted of fly ash being added at three different replacements namely; 30%,
50% and 70% of the mass of the total binder content in the cementitious paste mixture.
The water-cementitious ratio was maintained at 0.32 for all the three mixtures. The
experimental data was then compared to plain cement paste mixture of water-cement
ratio 0.32. Normal Portland cement and Class C fly ash whose chemical analysis and
particle size distribution are listed in Chapter 3, was used in this study.
6.4.1 Experimental Observation (< 24 hours)
The autogenous shrinkage strains measured during the first 24 hours is shown Figure
6-38, Figure 6-39 and Figure 6-40 for the cement-fly ash paste systems. A comparison
is made to the 24 hour period autogenous shrinkage strains of plain cement paste
mixture and is shown in Figure 6-41. Each data point on the graph is the average of
shrinkage strain values measured from 3 samples (corrugated tubes). In addition the
environmental temperature and the sample temperature were measured using a separate
identical sample and thermocouples. The zero point on the graph is chosen at 1.5 hours
from the time the cementitious material comes in contact with water. This time length
was chosen for consistency in taking the measurements for all the tubes because it takes
approximately 1.5 hours for mixing and placing of the specimens. Thus the first reading
performed on the first tube could not be captured earlier. This initial period was
consistently followed for all the cementitious mixtures so as to allow correct
comparison across. Following this the study was then extended to measure the
autogenous shrinkage strains in the corrugated tubes for a period of 90 days.
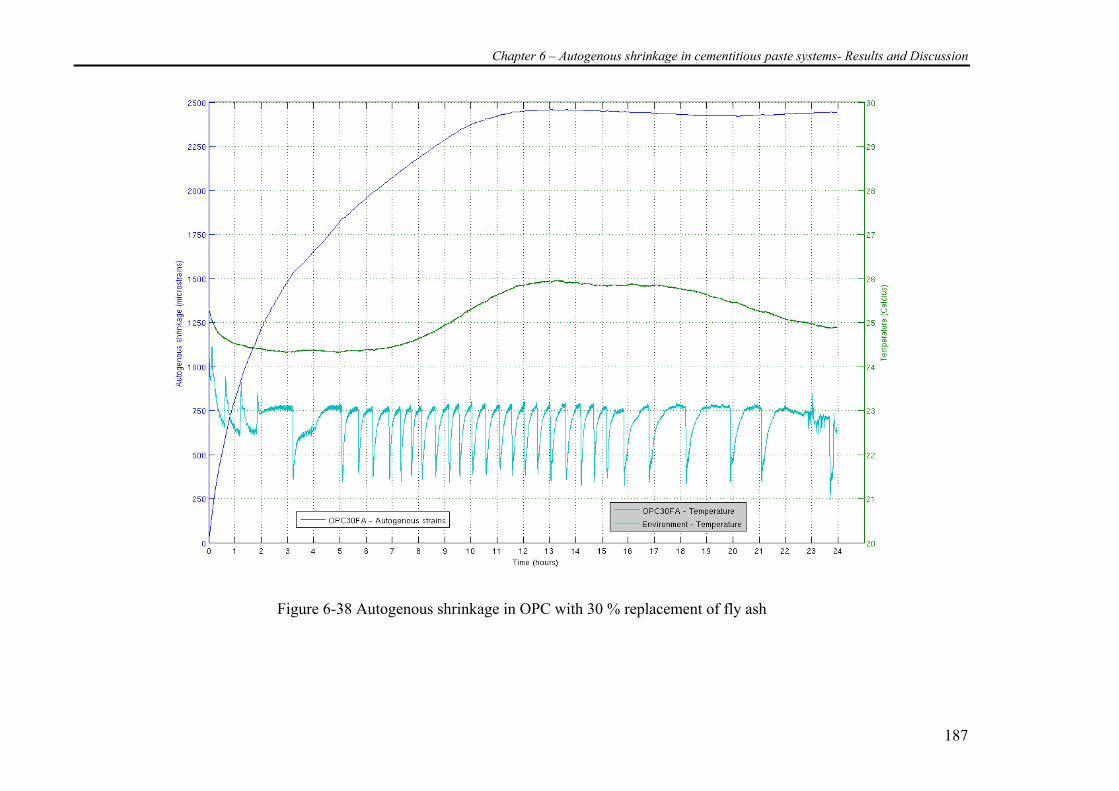
Chapter 6 – Autogenous shrinkage in cementitious paste systems- Results and Discussion
187
Figure 6-38 Autogenous shrinkage in OPC with 30 % replacement of fly ash
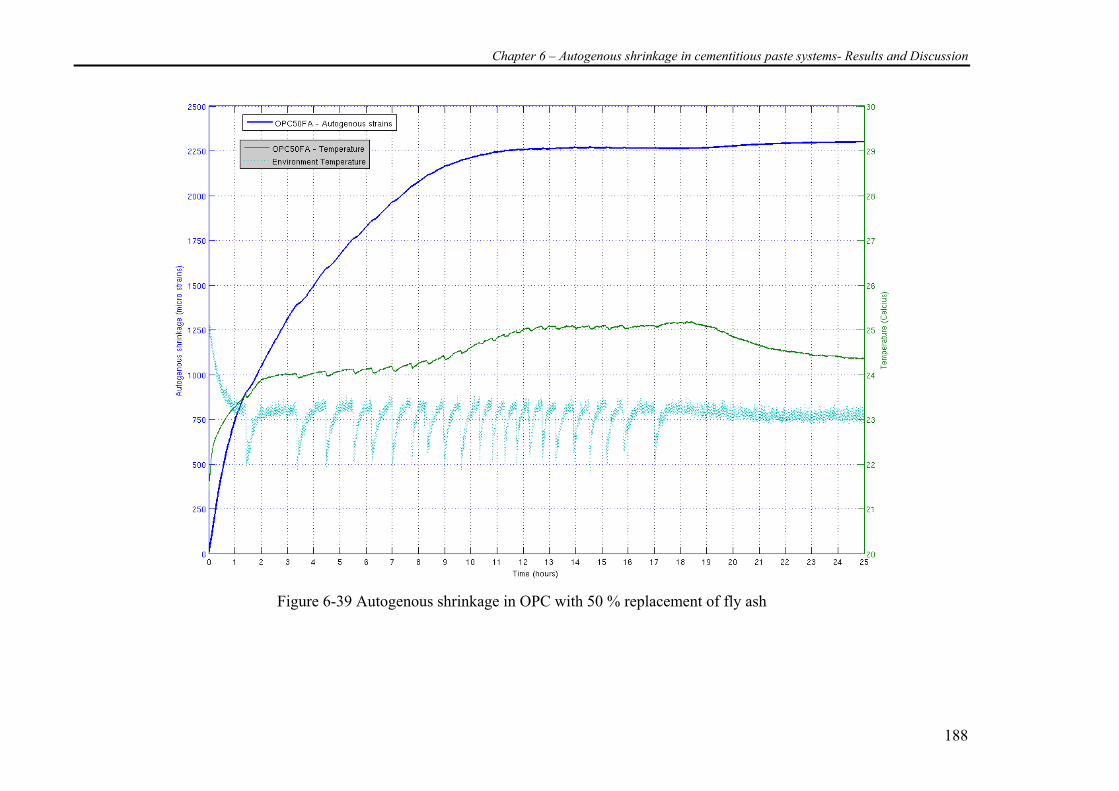
Chapter 6 – Autogenous shrinkage in cementitious paste systems- Results and Discussion
188
Figure 6-39 Autogenous shrinkage in OPC with 50 % replacement of fly ash
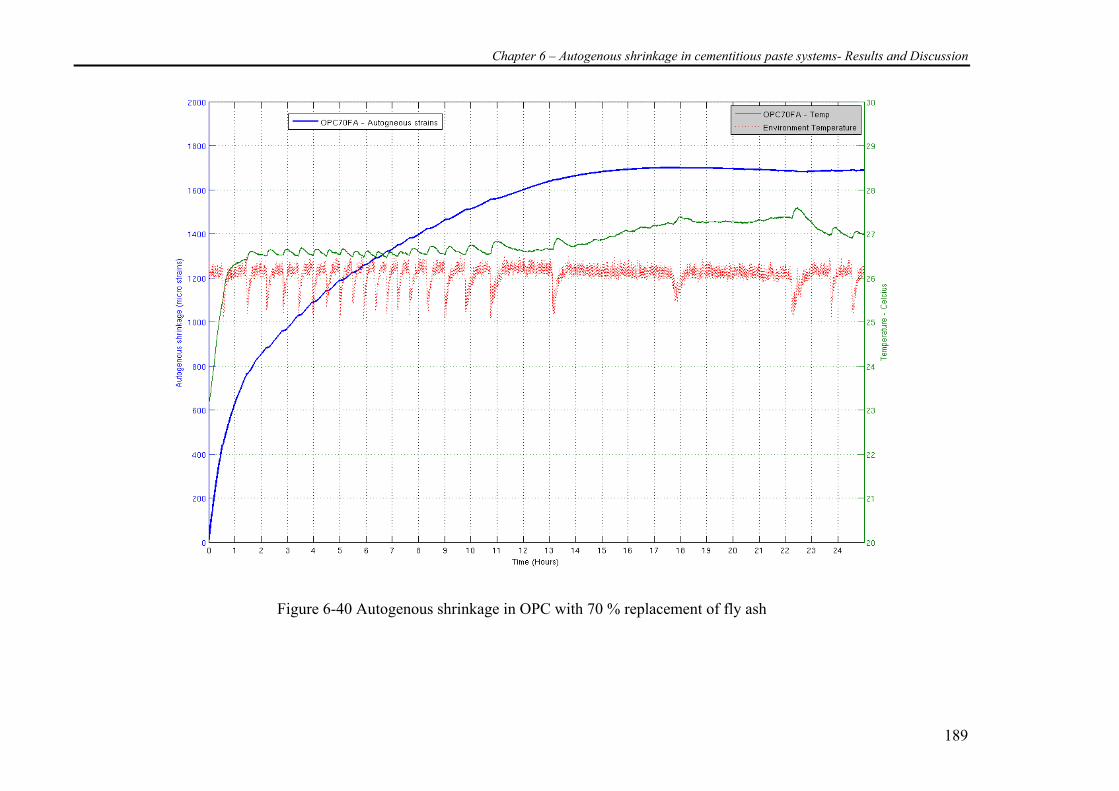
Chapter 6 – Autogenous shrinkage in cementitious paste systems- Results and Discussion
189
Figure 6-40 Autogenous shrinkage in OPC with 70 % replacement of fly ash
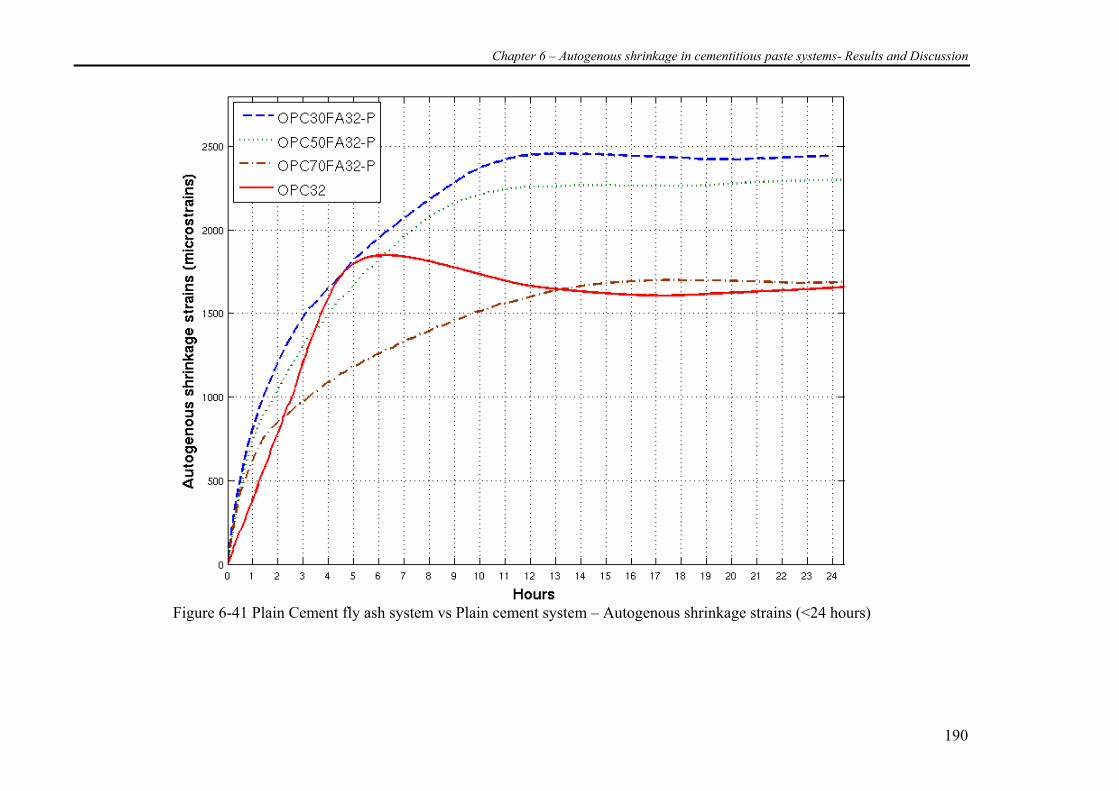
Chapter 6 – Autogenous shrinkage in cementitious paste systems- Results and Discussion
190
Figure 6-41 Plain Cement fly ash system vs Plain cement system – Autogenous shrinkage strains (<24 hours)
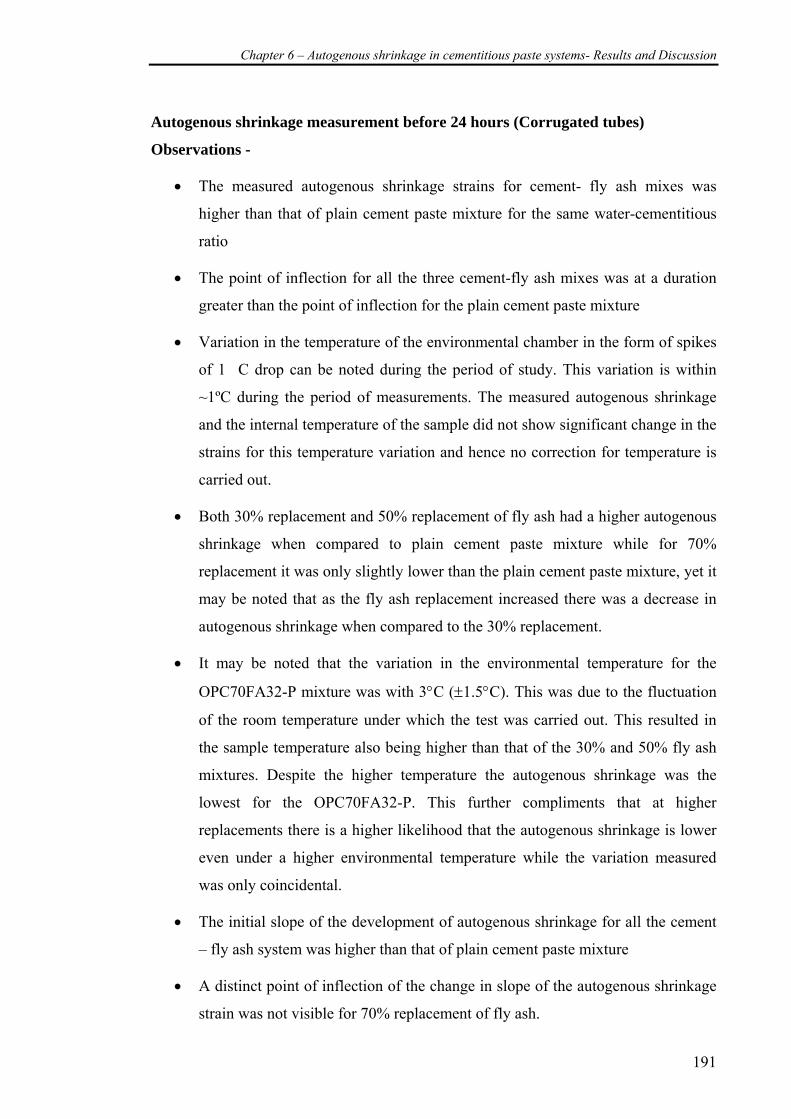
Chapter 6 – Autogenous shrinkage in cementitious paste systems- Results and Discussion
191
Autogenous shrinkage measurement before 24 hours (Corrugated tubes)
Observations -
• The measured autogenous shrinkage strains for cement- fly ash mixes was
higher than that of plain cement paste mixture for the same water-cementitious
ratio
• The point of inflection for all the three cement-fly ash mixes was at a duration
greater than the point of inflection for the plain cement paste mixture
• Variation in the temperature of the environmental chamber in the form of spikes
of 1�C drop can be noted during the period of study. This variation is within
~1ºC during the period of measurements. The measured autogenous shrinkage
and the internal temperature of the sample did not show significant change in the
strains for this temperature variation and hence no correction for temperature is
carried out.
• Both 30% replacement and 50% replacement of fly ash had a higher autogenous
shrinkage when compared to plain cement paste mixture while for 70%
replacement it was only slightly lower than the plain cement paste mixture, yet it
may be noted that as the fly ash replacement increased there was a decrease in
autogenous shrinkage when compared to the 30% replacement.
• It may be noted that the variation in the environmental temperature for the
OPC70FA32-P mixture was with 3°C (±1.5°C). This was due to the fluctuation
of the room temperature under which the test was carried out. This resulted in
the sample temperature also being higher than that of the 30% and 50% fly ash
mixtures. Despite the higher temperature the autogenous shrinkage was the
lowest for the OPC70FA32-P. This further compliments that at higher
replacements there is a higher likelihood that the autogenous shrinkage is lower
even under a higher environmental temperature while the variation measured
was only coincidental.
• The initial slope of the development of autogenous shrinkage for all the cement
– fly ash system was higher than that of plain cement paste mixture
• A distinct point of inflection of the change in slope of the autogenous shrinkage
strain was not visible for 70% replacement of fly ash.

Chapter 6 – Autogenous shrinkage in cementitious paste systems- Results and Discussion
192
Based on the observations the following comments / questions are raised.
• If fly ash, as reported by researchers to be dormant or less pozzolanic when
compared to silica fume, how then can we explain the fact that the autogenous
shrinkage strains are much higher, during the early hours of hydration than the
relevant values for plain cement ?
• The chemical shrinkage of cement-fly ash systems at a water-cementitious ratio
0.7 was found not to be higher than that of the plain cement paste mixture of the
same water-cement ratio, yet the autogenous shrinkage is higher than that of
plain cement paste mixture at water-cementitious ratio of 0.32.
• Did the setting time or the retardation effect of fly ash system have a role to play
in the development peak value or the autogenous shrinkage strains during the
early hours?
Before discussing these comments that deal with the observations made on the data of
the first 24 hours, let us examine the experimental data of the development of
autogenous shrinkage strain values after the initial 24 hour period.
6.4.2 Experimental Observation (after 24 hours)
The corrugated samples after 24 hours were weighed and the length of the samples was
monitored. The length change was then measured at regular intervals of 3, 7, 28, 60 and
90 days, similar to studies in plain cement paste mixtures. A comparison with plain
cement paste mixtures is made and shown in Figure 6-42. The zero point was chosen at
24 hours for allowing sufficient hardening for all the paste mixtures and uniformity
across all cementitious paste mixtures.
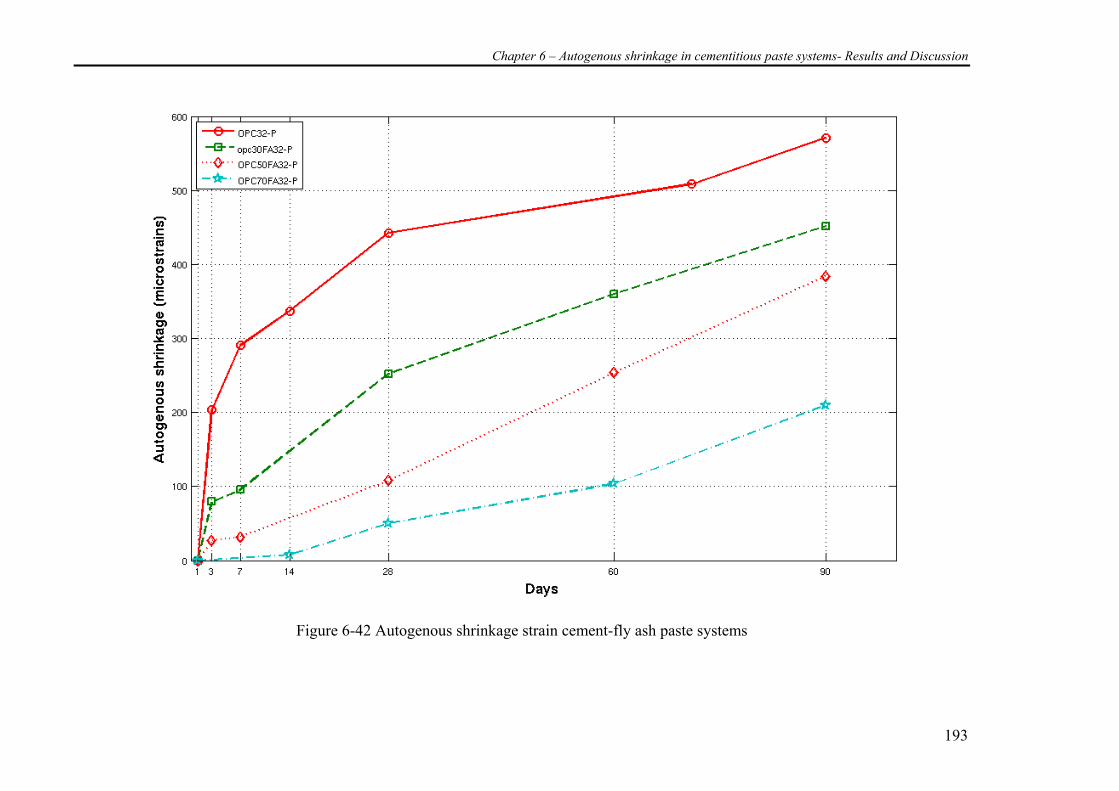
Chapter 6 – Autogenous shrinkage in cementitious paste systems- Results and Discussion
193
Figure 6-42 Autogenous shrinkage strain cement-fly ash paste systems

Chapter 6 – Autogenous shrinkage in cementitious paste systems- Results and Discussion
194
Autogenous shrinkage measurement after 24 hours (Corrugated tubes)
Observations -
• At all replacements and all durations at ages beyond 24 hours and when the
time-zero was fixed at 1 day, the measured autogenous strains are much lesser
than the plain cement paste mixture
• There was a decreasing trend in the observed autogenous shrinkage as the fly
ash replacement was increased.
• It could be observed that at ages beyond 28 days there was an accelerated gain in
autogenous shrinkage strain for cement-fly ash systems.
• At 70% replacement of fly ash very low or insignificant autogenous strains were
recorded until duration of 14 days.
• The rate of autogenous shrinkage gain beyond 28 days was the highest for 50%
replacement of fly ash followed by 30% fly ash replacement mixture and then
the 70% replacement fly ash mixture. Plain cement paste mixture recorded the
least increase in autogenous shrinkage strain beyond the 28 day duration.
Based on the observations the following comments are made.
• The pozzolanic activity is generally dominant after the 28 day period. Whether
this influenced the accelerated autogenous shrinkage strain beyond the 28 day
period is to be discussed further.
• The reduction in autogenous shrinkage for higher replacements of fly ash was
evident. Can this be related to the dormant pozzolanic activity and the degree of
active cement and fly ash hydration achieved?
• How did factors like the increase in compressive and tensile strength, the E-
modulus, hydration characteristics and porosity influence the development of the
autogenous shrinkage strains?
Work by Tangtermsirikul (1999) observed in studies on prismatic samples that were
sealed with vinyl tapes that for replacements with 30% and 50% Class F fly ash at
water-cementitious ratio of 0.3 , the autogenous shrinkage reduced with increase in fly
Chapter 6 – Autogenous shrinkage in cementitious paste systems- Results and Discussion
195
ash replacements. Similar to this study, the zero point was chosen at 24 hours from the
point of mixing. Similarly Chan et al. (Chan, Liu et al. 1999) has concluded in his
studies that the incorporation of fly ash decreases the autogenous shrinkage in concrete
though there was an increase in drying shrinkage. Lee et al (2003) states that though
autogenous shrinkage is reduced by the presence of fly ash it does not guarantee the
reduction in early age cracking. Some of the other researchers who have studied the
effect of fly ash in either concrete or cementitious paste systems and concluded it did
result in reduction of autogenous shrinkage include Gagne et al. (1999), Subramanian et
al (2002), Akkaya et al (2004), and Termkhajornkit et al (2004).
Though there is experimental evidence in literature supplementing some of our findings
the exact micro structural changes causing the reduction in autogenous shrinkage after
the 24 hour duration and the higher autogenous shrinkage at early ages (<24 hours) is to
be understood and hence CEMHYD3D is used in the succeeding sections were possible
to explain the reason for the reduction in autogenous shrinkage strain.
Note : CEMHYD3D was used only to model the cement-fly ash system at 30%
replacement. At higher replacements the model could not be well calibrated with the
experimental data. Hence it is not used in discussing the experimental results for higher
replacements of fly ash systems. Data from the literature is therefore used instead. The
exact cause of the failure of the model simulation to replicate experimental chemical
shrinkage data at higher replacement level of fly ash isso far not known. It is however
suspected that a limitation of the model is that it is not effective at higher replacements
of fly ash where the reaction mechanisms change quite significantly. Therefore, in the
case of replacement higher than 30%, information from literature has been collectively
used to analyse the observed experimental data.
6.4.3 Chemical shrinkage
To address the autogenous shrinkage from the perspective of chemical shrinkage
development, the following two factors are discussed independently.
1. The high autogenous shrinkage strains at ages before 24 hours for the cement-fly
ash system.
Chapter 6 – Autogenous shrinkage in cementitious paste systems- Results and Discussion
196
2. The decrease in autogenous shrinkage strain with increasing fly ash content at
ages greater than 24 hours by taking the zero time as 24 hours from the
commencement of addition of water to the cementitious mixture.
The autogenous shrinkage strains measured at ages less than 24 hours showed higher
strain values when compared to plain cement paste mixture. While most literature have
reported lower autogenous shrinkage for fly ash, this result may appear to be
contradicting. However, it has to be pointed out that much of the work reported in
literature was in fact for the post 24 hour period. The results of this research appear to
be in agreement with the literature as far as the post 24 hours results are concerned. As
for the behaviour before 24 hours, there exists scarce data in the literature for making
any comparison.
It is quite understandable, when one observed the high autogenous shrinkage strain for
the early 24 hours in cement-silica fume system, where the higher reactivity of silica
fume during the early hours contributes to the higher water-demand and higher chemical
shrinkage. However, having autogenous shrinkage strains higher for 30% and 50% fly
ash replacements than the strains obtained for plain cement is a point to be noted and
discussed. Moreover, although the results for the 70% replacement were lower than the
plain cement case, they were not significantly lower as would have been expected.
Bearing in mind that both systems are of the same w/cm ratio, it is believed that these
results deserve further analysis.
In a trend similar to that of the chemical shrinkage of cement-fly ash system at higher
water-cementitious ratio, the simulation revealed lower chemical shrinkage
OPC30FA32P when compared to the plain cement paste mixture in the lower water-
cement ratio mixture under sealed conditions of curing. This is shown in Figure 6-43.
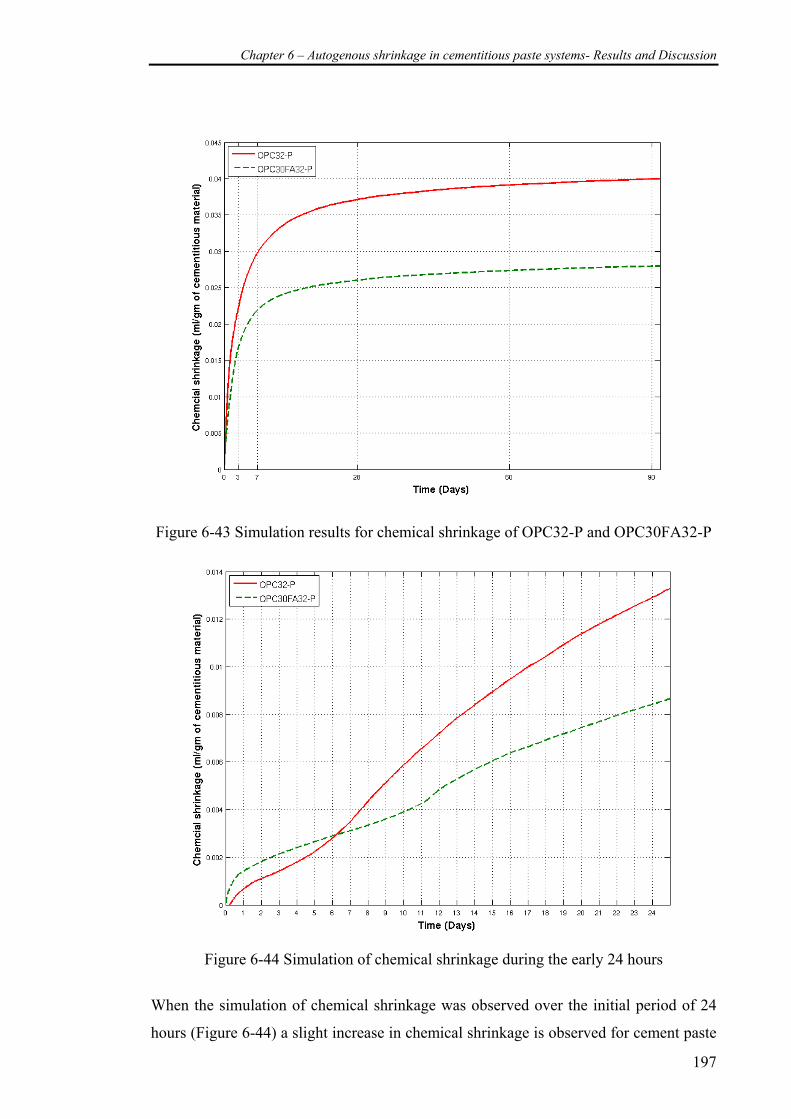
Chapter 6 – Autogenous shrinkage in cementitious paste systems- Results and Discussion
197
Figure 6-43 Simulation results for chemical shrinkage of OPC32-P and OPC30FA32-P
Figure 6-44 Simulation of chemical shrinkage during the early 24 hours
When the simulation of chemical shrinkage was observed over the initial period of 24
hours (Figure 6-44) a slight increase in chemical shrinkage is observed for cement paste
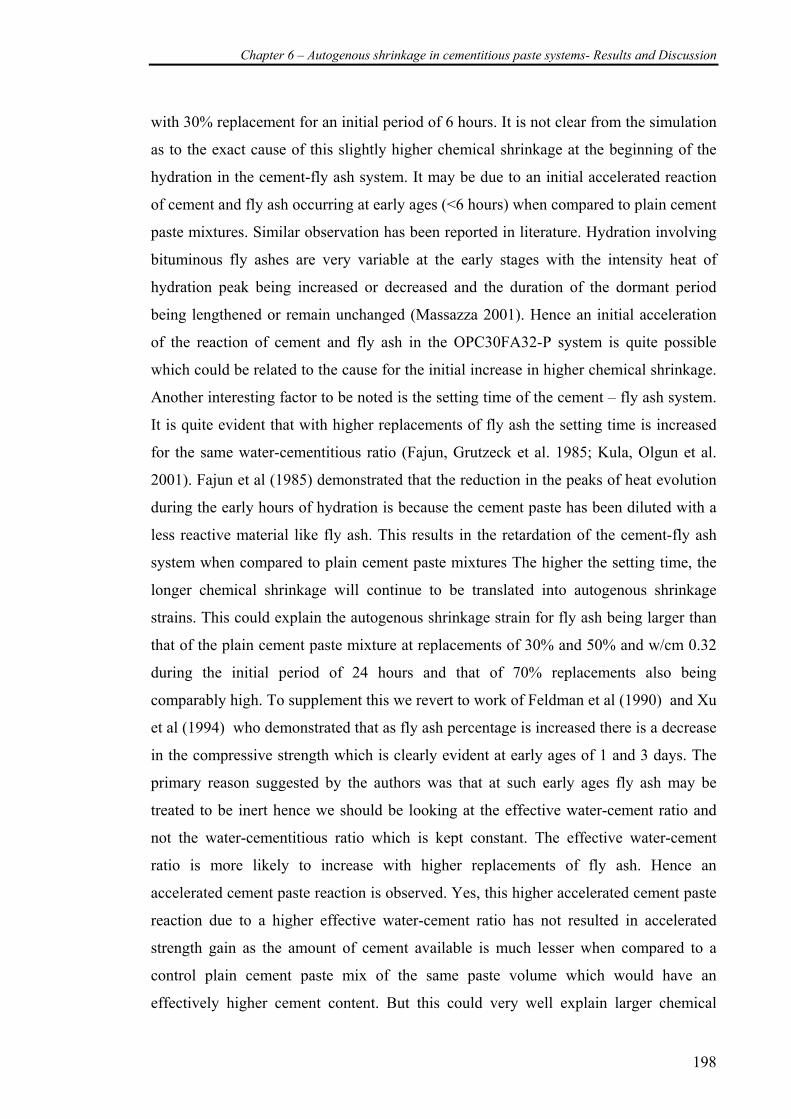
Chapter 6 – Autogenous shrinkage in cementitious paste systems- Results and Discussion
198
with 30% replacement for an initial period of 6 hours. It is not clear from the simulation
as to the exact cause of this slightly higher chemical shrinkage at the beginning of the
hydration in the cement-fly ash system. It may be due to an initial accelerated reaction
of cement and fly ash occurring at early ages (<6 hours) when compared to plain cement
paste mixtures. Similar observation has been reported in literature. Hydration involving
bituminous fly ashes are very variable at the early stages with the intensity heat of
hydration peak being increased or decreased and the duration of the dormant period
being lengthened or remain unchanged (Massazza 2001). Hence an initial acceleration
of the reaction of cement and fly ash in the OPC30FA32-P system is quite possible
which could be related to the cause for the initial increase in higher chemical shrinkage.
Another interesting factor to be noted is the setting time of the cement – fly ash system.
It is quite evident that with higher replacements of fly ash the setting time is increased
for the same water-cementitious ratio (Fajun, Grutzeck et al. 1985; Kula, Olgun et al.
2001). Fajun et al (1985) demonstrated that the reduction in the peaks of heat evolution
during the early hours of hydration is because the cement paste has been diluted with a
less reactive material like fly ash. This results in the retardation of the cement-fly ash
system when compared to plain cement paste mixtures The higher the setting time, the
longer chemical shrinkage will continue to be translated into autogenous shrinkage
strains. This could explain the autogenous shrinkage strain for fly ash being larger than
that of the plain cement paste mixture at replacements of 30% and 50% and w/cm 0.32
during the initial period of 24 hours and that of 70% replacements also being
comparably high. To supplement this we revert to work of Feldman et al (1990) and Xu
et al (1994) who demonstrated that as fly ash percentage is increased there is a decrease
in the compressive strength which is clearly evident at early ages of 1 and 3 days. The
primary reason suggested by the authors was that at such early ages fly ash may be
treated to be inert hence we should be looking at the effective water-cement ratio and
not the water-cementitious ratio which is kept constant. The effective water-cement
ratio is more likely to increase with higher replacements of fly ash. Hence an
accelerated cement paste reaction is observed. Yes, this higher accelerated cement paste
reaction due to a higher effective water-cement ratio has not resulted in accelerated
strength gain as the amount of cement available is much lesser when compared to a
control plain cement paste mix of the same paste volume which would have an
effectively higher cement content. But this could very well explain larger chemical
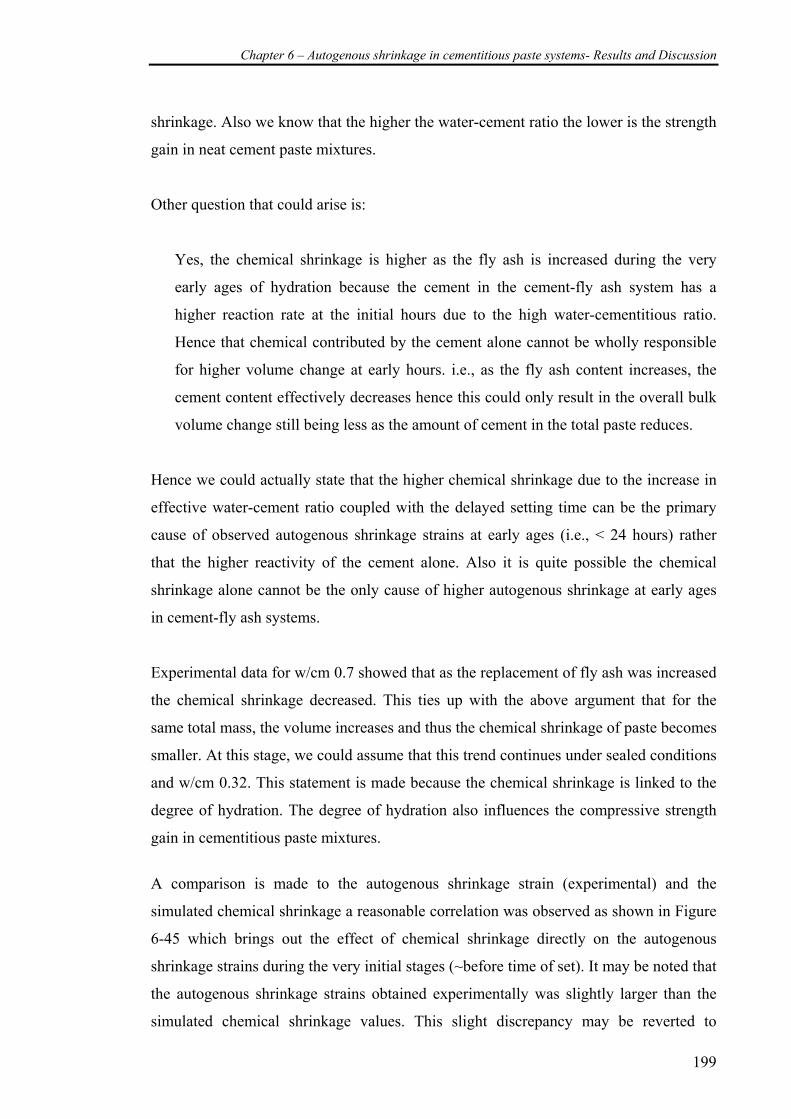
Chapter 6 – Autogenous shrinkage in cementitious paste systems- Results and Discussion
199
shrinkage. Also we know that the higher the water-cement ratio the lower is the strength
gain in neat cement paste mixtures.
Other question that could arise is:
Yes, the chemical shrinkage is higher as the fly ash is increased during the very
early ages of hydration because the cement in the cement-fly ash system has a
higher reaction rate at the initial hours due to the high water-cementitious ratio.
Hence that chemical contributed by the cement alone cannot be wholly responsible
for higher volume change at early hours. i.e., as the fly ash content increases, the
cement content effectively decreases hence this could only result in the overall bulk
volume change still being less as the amount of cement in the total paste reduces.
Hence we could actually state that the higher chemical shrinkage due to the increase in
effective water-cement ratio coupled with the delayed setting time can be the primary
cause of observed autogenous shrinkage strains at early ages (i.e., < 24 hours) rather
that the higher reactivity of the cement alone. Also it is quite possible the chemical
shrinkage alone cannot be the only cause of higher autogenous shrinkage at early ages
in cement-fly ash systems.
Experimental data for w/cm 0.7 showed that as the replacement of fly ash was increased
the chemical shrinkage decreased. This ties up with the above argument that for the
same total mass, the volume increases and thus the chemical shrinkage of paste becomes
smaller. At this stage, we could assume that this trend continues under sealed conditions
and w/cm 0.32. This statement is made because the chemical shrinkage is linked to the
degree of hydration. The degree of hydration also influences the compressive strength
gain in cementitious paste mixtures.
A comparison is made to the autogenous shrinkage strain (experimental) and the
simulated chemical shrinkage a reasonable correlation was observed as shown in Figure
6-45 which brings out the effect of chemical shrinkage directly on the autogenous
shrinkage strains during the very initial stages (~before time of set). It may be noted that
the autogenous shrinkage strains obtained experimentally was slightly larger than the
simulated chemical shrinkage values. This slight discrepancy may be reverted to
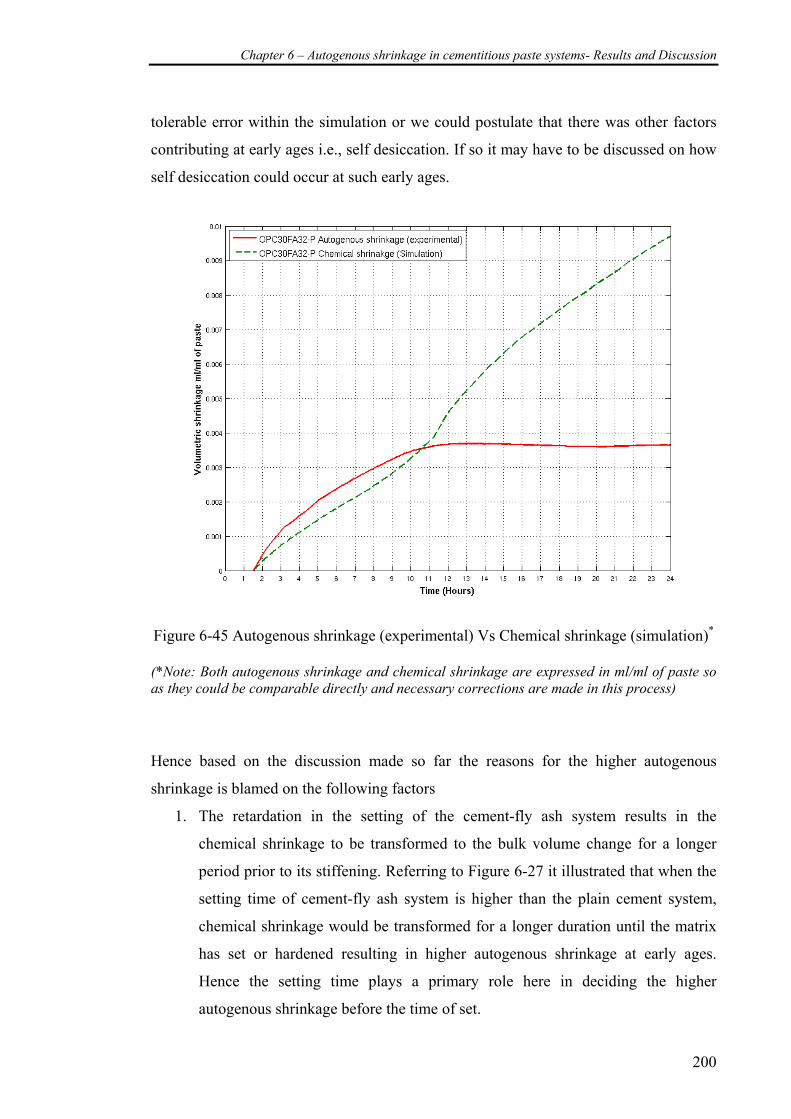
Chapter 6 – Autogenous shrinkage in cementitious paste systems- Results and Discussion
200
tolerable error within the simulation or we could postulate that there was other factors
contributing at early ages i.e., self desiccation. If so it may have to be discussed on how
self desiccation could occur at such early ages.
Figure 6-45 Autogenous shrinkage (experimental) Vs Chemical shrinkage (simulation)*
(*Note: Both autogenous shrinkage and chemical shrinkage are expressed in ml/ml of paste so as they could be comparable directly and necessary corrections are made in this process)
Hence based on the discussion made so far the reasons for the higher autogenous
shrinkage is blamed on the following factors
1. The retardation in the setting of the cement-fly ash system results in the
chemical shrinkage to be transformed to the bulk volume change for a longer
period prior to its stiffening. Referring to Figure 6-27 it illustrated that when the
setting time of cement-fly ash system is higher than the plain cement system,
chemical shrinkage would be transformed for a longer duration until the matrix
has set or hardened resulting in higher autogenous shrinkage at early ages.
Hence the setting time plays a primary role here in deciding the higher
autogenous shrinkage before the time of set.
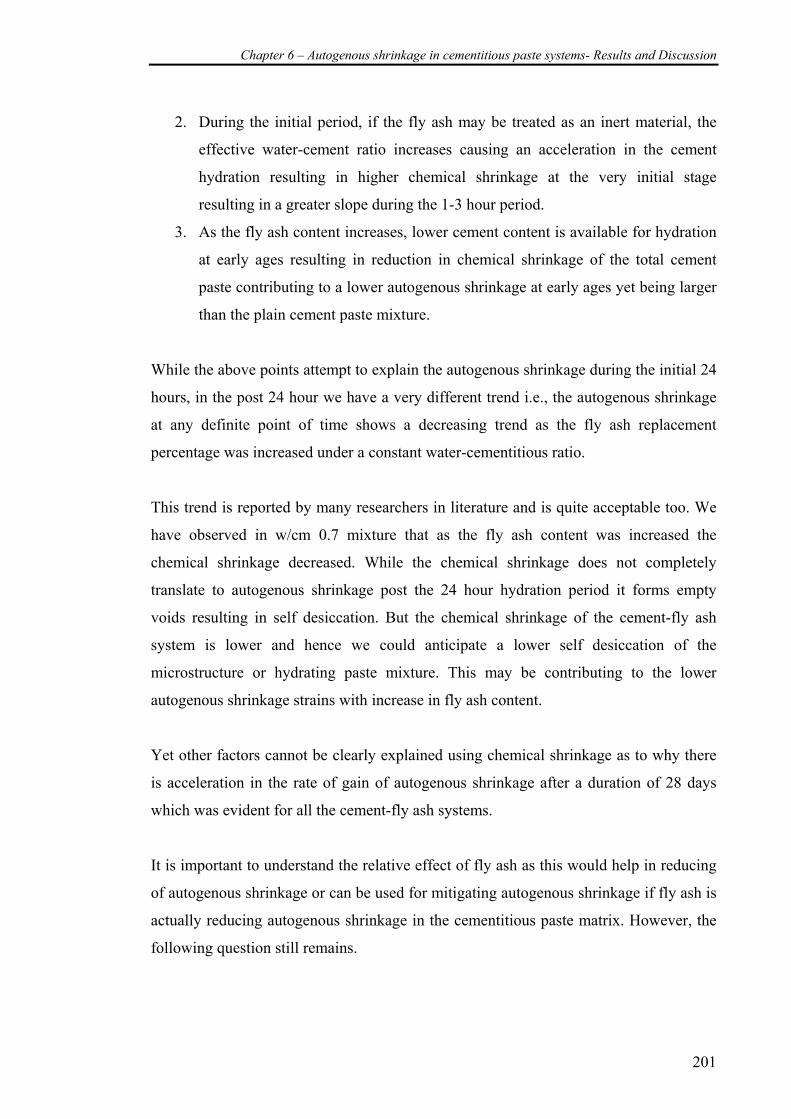
Chapter 6 – Autogenous shrinkage in cementitious paste systems- Results and Discussion
201
2. During the initial period, if the fly ash may be treated as an inert material, the
effective water-cement ratio increases causing an acceleration in the cement
hydration resulting in higher chemical shrinkage at the very initial stage
resulting in a greater slope during the 1-3 hour period.
3. As the fly ash content increases, lower cement content is available for hydration
at early ages resulting in reduction in chemical shrinkage of the total cement
paste contributing to a lower autogenous shrinkage at early ages yet being larger
than the plain cement paste mixture.
While the above points attempt to explain the autogenous shrinkage during the initial 24
hours, in the post 24 hour we have a very different trend i.e., the autogenous shrinkage
at any definite point of time shows a decreasing trend as the fly ash replacement
percentage was increased under a constant water-cementitious ratio.
This trend is reported by many researchers in literature and is quite acceptable too. We
have observed in w/cm 0.7 mixture that as the fly ash content was increased the
chemical shrinkage decreased. While the chemical shrinkage does not completely
translate to autogenous shrinkage post the 24 hour hydration period it forms empty
voids resulting in self desiccation. But the chemical shrinkage of the cement-fly ash
system is lower and hence we could anticipate a lower self desiccation of the
microstructure or hydrating paste mixture. This may be contributing to the lower
autogenous shrinkage strains with increase in fly ash content.
Yet other factors cannot be clearly explained using chemical shrinkage as to why there
is acceleration in the rate of gain of autogenous shrinkage after a duration of 28 days
which was evident for all the cement-fly ash systems.
It is important to understand the relative effect of fly ash as this would help in reducing
of autogenous shrinkage or can be used for mitigating autogenous shrinkage if fly ash is
actually reducing autogenous shrinkage in the cementitious paste matrix. However, the
following question still remains.
Chapter 6 – Autogenous shrinkage in cementitious paste systems- Results and Discussion
202
• What are the micro structural changes favouring reduced chemical shrinkage
which are in turn translated to reduced autogenous shrinkage strains as the
replacement of fly ash was increased at ages after 24 hours?
It is crucial to understand as one cannot make the statement explicitly that the reduced
chemical shrinkage could have been the only reason for reduced autogenous shrinkage.
It was observed in plain cement paste mixtures that the reduction in chemical shrinkage
had an inverse effect on the measured autogenous shrinkage strains after the 24 hour
period. Hence it clear we have to look into other factors like the degree of hydration or
the porosity or the internal drying factor as in earlier sections to have a more clear
understanding of the various factors contributing to autogenous shrinkage.
6.4.4 Degree of hydration
Basic Hydration kinetics – Fly ash hydration in cementitious paste systems is very
different to that of silica fume. The primary pozzolanic reaction may still involve the
reaction with Ca(OH)2 but it is not until one or more weeks until the alkalinity of the
pore solution is high enough to dissolve the fly ash (glass phase) (Fray, Bijen et al.
1989). To be more specific; for a 20 % fly ash replacement a pH of 13 or higher is
preferred (Bijen 1996). This may be one of the primary reasons for which pozzolanic
reactions involving fly ash are generally considered to begin at later stages of hydration
(> 14 days). While this mechanism may be valid at low replacements of 30% or perhaps
even 50% replacement of fly ash, yet at 70% replacements there may not be enough
cement to hydrate and form sufficient Ca(OH)2 or increase the alkalinity aiding in the
progress of the pozzolanic reactions. Hence, in the high volume fly ash systems, the
pozzolanic reaction may not be completed (Zhang and Canmet 1995; Jiang, Lin et al.
2000) i.e., fly ash may remain unhydrated even after longer periods of time (>365 days).
So it would be obvious that at 90 days considerable amount of fly ash would be
available unreacted (Feldman, Carette et al. 1990).
With many researchers using the Ca(OH)2 content as a measure of the degree of
hydration of the fly ash, steady decline in the Ca(OH)2 at ages beyond 7 days was
observed for fly ash replacements. Yet it cannot be ruled out that the determination of
reaction of fly as in cement-fly ash systems are difficult to achieve due to the non-
evaporable water content linked directly to the cement hydration products and not the
Chapter 6 – Autogenous shrinkage in cementitious paste systems- Results and Discussion
203
pozzolanic reactions. Hence it would be easier to revert to studies on the compressive
strength which could shed some light on the hydration mechanism and the development
of the microstructure. During the early hours in high volume fly ash paste mixtures it is
noted that the early age strength developments are quite low. The reason for this slower
strength development is, as stated earlier, related to increase in the effective water-
cement ratio of the mixture and the inert nature of fly ash at early ages thereby causing
the reduction in the compressive strength (Feldman, Carette et al. 1990). It may be
pointed out that this effective water-cement ratio is more critical in controlling the
hydration at early ages rather than the water-cementitious ratio. Similar opinion was
also suggested by (Xu and Sarkar 1994) while studies on compressive strength of high
volume fly ash cement paste mixtures were reported. Hence it may be stated that “.. the
slower development in strength explains the reduced rate of hydration of the fly ash
resulting in the overall free water content being larger which explains the lower
increase in autogenous shrinkage as the fly ash replacements are increased for the
same water-cementitious ratio post the 24 hour period”
Studies from autogenous shrinkage in plain cement paste mixture and cement-silica
fume paste mixture had confirmed that the hydration of the cementitious system had a
great influence on the development of autogenous shrinkage strains. Hence
understanding the development of degree of hydration in cement-fly ash mixtures is
important but the actual measurement of degree of hydration of the cement and fly ash
individually in hydrating cement-fly ash system has been difficult to determine. Most
importantly we accept that the cement-fly ash system has two different and distinct
reaction processes. The first being the reaction of the cement present in the cement-fly
ash system, with water which may be influenced by the presence of fly ash in the
system. The second is the reaction of fly ash with the Ca(OH)2 liberated from the
cement hydration. These two reaction progress collectively contribute to the hydration
of cement-fly ash paste mixtures. Wang et al(2004) studied the degree of hydration of
fly ash and cement in cement-fly ash paste mixtures of w/cm 0.3 for various
replacements up to 60%. They observed that as the replacement of fly ash increased the
degree of hydration of cement increased but the degree of hydration of fly ash
decreased. This is quite acceptable as at higher replacements, fly ash does not have the
opportunity to react as a lower amount of Ca(OH)2 will be produced by lower cement
Chapter 6 – Autogenous shrinkage in cementitious paste systems- Results and Discussion
204
content while the fly ash content will be more than enough to consume the limited
Ca(OH)2 produced. This reduced cement content coupled with the surplus fly ash that
had no chance to react with enough Ca(OH)2 contributes to the formation of empty
voids during hydration post the 24 hours. It is pointed out that the empty voids are
formed only after the system ceases to have no connected capillary pores or perfectly
sealed condition. As the fly ash content increases there is a likelihood of less hydration
products forming at the ages until 28 days which is evident from the strength
development of high fly ash paste mixtures. The unreacted fly ash which increases in
the high volume fly ash mixture remains dispersed well within the microstructure and
thus may not contribute in any form to autogenous shrinkage, hence the reduced values.
More importantly the low calcium fly ash mixtures undergo a slower pozzolanic
hydration reaction (Ma and Brown 1997) unlike the cement-silica fume systems
(Lilkov, Dimitrova et al. 1997). As the hydration proceeds beyond the 28 day period, fly
ash hydration kicks in resulting in fly ash also contributing to reduction in the porosity
and formation of empty voids from chemical shrinkage due to pozzolanic reaction.
While one may argue the formation of voids from chemical shrinkage should have
contributed to an increase in the porosity it should be note that the empty voids which
form reduce considerably at later ages as could be seen in our studies on chemical
shrinkage on plain cementitious mixture at water-cementitious ratio of 0.7 in Chapter 5.
But of more interest is as the porosity reduces beyond the 28 days due to progress in
pozzolanic hydration we have a resulting microstructure where the amount of empty
pores does not diminish but the overall porosity decreasing resulting a higher internal
drying or loss in internal humidity. This explains the acceleration in autogenous
shrinkage beyond the 28 day period. The higher the reactivity of fly ash the higher the
acceleration post the 28 day period as has been also reported by researchers on the
acceleration in compressive strength post the 28 day period. But this acceleration is
reduced at 70% fly ash due to very low cement content.
Jiang et al (1999) reported that as the replacement of fly ash was increased from 40% to
70% at w-cm ratio of ~0.28/0.30, the strength is reduced when compared to plain
cement paste mixture. At early ages the strength is low in higher replacements and
although the strength does increase at later ages yet it stays far below that of the
equivalent plain cement paste mixture. At 28 days Jiang et al observed that the Ca(OH)2
content decreased up to replacements of 55% but at 70 % the Ca(OH)2 was higher than
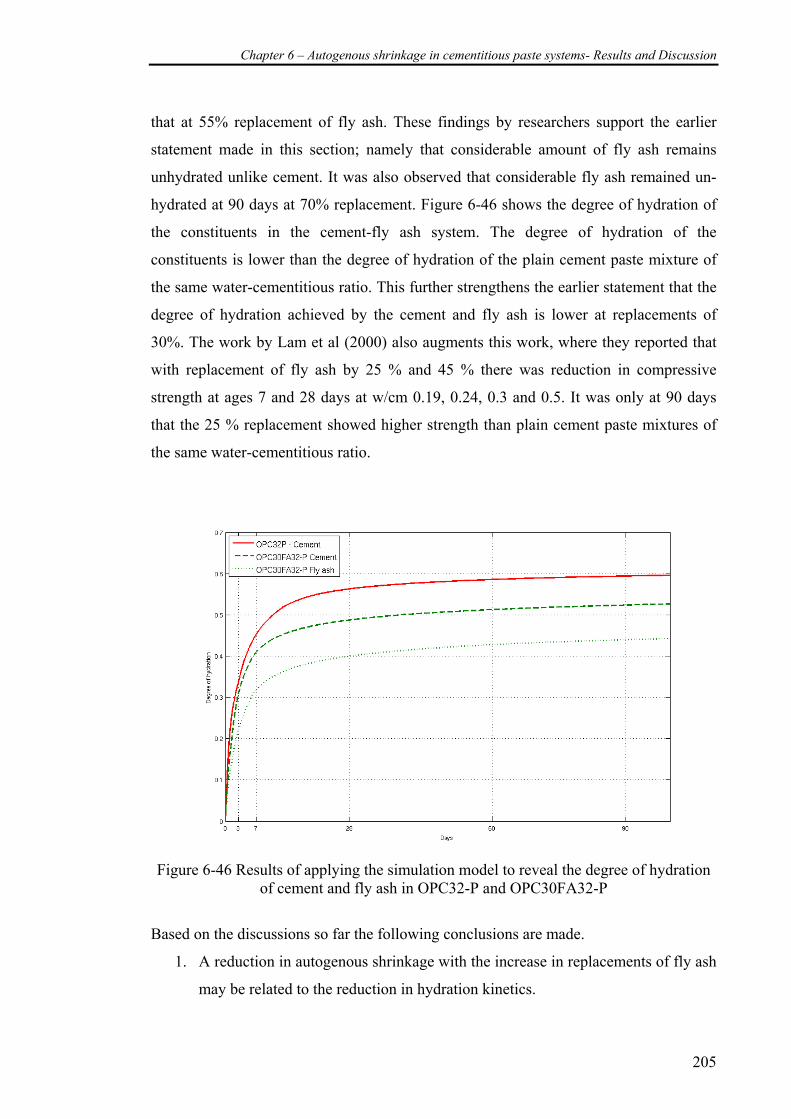
Chapter 6 – Autogenous shrinkage in cementitious paste systems- Results and Discussion
205
that at 55% replacement of fly ash. These findings by researchers support the earlier
statement made in this section; namely that considerable amount of fly ash remains
unhydrated unlike cement. It was also observed that considerable fly ash remained un-
hydrated at 90 days at 70% replacement. Figure 6-46 shows the degree of hydration of
the constituents in the cement-fly ash system. The degree of hydration of the
constituents is lower than the degree of hydration of the plain cement paste mixture of
the same water-cementitious ratio. This further strengthens the earlier statement that the
degree of hydration achieved by the cement and fly ash is lower at replacements of
30%. The work by Lam et al (2000) also augments this work, where they reported that
with replacement of fly ash by 25 % and 45 % there was reduction in compressive
strength at ages 7 and 28 days at w/cm 0.19, 0.24, 0.3 and 0.5. It was only at 90 days
that the 25 % replacement showed higher strength than plain cement paste mixtures of
the same water-cementitious ratio.
Figure 6-46 Results of applying the simulation model to reveal the degree of hydration
of cement and fly ash in OPC32-P and OPC30FA32-P
Based on the discussions so far the following conclusions are made.
1. A reduction in autogenous shrinkage with the increase in replacements of fly ash
may be related to the reduction in hydration kinetics.
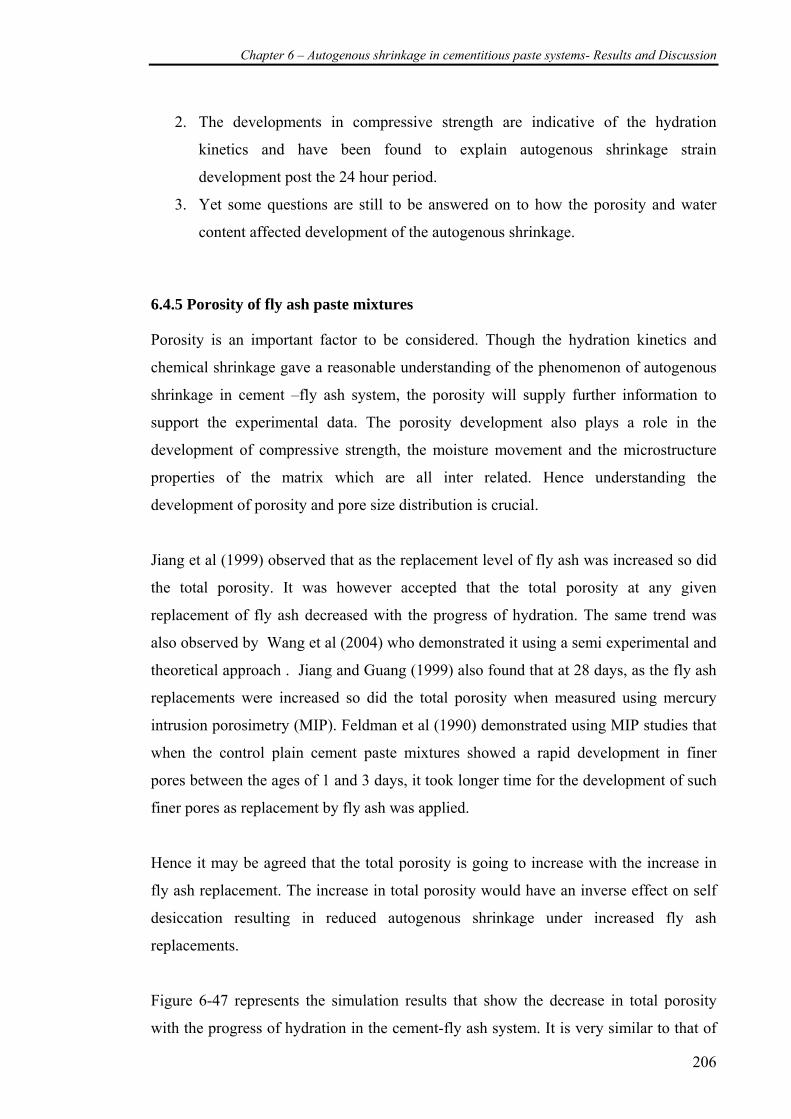
Chapter 6 – Autogenous shrinkage in cementitious paste systems- Results and Discussion
206
2. The developments in compressive strength are indicative of the hydration
kinetics and have been found to explain autogenous shrinkage strain
development post the 24 hour period.
3. Yet some questions are still to be answered on to how the porosity and water
content affected development of the autogenous shrinkage.
6.4.5 Porosity of fly ash paste mixtures
Porosity is an important factor to be considered. Though the hydration kinetics and
chemical shrinkage gave a reasonable understanding of the phenomenon of autogenous
shrinkage in cement –fly ash system, the porosity will supply further information to
support the experimental data. The porosity development also plays a role in the
development of compressive strength, the moisture movement and the microstructure
properties of the matrix which are all inter related. Hence understanding the
development of porosity and pore size distribution is crucial.
Jiang et al (1999) observed that as the replacement level of fly ash was increased so did
the total porosity. It was however accepted that the total porosity at any given
replacement of fly ash decreased with the progress of hydration. The same trend was
also observed by Wang et al (2004) who demonstrated it using a semi experimental and
theoretical approach . Jiang and Guang (1999) also found that at 28 days, as the fly ash
replacements were increased so did the total porosity when measured using mercury
intrusion porosimetry (MIP). Feldman et al (1990) demonstrated using MIP studies that
when the control plain cement paste mixtures showed a rapid development in finer
pores between the ages of 1 and 3 days, it took longer time for the development of such
finer pores as replacement by fly ash was applied.
Hence it may be agreed that the total porosity is going to increase with the increase in
fly ash replacement. The increase in total porosity would have an inverse effect on self
desiccation resulting in reduced autogenous shrinkage under increased fly ash
replacements.
Figure 6-47 represents the simulation results that show the decrease in total porosity
with the progress of hydration in the cement-fly ash system. It is very similar to that of
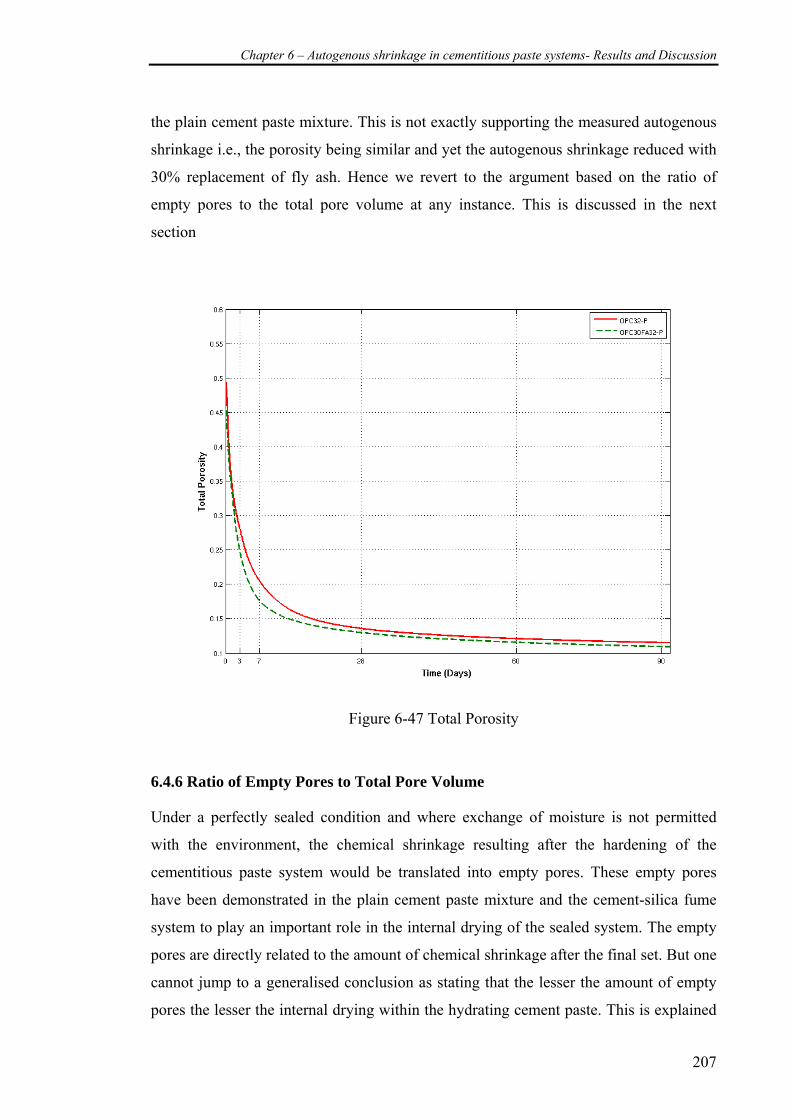
Chapter 6 – Autogenous shrinkage in cementitious paste systems- Results and Discussion
207
the plain cement paste mixture. This is not exactly supporting the measured autogenous
shrinkage i.e., the porosity being similar and yet the autogenous shrinkage reduced with
30% replacement of fly ash. Hence we revert to the argument based on the ratio of
empty pores to the total pore volume at any instance. This is discussed in the next
section
Figure 6-47 Total Porosity
6.4.6 Ratio of Empty Pores to Total Pore Volume
Under a perfectly sealed condition and where exchange of moisture is not permitted
with the environment, the chemical shrinkage resulting after the hardening of the
cementitious paste system would be translated into empty pores. These empty pores
have been demonstrated in the plain cement paste mixture and the cement-silica fume
system to play an important role in the internal drying of the sealed system. The empty
pores are directly related to the amount of chemical shrinkage after the final set. But one
cannot jump to a generalised conclusion as stating that the lesser the amount of empty
pores the lesser the internal drying within the hydrating cement paste. This is explained
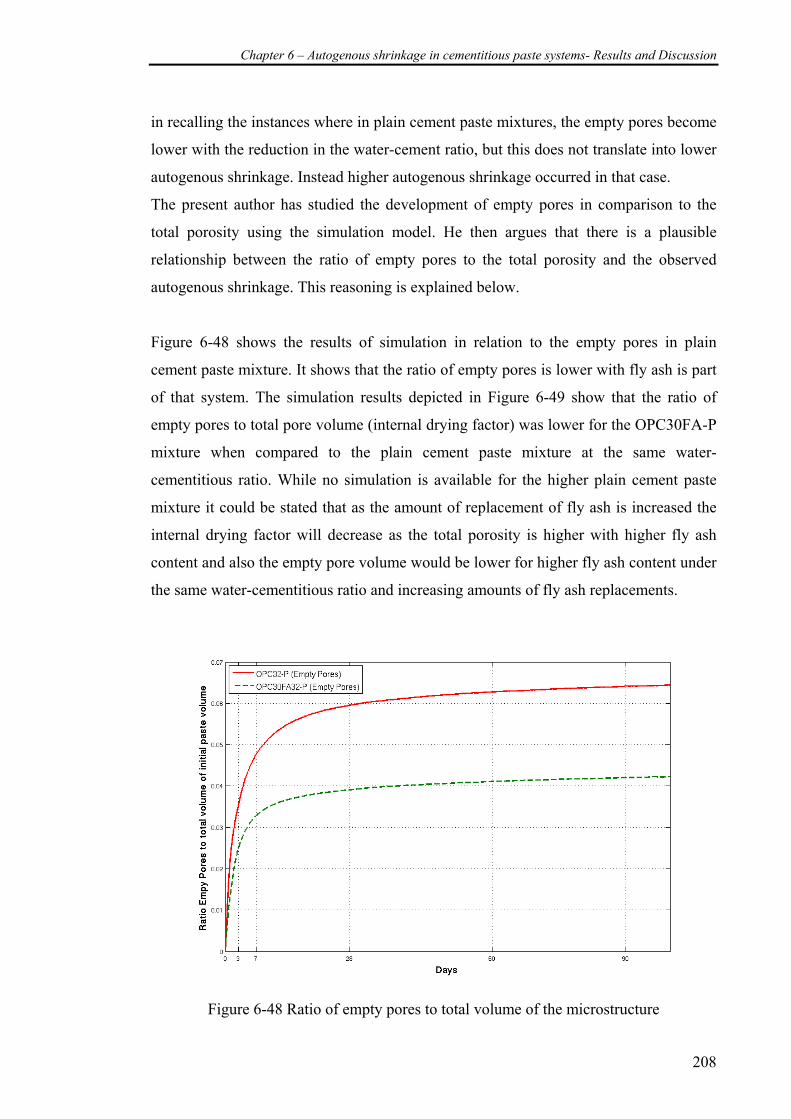
Chapter 6 – Autogenous shrinkage in cementitious paste systems- Results and Discussion
208
in recalling the instances where in plain cement paste mixtures, the empty pores become
lower with the reduction in the water-cement ratio, but this does not translate into lower
autogenous shrinkage. Instead higher autogenous shrinkage occurred in that case.
The present author has studied the development of empty pores in comparison to the
total porosity using the simulation model. He then argues that there is a plausible
relationship between the ratio of empty pores to the total porosity and the observed
autogenous shrinkage. This reasoning is explained below.
Figure 6-48 shows the results of simulation in relation to the empty pores in plain
cement paste mixture. It shows that the ratio of empty pores is lower with fly ash is part
of that system. The simulation results depicted in Figure 6-49 show that the ratio of
empty pores to total pore volume (internal drying factor) was lower for the OPC30FA-P
mixture when compared to the plain cement paste mixture at the same water-
cementitious ratio. While no simulation is available for the higher plain cement paste
mixture it could be stated that as the amount of replacement of fly ash is increased the
internal drying factor will decrease as the total porosity is higher with higher fly ash
content and also the empty pore volume would be lower for higher fly ash content under
the same water-cementitious ratio and increasing amounts of fly ash replacements.
Figure 6-48 Ratio of empty pores to total volume of the microstructure
Chapter 6 – Autogenous shrinkage in cementitious paste systems- Results and Discussion
209
Figure 6-49 Ratio of Empty Pores to Total Porosity
Figure 6-50 shows the correlation between the internal drying factor and the
experimental autogenous shrinkage. This correlation indicates that self desiccation
shrinkage occurring within the cementitious paste system can be related to internal
drying factor rather than the relative humidity.
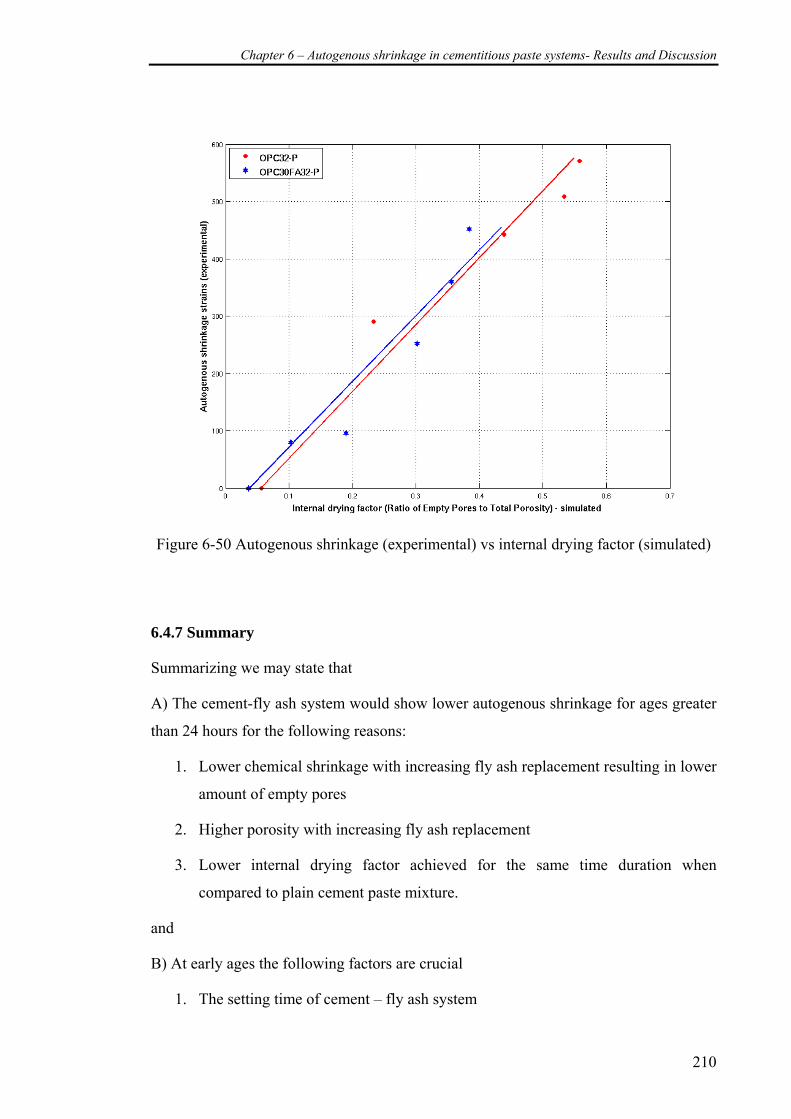
Chapter 6 – Autogenous shrinkage in cementitious paste systems- Results and Discussion
210
Figure 6-50 Autogenous shrinkage (experimental) vs internal drying factor (simulated)
6.4.7 Summary
Summarizing we may state that
A) The cement-fly ash system would show lower autogenous shrinkage for ages greater
than 24 hours for the following reasons:
1. Lower chemical shrinkage with increasing fly ash replacement resulting in lower
amount of empty pores
2. Higher porosity with increasing fly ash replacement
3. Lower internal drying factor achieved for the same time duration when
compared to plain cement paste mixture.
and
B) At early ages the following factors are crucial
1. The setting time of cement – fly ash system
Chapter 6 – Autogenous shrinkage in cementitious paste systems- Results and Discussion
211
2. The accelerated chemical shrinkage during the very early hours due to higher
effective water-cement ratio in the cementitious systems.
Yet, it is still not known at this stage whether other theories could hold as alternative
interpretation to the development and may be worth investigating in a future research.
Such theories are:
Theory 1. Water is absorbed by the inert fly ash particles which then becomes sources
or reservoirs of water to reduce self desiccation
Theory 2 The higher free water content within the cement-fly ash system has a
significant influence that contributes to lower autogenous shrinkage.
Chapter 6 – Autogenous shrinkage in cementitious paste systems- Results and Discussion
212
6.5 Cement – slag systems
Continuing the study on cement–fly ash paste systems, the work was extended to
understand the effect of slag replacements on autogenous shrinkage. Slag was chosen
for this study after that on fly ash as it is the most widely used supplementary
cementitious material next to fly ash. The study involved the measurement of
autogenous shrinkage in cementitious paste systems at different slag replacements. Slag
was added at replacements of 30%, 50% and 70% of the mass of cement content in the
cementitious paste. A constant water-cementitious ratio of 0.32 was maintained for all
the three paste mixtures. The autogenous shrinkage measurements were then compared
to plain cement paste mixture of water-cement ratio 0.32.
6.5.1 Experimental observation (<24 hours)
The study mainly comprises two parts. Measurement of autogenous shrinkage up to the
duration of 24 hours and measurements after 24 hours (both using corrugated tubes).
The results of the individual autogenous shrinkage strains before 24 hours for each of
the slag replacements can be found Figure 6-51, Figure 6-52 and Figure 6-53. The
internal temperature of the sample was 25°C ±1°C for all the three mixtures. The
ambient temperatures were also recorded during the initial 24 hours of hydration. As the
temperature variation was within ±1°C no correction for the recorded strains were
carried out and is compared directly with each other and the plain cement paste mixture.
Figure 6-54 shows the comparison of all the three cement-slag mixtures with the
control plain cement paste mixture of the same water-cementitious ratio 0.32.

Chapter 6 – Autogenous shrinkage in cementitious paste systems- Results and Discussion
213
Figure 6-51 Autogenous shrinkage in OPC with 30 % replacement of Slag
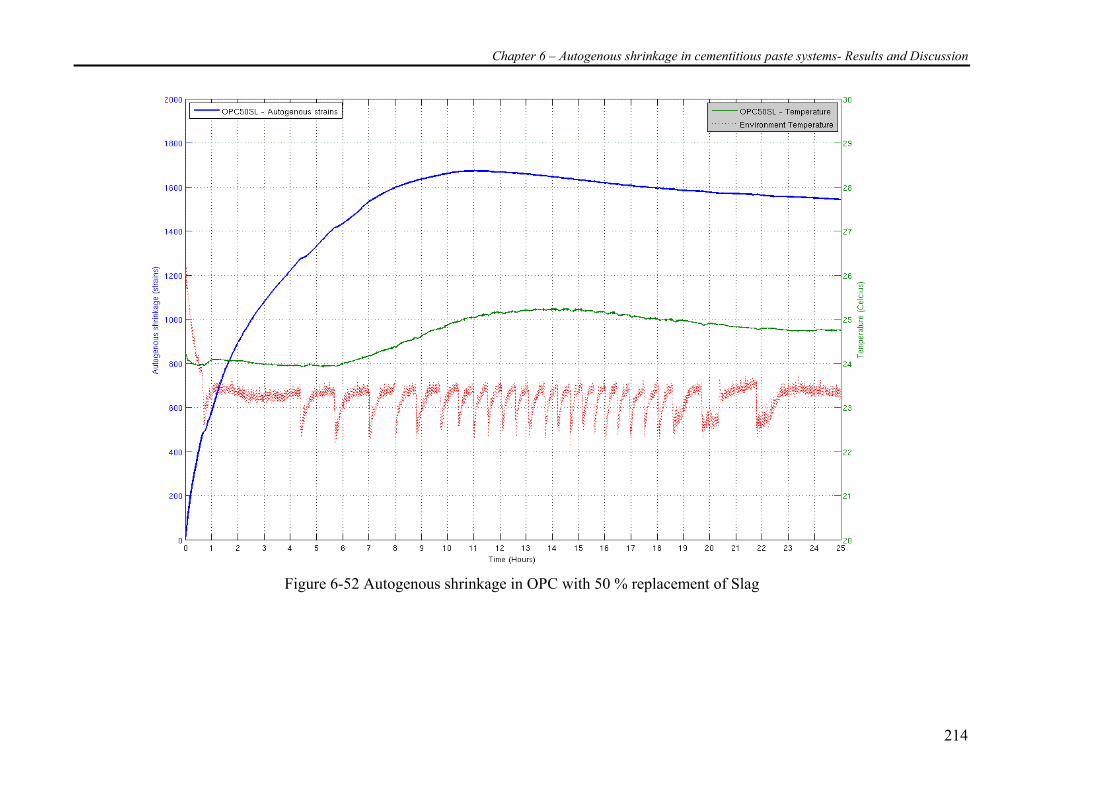
Chapter 6 – Autogenous shrinkage in cementitious paste systems- Results and Discussion
214
Figure 6-52 Autogenous shrinkage in OPC with 50 % replacement of Slag
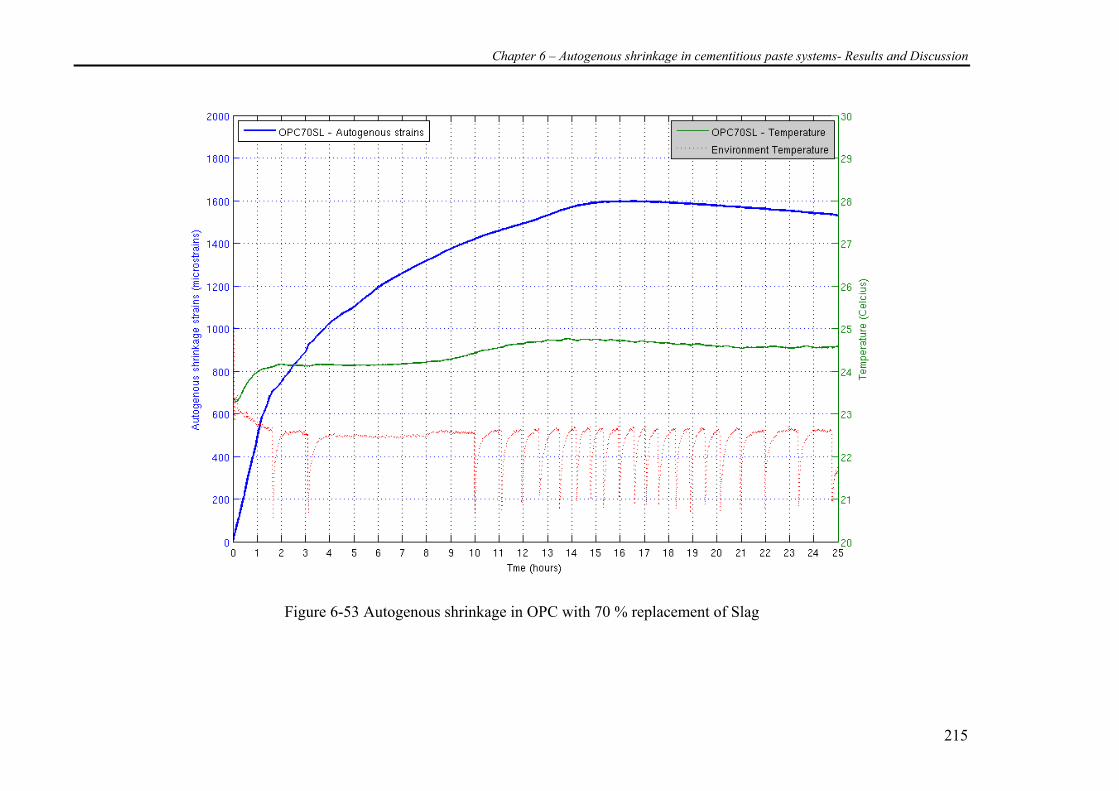
Chapter 6 – Autogenous shrinkage in cementitious paste systems- Results and Discussion
215
Figure 6-53 Autogenous shrinkage in OPC with 70 % replacement of Slag
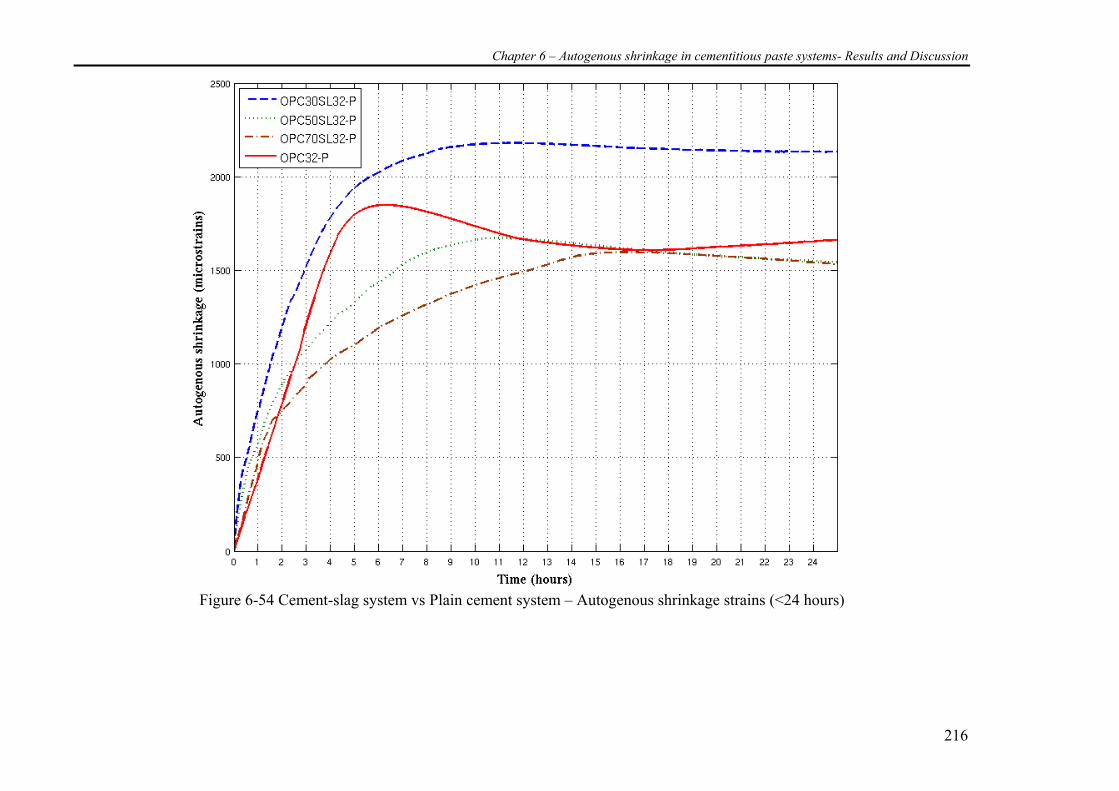
Chapter 6 – Autogenous shrinkage in cementitious paste systems- Results and Discussion
216
Figure 6-54 Cement-slag system vs Plain cement system – Autogenous shrinkage strains (<24 hours)
Chapter 6 – Autogenous shrinkage in cementitious paste systems- Results and Discussion
217
Autogenous shrinkage measurement before 24 hours (Corrugated tubes)
Observations -
• The cementitious paste mixture with 30% slag showed the highest autogenous
shrinkage strains at ages less than 24 hours when compared to the plain cement
paste mixture and other higher slag replacements
• The duration at which the point of inflection of the slope of the autogenous
shrinkage strain occurred increased with higher replacement of slag but this
increase was not as high as that of the cement-fly ash paste systems.
• The 50% and 70% slag replacement did not show much difference in autogenous
shrinkage at the end of 24 hours though their initial rates of development of the
strains were different.
• From the experimental data, it may be stated that the autogenous shrinkage
strain has a decreasing trend with increase in slag replacements during the initial
24 hours of hydration.
• The 30% slag replacement had a similar point of inflection (change in slope)
when compared to the control plain cement paste mixture.
• A more gradual change in slope or point of inflection is noticed with higher
replacements i.e., the sharp change in slope is not evident with higher
replacements of slag.
• At higher replacements of 50% and 70%, flash setting of the cementitious paste
mixture was observed during the preparation of the sample.
While the above observations are made, it is more interesting to know why the
cementitious paste mixtures behaved in such a manner. The author questions these
observations and attempts to apply existing knowledge (from literature) of cement-slag
systems to understand and interpret the data while postulating theories for the same. The
following comments/questions are raised.
Comments –
• Why is the value for the cementitious paste system with 30% slag replacement
alone, much larger than the plain cement paste mixture?
• Why is there a decreasing trend observed with the increase in slag dosage, when
we are aware that slag is hydraulic in nature by itself unlike fly ash?
Chapter 6 – Autogenous shrinkage in cementitious paste systems- Results and Discussion
218
• How are the setting times of cement-slag systems to influence the early age
deformations and how different are the setting times to that of the plain cement
paste mixture?
• A slight expansion in the cementitious paste systems can be observed once the
peak value of shrinkage is observed. Can we give a reason to this phenomenon?
• Why did the flash set occur? Is this a phenomenon particular to this slag as
influenced by its components? Or is it a phenomenon that is likely to be shared
by most slags? And why?
• What does the literature say, if any, about the phenomenon of flash set in the
presence of slag?
• Did the flash setting have an influence on the observed strains?
6.5.2 Experimental Observation (after 24 hours)
The corrugated samples after 24 hours were weighed and the length of the sample
monitored. The length change was then measured at regular intervals of 3, 7, 28, 60 and
90 days similar to the studies on plain cement paste mixtures. A comparison is made to
plain cement paste mixtures and is shown in Figure 6-55. The zero point was chosen at
24 hours for allowing sufficient hardening for all the paste mixtures and uniformity
across all cementitious paste mixtures.
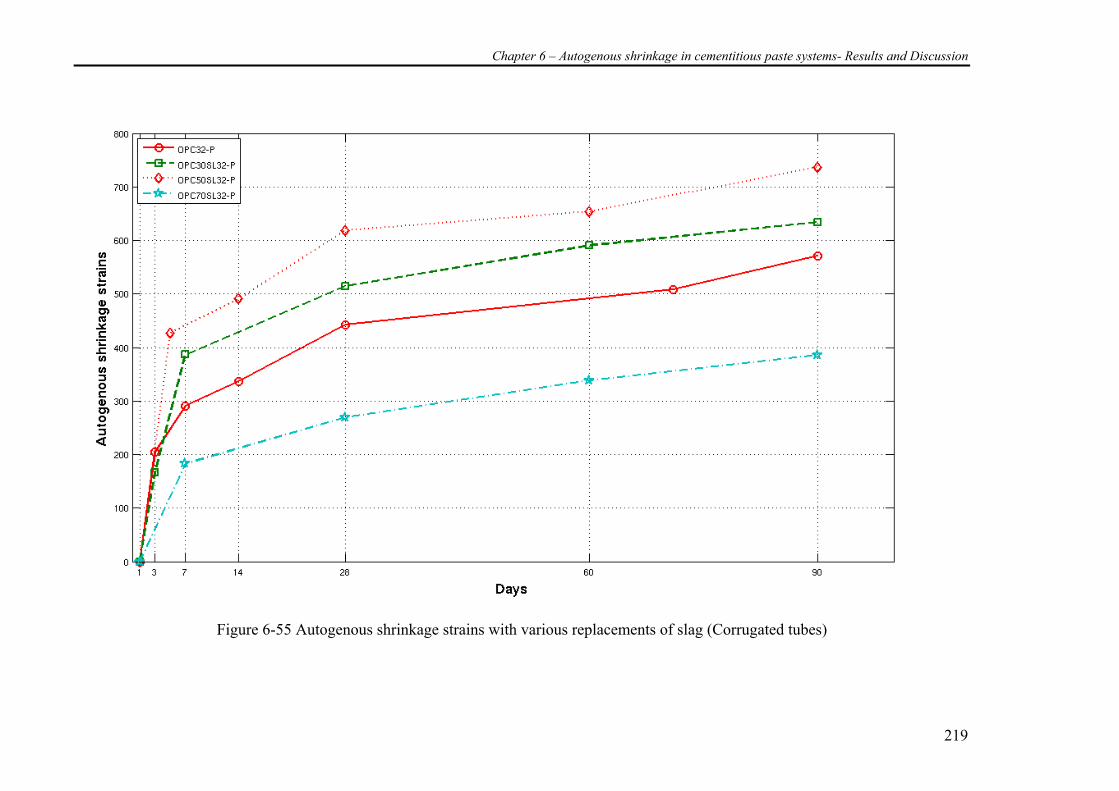
Chapter 6 – Autogenous shrinkage in cementitious paste systems- Results and Discussion
219
Figure 6-55 Autogenous shrinkage strains with various replacements of slag (Corrugated tubes)
Chapter 6 – Autogenous shrinkage in cementitious paste systems- Results and Discussion
220
Autogenous shrinkage measurement after 24 hours (Corrugated tubes)
Observations -
• More than 50% of the strains observed in 90 days is observed during the early 7
day period after which there is only a gradual increase in autogenous shrinkage
strain but this rate of increase in autogenous shrinkage strain is much lower than
the rate during the 1 - 7 day duration
• After 24 hour period, the autogenous shrinkage strain achieved by the 50%
replacement mixture is the highest, followed by the cementitious paste system
with 30% replacement. Yet both being much higher than the plain cement paste
mixture.
• The cementitious paste mixture with 70% replacement of slag showed the lowest
strains when compared to the other two slag replacement mixtures and was also
lower than the plain cement paste mixture.
• In the cement-slag system the rate of autogenous shrinkage development was
very similar to the plain cement system in all slag mixtures. Only the magnitudes
were different. This is unlike the cement-fly ash system where an initially slower
autogenous shrinkage was observed in the 1 -7 day period.
• No later acceleration stage was observed beyond the 28day period as was
observed in the cement-fly ash system.
Before any comments are made regarding the observations above, it is acknowledged
that the slag hydration is not as simple as that of cement-fly ash systems. Slag is
hydraulic by itself and due to the presence of alkalis in cement the slag hydration is
further activated. This is in conjunction with reacting with the CH which is released
from the cement hydration. That is, slag reacts on its own and interferes with the
hydration of cement also (Chen 2006). Hence keeping this in mind the following
comments are made:
• If slag is hydraulic in nature why did the cementitious paste system with 70%
replacement show the lowest autogenous shrinkage strain? The best way to
address this would be the slag stoichiometry. Referring back to the Chapter 5
where we talk about slag hydration we do understand that slag stoichiometry is
Chapter 6 – Autogenous shrinkage in cementitious paste systems- Results and Discussion
221
very much dependent on the composition of the slag (Richardson, Biernacki et
al. 2002) and is not straight forward as that of the plain cement. The slag
hydration is also influenced on the presence of alkali’s available to accelerate the
hydration of slag. Hence though we do have higher chemical shrinkage as
observed in lower replacements due to slag-calcium hydroxide reaction the same
may not be the case with higher replacements due to lower alkali’s
• Similarly why did the cementitious paste systems with 50% slag replacement
have a higher autogenous shrinkage strain to that of the 30% replacement?
• Why are autogenous shrinkage strains achieved at 7 days so large and nearly
over 50% of the 90 days value? Compared with the case of fly ash system, we
notice a much more gradual increase or even dormant period within that initial 7
day time.
• Can a simple Slag - CH reaction model alone be valid or a more complex
cement-slag hydration required to model or explain the autogenous shrinkage
stain hydration?
In order to understand the above questions the author uses data from CEMHYD3D for
understanding and interpreting the factors contributing to autogenous shrinkage. Similar
to the simulations of the cement-fly ash system, the cement-slag system simulation was
also carried out only for the 30% slag replacement. The simulations involving 50% and
70% slag replacements were not carried out as chemical shrinkage data could not be
calibrated against the experimental data. The reason was unknown but could have been
the limitation of the model. To begin interpreting the data we need to discuss, in this
context, the properties of chemical shrinkage, hydration kinetics, porosity and internal
drying factor.
6.5.3 Chemical shrinkage
Chemical shrinkage as explained in all the earlier section plays a vital part in
contributing to the autogenous shrinkage strains. Experimental evidence at w/cm of 0.7
showed that the chemical shrinkage was larger than plain cement paste for all
replacements of slag. Figure 6-56 shows the simulated chemical shrinkage for
OPC30SL32-P and Figure 6-57 reveals the simulated chemical shrinkage for the initial
24 hours. The chemical shrinkage values of OPC30SL-P are compared to the chemical
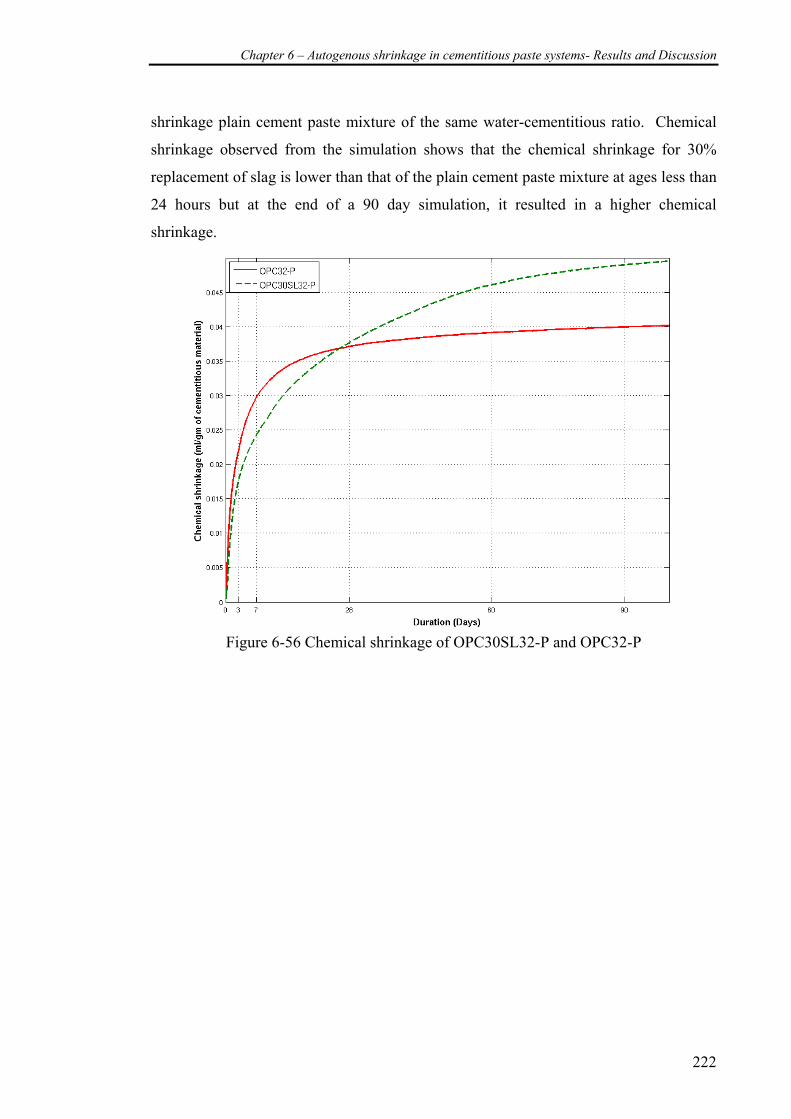
Chapter 6 – Autogenous shrinkage in cementitious paste systems- Results and Discussion
222
shrinkage plain cement paste mixture of the same water-cementitious ratio. Chemical
shrinkage observed from the simulation shows that the chemical shrinkage for 30%
replacement of slag is lower than that of the plain cement paste mixture at ages less than
24 hours but at the end of a 90 day simulation, it resulted in a higher chemical
shrinkage.
Figure 6-56 Chemical shrinkage of OPC30SL32-P and OPC32-P
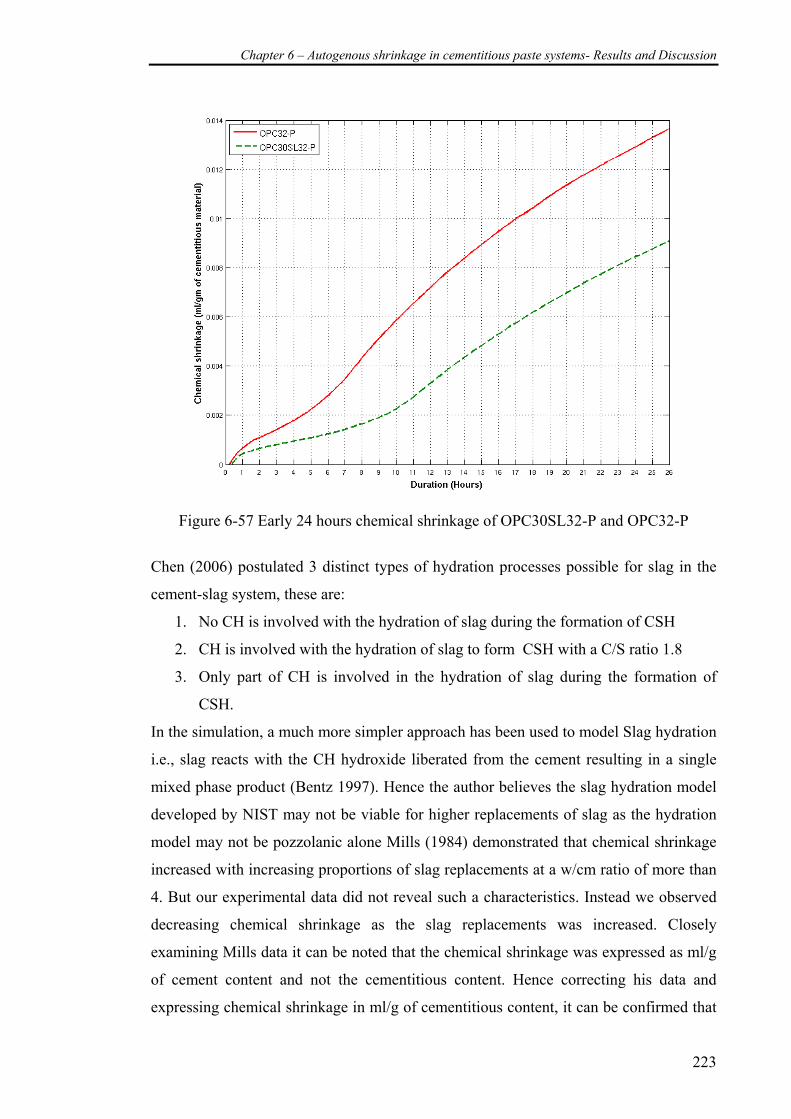
Chapter 6 – Autogenous shrinkage in cementitious paste systems- Results and Discussion
223
Figure 6-57 Early 24 hours chemical shrinkage of OPC30SL32-P and OPC32-P
Chen (2006) postulated 3 distinct types of hydration processes possible for slag in the
cement-slag system, these are:
1. No CH is involved with the hydration of slag during the formation of CSH
2. CH is involved with the hydration of slag to form CSH with a C/S ratio 1.8
3. Only part of CH is involved in the hydration of slag during the formation of
CSH.
In the simulation, a much more simpler approach has been used to model Slag hydration
i.e., slag reacts with the CH hydroxide liberated from the cement resulting in a single
mixed phase product (Bentz 1997). Hence the author believes the slag hydration model
developed by NIST may not be viable for higher replacements of slag as the hydration
model may not be pozzolanic alone Mills (1984) demonstrated that chemical shrinkage
increased with increasing proportions of slag replacements at a w/cm ratio of more than
4. But our experimental data did not reveal such a characteristics. Instead we observed
decreasing chemical shrinkage as the slag replacements was increased. Closely
examining Mills data it can be noted that the chemical shrinkage was expressed as ml/g
of cement content and not the cementitious content. Hence correcting his data and
expressing chemical shrinkage in ml/g of cementitious content, it can be confirmed that
Chapter 6 – Autogenous shrinkage in cementitious paste systems- Results and Discussion
224
the chemical shrinkage reduces with increasing dosage of slag content. Now this is
evidently visible in the initial 24 hour autogenous shrinkage strain values measured
thereby complementing the work of Mills(1984) and the simulation of OPC30SL32-P ,
where we did observe a decrease in the autogenous shrinkage as the replacement
percentage of slag was increased during the 24 hours. Secondly this trend was observed
even though we did actually have a slight retardation of the cementitious paste mixtures
with increasing slag dosage. Though there was a decreasing trend in the autogenous
shrinkage with increasing amounts of slag it is not evidently conclusive as to why all
these values are still higher than that of the plain cement paste mixture. The simulation
which shows lower chemical shrinkage than the plain cement paste mixture at early
ages does not account for the case of OPC30SL32-P where the measured autogenous
shrinkage in the first 24 hours was larger than that of OPC32-P.
Hence, we have experimental evidence from the work of Mills(1984) that as the slag
replacement is increased there is a reduction in chemical shrinkage and from this study
involving slag replacements at w/cm 0.7 which showed reduction in chemical shrinkage
at ages below 24 hours. It can be argued that setting time of the cement-slag pastes
could also have influenced or contributed to the higher autogenous shrinkage strains.
The setting time of cements blended with slag is generally longer than that of portland
cement(Lewis, Sear et al. 2003). As the proportion of slag increases so will the time
required for it to set (Chen 2006).
Secondly moving to measurement beyond 24 hours it can be seen that the autogenous
shrinkage was highest for cementitious paste mixture with 50% slag replacements. This
is a very similar trend to that of the chemical shrinkage for cement-slag mixtures at
w/cm 0.7 measured experimentally in this study. But whether it was solely the chemical
shrinkage which controlled the observed autogenous shrinkage strain is unknown at this
stage.
Hence it is concluded at this stage that there is not enough supporting evidence from
chemical shrinkage as to the exact reason for the observed autogenous shrinkage during
the early 24 hours. But measurements of autogenous shrinkage at w/cm 0.32 beyond the
24 hour period had very similar trend to that of the observed chemical shrinkage at
w/cm 0.7.
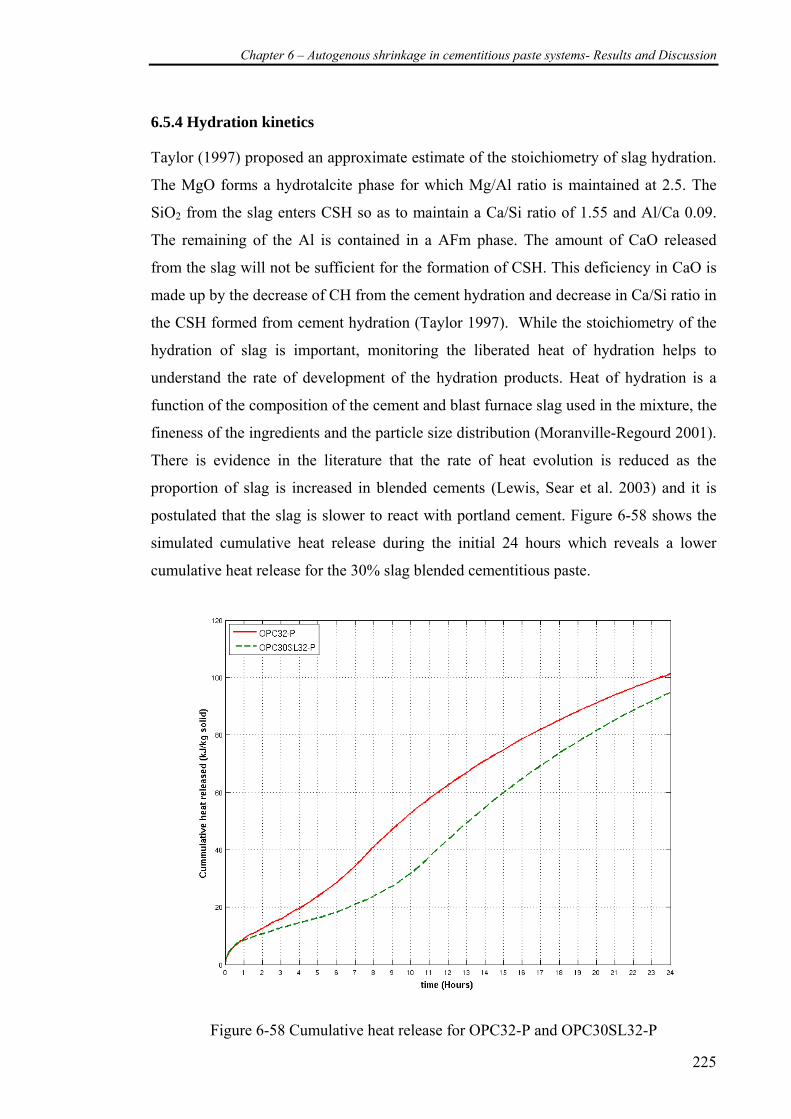
Chapter 6 – Autogenous shrinkage in cementitious paste systems- Results and Discussion
225
6.5.4 Hydration kinetics
Taylor (1997) proposed an approximate estimate of the stoichiometry of slag hydration.
The MgO forms a hydrotalcite phase for which Mg/Al ratio is maintained at 2.5. The
SiO2 from the slag enters CSH so as to maintain a Ca/Si ratio of 1.55 and Al/Ca 0.09.
The remaining of the Al is contained in a AFm phase. The amount of CaO released
from the slag will not be sufficient for the formation of CSH. This deficiency in CaO is
made up by the decrease of CH from the cement hydration and decrease in Ca/Si ratio in
the CSH formed from cement hydration (Taylor 1997). While the stoichiometry of the
hydration of slag is important, monitoring the liberated heat of hydration helps to
understand the rate of development of the hydration products. Heat of hydration is a
function of the composition of the cement and blast furnace slag used in the mixture, the
fineness of the ingredients and the particle size distribution (Moranville-Regourd 2001).
There is evidence in the literature that the rate of heat evolution is reduced as the
proportion of slag is increased in blended cements (Lewis, Sear et al. 2003) and it is
postulated that the slag is slower to react with portland cement. Figure 6-58 shows the
simulated cumulative heat release during the initial 24 hours which reveals a lower
cumulative heat release for the 30% slag blended cementitious paste.
Figure 6-58 Cumulative heat release for OPC32-P and OPC30SL32-P
Chapter 6 – Autogenous shrinkage in cementitious paste systems- Results and Discussion
226
The initial slower reactivity was also evident from studies on compressive strength. At
replacements of slag up to 65% it was observed that the inclusion of slag reduced the
early age strength as compared to plain cement mortars. But at ages beyond 7 days all
the mixtures with slag showed a higher strength gain than that for mixtures made from
normal portland cement. Ahmed (2007) has observed that in concrete specimens at
w/cm 0.38 there is a decreasing trend in the compressive strength with increase in slag
replacement percentage. On the contrary Swamy and Bouikni (1990) found that there
was a reduction in only compressive strength with 70% slag replacements in concrete
specimens cured for 7 days. Nevertheless the 70% replacement slag replacement shows
a much slower reaction rate and in the development of microstructure. Hence, this could
be a reason as to the cause of the reduction in autogenous shrinkage strains for cement-
slag blends with 70% slag. The kinetics is also influenced by the fineness of the slag
present in the cement-slag blends. At early ages with slag replacements of 50-60% the
early strength is mainly determined by the fineness of the clinker fractions and later
strength by the slag fraction. Slag in this study is finer than that of the Portland cement.
Whether the fineness did influence the rate of development on the autogenous shrinkage
is unknown at this stage as this aspect has not been investigated in isolation but the
effect of the finer slag in the cement-slag may have been a cause for the higher
autogenous shrinkage at lower replacements and this not being dominant at higher
replacements.
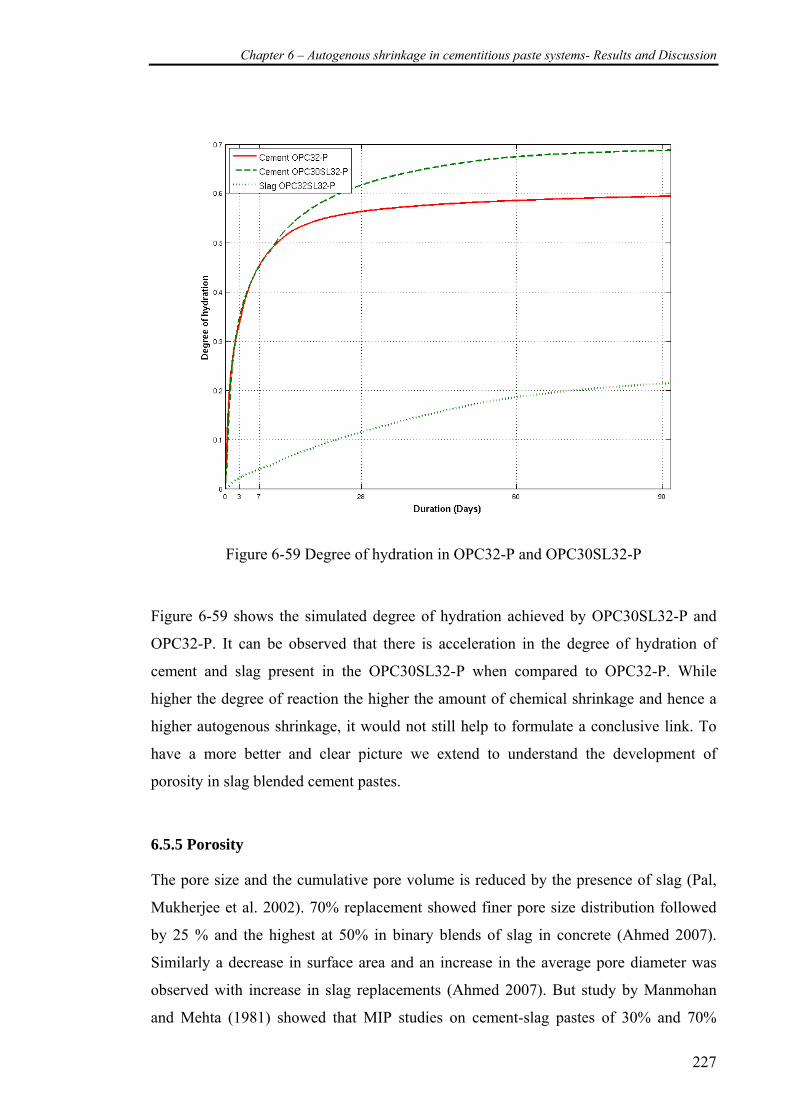
Chapter 6 – Autogenous shrinkage in cementitious paste systems- Results and Discussion
227
Figure 6-59 Degree of hydration in OPC32-P and OPC30SL32-P
Figure 6-59 shows the simulated degree of hydration achieved by OPC30SL32-P and
OPC32-P. It can be observed that there is acceleration in the degree of hydration of
cement and slag present in the OPC30SL32-P when compared to OPC32-P. While
higher the degree of reaction the higher the amount of chemical shrinkage and hence a
higher autogenous shrinkage, it would not still help to formulate a conclusive link. To
have a more better and clear picture we extend to understand the development of
porosity in slag blended cement pastes.
6.5.5 Porosity
The pore size and the cumulative pore volume is reduced by the presence of slag (Pal,
Mukherjee et al. 2002). 70% replacement showed finer pore size distribution followed
by 25 % and the highest at 50% in binary blends of slag in concrete (Ahmed 2007).
Similarly a decrease in surface area and an increase in the average pore diameter was
observed with increase in slag replacements (Ahmed 2007). But study by Manmohan
and Mehta (1981) showed that MIP studies on cement-slag pastes of 30% and 70%
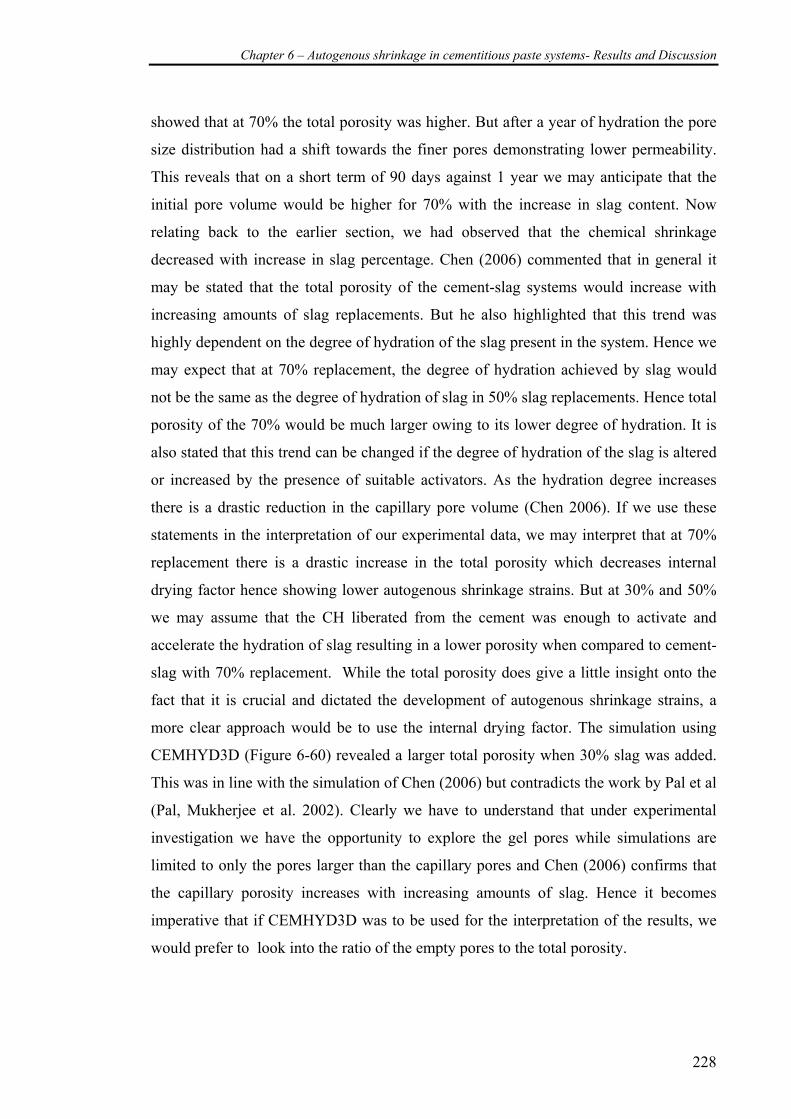
Chapter 6 – Autogenous shrinkage in cementitious paste systems- Results and Discussion
228
showed that at 70% the total porosity was higher. But after a year of hydration the pore
size distribution had a shift towards the finer pores demonstrating lower permeability.
This reveals that on a short term of 90 days against 1 year we may anticipate that the
initial pore volume would be higher for 70% with the increase in slag content. Now
relating back to the earlier section, we had observed that the chemical shrinkage
decreased with increase in slag percentage. Chen (2006) commented that in general it
may be stated that the total porosity of the cement-slag systems would increase with
increasing amounts of slag replacements. But he also highlighted that this trend was
highly dependent on the degree of hydration of the slag present in the system. Hence we
may expect that at 70% replacement, the degree of hydration achieved by slag would
not be the same as the degree of hydration of slag in 50% slag replacements. Hence total
porosity of the 70% would be much larger owing to its lower degree of hydration. It is
also stated that this trend can be changed if the degree of hydration of the slag is altered
or increased by the presence of suitable activators. As the hydration degree increases
there is a drastic reduction in the capillary pore volume (Chen 2006). If we use these
statements in the interpretation of our experimental data, we may interpret that at 70%
replacement there is a drastic increase in the total porosity which decreases internal
drying factor hence showing lower autogenous shrinkage strains. But at 30% and 50%
we may assume that the CH liberated from the cement was enough to activate and
accelerate the hydration of slag resulting in a lower porosity when compared to cement-
slag with 70% replacement. While the total porosity does give a little insight onto the
fact that it is crucial and dictated the development of autogenous shrinkage strains, a
more clear approach would be to use the internal drying factor. The simulation using
CEMHYD3D (Figure 6-60) revealed a larger total porosity when 30% slag was added.
This was in line with the simulation of Chen (2006) but contradicts the work by Pal et al
(Pal, Mukherjee et al. 2002). Clearly we have to understand that under experimental
investigation we have the opportunity to explore the gel pores while simulations are
limited to only the pores larger than the capillary pores and Chen (2006) confirms that
the capillary porosity increases with increasing amounts of slag. Hence it becomes
imperative that if CEMHYD3D was to be used for the interpretation of the results, we
would prefer to look into the ratio of the empty pores to the total porosity.
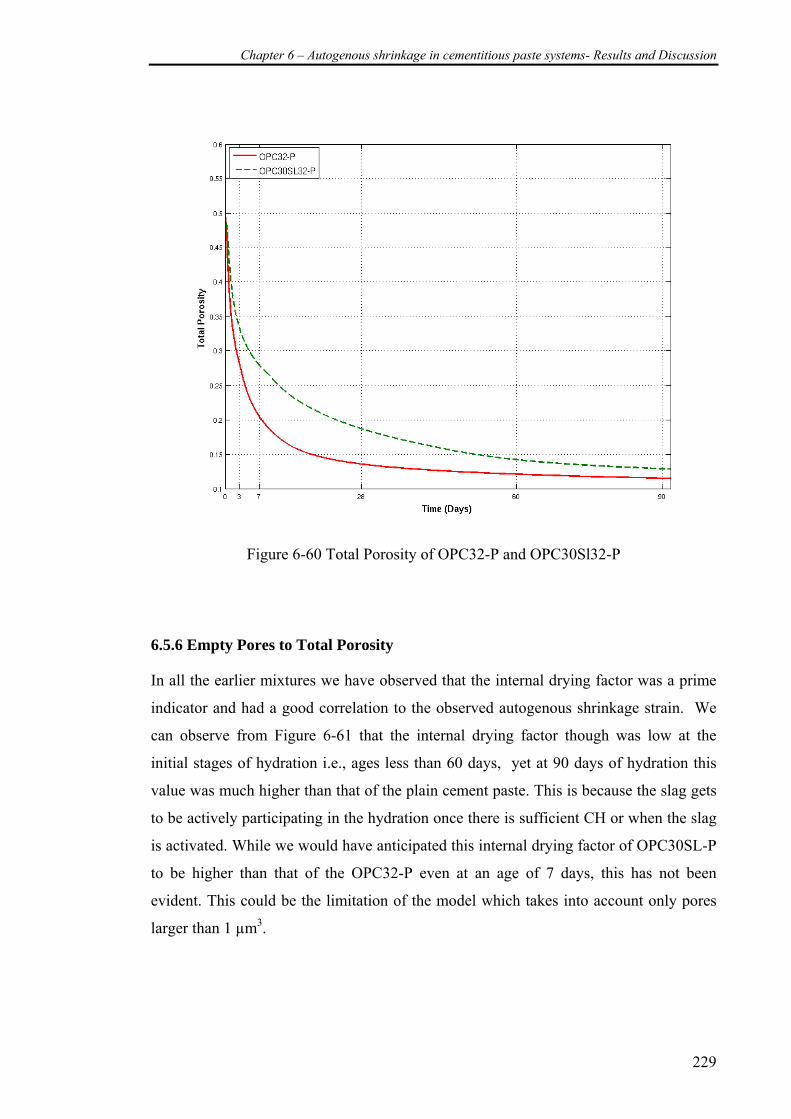
Chapter 6 – Autogenous shrinkage in cementitious paste systems- Results and Discussion
229
Figure 6-60 Total Porosity of OPC32-P and OPC30Sl32-P
6.5.6 Empty Pores to Total Porosity
In all the earlier mixtures we have observed that the internal drying factor was a prime
indicator and had a good correlation to the observed autogenous shrinkage strain. We
can observe from Figure 6-61 that the internal drying factor though was low at the
initial stages of hydration i.e., ages less than 60 days, yet at 90 days of hydration this
value was much higher than that of the plain cement paste. This is because the slag gets
to be actively participating in the hydration once there is sufficient CH or when the slag
is activated. While we would have anticipated this internal drying factor of OPC30SL-P
to be higher than that of the OPC32-P even at an age of 7 days, this has not been
evident. This could be the limitation of the model which takes into account only pores
larger than 1 µm3.
Chapter 6 – Autogenous shrinkage in cementitious paste systems- Results and Discussion
230
Figure 6-61 Internal drying factor OPC32-P and OPC30SL32-P
Yet when the internal drying factor was correlated with the autogenous shrinkage strain
(experimental data) there was excellent correlation for between the internal drying
factor and data beyond 7 days. This is shown in Figure 6-62. This further confirms the
importance of this internal drying factor and its role in autogenous shrinkage.
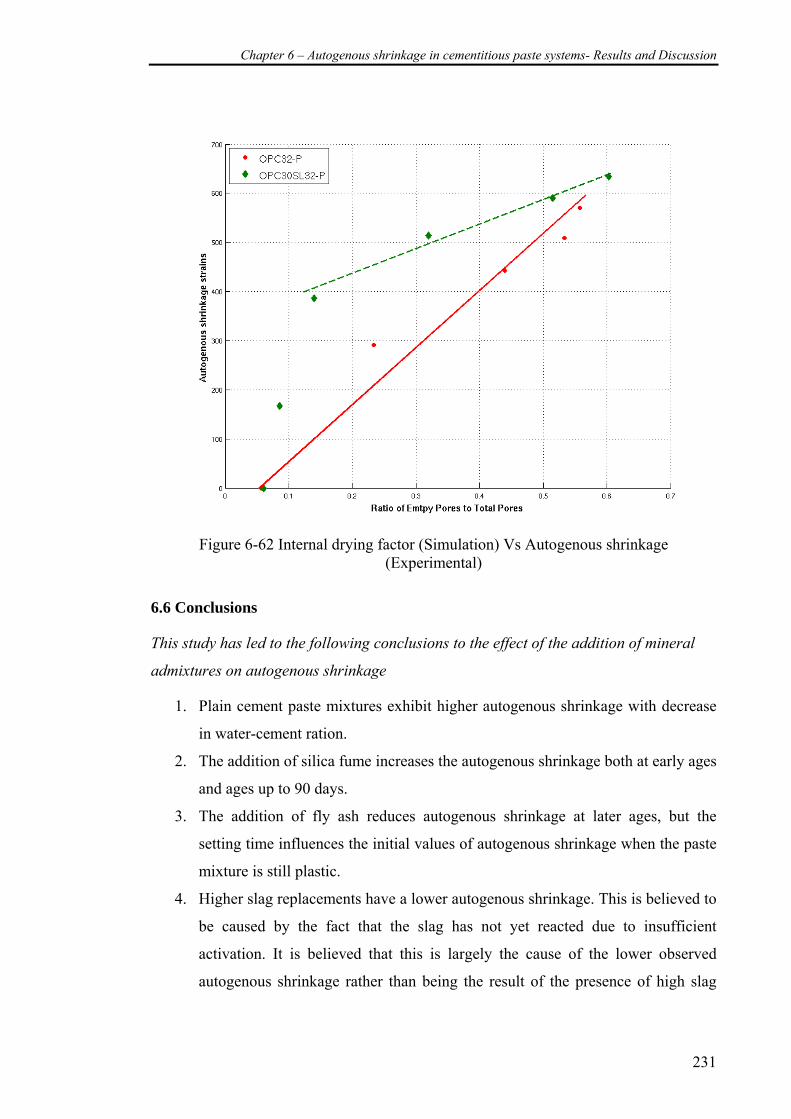
Chapter 6 – Autogenous shrinkage in cementitious paste systems- Results and Discussion
231
Figure 6-62 Internal drying factor (Simulation) Vs Autogenous shrinkage
(Experimental)
6.6 Conclusions
This study has led to the following conclusions to the effect of the addition of mineral
admixtures on autogenous shrinkage
1. Plain cement paste mixtures exhibit higher autogenous shrinkage with decrease
in water-cement ration.
2. The addition of silica fume increases the autogenous shrinkage both at early ages
and ages up to 90 days.
3. The addition of fly ash reduces autogenous shrinkage at later ages, but the
setting time influences the initial values of autogenous shrinkage when the paste
mixture is still plastic.
4. Higher slag replacements have a lower autogenous shrinkage. This is believed to
be caused by the fact that the slag has not yet reacted due to insufficient
activation. It is believed that this is largely the cause of the lower observed
autogenous shrinkage rather than being the result of the presence of high slag
Chapter 6 – Autogenous shrinkage in cementitious paste systems- Results and Discussion
232
volume. In general, slag may be said to accelerate autogenous shrinkage in
cementitious paste mixtures provided activation of slag is achieved.
5. The setting time of the cementitious pastes have a critical role in the initial value
of autogenous shrinkage when the cementitious matrix is still in its plastic state.
6. The internal drying factor which is the ratio of the empty pores to total porosity
has been found to have excellent correlation to autogenous shrinkage strains.
7. While the literature have adopted concepts of RH to explain the autogenous
shrinkage strains, the internal drying factor could be a simpler approach to
predict autogenous shrinkage but it may require further in-depth study into this
factor alone before such a postulation can be made. Nevertheless the author
believes this factor has been identified in this work.
8. It is pointed out that the internal drying factor is a function of the chemical
shrinkage and microstructure which are revealed from factors like the empty
pores and total porosity.
9. Whether the pore size distribution is a significant factor affecting the internal
drying factor is worth further study.
The effect of mechanical factors like tensile strength and elastic modulus are not
considered at this stage. However, they could be studied in a future research.
Nevertheless these factors have been investigated in the next chapter which discusses
autogenous shrinkage in concrete specimens.
Chapter 6 – Autogenous shrinkage in cementitious paste systems- Results and Discussion
233
Chapter 7 – Autogenous shrinkage in Concrete Results and Discussion
234
CHAPTER 7 -AUTOGENOUS SHRINKAGE IN CONCRETE –
RESULTS and DISCUSSION
7.1 Introduction
Chapter 6 discussed the autogenous shrinkage in cementitious paste systems. While
studies on paste were necessary for understanding the development of autogenous
shrinkage in the cementitious matrix, studies on concrete would give a much more
realistic representation of the phenomenon.
This Chapter deals primarily with the study of autogenous shrinkage strains in concrete
specimens and is categorised into four parts based on the mixture proportions similar to
those in paste studies.
a) Plain cement concrete mixture
b) Cement - silica fume mixture
c) Cement – fly ash mixture
d) Cement – slag mixtures
7.2 Plain cement concrete mixtures
The study begins with investigating the development of autogenous shrinkage strains in
plain cement concrete mixtures. Three different concrete mixtures at water-cement ratio
of 0.25, 0.32 and 0.38 were cast and are named OPC25, OPC32 and OPC38. Table 7-1
describes the nomenclature used. The details of the mixture proportion and the
quantities are explained in Chapter 3 (Experimental Methods). Subsequent sections will
outline the results of the study with discussions within.
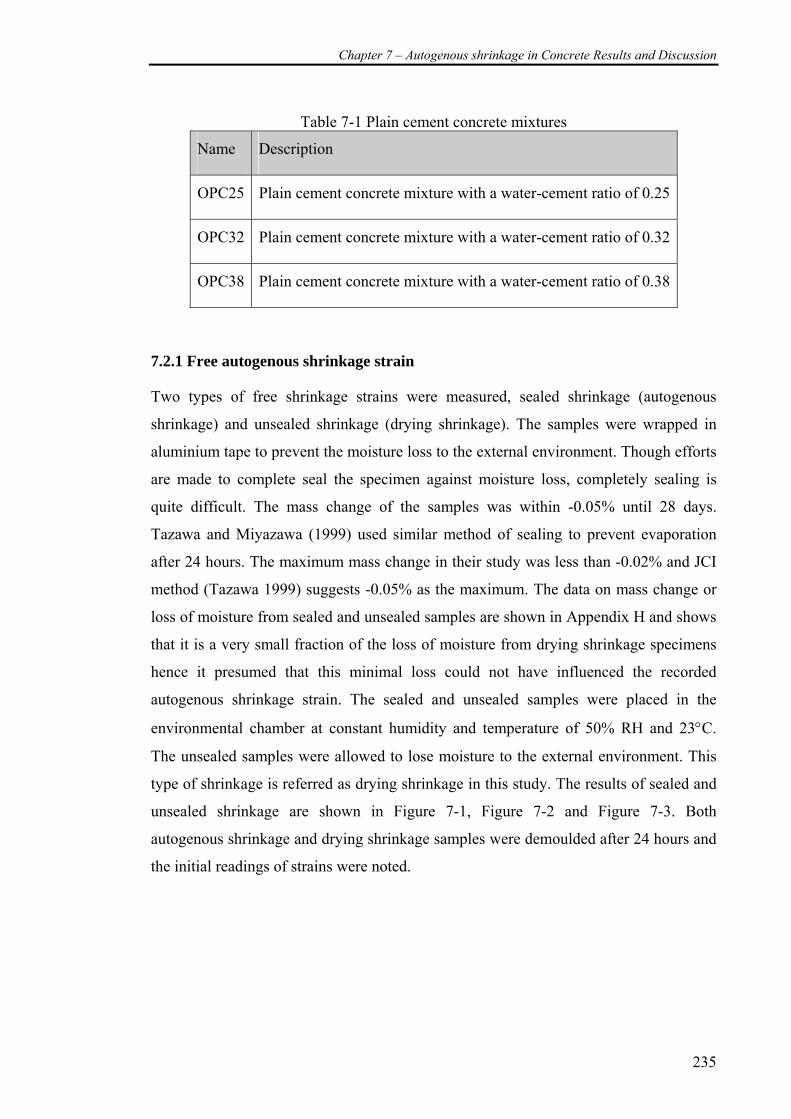
Chapter 7 – Autogenous shrinkage in Concrete Results and Discussion
235
Table 7-1 Plain cement concrete mixtures
Name Description
OPC25 Plain cement concrete mixture with a water-cement ratio of 0.25
OPC32 Plain cement concrete mixture with a water-cement ratio of 0.32
OPC38 Plain cement concrete mixture with a water-cement ratio of 0.38
7.2.1 Free autogenous shrinkage strain
Two types of free shrinkage strains were measured, sealed shrinkage (autogenous
shrinkage) and unsealed shrinkage (drying shrinkage). The samples were wrapped in
aluminium tape to prevent the moisture loss to the external environment. Though efforts
are made to complete seal the specimen against moisture loss, completely sealing is
quite difficult. The mass change of the samples was within -0.05% until 28 days.
Tazawa and Miyazawa (1999) used similar method of sealing to prevent evaporation
after 24 hours. The maximum mass change in their study was less than -0.02% and JCI
method (Tazawa 1999) suggests -0.05% as the maximum. The data on mass change or
loss of moisture from sealed and unsealed samples are shown in Appendix H and shows
that it is a very small fraction of the loss of moisture from drying shrinkage specimens
hence it presumed that this minimal loss could not have influenced the recorded
autogenous shrinkage strain. The sealed and unsealed samples were placed in the
environmental chamber at constant humidity and temperature of 50% RH and 23°C.
The unsealed samples were allowed to lose moisture to the external environment. This
type of shrinkage is referred as drying shrinkage in this study. The results of sealed and
unsealed shrinkage are shown in Figure 7-1, Figure 7-2 and Figure 7-3. Both
autogenous shrinkage and drying shrinkage samples were demoulded after 24 hours and
the initial readings of strains were noted.
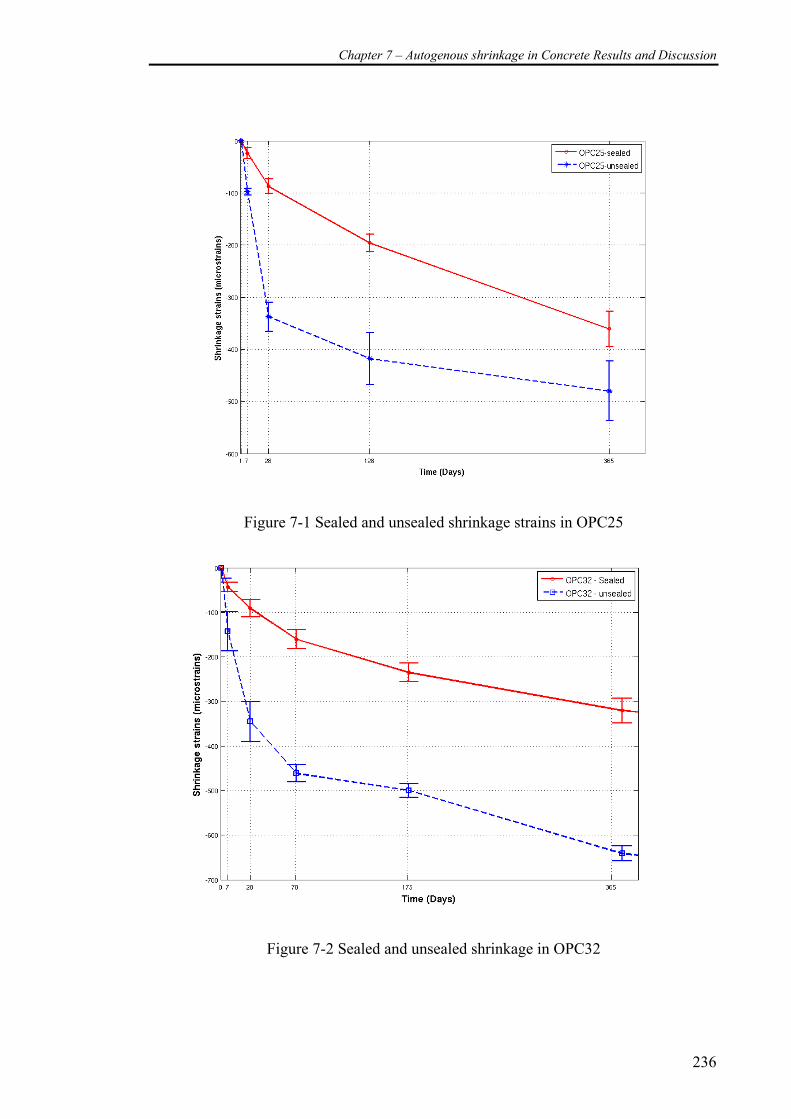
Chapter 7 – Autogenous shrinkage in Concrete Results and Discussion
236
Figure 7-1 Sealed and unsealed shrinkage strains in OPC25
Figure 7-2 Sealed and unsealed shrinkage in OPC32
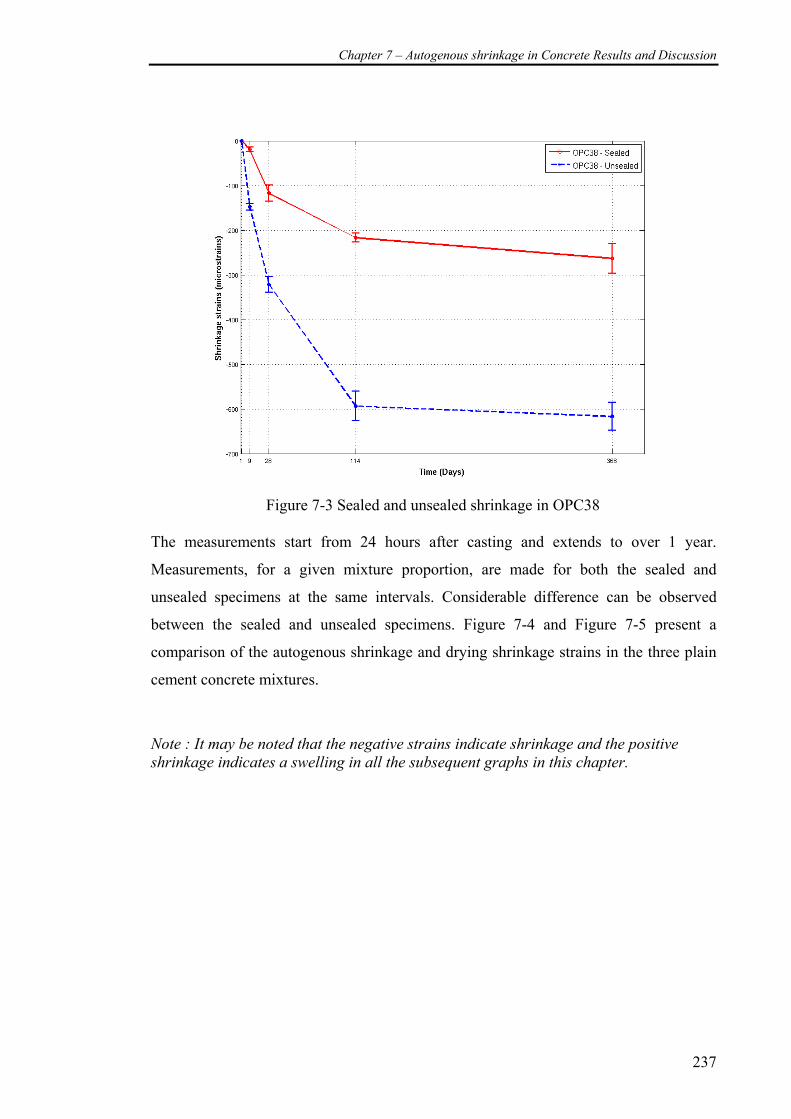
Chapter 7 – Autogenous shrinkage in Concrete Results and Discussion
237
Figure 7-3 Sealed and unsealed shrinkage in OPC38
The measurements start from 24 hours after casting and extends to over 1 year.
Measurements, for a given mixture proportion, are made for both the sealed and
unsealed specimens at the same intervals. Considerable difference can be observed
between the sealed and unsealed specimens. Figure 7-4 and Figure 7-5 present a
comparison of the autogenous shrinkage and drying shrinkage strains in the three plain
cement concrete mixtures.
Note : It may be noted that the negative strains indicate shrinkage and the positive shrinkage indicates a swelling in all the subsequent graphs in this chapter.
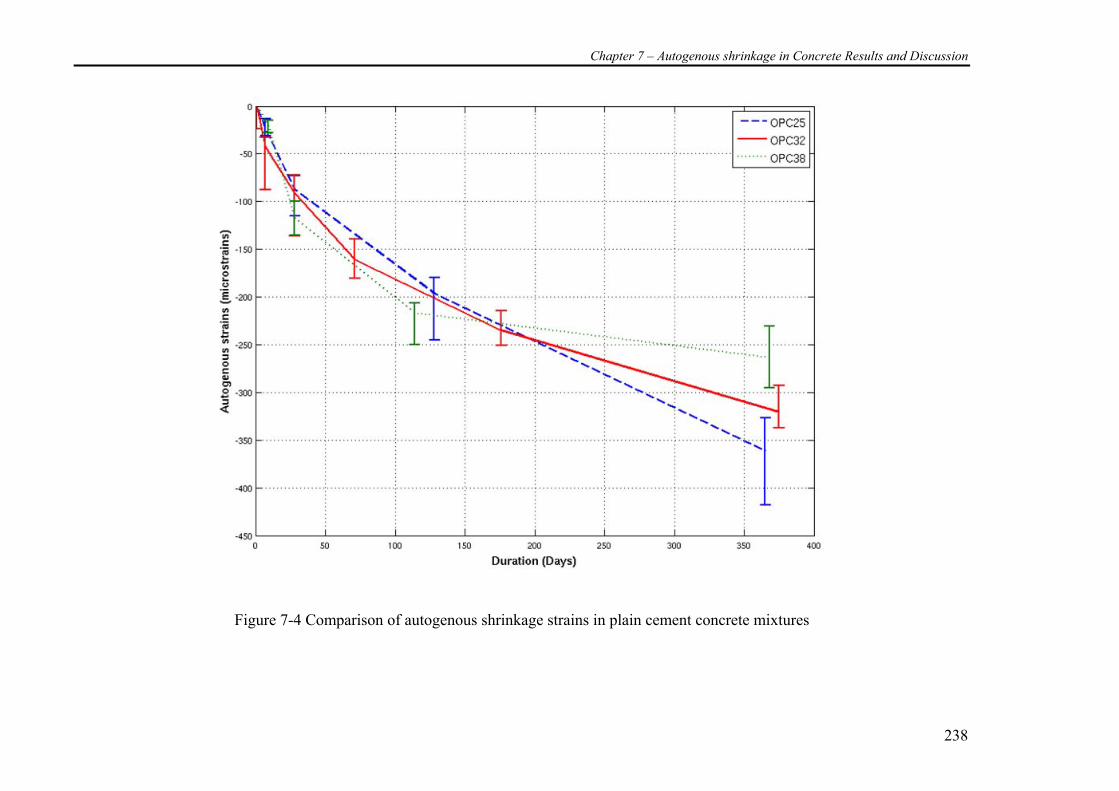
Chapter 7 – Autogenous shrinkage in Concrete Results and Discussion
238
Figure 7-4 Comparison of autogenous shrinkage strains in plain cement concrete mixtures
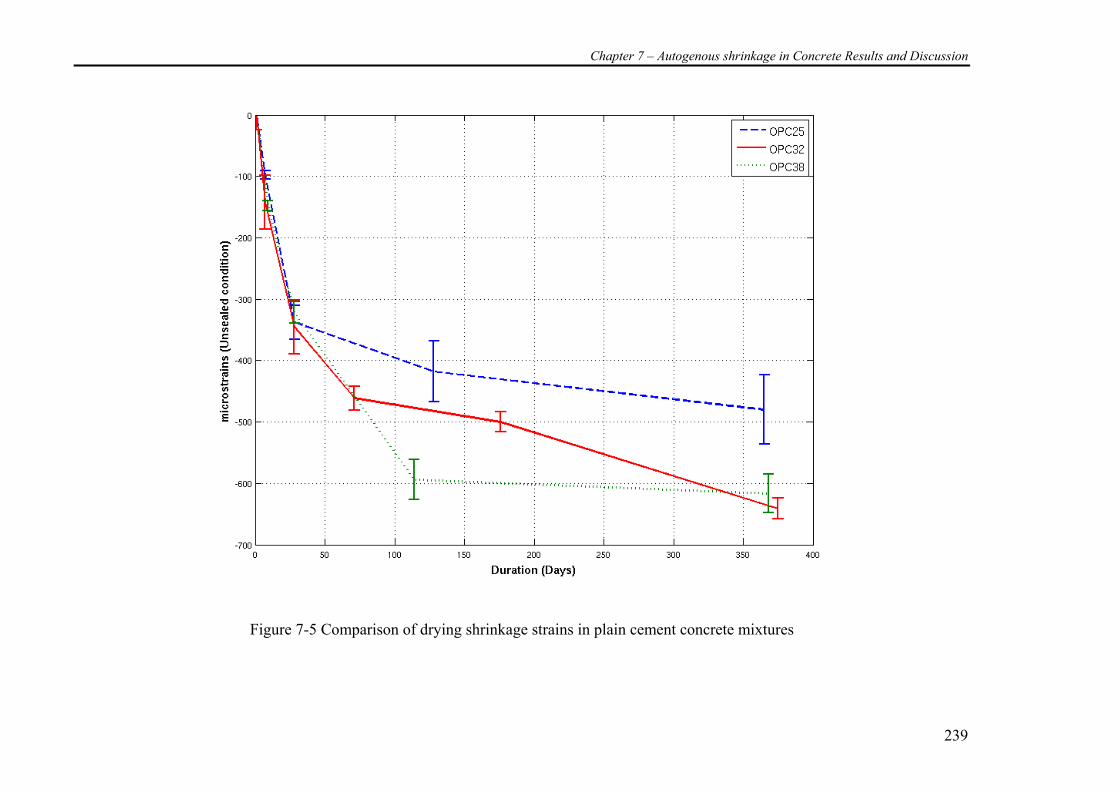
Chapter 7 – Autogenous shrinkage in Concrete Results and Discussion
239
Figure 7-5 Comparison of drying shrinkage strains in plain cement concrete mixtures
Chapter 7 – Autogenous shrinkage in Concrete Results and Discussion
240
Based on the above graphs Figure 7-4 and Figure 7-5 (and keeping in mind the results
obtained for the cements paste as was shown in Figure 6-4 and Figure 6-5) the
following observations are made.
• The autogenous shrinkage at the end of 1 year was highest for OPC25 and
lowest for OPC38.
• The plain cement paste mixtures exhibited highest autogenous shrinkage at the
lowest water-cement ratio at all ages until 90 days. This trend was not evident
with the concrete specimens and in fact at 28 days the concrete with OPC25
exhibiting the lowest autogenous shrinkage strains while OPC38 resulted in the
highest. This is quite contradicting to expected results derived from the literature
(Tazawa 1998; Tazawa and Miyazawa 1999) and those of the cement paste
studies in this research.
• For the shrinkage under unsealed condition and same test environment, OPC38
revealed the highest drying shrinkage OPC25 showing the lowest drying
shrinkage strain values from loss of moisture to external environment.
• Measurements begin from 24 hours of casting and any information on shrinkage
prior to the day of sealing was not available.
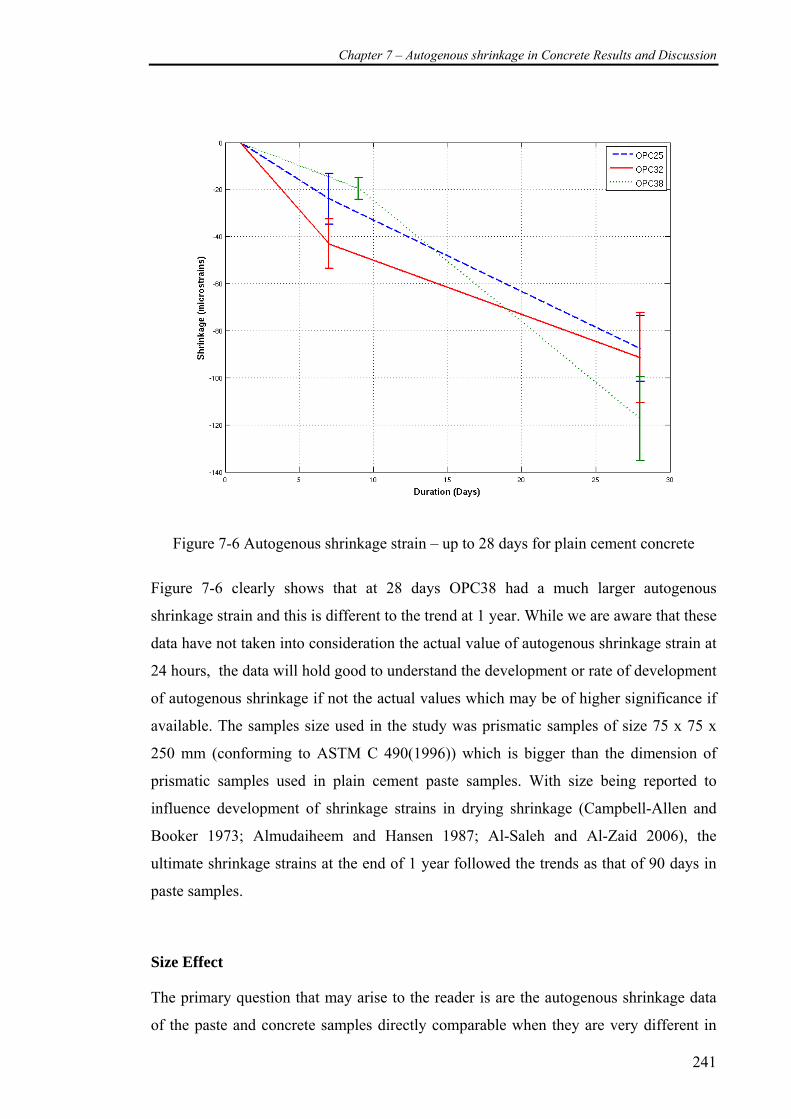
Chapter 7 – Autogenous shrinkage in Concrete Results and Discussion
241
Figure 7-6 Autogenous shrinkage strain – up to 28 days for plain cement concrete
Figure 7-6 clearly shows that at 28 days OPC38 had a much larger autogenous
shrinkage strain and this is different to the trend at 1 year. While we are aware that these
data have not taken into consideration the actual value of autogenous shrinkage strain at
24 hours, the data will hold good to understand the development or rate of development
of autogenous shrinkage if not the actual values which may be of higher significance if
available. The samples size used in the study was prismatic samples of size 75 x 75 x
250 mm (conforming to ASTM C 490(1996)) which is bigger than the dimension of
prismatic samples used in plain cement paste samples. With size being reported to
influence development of shrinkage strains in drying shrinkage (Campbell-Allen and
Booker 1973; Almudaiheem and Hansen 1987; Al-Saleh and Al-Zaid 2006), the
ultimate shrinkage strains at the end of 1 year followed the trends as that of 90 days in
paste samples.
Size Effect
The primary question that may arise to the reader is are the autogenous shrinkage data
of the paste and concrete samples directly comparable when they are very different in
Chapter 7 – Autogenous shrinkage in Concrete Results and Discussion
242
size and shape. In simpler terms, is it possible that the size and shape influenced the data
while measuring autogenous shrinkage? Autogenous shrinkage, in contrast to drying
shrinkage, is an internal drying phenomenon (self desiccation). The size effect is
dominant or reported to have an influence when moisture gradients within the samples
occur and are exposed to an external drying environment. But such a phenomenon does
not happen with autogenous shrinkage strain. In fact the self-desiccation and chemical
shrinkage occur from within and are more volumetric phenomena although
measurements are made in a linear direction due to the limitations of the test methods.
Hence it may be argued that autogenous shrinkage data should not be dependent on the
specimen geometry provided the specimens are completely sealed from the external
environment. Hence using data from plain cement paste studies of the prismatic or
corrugated tubes may be justifiable to interpret the trends if not the absolute values.
Effect of Aggregates
While we attempt to simplify and use paste samples to interpret concrete samples, the
complexity of concrete specimen over a paste specimen cannot be ruled out. The
presence of aggregates within the concrete offers restraint to the free shrinkage of the
paste matrix (Pickett 1956; Hobbs 1974) though we still describe it as the free shrinkage
of the concrete. Table 7-2 shows the aggregate and paste volume proportion in the three
mixture proportions. It is observed that the aggregate volume is higher as the water-
cement ratio is decreased. Also while comparing concrete and paste samples, it has to be
remembered that the actual amount of cement present in a finite volume of paste would
increase with the decrease in water-cement ratio in paste samples, while the actual
cement content remains a constant in the concrete mixtures with the aggregate volume
alone increasing and water content decreasing.
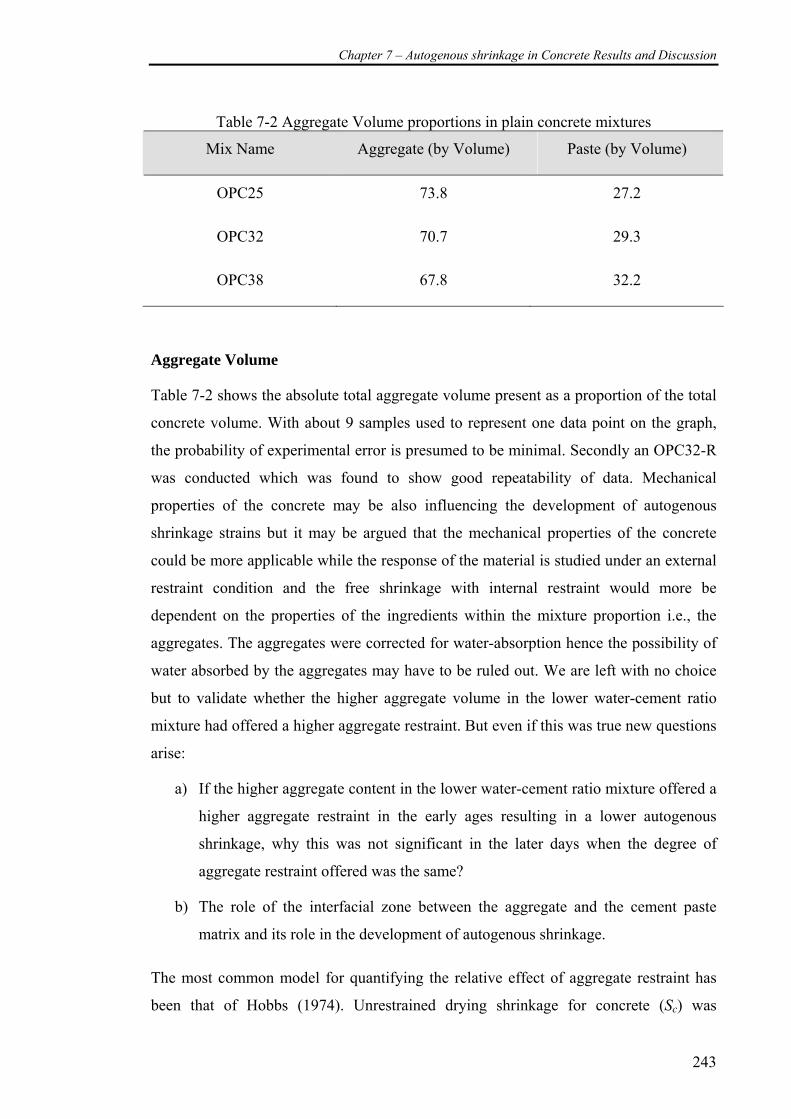
Chapter 7 – Autogenous shrinkage in Concrete Results and Discussion
243
Table 7-2 Aggregate Volume proportions in plain concrete mixtures
Mix Name Aggregate (by Volume) Paste (by Volume)
OPC25 73.8 27.2
OPC32 70.7 29.3
OPC38 67.8 32.2
Aggregate Volume
Table 7-2 shows the absolute total aggregate volume present as a proportion of the total
concrete volume. With about 9 samples used to represent one data point on the graph,
the probability of experimental error is presumed to be minimal. Secondly an OPC32-R
was conducted which was found to show good repeatability of data. Mechanical
properties of the concrete may be also influencing the development of autogenous
shrinkage strains but it may be argued that the mechanical properties of the concrete
could be more applicable while the response of the material is studied under an external
restraint condition and the free shrinkage with internal restraint would more be
dependent on the properties of the ingredients within the mixture proportion i.e., the
aggregates. The aggregates were corrected for water-absorption hence the possibility of
water absorbed by the aggregates may have to be ruled out. We are left with no choice
but to validate whether the higher aggregate volume in the lower water-cement ratio
mixture had offered a higher aggregate restraint. But even if this was true new questions
arise:
a) If the higher aggregate content in the lower water-cement ratio mixture offered a
higher aggregate restraint in the early ages resulting in a lower autogenous
shrinkage, why this was not significant in the later days when the degree of
aggregate restraint offered was the same?
b) The role of the interfacial zone between the aggregate and the cement paste
matrix and its role in the development of autogenous shrinkage.
The most common model for quantifying the relative effect of aggregate restraint has
been that of Hobbs (1974). Unrestrained drying shrinkage for concrete (Sc) was
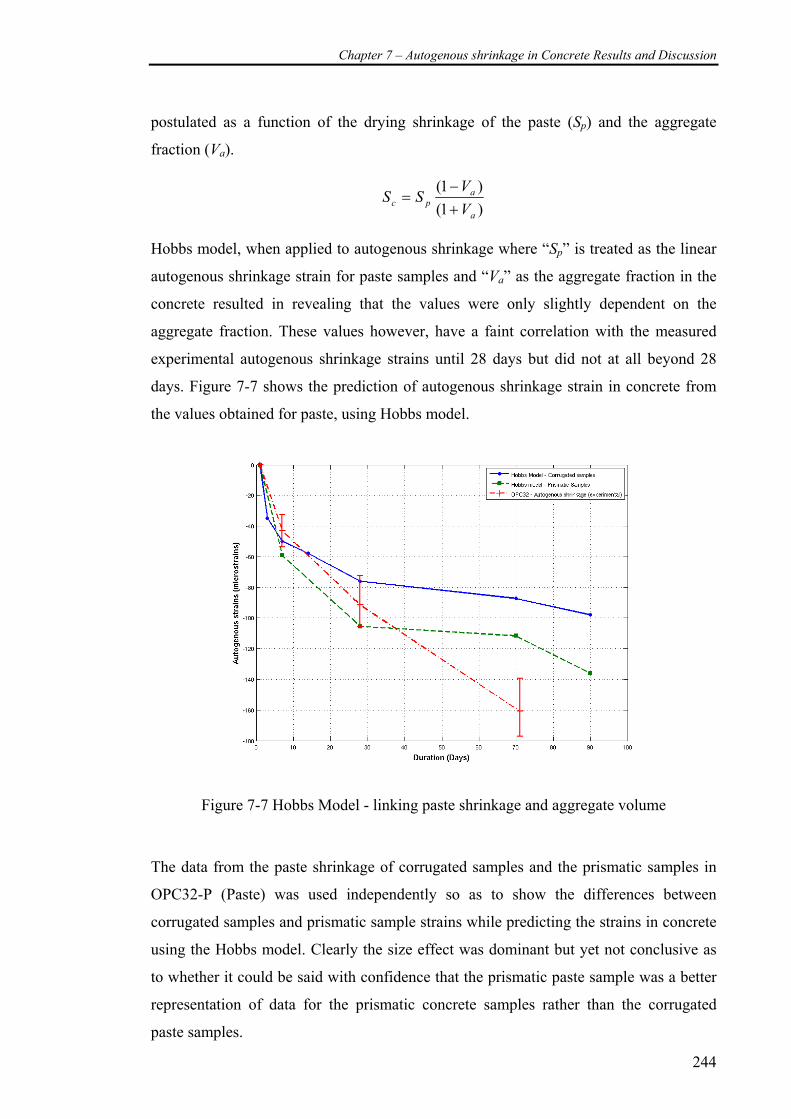
Chapter 7 – Autogenous shrinkage in Concrete Results and Discussion
244
postulated as a function of the drying shrinkage of the paste (Sp) and the aggregate
fraction (Va).
)1()1(
a
apc V
VSS
+−
=
Hobbs model, when applied to autogenous shrinkage where “Sp” is treated as the linear
autogenous shrinkage strain for paste samples and “Va” as the aggregate fraction in the
concrete resulted in revealing that the values were only slightly dependent on the
aggregate fraction. These values however, have a faint correlation with the measured
experimental autogenous shrinkage strains until 28 days but did not at all beyond 28
days. Figure 7-7 shows the prediction of autogenous shrinkage strain in concrete from
the values obtained for paste, using Hobbs model.
Figure 7-7 Hobbs Model - linking paste shrinkage and aggregate volume
The data from the paste shrinkage of corrugated samples and the prismatic samples in
OPC32-P (Paste) was used independently so as to show the differences between
corrugated samples and prismatic sample strains while predicting the strains in concrete
using the Hobbs model. Clearly the size effect was dominant but yet not conclusive as
to whether it could be said with confidence that the prismatic paste sample was a better
representation of data for the prismatic concrete samples rather than the corrugated
paste samples.
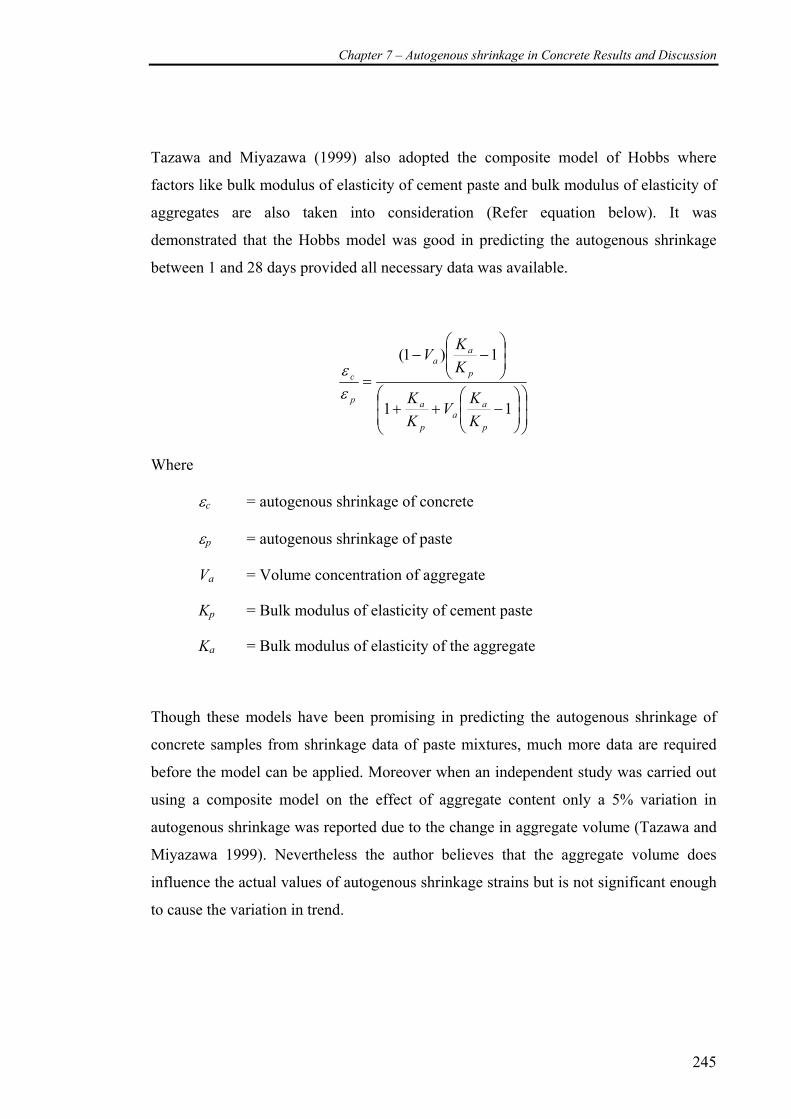
Chapter 7 – Autogenous shrinkage in Concrete Results and Discussion
245
Tazawa and Miyazawa (1999) also adopted the composite model of Hobbs where
factors like bulk modulus of elasticity of cement paste and bulk modulus of elasticity of
aggregates are also taken into consideration (Refer equation below). It was
demonstrated that the Hobbs model was good in predicting the autogenous shrinkage
between 1 and 28 days provided all necessary data was available.
⎟⎟⎠
⎞⎜⎜⎝
⎛⎟⎟⎠
⎞⎜⎜⎝
⎛−++
⎟⎟⎠
⎞⎜⎜⎝
⎛−−
=
11
1)1(
p
aa
p
a
p
aa
p
c
KK
VKK
KK
V
εε
Where
εc = autogenous shrinkage of concrete
εp = autogenous shrinkage of paste
Va = Volume concentration of aggregate
Kp = Bulk modulus of elasticity of cement paste
Ka = Bulk modulus of elasticity of the aggregate
Though these models have been promising in predicting the autogenous shrinkage of
concrete samples from shrinkage data of paste mixtures, much more data are required
before the model can be applied. Moreover when an independent study was carried out
using a composite model on the effect of aggregate content only a 5% variation in
autogenous shrinkage was reported due to the change in aggregate volume (Tazawa and
Miyazawa 1999). Nevertheless the author believes that the aggregate volume does
influence the actual values of autogenous shrinkage strains but is not significant enough
to cause the variation in trend.
Chapter 7 – Autogenous shrinkage in Concrete Results and Discussion
246
Interfacial Transition Zone
While theoretical approaches tend to treat the cement paste and the aggregate as two
separate entities and hence the possibility for a composite model, in reality this is not
exactly true. The Interfacial transition zone and how it could influence the development
of autogenous shrinkage in concrete are not adequately discussed in the literature. The
interface between the aggregate and cement paste is both at times a combination of
chemical and mechanical interlocking (Lawrence 2001). The interfacial transition zone
(ITZ) is believed to be considered the weakest link in the concrete (Neville 1995;
Zheng, Li et al. 2005). Further study may be required for a detailed interpretation if it
influences the variation in data and is recommended for future study by the author.
Compressive Strength
Figure 7-8 shows the development of compressive strength for the plain cement
concrete mixtures after curing. OPC25 exhibits the highest compressive strength
irrespective of time of measurement. The strength gain during the early 28 days was
more rapid for the lower water-cement ratio mixture than that of the higher water-
cement ratio mixtures. The increase in compressive strength beyond 28 days to 1 year
was relatively lower when compared to the strength gain between 1 – 28 days. The
effect of such an accelerated development of compressive strength may be of
importance as the response of free shrinkage of matrix would be dependent on the
mechanical properties of the concrete.
Compressive strength is also crucial from another aspect. Compressive strength is a
function of the gel-space ratio (Powers 1947). The gel-space ratio is the ratio between
the volume of the hydrated cement paste and sum of the volume of hydrated cement
paste and capillary pores (Neville 1995). With ‘r’ representing the gel-space ratio,
Powers demonstrated that the compressive strength of concrete was a function of the
cubic power of the gel-space. In simpler terms, if gel-space ratio increases so does the
compressive strength. The higher the values of gel-space ratio, the lower the amount of
capillary pores. This would mean that the pore size distribution shifts towards the lower
diameter range with the progress of hydration. Hence it may be interpreted that the gel-
space ratio together with the water-content present in the system influence the value of
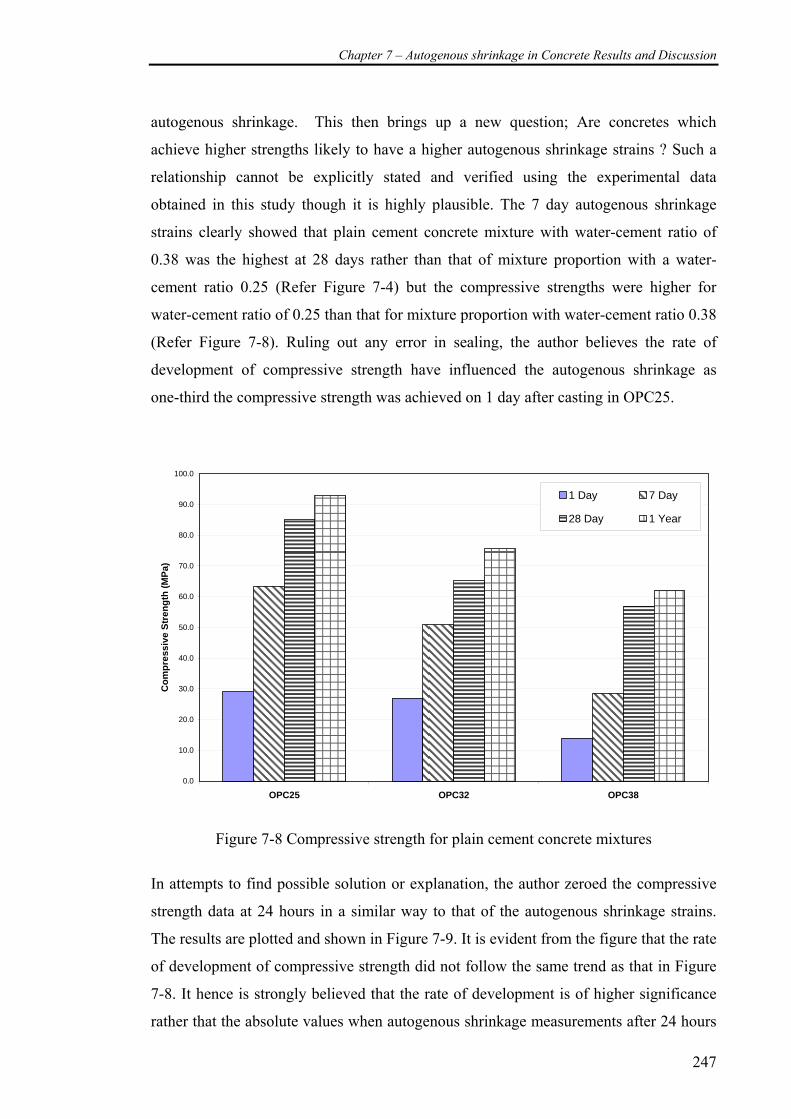
Chapter 7 – Autogenous shrinkage in Concrete Results and Discussion
247
autogenous shrinkage. This then brings up a new question; Are concretes which
achieve higher strengths likely to have a higher autogenous shrinkage strains ? Such a
relationship cannot be explicitly stated and verified using the experimental data
obtained in this study though it is highly plausible. The 7 day autogenous shrinkage
strains clearly showed that plain cement concrete mixture with water-cement ratio of
0.38 was the highest at 28 days rather than that of mixture proportion with a water-
cement ratio 0.25 (Refer Figure 7-4) but the compressive strengths were higher for
water-cement ratio of 0.25 than that for mixture proportion with water-cement ratio 0.38
(Refer Figure 7-8). Ruling out any error in sealing, the author believes the rate of
development of compressive strength have influenced the autogenous shrinkage as
one-third the compressive strength was achieved on 1 day after casting in OPC25.
0.0
10.0
20.0
30.0
40.0
50.0
60.0
70.0
80.0
90.0
100.0
OPC25 OPC32 OPC38
Com
pres
sive
Str
engt
h (M
Pa)
1 Day 7 Day
28 Day 1 Year
Figure 7-8 Compressive strength for plain cement concrete mixtures
In attempts to find possible solution or explanation, the author zeroed the compressive
strength data at 24 hours in a similar way to that of the autogenous shrinkage strains.
The results are plotted and shown in Figure 7-9. It is evident from the figure that the rate
of development of compressive strength did not follow the same trend as that in Figure
7-8. It hence is strongly believed that the rate of development is of higher significance
rather that the absolute values when autogenous shrinkage measurements after 24 hours
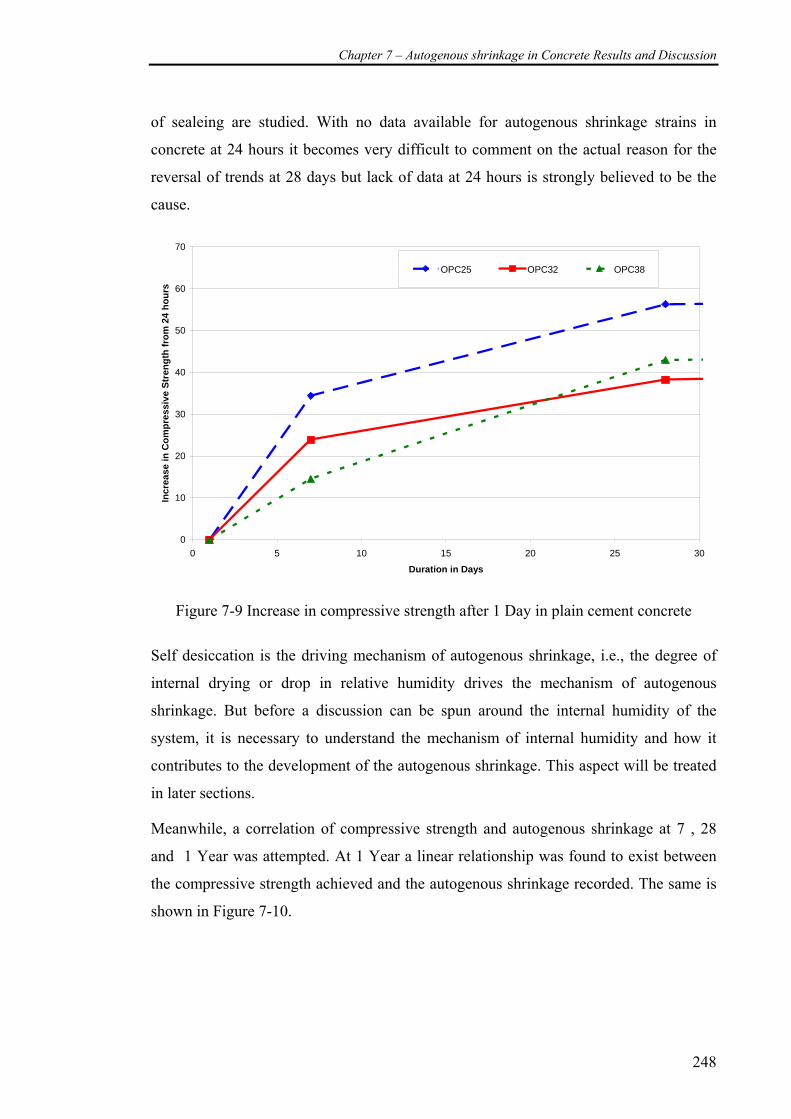
Chapter 7 – Autogenous shrinkage in Concrete Results and Discussion
248
of sealeing are studied. With no data available for autogenous shrinkage strains in
concrete at 24 hours it becomes very difficult to comment on the actual reason for the
reversal of trends at 28 days but lack of data at 24 hours is strongly believed to be the
cause.
0
10
20
30
40
50
60
70
0 5 10 15 20 25 30
Duration in Days
Incr
ease
in C
ompr
essi
ve S
tren
gth
from
24
hour
s
OPC25 OPC32 OPC38
Figure 7-9 Increase in compressive strength after 1 Day in plain cement concrete
Self desiccation is the driving mechanism of autogenous shrinkage, i.e., the degree of
internal drying or drop in relative humidity drives the mechanism of autogenous
shrinkage. But before a discussion can be spun around the internal humidity of the
system, it is necessary to understand the mechanism of internal humidity and how it
contributes to the development of the autogenous shrinkage. This aspect will be treated
in later sections.
Meanwhile, a correlation of compressive strength and autogenous shrinkage at 7 , 28
and 1 Year was attempted. At 1 Year a linear relationship was found to exist between
the compressive strength achieved and the autogenous shrinkage recorded. The same is
shown in Figure 7-10.
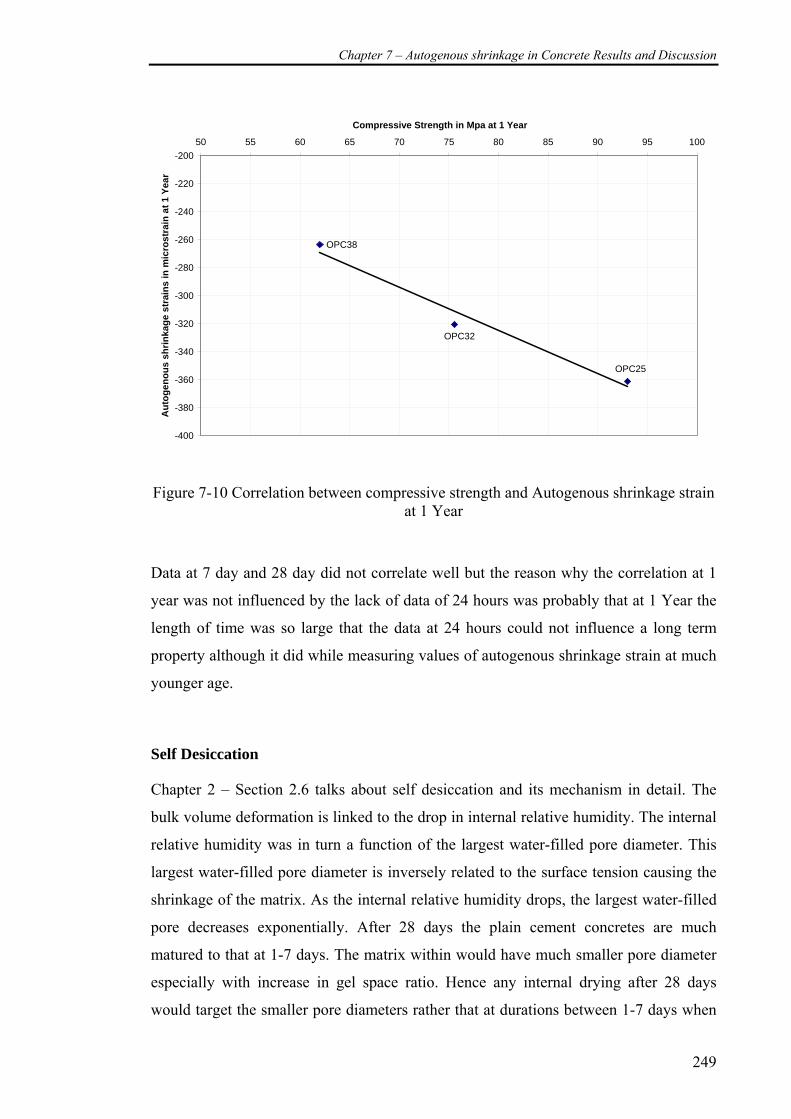
Chapter 7 – Autogenous shrinkage in Concrete Results and Discussion
249
OPC25
OPC32
OPC38
-400
-380
-360
-340
-320
-300
-280
-260
-240
-220
-20050 55 60 65 70 75 80 85 90 95 100
Compressive Strength in Mpa at 1 Year
Aut
ogen
ous
shrin
kage
str
ains
in m
icro
stra
in a
t 1 Y
ear
Figure 7-10 Correlation between compressive strength and Autogenous shrinkage strain at 1 Year
Data at 7 day and 28 day did not correlate well but the reason why the correlation at 1
year was not influenced by the lack of data of 24 hours was probably that at 1 Year the
length of time was so large that the data at 24 hours could not influence a long term
property although it did while measuring values of autogenous shrinkage strain at much
younger age.
Self Desiccation
Chapter 2 – Section 2.6 talks about self desiccation and its mechanism in detail. The
bulk volume deformation is linked to the drop in internal relative humidity. The internal
relative humidity was in turn a function of the largest water-filled pore diameter. This
largest water-filled pore diameter is inversely related to the surface tension causing the
shrinkage of the matrix. As the internal relative humidity drops, the largest water-filled
pore decreases exponentially. After 28 days the plain cement concretes are much
matured to that at 1-7 days. The matrix within would have much smaller pore diameter
especially with increase in gel space ratio. Hence any internal drying after 28 days
would target the smaller pore diameters rather that at durations between 1-7 days when
Chapter 7 – Autogenous shrinkage in Concrete Results and Discussion
250
concrete is not completely mature. Hence though self desiccation occurs from early
ages, it influences the bulk volume change may be more dominant in mature concretes
with lower porosity and smaller pore size distribution. This is further explained
elaborately below.
Chemical shrinkage
In Chapter 5 and Chapter 6 we dealt with the various factors causing chemical shrinkage
and how it could influence the development of autogenous shrinkage strain in paste
samples. Chemical shrinkage was demonstrated to be vital and have influenced the
development of autogenous shrinkage strains. It may be recollected that in the plain
cement paste mixtures, at any instant of time as the water-cement ratio decreased the
chemical shrinkage also decreased. The development of chemical shrinkage in paste
matrix of the concrete specimens may be assumed to be similar to that in the plain
cement paste mixtures. Hence it is acceptable to state that the chemical shrinkage will
be lower for the total concrete as the water-cement ratio is decreased. Unlike pastes in
concrete there is constant cement content in spite of change in water-cement ratio.
Hence could it be that lowering the water-cement ratio, resulted in less chemical
shrinkage and hence lower autogenous shrinkage at least for a duration 1 -7 days when
the total porosity is relatively higher than that of the matured concrete. This is quite
confusing and using internal drying factor would be an easier and direct approach to
correlate with the autogenous shrinkage strain.
Porosity and Pore size distribution
Numerous studies on pore size distribution of neat cement paste samples have been
done (Odler, Yudenfreund et al. 1972; Durekovic 1995) however, there is only limited
research on the difference in porosity of neat cement paste and hydrated cement in
concrete(Neville 1995). There is evidence that the pore structure of the hydrated cement
in the concrete samples is different to that of the plain cement paste of the same degree
of hydration (Winslow and Liu 1990). In concrete, as the water-cement ratio decreased
the total porosity would decrease at any given time or degree of hydration when
compared to the mixture with higher water-cement ratio. Also with higher strengths
achieved for lower water-cement ratio mixtures at a given time, when compared to the
Chapter 7 – Autogenous shrinkage in Concrete Results and Discussion
251
concretes with higher water-cement ratio, it is more likely that the lower water-cement
ratio mixtures have finer pore size distribution when compared to that of the higher
water-cement ratio as “...at a given porosity, smaller pores lead to a higher strength of
the cement paste (Neville 1995)”. Now with lower porosity and finer pore size
distribution present during the progress of hydration, the chances of self desiccation are
higher. Hence this explains the high autogenous shrinkage strain in OPC25 at the end of
1 year and the internal drying factor to be higher. Yet no evidence is available for the
reversed trend until 28 days other than zeroing at 24 hours which could have resulted in
masking the effect during early age measurements. Further to this postulation is to say
that beyond 28 days, the effect of the first 24 hours become too insignificant to change
the averall trend. While the literature shows that porosity and pore size distribution are
correlated well with strengths of the matrix, another interesting aspect or role would be
the effect of porosity and pore size distribution on the moisture movement within the
sample. As hydration proceeds and water within the concrete is consumed by the
cement resulting in self desiccation or internal drying, movement of water within the
matrix also has to be considered as to the development of self desiccation within the
matrix. The movement of water within the matrix may be influenced by the size of the
pore i.e., whether it is a capillary pore or a gel pore. Capillary pores are in the range of
10 nm to 10μm while gel pores range from 0.5nm to 4nm (Yaman, Hearn et al. 2002).
Gel pores at a size just larger than the size of the water molecule have a higher affinity
to water and removal or movement of this water is quite difficult (Ramachandran,
Feldman et al. 1981). Hence the capillary pores play a much more crucial role. As the
internal drying proceeds, first the removal or consumption of capillary water will occur.
For removal of gel pores a much higher internal drying will have to occur before it can
be removed. This range is quite low and RH change due to self desiccation does not
reach this range. Hence the range of pore sizes and pore size distribution of the capillary
pores are more crucial that the gel pores themselves. As the water-cement ratio
decreases it is quite obvious that the concrete with the lowest water-cement ratio at the
end of 1 year has the lowest water content, the lower porosity and smaller pore size
distribution. If we had been sufficiently able to cure the sample, we would have lower
porosity and pore size distribution. The internal free water content would have been
higher but with capillary pores being discontinuous in high strength concretes this
curing may not effective to reduce autogenous shrinkage. This is one strong reason why
research into saturated lightweight aggregates for mitigation of autogenous shrinkage
Chapter 7 – Autogenous shrinkage in Concrete Results and Discussion
252
has progressed (Bentur, Igarashi et al. 2001; Kovler, Souslikov et al. 2004; Ding, Tian
et al. 2005; Lura 2005).
7.2.2 Unsealed shrinkage strains
The unsealed shrinkage strain (drying shrinkage) was measured in an attempt to bring
out the importance of autogenous shrinkage and demonstrate that the sealing of
specimens with no or minimal moisture resulted in a considerable amount of shrinkage
when compared to drying shrinkage. The results on the unsealed shrinkage strains are
presented in Figure 7-5.
The reader may ask, “Does the unsealed shrinkage strain involve a component of
autogenous shrinkage as well?” The answer to this question may be both a Yes and a
No. In reality when the sample is not sealed, there is a higher possibility that self
desiccation cannot occur. For the occurrence of self desiccation moisture movement to
and from the specimen should be prevented. The drying shrinkage samples are open to
the external environment. This leads the shrinkage to be more driven by the external
humidity and loss of moisture to the external environment rather than self desiccation
from within. However, this does not mean that the sample does not experience any
internal autogenous shrinkage. The autogenous shrinkage is dormant and is not active
until the specimen is inhibited from exchanging moisture from within. Though localised
autogenous shrinkage strains may exist within the sample which may serve to be a part
of this observed drying shrinkage separating it would be near impossible. Hence we
could state that under unsealed shrinkage the mechanism driving the shrinkage is mostly
drying shrinkage and is the dominant one.
The study on unsealed shrinkage revealed that the lower the water-cement ratio the
lower the drying shrinkage. This effect is a clear evidence of drying shrinkage where
higher loss of moisture from higher water-cement ratio mixtures resulted in higher
values of shrinkage.. The mass loss in unsealed specimens is shown in Appendix I.
Chapter 7 – Autogenous shrinkage in Concrete Results and Discussion
253
7.2.3 Summary
It is believed from this study this experimental study that, the autogenous shrinkage is
higher for lower water-cement ratio after sufficient hydration has progressed or after 28
days (for samples sealed at 1 day). But when measurements are taken immediately after
sealing and at shorter periods, there is likelihood that zeroing the strains at 24 hours has
masked the trend. Yet it is highly likely that if measurements commenced from the time
of setting if not immediately after casting the autogenous shrinkage is going to be higher
for lower water-cement ratio irrespective of the time of measurement after setting. The
strong correlation of compressive strength to autogenous shrinkage at 1 year makes the
author believe that that concretes with higher strength are expected to experience larger
autogenous shrinkage.
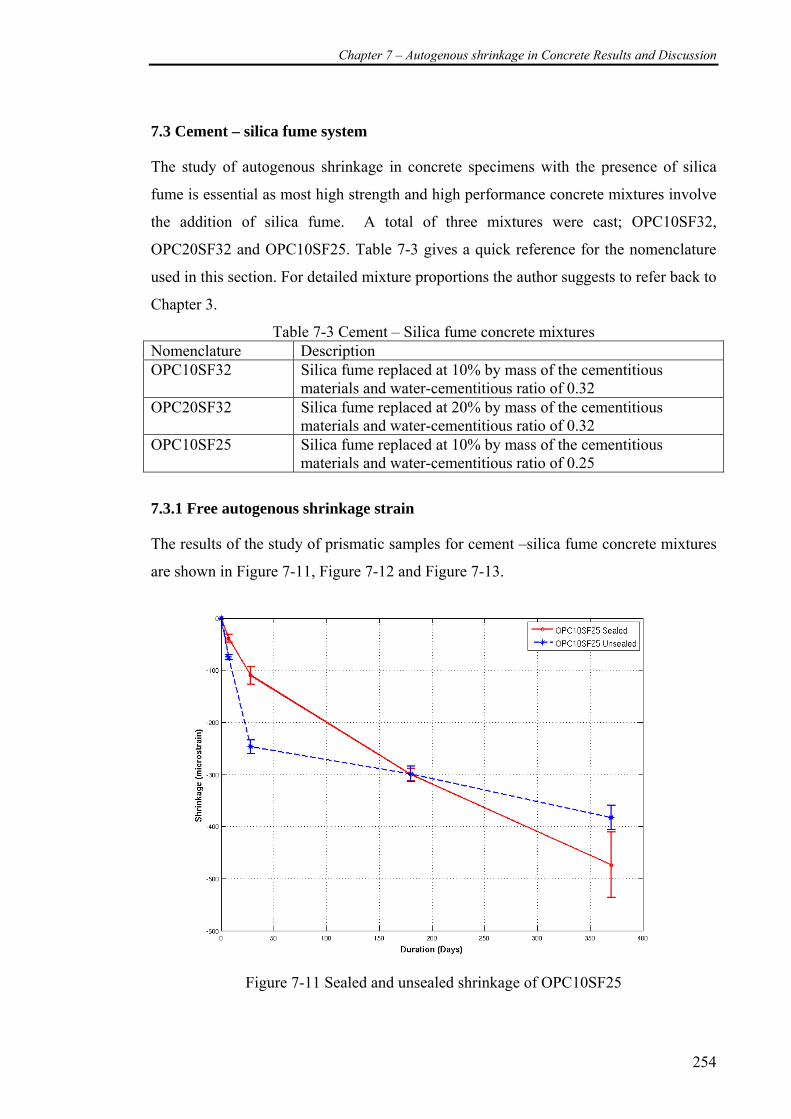
Chapter 7 – Autogenous shrinkage in Concrete Results and Discussion
254
7.3 Cement – silica fume system
The study of autogenous shrinkage in concrete specimens with the presence of silica
fume is essential as most high strength and high performance concrete mixtures involve
the addition of silica fume. A total of three mixtures were cast; OPC10SF32,
OPC20SF32 and OPC10SF25. Table 7-3 gives a quick reference for the nomenclature
used in this section. For detailed mixture proportions the author suggests to refer back to
Chapter 3.
Table 7-3 Cement – Silica fume concrete mixtures Nomenclature Description OPC10SF32 Silica fume replaced at 10% by mass of the cementitious
materials and water-cementitious ratio of 0.32 OPC20SF32 Silica fume replaced at 20% by mass of the cementitious
materials and water-cementitious ratio of 0.32 OPC10SF25 Silica fume replaced at 10% by mass of the cementitious
materials and water-cementitious ratio of 0.25
7.3.1 Free autogenous shrinkage strain
The results of the study of prismatic samples for cement –silica fume concrete mixtures
are shown in Figure 7-11, Figure 7-12 and Figure 7-13.
Figure 7-11 Sealed and unsealed shrinkage of OPC10SF25
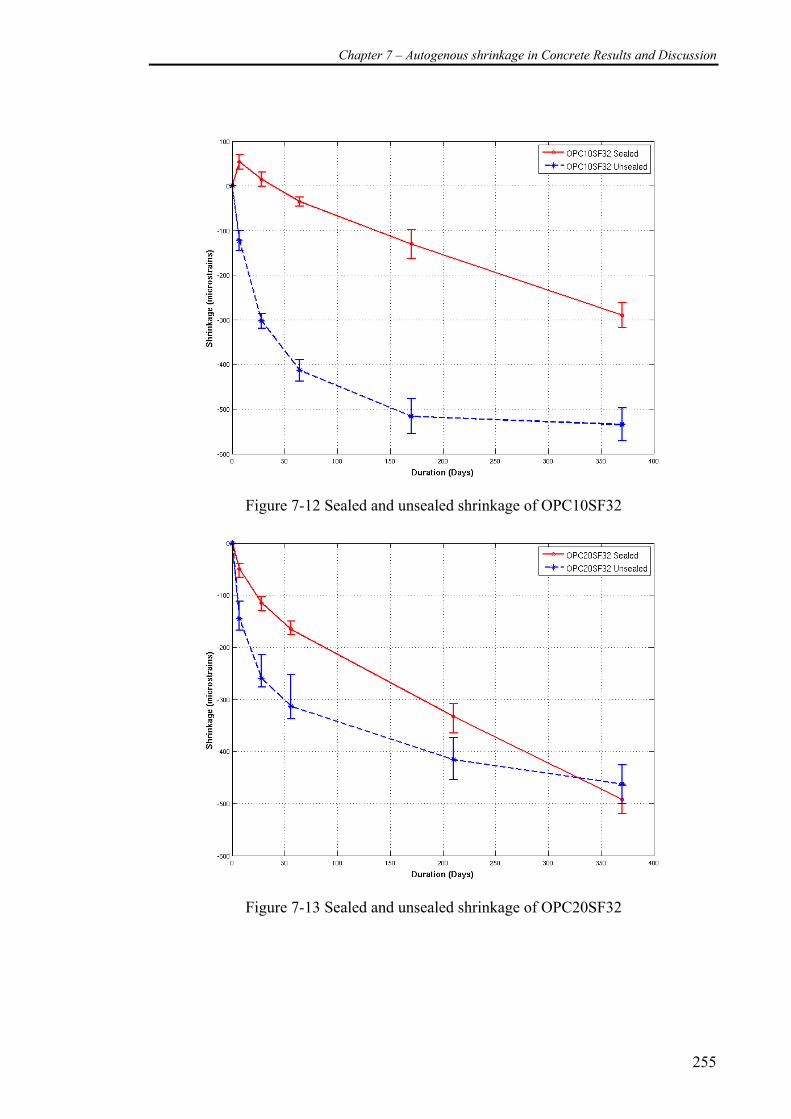
Chapter 7 – Autogenous shrinkage in Concrete Results and Discussion
255
Figure 7-12 Sealed and unsealed shrinkage of OPC10SF32
Figure 7-13 Sealed and unsealed shrinkage of OPC20SF32

Chapter 7 – Autogenous shrinkage in Concrete Results and Discussion
256
Figure 7-14 Comparison of autogenous shrinkage strains of cement-silica fume systems
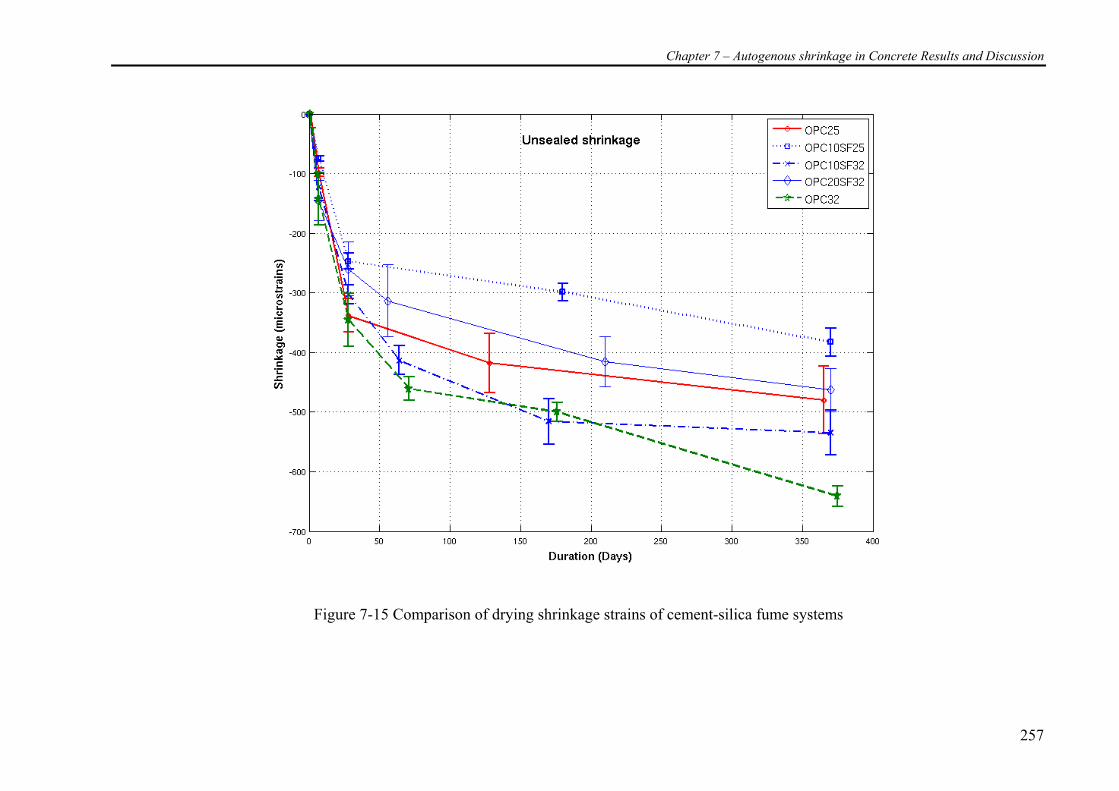
Chapter 7 – Autogenous shrinkage in Concrete Results and Discussion
257
Figure 7-15 Comparison of drying shrinkage strains of cement-silica fume systems
Chapter 7 – Autogenous shrinkage in Concrete Results and Discussion
258
Based on the above graphs of Figure 7-14 and Figure 7-15, the following observations
or inferences are made.
A critical examination of these results and analysis of the results are drawn in the
following sections below.
Observations
• Figure 7-14 shows that under sealed conditions, 20% replacement of silica fume
at a water-cementitious ratio of 0.32 and 10% replacement of silica fume at a
water-cementitious ratio of 0.25 showed the highest autogenous shrinkage
strains.
• While 10% replacement of silica fume at a water-cementitious ratio of 0.32
showed lower autogenous shrinkage strains than OPC32, it may not be
interpreted that silica fume at 10% replacement may cause lower autogenous
shrinkage. This decrease was solely the result of the expansion observed at 7
days. The amount of shrinkage that occurred post the 7 days period in
OPC10SF32 was in fact higher than the OPC32.
• At 1 year in OPC10SF25 and OPC20SF32, the strains under sealed conditions
were higher than that observed under unsealed conditions.
• In all mixes the 28 day strain values recorded were less than 50% of the 1 year
strain values. This shows considerable autogenous shrinkage strain development
beyond 28 day period. (Note : It may be remembered that the strains were
recorded beginning 24 hours from addition of water to the cementitious mixture)
• Figure 7-15 reveals that under unsealed conditions, OPC32 showed the highest
amount of drying shrinkage strains and the lowest was that of OPC10SF25.
Work by other researchers
An increase in autogenous shrinkage due to the addition of silica fume has been
reported for water-cementitious ratio of 0.25 – 0.4 though a decreasing trend in
autogenous shrinkage in cement-silica fume concretes was observed as the water-
cementitious ratio was increased (Yang and Zhang 2004). In alternative to prismatic
specimens Brooks et al (1999) used cylindrical specimens and measurements were
recorded after 24 hours. They observed that higher replacements of silica fume did
result in higher autogenous shrinkage at the age of 90 days but 10 % replacement of
Chapter 7 – Autogenous shrinkage in Concrete Results and Discussion
259
silica fume at 0.23 water-cementitious ratio did not exhibit a higher autogenous
shrinkage strain than that of plain cement concrete mixture during the entire duration of
the test. Mak et al (1999) also observed that in the presence of silica fume for the same
water-cementitious ratio the autogenous shrinkage was higher when compared to plain
cement concrete mixtures. Saje et al (2001) postulated that the primary cause for the
increased autogenous shrinkage strain with the addition of silica fume was the finer
pores formed due to the pozzolanic hydration. This aspect in elaborated at a later part of
this section. Zhang et al (2003) studied autogenous shrinkage for a duration of 90 days
at replacements of 5% and 10% at water-cementitious ratio of 0.26, 0.30 and 0.35. This
was very similar to the study by the author in this study. But Zhang et al also had the
opportunity to measure the autogenous shrinkage strain until the early age of 1 day.
They also concluded that under a measurement period of ~90 days, most of the
shrinkage (~60%) occurred as early as 2 weeks.
Most researchers demonstrated that silica fume addition increased the autogenous
shrinkage. In this study, similar trends were observed except for OPC10SF32 where a
slight expansion in the concrete was observed at 7 days to be later followed by
shrinkage.
Comparison to autogenous shrinkage in paste samples
Before any interpretations are made, we need to begin by recalling the autogenous
shrinkage measurements in paste samples. It was observed that in the measurements
with prismatic samples the cement-silica fume paste system at a water-cementitious
ratio of 0.32 did not show higher autogenous shrinkage strain at 7 day period but had a
later acceleration resulting in a higher autogenous shrinkage strain at 28 and 90 day
period. This effect was also evident in the corrugated tube if the shrinkage strains were
zeroed at the beginning of 24 hours after casting. But if absolute values of autogenous
shrinkage was measured from the early hours (~1.5 hours after mixing) this trend cannot
be evident due to the high autogenous shrinkage strain values obtained until the time of
set. The autogenous shrinkage was as high as ~900 microstrains at 90 days in the
cement-silica fume paste system. But in concrete, the maximum value obtained at 20%
replacement by silica fume, was in the order of ~200 microstrains at about 90 days and
Chapter 7 – Autogenous shrinkage in Concrete Results and Discussion
260
~500 microstrains at 1 year. It can be observed that the aggregate played a major part in
offering internal restraint to the free shrinkage of the cementitious paste system.
Role of silica fume in autogenous shrinkage
Most theories on autogenous shrinkage are spun around chemical shrinkage and self
desiccation(Lura, Jensen et al. 2003; Bentz and Jensen 2004). When addressing
chemical shrinkage and self desiccation, the author will discuss the effect of silica fume
on these properties in specific. Experimental evidence from earlier figures reveal that
silica fume addition brought resulted in higher autogenous shrinkage strain when
compared to its reference plain cement concrete mixture. The reasons contributing to
this effect are explained further in detail.
Chemical shrinkage
As observed and reported in Chapter 5, the system with silica fume has a higher rate of
chemical shrinkage. Two primary factors are the cause for this higher chemical
shrinkage.
1. A higher volume change associated with the pozzolanic reaction of silica
and calcium hydroxide.
2. The higher fineness of the silica fume particles contribute to higher
reactivity and becomes an active part of the early hydration in the
cementitious system
Hence, as silica fume begins to react readily with the available CH, water is consumed
at a higher rate than that of the plain cement concrete. In addition the higher volume
change associated with the pozzolanic reaction results in larger chemical shrinkage and
hence a higher likelihood to encounter empty pores (which contribute to self
desiccation). This higher chemical shrinkage is the first process which triggers the
chances of a higher self desiccation (i.e., drop in internal relative humidity). The higher
the amount of silica fume the higher the probability of chemical shrinkage.
Chapter 7 – Autogenous shrinkage in Concrete Results and Discussion
261
The Pozzolanic reaction
Silica fume is highly reactive pozzolanic material which reacts with the Ca(OH)2
released from the hydration of cement. Silica fume possesses a much higher surface area
than Portland cement. It is highly reactive and readily begins to take part in the
pozzolanic reaction. Unlike fly ash, addition of silica fume kicks in the pozzolanic
reaction at a much earlier stage. The significance of earlier pozzolanic activity means
1. Higher autogenous shrinkage should be exhibited at earlier stages when
the silica fume is actively involved with the hydration process
2. At later durations, the rate of development of autogenous shrinkage
should not be dominant over that at early ages.
This was not quite evident in this study as shrinkage strains at 90 days only contributed
to less than 50% of the strains achieved at 1 year. Hence obviously there are other
factors other than the higher reactivity of the silica fume and the pozzolanic reaction
contributing to the development of autogenous shrinkage strain.
Self desiccation
Self desiccation or the drop in relative humidity which is the primary theories of
autogenous shrinkage is greatly increased as chemical shrinkage increases. But in
addition to higher reactivity and fineness contributing to the increased chemical
shrinkage, the pozzolanic reaction has a higher consumption of water during the
progress of hydration (refer to Appendix 5-A for Volume stoichiometry of silica fume
and CH reactions). For every 1 gram of silica reacting with CH about 0.85 gram of
water was consumed with a resulting –0.2022 ml of chemical shrinkage per gram of
silica reacted. Thus the free water within the system would drop rapidly as hydration
proceeds. This would mean that with the progress of hydration of the silica fume; larger
amount of water is consumed, in the contrast with the case when cement only was
present. With a higher replacement of silica fume this trend is more likely to increase
resulting in increased self-desiccation. A higher rate of consumption of water is one
primary cause of self desiccation. But for internal humidity to drop the reduction in free
water alone is not sufficient. The porosity and pore size distribution also plays a crucial
role. In addition at a lower water-cementitious ratio there is a lower free water content
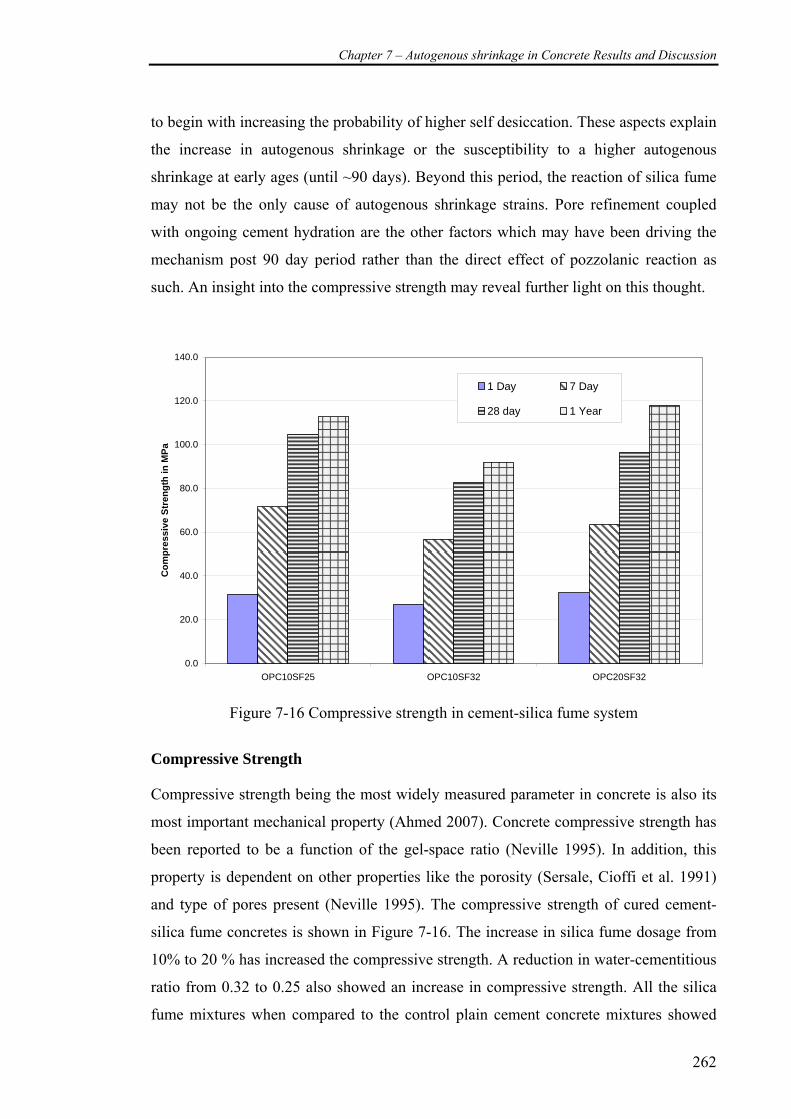
Chapter 7 – Autogenous shrinkage in Concrete Results and Discussion
262
to begin with increasing the probability of higher self desiccation. These aspects explain
the increase in autogenous shrinkage or the susceptibility to a higher autogenous
shrinkage at early ages (until ~90 days). Beyond this period, the reaction of silica fume
may not be the only cause of autogenous shrinkage strains. Pore refinement coupled
with ongoing cement hydration are the other factors which may have been driving the
mechanism post 90 day period rather than the direct effect of pozzolanic reaction as
such. An insight into the compressive strength may reveal further light on this thought.
0.0
20.0
40.0
60.0
80.0
100.0
120.0
140.0
OPC10SF25 OPC10SF32 OPC20SF32
Com
pres
sive
Str
engt
h in
MPa
1 Day 7 Day
28 day 1 Year
Figure 7-16 Compressive strength in cement-silica fume system
Compressive Strength
Compressive strength being the most widely measured parameter in concrete is also its
most important mechanical property (Ahmed 2007). Concrete compressive strength has
been reported to be a function of the gel-space ratio (Neville 1995). In addition, this
property is dependent on other properties like the porosity (Sersale, Cioffi et al. 1991)
and type of pores present (Neville 1995). The compressive strength of cured cement-
silica fume concretes is shown in Figure 7-16. The increase in silica fume dosage from
10% to 20 % has increased the compressive strength. A reduction in water-cementitious
ratio from 0.32 to 0.25 also showed an increase in compressive strength. All the silica
fume mixtures when compared to the control plain cement concrete mixtures showed
Chapter 7 – Autogenous shrinkage in Concrete Results and Discussion
263
higher values of compressive strength at all ages. The 28 days compressive strength
contributed to about ~80% of the 1 year compressive strength data for all replacements
of silica fume. Yet more than 50% increase in autogenous shrinkage was evident
between 28 days and 1 year. With most silica fume reactivity to occur at ages less than
28 days, the pozzolanic activity of silica fume cannot dictate the development of
autogenous shrinkage after 28 days. The author believes the property of “pore
refinement” may be an answer to the above issue of autogenous shrinkage development
without much increase in compressive strength. The total pore volume may remain a
constant and there is a shift in the pore size distribution from larger size pores to smaller
pores(Yogendran and Langan 1987). This may also explain why not much an increase
in compressive strength was evident as pores smaller than 20 nm in diameter do not
have a significant effect on the compressive strength of concrete (Ward, Neville et al.
1969).
From the compressive strength data in plain cement concrete at 1 year, a linear
relationship was found to exist between the autogenous shrinkage strains and the
compressive strength. A similar trend is observed in the silica fume concrete mixture as
well. The same is shown in Figure 7-17. This correlation brings out a general conclusion
that cementitious systems with higher compressive strength could actually experience
higher values of autogenous shrinkage under sealed conditions. OPC10SF32 did not fit
well in this correlation. It is believed that the expansion of the concrete at early ages
could have triggered this shift and hence if concrete had undergone continuous
autogenous shrinkage from the point of sealing there could be a higher possibly that it
followed this trend as well.
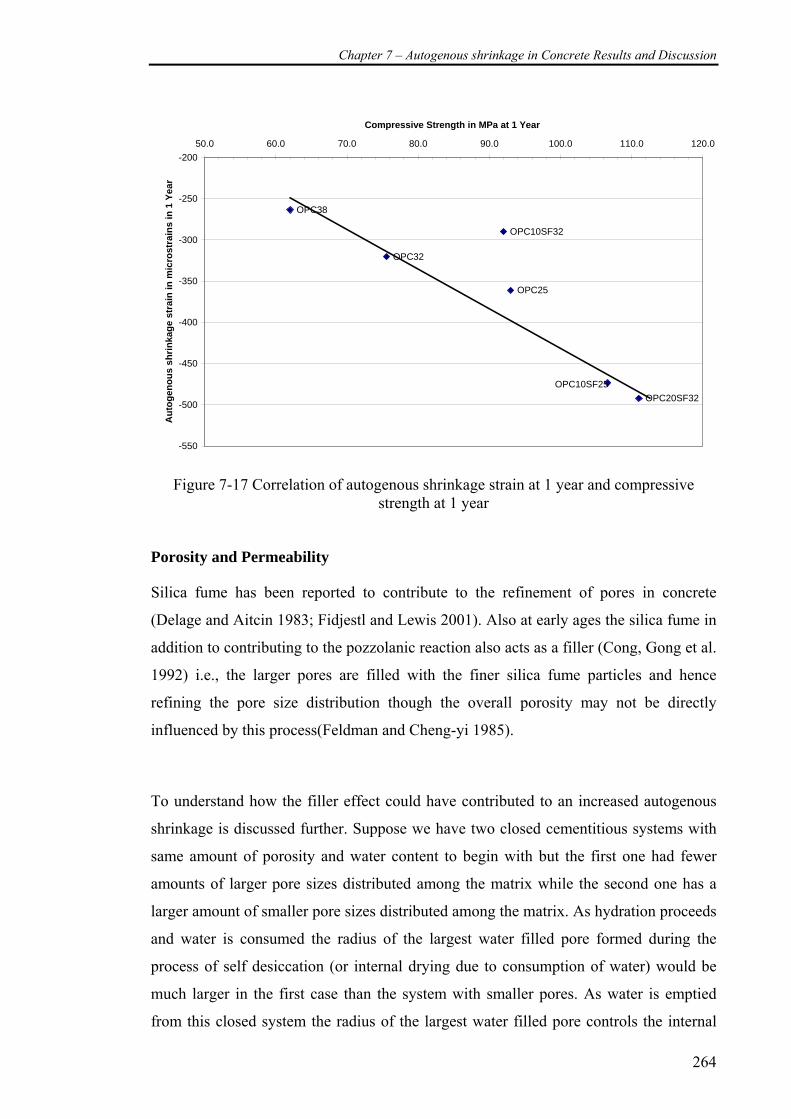
Chapter 7 – Autogenous shrinkage in Concrete Results and Discussion
264
OPC10SF32
OPC20SF32OPC10SF25
OPC25
OPC32
OPC38
-550
-500
-450
-400
-350
-300
-250
-20050.0 60.0 70.0 80.0 90.0 100.0 110.0 120.0
Compressive Strength in MPa at 1 Year
Aut
ogen
ous
shrin
kage
str
ain
in m
icro
stra
ins
in 1
Yea
r
Figure 7-17 Correlation of autogenous shrinkage strain at 1 year and compressive
strength at 1 year
Porosity and Permeability
Silica fume has been reported to contribute to the refinement of pores in concrete
(Delage and Aitcin 1983; Fidjestl and Lewis 2001). Also at early ages the silica fume in
addition to contributing to the pozzolanic reaction also acts as a filler (Cong, Gong et al.
1992) i.e., the larger pores are filled with the finer silica fume particles and hence
refining the pore size distribution though the overall porosity may not be directly
influenced by this process(Feldman and Cheng-yi 1985).
To understand how the filler effect could have contributed to an increased autogenous
shrinkage is discussed further. Suppose we have two closed cementitious systems with
same amount of porosity and water content to begin with but the first one had fewer
amounts of larger pore sizes distributed among the matrix while the second one has a
larger amount of smaller pore sizes distributed among the matrix. As hydration proceeds
and water is consumed the radius of the largest water filled pore formed during the
process of self desiccation (or internal drying due to consumption of water) would be
much larger in the first case than the system with smaller pores. As water is emptied
from this closed system the radius of the largest water filled pore controls the internal

Chapter 7 – Autogenous shrinkage in Concrete Results and Discussion
265
drop in relative humidity (Refer Section 2.6.2 ). In the system with smaller pores
reduction in water results in smaller largest water filled pore in comparison to the
system with larger pores. Hence a lower internal relative humidity would be present in
system with smaller pores than a system with larger pores for the same amount of water
removed. This lower internal relative humidity in the system with smaller pores is likely
to create higher capillary forces resulting in larger bulk volume change or self
desiccation shrinkage. This same phenomenon can be used to explain autogenous
shrinkage strains being higher for finer cements than coarser cements. Also it was
reported by Igarashi et al (2005) that at very low water-cementitious ratio in silica fume
concrete, the pores were more continuous when compared to normal concretes where
coarser discontinuous pore size distribution were present. The pores being smaller and
continuous will only contribute to an un-inhibited development of autogenous shrinkage
strains during the progress of hydration as a continuous depletion of water can is always
possible and also maintaining smaller size largest water filled pore radius. Some
important questions concerning aspects of porosity and permeability are raised here
• Does a concrete with lower total porosity always contribute to higher
autogenous shrinkage?
• Does concrete with pore size distribution primarily concentrated on the smaller
size pores contribute to a higher autogenous shrinkage?
These questions are genuinely valid for cementitious systems which have always been
reported to have a lower total porosity as hydration proceeds and lower pore size
distribution with the inclusion of silica fume concrete. Whether such scenario, if always
existing, can contribute to a higher autogenous shrinkage is discussed in the following
section.
Does concrete with a lower porosity always contribute to higher autogenous
shrinkage?
Let us base this discussion on a closed system with concrete of a very low porosity.
While most literature sources are inclined in saying that a lower porosity makes the
concrete susceptible to higher autogenous shrinkage, the author would like to argue
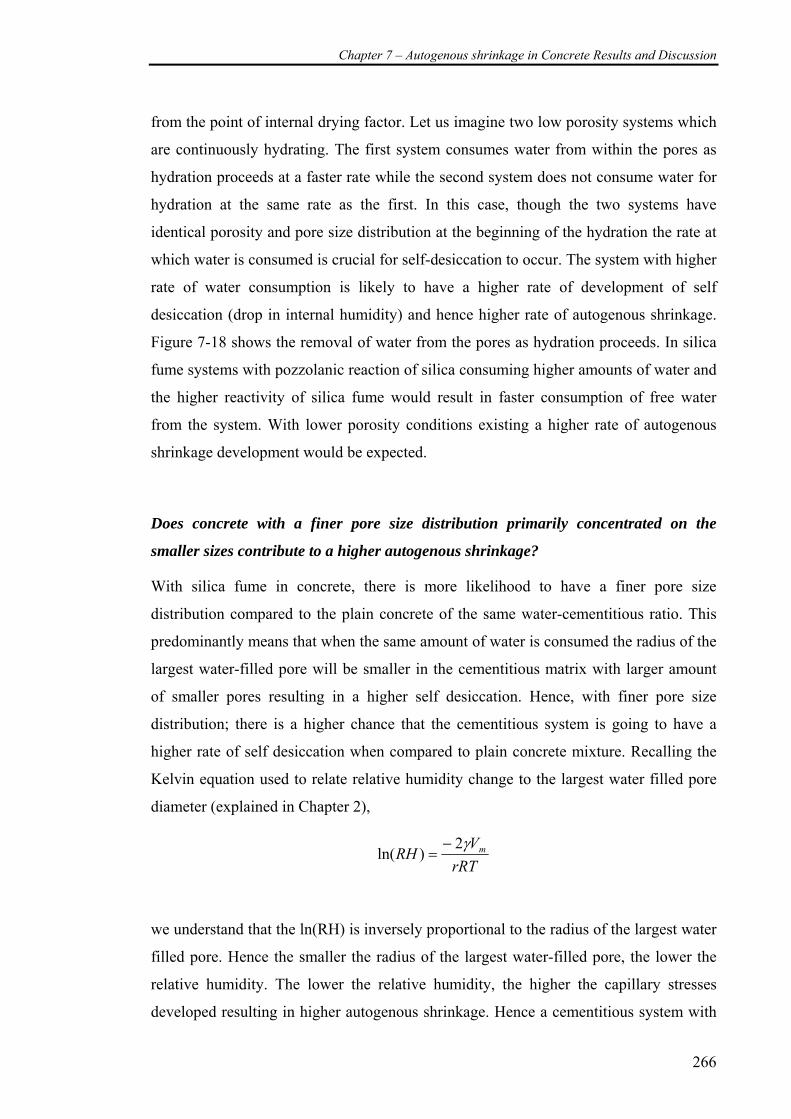
Chapter 7 – Autogenous shrinkage in Concrete Results and Discussion
266
from the point of internal drying factor. Let us imagine two low porosity systems which
are continuously hydrating. The first system consumes water from within the pores as
hydration proceeds at a faster rate while the second system does not consume water for
hydration at the same rate as the first. In this case, though the two systems have
identical porosity and pore size distribution at the beginning of the hydration the rate at
which water is consumed is crucial for self-desiccation to occur. The system with higher
rate of water consumption is likely to have a higher rate of development of self
desiccation (drop in internal humidity) and hence higher rate of autogenous shrinkage.
Figure 7-18 shows the removal of water from the pores as hydration proceeds. In silica
fume systems with pozzolanic reaction of silica consuming higher amounts of water and
the higher reactivity of silica fume would result in faster consumption of free water
from the system. With lower porosity conditions existing a higher rate of autogenous
shrinkage development would be expected.
Does concrete with a finer pore size distribution primarily concentrated on the
smaller sizes contribute to a higher autogenous shrinkage?
With silica fume in concrete, there is more likelihood to have a finer pore size
distribution compared to the plain concrete of the same water-cementitious ratio. This
predominantly means that when the same amount of water is consumed the radius of the
largest water-filled pore will be smaller in the cementitious matrix with larger amount
of smaller pores resulting in a higher self desiccation. Hence, with finer pore size
distribution; there is a higher chance that the cementitious system is going to have a
higher rate of self desiccation when compared to plain concrete mixture. Recalling the
Kelvin equation used to relate relative humidity change to the largest water filled pore
diameter (explained in Chapter 2),
rRTV
RH mγ2)ln(
−=
we understand that the ln(RH) is inversely proportional to the radius of the largest water
filled pore. Hence the smaller the radius of the largest water-filled pore, the lower the
relative humidity. The lower the relative humidity, the higher the capillary stresses
developed resulting in higher autogenous shrinkage. Hence a cementitious system with
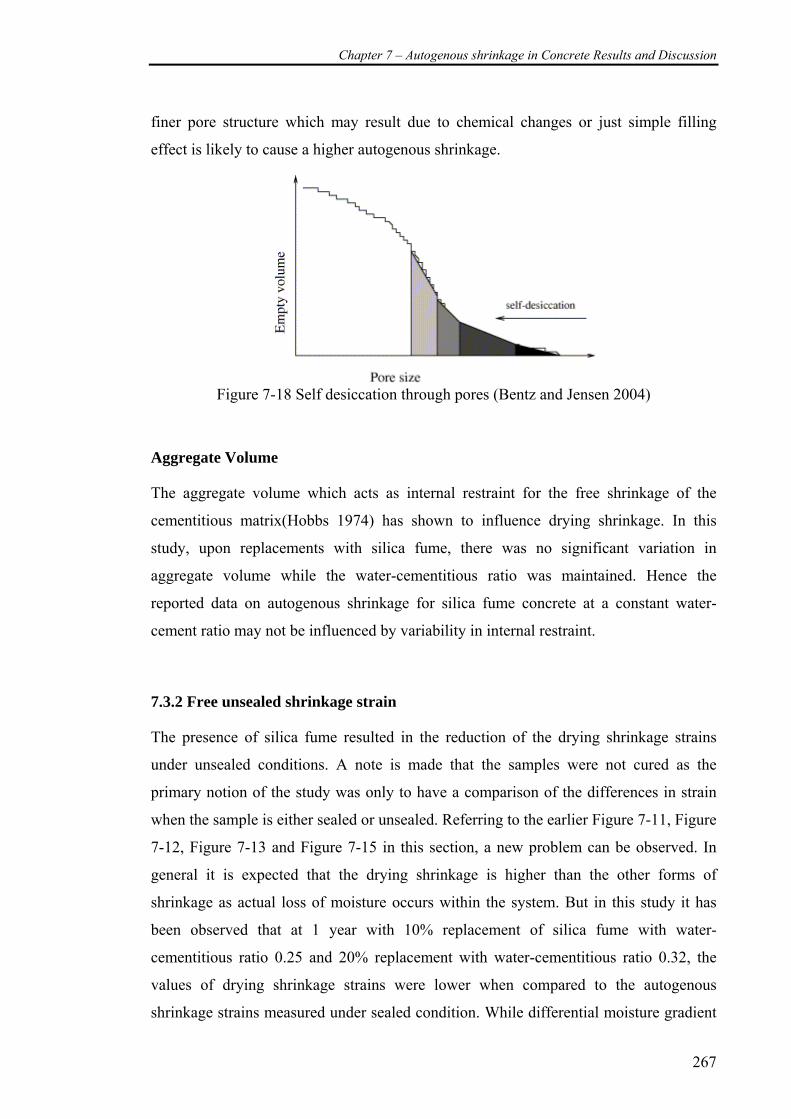
Chapter 7 – Autogenous shrinkage in Concrete Results and Discussion
267
finer pore structure which may result due to chemical changes or just simple filling
effect is likely to cause a higher autogenous shrinkage.
Figure 7-18 Self desiccation through pores (Bentz and Jensen 2004)
Aggregate Volume
The aggregate volume which acts as internal restraint for the free shrinkage of the
cementitious matrix(Hobbs 1974) has shown to influence drying shrinkage. In this
study, upon replacements with silica fume, there was no significant variation in
aggregate volume while the water-cementitious ratio was maintained. Hence the
reported data on autogenous shrinkage for silica fume concrete at a constant water-
cement ratio may not be influenced by variability in internal restraint.
7.3.2 Free unsealed shrinkage strain
The presence of silica fume resulted in the reduction of the drying shrinkage strains
under unsealed conditions. A note is made that the samples were not cured as the
primary notion of the study was only to have a comparison of the differences in strain
when the sample is either sealed or unsealed. Referring to the earlier Figure 7-11, Figure
7-12, Figure 7-13 and Figure 7-15 in this section, a new problem can be observed. In
general it is expected that the drying shrinkage is higher than the other forms of
shrinkage as actual loss of moisture occurs within the system. But in this study it has
been observed that at 1 year with 10% replacement of silica fume with water-
cementitious ratio 0.25 and 20% replacement with water-cementitious ratio 0.32, the
values of drying shrinkage strains were lower when compared to the autogenous
shrinkage strains measured under sealed condition. While differential moisture gradient
Chapter 7 – Autogenous shrinkage in Concrete Results and Discussion
268
has been studied within cementitious systems contributing to differential drying
shrinkage, this scenario may alert to a whole new avenue of differential shrinkage
occurring within a system which may be self desiccating from the inside while still
losing moisture to the outside environment through the outside layers. In general
addition of silica fume reduced the drying shrinkage strains when compared to plain
cement concrete mixtures of the same water-cement ratio.
7.3.3 Summary
The addition of silica fume increases the risk of higher autogenous shrinkage. The
various factors which trigger this higher autogenous shrinkage may include higher
fineness of the silica fume, lower porosity of the hydrating microstructure, higher
chemical shrinkage and pore refinement due to the pozzolanic reaction. The recorded
autogenous shrinkage being larger than the drying shrinkage at a period of 1 year opens
the way for a whole new area of differential shrinkage studies which may have not been
reported earlier and is worth investigating as a future study.
Chapter 7 – Autogenous shrinkage in Concrete Results and Discussion
269
7.4 Cement– fly ash system
The earlier section demonstrated the autogenous shrinkage is dominant and may be of
serious concern when water-cement ratio is lowered in conjunction with the addition of
silica fume. This section focuses on the addition of fly ash and interprets whether fly ash
promotes or mitigates autogenous shrinkage strain. The role of fly ash is important as it
is very widely used in high performance concretes and green concrete in the thrust for
sustainability. Though the use of fly ash have showed promising results in both its
performance and reducing the carbon footprint whether it is favouring or not favouring
autogenous shrinkage can help in better and more efficient use of the material.
Four mixture proportions were designed to understand autogenous shrinkage strains.
The mixture proportions used in this study are shown in Table 7-4. The details of the
mixture proportion were explained earlier in Chapter 3 (Experimental Methods).
Table 7-4 Nomenclature for cement-fly ash cementitious system
Name Description
OPC30FA25 Plain cement concrete mixture with 30% fly ash replacement by weight of cement and a water-cementitious ratio of 0.25
OPC30FA32 Plain cement concrete mixture with 30% fly ash replacement by weight of cement and a water-cementitious ratio of 0.32
OPC50FA32 Plain cement concrete mixture with 50% fly ash replacement by weight of cement and a water-cementitious ratio of 0.32
OPC70FA32 Plain cement concrete mixture with 70% fly ash replacement by weight of cement and a water-cementitious ratio of 0.32

Chapter 7 – Autogenous shrinkage in Concrete Results and Discussion
270
7.4.1 Free autogenous shrinkage strain
The free autogenous shrinkage strains were recorded after demoulding the samples at 24
hours from casting. OPC50FA32 and OPC70FA32 had not sufficiently hardened at 24
hours and hence were demoulded after 48 hours.
Figure 7-19 Sealed and unsealed shrinkage strains in OPC30FA25
Figure 7-20 Sealed and unsealed shrinkage strains in OPC30FA32
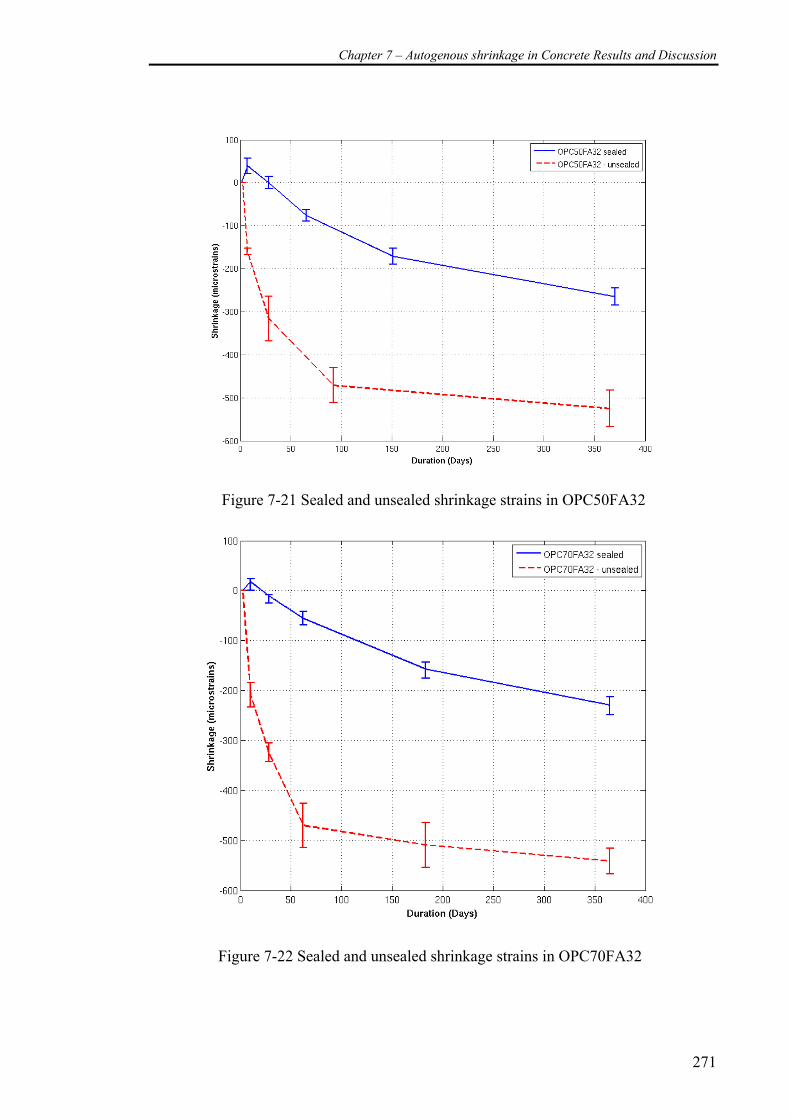
Chapter 7 – Autogenous shrinkage in Concrete Results and Discussion
271
Figure 7-21 Sealed and unsealed shrinkage strains in OPC50FA32
Figure 7-22 Sealed and unsealed shrinkage strains in OPC70FA32
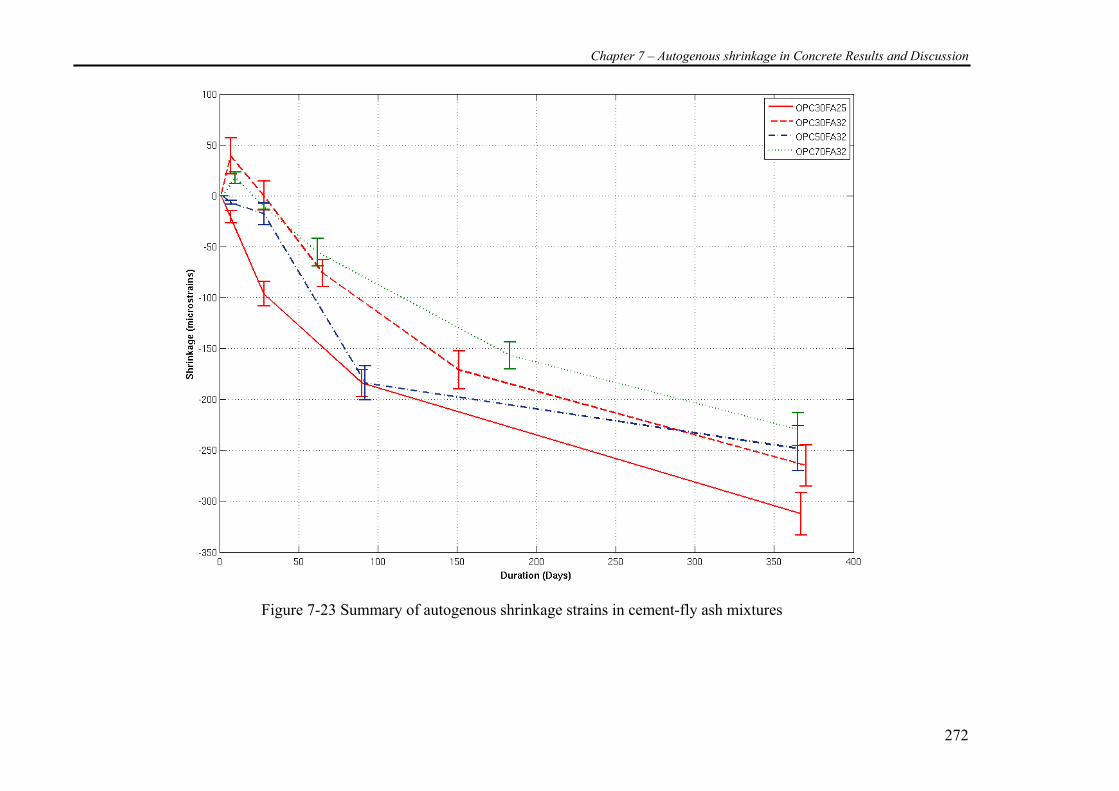
Chapter 7 – Autogenous shrinkage in Concrete Results and Discussion
272
Figure 7-23 Summary of autogenous shrinkage strains in cement-fly ash mixtures
Chapter 7 – Autogenous shrinkage in Concrete Results and Discussion
273
Observations
1. An expansion was observed at ages 1- 7 days for the cement-fly ash mixtures at
all replacements and water-cementitious ratio of 0.32.
2. At 1 year the higher the fly ash replacement content in the cement-fly ash
mixtures, the lower was the autogenous shrinkage.
3. Much of the autogenous shrinkage in cement-fly ash mixtures occurred after 28
days duration.
4. The unsealed shrinkage strains are much higher than the sealed shrinkage strains
making them very different to cement-silica fume systems.
Work by other researchers
Lee et al (2003) demonstrated a decrease in autogenous shrinkage at fly ash replacement
of 10, 20 and 30% and constant water-cementitious ratio of 0.31 and 0.27 at ages up to
28 days. Lee et al commenced the measurements from 6 hours after casting using
specialized moulds of dimensions 100 mm x 100 mm x 400 mm and embedded gauges
whose movement was recorded using LVDTs. Chan et al (1999) showed similar results
when studies were conducted with sealed cylindrical specimens and measurements
commenced after 24 hours. At 7 days and 28 days increase in fly ash content
contributed to a decrease in autogenous shrinkage strain. These studies were in general
carried out up to 28 days. Fly ash has a prolonged action of pozzolanic activity beyond
the 28 day period. The long term effect of fly ash is not clearly documented.
Comparison to autogenous shrinkage in paste samples
Studies on autogenous shrinkage in paste samples had a much clearer trend at 28 and 90
days as can be seen from Figure 6-42. In concrete specimens with fly as replacements,
such a trend is not clearly evident at 28 days but is so at 1 year (Refer Figure 7-24). At
28 days the measured autogenous shrinkage strains on the concrete specimens have
been quite low due to an expansion or swelling observed at all replacements of fly ash.
This swelling was dominant at lower replacements of fly ash but absent in plain
concrete mixtures. Tangtermsirikul (1999) observed similar expansion due to a high
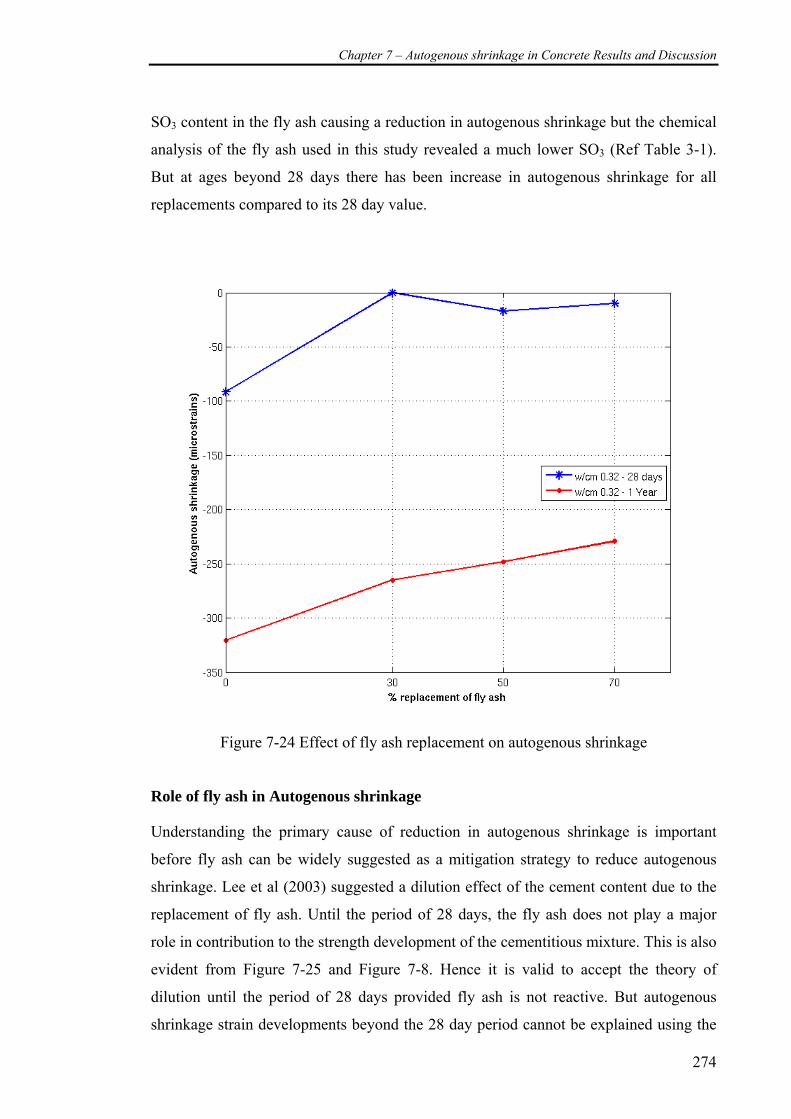
Chapter 7 – Autogenous shrinkage in Concrete Results and Discussion
274
SO3 content in the fly ash causing a reduction in autogenous shrinkage but the chemical
analysis of the fly ash used in this study revealed a much lower SO3 (Ref Table 3-1).
But at ages beyond 28 days there has been increase in autogenous shrinkage for all
replacements compared to its 28 day value.
Figure 7-24 Effect of fly ash replacement on autogenous shrinkage
Role of fly ash in Autogenous shrinkage
Understanding the primary cause of reduction in autogenous shrinkage is important
before fly ash can be widely suggested as a mitigation strategy to reduce autogenous
shrinkage. Lee et al (2003) suggested a dilution effect of the cement content due to the
replacement of fly ash. Until the period of 28 days, the fly ash does not play a major
role in contribution to the strength development of the cementitious mixture. This is also
evident from Figure 7-25 and Figure 7-8. Hence it is valid to accept the theory of
dilution until the period of 28 days provided fly ash is not reactive. But autogenous
shrinkage strain developments beyond the 28 day period cannot be explained using the
Chapter 7 – Autogenous shrinkage in Concrete Results and Discussion
275
theory of dilution as fly ash is no longer inert. It is believed that sufficient CH and
higher pH would control the progress of pozzolanic reaction beyond 28 days (Neville
1995). This accelerated progress of hydration of fly ash may have resulted in increased
autogenous shrinkage beyond the 28 day period. Another theory proposed by
Tangtermsirikul (1999) is that the free water content in cement-fly ash mixtures is
generally higher than plain cement concrete mixtures and this could be the cause due to
reduction in autogenous shrinkage.
Chemical shrinkage
Chemical shrinkage the prime factor contributes to the self desiccation in a two step
phenomenon, i.e., removal of water due to hydration (reduction in free water), volume
loss due to hydration (resulting in empty voids) both collectively contributing to self
desiccation. The pozzolanic reaction clearly demonstrated by ASG (refer Appendix F)
that for every gram of ASG reacting with CH about 0.67 gm of water was consumed. Th
consumption of water per gram of the phase (ASG) is even higher than C3S and C2S
reacting with water While this may only be a theoretical value, it still denotes a
relatively larger amount of water consumed for hydration of fly ash phases when
compared to cement. As the pozzolanic reaction is triggered beyond the 28 days with
sufficient amount of CH present higher amounts of water may be consumed resulting
self desiccation. Probably this could explain the acceleration in development of
autogenous shrinkage strain beyond the 28 days period. Yet this acceleration in
autogenous shrinkage or self desiccation has not been sufficient enough to surpass the
values of plain cement concrete mixtures.
The Pozzolanic reaction
For pozzolanic reaction to occur abundant amounts of CH may have to be present in the
vicinity of fly ash. With CH reacting with fly ash likely to accelerate the amount of
autogenous shrinkage, this could explain the increase in autogenous shrinkage beyond
28 days dominant at lower replacements of fly ash. But at higher replacements of fly ash
lower amounts of CH is produced from the hydration of cement. Hence a scarcity in CH
available for the pozzolanic reaction exists. This result’s in lower pozzolanic activity or
degree of hydration of fly ash achieved may be lower for higher replacements of fly ash.
Chapter 7 – Autogenous shrinkage in Concrete Results and Discussion
276
The same has also been observe by researchers were a decreasing trend in the dgree of
hydration of fly ash is achieved as the percentage replacement of fly ash increased
(Wang, Zhang et al. 2004). Termkhajornkit et al (2005) also commented in his work
that the development of autogenous shrinkage beyond the 56 days period is mainly
dependent on the hydration of fly ash. Infact this could be one of the reason why
Tangtermsirikul (1999) obtained higher values of autogenous shrinkage for fine fly ash
particles at 30% replacement than the cement only system. The higher reactivity of fly
ash results in a higher degree of hydration there by consuming water at a higher rate
leading to self desiccation. Hence it is postulated that at early ages the effective water-
cement ratio is higher due to dilution effect from inert fly ash particles. This causes a
lower autogenous shrinkage at ages up to 28 days. At later ages (beyond 28 days) much
of cement hydration has completed and the pozzolanic reaction of fly ash promotes
autogenous shrinkage but is not likely to result in very high autogenous shrinkage
strains due to insufficient CH.
Compressive strength
The compressive strength of the cured samples was determined and the results plotted in
Figure 7-25. It can be observed that when the compressive strength at 1 year was plotted
against the autogenous shrinkage achieved at 1 year there was a trend similar to that of
plain cement and silica fume concrete systems (Ref Figure 7-26). As the compressive
strength increased so did the autogenous shrinkage, which brings the author to believe
the gel-space ratio (a closely related parameter to compressive strength), may be closely
associated with autogenous shrinkage.
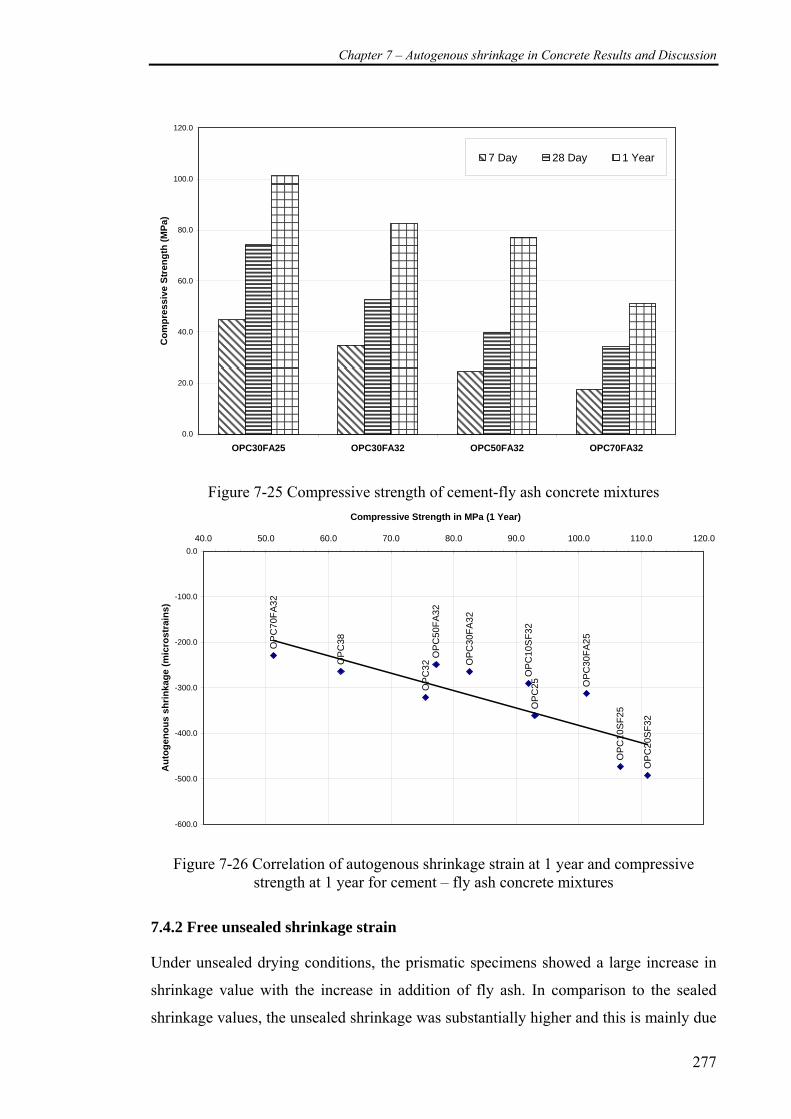
Chapter 7 – Autogenous shrinkage in Concrete Results and Discussion
277
0.0
20.0
40.0
60.0
80.0
100.0
120.0
OPC30FA25 OPC30FA32 OPC50FA32 OPC70FA32
Com
pres
sive
Str
engt
h (M
Pa)
7 Day 28 Day 1 Year
Figure 7-25 Compressive strength of cement-fly ash concrete mixtures
OP
C20
SF3
2
OP
C10
SF2
5OP
C25OP
C32O
PC
38
OP
C30
FA25
OP
C10
SF3
2
OP
C30
FA32
OP
C50
FA32
OP
C70
FA32
-600.0
-500.0
-400.0
-300.0
-200.0
-100.0
0.040.0 50.0 60.0 70.0 80.0 90.0 100.0 110.0 120.0
Compressive Strength in MPa (1 Year)
Aut
ogen
ous
shrin
kage
(mic
rost
rain
s)
Figure 7-26 Correlation of autogenous shrinkage strain at 1 year and compressive
strength at 1 year for cement – fly ash concrete mixtures
7.4.2 Free unsealed shrinkage strain
Under unsealed drying conditions, the prismatic specimens showed a large increase in
shrinkage value with the increase in addition of fly ash. In comparison to the sealed
shrinkage values, the unsealed shrinkage was substantially higher and this is mainly due
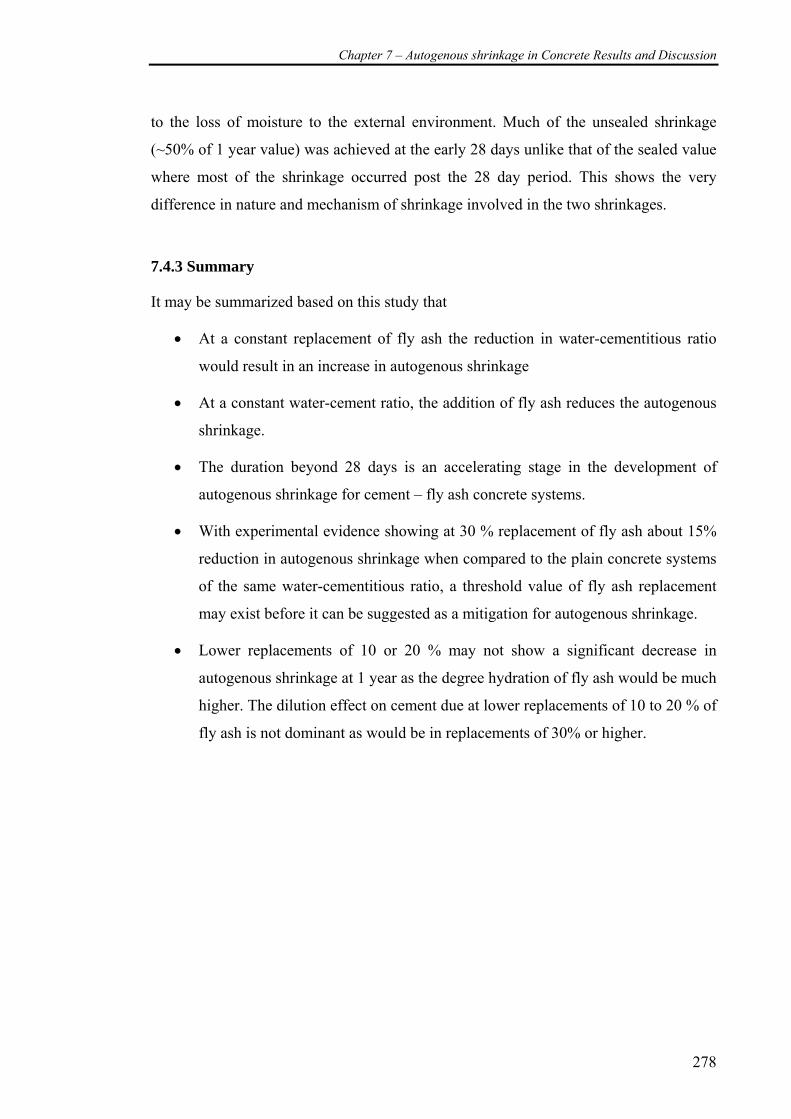
Chapter 7 – Autogenous shrinkage in Concrete Results and Discussion
278
to the loss of moisture to the external environment. Much of the unsealed shrinkage
(~50% of 1 year value) was achieved at the early 28 days unlike that of the sealed value
where most of the shrinkage occurred post the 28 day period. This shows the very
difference in nature and mechanism of shrinkage involved in the two shrinkages.
7.4.3 Summary
It may be summarized based on this study that
• At a constant replacement of fly ash the reduction in water-cementitious ratio
would result in an increase in autogenous shrinkage
• At a constant water-cement ratio, the addition of fly ash reduces the autogenous
shrinkage.
• The duration beyond 28 days is an accelerating stage in the development of
autogenous shrinkage for cement – fly ash concrete systems.
• With experimental evidence showing at 30 % replacement of fly ash about 15%
reduction in autogenous shrinkage when compared to the plain concrete systems
of the same water-cementitious ratio, a threshold value of fly ash replacement
may exist before it can be suggested as a mitigation for autogenous shrinkage.
• Lower replacements of 10 or 20 % may not show a significant decrease in
autogenous shrinkage at 1 year as the degree hydration of fly ash would be much
higher. The dilution effect on cement due at lower replacements of 10 to 20 % of
fly ash is not dominant as would be in replacements of 30% or higher.
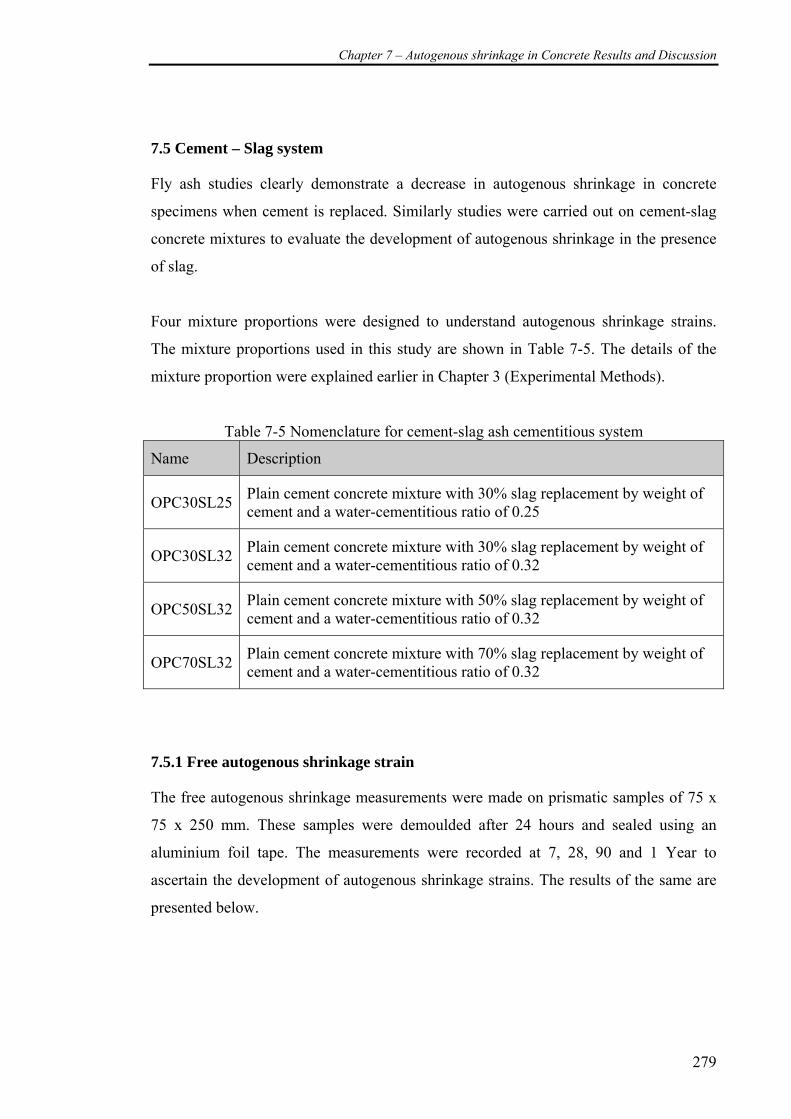
Chapter 7 – Autogenous shrinkage in Concrete Results and Discussion
279
7.5 Cement – Slag system
Fly ash studies clearly demonstrate a decrease in autogenous shrinkage in concrete
specimens when cement is replaced. Similarly studies were carried out on cement-slag
concrete mixtures to evaluate the development of autogenous shrinkage in the presence
of slag.
Four mixture proportions were designed to understand autogenous shrinkage strains.
The mixture proportions used in this study are shown in Table 7-5. The details of the
mixture proportion were explained earlier in Chapter 3 (Experimental Methods).
Table 7-5 Nomenclature for cement-slag ash cementitious system
Name Description
OPC30SL25 Plain cement concrete mixture with 30% slag replacement by weight of cement and a water-cementitious ratio of 0.25
OPC30SL32 Plain cement concrete mixture with 30% slag replacement by weight of cement and a water-cementitious ratio of 0.32
OPC50SL32 Plain cement concrete mixture with 50% slag replacement by weight of cement and a water-cementitious ratio of 0.32
OPC70SL32 Plain cement concrete mixture with 70% slag replacement by weight of cement and a water-cementitious ratio of 0.32
7.5.1 Free autogenous shrinkage strain
The free autogenous shrinkage measurements were made on prismatic samples of 75 x
75 x 250 mm. These samples were demoulded after 24 hours and sealed using an
aluminium foil tape. The measurements were recorded at 7, 28, 90 and 1 Year to
ascertain the development of autogenous shrinkage strains. The results of the same are
presented below.
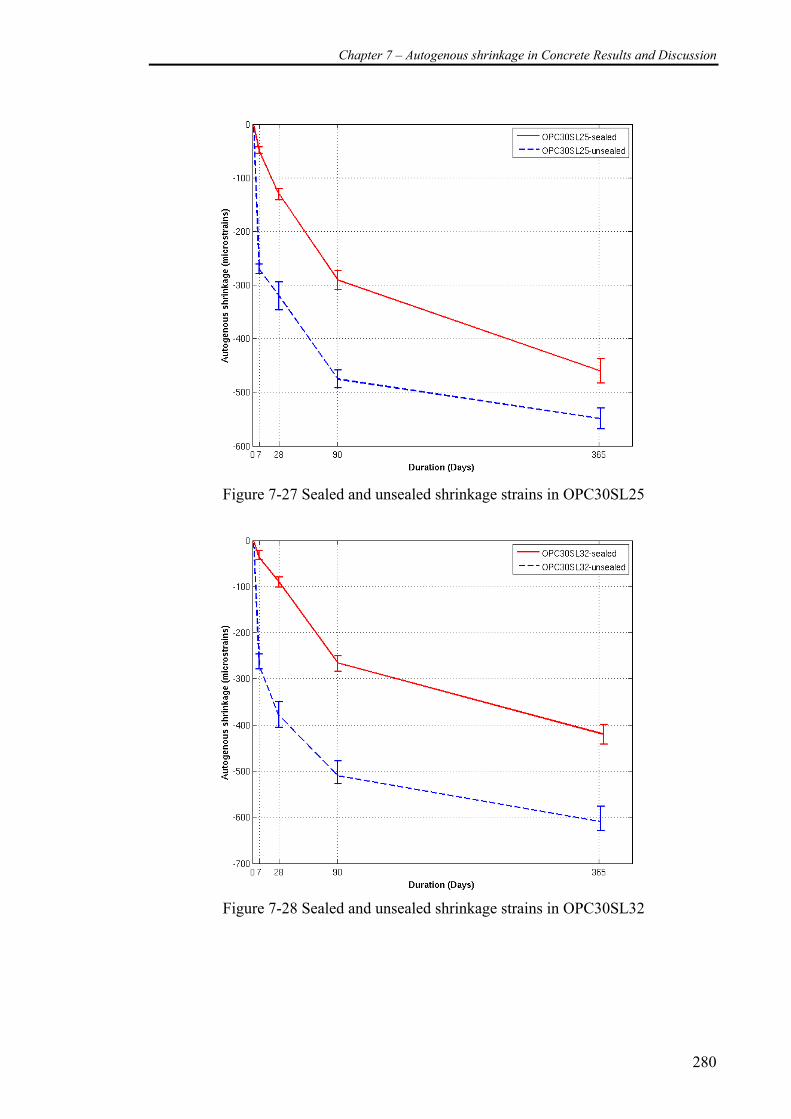
Chapter 7 – Autogenous shrinkage in Concrete Results and Discussion
280
Figure 7-27 Sealed and unsealed shrinkage strains in OPC30SL25
Figure 7-28 Sealed and unsealed shrinkage strains in OPC30SL32
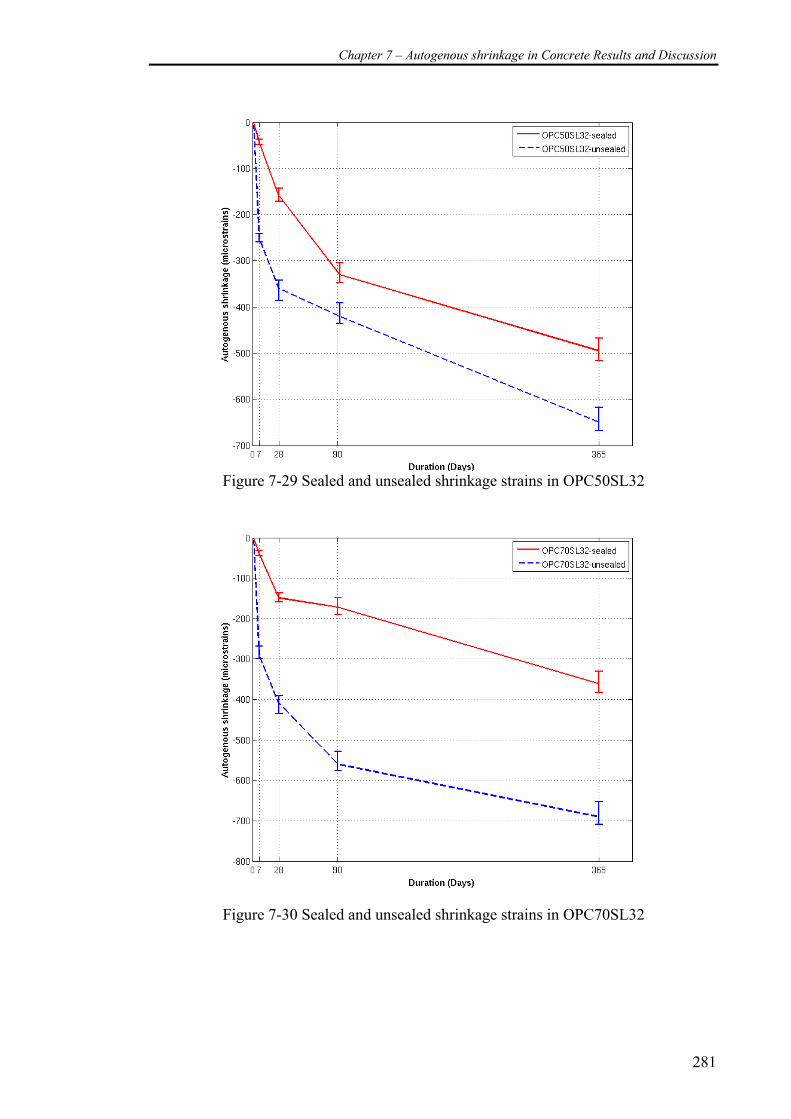
Chapter 7 – Autogenous shrinkage in Concrete Results and Discussion
281
Figure 7-29 Sealed and unsealed shrinkage strains in OPC50SL32
Figure 7-30 Sealed and unsealed shrinkage strains in OPC70SL32
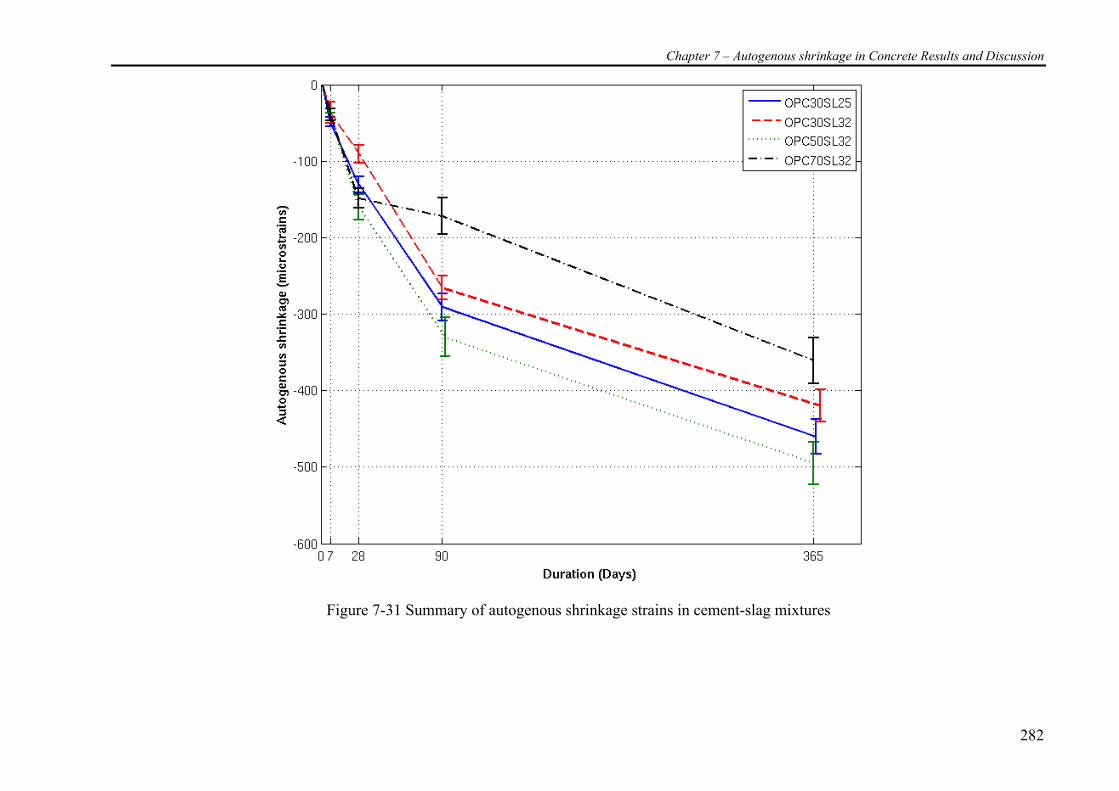
Chapter 7 – Autogenous shrinkage in Concrete Results and Discussion
282
Figure 7-31 Summary of autogenous shrinkage strains in cement-slag mixtures
Chapter 7 – Autogenous shrinkage in Concrete Results and Discussion
283
From Figure 7-27, Figure 7-28, Figure 7-29 and Figure 7-30 the following observations
are made
Observations
1. An increase in replacement of slag resulted in the increase in autogenous
shrinkage but at very high replacements this trend declined.
2. OPC50SL32 showed the highest amount of autogenous shrinkage strain.
3. With decrease in water-cement ratio for the same replacement of slag, there was
an increase in autogenous shrinkage
4. At 90 days more than 50% of the ultimate values of strains were achieved.
5. The increase in autogenous shrinkage strain beyond 90 days was very similar
irrespective of the amount of replacement of slag.
Work by other researchers
Though in literature very limited research (in comparison to fly ash mixtures) has been
carried out the study of autogenous shrinkage in cementitious systems with slag
replacements, there has been a very consistent data available. Studies by Lim and
Wee(2000), Lee et al (2006) , Tazawa and Miyazawa (1997) have demonstrated that the
autogenous shrinkage is higher for 50% slag replacements. Researchers also reported
autogenous shrinkage is higher than that of the plain cement concrete mixtures.
Role of slag in autogenous shrinkage
Unlike fly ash, at very early ages of even 7 days considerable autogenous shrinkage has
been observed in slag mixtures. Before we begin the discussion and postulate, the
author reminds that the fineness of slag was much higher than that of the ordinary
portland cement (Refer Figure 3-1). Slag has a much higher specific surface area in
comparison to ordinary Portland cement. The higher fineness of slag makes it difficult
to interpret whether the higher autogenous shrinkage was due to the fineness of the slag
or the reactions associated with slag. It is assumed that it is a coupled action of the
reactions associated with slag and the higher fineness causing increased reactivity. In
addition to the hydration of cement, slag reacts with water but requires hydraulic C2S or
Chapter 7 – Autogenous shrinkage in Concrete Results and Discussion
284
a suitable activator.. It is hence predominantly considered to react with the CH produced
from cement hydration.
Uchikawa (1986) reported in his study that at early ages cement-slag mixtures had a
very similar porosity to that of the cement only mixtures but at later ages there was shift
in the volume of pores towards to the lower pore sizes. A higher volume of pores of size
3-5 nm was reported. The total porosity when studied by Manmohan and Mehta (1981)
showed that the total porosity was significantly larger as the slag replacement increased
from 30% to 70%. With evidence that the porosity is decreased at very high
replacements of fly ash there is a likelihood that it will not promote self desiccation and
hence less autogenous shrinkage
Slag hydration and stoichiometry
Unlike cement-silica fume or cement-fly ash were definite reaction stoichiometry can be
written, the same is not the case with cement-slag mixtures. The mineral phases present
in slag are highly dependent on its chemical analysis. This makes writing a generalized
volume stoichiometry for slag difficult. Biernacki et al (2002)gave a generic form of
reaction stoichiometry for slag/CH reaction based on his chemical composition of
GGBFS.
C7.88S7M3A + 2.6 CH +b H → 7.39 C1.42SHmA0.046 +0.66 M4.6AHd
The above equation shows that the chemical composition of slag and the CH present
from the hydrating microstructure would control the progress of hydration of the slag.
The chemical structure of the slag phases cannot change but as the replacement of
cement with slag increases there would be an ideal CH content which when formed
would promote the progress of hydration. ie., the slag/CH ratio controlled the progress
of hydration of the slag. It is more likely that at higher replacements of slag the amount
of CH formed would be much lower hindering the progress of hydration of the slag in
the cementitious system. If a constant source of CH is not available the slag hydration
would not progress resulting in reduced performance of the material. It is reminded that
experimental investigation on chemical shrinkage in slag was higher than that of plain
cement paste mixture at water-cement ratio of 0.7. This reflects that as slag hydrates the
amount of empty voids formed under sealed hydration would be larger. But it is
imperative that hydration of slag has to occur to result in larger amount of empty voids.

Chapter 7 – Autogenous shrinkage in Concrete Results and Discussion
285
Compressive strength
The compressive strength of cured cylinders are shown in Figure 7-32. The compressive
strength data also reflected a decrease in compressive strength when the replacement
percentage was increased to 70%. When the compressive strength was correlated with
the observed autogenous shrinkage strains at 1 year there was a definite trend observed.
Figure 7-33 shows that for all the cementitious systems a linear correlation was
observed with increase in compressive strength.
0.0
20.0
40.0
60.0
80.0
100.0
120.0
OPC30SL25 OPC30SL32 OPC50SL32 OPC70SL32
Com
pres
sive
Str
engt
h (M
Pa)
7 Day 28 Day 1 Year
Figure 7-32 Compressive strength of cement-slag concrete mixtures
The relationship between compressive strength and autogenous shrinkage is of higher
importance as this definite relationship may concern researchers working on high
strength concrete mixtures. The author believes the gel-space ratio responsible for high
compressive strength may also be responsible for the increase in autogenous shrinkage.
As the gel-space ratio increases, the amount of gel pores increases with increase in
hydration products formed. This characteristic porosity is much smaller than the
existing capillary pores. This shifts the pore size distribution to the lower side as the
hydration proceeds. This results in reduction of existing capillary pores resulting in the
total porosity to be decreased. This may result in the increase in internal drying factor
causing higher autogenous shrinkage. While not much of a study on the relationship
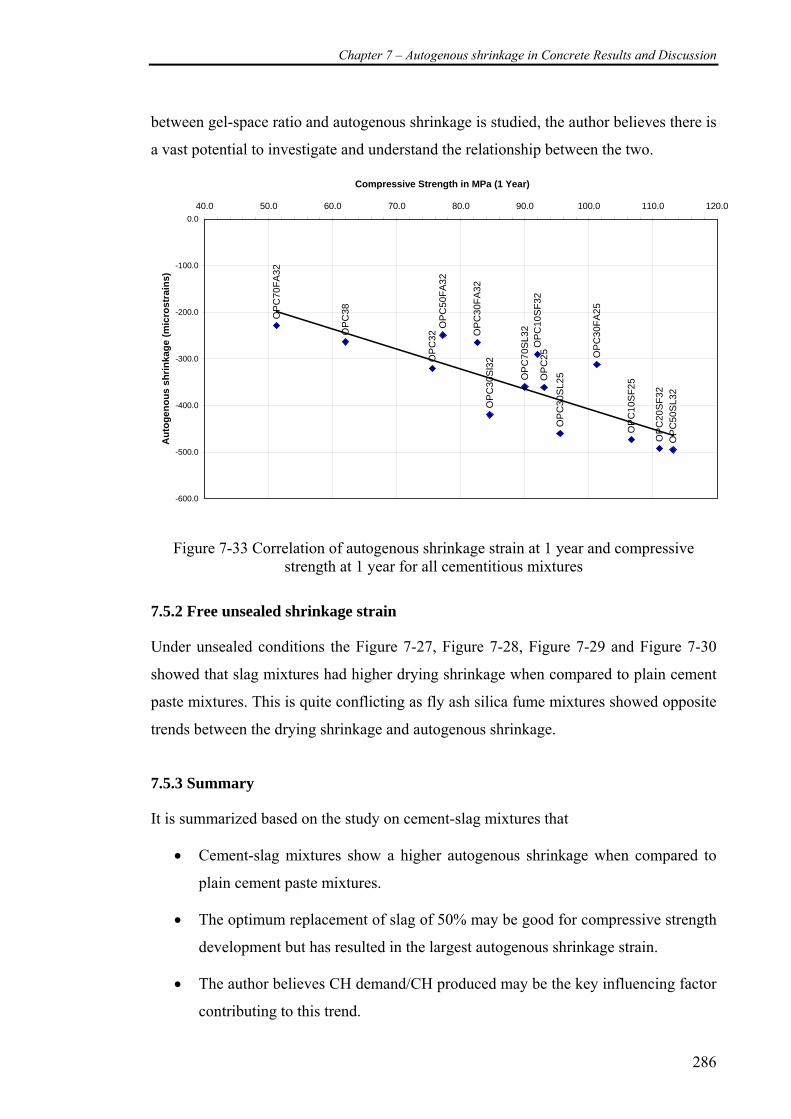
Chapter 7 – Autogenous shrinkage in Concrete Results and Discussion
286
between gel-space ratio and autogenous shrinkage is studied, the author believes there is
a vast potential to investigate and understand the relationship between the two.
OP
C30
Sl3
2
OP
C70
SL3
2
OP
C30
SL2
5
OP
C50
SL3
2O
PC
20S
F32
OP
C10
SF2
5OP
C25O
PC
32OP
C38
OP
C30
FA25
OP
C10
SF3
2
OP
C30
FA32
OP
C50
FA32
OP
C70
FA32
-600.0
-500.0
-400.0
-300.0
-200.0
-100.0
0.040.0 50.0 60.0 70.0 80.0 90.0 100.0 110.0 120.0
Compressive Strength in MPa (1 Year)
Aut
ogen
ous
shrin
kage
(mic
rost
rain
s)
Figure 7-33 Correlation of autogenous shrinkage strain at 1 year and compressive
strength at 1 year for all cementitious mixtures
7.5.2 Free unsealed shrinkage strain
Under unsealed conditions the Figure 7-27, Figure 7-28, Figure 7-29 and Figure 7-30
showed that slag mixtures had higher drying shrinkage when compared to plain cement
paste mixtures. This is quite conflicting as fly ash silica fume mixtures showed opposite
trends between the drying shrinkage and autogenous shrinkage.
7.5.3 Summary
It is summarized based on the study on cement-slag mixtures that
• Cement-slag mixtures show a higher autogenous shrinkage when compared to
plain cement paste mixtures.
• The optimum replacement of slag of 50% may be good for compressive strength
development but has resulted in the largest autogenous shrinkage strain.
• The author believes CH demand/CH produced may be the key influencing factor
contributing to this trend.
Chapter 7 – Autogenous shrinkage in Concrete Results and Discussion
287
• The assumption that slag reacts with CH alone is still valid but studies
interpreting a detailed study on hydration of slag and its influence of autogenous
shrinkage is to be carried out as an exhaustive study on cement-slag mixtures.
• The relationship between the compressive strength and autogenous shrinkage at
1 year, compels the author to believe that mixture proportions with higher
compressive strengths are more likely to cause higher autogenous shrinkage.
Chapter 8 – Autogenous shrinkage – An overview of controversies
288
CHAPTER 8 -AUTOGENOUS SHRINKAGE - AN OVERVIEW OF
CONTROVERSIES
8.1 Introduction
In the earlier chapters, the author has discussed the experimental investigation of
chemical and autogenous shrinkage in cementitious systems. The author sees the
necessity to also discuss certain important aspects of the theories of autogenous
shrinkage in conjunction with this experimental study. Arguments are drawn in
conjunction with the studies carried out bringing out the complexity of autogenous
shrinkage phenomenon.
8.2 Early Age deformations (<24 hours)
The term early age is by itself a highly convoluted term and every author has a different
context related to the adopted time frame. In this discussion the early age generally
refers to duration less than 24 hours with an emphasis on the period before and after
setting separately. During the initial ~6 hours i.e, before the setting of the cementitious
paste system there is a rapid increase in autogenous shrinkage when the cement paste
matrix is weak and is in its plastic state. This development of autogenous shrinkage
cannot be attributed to self-desiccation as the paste then, is still quite saturated with
hydrating water.
The underlying theories of autogenous shrinkage date to the concept of self-desiccation
which is driven by the relative humidity within the system. This concept however, may
not be always be the prime factor causing autogenous shrinkage especially at early ages
before the setting of the cementitious paste. Visualizing the early age deformational
changes, the cementitious system is mixed and placed in a mould and provided the
system is completely sealed and well compacted the following assumptions are believed
to be valid.
1. The concrete is in a plastic state and hence cannot sustain any deformation.
Chapter 8 – Autogenous shrinkage – An overview of controversies
289
2. The voids within the system are completely filled with water and the system is
saturated.
Under these circumstances, the author is inclined to believe that the following factors
have a greater influence on the autogenous deformation rather than self desiccation.
1. The chemical shrinkage of the system dictates the deformational change – this is
also reflected from the excellent correlation between the autogenous bulk
deformation (experimental) and the chemical shrinkage (simulated) during the
early ages of shrinkage [refer to Chapter 6].
2. The setting time of the system has a role to play in the maximum deformation
achieved during the early ages – which is reflected from each of the
cementitious mixtures, achieving the peak values at different time intervals
which correspond to the setting times [Refer to Chapter 6].
3. Self desiccation would not occur until the system has begun to set, i.e., achieve a
skeleton that after the deformation due to the earliest stages of chemical
shrinkage has taken place.
4. The probability for the relative humidity to drop below 100% when the system is
completely saturated is low.
Lura et al (2003) stated that a RH value of 98% was observed for cement paste before
the initial setting i.e., when it was in a fluid state and the pore system was completely
saturated. The reduction in RH was assumed to be due to the dissolved salts in the pore
fluid. Lura et al (2003) hence pointed out that the actual RH change measured in a
hydrating system should be separated from the RH due to salt dissolution. This view
actually strengthens the argument that RH change due to self desiccation is not valid
until the paste had set. With self desiccation not occurring until the point of set, the
author is now pointing out that self desiccation shrinkage should not be confused with
autogenous shrinkage and the definition of autogenous shrinkage does not refer to
shrinkage due to self desiccation alone but is actually the shrinkage without any
moisture exchange with the external environment and at a constant temperature. Having
said this, the following issues are elaborately discussed.
1. The likelihood that the setting time influences the values of autogenous
shrinkage strain achieved at early ages
Chapter 8 – Autogenous shrinkage – An overview of controversies
290
2. Separating out the autogenous shrinkage at early ages from plastic shrinkage.
8.2.1 Influence of setting time on autogenous shrinkage at early age
Recollecting the study on autogenous shrinkage in cementitious paste samples, where
the author attempted to measure the autogenous shrinkage the following distinct
phenomenon is elaborated and conclusions drawn.
• With addition of fly ash there was an increase in early age autogenous shrinkage
in spite of the lower chemical shrinkage when compared to plain cement paste
mixture at 30% and 50% replacement. And in fact even at 70% in spite of very
low chemical shrinkage the maximum value of autogenous shrinkage strain
achieved at early hours was as high as that of the cement if not greater.
One may cross reference with the data from OPC25-P, OPC32-P and OPC38-P and
argue that at OPC25P the setting time is lower than that of OPC32-P and OPC38-P and
should in that case have resulted in lower autogenous shrinkage for OPC25-P. This
however, was not observed in the experimental study during this early age. OPC25-P,
OPC32-P and OPC32P did not show this trend as the presence of lower cement content
in a finite volume of paste at a higher water-cement ratio also decides the amount of
chemical shrinkage achieved which dictates the bulk volumetric deformation until the
setting of the cementitious paste system.
In a cement-fly ash mixture the addition of fly ash in general increases its setting time.
It was also demonstrated in this study that the addition of fly ash contributed to a
reduction in chemical shrinkage especially at early ages. As long as the cementitious
paste system is in its plastic form, any form of chemical shrinkage will result in the bulk
volume change also. Hence If the cementitious system has a delayed or longer setting
time, even with lower chemical shrinkage we could achieve a higher autogenous strain
at early ages for the cases where fly ash is used in partial replacements of cement. It is
also brought to attention that that as setting time influences the development of
autogenous shrinkage at early ages, it is likely that addition of super-plasticizer or set
retarders is more likely to increase the autogenous shrinkage at early ages.
Chapter 8 – Autogenous shrinkage – An overview of controversies
291
8.2.2 Plastic shrinkage or autogenous shrinkage
Before the setting of the cementitious system, chemical shrinkage dominates the
development of autogenous shrinkage and it is less likely that self-desiccation is
dominant. The author is inclined to believe that this type of shrinkage i.e., the
autogenous shrinkage at early ages which is primarily caused by chemical shrinkage
may not necessarily occur only under sealed conditions but may also be possible under
unsealed conditions. There is no specifically explicit reference to this aspect
(autogenous shrinkage under unsealed conditions) in literature so far to the best of the
author’s knowledge. Plastic shrinkage is defined as the shrinkage that occurs in the
surface of fresh concrete within the first few hours after it has been placed, that is when
the concrete is still in its plastic state (Lerch 1957). Clearly in literature where most
researchers have referred to plastic shrinkage being caused by the action of capillary
forces (Wittmann 1976; Radocea 1992) and it being driven by factors like temperature,
relative humidity of external environment and loss of moisture. There has not been any
reference to whether chemical shrinkage plays a role. The author believes that chemical
shrinkage is an added factor which may play a role in cementitious systems under early
ages even when the system is not sealed. This is because whether the sample is sealed or
unsealed under a saturated condition and when the cementitious matrix is weak the bulk
volume is going to change as long as chemical shrinkage occurs. Hence the question
whether autogenous shrinkage measured due to chemical shrinkage at early ages is a
part of the plastic shrinkage is a valid discussion to be raised when studying plastic
shrinkage cracking. Recently studies have progressed on the mitigation of plastic
shrinkage by the use of shrinkage reducing admixtures (Lura, Pease et al. 2007; Mora-
Ruacho, Gettu et al. 2009). Shrinkage reducing admixture contributes to the reduction
of plastic shrinkage by reducing the surface tension of the pore fluid or water in the
cementitious system. At early ages even if the surface tension is reduced the decrease in
chemical shrinkage may not occur. Hence the role of chemical shrinkage is to be
elaborated and added to when studying plastic shrinkage or any early age deformations
under unsealed conditions. The author raises the question why has this component of
autogenous shrinkage due to chemical shrinkage not been studied along with plastic
shrinkage? Is it possibly neglected because the plastic shrinkage associated with the
actual loss of water due to evaporation is much larger in magnitude than that due to the
bulk shrinkage due to chemical shrinkage? Literature shows that the plastic shrinkage in
Chapter 8 – Autogenous shrinkage – An overview of controversies
292
the early ages may be as high as in the order of 1% of the absolute volume of the dry
cement (Swayze 1942) but the value achieved by chemical shrinkage can be as large as
~0.005 ml/gm of cement during the early 6 hours in the higher water-cementitious ratio
mixtures. Hence a study on the role of chemical shrinkage in plastic shrinkage may be
worth investigating before a conclusion is drawn.
This opens a debate also on whether chemical shrinkage at such early ages can be
treated as a part of plastic shrinkage. If chemical shrinkage is treated as part of plastic
shrinkage then autogenous shrinkage measurements may not commence prior to set and
only self-desiccation shrinkage may be categorized as autogenous shrinkage. This is
somehow beyond the scope of this research but a joint research group is needed to
properly define and stipulate the criteria for defining autogenous shrinkage. But it is
important to remember that although each of these shrinkage studies can be carried out
independently, a combination of two or more of shrinkage types are going to occur in
real structures.
Recalling JCI definition (Tazawa 1999) of autogenous shrinkage ….“Autogenous
shrinkage is the macroscopic volume reduction of cementitious materials when cement
hydrates after the initial setting. It does not include volume change due to loss or
ingress of substance, temperature variation, application of an external force or
restraint”. There is a clear indication that the committee had decided to consider the
autogenous shrinkage after the time of initial set. But if we refer to the Bentz and Jensen
(2004) work, they define autogenous deformation of concrete as … “the unrestrained,
bulk deformation that occurs when concrete is kept sealed and at a constant
temperature”. The time frame is not stipulated to be from the point of initial set and
studies from early ages have been studied by them. The author, in this study, is inclined
to believe that autogenous shrinkage may be accounted for from the moment the cement
paste comes in contact with water. But in reality we have to argue the necessity for
measurement from such early ages. For example the code stipulates a 7 day curing for
drying shrinkage, before any measurements to assess the drying shrinkage of the
concrete is carried out. This is because it is presumed that for the first 7 days curing will
be carried out at the site or suitable curing methods be adopted. Hence firstly it is more
suitable to adopt a universal drying shrinkage curing regime which depicts the site
Chapter 8 – Autogenous shrinkage – An overview of controversies
293
conditions and secondly it is more logical to assess the drying shrinkage characteristics
of a reasonably matured concrete.
Similarly when a universal test method is to be designed for autogenous shrinkage the
time frame of measurement i.e., measurements beginning from the time of sealing or
measurements beginning from the time of addition of water, has to be clearly outlined.
Such a code stipulated time frame must be a representation of the site condition the
concrete is likely to experience. Autogenous shrinkage is dominant only in high strength
concrete mixtures. The curing regime in high strength concrete involves various
methods as misting, applying an evaporation retarder or using curing compounds (ACI-
363 1995). These curing methods are suggested to be employed immediately after
placement for high strength concrete mixtures. Contrasting such a code stipulated strict
curing regime with the practice of material scientists attempting to measure autogenous
shrinkage by sealing the specimen with no curing, points out to the gap between
research practices and practical considerations. The likelihood for high strength
structural concrete to be sealed immediately after placement is low unless the concrete
placed may be mass concrete or special concrete that is sealed using a sealing
compound. Hence the right testing method should correctly assess the autogenous
shrinkage to be experienced at site of placed high strength concrete. Nevertheless
information from the very early age regarding autogenous shrinkage would give
numerous options to the designer as variables are changed according to the material
characteristics suiting his/her site conditions.
8.2.3 Influence of bleeding on early age autogenous shrinkage
Most mixtures of cementitious paste in this study using corrugated tubes showed some
kind of swelling after achieving a peak value during the early hours (~setting time of
paste). Hammer et al (2002) postulated that the bleeding characteristics could
potentially be a source of error in the measurement of autogenous shrinkage at early
ages. He insisted that the collection of bleed water on the surface of the specimen might
influence the autogenous shrinkage in early ages i.e., by leading to a sedimentation
phenomenon thereby a movement of the cementitious material in the vertical
direction(Radocea 1992). Similarly the re-adsorption of the bleed water when the
Chapter 8 – Autogenous shrinkage – An overview of controversies
294
concrete is stiffening can probably show a reduced autogenous shrinkage or even
expansion. If two mixtures have potentially different bleed characteristics then a
comparison of the early age autogenous shrinkage would not be meaningful. Having
said this, an expansion was observed in most of the cementitious paste samples studied
using the corrugated tube, (refer to Chapter 6). A similar expansion was also reported by
Barcelo et al (2005) when volumetric bulk deformation was studied on sealed
specimens. But they related this to the higher lime and the sulphate to alkali ratio.
Nevertheless at the early ages, irrespective of the chemical interaction of the hydration
products and the presence of higher lime or sulphate to alkali ratio, the bleeding of the
cementitious paste and re-adsorption of the bleed water by cementitious paste system
when it begins to self-desiccate is likely to cause a reduced autogenous shrinkage or
expansion. This expansion will occur only immediately after the setting of the
cementitious system and should not be confused with any expansion that may occur
after 24 hours.
8.2.4 Summary
It could hence be summarized in general that at early ages the key factors which are
setting time and chemical shrinkage play a vital role in determining the strain values
that occur under sealed condition. In addition, physical characteristics like bleeding may
contribute to alter the rate of development or interaction within the microstructure
during the development of autogenous shrinkage at such early ages. It may not be
overruled that the key factors driving chemical shrinkage are the early age kinetics of
hydration and the chemical reactions of the cementitious material. Factors like fineness
of the cementitious material, water-cement ratio, chemical composition which
contribute or may alter the hydration mechanism at early ages will eventually alter the
rate of development of chemical shrinkage and hence the autogenous shrinkage at early
ages as it may be called.
8.3 Autogenous deformations (>24 hours)
Autogenous shrinkage measurements beyond 24 hours is mostly after the time of set of
the cementitious paste. Unlike early age where chemical shrinkage alone played the
most dominant role, at later ages self desiccation is the key factor as reported in
Chapter 8 – Autogenous shrinkage – An overview of controversies
295
literature (Lura, Jensen et al. 2003). Chapter 2 described self desiccation i.e., the
internal drop in relative humidity within the hydration cementitious system as hydration
proceeds under sealed conditions.
8.3.1 Relative Humidity
Researchers have accepted that autogenous shrinkage is closely associated with the
change in relative humidity within the system. A generic model depicting the actual
mechanism of the intrinsic change in relative humidity within the pores has been
postulated (Lura, Jensen et al. 2003). However, the complexity of the phenomenon is
not clearly presented. Experimental determination of RH change was measured using
hygrometers or suitable RH sensors. The measured RH change has been found to be
influence by several factors and the most important being that due to the dissolved salts
in the pore fluid.
Elaborating this further; the Raoult’s law o
AAA PXP = (Brown and H. Eugene Lemay 1981)
Where
PA = Vapour pressure of the solution
XA = mole fraction of the solvent
oAP = vapour pressure of the pure solvent
can be re-expressed as
RHs = X1 (Lura, Jensen et al. 2003)
where
X1 = molar fraction of water in the pore fluid
RHS = Relative humidity due to dissolved salts
Studies on the chemical analysis of pore fluid by Page and Vennesland (1983) was used
by Lura et al (2003) to demonstrate the reduction in RH due to dissolved salts at early
ages. The RH due to dissolution of salts was separated from experimentally measured
RH to obtain the RH change due to self desiccation alone. Even if we are successful
with separating out the RH change due to self desiccation from that due to the salt
dissolution, the complexity in the experimental determination of RH and extensive
calibration required is to be highlighted.
Chapter 8 – Autogenous shrinkage – An overview of controversies
296
To explain some of the factors which would influence RH change measurements due to
self desiccation we recollect the relationship between RH change and radius of the
largest water filled pore (explained in Chapter 2) and how it is correlated to the
reduction in bulk volume.
⎟⎠
⎞⎜⎝
⎛ −=rRT
VRH mγ2
)ln( (Bentz and Jensen 2004)
Once the RH is measured, it would be logical to determine the radius of the largest
water-filled pore which is then related to the capillary tension in the pore fluid;
rcapγσ 2
= (Bentz and Jensen 2004)
Knowing the acting capillary forces, one can model the bulk volume change using
known material property of the partially saturated cementitious paste system (porous
medium). These are extensively theoretical and several difficulties may be faced by the
researcher if such a path is chosen to model autogenous shrinkage. The complexity is
briefly discussed in the following paragraphs.
8.3.1.1 Surface tension (γ )
The most important of these would be the determination of the surface tension of the
pore fluid. The surface tension of pure water could be readily measured using the Du
Noüy Ring method or any other suitable method. The microstructure of the cementitious
system pore fluid is not pure water. The property of the pore fluid directly influences the
measurement of RH within the system and the capillary pressure. As hydration proceeds
the amount of dissolved salts present in the pore fluid changes continuously. Hence the
surface tension used to model autogenous shrinkage cannot be treated a constant. No
independent study has been carried out to the best of author’s knowledge in order to
examine whether the difference in surface tension between pure water and pore fluid
would significantly affect the RH change. We assume the properties of pure water in
our theoretical analysis for the pore fluid. Hence it is neither clear nor certain whether
the use of surface tension values of pure water is justifiable or that the pore fluid is
required for a more valid choice. Researchers may argue it is perfectly valid to have
Chapter 8 – Autogenous shrinkage – An overview of controversies
297
assumptions such as that of the surface tension of pure water for that of the pore fluid
(Lura, Jensen et al. 2003) in describing a complex phenomenon such as autogenous
shrinkage. But the author believes it has to be brought to the attention of the reader of
such an assumption and its implication.
8.3.1.2 Temperature
The measurement of RH within a porous system is highly influenced by the temperature
of the system as the surface tension values are sensitive to temperature. It is important
that when experimental determination of RH is carried out, the RH of the sample and
the surrounding equilibrium air temperature has to be maintained at the same temperate.
8.3.1.3 Calibration of Sensors
The RH change falls in the higher range of 75% - 100% making the actual range of
measurement very small and hence even an error of 1% makes the error estimated range
from 4% to 5% and such error values are quite high.
8.3.2 Transport Property
Using the standard values of surface tension and molar weight of water as given by Lura
et al (2003), the RH vs the radius of the largest water filled pore was plotted. Figure 8-1
shows the actual variation in RH as the radius of meniscus decreases for standard values
of surface tension, temperature, molar weight and density of water. The figure clearly
shows the logarithmic change in RH as the radius of meniscus drops. But what is of
more importance is the actual radius of the water filled pores. Jiang et al (2006) showed
that the relative humidity change measured in a cement paste mixture of w/c 0.2
decreases to as low as 79 % and that of a w/c 0.5 decreases only to 95 % (Sealed
measurements). The range of RH change is much smaller when compared to the
decrease in the size of the largest water filled pore size as RH decrease. The natural
logarithm of the RH change being inversely proportional to the pore size is the prime
cause. As RH drops below 90%, the radius of the largest water filled pore radius drops
below ~10-8 m (0.01μm or 10nm) hence likely to influence the transport properties of
the moisture within the sealed sample.
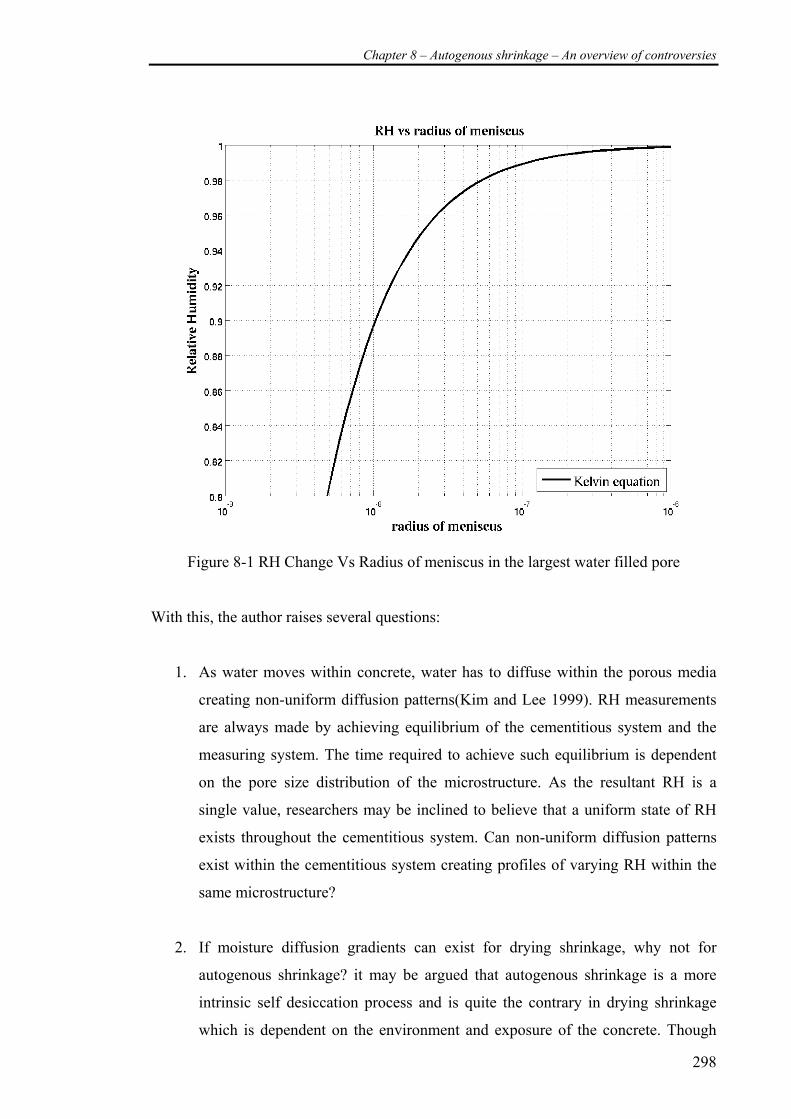
Chapter 8 – Autogenous shrinkage – An overview of controversies
298
Figure 8-1 RH Change Vs Radius of meniscus in the largest water filled pore
With this, the author raises several questions:
1. As water moves within concrete, water has to diffuse within the porous media
creating non-uniform diffusion patterns(Kim and Lee 1999). RH measurements
are always made by achieving equilibrium of the cementitious system and the
measuring system. The time required to achieve such equilibrium is dependent
on the pore size distribution of the microstructure. As the resultant RH is a
single value, researchers may be inclined to believe that a uniform state of RH
exists throughout the cementitious system. Can non-uniform diffusion patterns
exist within the cementitious system creating profiles of varying RH within the
same microstructure?
2. If moisture diffusion gradients can exist for drying shrinkage, why not for
autogenous shrinkage? it may be argued that autogenous shrinkage is a more
intrinsic self desiccation process and is quite the contrary in drying shrinkage
which is dependent on the environment and exposure of the concrete. Though
Chapter 8 – Autogenous shrinkage – An overview of controversies
299
self desiccation is an internal phenomenon it is dependent on the internal
microsture of the cementitious paste system which is not necessarily uniform.
Without a explicit research study clarifying this, moisture diffusion patterns
cannot be presumed to not exist.
With RH decreasing, the radius of the largest filled pore is all that matters. But for a
unified largest water filled pore diameter to exist throughout the microstructure, water
or moisture may have to re-arrange or move within the system to achieve an equilibrium
relative humidity. In that case, the movement of moisture within the system has to be
diffusion dependent. We are aware that diffusion through capillary pores is not the same
as that of the gel pores. With pore diameter of the largest water filled pore reducing
below 10nm as the RH drops below 90% there is a higher likelihood that this diffusion
process is a combination of ordinary diffusion and surface diffusion (Xi, Bazant et al.
1994). Hence it may be important to understand that when measurements are done by
equilibrating the sample to achieve a constant RH, the actual time lag between the
measurement and the RH within the sample may exist as well. The applicability of
Kelvin equation for very low pore size is also questionable and researchers have been
limiting the pore size for the reliability of use of Kelvin equation(Sing 2001). Hence
further research may be required before relative humidity change can be used as the sole
indicator for measuring self-desiccation. Meanwhile this criterion is still considered the
best theoretical approach to understand the mechanism.
8.3.3 Internal drying factor
The internal drying factor (identified in Chapter 6) where the autogenous shrinkage of
the cementitious paste system was found to be related to the ratio of the volume of the
empty pores to that of the total porosity, may be an alternative to develop a semi-
empirical relationship instead of using RH change.
porositytotalporesemptyofvolume
sh ....
∝ε

Chapter 8 – Autogenous shrinkage – An overview of controversies
300
Where εsh is the free autogenous shrinkage strain. Obviously the amount of empty pores
formed at any instant is a function of the amount of chemical shrinkage occurring within
the closed system as any amount of chemical shrinkage is most likely to translate to
empty pores within the system after the time of set.
Hence it would be justifiable to express the above expression as
porositytotaltshrinkagechemicaltshrinkagechemical
sh .)(.)(. 0−
∝ε
Where,
εsh = autogenous shrinkage in the cementitious paste system
chemical shrinkage (t)= volume of chemical shrinkage at a time ‘t’ expressed as
a fraction of a finite volume of the cementitious paste.
chemical shrinkage (t0)= volume of chemical shrinkage at a time of set
expressed as a fraction of a finite volume of the
cementitious paste.
.
total porosity = volume of total voids expressed as a fraction of a finite
volume of the cementitious paste system.
In this study, the internal drying factor was determined from simulations of
CEMHYD3D for the cementitious paste system. It is possible to have determined this
internal drying factor experimentally as well provided the total porosity and chemical
shrinkage of the cementitious system at the lower water-cement ratio were obtained
experimentally. Hence the possibility to determine the internal drying factor from well
established experimental methods exists. This is in contrast to the RH Change approach
which is too complex to be extensively used in concrete applications in a generalized
manner. Researchers may argue that in order to determine the internal drying factor we
require data on the chemical shrinkage and as well as the total porosity while RH
Chapter 8 – Autogenous shrinkage – An overview of controversies
301
measurements is a single experimental value to be determined. The author believes RH
measurement is a less well established test method for concrete. The measurement range
is mostly between 100% and 80% making even 1% RH error very high. RH
measurements also require extensive calibration of the probe with higher importance to
be devoted to the temperature of the specimen and the equilibrium air surrounding it.
But in the alternative method, a factor like internal drying factor can be easily
determined using well established experimental methods (i.e., chemical shrinkage and
total porosity) or using CEMHYD3D (simulation model) provided sufficient calibration
of the model is done using a suitable experimental data such as the chemical shrinkage
or the degree of hydration is done. With experimental evidence showing that total
porosity as well as chemical shrinkage can be related to the degree of hydration (Geiker
1983; Frías and Cabrera 2000), it may be possible to determine this internal drying
factor from a single degree of hydration value for simple cementitious systems. If a
semi empirical relation was to be developed as
)(idfash =ε
Where a = coefficient of proportionality
idf = internal drying factor
This above expression is analogous
)( Tathermalth Δ=ε
Where
αthermal = thermal coefficient of expansion
ΔT = temperature change
We know that “αthermal” being dependent on the material property similarly “a” is
consequently dependent on the response of the material to the amount of internal drying
that occurred. Similarly, this would be the case with autogenous shrinkage and internal
drying factor. Chapter 6 showed that the slopes were not necessarily the same across the
cementitious system for autogenous shrinkage vs. internal drying factor but this is

Chapter 8 – Autogenous shrinkage – An overview of controversies
302
something which may require further more extensive study over a wider range and
scenarios before establishing a semi-empirical model. Hence “a” may be a characteristic
dependent on the cementitious system (similar to a material property) whose “idf” is
dependent on the self desiccation occurring due to the increase in the degree of
hydration “α”.
8.3.4 Aggregate Restraint
The aggregate restraint is of equal concern when comparison or correlation between the
free autogenous shrinkage of paste sample and free autogenous shrinkage of concrete
samples are made. In the concrete samples, the free bulk volume change is a result of
the restrained free autogenous shrinkage of the paste, the modelling of aggregate
restraint is not straight forward. Simple models like that of Hobbs (1974) may give an
indication of the restraint offered but requires more information on the mechanical
properties of the paste and the aggregate at every instance of time. The mechanical
properties are not a constant for the paste as the hydration proceeds and hence the use of
a single value of the elastic or the bulk modulus increases the error.
8.3.5 Compressive Strength
When studies on concrete were made at 1 year it was observed that the autogenous
shrinkage was related to the compressive strength of the concrete at the end of 1 year.
This further strengthens the argument of using internal drying factor as a key factor in
the autogenous shrinkage. Compressive strength has always been considered to be
related to the gel/space ratio of the cementitious system. The gel/space ratio is defined
as the ratio of hydrating cement paste to that of the sum of the volumes of the hydrated
cement and the capillary pores. The gel-space ratio being dependent on the degree of
hydration achieved by the cementitious system and on the amount of capillary voids
present, could in turn be related to the chemical shrinkage and total porosity of the
system and hence the internal drying factor.
8.3.6 Autogenous shrinkage Vs Drying shrinkage
Interestingly, in cement-silica fume systems and cement-slag systems, when the
autogenous shrinkage was very high, it was observed that the autogenous shrinkage was
Chapter 8 – Autogenous shrinkage – An overview of controversies
303
higher than that of the simple unsealed (drying) shrinkage at 1 year. This has been
relatively a new aspect investigated in this study. In the past moisture gradients been
studied in drying shrinkage to model differential shrinkage strains. Similarly we can
have the same scenario in a cementitious system that is partly sealed and partly
unsealed, i.e., the bulk concrete is such that the outer microstructure still has a few
capillary pores open to the external drying environment while the inner microstructure
has disconnected capillary system. This results in the outer microstructure experiencing
drying shrinkage due to evaporation loss and inner microstructure autogenous shrinkage
both at different rates. The resultant would be differential shrinkage of the concrete or
cementitious system. This concept of differential shrinkage is relatively new (though
differential shrinkage due to drying shrinkage has been studied) and may require further
investigation specially when it may lead to serious defects in larger concrete structures.
8.4 Summary
It is clear from the discussion in this chapter that though research has progressed with
autogenous shrinkage into its behaviour under restrained condition or mitigation of
autogenous shrinkage, there are fundamental uncertainties which still exist across the
literature. With still a universally accepted definition for autogenous shrinkage not
existing and a reliable test method not evolved completely, such an uncertainty may
continue to prevail as every researcher’s approach leads to a different scenario that may
add to the confusion in this area of knowledge. It is therefore evident that a great deal of
research is needed in order to arrive to universally accepted definitions, and possible
modelling that may be easy to use by concrete practitioners.
Chapter 9 – Conclusions and recommendations for future study
304
CHAPTER 9 -CONCLUSIONS AND RECOMMENDATIONS FOR
FUTURE STUDY
9.1 Conclusions
High strength and high performance concrete mixtures are and will be driving the
current concrete research community. Autogenous shrinkage which is likely to occur in
these specialized concretes should be well understood and mitigated so as to exploit the
full potential of the material.
This study had been carried out to not only determine the autogenous shrinkage but also
to address basic factors influencing its development. In doing so the author was
confronted by the enormous complexity in the phenomenon and by the uncertainties in
its basic experimental procedures and boundary definitions. The various findings are
presented in the subsequent subsections below, followed by recommendations for future
study.
9.1.1 Experimental procedure
Though prismatic samples wrapped in aluminium foil tape was easier to cast, the author
strongly believes the specialized corrugated tube developed by Jensen (1995) is a much
better alternative and offers flexibility in measurements from very early hours. The
corrugated tube is more logical as it is able to capture volumetric deformation when in
plastic state and linear deformation when the cementitious matrix has hardened. The
improvement to the test method by using proximity sensors for non-contact
measurements should be preferred when studies involve measurements where the
cementitious matrix is very weak before it has set. The author regrets that such a
suitable technique has not been completely developed for concrete as well but was
beyond the scope of this research.
Chapter 9 – Conclusions and recommendations for future study
305
9.1.2 Numerical simulation using CEMHYD3D
CEMHYD3D has been a valuable tool in bringing out information on the microstructure
of the hydrating cementitious system. Its uniqueness lies in the ability to model
scenarios of sealed hydration brings and obtain valuable information which may have
been difficult to obtain using standard experimental procedures. The flexibility of the
numerical model to incorporate supplementary cementitious materials like silica fume,
fly ash or slag helps in bridging the gap between independent numerical studies and
experimental investigations. In many cases it is quite difficult to design experimental
studies to suit a numerical model or vice versa, while CEMHYD3D has a vast potential
and opportunities and hence was successfully used to interpret micro-structural changes
that cause autogenous shrinkage strains.
9.1.3 Chemical Shrinkage
In Chapter 5 the author experimentally observed that addition of supplementary
cementitious materials greatly influenced the development of chemical shrinkage.
• Silica fume at 10% replacement and a constant water-cementitious ratio resulted
in higher chemical shrinkage at ages up to 90 days. It was postulated from
simple stoichiometry equations that the pozzolanic reaction of silica coupled
with higher fineness and reactivity contributed to this high chemical shrinkage.
• The increase in addition of fly ash resulted in a decrease in chemical shrinkage.
A sharp decrease in chemical shrinkage was observed at 90 days for
replacements of 50% and 70% by fly ash and water-cementitious ratio of 0.7.
• Chemical shrinkage increased with slag replacements up to 50% followed by
decline in chemical shrinkage at 70%. There was a period of dormant stage i.e.,
very small value of chemical shrinkage during the early 6-10 hours after
beginning the test for all mixtures with slag.
A strong emphasis is laid on the hydration kinetics and hydration stoichiometry when
predicting the development of chemical shrinkage. The proposed stoichiometry model
for estimation of the ultimate chemical shrinkage in plain cement mixture brings out
valuable information on how chemical shrinkage can be widely used to study aspects of
Chapter 9 – Conclusions and recommendations for future study
306
hydration of cementitious systems. Simple bougue’s composition may be sufficient to
explain the ultimate value of chemical shrinkage from basic hydration rules as
guidelines, but such predictions are highly dependent on properties such as the specific
gravity and molecular weight of the phases.
The proportionality between the degree of hydration and chemical shrinkage is
questioned and its uncertainties at early ages of hydration (~6 hours) are pointed out.
With the addition of supplementary cementitious materials, the chemical shrinkage
becomes a function of variables; a) the hydration of the cement, and b) the hydration of
the supplementary cementitious material as well. Hence a much detailed study has to be
carried out to ascertain the validity and suitability of the use of chemical shrinkage to
understand hydration kinetics in cementitious systems in binary and ternary blends. The
author wishes to point out the inconsistency in the literature in expressing chemical
shrinkage of cementitious paste and has expressed the view that expressing chemical
shrinkage as ml/gm of cement in binary blends is misleading as the amount of cement is
not constant in a finite volume of paste. Hence it is suggested that it is more appropriate
to express chemical shrinkage as ml/gm of cementitious material or ml/ml of paste.
9.1.4 Autogenous shrinkage in paste samples
Chemical shrinkage was found to directly influence the development of autogenous
shrinkage at very early ages (~before the setting of the cementitious system). Though
chemical shrinkage has been reported in the literature to be one of the important factors
contributing to autogenous shrinkage it was observed in this study that an increase in
chemical shrinkage would not necessarily result in higher autogenous shrinkage (This
has been discussed in detail in Chapter 6). Chemical shrinkage was indirectly linked to
other factors like self desiccation or ‘the internal drying factor’. Hence the effect of
chemical shrinkage on these factors is more of concern rather than the chemical
shrinkage itself. The primary observation was that of the autogenous shrinkage in paste
samples. As the water-cement ratio was decreased so did the chemical shrinkage. But
this decrease in chemical shrinkage still contributed to an increase in autogenous
shrinkage. This was the primary reason for the author to believe that the effect of
Chapter 9 – Conclusions and recommendations for future study
307
chemical shrinkage on factors contributing to autogenous shrinkage is of greater
importance rather than the actual value of chemical shrinkage itself.
In silica fume concrete mixtures which experience pore refinement as well as higher
chemical shrinkage, collectively contributed to the increased autogenous shrinkage.
Cement – fly ash paste mixtures had lower autogenous shrinkage strain at ages up to 90
days. This decrease was larger as fly ash replacement was increased. The author
believes the higher porosity and delayed pozzolanic reactivity coupled with lower
chemical shrinkage contributed to this reduced autogenous shrinkage.
Slag with 50% replacement had the highest autogenous shrinkage though all of the slag
replacements showed a higher autogenous shrinkage compared to plain cement concrete
mixtures. The slag dosage at 50% would have been the optimum dosage for CH demand
and consumption, thus contributing the highest degree of hydration of both cement and
slag, and resulting in higher autogenous shrinkage.
Internal drying factor
The “internal drying factor” defined as the ratio of volume of empty voids to that of the
total porosity is found to be a very promising criterion. This parameter has been
proportional to the amount of autogenous shrinkage; i.e. as the “internal drying factor”
within the cementitious paste system increased so did the autogenous shrinkage. This
relationship existed for all mixtures with various blends.
9.1.5 Autogenous shrinkage in concrete samples
The lack of early age measurement (< 24 hours) of autogenous shrinkage in the case of
concrete study had an influence on the observations up to 28 days especially in plain
cement concrete mixtures. Plain cement concrete mixtures did not necessarily show a
higher autogenous chemical shrinkage at early ages as the water-cement ratio was
decreased.
Cement-silica fume systems predominantly showed the highest autogenous shrinkage
strains. This was evident from paste studies as well where, lower porosity, lower free
Chapter 9 – Conclusions and recommendations for future study
308
water-content and pore refinement, all coupled with higher autogenous shrinkage
contributed to silica fume concretes to be more prone to autogenous shrinkage. High
performance and high strength concrete mixtures incorporating silica fume should be
investigated for the likely autogenous shrinkage under sealed conditions.
Fly ash when added to plain cement concrete mixtures resulted in short term reduction
of autogenous shrinkage, though at all times the measurements were lower than that of
the plain cement concrete mixtures. But most of the development in autogenous
shrinkage in cement-fly ash mixture occurred beyond the initial 28 days of hydration.
The slope of the autogenous shrinkage strain was steeper beyond the 28 days. This may
be of importance as fly ash is thought to reduce autogenous shrinkage. The later stage
acceleration of autogenous shrinkage was primarily due to the pozzolanic reactivity and
has to be more understood clearly before fly ash can be suggested as a measure for the
mitigation of autogenous shrinkage.
Cement-slag system showed higher autogenous shrinkage despite the assumption that
slag reactions are driven by CH content within the hydrating paste. This assumption
may not be wholly valid and reactivity of slag in the absence of CH may have to be
studied so as to better understand why slag contributed to the higher autogenous
shrinkage. An increase in fineness may also have been a cause.
9.1.6 Compressive strength
The author observed that 1 year cured samples with higher compressive strength also
had a higher autogenous shrinkage. Compressive strength is a function of gel-space
ratio (Neville 1995). The gel-space ratio is a function of the amount of hydration
product formed and the capillary pores. This factor of gel-space ratio would be worth
investigating for future research so as to more clearly understand its link to autogenous
shrinkage. Nevertheless the author has observed that irrespective of the cementitious
system, an increase in compressive strength at 1 year was associated with an increase in
autogenous shrinkage.
Chapter 9 – Conclusions and recommendations for future study
309
9.1.7 Modelling autogenous shrinkage
The modelling of autogenous shrinkage has been approached by various researchers
using self desiccation i.e., the change in relative humidity within the closed system. The
author suggests that “internal drying factors” can also be used to model autogenous
shrinkage in cementitious paste systems.
9.2 Recommendations for future study
Several aspects of autogenous shrinkage require extensive study in the near future.
Research communities working on various problems associated with autogenous
shrinkage should form joint efforts and networks to effectively study much of the
aspects of autogenous shrinkage within a short span in order to make it readily available
for structural designers.
Some of the recommendations for future study limited to free autogenous shrinkage
measurement include:
1. A well accepted definition for autogenous shrinkage is to be put forward by
the global concrete community so as to reduce ambiguity in research and
reporting.
2. A standardized test method for autogenous shrinkage should be adopted for
paste, mortar and concrete samples with the flexibility to measure early age
deformations.
3. The mechanism of autogenous shrinkage using Kelvin and Laplace
equations need to be extensively studied keeping in mind the limitations of
these equations and pointing out the assumptions and their impact on the
prediction and modelling.
4. RH measurements techniques need to be more thoroughly reviewed and
validated before it can be suggested for measuring self desiccation owing to
its difficulty and sensitivity while the measurements are carried out.
5. “Internal drying factor” has been found in this study, to be an important
criterion and hence an independent research is worth to extensively study
Chapter 9 – Conclusions and recommendations for future study
310
this aspect with the possibility that it be used as an alternative to internal RH
measurement.
6. Gel-space ratio and its link to autogenous shrinkage are important to
understand and establish a definite correlation between compressive strength
and autogenous shrinkage in normal cementitious systems.
7. There is an immediate need to bridge the gap between numerical and
experimental studies, hence much more work is needed in both the
experimental and numerical directions so as to cross-confirm experimental
findings and numerical modelling.
8. The ability of predicting and verifying free autogenous shrinkage under real
scenarios are of paramount practical importance. Thus, monitoring actual
structures and correlating the results with numerical modelling as well as
meticulous laboratory testing are of areas of highly recommended future
research.

Chapter 9 – Conclusions and recommendations for future study
311
References
312
REFERENCES
ACI-363 (1995). A state of the art report on high strength concrete. ACI Manual of concrete practise. American-Concrete-Institute.
Ahmed, M. S. (2007). Effects of systematic increase of pozzolonic materials on the mechanical, durability and microstructural characteristics of concrete. School of ACME. Canberra, UNSW@ADFA. PhD Thesis.
Aitcin, P. C., Ed. (1999). Autogenous shrinkage measurement. Autogenous shrinkage of concrete, E&FN Spon, London.
Akkaya, Y., M. Konsta-Gdoutas, et al. (2004). The pore structure and autogenous shrinkage of High Performace Concrete with Ternary Binders. Eigth CANMET/ACI International Conference on Fly Ash, Silica Fume, Slag and Natural Pozzolans in Concrete : ACI SP 221. V. M. Malhotra: 233-247.
Akkaya, Y., M. Konsta-Gdoutas, et al. (2004). The pore structure and autogenous shrinkage of High Performance Concrete with Ternary Binders. 8th CANMET/ACI International Conference on Fly Ash, Silica Fume, Slag and Natural Pozzolans in Concrete : ACI SP 221. V. M. Malhotra: 233-247.
Al-Saleh, S. A. and R. Z. Al-Zaid (2006). "Effects of drying conditions, admixtures and specimen size on shrinkage strains." Cement and Concrete Research 32: 1985-1991.
Aldred, J. M. and S. N. Lee (2004). Factors affecting the autogenous shrinkage of ground granulated blast furnace slag cement concrete. 8th CANMET/ACI International Conference on Fly Ash, Silica Fume, Slag and Natural Pozzolans in Concrete : ACI SP 221. V. M. Malhotra: 783-796.
Almudaiheem, J. A. and W. Hansen (1987). "Effect of specimen size and shape on drying shrinkage of concrete." ACI Materials Journal March-April: 130-135.
Alshamsi, A. M., A. R. Sabouni, et al. (1993). "Influence of set retarding superplasticizer and microsilica on setting times of pastes at various temperatures." Cement and Concrete research 23: 592-598.
AS-1478.1 (2000). "Chemical admixtures for concrete, mortar and grout. Part 1 : Admixtures for concrete." Australian Standards.
AS-2350.9 (2006). "Methods of testing portland, blended and masonry cements. Method 9 : Determination of residue on the 45 microns sieve." Australian Standards.
AS-2350.13 (2006). "Methods of testing portland, blended and masonry cements. Method 13 : Determination of drying shrinkage of cement mortars." Australian Standards.
References
313
AS-3582.3 (1994). "Supplementary cementitious materials for use with portland cement." Australian Standards.
AS-3583.1 (1998). "Methods of test for supplementary cementitious materials for use with portland and blended cement. Method 1 : Determination of fineness by the 45 micrometer sieve." Australian Standards.
AS-3583.5 (1991). "Methods of test for supplementary cementitious materials for use with portland cement. Method 5: Determination of relative density." Australian Standards.
AS-3972 (1997). "Portland and blended cements." Australian Standards.
ASTM-C-490 (1996). "Standard practice for use of apparatus for determination of length change of hardened cement paste, mortar and concrete." ASTM Standards International.
ASTM-C-1608 (2006). "Standard test method for chemical shrinkage of hydraulic cement paste." ASTM Standards International.
Barcelo, L. (2002). "Chemical shrinkage." Early Age Cracking in Cementitious System - Report of RILEM Committee TC 181-EAS: 337pp.
Barcelo, L., S. Boivin, et al. (1999). Linear vs volumetric autogenous shrinkage measurement : Material behaviour or experimental artifact? Second International Conference on Self Desiccation and its importance in concrete technology.
Barcelo, L., M. Moranville, et al. (2005). "Autogenous shrinkage of concrete: A balance between autogenous swelling and self-desiccation." Cement and Concrete Research 35(1): 177-183.
Baroghel-Bouny, V., P. Mounanga, et al. (2006). "Autogenous deformations of cement pastes: Part II. W/C effects, micro-macro correlations, and threshold values." Cement and Concrete Research 36(1): 123-136.
Beltzung, F. and F. Wittmann (2002). Influence of cement composition on endogenous shrinkage. Self Desiccation and its importance in concrete technology : Third International research seminar. Lund University.
Bentur, A., S. I. Igarashi, et al. (2001). "Prevention of autogenous shrinkage in high-strength concrete by internal curing using wet lightweight aggregates." Cement and Concrete Research 31(11): 1587-1591.
Bentz, D. P. (1995). A Three dimensional cement hydration and microstructure program I Hydration rate, Heat of hydration and chemical shrinkage, NISTIR 5756, National Institute of Standards and Technology.
References
314
Bentz, D. P. (1997). Guide to using CEMHYD3D : A three dimensional cement hydration and microstructure development package. Technical report NISTIR 5977.
Bentz, D. P. (2000). Technical note VCCTL 02 : SEM / X-ray imaging of cement powders.
Bentz, D. P. (2006). "Capillary porosity depercolation / repercolation in hydrating cement pastes via low-temperature calorimetry measurements and CEMHYD3D modelling." Journal of American Ceramic Society 89(8): 2606-2611.
Bentz, D. P. (2006). Personal Communication (Email).
Bentz, D. P. (2007). Cementitious materials : Hydration chemistry and characterization (Personal Communication).
Bentz, D. P. (2007). "A Virtual Rapid Chloride Permeability Test." Cement & Concrete Composites 29(10): 723-731.
Bentz, D. P., Garboczi, E.J., Martys, N., Snyder, K.A., Guthrie, W.S., Kyritsis, K., and Neithalath, N (2009). "Virtual Testing of Concrete Transport Properties." ACI Fall 2009 session on Material Science Modelling as a Solution to Concrete Problems.
Bentz, D. P., C. J. Haecker, et al. (2002). Prediction of cement physical properties by virtual testing. Process Technology of Cement Manufacturing, Proceedings of the 5th International VDZ Congress.
Bentz, D. P. and O. M. Jensen (2004). "Mitigation strategies for autogenous shrinkage cracking." Cement and Concrete Composites 26(6): 677-685.
Bijen, J. (1996). "Benefits of slag and fly ash." Construction and Building materials 10(5): 309-314.
Bisschop, J., Ed. (2002). Evolution of solid behaviour. Rilem Report No 25 : Early age cracking in cementitious systems.
Bjontegaard, O. (1999). Thermal dilation and Autogenous deformation as driving forces to self-induced stresses in High Performance Concrete. Division of Structural Engineering, Norwegian University of Science and Technology. PhD.
Boivin, S., P. Acker, et al. (1999). Experimental assessment of chemical shrinkage of hydrating cement pastes. Autogenous shrinkage of Concrete. E.-i. Tazawa, E & FN Spon.
Brooks, J. J., J. G. Cabrera, et al. (1999). Factors affecting the autogenous shrinkage of silica fume high strength concrete. Autogenous Shrinkage of Concrete. E.-i. Tazawa, E & FN Spon.
References
315
Brown, T. L. and J. H. Eugene Lemay (1981). Chemistry - The central science, Prentice/Hall International.
Campbell-Allen, D. and J. R. Booker (1973). "Size effects in drying and shrinkage of concrete." Materiaux et constructions 6(32): 151-152.
Chan, W. W., C. Y. Liu, et al. (1998). Effects of slag and fly ash on the autogenous shrinkage of high performance concrete. Autogenous Shrinkage of Concrete. E.-i. Tazawa, E & FN Spon.
Chan, Y. W., C. Y. Liu, et al. (1999). Effects of slag and fly ash on the autogenous shrinkage of high performace concrete. Autogenous shrinkage of concrete. E.-i. Tazawa, E&FN Spon, London.
Chan, Y. W., C. Y. Liu, et al. (1999). Effects of slag and fly ash on the autogenous shrinkage of high performance concrete. Autogenous shrinkage of concrete. E.-i. Tazawa, E&FN Spon, London.
Charron, J. P., J. Marchand, et al. (2001). "Early age deformations of hydrating cement paste systems : Comparison of linear and volumetric shrinkage measurements." Concrete science and engineering Vol 3.
Charron, J. P., J. Marchand, et al. (2002). Comparative study of the effects of water/binder ratio and silica fume on volume instability of hydrating cement pastes at early age. Self Desiccation and its importance in concrete technology : Third International research seminar Lund University.
Chen-yi, H. and R. F. Feldman (1985). "Hydration reactions in portland cement-silica fume blends." Cement and Concrete Research 15: 585-592.
Chen, W. (2006). Hydration of Slag cement : Theory, Modelling and Application, University of Twente. PhD
Chen, W. and H. J. H. Brouwers (2007). "The hydration of slag, part 2 : reaction models for blended cements." Journal of Material Science 42: 444-464.
Cohen, M. D., J. Olek, et al. (1990). "Mechanism of plastic shrinkage cracking in portland cement and portland cement-silica fume paste and mortar." Cement and Concrete Research 20(1): 103-119.
Cong, X., S. Gong, et al. (1992). "Role of silica fume in compressive strength of cement paste, mortar and concrete." ACI Materials Journal 89(4): 375-387.
Davis, H. E. (1940). Autogenous Volume change of Concrete. Proceedings of the 43rd Annual Meeting, American Society for Testing Materials,, Atlantic City, N.J.
References
316
Davis, H. E. (1940). "Autogenous volume change of concrete." Proceedings of ASTM 40: 1103.
Delage, P. and P. C. Aitcin (1983). "Influence of condensed silica fume on the pore size distribution of concretes." Industrial and engineering chemistry product research and development 22(2): 286-290.
Ding, Q., Y. Tian, et al. (2005). "Autogenous shrinkage of high strength lightweight aggregate concrete." Journal Wuhan University of Technology, Materials Science Edition 20(4): 123-125.
Durekovic, A. (1995). "Cement pastes of low water to solid ratio : An investigation of the porosity characteristics under the influence of a superplasticizer and silica fume." Cement and Concrete Research 25(2): 365-375.
Fajun, W., M. W. Grutzeck, et al. (1985). "The retarding effect of fly ash upon the hydration of cement pastes : The first 24 hours." Cement and Concrete Research 15: 174-184.
Feldman, R. F., G. G. Carette, et al. (1990). "Studies on the mechanism of development of physical and mechanical properties of high volume fly ash-cement pastes." Cement & Concrete Composites 12: 245-251.
Feldman, R. F. and H. Cheng-yi (1985). "Properties of portland cement-silica fume pastes II Mechanical properties." Cement and Concrete Research 15: 943-952.
Feldman, R. F. and H. Cheng-yi (1985). "Properties of portland cement - silica fume pastes I . Porosity and surface properties." Cement and Concrete Research 15: 765-774.
Fidjestl, P. and R. Lewis (2001). Microsilica as an addition. Lea's Chemistry of cement and concrete. P. C. Hewlett, Butterworth Heinemann.
Fraay, A. L. A., J. M. Bijen, et al. (1989). "The reaction of fly ash in concrete - A critical examination." Cement and Concrete Research 19: 235-246.
Fraden, J. (2004). Handbook of Modern Sensors: Physics, Designs, and Applications, Birkhäuser.
Fray, A. L. A., J. M. Bijen, et al. (1989). "The reaction of fly ash in concrete - A critical examination." Cement and Concrete Research 19(2): 235-246.
Frías, M. and J. Cabrera (2000). "Pore size distribution and degree of hydration of metakaolin-cement pastes." Cement and Concrete Research 30(4): 561-569.
Fulton, F. S. (1962). The rate of hydration of portland cement. Portland Cement Institute, South Africa : Laboratory Report SF-4.
References
317
Gagne, R., I. Aouad, et al. (1999). "Development of a new experimental technique for the study of the autogenous shrinakge of cement paste." Materials and Structures 32: pp 635-642.
Gagne, R., I. Aouad, et al. (1999). "Development of a new experimental technique for the study of the autogenous shrinkage of cement paste." Materials and Structures 32: pp 635-642.
Garboczi, E. J., D. P. Bentz, et al. (2008). "An electronic monograph: Modelling and measuring the structure and properties of cement-based materials." from http://ciks.cbt.nist.gov/garbocz/.
Geiker, M. (1983). Measurements of Chemical shrinkage and a systematic evaluation of hydration curves by means of the dispersion model. Institute of mineral industry, Technical University of Denmark. PhD.
Geiker, M. and T. Knudsen (1982). "Chemical shrinkage of portland cement paste." Cement and Concrete Research 12: 603-610.
Gleize, P. J. P., M. Cyr, et al. (2007). "Effects of metakaolin on autogenous shrinkage of cement pastes." Cement and Concrete Composites 29(2): 80-87.
Habel, K., J. R. Charron, et al. (2006). "Autogenous deformations and viscoelasticity of UHPFRC in structures. Part I: Experimental results." Magazine of Concrete Research 58(3): 135-145.
Hammer, T. A., Ed. (1999). Test methods for linear measurement of autogenous shrinkage before setting. Autogenous shrinkage of concrete, E&FN Spon London.
Hammer, T. A., O. Bjontegaard, et al. (2002). Measurement methods for testing of early age autogenous strain. Early Age cracking in cementitious systems RILEM TC 181-EAS. A. Bentur, RILEM Publications s.a.r.l.
Hedlund, H. and G. Westman, Eds. (1999). Evaluation and comparison of sealed and non-sealed shrinkage deformation. Autogenous shrinkage of concrete. E&FN Spon, London.
Hobbs, D. W. (1974). "Influence of aggregate restraint on the shrinkage of concrete." ACI Journal(September): 445-450.
Holt, E. E. (2001). Early age autogenous shrinkage of concrete. Department of civil and environmental engineering, University of Washington.
Hua, C., P. Acker, et al. (1995). "Analysis and models of the autogenous shrinkage of hardening cement. I. Modelling at macroscopic scale." Cement and Concrete Research 25(7): 1457-1468.
References
318
Igarashi, S.-I., A. Watanabe, et al. (2005). "Evaluation of capillary pore size characteristics in high-strength concrete at early ages." Cement and Concrete Research 35(3): 513-519.
Indikon (2008). Eddy Current proximity probes, transmitters, probe drivers and cables, Indikon - A River hawk company.
Jensen, O. M. (1995). "Thermodynamic limitation of self-desiccation." Cement and Concrete Research 25(1): 157-164.
Jensen, O. M. (2005). Personal Communication : Fabrication of frame for measurement of autogenous shrinkage.
Jensen, O. M. and P. F. Hansen (1995). "A dilatometer for measuring autogenous deformation in hardening Portland cement paste." Materials and Structures 28: 406-409.
Jensen, O. M. and P. F. Hansen (1996). "Autogenous deformation and change of the relative humidity in silica fume-modified cement paste." ACI Materials Journal 93(6): 539-543.
Jensen, O. M. and P. F. Hansen (2001). "Autogenous deformation and RH-change in perspective." Cement and Concrete Research 31(12): 1859-1865.
Jensen, O. M. and P. F. Hansen (2001). "Autogenous deformation and RH change in perspective." Cement and Concrete Research 31.
Jensen, O. M., P. F. Hansen, et al. (1999). "Clinker mineral hydration at reduced relative humidities." Cement and Concrete Research 29: 1505-1512.
Jiang, L. and Y. Guan (1999). "Pore structure and its effect on strength of high volume fly ash paste." Cement and Concrete research 29: 631-633.
Jiang, L., B. Lin, et al. (1999). "Studies on hydration in high volume fly ash concrete binders." ACI Materials Journal 96(6).
Jiang, L., B. Lin, et al. (2000). "A model for predicting carbonation of high-volume fly ash concrete." Cement and Concrete Research 30(5): 699-702.
Jiang, Z., Z. Sun, et al. (2005). "Autogenous relative humidity change and autogenous shrinkage of high-performance cement pastes." Cement and Concrete Research 35(8): 1539-1545.
Jiang, Z., Z. Sun, et al. (2006). "Internal relative humidity distribution in high performance cement paste due to moisture diffusion and self-desiccation." Cement and Concrete Research 36: 320-325.
References
319
Justnes, H. (2004). Autogenous shrinkage of cementitious paste - state of the art. Seventh CANMET / ACI International Conference on recent advances in concrete technology, Las Vegas, U.S.A.
Justnes, H., B. Ardoullie, et al. (1998). The chemical shrinkage of pozzolonic reaction products. Proceedings of the 6th International conference on fly ash , silica fume , slag and natural pozzolana in concrete.
Justnes, H., F. Clemmens, et al. (2000). Correlating the deviation point between external and total chemical shrinkage with setting time and other characteristics of hydrating cement paste. Proceedings of the Int RILEM workshop on shrinkage of concrete "Shrinkage 2000", Paris.
Justnes, H., A. V. Gemert, et al. (1996). "Total and external chemical shrinkage of low water-cement ratio cement paste." Advances in Cement Research 8(31): 121-126.
Justnes, H., B. Reyniers, et al. (1994). "An evaluation of methods for measuring chemical shrinkage of cementitious pastes." Nordic concrete research 14(1): 45-61.
Justnes, H., E. J. Sellevold, et al. (2000). Influence of plasticizers and superplasticizers on chemical shrinkage of cement. Proceedings of the 6th International conference on superplasticizer and other chemical admixtures in concrete, France.
Justnes, H., E. J. Sellevold, et al. (1999). Chemical shrinkage of cementitious pastes with mineral admixtures. Self Desiccation and its importance in concrete technology, Proceedings of the second international seminar, Lund University.
Justnes, H., E. J. Sellevold, et al. (1999). The influence of cement characteristics on chemical shrinkage. Autogenous shrinkage of Concrete, Hiroshima, Japan.
Kada, H., M. Lachemi, et al. (2002). "Determination of the coefficient of thermal expansion of high performance concrete from initial setting." Materials and Structures/Materiaux et Constructions 35(1): 35-41.
Khalil, K. A. (1996). "Pore structure and surface area of hardened cement pastes containing silica fume." Materials Letters 26: 259-264.
Kim, J.-K. and C.-S. Lee (1999). "Moisture diffusion of concrete considering self-desiccation at early ages." Cement and Concrete Research 29(12): 1921-1927.
Knudsen, T. (1980). On the particle size distribution in cement hydration. Proceedings of the 7th International symposium of chemistry of cement.
Koenders, E. A. B. and K. V. Breugel (1999). Modelling dimensional changes in low water/cement ratio pastes. Autogenous shrinkage of concrete.

References
320
Kovler, K., A. Souslikov, et al. (2004). "Pre-soaked lightweight aggregates as additives for internal curing of high-strength concretes." Cement, Concrete and Aggregates 26(2): 131-138.
Kovler, K. and S. Zhutovsky (2006). "Overview and future trends of shrinkage research." Materials and Structures 39(9): 827-847.
Kula, I., A. Olgun, et al. (2001). "Effects of colemanite waste, cool bottom ash and fly ash on the properties of cement." Cement and Concrete Research 31: 491-494.
Lam, L., Y. L. Wong, et al. (2000). "Degree of hydration and gel/space ratio of high volume fly ash/cement system." Cement and Concrete Research 30: 747-756.
Larson, M. (2003). Thermal crack estimation in early age concrete: models and methods for practical application, Lulea University of Technology. Doctoral degree.
Lawrence, C. D. (2001). Physiochemical and mechanical properties of portland cements. Lea's chemistry of cement and concrete. P. C. Hewlett, Butterworth Heinemann.
Lee, H. K., H. K. Lee, et al. (2006). "Autogenous shrinkage of concrete containing granulated blast-furnace slag." Cement and Concrete Research 36(7): 1279-1285.
Lee, H. K., K. M. Lee, et al. (2003). "Autogenous shrinkage of high-performance concrete containing fly ash." Magazine of Concrete Research 55(6): 507-515.
Lee, H. K., K. M. Lee, et al. (2003). "Autogenous shrinkage of high performance concrete containing fly ash." Magazine of Concrete Research 55(6): 507-515.
Lee, Y., S.-T. Yi, et al. (2006). "Evaluation of a basic creep model with respect to autogenous shrinkage." Cement and Concrete Research 36(7): 1268-1278.
Lerch, W. (1957). "Plastic shrinkage." Journal of American Concrete Institute 28(8).
Lewis, R., L. Sear, et al. (2003). Cementitious additions. Advanced Concrete Technology. J. Newman and B. S. Choo, Butterworth-Heinemann.
Lilkov, V., E. Dimitrova, et al. (1997). "Hydration process of cement containing fly ash and silica fume : The first 24 hours." Cement and Concrete Research 27(4): 577-588.
Lim, S. N. and T. H. Wee (2000). "Autogenous shrinkage of ground-granulated blast-furnace slag concrete." ACI Materials Journal 97(5): 587-593.
Liwu, M. and D. Min (2006). "Thermal behaviour of cement matrix with high-volume mineral admixtures at early hydration age." Cement and Concrete Research 36(10): 1992-1998.
References
321
Locher, F., S. Sprung, et al. (1973). "The effect of the particle size distribution on the strength of portland cement." Zement-Kalk-Gips 26(8): 349-355.
Long, G.-C., Z.-W. Jiang, et al. (2005). "Self-desiccation effect of reactive powder concrete." Jianzhu Cailiao Xuebao/Journal of Building Materials 8(1): 7-10.
Loukili, A., D. Chopin, et al. (2000). "New approach to determine autogenous shrinkage of mortar at an early age considering temperature history." Cement and Concrete Research 30(6): 915-922.
Lura, P. (2005). "Internal water curing with Liapor aggregates." Heron 50(1): 5-23.
Lura, P., O. M. Jensen, et al. (2003). "Autogenous shrinkage in high performance cement paste : An evaluation of basic mechanisms." Cement and Concrete Research 33: 223-232.
Lura, P., B. Pease, et al. (2007). "Influence of shrinkage reducing admixtures on development of plastic shrinkage cracks." ACI Materials Journal 104(2): 187-194.
Lura, P., K. Van Breugel, et al. (2001). "Effect of curing temperature and type of cement on early-age shrinkage of high-performance concrete." Cement and Concrete Research 31(12): 1867-1872.
Lynam, C. G. (1934). Growth and Movement in Portland Cement Concrete, Oxford University Press, London, pp. 25-45.
Ma, W. and P. W. Brown (1997). "Hydrothermal reactions of fly ash with Ca(OH)2 and CaSO4.2H20." Cement and Concrete Research 27(8): 1237-1248.
Mak, S. L., D. Ritchie, et al. (1999). Temperature effects on early age autogenous shrinkage in high performance concretes. Autogenous shrinkage of concrete. E. Tazawa, E&FN Spon, London.
Manmohan, D. and P. K. Mehta (1981). "Influence of pozzolonic, slag and chemical admixtures on pore size distribution and permeability of hardened cement pastes." Cement, Concrete and Aggregates 3(1): 63-67.
Massazza, F. (2001). Pozzolana and Pozzolanic cements. Lea's chemistry of cement and concrete. P. C. Hewlett, Butterworth Heinmann.
Melo Neto, A. A., M. A. Cincotto, et al. (2008). "Drying and autogenous shrinkage of pastes and mortars with activated slag cement." Cement and Concrete Research 38(4): 565-574.
Miao, B., J.-C. Chern, et al. (2003). "Influences of fiber content on properties of self-compacting steel fiber reinforced concrete." Journal of the Chinese Institute of
References
322
Engineers, Transactions of the Chinese Institute of Engineers,Series A/Chung-kuo Kung Ch'eng Hsuch K'an 26(4): 523-530.
Mills, R. H. (1984). Chemical shrinkage and differential sorption in mixtures of portland cement and blast furnace slag. Blended Cements.
Mora-Ruacho, J., R. Gettu, et al. (2009). "Influence of shrinkage-reducing admixtures on the reduction of plastic shrinkage cracking in concrete." Cement and Concrete Research 39(3): 141-146.
Moranville-Regourd, M. (2001). Cements made from blastfurnace slag. Lea's Chemistry of Cement and Concrete. P. C. Hewlett, Butterworth Heinemann.
Neville, A. M. (1995). Properties of concrete, Longman.
Odler, I. (2001). Hydration, Setting and Hardening of Portland Cement. Lea's Chemistry of cement and concrete. P. C. Hewlett, Butterworth Heinemann.
Odler, I., M. Yudenfreund, et al. (1972). "Hardened portland cement pastes of low porosity III Degree of hydration, expansion of paste, total porosity." Cement and Concrete Research 2: 463-480.
Page, C. L. and O. Vennesland (1983). "Pore solution composition and chloride binding capacity of silica fume cement paste." Materials and Structures 16(1).
Pal, S. C., A. Mukherjee, et al. (2002). "Corrosion behaviour of reinforcement of slag concrete." ACI Materials Journal 99(6): 521-527.
Pane, I. and W. Hansen (2005). "Investigation of blended cement hydration by isothermal calorimetry and thermal analysis." Cement and Concrete Research 35(6): 1155-1164.
Park, K. B., T. Noguchi, et al. (1999). A study of the hydration ratio and autogenous shrinkage of cement paste. Autogenous shrinkage of concrete.
Persson, B. (1997). Experimental studies of the effect of silica fume on chemical shrinkage and self-desiccation in portland cement mortars. International Research Seminar on Self Desiccation and its importance in Concrete Technology. B. Persson and G. Fagerlund. Lund.
Persson, B. (1997). "Self-desiccation and its importance in concrete technology." Materials and Structures/Materiaux et Constructions 30(199): 293-305.
Pickett, G. (1956). "Effect of aggregate on shrinkage of concrete and hypothesis concerning shrinkage." Journal of American Concrete Institute 52: 581-590.
References
323
Poon, C. S., L. Lam, et al. (2000). "A study on high strength concrete prepared with large volumes of low calcium fly ash." Cement and Concrete Research 30: 447-455.
Powers, T. C. (1935). "Adsorption of water by portland cement paste during the hardening process." Industrial and Engineering Chemistry 27(7): 790-794.
Powers, T. C. and L. E. Copeland (1959). "Capillary continuity and discontinuity in cement pastes." Journal of the PCA research and development laboratories 1(2): 38-48.
Princigallo, A., P. Lura, et al. (2003). "Early development of properties in a cement paste: A numerical and experimental study." Cement and Concrete Research 33(7): 1013-1020.
Radocea, A. (1992). A study on the mechanism of plastic shrinkage of cement based materials. Division of Building materials, Chalmers University of Technology. Doctoral degree.
Ramachandran, V. S., R. F. Feldman, et al. (1981). Concrete Science - Treatise on current research, Heyden & Son Ltd.
Rao, G. A. (2003). "The investigations of the performance of silica fume incorporated cement pastes and mortars." Cement and Concrete Research 33: 1765-1770.
Ravina, D. and R. Shalon (1968). "Plastic shrinkage cracking." Journal of ACI Proceedings 65(4): 282-292.
Richardson, J. M., J. J. Biernacki, et al. (2002). "Stoichiometry of slag hydration with Calcium hydroxide." Journal of American Ceramic Society 85(4): 947-953.
Saje, D. and F. Saje (2001). "Autogenous Shrinkage Development in HPC." High Performance Materials in Bridges: 11-20.
Sersale, R., G. F. Cioffi, et al. (1991). "Relationship between gypsum content, porosity and strength of cement." Cement and Concrete Research 10(5): 657-664.
Sing, K. (2001). "The use of nitrogen adsorption for the characterisation of porous materials." Colloids and Surfaces A: Physicochemical and Engineering Aspects 187-188: 3-9.
Skinner, L. M. and J. R. Sambles (1972). "The Kelvin equation - a review." Aerosol Science 3: 199-210.
Springenschmid, R. (1994). Thermal Cracking in Concrete at Early Ages : Proceedings of the International Rilem Symposium, Taylor & Francis.
References
324
Steinour, H. H. (1953). The reactions and thermochemistry of cement hydration at ordinary temperature. PCA Research Bulletin.
Subramanian, S., V. Mallikarjun, et al. (2002). Use of admixtures for reducing autogenous shrinkage of concrete. Innovations and Developments in Concrete Materials and Constructions, University of Dundee, Scotland UK, Thomas Telford.
Swamy, R. N. and A. Bouikni (1990). "Some Engineering properties of slag concrete as influenced by mix proportioning and curing." ACI Materials Journal 87(3): 210-220.
Swayze, M. A. (1942). "Early concrete volume changes and their control." Journal of American Concrete Institute 38: 425-440.
Tangtermsirikul, S., Ed. (1999). Effect of chemical composition and particle size of fly ash on autogenous shrinkage of paste. Autogenous shrinkage of concrete, E & FN Spon.
Tangtermsirikul, S. (1999). Effect of chemical composition and particle size of fly ash on autogenous shrinkage of paste. Autogenous shrinkage of concrete. E.-i. Tazawa. London, E & FN Spon: 406.
Taylor, H. F. W. (1997). Cement Chemistry, 2nd Edition, Thomas Telford.
Tazawa, E.-i. (1998). Autogenous shrinkage of concrete - Proceedings of the International workshop organized by Japan Concrete Institute.
Tazawa, E.-i., Ed. (1999). Autogenous shrinkage of concrete, E&FN Spon, London.
Tazawa, E.-i. and S. Miyazawa (1995). "Influence of cement and admixture on autogenous shrinkage of cement paste." Cement and Concrete Research 25(2): 281-287.
Tazawa, E.-i., S. Miyazawa, et al. (1995). "Chemical shrinkage and autogenous shrinkage of hydrating cement paste." Cement and Concrete Research 25(2): 288-292.
Tazawa, E. and S. Miyazawa (1992). Autogenous shrinkage caused by self desiccation in cementitious concrete. Proceedings of the Ninth International conference on the chemistry of cement.
Tazawa, E. and S. Miyazawa (1997). "Influence of constituents and composition on autogenous shrinkage cementitious materials." Magazine of Concrete Research 49(178): 15-22.
Tazawa, E. and S. Miyazawa (1999). Effect of constituents and curing condition on autogenous shrinkage of concrete. Autogenous shrinkage of concrete. E. Tazawa, E & FN Spon.
References
325
Termkhajornkit, P., T. Nawa, et al. (2004). "Effect of fly ash on autogenous shrinkage." Cement and Concrete Research.
Termkhajornkit, P., T. Nawa, et al. (2005). "Effect of fly ash on autogenous shrinkage." Cement and Concrete Research 35(3): 473-482.
Toutanji, H. A. and T. El-Korchi (1995). "the influence of silica fume on the compressive strength of cement paste and mortar." Cement and Concrete Research 25(7): 1591-1602.
Uchikawa, H. (1986). Blended cements. Effect of blending components on hydration and structure formation. Proceedings of 8th International confrence on the chemistry of cement, Rio de Janeiro.
VCCTL. (2009). "Overview of VCCTL." Dec 2008, from http://www.bfrl.nist.gov/861/vcctl/refs/overview.jpg.
Wang, A., C. Zhang, et al. (2004). "Fly ash effects II. The active effect of fly ash." Cement and Concrete Research 34: 2057-2060.
Ward, M. A., A. M. Neville, et al. (1969). "Creep of Air Entrained concrete." Magazine of Concrete Research 21(69): 205-210.
Weiss, W. J. (1999). Prediction of early age shrinkage cracking in concrete elements, Northwestern University. PhD.
Winslow, D. and D. Liu (1990). "The pore structure of paste in concrete." Cement and Concrete Research 20: 227-235.
Wittmann, F. H. (1976). "On the action of capillary pressure in fresh concrete." Cement and Concrete Research 6(49-56).
Xi, Y., Z. P. Bazant, et al. (1994). "Moisture Diffusion in Cementitious materials : Moisture capacity and Diffusivity." Advanced Cement Based Materials 1: 258-266.
Xu, A. and S. L. Sarkar (1994). "Microstructural development in high volume fly ash cement system." Journal of Materials in Civil Engineering 6(1): 117-136.
Yaman, I. O., N. Hearn, et al. (2002). "Active and non-active porosity in concrete. Part 1 : Experimental evidence." Materials and Structures 35: 102-109.
Yang, Q.-B. and S.-Q. Zhang (2004). "Self-desiccation mechanism of high-performance concrete." Journal of Zhejiang University: Science 5(12): 1517-1523.
Yogendran, V. and B. W. Langan (1987). Utilization of silica fume in high strength concrete. Utilization of high strength concrete, Trondheim.

References
326
Yogendran, V., B. W. Langan, et al. (1991). "Hydration of cement and silica fume paste." Cement and Concrete Research 21: 691-708.
Yun, K.-K., P.-G. Choi, et al. (2007). "Thermal and autogenous shrinkages of very early strength latex-modified concrete." Transportation Research Record(2020): 30-39.
Zhang, M.-H. and O. E. Gjorv (1991). "Effect of silica fume on cement hydration in low porosity cement pastes." Cement and Concrete Research 21: 800-808.
Zhang, M.-H. and O. E. Gjorv (1991). "Effect of silica fume on pore structure and chloride diffusivity of low porosity cement pastes." Cement and Concrete Research 21: 1006-1014.
Zhang, M. H. and Canmet (1995). "Microstructure, crack propagation, and mechanical properties of cement pastes containing high volumes of fly ashes." Cement and Concrete Research 25(6): 1165-1178.
Zhang, M. H., C. T. Tam, et al. (2003). "Effect of water-to-cementitious materials ratio and silica fume on the autogenous shrinkage of concrete." Cement and Concrete Research 33(10): 1687-1694.
Zheng, J. J., C. Q. Li, et al. (2005). "Thickness of interfacial transition zone and cement content profiles around aggregates." Magazine of Concrete Research 57(7): 397-406.
References
327
Appendix A – Chemical shrinkage –Test Procedure
328
APPENDIX A Chemical shrinkage – Test procedure
The following procedure will explain in detail the test procedure adopted for the
measurement of chemical shrinkage.
Aim
The objective of this test method is to measure the development of chemical shrinkage
for a cementitious system when it hydrates.
Apparatus required
The following are the list of the requirements before the test can be commenced.
• Cement / Mineral admixture
• Flat bottomed Glass vial (or Erlenmeyer flask)– 50 ml capacity (10 Nos)
• Rubber Stopper with centre hole for inserting measuring pipette – 9 Nos
• Measuring pipette
• Liquid Rubber
• Distilled and de-aired water
• Weigh balance
• Mini-mixer (suitable for mixing cement paste)
• Plastic dispenser
• Constant temperature chamber
• Thermocouple and suitable data logger or thermometer
• Suitable tag’s to name the samples
Procedure
1. Wash the flat bottomed glass vials with distilled before the beginning of the test
and dry them thoroughly.
2. Wash the rubber stopper and the measuring pipette and dry them thoroughly.
3. Leave the glass vial’s in the environmental chamber so the temperature of the
glass is in equilibrium and constant.
Appendix A – Chemical shrinkage –Test Procedure
329
4. Leave 2 litres of distilled and de-aired water in the environmental chamber so
that the temperature will be in equilibrium with the test chamber.
5. Insert the glass pipette into the rubber stopper and seal the junction between the
rubber stopper and the glass vial using liquid rubber.
6. Measure 200 gm of cement and add 140 ml of distilled water.
7. Mix the mixture well in the mini-mixer to form a uniform paste
8. Place the vial over the weigh balance and tare the reading.
9. Dispense about 15 gm of the cement paste using a plastic dispenser or any other
suitable method ensuring homogeneity.
10. Care should be taken that the sample does not stick to the sides of the walls of
the glass vial when the sample is placed into. Repeat this procedure until all 10
vials are placed with the sample.
11. Record the actual amount of cement paste in each vial to 0.01 gm accuracy.
12. Leave the sample to stand still in the vial and ensure all the visible air-bubbles
have disappeared.
13. Top up each vial to the surface with distilled and de-aired water.
14. Place the rubber stopper with the measuring pipette over the vial and seal the
junction between the vial and the rubber stopper using liquid rubber. This is
done for 9 samples.
15. The 10 sample is used for measurement of temperature of the water during the
test.
16. Take extra precaution that there are no air-bubbles trapped under the rubber
stopper or anywhere within the sample.
17. Place a drop of paraffin oil over the column of water in the pipette.
18. Tag each sample and record the initial reading on the measuring pipette.
19. Watch the reading in each pipette to ensure any abnormality in the reading.
20. Commence the first reading after 1.5 hours from the moment cement was in
contact with water in the mini-mixer for all the 9 samples.
21. Record the temperature in the 10th sample using a thermocouple or thermometer.
22. Record every 1 hour for the first 24 hours and then 48 hours, 72 hours, 7 days,
28 days, 60 days and 90 days reading.

Appendix A – Chemical shrinkage –Test Procedure
330
Results
• The recorded chemical shrinkage is for 15 gm of the cement paste which is the
converted so as it can be expressed as ml/gm of the cement after necessary
temperature corrections are carried out for the temperature rise of the water
during the course of the test.
• A graph is prepared for the average chemical shrinkage of the 9 samples
• Report the temperature change of the sample during the test duration.
Figure A-1 Photograph of chemical shrinkage experiment in progress (OPC50FA07)

Appendix A – Chemical shrinkage –Test Procedure
331
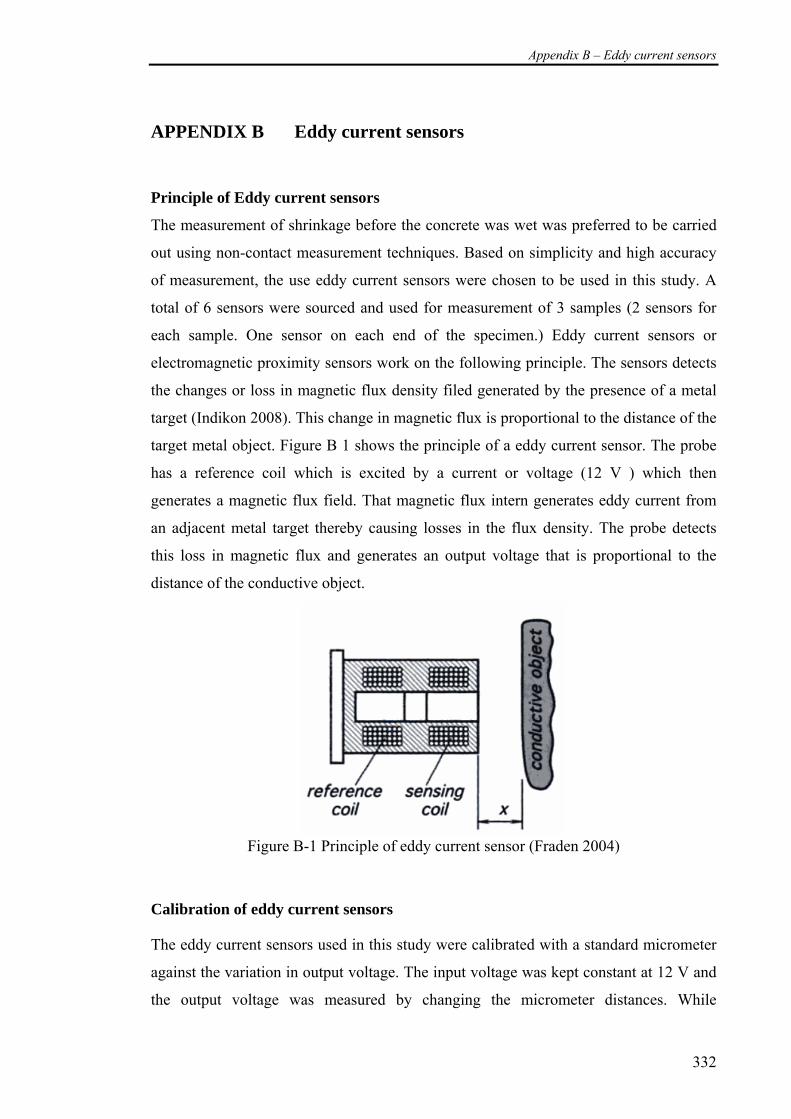
Appendix B – Eddy current sensors
332
APPENDIX B Eddy current sensors
Principle of Eddy current sensors
The measurement of shrinkage before the concrete was wet was preferred to be carried
out using non-contact measurement techniques. Based on simplicity and high accuracy
of measurement, the use eddy current sensors were chosen to be used in this study. A
total of 6 sensors were sourced and used for measurement of 3 samples (2 sensors for
each sample. One sensor on each end of the specimen.) Eddy current sensors or
electromagnetic proximity sensors work on the following principle. The sensors detects
the changes or loss in magnetic flux density filed generated by the presence of a metal
target (Indikon 2008). This change in magnetic flux is proportional to the distance of the
target metal object. Figure B 1 shows the principle of a eddy current sensor. The probe
has a reference coil which is excited by a current or voltage (12 V ) which then
generates a magnetic flux field. That magnetic flux intern generates eddy current from
an adjacent metal target thereby causing losses in the flux density. The probe detects
this loss in magnetic flux and generates an output voltage that is proportional to the
distance of the conductive object.
Figure B-1 Principle of eddy current sensor (Fraden 2004)
Calibration of eddy current sensors
The eddy current sensors used in this study were calibrated with a standard micrometer
against the variation in output voltage. The input voltage was kept constant at 12 V and
the output voltage was measured by changing the micrometer distances. While
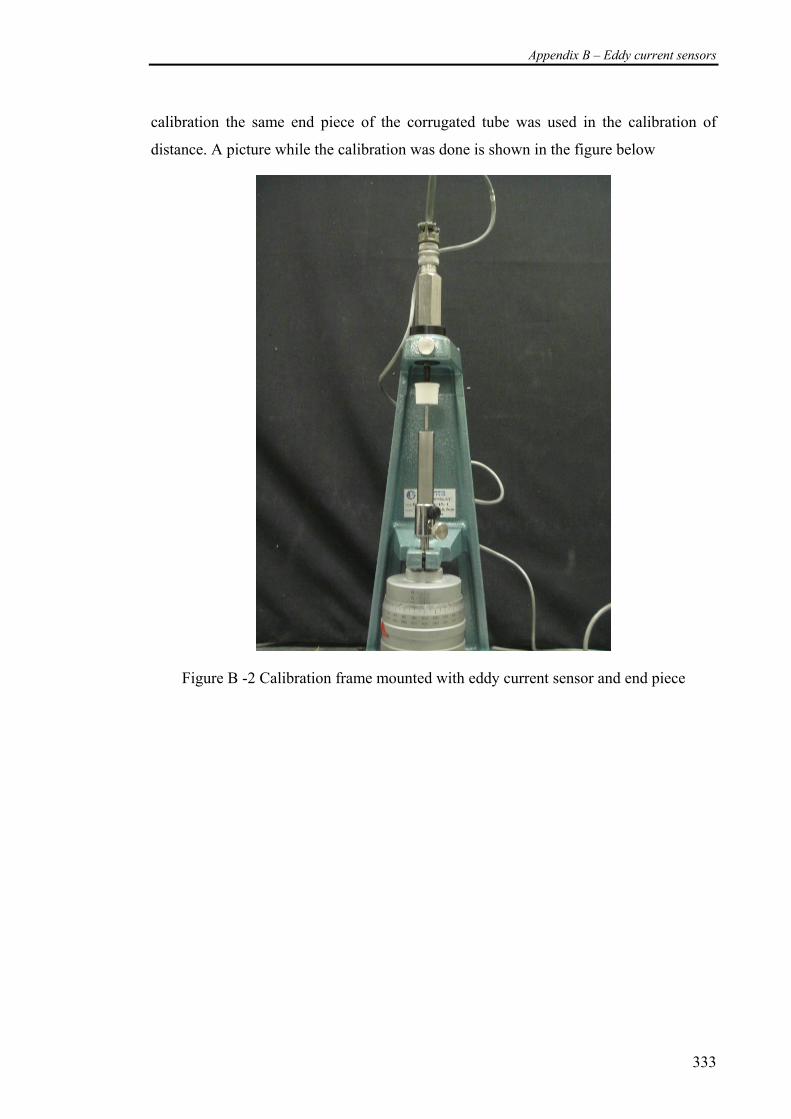
Appendix B – Eddy current sensors
333
calibration the same end piece of the corrugated tube was used in the calibration of
distance. A picture while the calibration was done is shown in the figure below
Figure B -2 Calibration frame mounted with eddy current sensor and end piece
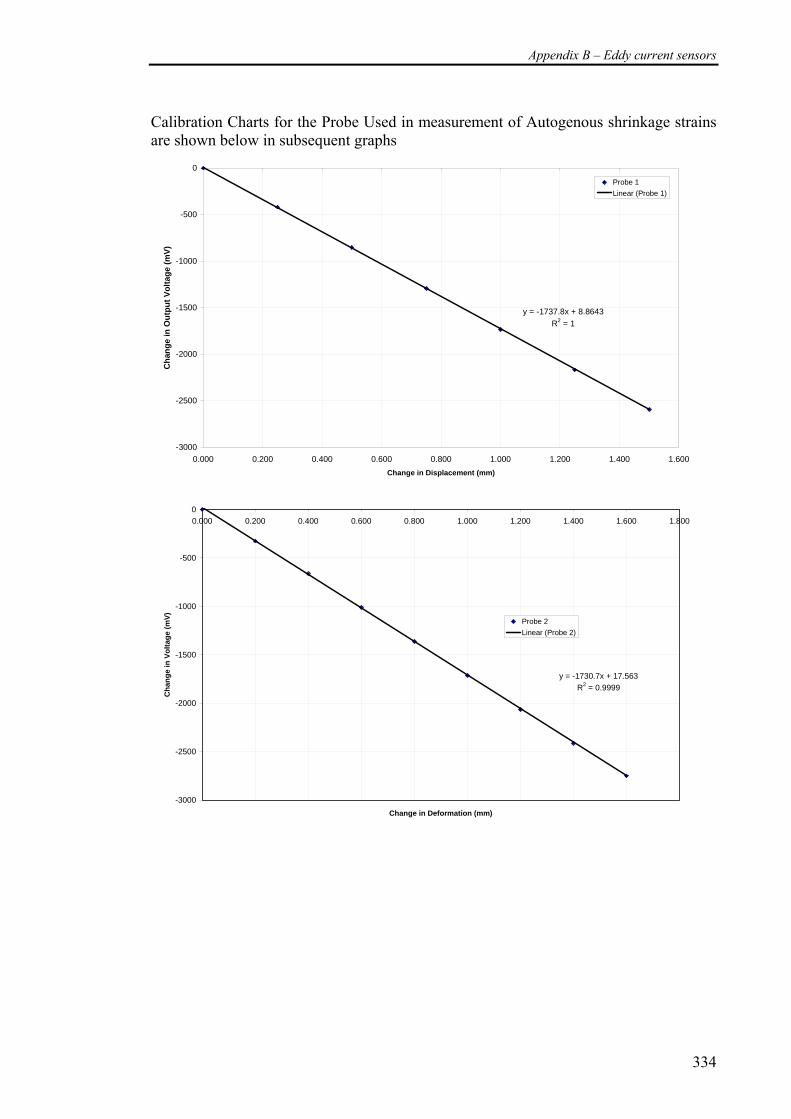
Appendix B – Eddy current sensors
334
Calibration Charts for the Probe Used in measurement of Autogenous shrinkage strains are shown below in subsequent graphs
y = -1737.8x + 8.8643R2 = 1
-3000
-2500
-2000
-1500
-1000
-500
0
0.000 0.200 0.400 0.600 0.800 1.000 1.200 1.400 1.600Change in Displacement (mm)
Cha
nge
in O
utpu
t Vol
tage
(mV)
Probe 1Linear (Probe 1)
y = -1730.7x + 17.563R2 = 0.9999
-3000
-2500
-2000
-1500
-1000
-500
00.000 0.200 0.400 0.600 0.800 1.000 1.200 1.400 1.600 1.800
Change in Deformation (mm)
Cha
nge
in V
olta
ge (m
V) Probe 2Linear (Probe 2)
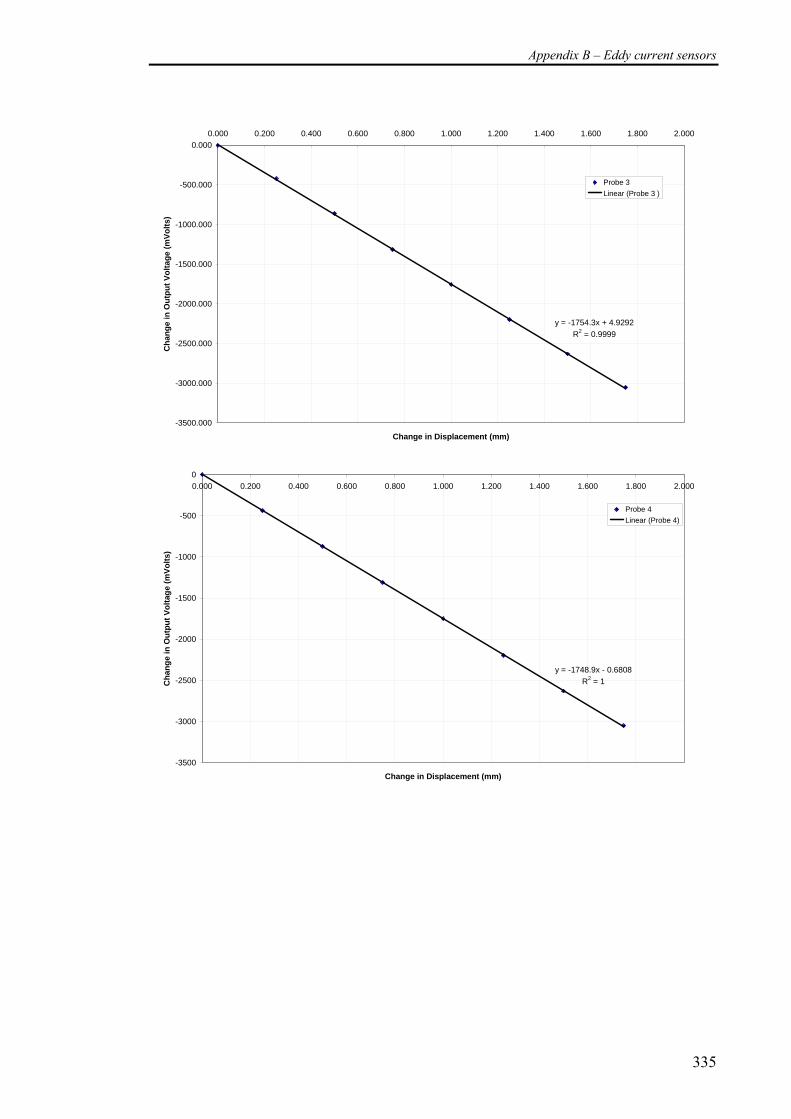
Appendix B – Eddy current sensors
335
y = -1754.3x + 4.9292R2 = 0.9999
-3500.000
-3000.000
-2500.000
-2000.000
-1500.000
-1000.000
-500.000
0.0000.000 0.200 0.400 0.600 0.800 1.000 1.200 1.400 1.600 1.800 2.000
Change in Displacement (mm)
Cha
nge
in O
utpu
t Vol
tage
(mVo
lts)
Probe 3 Linear (Probe 3 )
y = -1748.9x - 0.6808R2 = 1
-3500
-3000
-2500
-2000
-1500
-1000
-500
00.000 0.200 0.400 0.600 0.800 1.000 1.200 1.400 1.600 1.800 2.000
Change in Displacement (mm)
Cha
nge
in O
utpu
t Vol
tage
(mVo
lts)
Probe 4Linear (Probe 4)
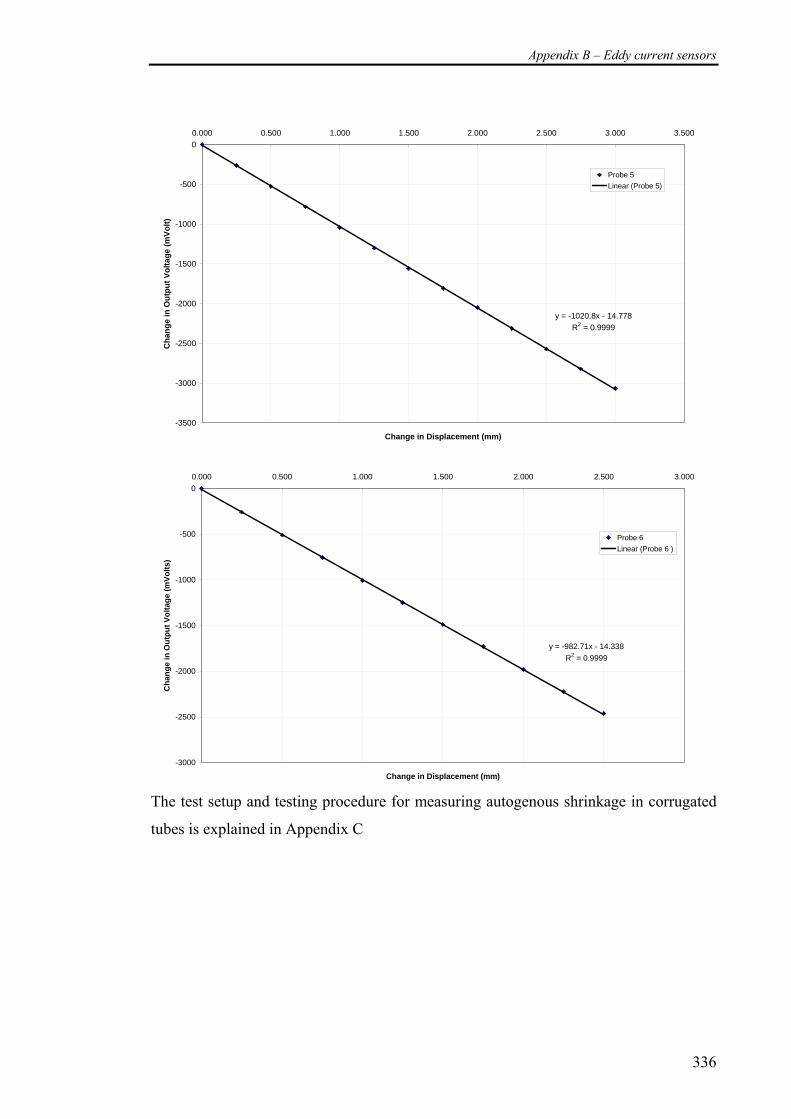
Appendix B – Eddy current sensors
336
y = -1020.8x - 14.778R2 = 0.9999
-3500
-3000
-2500
-2000
-1500
-1000
-500
00.000 0.500 1.000 1.500 2.000 2.500 3.000 3.500
Change in Displacement (mm)
Cha
nge
in O
utpu
t Vol
tage
(mVo
lt)Probe 5Linear (Probe 5)
y = -982.71x - 14.338R2 = 0.9999
-3000
-2500
-2000
-1500
-1000
-500
00.000 0.500 1.000 1.500 2.000 2.500 3.000
Change in Displacement (mm)
Cha
nge
in O
utpu
t Vol
tage
(mVo
lts)
Probe 6 Linear (Probe 6 )
The test setup and testing procedure for measuring autogenous shrinkage in corrugated
tubes is explained in Appendix C

Appendix B – Eddy current sensors
337
Appendix C – Autogenous measurements using corrugated tubes
338
APPENDIX C Autogenous measurement using corrugated tubes
The detailed test procedure for the measurement of autogenous shrinkage is listed below
in this appendix.
Aim
The primary aim of this test method was to capture the autogenous shrinkage strains in
cementitious paste systems immediately (beginning from ~1.5 hours) after mixing
Apparatus required
• 4 Corrugated tubes
• 8 sealing end plugs
• 8 metal disks (slightly smaller than the diameter of the end plugs)
• 6 eddy current sensors
• Data logger
• 3 measuring frames to mount the eddy current sensors
• Thermocouples 2 Nos
Corrugated tubes
These corrugated tubes were sourced from Prof O.M.Jensen at Technical University of
Denmark. Figure C1 shows a picture of the corrugated tube used in this study.. The
details of the corrugated tube are explained in detail in the papers by Jensen and his co-
workers (Jensen and Hansen 1995; Jensen and Hansen 2001; Lura, Jensen et al. 2003).
Data acquisition system
A data acquisition system to monitor the change in voltage as the specimen contracted
was setup with the help of the School Electronics workshop. The frame shown in Figure
C-2 was fabricated in-house and the probes mounted on them. The probes were then
connected to a data acquisition system to record the change in voltage for each of the
probes (total of 6 Nos) and 2 thermocouples. Figure C-3 shows the screen shot of the
data acquisition software used.
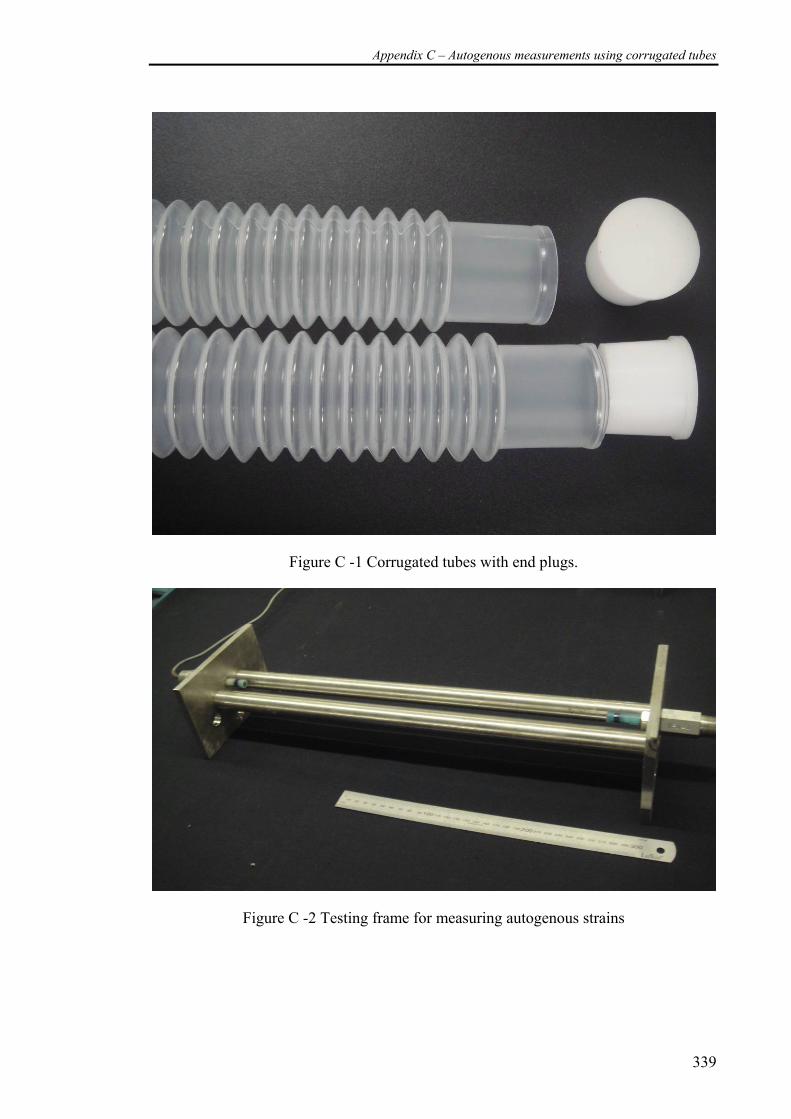
Appendix C – Autogenous measurements using corrugated tubes
339
Figure C -1 Corrugated tubes with end plugs.
Figure C -2 Testing frame for measuring autogenous strains
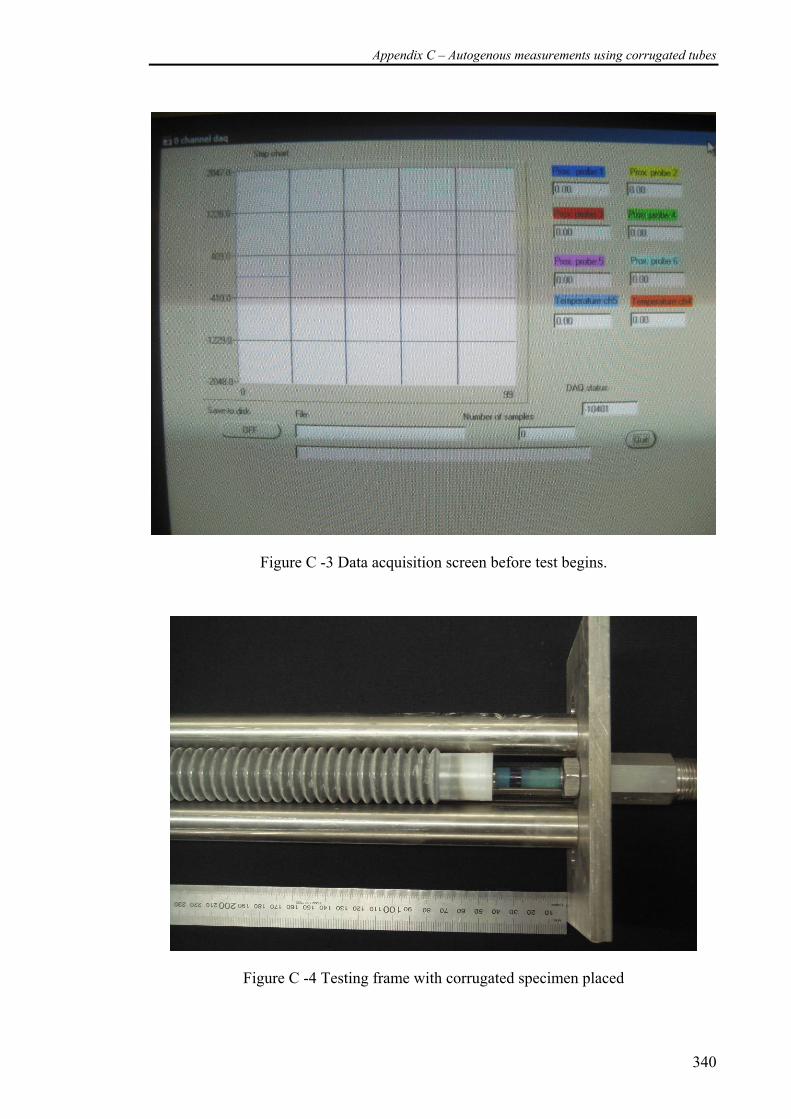
Appendix C – Autogenous measurements using corrugated tubes
340
Figure C -3 Data acquisition screen before test begins.
Figure C -4 Testing frame with corrugated specimen placed
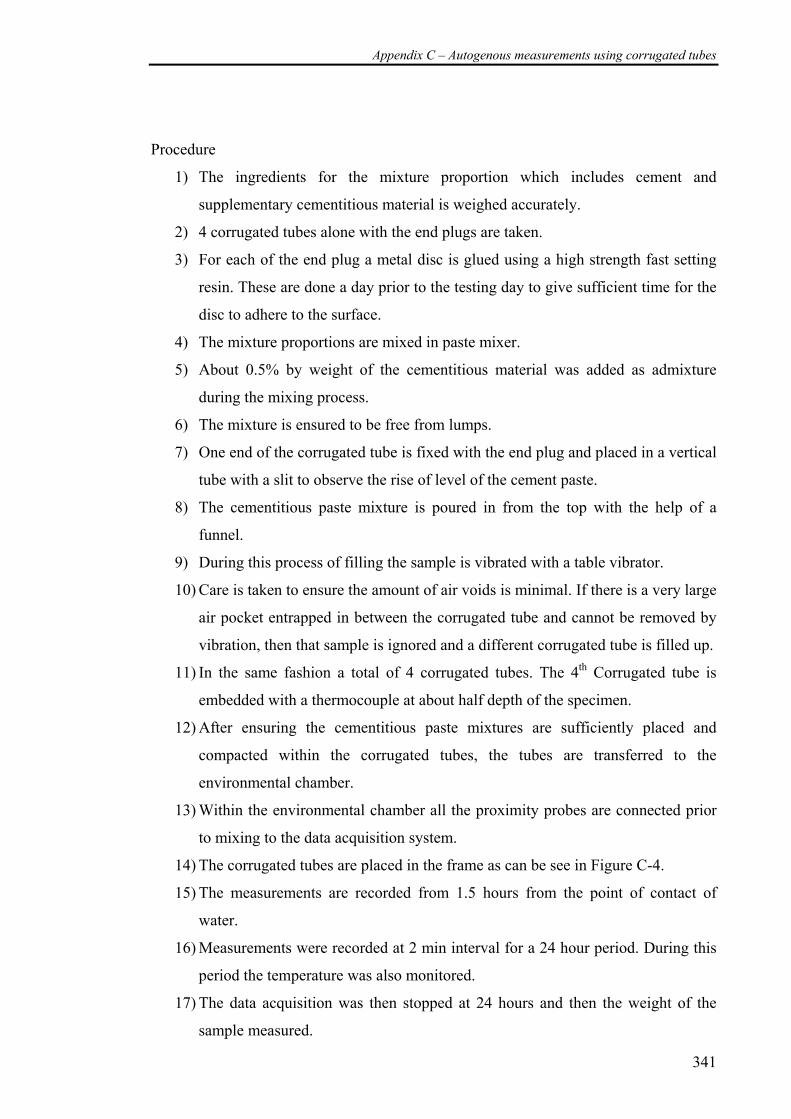
Appendix C – Autogenous measurements using corrugated tubes
341
Procedure
1) The ingredients for the mixture proportion which includes cement and
supplementary cementitious material is weighed accurately.
2) 4 corrugated tubes alone with the end plugs are taken.
3) For each of the end plug a metal disc is glued using a high strength fast setting
resin. These are done a day prior to the testing day to give sufficient time for the
disc to adhere to the surface.
4) The mixture proportions are mixed in paste mixer.
5) About 0.5% by weight of the cementitious material was added as admixture
during the mixing process.
6) The mixture is ensured to be free from lumps.
7) One end of the corrugated tube is fixed with the end plug and placed in a vertical
tube with a slit to observe the rise of level of the cement paste.
8) The cementitious paste mixture is poured in from the top with the help of a
funnel.
9) During this process of filling the sample is vibrated with a table vibrator.
10) Care is taken to ensure the amount of air voids is minimal. If there is a very large
air pocket entrapped in between the corrugated tube and cannot be removed by
vibration, then that sample is ignored and a different corrugated tube is filled up.
11) In the same fashion a total of 4 corrugated tubes. The 4th Corrugated tube is
embedded with a thermocouple at about half depth of the specimen.
12) After ensuring the cementitious paste mixtures are sufficiently placed and
compacted within the corrugated tubes, the tubes are transferred to the
environmental chamber.
13) Within the environmental chamber all the proximity probes are connected prior
to mixing to the data acquisition system.
14) The corrugated tubes are placed in the frame as can be see in Figure C-4.
15) The measurements are recorded from 1.5 hours from the point of contact of
water.
16) Measurements were recorded at 2 min interval for a 24 hour period. During this
period the temperature was also monitored.
17) The data acquisition was then stopped at 24 hours and then the weight of the
sample measured.
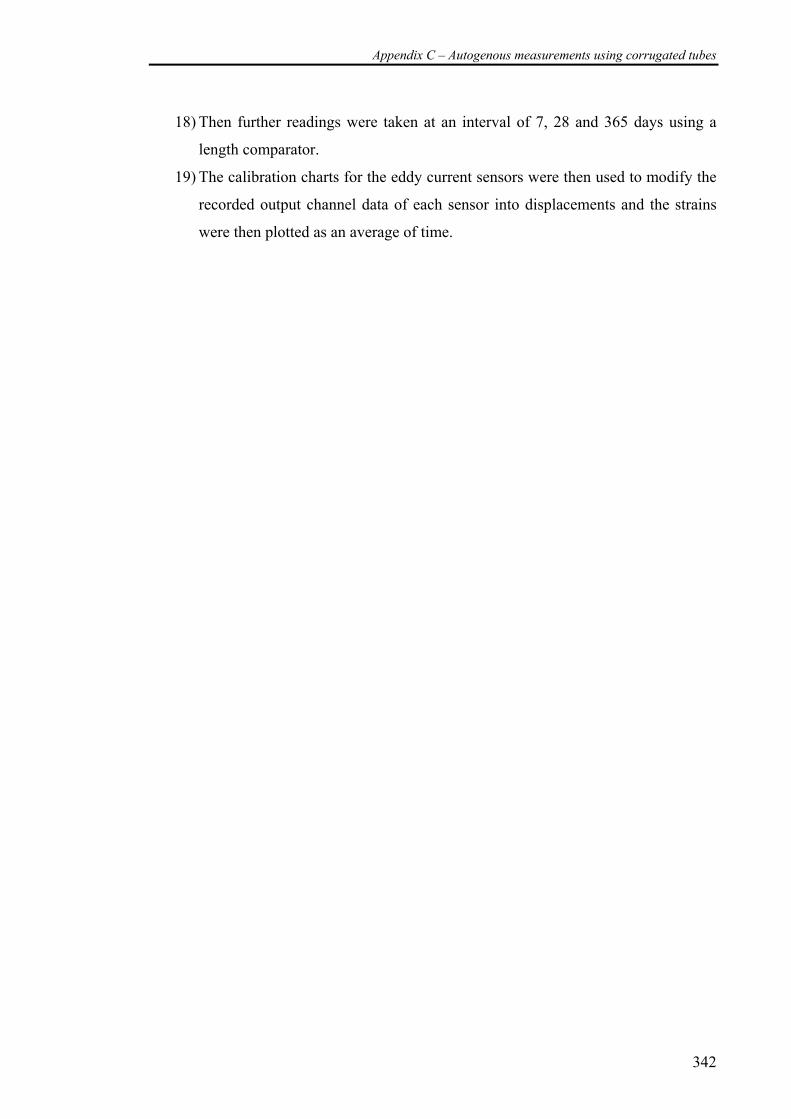
Appendix C – Autogenous measurements using corrugated tubes
342
18) Then further readings were taken at an interval of 7, 28 and 365 days using a
length comparator.
19) The calibration charts for the eddy current sensors were then used to modify the
recorded output channel data of each sensor into displacements and the strains
were then plotted as an average of time.

Appendix C – Autogenous measurements using corrugated tubes
343
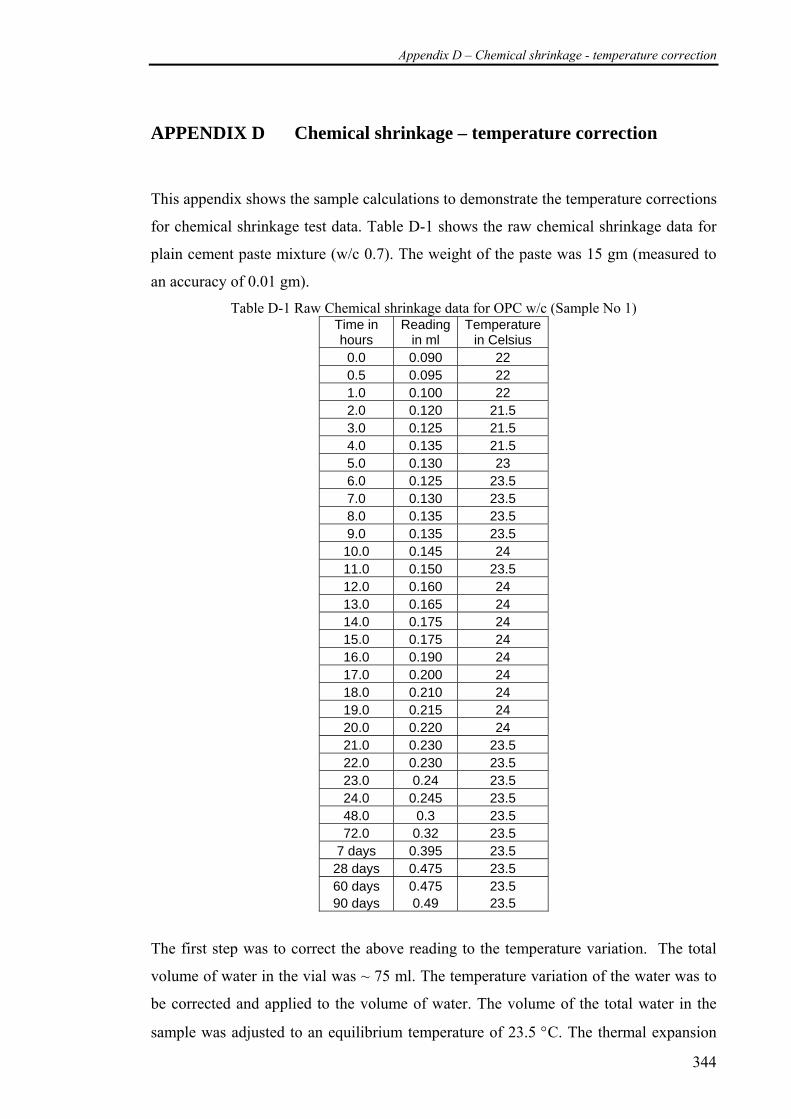
Appendix D – Chemical shrinkage - temperature correction
344
APPENDIX D Chemical shrinkage – temperature correction
This appendix shows the sample calculations to demonstrate the temperature corrections
for chemical shrinkage test data. Table D-1 shows the raw chemical shrinkage data for
plain cement paste mixture (w/c 0.7). The weight of the paste was 15 gm (measured to
an accuracy of 0.01 gm).
Table D-1 Raw Chemical shrinkage data for OPC w/c (Sample No 1) Time in hours
Reading in ml
Temperature in Celsius
0.0 0.090 22 0.5 0.095 22 1.0 0.100 22 2.0 0.120 21.5 3.0 0.125 21.5 4.0 0.135 21.5 5.0 0.130 23 6.0 0.125 23.5 7.0 0.130 23.5 8.0 0.135 23.5 9.0 0.135 23.5 10.0 0.145 24 11.0 0.150 23.5 12.0 0.160 24 13.0 0.165 24 14.0 0.175 24 15.0 0.175 24 16.0 0.190 24 17.0 0.200 24 18.0 0.210 24 19.0 0.215 24 20.0 0.220 24 21.0 0.230 23.5 22.0 0.230 23.5 23.0 0.24 23.5 24.0 0.245 23.5 48.0 0.3 23.5 72.0 0.32 23.5
7 days 0.395 23.5 28 days 0.475 23.5 60 days 0.475 23.5 90 days 0.49 23.5
The first step was to correct the above reading to the temperature variation. The total
volume of water in the vial was ~ 75 ml. The temperature variation of the water was to
be corrected and applied to the volume of water. The volume of the total water in the
sample was adjusted to an equilibrium temperature of 23.5 °C. The thermal expansion
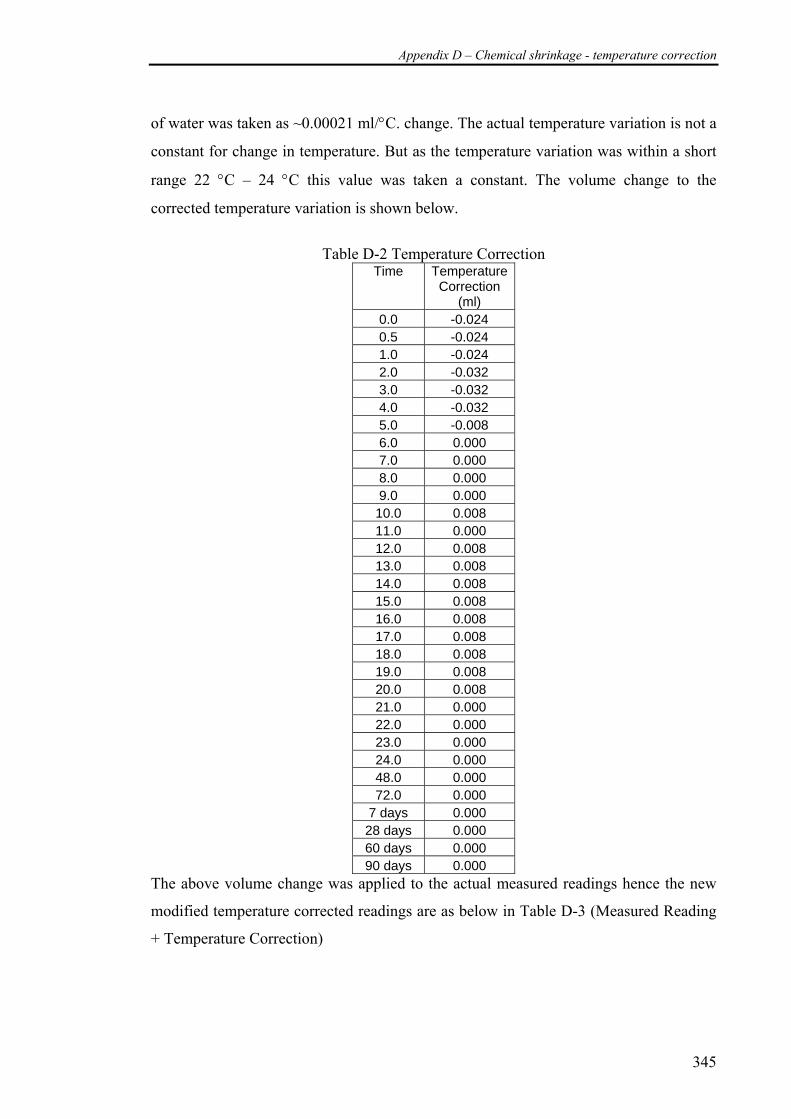
Appendix D – Chemical shrinkage - temperature correction
345
of water was taken as ~0.00021 ml/°C. change. The actual temperature variation is not a
constant for change in temperature. But as the temperature variation was within a short
range 22 °C – 24 °C this value was taken a constant. The volume change to the
corrected temperature variation is shown below.
Table D-2 Temperature Correction
Time Temperature Correction
(ml) 0.0 -0.024 0.5 -0.024 1.0 -0.024 2.0 -0.032 3.0 -0.032 4.0 -0.032 5.0 -0.008 6.0 0.000 7.0 0.000 8.0 0.000 9.0 0.000 10.0 0.008 11.0 0.000 12.0 0.008 13.0 0.008 14.0 0.008 15.0 0.008 16.0 0.008 17.0 0.008 18.0 0.008 19.0 0.008 20.0 0.008 21.0 0.000 22.0 0.000 23.0 0.000 24.0 0.000 48.0 0.000 72.0 0.000
7 days 0.000 28 days 0.000 60 days 0.000 90 days 0.000
The above volume change was applied to the actual measured readings hence the new
modified temperature corrected readings are as below in Table D-3 (Measured Reading
+ Temperature Correction)
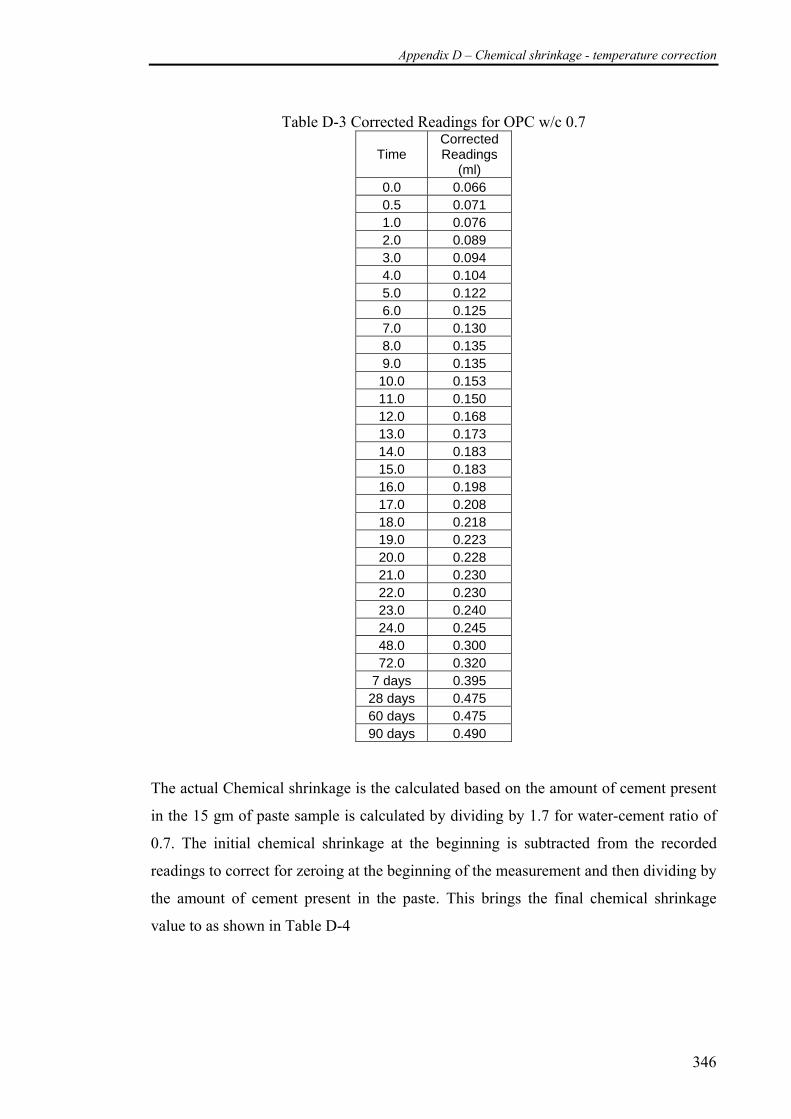
Appendix D – Chemical shrinkage - temperature correction
346
Table D-3 Corrected Readings for OPC w/c 0.7
Time Corrected Readings
(ml) 0.0 0.066 0.5 0.071 1.0 0.076 2.0 0.089 3.0 0.094 4.0 0.104 5.0 0.122 6.0 0.125 7.0 0.130 8.0 0.135 9.0 0.135
10.0 0.153 11.0 0.150 12.0 0.168 13.0 0.173 14.0 0.183 15.0 0.183 16.0 0.198 17.0 0.208 18.0 0.218 19.0 0.223 20.0 0.228 21.0 0.230 22.0 0.230 23.0 0.240 24.0 0.245 48.0 0.300 72.0 0.320
7 days 0.395 28 days 0.475 60 days 0.475 90 days 0.490
The actual Chemical shrinkage is the calculated based on the amount of cement present
in the 15 gm of paste sample is calculated by dividing by 1.7 for water-cement ratio of
0.7. The initial chemical shrinkage at the beginning is subtracted from the recorded
readings to correct for zeroing at the beginning of the measurement and then dividing by
the amount of cement present in the paste. This brings the final chemical shrinkage
value to as shown in Table D-4
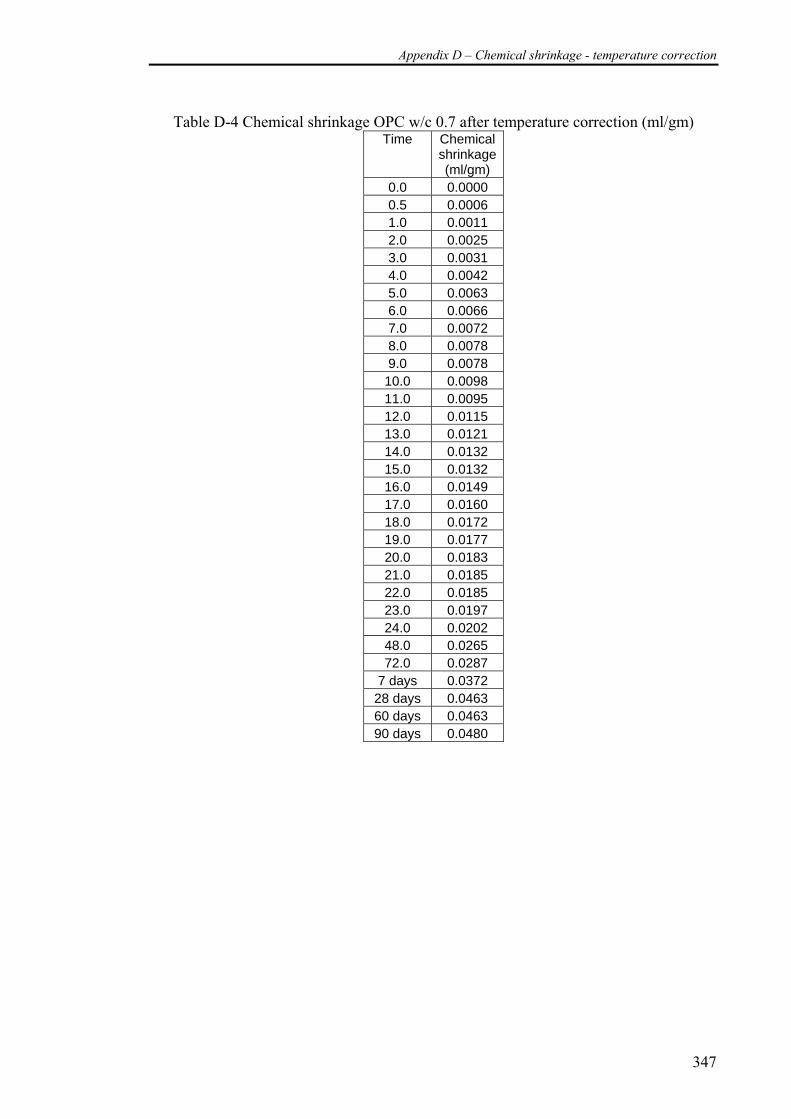
Appendix D – Chemical shrinkage - temperature correction
347
Table D-4 Chemical shrinkage OPC w/c 0.7 after temperature correction (ml/gm) Time Chemical
shrinkage(ml/gm)
0.0 0.0000 0.5 0.0006 1.0 0.0011 2.0 0.0025 3.0 0.0031 4.0 0.0042 5.0 0.0063 6.0 0.0066 7.0 0.0072 8.0 0.0078 9.0 0.0078
10.0 0.0098 11.0 0.0095 12.0 0.0115 13.0 0.0121 14.0 0.0132 15.0 0.0132 16.0 0.0149 17.0 0.0160 18.0 0.0172 19.0 0.0177 20.0 0.0183 21.0 0.0185 22.0 0.0185 23.0 0.0197 24.0 0.0202 48.0 0.0265 72.0 0.0287
7 days 0.0372 28 days 0.0463 60 days 0.0463 90 days 0.0480
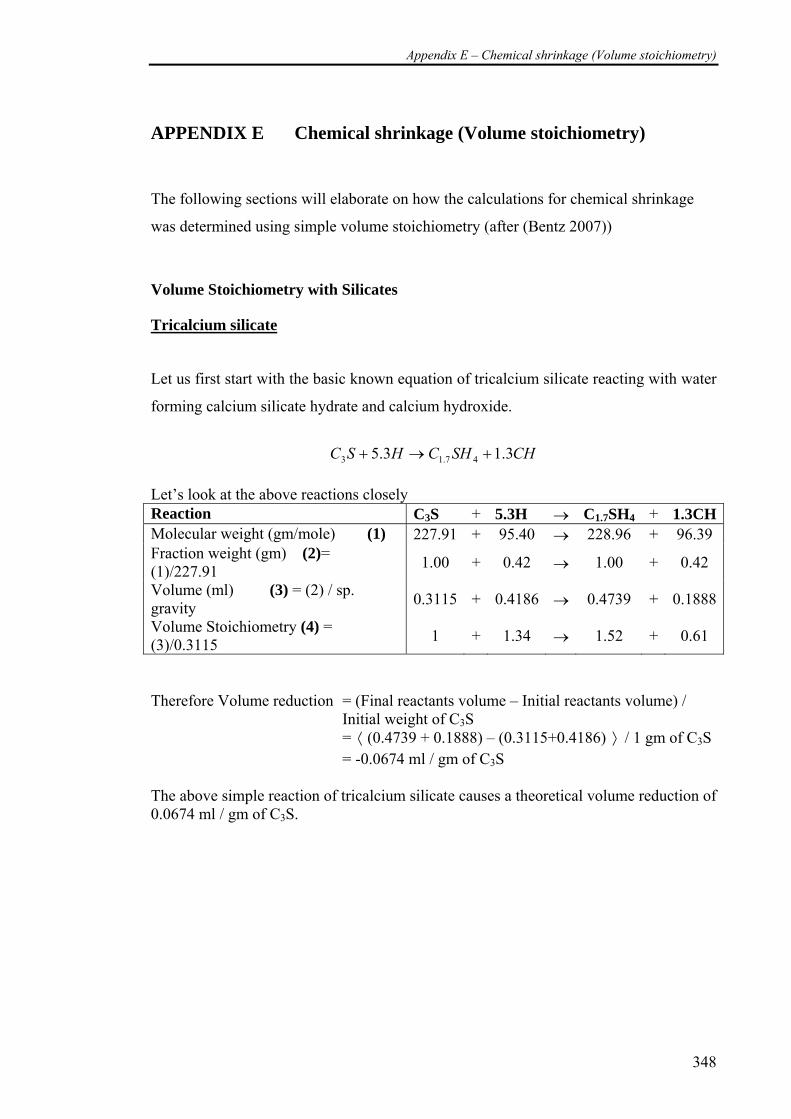
Appendix E – Chemical shrinkage (Volume stoichiometry)
348
APPENDIX E Chemical shrinkage (Volume stoichiometry)
The following sections will elaborate on how the calculations for chemical shrinkage
was determined using simple volume stoichiometry (after (Bentz 2007))
Volume Stoichiometry with Silicates
Tricalcium silicate
Let us first start with the basic known equation of tricalcium silicate reacting with water
forming calcium silicate hydrate and calcium hydroxide.
CHSHCHSC 3.13.5 47.13 +→+
Let’s look at the above reactions closely Reaction C3S + 5.3H → C1.7SH4 + 1.3CHMolecular weight (gm/mole) (1) 227.91 + 95.40 → 228.96 + 96.39 Fraction weight (gm) (2)= (1)/227.91 1.00 + 0.42 → 1.00 + 0.42
Volume (ml) (3) = (2) / sp. gravity 0.3115 + 0.4186 → 0.4739 + 0.1888
Volume Stoichiometry (4) = (3)/0.3115 1 + 1.34 → 1.52 + 0.61
Therefore Volume reduction = (Final reactants volume – Initial reactants volume) /
Initial weight of C3S = ⟨ (0.4739 + 0.1888) – (0.3115+0.4186) ⟩ / 1 gm of C3S = -0.0674 ml / gm of C3S The above simple reaction of tricalcium silicate causes a theoretical volume reduction of 0.0674 ml / gm of C3S.
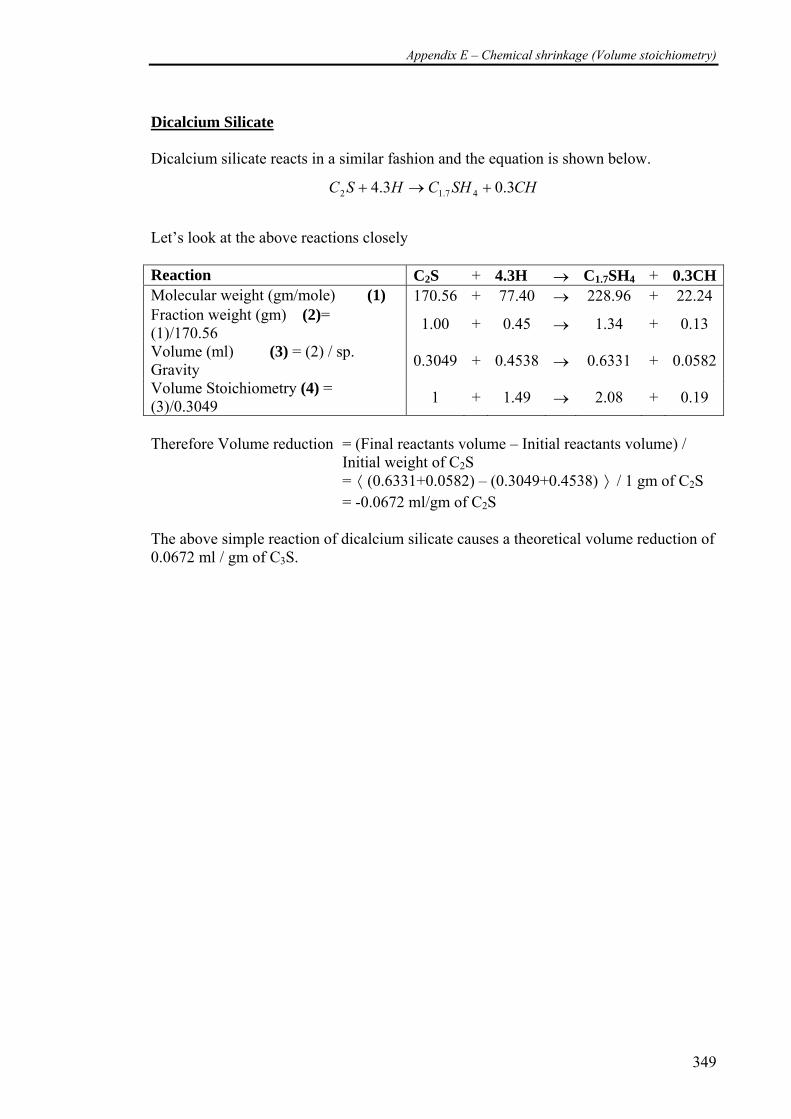
Appendix E – Chemical shrinkage (Volume stoichiometry)
349
Dicalcium Silicate Dicalcium silicate reacts in a similar fashion and the equation is shown below.
CHSHCHSC 3.03.4 47.12 +→+
Let’s look at the above reactions closely Reaction C2S + 4.3H → C1.7SH4 + 0.3CHMolecular weight (gm/mole) (1) 170.56 + 77.40 → 228.96 + 22.24 Fraction weight (gm) (2)= (1)/170.56 1.00 + 0.45 → 1.34 + 0.13
Volume (ml) (3) = (2) / sp. Gravity 0.3049 + 0.4538 → 0.6331 + 0.0582
Volume Stoichiometry (4) = (3)/0.3049 1 + 1.49 → 2.08 + 0.19
Therefore Volume reduction = (Final reactants volume – Initial reactants volume) /
Initial weight of C2S = ⟨ (0.6331+0.0582) – (0.3049+0.4538) ⟩ / 1 gm of C2S = -0.0672 ml/gm of C2S The above simple reaction of dicalcium silicate causes a theoretical volume reduction of 0.0672 ml / gm of C3S.

Appendix E – Chemical shrinkage (Volume stoichiometry)
350
Tricalcium aluminate
Tricalcium aluminates reaction is different in the presence and absence of gypsum,
hence resulting in different volume reductions for each case.
In the absence of gypsum
The reaction of tricalcium aluminate in the absence of gypsum is as follows
633 6 AHCHAC →+ Let’s look at the above reactions closely
Reaction C3A + 6H → C3AH6
Molecular weight (gm/mole) (1) 269.97 + 108.00 → 378.00 Fraction weight (gm) (2)= (1)/269.97 1.00 + 0.40 → 1.40 Volume (ml) (3) = (2) / sp. Gravity 0.33 + 0.40 → 0.56 Volume Stoichiometry (4) = (3)/0.33 1 + 1.21 → 1.68
Therefore Volume reduction = (Final reactants volume – Initial reactants volume) /
Initial weight of C3A = ⟨ 0.56 - (0.40 + 0.33) ⟩ / 1 gm of C3A = -0.1745 ml/gm of C3A
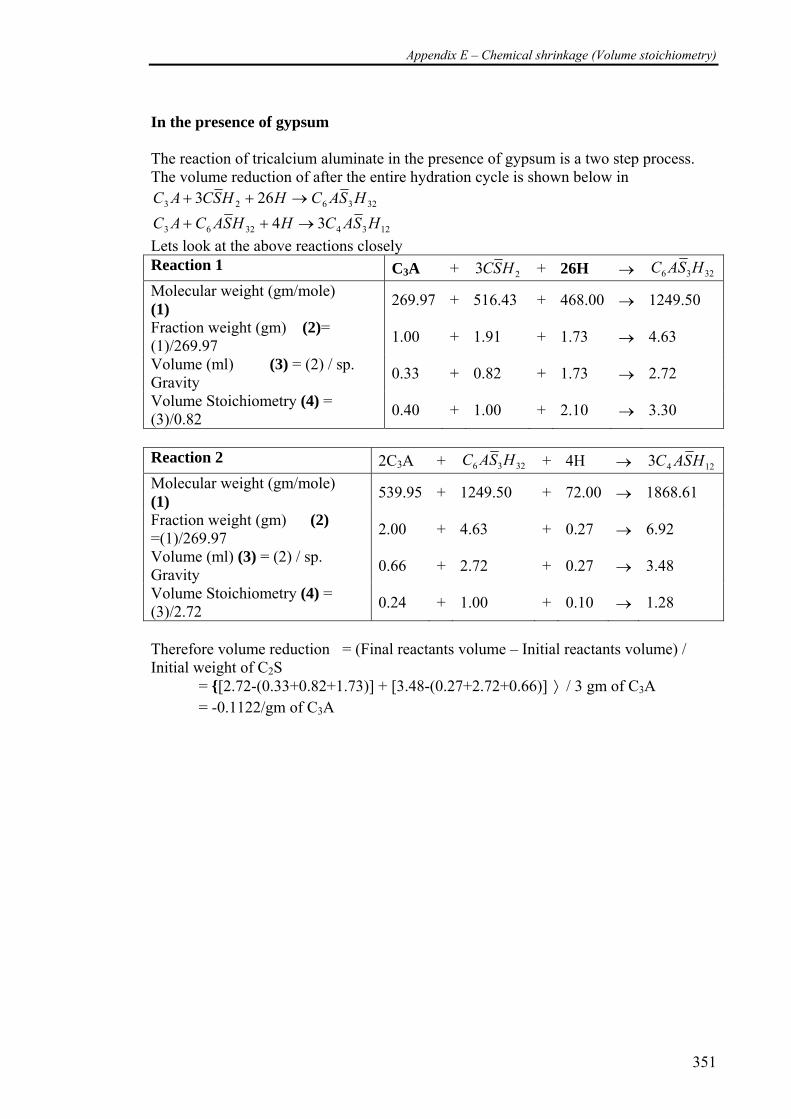
Appendix E – Chemical shrinkage (Volume stoichiometry)
351
In the presence of gypsum The reaction of tricalcium aluminate in the presence of gypsum is a two step process. The volume reduction of after the entire hydration cycle is shown below in
323623 263 HSACHHSCAC →++
12343263 34 HSACHHSACAC →++ Lets look at the above reactions closely Reaction 1 C3A + 23 HSC + 26H → 3236 HSACMolecular weight (gm/mole) (1) 269.97 + 516.43 + 468.00 → 1249.50
Fraction weight (gm) (2)= (1)/269.97 1.00 + 1.91 + 1.73 → 4.63
Volume (ml) (3) = (2) / sp. Gravity 0.33 + 0.82 + 1.73 → 2.72
Volume Stoichiometry (4) = (3)/0.82 0.40 + 1.00 + 2.10 → 3.30
Reaction 2 2C3A + 3236 HSAC + 4H → 1243 HSACMolecular weight (gm/mole) (1) 539.95 + 1249.50 + 72.00 → 1868.61
Fraction weight (gm) (2) =(1)/269.97 2.00 + 4.63 + 0.27 → 6.92
Volume (ml) (3) = (2) / sp. Gravity 0.66 + 2.72 + 0.27 → 3.48
Volume Stoichiometry (4) = (3)/2.72 0.24 + 1.00 + 0.10 → 1.28
Therefore volume reduction = (Final reactants volume – Initial reactants volume) / Initial weight of C2S = {[2.72-(0.33+0.82+1.73)] + [3.48-(0.27+2.72+0.66)] ⟩ / 3 gm of C3A = -0.1122/gm of C3A

Appendix E – Chemical shrinkage (Volume stoichiometry)
352
Tetra calcium aluminoferrite As Tricalcium aluminate, Tricalcium aluminates also reacts differently in the presence and absence of gypsum, hence resulting in different volume reductions for each case. In the absence of gypsum The reaction of tricalcium aluminate in the absence of gypsum is as follows
3634 10 FHCHAHCHAFC ++→+ Lets look at the above reactions closely Reaction C4AF + 10H → C3AH6 + CH + FH3 Molecular weight (gm/mole) (1) 477.44 + 180.00 → 378.00 + 74.14 + 209.4
Fraction weight (gm) (2)= (1)/269.97 1.00 + 0.38 → 0.79 + 0.16 + 0.44
Volume (ml) (3) = (2) / sp. Gravity 0.27 + 0.38 → 0.31 + 0.07 + 0.15
Volume Stoichiometry (4) = (3)/0.27 1 + 1.41 → 1.17 + 0.26 + 0.55
Therefore Volume reduction = (Final reactants volume – Initial reactants volume) / Initial weight of C2S = ⟨ (0.15+0.07+0.31) - (0.27+0.38) ⟩ / 1 gm of C4AF = -0.1154 ml/gm of C4AF In the presence of gypsum The reaction of tricalcium aluminate in the presence of gypsum is a two step process. The volume reduction of after the entire hydration cycle is shown below.
3323624 303 FHCHHSACHHSCAFC ++→++
312432364 223122 FHCHHSACHHSCAFC ++→++ Lets look at the above reactions closely
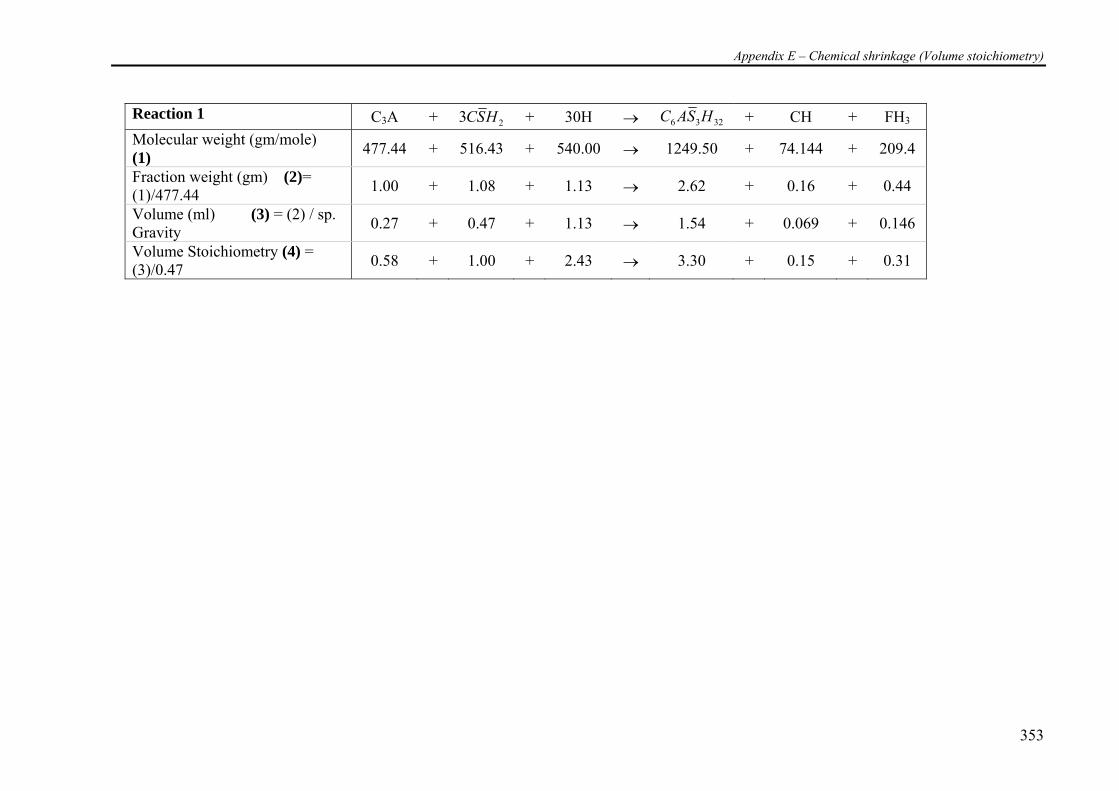
Appendix E – Chemical shrinkage (Volume stoichiometry)
353
Reaction 1 C3A + 23 HSC + 30H → 3236 HSAC + CH + FH3 Molecular weight (gm/mole) (1) 477.44 + 516.43 + 540.00 → 1249.50 + 74.144 + 209.4
Fraction weight (gm) (2)= (1)/477.44 1.00 + 1.08 + 1.13 → 2.62 + 0.16 + 0.44
Volume (ml) (3) = (2) / sp. Gravity 0.27 + 0.47 + 1.13 → 1.54 + 0.069 + 0.146
Volume Stoichiometry (4) = (3)/0.47 0.58 + 1.00 + 2.43 → 3.30 + 0.15 + 0.31
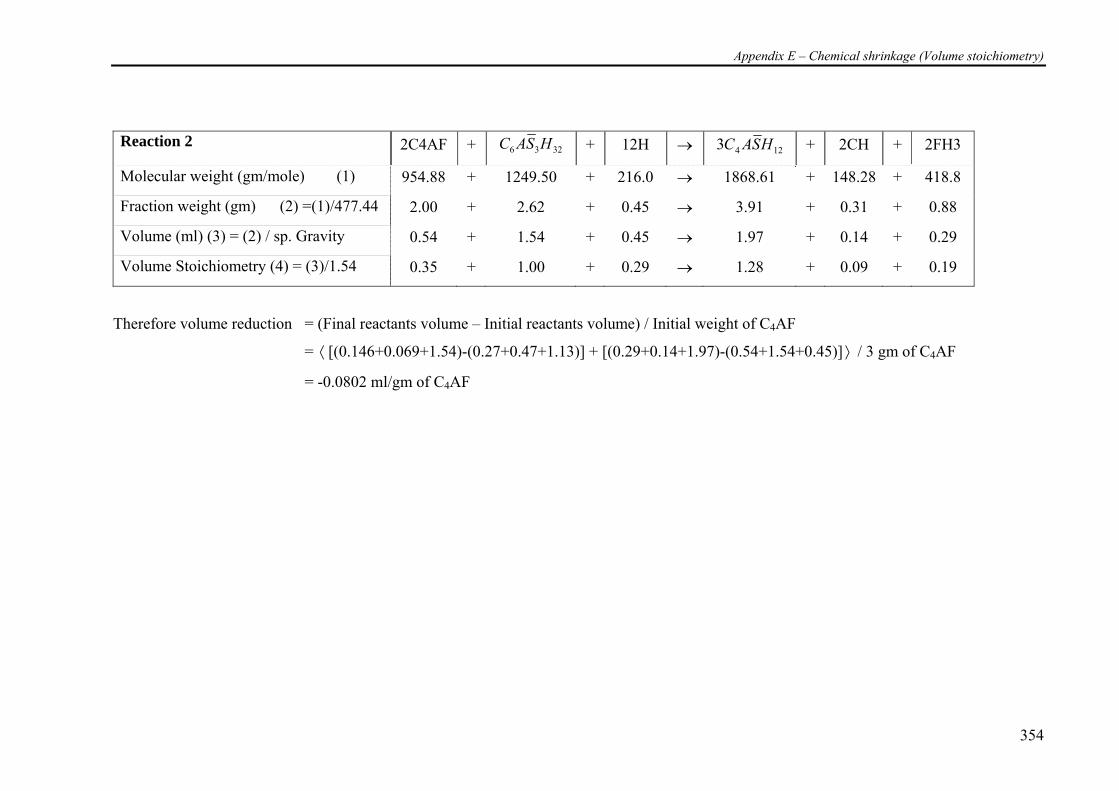
Appendix E – Chemical shrinkage (Volume stoichiometry)
354
Reaction 2 2C4AF + 3236 HSAC + 12H → 1243 HSAC + 2CH + 2FH3
Molecular weight (gm/mole) (1) 954.88 + 1249.50 + 216.0 → 1868.61 + 148.28 + 418.8
Fraction weight (gm) (2) =(1)/477.44 2.00 + 2.62 + 0.45 → 3.91 + 0.31 + 0.88
Volume (ml) (3) = (2) / sp. Gravity 0.54 + 1.54 + 0.45 → 1.97 + 0.14 + 0.29
Volume Stoichiometry (4) = (3)/1.54 0.35 + 1.00 + 0.29 → 1.28 + 0.09 + 0.19
Therefore volume reduction = (Final reactants volume – Initial reactants volume) / Initial weight of C4AF
= ⟨ [(0.146+0.069+1.54)-(0.27+0.47+1.13)] + [(0.29+0.14+1.97)-(0.54+1.54+0.45)] ⟩ / 3 gm of C4AF
= -0.0802 ml/gm of C4AF
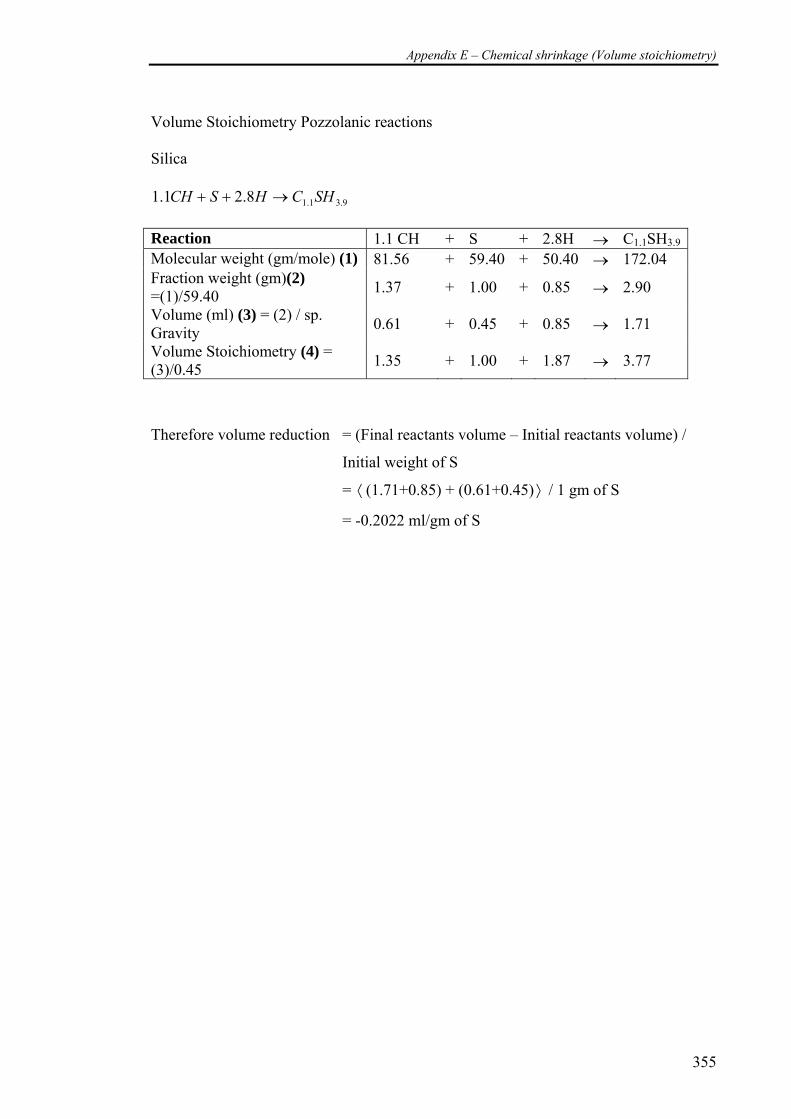
Appendix E – Chemical shrinkage (Volume stoichiometry)
355
Volume Stoichiometry Pozzolanic reactions Silica
9.31.18.21.1 SHCHSCH →++ Reaction 1.1 CH + S + 2.8H → C1.1SH3.9
Molecular weight (gm/mole) (1) 81.56 + 59.40 + 50.40 → 172.04 Fraction weight (gm)(2) =(1)/59.40 1.37 + 1.00 + 0.85 → 2.90
Volume (ml) (3) = (2) / sp. Gravity 0.61 + 0.45 + 0.85 → 1.71
Volume Stoichiometry (4) = (3)/0.45 1.35 + 1.00 + 1.87 → 3.77
Therefore volume reduction = (Final reactants volume – Initial reactants volume) /
Initial weight of S
= ⟨ (1.71+0.85) + (0.61+0.45) ⟩ / 1 gm of S
= -0.2022 ml/gm of S
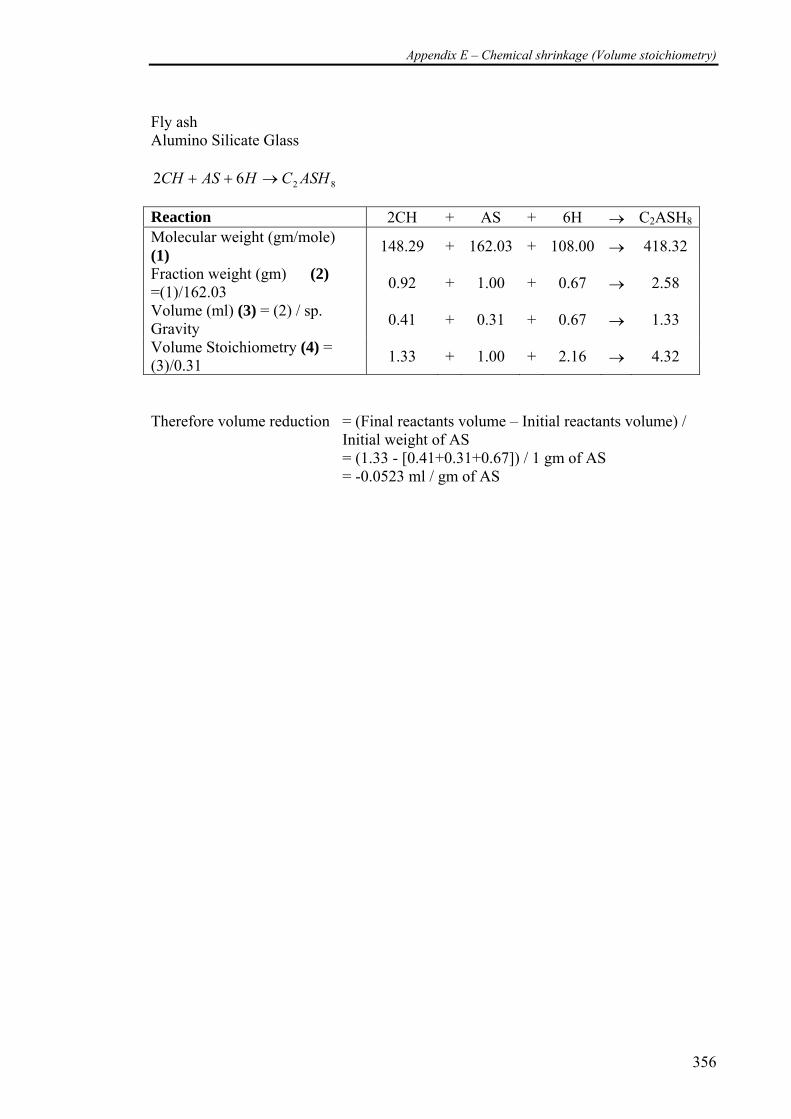
Appendix E – Chemical shrinkage (Volume stoichiometry)
356
Fly ash Alumino Silicate Glass
8262 ASHCHASCH →++ Reaction 2CH + AS + 6H → C2ASH8
Molecular weight (gm/mole) (1) 148.29 + 162.03 + 108.00 → 418.32
Fraction weight (gm) (2) =(1)/162.03 0.92 + 1.00 + 0.67 → 2.58
Volume (ml) (3) = (2) / sp. Gravity 0.41 + 0.31 + 0.67 → 1.33
Volume Stoichiometry (4) = (3)/0.31 1.33 + 1.00 + 2.16 → 4.32
Therefore volume reduction = (Final reactants volume – Initial reactants volume) /
Initial weight of AS = (1.33 - [0.41+0.31+0.67]) / 1 gm of AS = -0.0523 ml / gm of AS
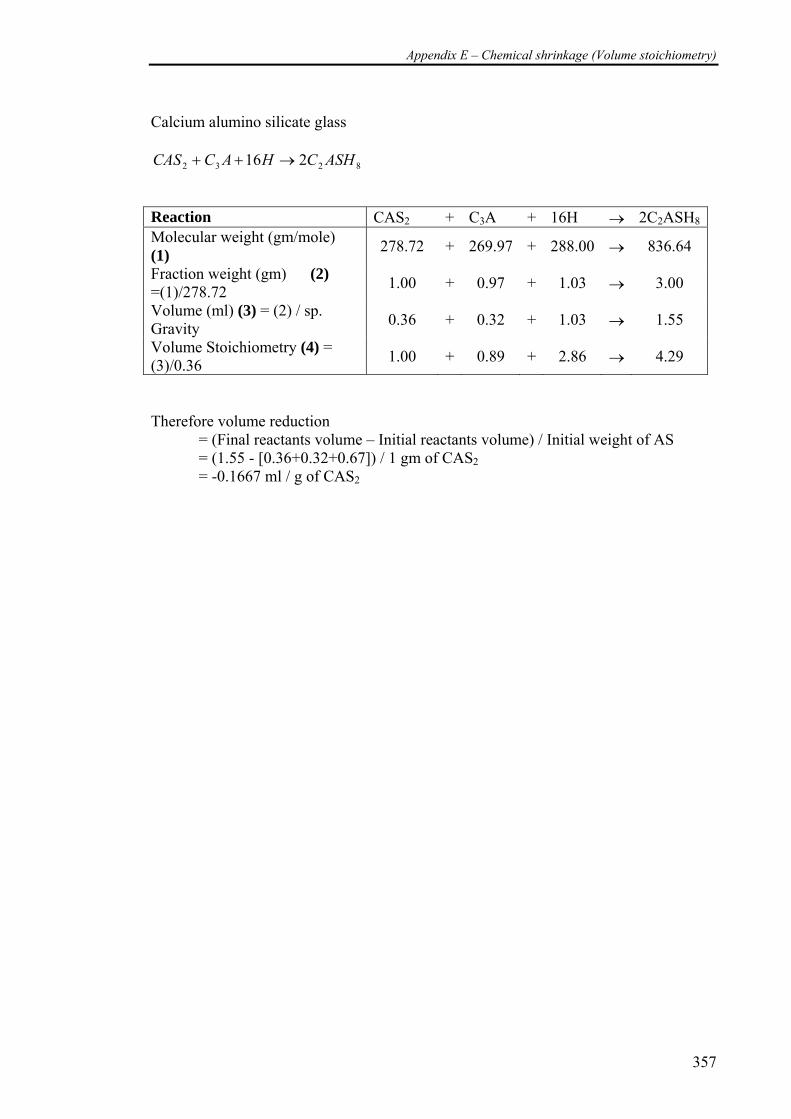
Appendix E – Chemical shrinkage (Volume stoichiometry)
357
Calcium alumino silicate glass
8232 216 ASHCHACCAS →++ Reaction CAS2 + C3A + 16H → 2C2ASH8
Molecular weight (gm/mole) (1) 278.72 + 269.97 + 288.00 → 836.64
Fraction weight (gm) (2) =(1)/278.72 1.00 + 0.97 + 1.03 → 3.00
Volume (ml) (3) = (2) / sp. Gravity 0.36 + 0.32 + 1.03 → 1.55
Volume Stoichiometry (4) = (3)/0.36 1.00 + 0.89 + 2.86 → 4.29
Therefore volume reduction = (Final reactants volume – Initial reactants volume) / Initial weight of AS = (1.55 - [0.36+0.32+0.67]) / 1 gm of CAS2 = -0.1667 ml / g of CAS2

Appendix E – Chemical shrinkage (Volume stoichiometry)
358
Appendix F – Simulating using CEMHYD3D
359
APPENDIX F Simulations using CEMHYD3D
The following sections will explain in detail the simulations carried out using
CEMHYD3D. The simulations are categorized into simulations at
1. water-cementitious ratio of 0.7
2. water-cementitious ratio of 0.32
The first hydration explained here involves the basic control simulation involving
cement paste with water-cement ratio of 0.7.
(Please note only a simplified version of the steps involved in CEMHYD3D is explained
below. For a more detailed procedure the author suggests to refer to the manual on
CEMHYD3D(Bentz 1997)).
Simulations at water-cementitious ratio of 0.7 – (OPC07 Simulation)
The hydration simulation consists of three parts. The CEMHYD3D program has a
separate set of C programs to be executed and inputs for each of the steps before the
final output can be arrived. The steps involve include
• Generation of particles distributed in the microstructure. - Initial distribution
of particles of cement confirming to particle size distribution and achieving the
desired water-cementitious ratio in the microstructure.
• Distribution of the phases within the particles present in the microstructure –
Various phases of the cementitious material is to be distributed into the various
particles present in the microstructure.
• Hydration of the microstructure - Input parameters for hydration into the
created microstructure to obtain desired results. –
• Calibrate with experimental chemical shrinkage data.
Generation of particles distributed in the microstructure
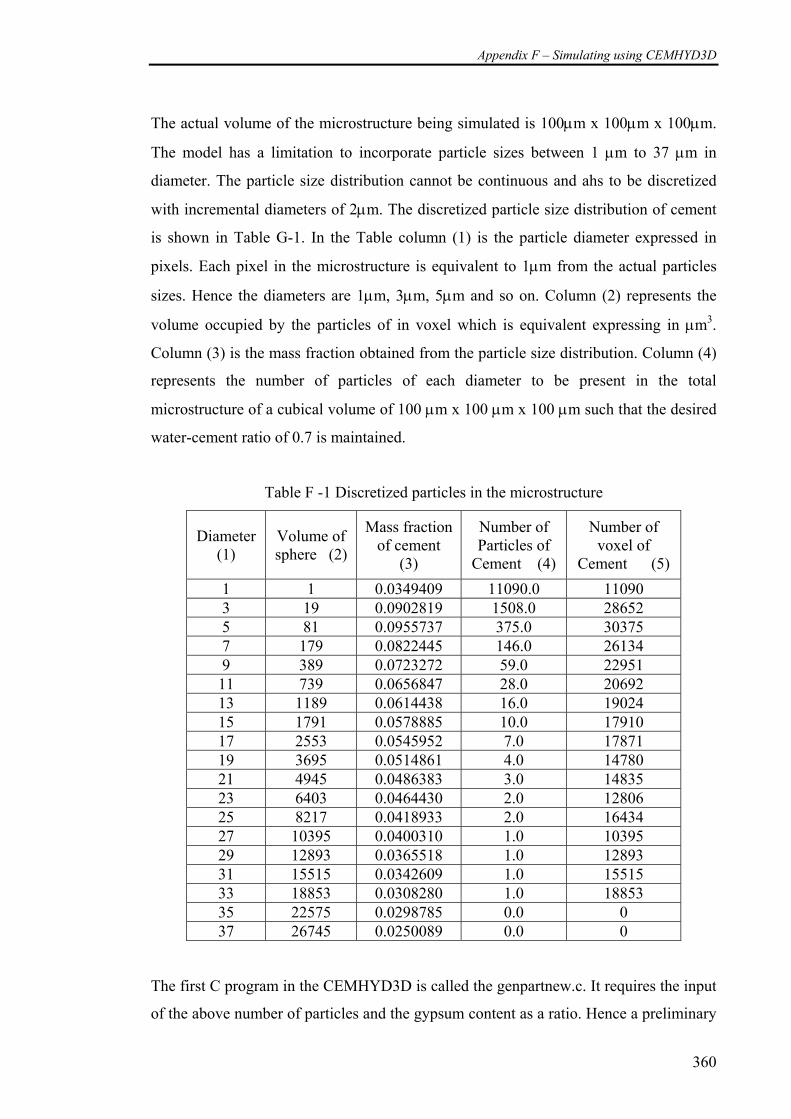
Appendix F – Simulating using CEMHYD3D
360
The actual volume of the microstructure being simulated is 100μm x 100μm x 100μm.
The model has a limitation to incorporate particle sizes between 1 μm to 37 μm in
diameter. The particle size distribution cannot be continuous and ahs to be discretized
with incremental diameters of 2μm. The discretized particle size distribution of cement
is shown in Table G-1. In the Table column (1) is the particle diameter expressed in
pixels. Each pixel in the microstructure is equivalent to 1μm from the actual particles
sizes. Hence the diameters are 1μm, 3μm, 5μm and so on. Column (2) represents the
volume occupied by the particles of in voxel which is equivalent expressing in μm3.
Column (3) is the mass fraction obtained from the particle size distribution. Column (4)
represents the number of particles of each diameter to be present in the total
microstructure of a cubical volume of 100 μm x 100 μm x 100 μm such that the desired
water-cement ratio of 0.7 is maintained.
Table F -1 Discretized particles in the microstructure
Diameter (1)
Volume of sphere (2)
Mass fraction of cement
(3)
Number of Particles of
Cement (4)
Number of voxel of
Cement (5) 1 1 0.0349409 11090.0 11090 3 19 0.0902819 1508.0 28652 5 81 0.0955737 375.0 30375 7 179 0.0822445 146.0 26134 9 389 0.0723272 59.0 22951 11 739 0.0656847 28.0 20692 13 1189 0.0614438 16.0 19024 15 1791 0.0578885 10.0 17910 17 2553 0.0545952 7.0 17871 19 3695 0.0514861 4.0 14780 21 4945 0.0486383 3.0 14835 23 6403 0.0464430 2.0 12806 25 8217 0.0418933 2.0 16434 27 10395 0.0400310 1.0 10395 29 12893 0.0365518 1.0 12893 31 15515 0.0342609 1.0 15515 33 18853 0.0308280 1.0 18853 35 22575 0.0298785 0.0 0 37 26745 0.0250089 0.0 0
The first C program in the CEMHYD3D is called the genpartnew.c. It requires the input
of the above number of particles and the gypsum content as a ratio. Hence a preliminary
Appendix F – Simulating using CEMHYD3D
361
microstructure is created with a name opcw07.img. This img file has the data of the
complete particles stored as an array of 100 x 100 x 100. The space other than the
particles is assumed to be filled with water. This preliminary microstructure contains
particles of diameter 3μm to 37μm. Particles of diameter 1μm are added while
executing the hydration of the microstructure to save space with computer memory.
Distribution of the phases
After the initial image file is created based on the image analysis of the cement paste we
attempt to distribute the phases among the particles of cement in the microstructure. For
this a C program distrib3d.c was used. The new file with the phases created will be
termed opcw07f.img.
Hydration of the microstructure
The third and final program is executed which will hydrate the above created program
based on set of rules of hydration. A sample input data file is shown below.
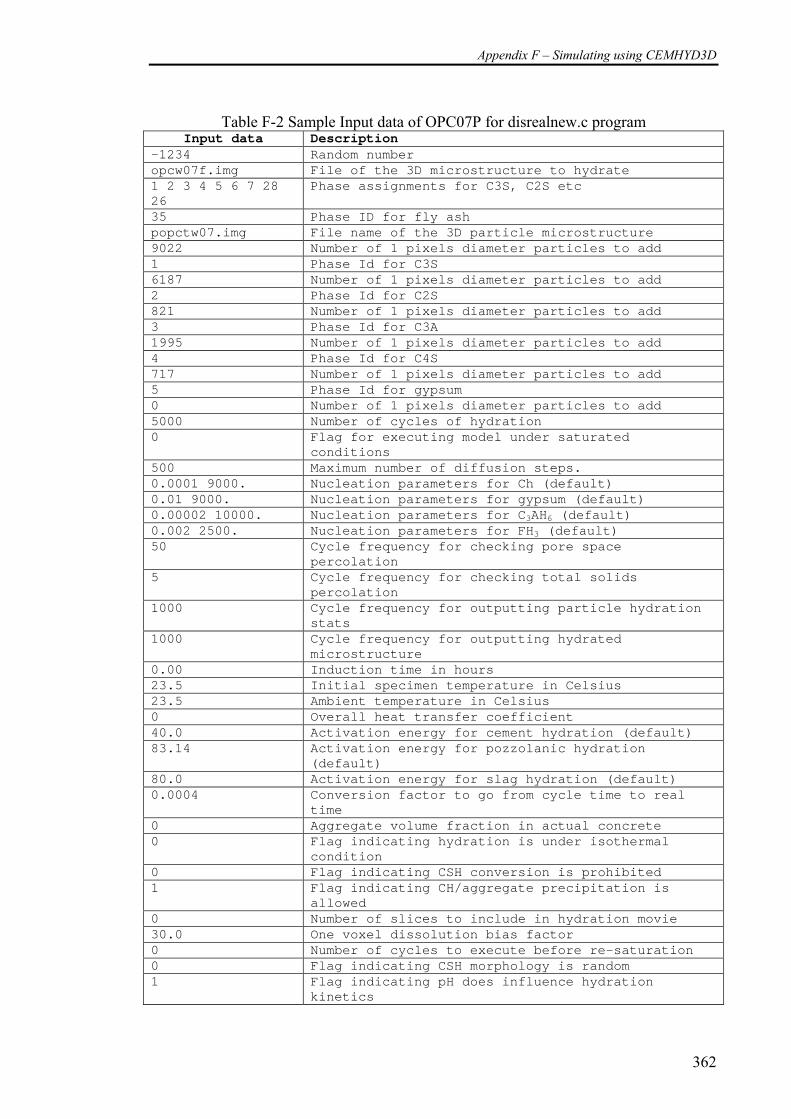
Appendix F – Simulating using CEMHYD3D
362
Table F-2 Sample Input data of OPC07P for disrealnew.c program Input data Description
-1234 Random number opcw07f.img File of the 3D microstructure to hydrate 1 2 3 4 5 6 7 28 26
Phase assignments for C3S, C2S etc
35 Phase ID for fly ash popctw07.img File name of the 3D particle microstructure 9022 Number of 1 pixels diameter particles to add 1 Phase Id for C3S 6187 Number of 1 pixels diameter particles to add 2 Phase Id for C2S 821 Number of 1 pixels diameter particles to add 3 Phase Id for C3A 1995 Number of 1 pixels diameter particles to add 4 Phase Id for C4S 717 Number of 1 pixels diameter particles to add 5 Phase Id for gypsum 0 Number of 1 pixels diameter particles to add 5000 Number of cycles of hydration 0 Flag for executing model under saturated
conditions 500 Maximum number of diffusion steps. 0.0001 9000. Nucleation parameters for Ch (default) 0.01 9000. Nucleation parameters for gypsum (default) 0.00002 10000. Nucleation parameters for C3AH6 (default) 0.002 2500. Nucleation parameters for FH3 (default) 50 Cycle frequency for checking pore space
percolation 5 Cycle frequency for checking total solids
percolation 1000 Cycle frequency for outputting particle hydration
stats 1000 Cycle frequency for outputting hydrated
microstructure 0.00 Induction time in hours 23.5 Initial specimen temperature in Celsius 23.5 Ambient temperature in Celsius 0 Overall heat transfer coefficient 40.0 Activation energy for cement hydration (default) 83.14 Activation energy for pozzolanic hydration
(default) 80.0 Activation energy for slag hydration (default) 0.0004 Conversion factor to go from cycle time to real
time 0 Aggregate volume fraction in actual concrete 0 Flag indicating hydration is under isothermal
condition 0 Flag indicating CSH conversion is prohibited 1 Flag indicating CH/aggregate precipitation is
allowed 0 Number of slices to include in hydration movie 30.0 One voxel dissolution bias factor 0 Number of cycles to execute before re-saturation 0 Flag indicating CSH morphology is random 1 Flag indicating pH does influence hydration
kinetics
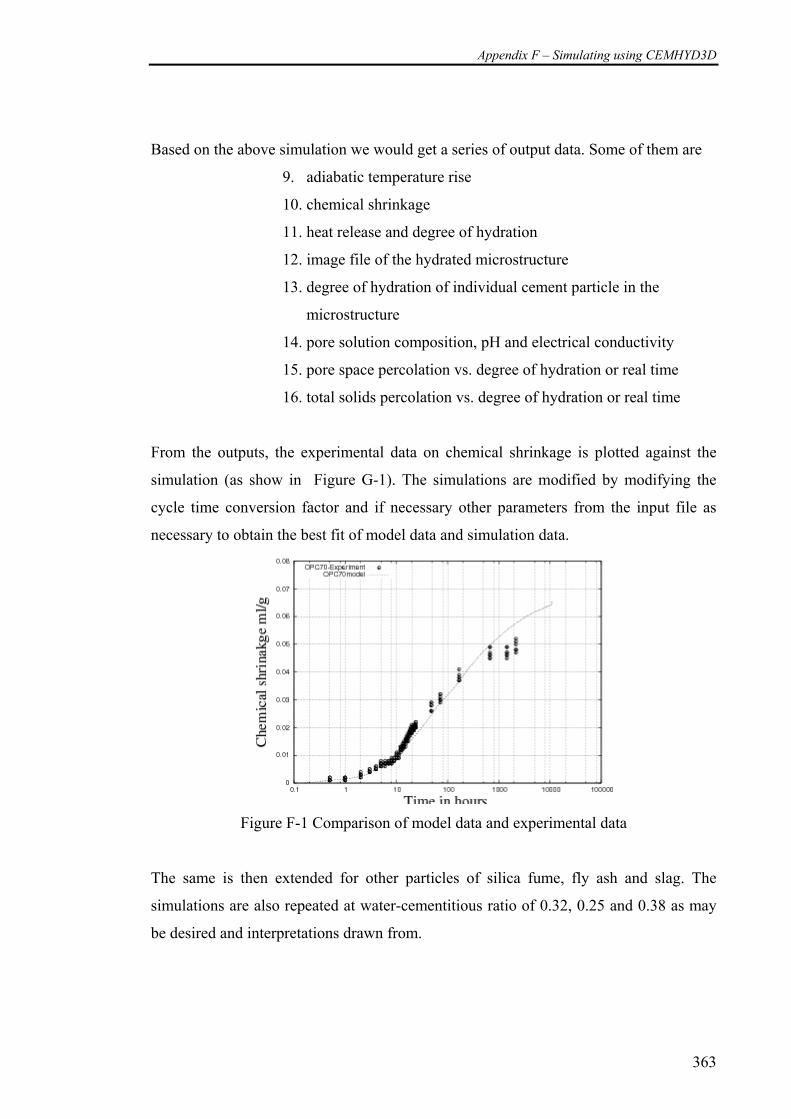
Appendix F – Simulating using CEMHYD3D
363
Based on the above simulation we would get a series of output data. Some of them are
9. adiabatic temperature rise
10. chemical shrinkage
11. heat release and degree of hydration
12. image file of the hydrated microstructure
13. degree of hydration of individual cement particle in the
microstructure
14. pore solution composition, pH and electrical conductivity
15. pore space percolation vs. degree of hydration or real time
16. total solids percolation vs. degree of hydration or real time
From the outputs, the experimental data on chemical shrinkage is plotted against the
simulation (as show in Figure G-1). The simulations are modified by modifying the
cycle time conversion factor and if necessary other parameters from the input file as
necessary to obtain the best fit of model data and simulation data.
Figure F-1 Comparison of model data and experimental data
The same is then extended for other particles of silica fume, fly ash and slag. The
simulations are also repeated at water-cementitious ratio of 0.32, 0.25 and 0.38 as may
be desired and interpretations drawn from.
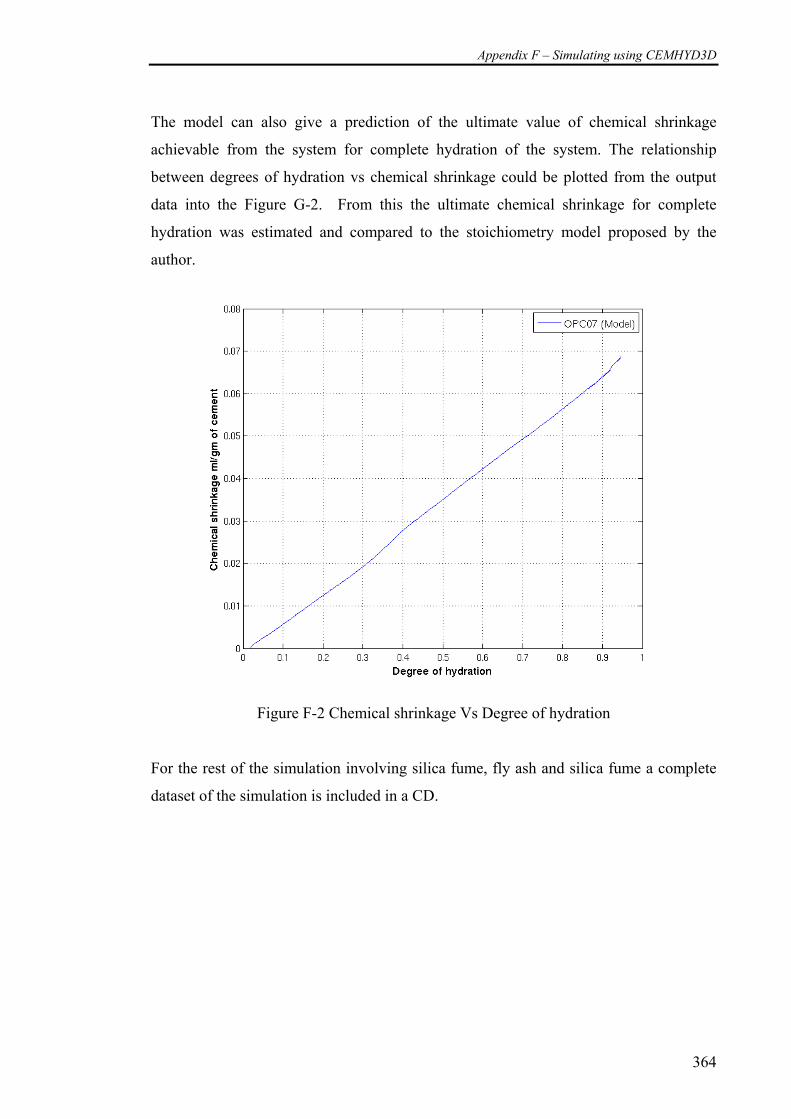
Appendix F – Simulating using CEMHYD3D
364
The model can also give a prediction of the ultimate value of chemical shrinkage
achievable from the system for complete hydration of the system. The relationship
between degrees of hydration vs chemical shrinkage could be plotted from the output
data into the Figure G-2. From this the ultimate chemical shrinkage for complete
hydration was estimated and compared to the stoichiometry model proposed by the
author.
Figure F-2 Chemical shrinkage Vs Degree of hydration
For the rest of the simulation involving silica fume, fly ash and silica fume a complete
dataset of the simulation is included in a CD.
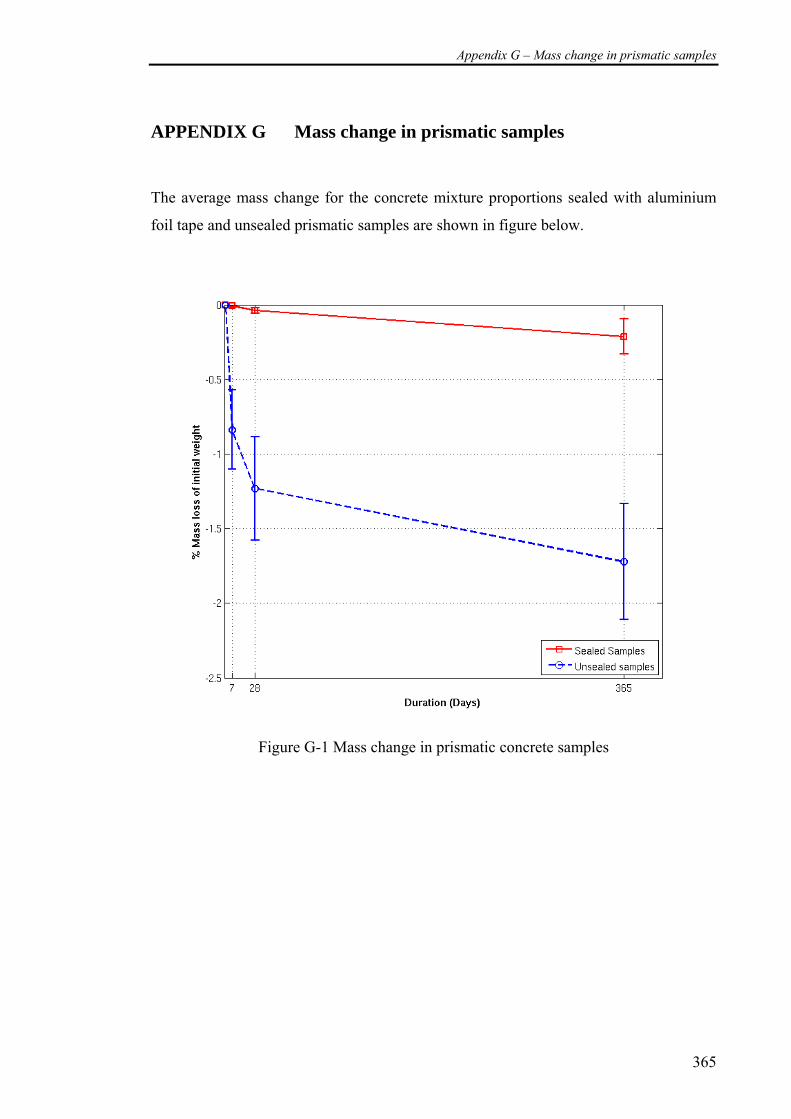
Appendix G – Mass change in prismatic samples
365
APPENDIX G Mass change in prismatic samples
The average mass change for the concrete mixture proportions sealed with aluminium
foil tape and unsealed prismatic samples are shown in figure below.
Figure G-1 Mass change in prismatic concrete samples


