
NBER WORKING PAPER SERIES
SOCIAL IDENTITY AND PREFERENCES
Daniel J. BenjaminJames J. Choi
A. Joshua Strickland
Working Paper 13309http://www.nber.org/papers/w13309
NATIONAL BUREAU OF ECONOMIC RESEARCH1050 Massachusetts Avenue
Cambridge, MA 02138August 2007
Experiment 1 was Strickland’s Harvard College honors senior thesis. We thank John Bargh, NickBarberis, Jim Baron, Geoffrey Cohen, David Dunning, John Friedman, Matthew Gentzkow, Dan Gilbert,Karla Hoff, Moshe Hoffman, Emir Kamenica, Miles Kimball, Rachel Kranton, Ilyana Kuziemko,David Laibson, John List, Wendy Berry Mendes, Sendhil Mullainathan, Emily Oster, Todd Pittinsky,Claudia Sahm, Jesse Shapiro, Margaret Shih, Paul Tetlock, Rebecca Thornton, Robert Willis, twoanonymous referees, and seminar participants at Harvard, Dartmouth, Michigan, NBER, Yale, andChicago for comments and suggestions. We thank Bruce Rind and Bill Stull for facilitating our accessto Temple University. Sarah Bommarito, Gabriel Carroll, Josh Cherry, Ghim Chuan, Christopher Convery,Geoffrey Fisher, Neals Frage, Bjorn Johnson, Dasol Kim, Annette Leung, Hans Lo, Shawn Nelson,Mark Petzold, Tiye Sherrod, Kimberly Solarz, Michael Stevens, Bernardo Vas, Narendra Vempati,and especially Neel Rao and Collin Raymond provided excellent research assistance. We thank theRussell Sage Foundation Small Grants Program in Behavioral Economics and the National Instituteon Aging (grants P30- AG012810 and T32-AG00186) for financial support. Benjamin thanks the Institutefor Humane Studies, the Institute for Quantitative Social Science, the Program on Negotiation at HarvardLaw School, Harvard’s Center for Justice, Welfare, and Economics, and the National Institute on Aging(grant P01-AG26571) for financial support. Choi thanks the Mustard Seed Foundation, the NationalInstitute on Aging (grant R01-AG021650), and Whitebox Advisors for financial support. Stricklandthanks the Harvard College Research Program, the Harvard Economics Department, and the HarvardPsychology Department for financial assistance. The views expressed herein are those of the author(s)and do not necessarily reflect the views of the National Bureau of Economic Research.
© 2007 by Daniel J. Benjamin, James J. Choi, and A. Joshua Strickland. All rights reserved. Shortsections of text, not to exceed two paragraphs, may be quoted without explicit permission providedthat full credit, including © notice, is given to the source.

Social Identity and PreferencesDaniel J. Benjamin, James J. Choi, and A. Joshua StricklandNBER Working Paper No. 13309August 2007, Revised September 2009 JEL No. C91,Z10
ABSTRACT
Social identities prescribe behaviors for people. We identify the marginal behavioral effect of thesenorms on discount rates and risk aversion by measuring how laboratory subjects’ choices change whenan aspect of social identity is made salient. When we make ethnic identity salient to Asian-Americansubjects, they make more patient choices. When we make racial identity salient to black subjects, non-immigrantblacks (but not immigrant blacks) make more patient choices. Making gender identity salient has noeffect on intertemporal or risk choices.
Daniel J. Benjamin480 Uris HallEconomics DepartmentCornell UniversityIthaca, NY 14853and [email protected]
James J. ChoiYale School of Management135 Prospect StreetP.O. Box 208200New Haven, CT 06520-8200and [email protected]
A. Joshua StricklandYale Law School127 Wall St.New Haven, CT [email protected]

2
Relative to white Americans, Asian-Americans accumulate more human capital and are
more likely to participate in tax-deferred savings accounts. Black Americans accumulate less
financial wealth, accumulate less human capital, and are less likely to invest in the stock market,
even after controlling for observable demographic variables. However, recent black immigrants
from the West Indies and Africa are disproportionately represented among high-income blacks
and elite college students. Women invest in more conservative financial assets than men and
behave more cautiously in laboratory experiments.1
Many social scientists have argued that differences in norms tied to social identities help
explain such demographic differences in economic outcomes.2 Asian-American identity is
hypothesized to include a norm for patience, non-immigrant black identity is hypothesized to
include norms for impatience and risk-averse investing, and a higher degree of risk aversion is
hypothesized to be normative for female identity than for male identity. However, it is difficult
to test with non-experimental data whether identity norms play a causal role in economic
decision-making. Social category affiliations in the field are confounded with many other factors
such as socioeconomic status, opportunity sets, and peer pressure (David Austen-Smith and
Fryer 2005; Fryer and Paul Torelli 2005).
In this paper, we use a methodology from social psychology to introduce exogenous
variation in identity effects. According to “self-categorization theory,” a long-standing idea in
1 These findings are documented in Thomas Sowell (1975), Stanley Sue and Sumie Okazaki (1990), Derek A. Neal and William R. Johnson (1996), Erik Hurst, Ming-Ching Luoh, and Frank Stafford (1998), Nancy Ammon Jianakoplos and Alexandra Bernasek (1998), Annika E. Sundén and Brian J. Surette (1998), James P. Byrnes, David C. Miller, and William D. Schaefer (1999), Joseph G. Altonji, Ulrich Doraszelski, and Lewis Segal (2000), Glenn R. Springstead and Theresa M. Wilson (2000), Roland G. Fryer Jr. and Steven D. Levitt (2004), Rachel Croson and Uri Gneezy (2004), and Sara Rimer and Karen W. Arenson (2004). It should be noted that Christopher Carroll, Byung-Kun Rhee, and Changyong Rhee (1994, 1999) do not find that Asian immigrants save more, but they are hindered by their data quality. Carroll, Rhee, and Rhee (1994) do find that Asian-Canadian immigrants’ educational expenditures are 3.6 times the Canadian average. 2 See, for example, Thomas Sowell (1975, 1981, 2005), Barry R. Chiswick (1983), Charles Murray (1984), Geert Hofstede and Michael Harris Bond (1988), Richard P. Barke, Hank Jenkins-Smith, and Paul Slovic (1997), and Yankelovich Partners Inc. (1999).
3
psychology (William James 1890; John C. Turner 1985), environmental cues called “primes” can
temporarily make a certain social category more salient, causing a person’s behavior to tilt more
toward the norms associated with the salient category. If the self-categorization theory is valid,
then a researcher can identify the marginal effect of a particular social category by
experimentally varying the salience of the category and seeing how an individual’s behavior
changes.
Our focus is on the effect of ethnic, racial, and gender category norms on time and risk
preferences. After randomly manipulating category salience, we elicit subjects’ time and risk
preferences using incentive-compatible mechanisms standard in experimental economics.
Section I describes a theoretical framework for understanding how priming effects allow us to
make inferences about norms.
Section II presents the first experiment, which studies the effect of Asian ethnic category
norms on time and risk preferences. Consistent with the hypothesis that Asian category norms
help explain high Asian-American capital accumulation, we find that primed Asian-American
subjects make more patient choices than Asian-American control subjects.
Section III presents the second experiment, which studies black racial category norms
and gender category norms. Contrary to the arguments of Sowell (1975, 1981, 2005) and Charles
Murray (1984), we find that making race salient causes native blacks—that is, those who have
long-standing U.S. roots—to become more patient, whereas it has no effect on immigrant blacks’
discount rates.3 We also find suggestive evidence that native blacks become more risk averse
when primed with race, which is consistent with racial risk norms depressing native blacks’
3 See Herbert J. Storing (1995), Cornel West (2000), and Bernard W. Bell (2005) for arguments that patience is a central feature of black American norms.

4
stock market participation, and that whites become more patient when primed with race. Finally,
making gender salient has no effect on men and women’s risk aversion.
There is a large psychology literature on identity salience.4 Our work differs from this
past research in two important ways. First, we focus on primitive preference parameters
measured with incentive-compatible mechanisms, dependent variables that are primarily of
interest to economists. Second, psychologists have emphasized testing the validity of self-
categorization theory and the cognitive mechanisms through which it operates. Therefore, they
prime identities chosen specifically because their norms are known so that the theory has a clear
prediction about the priming effect. We take self-categorization theory as given and prime
identities with unknown norms so that we can infer what those norms are via the behavioral
response to the prime.
Section IV concludes. A web appendix contains the experimental materials we used.
I. A Theoretical Framework
Within our theoretical framework, which is inspired by Akerlof and Kranton (2000),
priming a particular social category reveals the marginal effect of increasing the strength of
affiliation with that category. Let x be some action choice, such as how much to pursue
immediate gratification or how much to avoid risks. An individual belongs to a social category
C, such as black race or female gender, with strength s ≥ 0. Let x0 denote the individual’s
4 Identity salience studies include Stephen Reicher and Mark Levine (1994), Mark R. Forehand, Rohit Deshpandé, and Americus Reed II (2002), and Robyn A. LeBoeuf, Eldar Shafir, and Julia Belyavsky (2006). In addition, priming techniques are widely used in psychology to explore broader cognitive processes. See, for example, John A. Bargh, Mark Chen, and Lara Burrows (1996) and Daniel M. Wegner and Bargh (1998). Our work is also related to economic research on social identity and discrimination against outgroup members (e.g., Karla Hoff and Priyanka Pandey 2006; Yan Chen and Sherry Xin Li 2009).
5
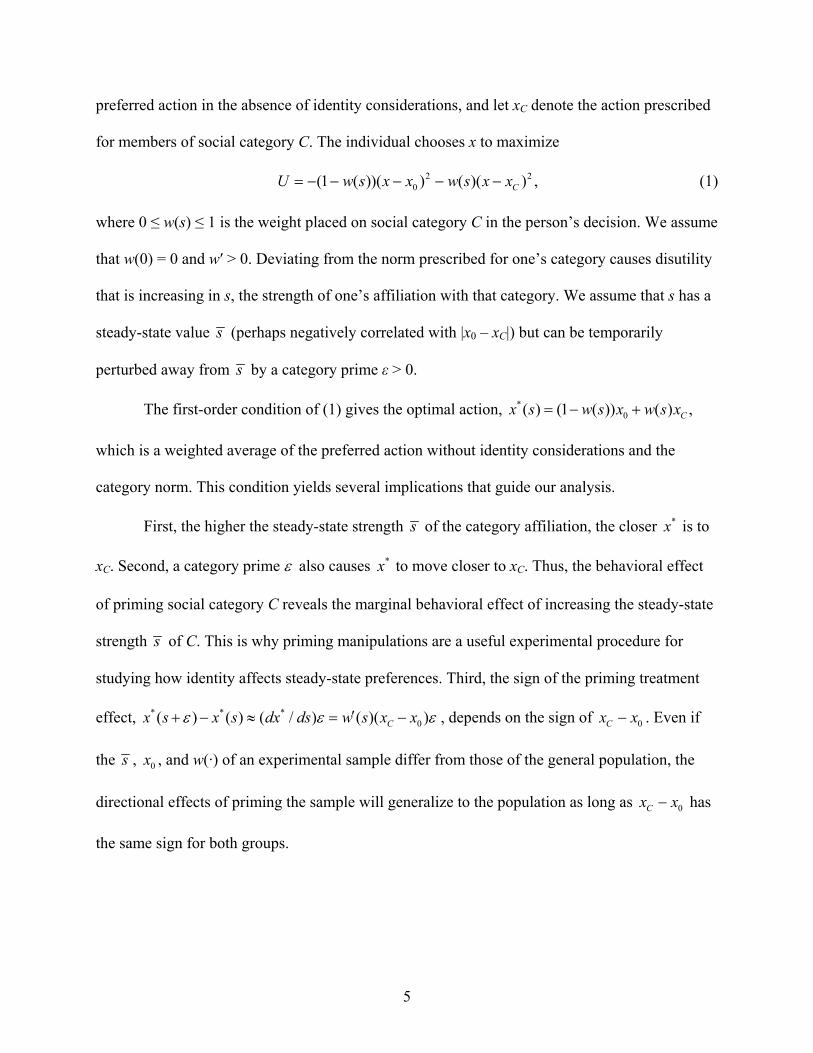
preferred action in the absence of identity considerations, and let xC denote the action prescribed
for members of social category C. The individual chooses x to maximize
2 20(1 ( ))( ) ( )( )CU w s x x w s x x= − − − − − , (1)
where 0 ≤ w(s) ≤ 1 is the weight placed on social category C in the person’s decision. We assume
that w(0) = 0 and w′ > 0. Deviating from the norm prescribed for one’s category causes disutility
that is increasing in s, the strength of one’s affiliation with that category. We assume that s has a
steady-state value s (perhaps negatively correlated with |x0 – xC|) but can be temporarily
perturbed away from s by a category prime ε > 0.
The first-order condition of (1) gives the optimal action, *0( ) (1 ( )) ( ) ,Cx s w s x w s x= − +
which is a weighted average of the preferred action without identity considerations and the
category norm. This condition yields several implications that guide our analysis.
First, the higher the steady-state strength s of the category affiliation, the closer *x is to
xC. Second, a category prime ε also causes *x to move closer to xC. Thus, the behavioral effect
of priming social category C reveals the marginal behavioral effect of increasing the steady-state
strength s of C. This is why priming manipulations are a useful experimental procedure for
studying how identity affects steady-state preferences. Third, the sign of the priming treatment
effect, * * *0( ) ( ) ( / ) ( )( )Cx s x s dx ds w s x xε ε ε′+ − ≈ = − , depends on the sign of 0Cx x− . Even if
the s , 0x , and w(·) of an experimental sample differ from those of the general population, the
directional effects of priming the sample will generalize to the population as long as 0Cx x− has
the same sign for both groups.

6
The hypothesis that an identity norm increases patience corresponds to 0Cγ γ< , where
γ is the degree of impatient behavior. Similarly, the hypotheses that an identity norm increases
risk aversion corresponds to 0Cρ ρ> , where ρ is the degree of risk-averse behavior.
Some psychologists have expressed the intuition that priming a category should have a
stronger effect on those who identify more strongly with that category. Our framework generates
the perhaps surprising conclusion that this need not be the case. Let 0 Cx x< without loss of
generality. Priming sensitivity increasing with identification strength corresponds to the
condition 2 * 2/d x ds > 0, which holds in a neighborhood of s if and only if ( ) 0w s′′ > . Depending
on the shape of w(·) and the level of s, 2 * 2/d x ds could take either sign. While it may be the case
that individuals with higher s are more susceptible to priming ( 0w′′ > ), such individuals could
instead become saturated with the category ( 0w′′ < ). Thus, measuring the interaction between
priming and identification strength does not test the theory’s validity.
II. Experiment 1: Asian-American Ethnic Norms
A. Procedure
Participants were Harvard College undergraduates, 71 of Asian descent and 66 of white
descent. Half the participants were randomly assigned to the ethnicity-salience condition and half
to the control condition. Subjects responded to a “background questionnaire” that varied by
experimental condition, then a time preference elicitation, and finally a risk preference
elicitation.
In the ethnicity-salience condition, the “background questionnaire” included questions
about languages spoken by the subject’s family and how many generations the subject’s family
has lived in the United States. This manipulation was originally used by Margaret Shih, Todd L.

7
Pittinsky, and Nalini Ambady (1999) to make ethnicity salient to Asian-Americans. In the
control condition, the “background questionnaire” asked about the school meal plan and cable
television subscription.
We measured time preferences by asking participants to make 46 binary choices between
a certain amount of money received earlier ($3 or $7) and a larger amount received later (either
between $3.05 and $7, or between $7.10 and $15). Half the choices were between an immediate
payment and a payment one week later, and half the choices were between a payment one week
later and a payment two weeks later.
Our approach to measuring time preferences is standard (Shane Frederick, George
Loewenstein, and Ted O’Donoghue 2002). Similar measures predict variation in discounting-
related behaviors such as drug addiction, cigarette smoking, excessive gambling, use of
commitment savings devices, borrowing on installment accounts and credit cards, and rapid
exhaustion of food stamps.5
We measured risk preferences with 18 binary choices between a sure $4 and an X percent
chance at $8, where X varied from 25 to 76. Risk aversion measures derived from real-stakes
experimental choices such as ours are highly correlated with measures from hypothetical
choices, which in turn predict risky behaviors such as smoking, drinking, failing to hold
insurance, holding stocks rather than Treasury bills, being self-employed, switching jobs, and
moving residences.6
5 See Victor Fuchs (1982), Warren K. Bickel, Amy L. Odum, and Gregory J. Madden (1999), Kris N. Kirby, Nancy M. Petry, and Bickel (1999), Petry and Thomas Casarella (1999), Kirby and Petry (2004), Jesse M. Shapiro (2005), Nava Ashraf, Dean S. Karlan, and Wesley Yin (2006), and Stephan Meier and Charles Sprenger (forthcoming). 6 See Robert B. Barsky et al. (1997), Luigi Guiso and Monica Paiella (forthcoming), Thomas Dohmen et al. (2005), and Claudia R. Sahm (2007).

8
One of the time or risk preference choices was randomly selected to determine each
participant’s payout. All payments were made by a check given to the participant immediately
following the experiment. Delayed payments were implemented by post-dating the check.7
B. Econometric Methodology
In the time preference task, our dependent variable is the log of the minimum
continuously compounded weekly interest rate that the subject requires to choose the later
payment. That is, we apply the log operator once to transform the reservation gross interest rate
into the continuously compounded net interest rate, and then we apply the log operator again.
The second application of the log operator causes the estimator we describe below to assume that
reservation continuously compounded interest rates are conditionally log-normal, thus ruling out
negative discount rates. In the risk preference task, our dependent variable is the minimum risk
premium—that is, the expected return offered by the gamble in excess of the risk-free return—
that the subject requires to accept the gamble. For example, if the subject would choose to
gamble for $8 rather than accept the sure $4 if and only if the probability of winning is at least 58
percent, then the reservation risk premium is (8 × 0.58 – 4)/4 = 0.16.8
Because we observe choices at only a finite number of interest rates and risk premia, we
use an interval regression (Mark B. Stewart 1983), which is a generalization of the tobit
estimator that allows the econometrician to specify that the dependent variable value lies
7 If a risk preference choice was selected for payment, the check was immediately cashable. 8 In this formula, we treat the risk choice as investing a $4 endowment into either the risk-free or risky asset.
9
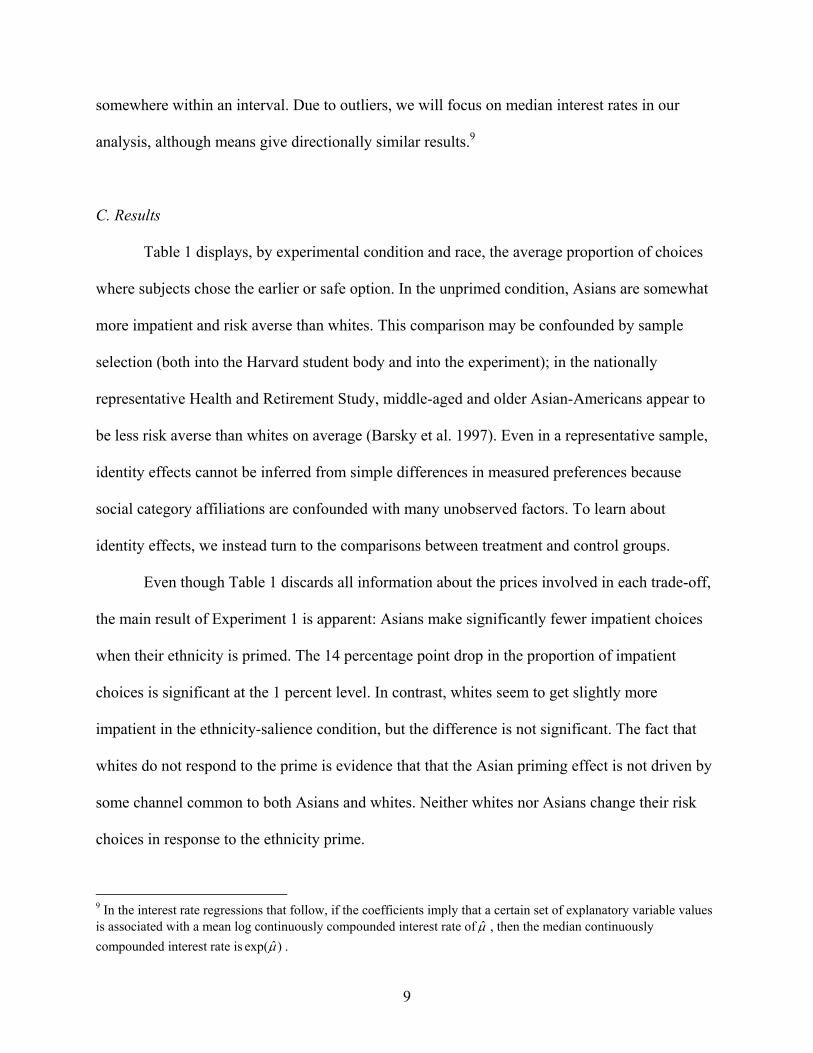
somewhere within an interval. Due to outliers, we will focus on median interest rates in our
analysis, although means give directionally similar results.9
C. Results
Table 1 displays, by experimental condition and race, the average proportion of choices
where subjects chose the earlier or safe option. In the unprimed condition, Asians are somewhat
more impatient and risk averse than whites. This comparison may be confounded by sample
selection (both into the Harvard student body and into the experiment); in the nationally
representative Health and Retirement Study, middle-aged and older Asian-Americans appear to
be less risk averse than whites on average (Barsky et al. 1997). Even in a representative sample,
identity effects cannot be inferred from simple differences in measured preferences because
social category affiliations are confounded with many unobserved factors. To learn about
identity effects, we instead turn to the comparisons between treatment and control groups.
Even though Table 1 discards all information about the prices involved in each trade-off,
the main result of Experiment 1 is apparent: Asians make significantly fewer impatient choices
when their ethnicity is primed. The 14 percentage point drop in the proportion of impatient
choices is significant at the 1 percent level. In contrast, whites seem to get slightly more
impatient in the ethnicity-salience condition, but the difference is not significant. The fact that
whites do not respond to the prime is evidence that that the Asian priming effect is not driven by
some channel common to both Asians and whites. Neither whites nor Asians change their risk
choices in response to the ethnicity prime.
9 In the interest rate regressions that follow, if the coefficients imply that a certain set of explanatory variable values is associated with a mean log continuously compounded interest rate of μ̂ , then the median continuously compounded interest rate is ˆexp( )μ .

10
Table 2 presents formal regression evidence on priming effects, incorporating price
information. We regress participants’ reservation log continuously compounded interest rate and
risk premium on an experimental condition dummy. The interest rate regression also includes
dummies for whether the intertemporal choice is between payments deferred for one week versus
two weeks, whether the earlier payout being offered is $7, and the interaction of the above two
dummies. We cluster standard errors in the interest rate regression by subject (Kenneth A. Froot
1989; William Rogers 1993). Column 1 confirms that the interest rate required by Asians to
defer payment falls dramatically when Asian ethnic identity is made salient. For example, for
trade-offs between $4 now and money one week from now, the median required interest rate falls
from 8.8 percent to 2.1 percent. Running separate regressions for each intertemporal choice type
(immediate payment amount × time horizon) reveals that this treatment effect is significant at the
1 percent level and of similar magnitude for all four types.10 Column 3 shows that there is no
effect on the risk premium Asians require to accept gambles, which is perhaps not surprising
given the previous literature’s ambiguous findings on Asian risk attitudes.11 Columns 2 and 4
show, in analogous regressions for white subjects, that whites’ choices are not affected by the
prime.
10 In a regression that includes an interaction between identity salience and an indicator for one’s family having lived in the U.S. for fewer than two generations, the interaction is insignificantly negative for Asians. However, this regression must be interpreted cautiously because we did not measure immigration status for the control group and so cannot include immigration status as an uninteracted regressor. 11 See Lawrence K. Hong (1978), Barsky et al. (1997), Elke U. Weber and Christopher Hsee (1998), and Hsee and Weber (1999).
11
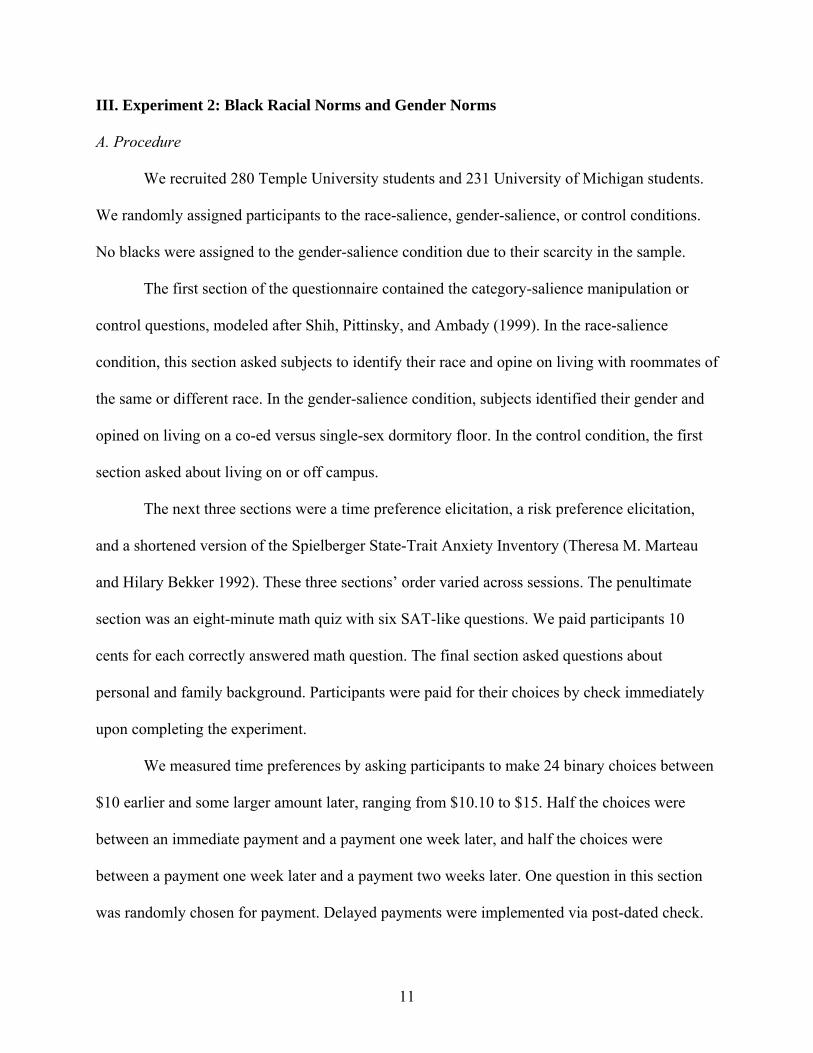
III. Experiment 2: Black Racial Norms and Gender Norms
A. Procedure
We recruited 280 Temple University students and 231 University of Michigan students.
We randomly assigned participants to the race-salience, gender-salience, or control conditions.
No blacks were assigned to the gender-salience condition due to their scarcity in the sample.
The first section of the questionnaire contained the category-salience manipulation or
control questions, modeled after Shih, Pittinsky, and Ambady (1999). In the race-salience
condition, this section asked subjects to identify their race and opine on living with roommates of
the same or different race. In the gender-salience condition, subjects identified their gender and
opined on living on a co-ed versus single-sex dormitory floor. In the control condition, the first
section asked about living on or off campus.
The next three sections were a time preference elicitation, a risk preference elicitation,
and a shortened version of the Spielberger State-Trait Anxiety Inventory (Theresa M. Marteau
and Hilary Bekker 1992). These three sections’ order varied across sessions. The penultimate
section was an eight-minute math quiz with six SAT-like questions. We paid participants 10
cents for each correctly answered math question. The final section asked questions about
personal and family background. Participants were paid for their choices by check immediately
upon completing the experiment.
We measured time preferences by asking participants to make 24 binary choices between
$10 earlier and some larger amount later, ranging from $10.10 to $15. Half the choices were
between an immediate payment and a payment one week later, and half the choices were
between a payment one week later and a payment two weeks later. One question in this section
was randomly chosen for payment. Delayed payments were implemented via post-dated check.

12
The section’s instructions made it clear that the questions were not intended to evaluate
performance: “It’s important to keep in mind that there are no right or wrong answers here.
Which choice you make is a matter of personal preference.” We used this same wording again in
the instructions for the risk preference elicitations.
We elicited small-stakes risk preferences by asking participants to make six binary
choices between $1 for sure and a 50 percent chance at a larger amount, ranging from $1.60 to
$3.60. All six choices affected each subject’s payment. We measured larger-stakes risk
preferences with analogous choices, except that the monetary amounts were multiplied by 100
and there was only a small chance that the subject’s choice would be implemented.12
B. Main Results
Table 3 displays, by demographic group × treatment group, the average percent of
intertemporal or risk choices where subjects chose the earlier or safe payment, respectively.13 (A
Web appendix table reports descriptive statistics for each demographic × treatment group.) We
classify blacks as immigrants if they responded in the debriefing survey that either they or at
least one of their parents were born outside the U.S. Because no blacks were assigned to the
gender-salience condition, we exclude all blacks from the control group when making
comparisons to a gender-salience treatment group.
As in Experiment 1, our student subjects are a highly selected population, and this is
reflected in their baseline choices. For instance, blacks are on average more risk averse than
whites in nationally representative data (on middle-aged and older Americans; see Sahm 2007),
12 Any money participants earned from their risk choices was paid with a check that could be cashed immediately. 13 To be clear that they are not driving our results, we have dropped the four native blacks who were over 22 years old, all of whom were randomized into the race-salience treatment. These subjects—ages 23, 23, 34, and 47—differed from other subjects along many dimensions. Our priming results are qualitatively similar if we include these four subjects.

13
whereas our unprimed native black subjects choose the safe payment less often than our white
subjects. We identify identity effects by comparing unprimed participants with primed
participants within each demographic group.
Table 3 shows that when we discard all price information, we do not find any treatment
effects that reach statistical significance. Table 4 presents regression evidence incorporating
price information. Our econometric methodology is similar to that used for Experiment 1. The
dependent variable is either the log of the continuously compounded reservation interest rate or
the reservation risk premium. The explanatory variables are a dummy for whether a social
category is being made salient, a tradeoff type dummy (whether the intertemporal choice is
between payments deferred for one week versus two weeks, or whether the sure payout in the
risky choice is $100), a dummy for whether the subjects were recruited at Michigan, and an
interaction between the tradeoff type and Michigan dummies.
In Panel A, we see that making race salient to native blacks significantly lowers their
reservation interest rate for deferring receipt of payment.14 For example, fitted regression
estimates from the table indicate that when choosing between money now and money one week
from now, the median continuously compounded reservation interest rate among Temple
students falls from 23.2 percent to 10.9 percent. In contrast, race salience has no effect on white
and immigrant black reservation interest rates.15 It appears that racial identity effects on discount
14 The difference in the statistical significance of the native black priming effect in Table 3 versus Table 4 is mainly due to the fact that the reservation continuously compounded interest rate is close to log-normally distributed. Therefore, using the log of the continuously compounded interest rate as the dependent variable in a regression results in an efficient estimate of the median. The comparison of percentages in Table 3 did not utilize such a transformation, resulting in an inefficient estimate. Note that we had subjects make many more intertemporal choices in Experiment 1 than in Experiment 2, so the inefficient estimator used in Table 1 still has sufficient power to detect the Asian priming effect. 15 The difference between the native black coefficient and the white coefficient is significant at the 10 percent level (p = 0.06), as is the difference between the native black and immigrant black coefficients (p = 0.10). However, these comparisons must be interpreted carefully, since the dependent variable has been transformed by two applications of the log function. A one unit movement in the transformed interest rate does not translate to an equivalent size

14
rates do not cause the capital accumulation gap between blacks and whites, and between native
and immigrant blacks.
The last two columns of Table 4’s Panel A show that making gender salient has no
significant effects on either men’s or women’s patience. Panel B shows that there are no
significant priming effects on any of the groups’ risk aversions either. In particular, there is no
indication that male identity contains a stronger risk-seeking norm than female identity.
Subjects who did not believe that our preference elicitations were incentive-compatible
may have made low-quality decisions or acted strategically (rather than reporting their true
preferences), adding noise and bias to our treatment effect estimates. Therefore, an interesting
subsample is the set of subjects who reported in the debriefing questionnaire that they believed
that they would be paid exactly as promised in the experimental instructions.16
Our first question regarding payment credibility asked, “Throughout this experiment, you
made choices that involved various amounts of money. We said that your responses would affect
how much you get paid, but you may not have believed us. Did you believe that your responses
would affect how much you get paid?” The second question asked, “Think back to when you
were answering questions about getting a certain amount of money today versus getting some
different amount of money in a week. Did you believe that you would actually get paid in a week
if you chose to take the money in a week?”
movement in the untransformed interest rate, which is the price that is relevant to subjects. To get a sense of the magnitudes in the untransformed scale, we perform a calculation similar to the one in the main text and find that primed Temple whites’ median reservation interest rate falls by only 0.4 percentage points, and primed Temple immigrant blacks’ median reservation interest rate falls by only 0.7 percentage points. Analogous calculations for Michigan subjects yield similar results. 16 We did not measure our credibility among Experiment 1 subjects. Experiment 1 was conducted on Harvard undergraduates by the third author, who was also a Harvard undergraduate at the time. We had no affiliation with Temple, and only a temporary non-faculty affiliation with the University of Michigan. In subsequent experiments similar to Experiment 2 (but with a different priming manipulation) at one of our home institutions, we find belief rates around 80 percent, suggesting that credibility is in fact much higher when social distance is smaller.

15
In a Web appendix table, we show that the category salience manipulations had no
statistically significant effect on belief in our payment promises, but between 35 and 53 percent
of subjects within each demographic group × experimental condition cell reported some
disbelief. Other studies have shown that without financial incentives, experimental participants
behave more randomly and exert less effort (see Colin F. Camerer and Robin M. Hogarth 1999
for a literature review). We have suggestive evidence that this is true among our skeptics. One
measure of participants’ cognitive effort is whether their choices are “well-behaved”—choosing
the delayed payment if and only if the interest rate exceeds exactly one threshold, and choosing
the gamble if and only if the risk premium exceeds exactly one threshold.17 Respectively, 7
percent and 21 percent of participants who did not believe our payment promises failed to
answer the intertemporal and risk questions in a well-behaved manner. These proportions are
greater than the 5 percent and 16 percent of believers who made poorly behaved intertemporal or
risk choices, but it should be noted that these differences are not statistically significant.18
Because dropping self-reported skeptics causes us to discard so much data, subjects
endogenously chose their response to the belief questions, and merely asking questions about
payment credibility may have generated skepticism ex post even if none was present during the
preference elicitations, the subsample results that follow should be interpreted with caution.
In Table 5, we exclude subjects who did not believe that their choices would affect their
payment. For our time preference regressions, we additionally drop subjects who did not believe
they would receive deferred payments. We find that restricting our sample to self-reported
17 Our results are qualitatively similar when excluding subjects whose choices were poorly behaved. 18 Non-believers also made a higher fraction of impatient choices (p = 0.02) and cautious choices (not statistically significant), which is consistent with their exerting less cognitive effort (Daniel J. Benjamin, Sebastian A. Brown, and Jesse M. Shapiro 2006). Charles A. Holt and Susan K. Laury (2002) find that subjects become less risk averse when they are not offered incentives. Our results may not be inconsistent with Holt and Laury’s because they explicitly told their subjects that the choices were hypothetical, whereas our non-believing subjects apparently believed we were deceiving them about incentives.

16
believers qualitatively changes some of our results. Although the point estimate for the effect of
priming race on time preference is nearly identical in the full native black sample and in the
restricted native black sample (which is 41 percent smaller), the effect loses statistical
significance in the restricted sample. Priming race also causes white discount rates to drop
significantly among believers, suggesting that there may be a patient white racial norm as well.19
In the risk domain for the restricted sample, we find that priming racial identity raises the
reservation native black risk premium among believers by 23 percentage points, a change that is
significant at the 1 percent level. In contrast, immigrant blacks’ required risk premium falls by
11 percentage points when race is salient, although the drop is not statistically different from
zero. The native black priming effect on risk aversion is statistically different from the white and
immigrant black priming effects (both p-values < 0.01). This result is consistent with the
hypothesis that racial risk norms depress native blacks’ stock market participation.
C. Potential Alternative Explanations
Stereotype threat, lift, and emotional states. Many researchers have documented the “stereotype
threat” phenomenon: making race or gender salient impairs the cognitive performance of groups
with stereotypically poor performance. Conversely, making negative stereotypes about other
groups salient improves cognitive performance, a finding dubbed “stereotype lift.”20 It is
believed that stereotype threat and lift effects operate through increasing or reducing anxiety that
19 Race (e.g. white) is distinct from ethnicity (e.g. German). The priming effect on whites in Experiment 2 should be interpreted as a race salience effect on whites. For whites in Experiment 1, the priming effect should be interpreted as an ethnicity salience effect for the various ethnicities relevant to the white subjects. 20 Studies documenting stereotype threat and lift include Claude M. Steele and Joshua Aronson (1995), Shih, Pittinsky, and Ambady (1999), Gregory M. Walton and Geoffrey L. Cohen (2003), David M. Marx and Diederik A. Stapel (2006), and Thomas S. Dee (2008).

17
one will confirm negative stereotypes about one’s group. Consistent with this mechanism, these
effects vanish when tasks are presented to subjects as not being diagnostic of ability.
A possible explanation for our results is that the category primes affected subjects’ ability
to compute expected values and interest rates. We think this explanation is unlikely because we
did not present the preference elicitation questions as being diagnostic of ability. In Experiment
2, we explicitly told subjects that there are no right or wrong answers for the preference
elicitation questions.
However, even if stereotype threat and lift effects on cognitive ability were not present, it
is possible that the priming questions induced changes in subjects’ emotional states which
affected their expressed preferences. For example, if certain priming questions agitated subjects,
their willingness to delay payment receipt or take risks may change (Loewenstein 2000).
To check that our results are not being driven by stereotype threat, stereotype lift, or
emotional changes, we examine how the primes affected performance on the five math quiz
questions administered after the elicitations and responses to the anxiety inventory. The primes
had no effect on math quiz performance or anxiety (results not shown in tables).21
21 Stereotype threat and lift effects have been shown to last at least 16 minutes after race is made salient (Jim Blascovich et al. 2001). Hence, these effects (if we had activated them) would be expected to affect performance in our math quiz, which was administered approximately 12 minutes after the prime. We can confirm that our priming effect on time preference persists for at least 12 minutes because we varied the order of the preference elicitations (in Experiment 2). In fact, the priming effect is largest immediately before the math quiz, although this is mainly driven by control subjects becoming more impatient, rather than primed subjects becoming more patient. We thank a referee for pointing out that, even if stereotype threat did not affect the preference elicitations, one might have expected stereotype threat to be activated for the math questions, since they are clearly diagnostic of ability. The lack of such an effect here may be due to the many non-diagnostic tasks performed between the prime and the math quiz. Stereotype threat studies typically administer the diagnostic task immediately after the identity-relevant questions and present the task as the focus of the researchers’ interest, making it more likely that subjects will infer that their performance on that task will be used to judge their race or gender.

18
Experimenter “demand effects.” If participants understood the purpose of the experiment, then
our priming effects could be explained by a “demand effect” that caused participants to behave
in the way they thought the experimenters wanted them to behave.
In the Michigan sample, we asked in the final questionnaire section, “Think back to when
you were making choices about money. While you were making those choices, were you
thinking about what we wanted you to do?” Ninety percent of subjects circled the answer, “No, I
was making the choice I wanted to make. I was not thinking about what the experimenter might
want me to choose.” Of those who instead circled yes, most made innocuous guesses about what
the experimenters wanted (like “to see whether or not we were risk takers with money”), and no
one made a guess related to race or gender. Our results are qualitatively similar when we drop
subjects who reported thinking about what the experimenter wanted them to do.
Type I error. Although our main priming effects are highly statistically significant, we also tested
many hypotheses. One way to gain a sense for the likelihood that our results are driven by Type I
error is to see if the priming effects are consistent at both schools in which we collected data.
Running regressions separately for each school, we find that the native black discount rate effect
is strong among the Michigan subjects, where the identity salience coefficient is –1.628 and the
p-value is 0.006. The effect is also negative among the native black subjects at Temple, although
the identity salience coefficient is smaller (–0.281) and the p-value is larger (0.353).
In the subsample of subjects who reported believing our payment promises, priming race
in native blacks caused them to become more risk averse in both the Temple sample (coefficient
= 0.153, p = 0.094) and the Michigan sample (coefficient = 0.358, p = 0.013). The point estimate
for the race priming effect on immigrant blacks’ reservation risk premium is negative at both

19
Temple (–0.125) and Michigan (–0.035), and the p-value for the difference between the native
and immigrant black race priming effects on the risk premium is 0.045 at Temple and 0.059 at
Michigan. The white believer subsample’s discount rate priming effect is negative at both
schools, but stronger at Temple (coefficient = –0.967, p = 0.029) than at Michigan (coefficient =
–0.418, p = 0.368).
IV. Conclusion
Our results suggest that social identity affects fundamental economic preferences. We
find that making Asian-American subjects’ ethnicity salient causes them to exhibit more patient
preferences. Making race salient to black subjects decreases discount rates among those who
have longstanding roots in the U.S. There is also suggestive evidence that native blacks become
more risk averse and whites more patient when their racial identity is salient.
Understanding identity salience effects is important for at least two reasons. First, as we
have emphasized in this paper, identity salience manipulations are an empirical tool that
economists can use to test theories about how steady-state identity affiliations matter for
behavior. Second, identity primes may in themselves have important real-world behavioral
consequences. If being the only female in line at the polling booth primes the gender identity
category, then it may influence the woman to vote for a female candidate.22 An American-born
black worker who is enrolling in his 401(k) may, due to a transitory racial prime, choose a higher
savings rate. Even though his discount rate was only temporarily depressed, a large body of
empirical evidence has shown that most households’ retirement savings decisions are highly
inertial (William Samuelson and Richard Zeckhauser 1988; Brigitte C. Madrian and Dennis F.
22 Jonah Berger, Marc Meredith, and S. Christian Wheeler (2008) find that voters who vote in a school are more likely to vote to raise taxes to support education.

20
Shea 2001; James J. Choi et al. 2002), so the momentary effect of the prime could have long-run
consequences. Priming effects raise the possibility that a benevolent policymaker could
intentionally use identity primes as an instrument for encouraging desirable behaviors in various
domains, such as savings and investing. Of course, policymakers and other market players will
have self-interested motives as well for manipulating the primes to which individuals are
exposed.

21
References Akerlof, George A., and Rachel E. Kranton. 2000. “Economics and Identity,” Quarterly
Journal of Economics, 115(3): 715-733.
Altonji, Joseph G., Ulrich Doraszelski, and Lewis Segal. 2000. “Black/White Differences in Wealth.” Economic Perspectives (Winter).
Ashraf, Nava, Dean S. Karlan, and Wesley Yin. 2006. “Tying Odysseus to the Mast: Evidence from a Commitment Savings Project in the Philippines.” Quarterly Journal of Economics, 121(2): 635-672.
Austen-Smith, David, and Roland G. Fryer, Jr. 2005. “An Economic Analysis of ‘Acting White.’” Quarterly Journal of Economics, 120(2): 551-583.
Bargh, John A., Mark Chen, and Lara Burrows. 1996. “Automaticity of Social Behavior: Direct Effects of Trait Construct and Stereotype Activation on Action.” Journal of Personality and Social Psychology, 71(2): 230-244.
Barke, Richard P., Hank Jenkins-Smith, and Paul Slovic. 1997. “Risk Perceptions of Men and Women Scientists.” Social Science Quarterly, 78(1): 167-176.
Barsky, Robert B., F. Thomas Juster, Miles S. Kimball, and Matthew D. Shapiro. 1997. “Preference Parameters and Behavioral Heterogeneity: An Experimental Approach in the Health and Retirement Study.” Quarterly Journal of Economics, 112(2): 537-579.
Bell, Bernard W. 2005. The Contemporary African American Novel: Its Folk Roots and Modern Literary Branches. Amherst, MA: University of Massachusetts Press.
Benjamin, Daniel J., Sebastian A. Brown, and Jesse M. Shapiro. 2006. “Who is Behavioral? Cognitive Ability and Anomalous Preferences?” http://www.arts.cornell.edu/econ/ dbenjamin.
Berger, Jonah, Marc Meredith, and S. Christian Wheeler. 2008. “Contextual Priming: Where People Vote Affects How They Vote.” Proceedings of the National Academy of Sciences, 105(26): 8846-8849.
Bickel, Warren K., Amy L. Odum, and Gregory J. Madden. 1999. “Impulsivity and Cigarette Smoking: Delay Discounting in Current, Never, and Ex-Smokers.” Psychopharmacology, 146(4): 447-454.
Blascovich, Jim, Steven J. Spencer, Diane Quinn, and Claude Steele. 2001. “African Americans and High Blood Pressure: The Role of Stereotype Threat.” Psychological Science, 12(3): 225-229.
Byrnes, James P., David C. Miller, and William D. Schafer. 1999. “Gender Differences in Risk Taking: A Meta-Analysis.” Psychological Bulletin, 125(3): 367-383.

22
Camerer, Colin F., and Robin M. Hogarth. 1999. “The Effects of Financial Incentives in Experiments: A Review and Capital-Labor-Production Framework.” Journal of Risk and Uncertainty, 19(1-3): 7-42.
Carroll, Christopher, Byung-Kun Rhee and Changyong Rhee. 1994. “Are There Cultural Effects on Saving? Some Cross-Sectional Evidence.” Quarterly Journal of Economics, 109(3): 685-699.
Carroll, Christopher, Byung-Kun Rhee and Changyong Rhee. 1999. “Does Cultural Origin Affect Saving Behavior? Evidence from Immigrants.” Economic Development and Cultural Change, 48(1): 33-50.
Chen, Yan, and Sherry Xin Li. 2009. “Group Identity and Social Preferences.” American Economic Review, 99(1): 431-457.
Chiswick, Barry R. 1983. “The Earnings and Human Capital of American Jews.” Journal of Human Resources, 18(3): 313-336.
Choi, James J., David Laibson, Brigitte C. Madrian, and Andrew Metrick. 2002. “Defined Contribution Pensions: Plan Rules, Participant Choices, and the Path of Least Resistance.” In Tax Policy and the Economy 16, ed. James Poterba, 67-114. Cambridge, MA: MIT Press.
Croson, Rachel, and Uri Gneezy. 2004. “Gender Differences in Preferences.” http://opim.wharton.upenn.edu/~crosonr/research/%5B59%5D.pdf
Dee, Thomas S. 2008. “Stereotype Threat and the Student-Athlete.” http://www.swarthmore.edu/Documents/academics/economics/Stereotype%20Threat%20and%20the%20Student-Athlete%20-%20Dee,%20TS.pdf
Dohmen, Thomas, Armin Falk, David Huffman, Uwe Sunde, Jürgen Schupp, and Gert G. Wagner. 2005. “Individual Risk Attitudes: New Evidence from a Large, Representative, Experimentally-Validated Survey.” IZA Discussion Paper No. 1730.
Forehand, Mark R., Rohit Deshpandé, and Americus Reed II. 2002. “Identity Salience and the Influence of Differential Activiation of the Social Self-Schema on Advertising Response.” Journal of Applied Psychology, 87(6): 1086-1099.
Frederick, Shane, George Loewenstein, and Ted O’Donoghue. 2002. “Time Discounting and Time Preference: A Critical Review.” Journal of Economic Literature, 40(2): 351-401.
Froot, Kenneth A. 1989. “Consistent Covariance Matrix Estimation with Cross-Sectional Dependence and Heteroskedasticity in Financial Data.” Journal of Financial and Quantitative Analysis, 24(3): 333-355.
Fryer Jr., Roland G., and Steven D. Levitt. 2004. “Understanding the Black-White Test Score Gap in the First Two Years of School.” Review of Economics and Statistics, 86(2): 447-464.

23
Fryer Jr., Roland G., and Paul Torelli. 2005. “An Empirical Analysis of ‘Acting White.’” NBER Working Paper 11334.
Fuchs, Victor. 1982. “Time Preference and Health: An Exploratory Study.” In Victor R. Fuchs, editor, Economic Aspects of Health: 93-120. Chicago: University of Chicago Press.
Guiso, Luigi, and Monica Paiella. Forthcoming. “Risk Aversion, Wealth, and Background Risk.” Journal of the European Economic Association.
Hoff, Karla, and Priyanka Pandey. 2006. “Discrimination, Social Identity, and Durable Inequalities.” American Economic Review, 96(2): 206-211.
Hofstede, Geert, and Michael Harris Bond. 1988. “The Confucius Connection: From Cultural Roots to Economic Growth.” Organizational Dynamics, 16(4): 5-21.
Holt, Charles A., and Susan K. Laury. 2002. “Risk Aversion and Incentive Effects.” American Economic Review, 92(5): 1644-1655.
Hong, Lawrence K. 1978. “Risky Shift and Cautious Shift: Some Direct Evidence on the Culture-Value Theory.” Social Psychology, 41(4): 342-346.
Hsee, Christopher K., and Elke U. Weber. 1999. “Cross-National Differences in Risk Preference and Lay Predictions.” Journal of Behavioral Decision Making, 12(2): 165-179.
Hurst, Erik, Ming-Ching Luoh, and Frank Stafford. 1998. “Wealth Dynamics of American Families: 1984-1994.” Brookings Papers on Economic Activity, 1998(1).
James, William. 1890. The Principles of Psychology. New York: Henry Holt.
Jianakoplos, Nancy Ammon, and Alexandra Bernasek. 1998. “Are Women More Risk Averse?” Economic Inquiry, 36(4): 620-630.
Kirby, Kris N., and Nancy M. Petry. 2004. “Heroin and Cocaine Abusers Have Higher Discount Rates for Delayed Rewards than Alcoholics or Non-Drug-Using Controls.” Addiction, 99(4): 461-471.
Kirby, Kris N., Nancy M. Petry, and Warren K. Bickel. 1999. “Heroin Addicts Have Higher Discount Rates for Delayed Rewards than Non-Drug-Using Controls.” Journal of Experimental Psychology, 128(1): 78-87.
LeBoeuf, Robyn A., Eldar Shafir, and Julia Belyavsky. 2006. “The Conflicting Choices of Alternating Selves.” Unpublished.
Loewenstein, George. 2000. “Emotions in Economic Theory and Economic Behavior.” American Economic Review, 90(2): 426-432.

24
Madrian, Brigitte C. and Dennis F. Shea. 2001. “The Power of Suggestion: Inertia in 401(k) Participation and Savings Behavior.” Quarterly Journal of Economics, 116(4): 1149-1187.
Marteau, Theresa M., and Hilary Bekker. 1992. “The Development of a Six-Item Short-Form of the State Scale of the Spielberger State-Trait Anxiety Inventory (STAI).” British Journal of Clinical Psychology, 31(3): 301-306.
Marx, David M., and Diederik A. Stapel. 2006. “Understanding Stereotype Life: On the Role of the Social Self.” Social Cognition, 24(6), 776-91.
Meier, Stephan, and Charles Sprenger. Forthcoming. “Present-biased preferences and credit card borrowing.”American Economic Journal: Applied Economics.
Murray, Charles. 1984. Losing Ground: American Social Policy, 1950-1980. New York: Basic Books.
Neal, Derek A., and William R. Johnson. 1996. “The Role of Premarket Factors in Black-White Wage Differences.” Journal of Political Economy, 104(5): 869-895.
Petry, Nancy M., and Thomas Casarella. 1999. “Excessive Discounting of Delayed Rewards in Substance Abusers with Gambling Problems.” Drug and Alcohol Dependence, 56(1-2): 25-32.
Reicher, Stephen, and Mark Levine. 1994. “Deindividuation, Power Relations Between Groups and the Expression of Social Identity: The Effects of Visibility to the Out-Group.” British Journal of Social Psychology, 33(2): 145-163.
Rimer, Sara, and Karen W. Arenson. 2004. “Top Colleges Take More Blacks, but Which Ones?” New York Times. June 24, A1.
Rogers, William. 1993. “Regression Standard Errors in Clustered Samples.” Stata Technical Bulletin, 13: 19-23.
Sahm, Claudia R. 2007. “Stability of Risk Preference.” Federal Reserve Board Finance and Economics Discussion Series 2007-66.
Samuelson, William, and Richard Zeckhauser. 1988. “Status Quo Bias in Decision Making.” Journal of Risk and Uncertainty, 1(1): 7-59.
Shapiro, Jesse M. 2005. “Is There a Daily Discount Rate? Evidence from the Food Stamp Nutrition Cycle.” Journal of Public Economics, 89(2-3): 303-325.
Shih, Margaret, Todd L. Pittinsky, and Nalini Ambady. 1999. “Stereotype Susceptibility: Identity Salience and Shifts in Quantitative Performance.” Psychological Science, 10(1): 80-83.
Sowell, Thomas. 1975. Race and Economics. New York: David McKay Company, Inc.

25
Sowell, Thomas. 1981. Ethnic America: A History. New York: Basic Books.
Sowell, Thomas. 2005. Black Rednecks and White Liberals. San Francisco: Encounter Books.
Springstead, Glenn R., and Theresa M. Wilson. 2000. “Participation in Voluntary Individual Savings Accounts: An Analysis of IRAs, 401(k)s, and TSP.” Social Security Bulletin, 63(1).
Steele, Claude M., and Joshua Aronson. 1995. “Stereotype Threat and the Intellectual Test Performance of African Americans.” Journal of Personality and Social Psychology, 69(5): 797-811.
Stewart, Mark B. 1983. “On Least Squares Estimation when the Dependent Variable is Grouped.” Review of Economic Studies, 50(4): 737-753.
Storing, Herbert J. 1995. “What Country Have I? Political Writings By Black Americans.” In Toward a More Perfect Union: Writings of Herbert J. Storing, ed. Joseph M. Bessette, 206-220. Washington D.C.: AEI Press.
Sue, Stanley, and Sumie Okazaki. 1990. “Asian-American Educational Achievements: A Phenomenon in Search of an Explanation.” American Psychologist, 45(8): 913-920.
Sundén, Annika E., and Brian J. Surette. 1998. “Gender Differences in the Allocation of Assets in Retirement Savings Plans.” American Economic Review, 88(2): 207-211.
Turner, John C. 1985. “Social Categorization and the Self-Concept: A Social Cognitive Theory of Group Behavior.” In Advances in Group Processes, Vol. 2, ed. E. J. Lawler, 77-121. Greenwich, CT: JAI Press.
Walton, Gregory M., and Geoffrey L. Cohen. 2003. “Stereotype Lift.” Journal of Experimental Social Psychology, 39(5): 456-467.
Weber, Elke U., and Christopher Hsee. 1998. “Cross-cultural Differences in Risk Perception, but Cross-cultural Similarities in Attitudes Towards Perceived Risk.” Management Science, 44(9): 1205-1217.
Wegner, Daniel M., and John A. Bargh. 1998. “Control and Automaticity in Social Life.” In Handbook of Social Psychology, 4th Edition, Vol. 1, eds. Daniel T. Gilbert, Susan T. Fiske, and Gardner Lindzey, 446-496. New York: McGraw-Hill.
West, Cornel. 2000. The Cornel West Reader. New York: Basic Civitas Books.
Yankelovich Partners Inc. 1999. “The Ariel Mutual Funds/Charles Schwab & Co., Inc. Black Investor Survey: Saving and Investing Among High Income Black and White Americans.” http://www.arielcapital.com/repository/func,download/filecatid,47.
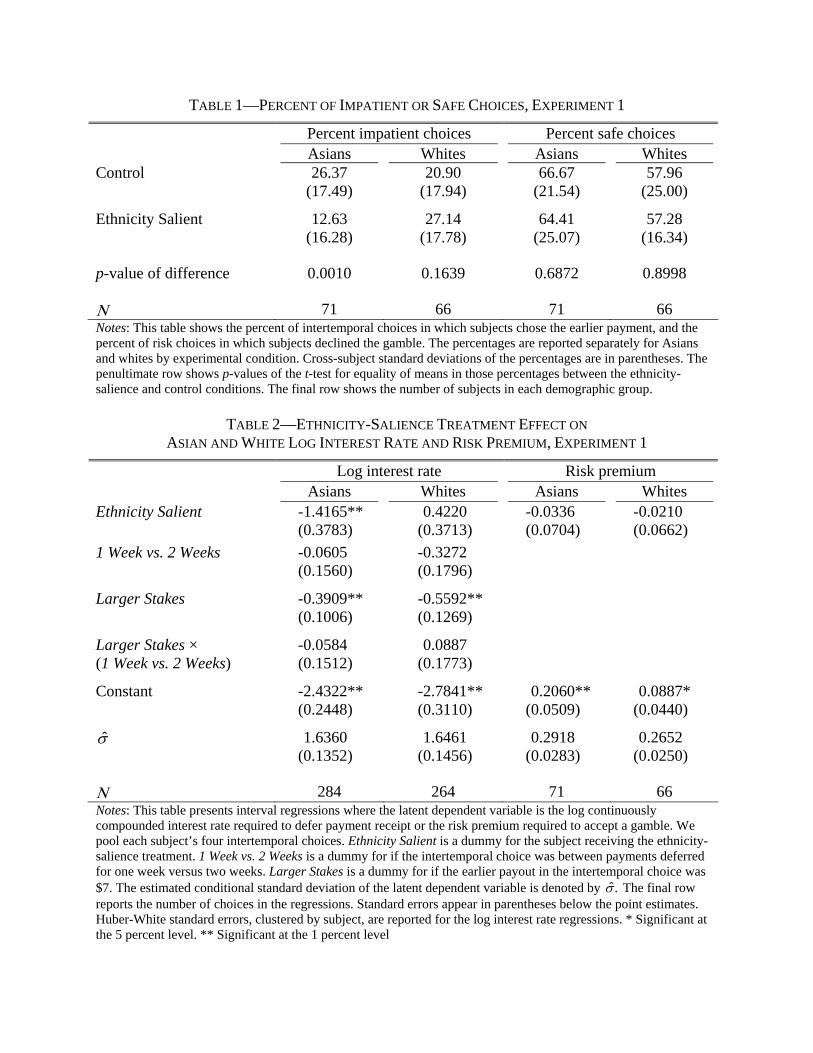
TABLE 1—PERCENT OF IMPATIENT OR SAFE CHOICES, EXPERIMENT 1
Percent impatient choices Percent safe choices Asians Whites Asians Whites Control 26.37 20.90 66.67 57.96 (17.49) (17.94) (21.54) (25.00)
Ethnicity Salient 12.63 27.14 64.41 57.28 (16.28) (17.78) (25.07) (16.34)
p-value of difference 0.0010 0.1639 0.6872 0.8998
Ν 71 66 71 66 Notes: This table shows the percent of intertemporal choices in which subjects chose the earlier payment, and the percent of risk choices in which subjects declined the gamble. The percentages are reported separately for Asians and whites by experimental condition. Cross-subject standard deviations of the percentages are in parentheses. The penultimate row shows p-values of the t-test for equality of means in those percentages between the ethnicity-salience and control conditions. The final row shows the number of subjects in each demographic group.
TABLE 2—ETHNICITY-SALIENCE TREATMENT EFFECT ON
ASIAN AND WHITE LOG INTEREST RATE AND RISK PREMIUM, EXPERIMENT 1
Log interest rate Risk premium Asians Whites Asians Whites Ethnicity Salient -1.4165**
(0.3783) 0.4220
(0.3713) -0.0336 (0.0704)
-0.0210 (0.0662)
1 Week vs. 2 Weeks -0.0605 (0.1560)
-0.3272 (0.1796)
Larger Stakes -0.3909** (0.1006)
-0.5592** (0.1269)
Larger Stakes × (1 Week vs. 2 Weeks)
-0.0584 (0.1512)
0.0887 (0.1773)
Constant -2.4322** (0.2448)
-2.7841** (0.3110)
0.2060** (0.0509)
0.0887* (0.0440)
σ̂ 1.6360 (0.1352)
1.6461 (0.1456)
0.2918 (0.0283)
0.2652 (0.0250)
Ν 284 264 71 66 Notes: This table presents interval regressions where the latent dependent variable is the log continuously compounded interest rate required to defer payment receipt or the risk premium required to accept a gamble. We pool each subject’s four intertemporal choices. Ethnicity Salient is a dummy for the subject receiving the ethnicity-salience treatment. 1 Week vs. 2 Weeks is a dummy for if the intertemporal choice was between payments deferred for one week versus two weeks. Larger Stakes is a dummy for if the earlier payout in the intertemporal choice was $7. The estimated conditional standard deviation of the latent dependent variable is denoted by ˆ.σ The final row reports the number of choices in the regressions. Standard errors appear in parentheses below the point estimates. Huber-White standard errors, clustered by subject, are reported for the log interest rate regressions. * Significant at the 5 percent level. ** Significant at the 1 percent level

TABLE 3—PERCENT OF IMPATIENT OR SAFE CHOICES, EXPERIMENT 2
Panel A: Percent of choices that were impatient
Whites Native blacks
Immigrant blacks Men Women
Control 41.54 63.58 52.30 46.54 36.06 (31.04) (23.07) (25.07) (31.64) (28.39) Social category salient 40.10 50.53 48.94 49.20 40.32 (32.03) (32.30) (26.62) (30.13) (28.33)
p-value of difference 0.6967 0.1390 0.6591 0.7293 0.4594
N 222 71 53 129 134 Panel B: Percent of choices that were safe
Whites Native blacks
Immigrant blacks Men Women
Control 51.42 48.46 50.60 49.19 49.80 (21.43) (18.20) (19.37) (20.94) (21.41) Social category salient 47.13 55.87 48.33 45.74 44.88 (20.98) (18.47) (22.18) (22.85) (19.36)
p-value of difference 0.1226 0.1757 0.7585 0.2823 0.1207
N 222 71 53 129 134 Notes: This table shows the percent of intertemporal choices in which subjects chose the earlier payment, and the percent of risk choices in which subjects declined the gamble. The percentages are reported separately for each demographic group by experimental condition. “Social category salient” refers to the race-salience treatment (first three columns) or the gender-salience treatment (last two columns). Cross-subject standard deviations of the percentages are in parentheses. In order to test for differences between the control and social category salient percentages, we run an OLS regression of each variable of interest on a treatment dummy, a dummy for whether the subject was recruited at Michigan (because the proportion of Michigan students is not equal across treatment cells), and a constant. The p-values reported in the penultimate row of each panel are for the treatment dummy coefficients. The final row in each panel shows the number of subjects.

TABLE 4—CATEGORY-SALIENCE TREATMENT EFFECTS, EXPERIMENT 2
Panel A: Log Interest Rate
Whites Native blacks
Immigrant blacks Men Women
Social Category -0.0563 -0.7587** -0.0899 -0.1376 0.3213 Salient (0.2400) (0.2896) (0.2868) (0.2942) (0.2834) 1 Week vs. 2 Weeks -0.1905 -0.1431 0.2863 -0.3897* 0.1501 (0.1190) (0.2305) (0.2473) (0.1695) (0.1648) UMich -0.2307 -0.5858 -0.0234 -0.9167** 0.0981 (0.2407) (0.3684) (0.4541) (0.2976) (0.2903) 1 Week vs. 2 Weeks × 0.0275 0.3317 0.6190 0.3867 -0.4079 UMich (0.1628) (0.3061) (0.3450) (0.2039) (0.2178) Constant -2.6663** -1.4605** -2.4737** -1.9818** -3.1398** (0.1984) (0.2147) (0.2575) (0.2147) (0.2688) σ̂ 1.7980 1.4328 1.2002 1.6166 1.6726 (0.1012) (0.1517) (0.1176) (0.1252) (0.1154)
N 444 142 106 258 268 Panel B: Risk Premium
Whites
Native blacks
Immigrant blacks Men Women
Social Category -0.0698 0.0986 0.0474 -0.0528 -0.1091 Salient (0.0468) (0.0885) (0.0940) (0.0660) (0.0598) Larger Stakes 0.3176** 0.0470 0.0634 0.3211** 0.1301* (0.0436) (0.0837) (0.0751) (0.0582) (0.0572) UMich 0.0125 -0.0091 0.1827 -0.0093 -0.1119* (0.0456) (0.1166) (0.1138) (0.0625) (0.0568) Larger Stakes × -0.0724 0.2454 0.1215 -0.0842 0.0812 UMich (0.0596) (0.1371) (0.1774) (0.0852) (0.0819) Constant 0.2002** 0.1732* 0.0976 0.1891** 0.2808** (0.0394) (0.0822) (0.0767) (0.0491) (0.0532) σ̂ 0.3954 0.4341 0.4053 0.4087 0.3954 (0.0184) (0.0387) (0.0460) (0.0246) (0.0236)
N 444 142 106 258 268 Notes: This table presents interval regressions where the latent dependent variable is the log continuously compounded interest rate required to defer payment receipt or the risk premium required to accept a gamble. We pool each subject’s two intertemporal choices together and each subject’s two risk choices together. Social Category Salient is a dummy for the race-salience treatment (first three columns) or the gender-salience treatment (last two columns). 1 Week vs. 2 Weeks is a dummy for if the intertemporal choice was between payments deferred for one week versus two weeks. Larger Stakes is a dummy for if the sure payout in the risky choice was $100. UMich is a dummy for whether the subject was recruited at the University of Michigan. The estimated conditional standard deviation of the latent dependent variable is denoted by ˆ.σ Huber-White standard errors, clustered by subject, are reported in parentheses below the point estimates. The final row of each panel reports the number of choices in the regressions. * Significant at the 5 percent level. ** Significant at the 1 percent level.

TABLE 5—CATEGORY-SALIENCE TREATMENT EFFECTS EXCLUDING SUBJECTS SKEPTICAL ABOUT PAYMENTS, EXPERIMENT 2
Panel A: Log Interest Rate
Whites Native blacks
Immigrant blacks Men Women
Social Category -0.7006* -0.6919 -0.3800 -0.4524 -0.0925 Salient (0.3184) (0.4074) (0.3454) (0.3960) (0.3967) 1 Week vs. 2 Weeks -0.1964 -0.0943 0.0968 -0.4452 0.1797 (0.1468) (0.2228) (0.3586) (0.2289) (0.2271) UMich -0.3345 -0.1665 -0.3111 -0.6460 -0.0089 (0.3012) (0.5126) (0.5760) (0.3728) (0.3928) 1 Week vs. 2 Weeks × 0.0348 0.0519 0.9917 0.3709 -0.4447 UMich (0.2163) (0.2954) (0.5141) (0.2735) (0.2943) Constant -2.3958** -1.6564** -2.4392** -1.8242** -3.0606** (0.2317) (0.2967) (0.3570) (0.2663) (0.3521) σ̂ 1.7736 1.4725 1.0918 1.4852 1.7317 (0.1291) (0.2079) (0.1386) (0.1626) (0.1554)
N 272 84 56 152 160 Panel B: Risk Premium
Whites
Native blacks
Immigrant blacks Men Women
Social Category -0.0583 0.2298** -0.1062 -0.0888 -0.1133 Salient (0.0507) (0.0778) (0.0887) (0.0725) (0.0674) Larger Stakes 0.3098** 0.0442 0.1088 0.3027** 0.0938 (0.0488) (0.0920) (0.0741) (0.0658) (0.0660) UMich -0.0083 0.0332 0.1101 -0.0522 -0.1616* (0.0493) (0.1171) (0.0868) (0.0684) (0.0628) Larger Stakes × -0.0308 0.2042 0.0915 -0.0383 0.1596 UMich (0.0673) (0.1480) (0.2166) (0.0972) (0.0929) Constant 0.2091** 0.0474 0.0919 0.2171** 0.3025** (0.0413) (0.0818) (0.0832) (0.0511) (0.0554) σ̂ 0.3986 0.4087 0.3513 0.4047 0.3961 (0.0196) (0.0391) (0.0525) (0.0272) (0.0256)
N 374 118 80 208 214 Notes: This table presents interval regressions where the latent dependent variable is the log continuously compounded interest rate required to defer payment receipt or the risk premium required to accept a gamble. We pool each subject’s two intertemporal choices together and each subject’s two risk choices together. Social Category Salient is a dummy for the race-salience treatment (first three columns) or the gender-salience treatment (last two columns). 1 Week vs. 2 Weeks is a dummy for if the intertemporal choice was between payments deferred for one week versus two weeks. Larger Stakes is a dummy for if the sure payout in the risky choice was $100. UMich is a dummy for whether the subject was recruited at the University of Michigan. The estimated conditional standard deviation of the latent dependent variable is denoted by ˆ.σ Huber-White standard errors, clustered by subject, are reported in parentheses below the point estimates. The final row of each panel reports the number of choices in the regressions. * Significant at the 5 percent level. ** Significant at the 1 percent level.


