Download - ATS Company Reports: Nrb bearing
Company Details
NRB Bearing is the fourth largest organized Indian bearing manufacturer (12% market share) catering to the
mobility segment (automobiles, off-highway vehicles such as construction equipment, tractors, etc.). It
specializes in needle roller bearing, which forms 50% of the top line, commanding a staggering 70% market
share in the segment.
The company also enjoys superior margins vis-à-vis its peers as it produces all its output indigenously unlike
its peers whose trading item forms 25-40% of sales. Presence across all OEMs in India NRB is the fourth
largest bearing manufacturer (organized) in India with a share of 12% (in terms of sales) in the organized
bearings market. With a proven track record over 49 years, it is a preferred supplier to leading domestic OEMs
such Hero Moto Corp, Bajaj Auto, Maruti Suzuki, Tata Motors, Ashok Leyland, etc. Needle roller bearings are
customized items. Therefore, the company works with OEMs from the conceptualization stage to provide anti
friction solutions. Being positioned in the niche customized bearings segment, the company faces less
competition from global bearing manufacturers such as SKF (Sweden) and Timken (the US), who largely
produce off-the-shelf bearings.
The company dominates India’s organized needle roller bearings market and most of its revenues are from
needle roller bearings. Engagement with the clients from the conceptualization phase itself has ensured a
steady relationship with leading domestic and global OEMs. Some of the company’s key international
customers are Renault Volvo, ZF Group and Getrag Group.
The current market capitalization stands at Rs 1,308.46 crore. The company has reported a standalone sales
of Rs 173.18 crore and a Net Profit of Rs 14.95 crore for the quarter ended Sep 2014.
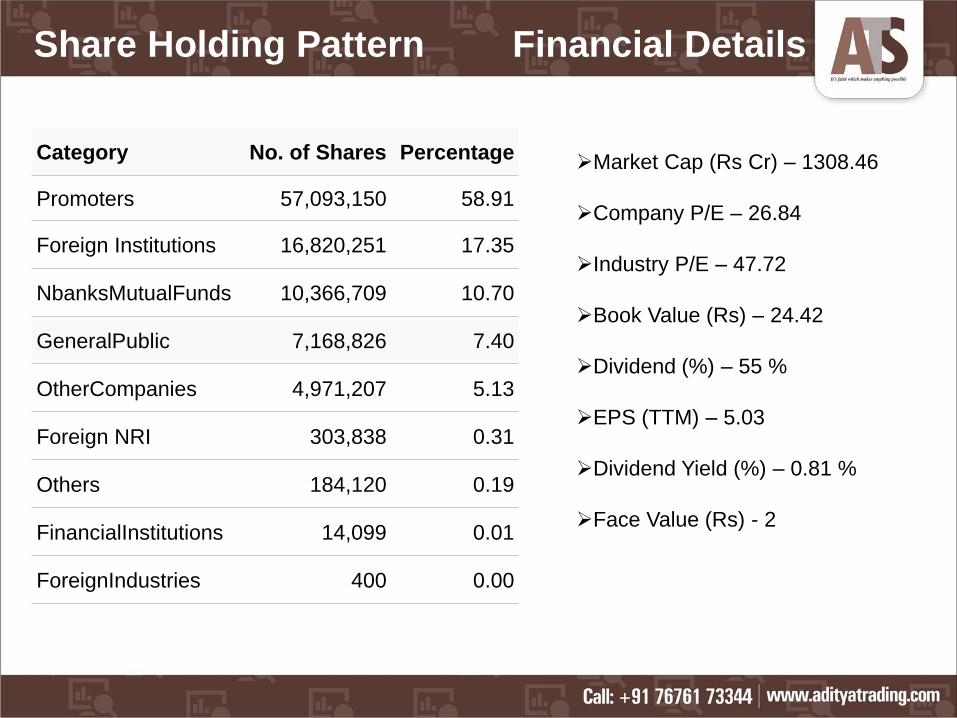
Category No. of Shares Percentage
Promoters 57,093,150 58.91
Foreign Institutions 16,820,251 17.35
NbanksMutualFunds 10,366,709 10.70
GeneralPublic 7,168,826 7.40
OtherCompanies 4,971,207 5.13
Foreign NRI 303,838 0.31
Others 184,120 0.19
FinancialInstitutions 14,099 0.01
ForeignIndustries 400 0.00
Market Cap (Rs Cr) – 1308.46
Company P/E – 26.84
Industry P/E – 47.72
Book Value (Rs) – 24.42
Dividend (%) – 55 %
EPS (TTM) – 5.03
Dividend Yield (%) – 0.81 %
Face Value (Rs) - 2
Share Holding Pattern Financial Details
Industry Details
Although the development of India's ball and roller bearing industry is not quite enviable, it can be said without
contradiction that India has relatively strong base for the manufacture of bearings. There are about 12 large
and medium units which together turn out over 100 million bearings every year. Almost all the units have
foreign collaboration. The Indian Bearing industry makes around 500 types of bearings as against over 30,000
types of bearings being used by the Indian industry. Bulk of these are only of standard types and are used
mostly in low-technology areas like fans, electric motors, water pumps, and by the automotive sector.
The current Indian bearings industry is worth Rs.3500 crore. In this, automotive segment accounts for 45
percent of the revenues, which amount to Rs.1,350 crores and the remaining 55 percent of revenues are
being contributed by industrial demand. In the automotive bearings market, the organized segment
manufactures cater to 50 percent of the demand. About 15 percent of the production is by the unorganized
segment in India, and the remaining 35 percent of demand is fulfilled through imports. Out of the total
revenues in the automotive segment, 60 percent of the revenues are contributed by the OEMs and the
remaining 40 percent is by the demand from the aftermarket. There has been a growth of 15 percent in the
aftermarket segment and OE demand has increased by more than 25 percent from the financial year 2005-
06.
Though the demand from the aftermarket segment is increasing, the growth rate is declining compared to the
year 2005 - 06. In the aftermarket, 6 percent demand is from the engineering applications segment, 5 percent
from LCV segment, 4 percent from MUV segment, 8 percent from car segment, 11 percent from tractor
segment, and the remaining 15 percent from automotive ancillary segment. Rest of the 50 percent demand is
from the Railway sector.
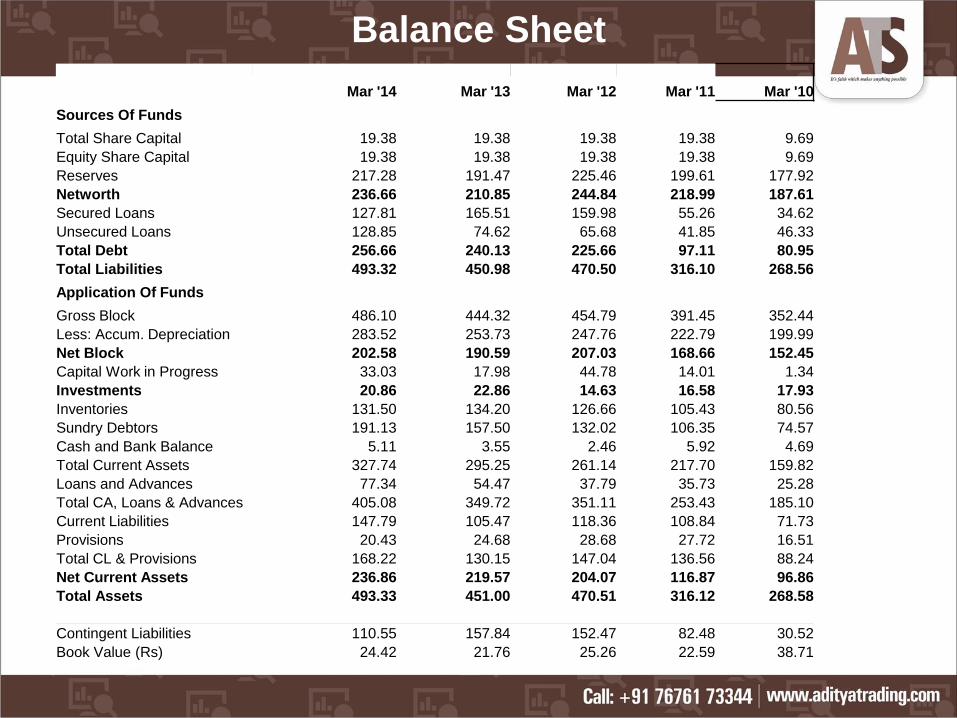
Balance Sheet
Mar '14 Mar '13 Mar '12 Mar '11 Mar '10
Sources Of Funds
Total Share Capital 19.38 19.38 19.38 19.38 9.69
Equity Share Capital 19.38 19.38 19.38 19.38 9.69
Reserves 217.28 191.47 225.46 199.61 177.92
Networth 236.66 210.85 244.84 218.99 187.61
Secured Loans 127.81 165.51 159.98 55.26 34.62
Unsecured Loans 128.85 74.62 65.68 41.85 46.33
Total Debt 256.66 240.13 225.66 97.11 80.95
Total Liabilities 493.32 450.98 470.50 316.10 268.56
Application Of Funds
Gross Block 486.10 444.32 454.79 391.45 352.44
Less: Accum. Depreciation 283.52 253.73 247.76 222.79 199.99
Net Block 202.58 190.59 207.03 168.66 152.45
Capital Work in Progress 33.03 17.98 44.78 14.01 1.34
Investments 20.86 22.86 14.63 16.58 17.93
Inventories 131.50 134.20 126.66 105.43 80.56
Sundry Debtors 191.13 157.50 132.02 106.35 74.57
Cash and Bank Balance 5.11 3.55 2.46 5.92 4.69
Total Current Assets 327.74 295.25 261.14 217.70 159.82
Loans and Advances 77.34 54.47 37.79 35.73 25.28
Total CA, Loans & Advances 405.08 349.72 351.11 253.43 185.10
Current Liabilities 147.79 105.47 118.36 108.84 71.73
Provisions 20.43 24.68 28.68 27.72 16.51
Total CL & Provisions 168.22 130.15 147.04 136.56 88.24
Net Current Assets 236.86 219.57 204.07 116.87 96.86
Total Assets 493.33 451.00 470.51 316.12 268.58
Contingent Liabilities 110.55 157.84 152.47 82.48 30.52
Book Value (Rs) 24.42 21.76 25.26 22.59 38.71

Profit and Loss Account
Mar '14 Mar '13 Mar '12 Mar '11 Mar '10
Income
Sales Turnover 594.49 579.53 596.83 515.45 377.37
Excise Duty 0.00 0.00 48.06 43.41 26.27
Net Sales 594.49 579.53 548.77 472.04 351.10
Other Income 4.57 8.66 1.68 -1.11 5.34
Stock Adjustments -7.17 14.58 13.88 12.88 -10.92
Total Income 591.89 602.77 564.33 483.81 345.52
Expenditure
Raw Materials 283.56 290.36 260.68 217.47 154.30
Power & Fuel Cost 24.23 26.74 21.89 17.99 15.03
Employee Cost 92.38 94.79 88.69 76.92 62.06
Miscellaneous Expenses 86.54 88.55 8.13 4.83 4.99
Total Expenses 486.71 500.44 453.24 374.53 278.75
Operating Profit 100.61 93.67 109.41 110.39 61.43
PBDIT 105.18 102.33 111.09 109.28 66.77
Interest 17.19 17.31 14.46 6.76 10.06
PBDT 87.99 85.02 96.63 102.52 56.71
Depreciation 33.27 29.97 27.77 22.86 19.55
Profit Before Tax 54.72 55.05 68.86 79.66 37.16
PBT (Post Extra-ord Items) 54.72 55.05 68.84 79.23 37.16
Tax 16.53 8.01 20.57 25.30 12.74
Reported Net Profit 38.18 47.04 48.29 53.92 24.41
Total Value Addition 203.15 210.09 192.56 157.06 124.45
Equity Dividend 10.66 16.48 19.38 19.38 9.69
Corporate Dividend Tax 1.71 2.70 3.05 3.14 1.61
Per share data (annualised)
Shares in issue (lakhs) 969.23 969.23 969.23 969.23 484.61
Earning Per Share (Rs) 3.94 4.85 4.98 5.56 5.04
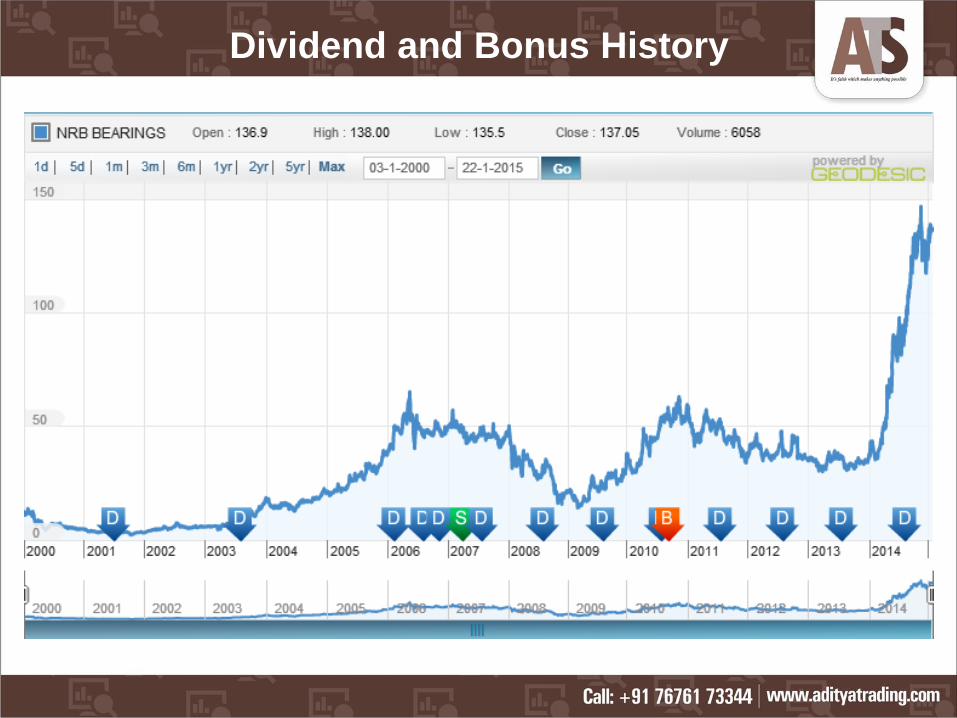
Dividend and Bonus History
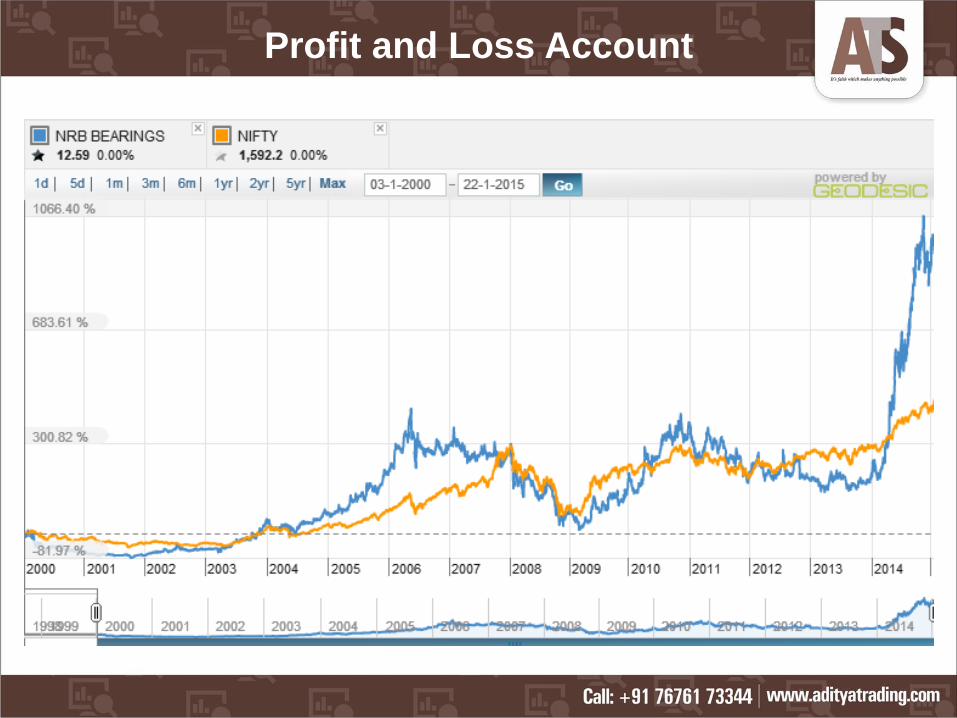
Profit and Loss Account
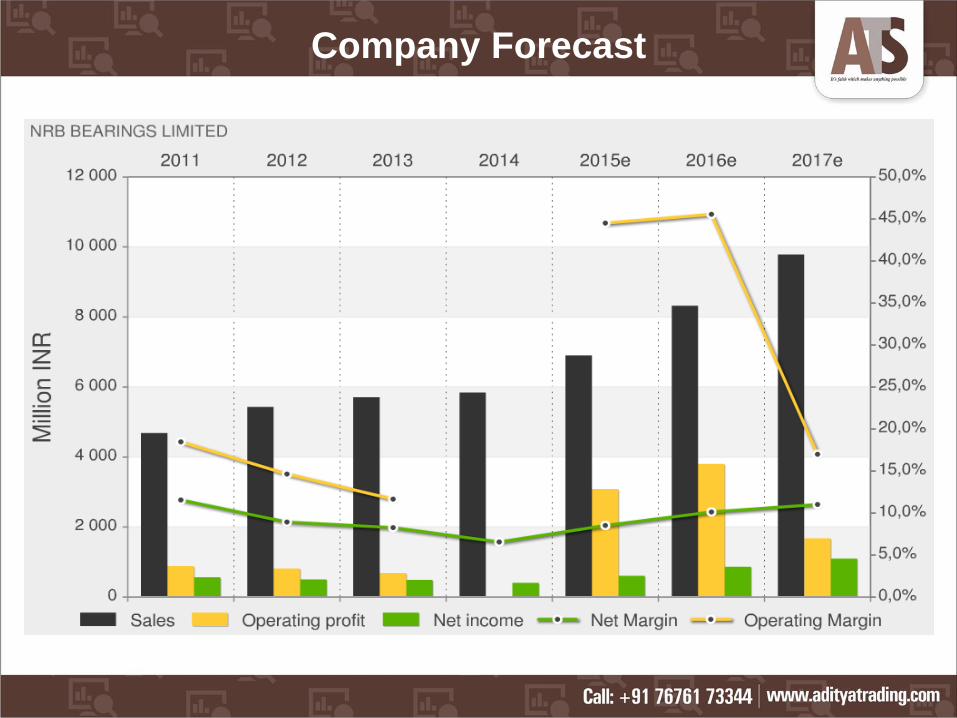
Company Forecast

PBIT – 11.24 v/s 10.82
RoCE – 14.57 v/s 16.04
RoE – 17.06 v/s 20.64
Net Profit Margin – 6.37 v/s 7.99
Return on net worth – 16.13 v/s 22.30
D/ E Ratio – 1.08 v/s 1.14
Interest Cover – 4.18 v/s 4.18
Current Ratio – 1.06 v/s 0.94
Reserves – 217.28 cr v/s 191.47 cr
PAT – 38.18 cr v/s 47.04 cr
Total assets – 493.33 cr v/s 4510 cr
Net sales – 594.49 cr v/s 579.53 cr
Book Value – 24.42 cr v/s 21.76 cr
Days BSE NSE
30 130.24 130.26
50 130.68 130.71
150 115.47 115.45
200 103.82 103.84
Important Ratios Simple Moving Average
Recommendations
Buy NRB Bearings Ltd at current or lower market
levels
Reasons for the recommendations are :
Sound financial position of the company.
Availability of adequate manufacturing facility to meet demands.
Huge difference in profit margins when compared with its peers.
Market leader in Needle Roller Bearings.
Clients include major national and international players.
Growth forecast of the automobile industry.
Improved QoQ performance of sales.
Share holdings by major Mutual Funds.