
Assembly Line BalancingAssembly Line Balancing
Applied Management Science for Decision Making, 1e Applied Management Science for Decision Making, 1e © 2012 Pearson Prentice-Hall, Inc. Philip A. Vaccaro , PhD© 2012 Pearson Prentice-Hall, Inc. Philip A. Vaccaro , PhD

Assembly Line BalancingAssembly Line Balancing
The assignment of tasks to work stations along an assembly line in such a way as
to achieve the same or close to sameworking times at each work station.
THE GOAL IS TO CREATE A SMOOTH,THE GOAL IS TO CREATE A SMOOTH,CONTINUOUS FLOW OF PRODUCT THROUGHCONTINUOUS FLOW OF PRODUCT THROUGH
THE ASSEMBLY LINE FOR MAXIMUMTHE ASSEMBLY LINE FOR MAXIMUMPRODUCTIVITY AND MINIMUM IDLE TIMEPRODUCTIVITY AND MINIMUM IDLE TIME
AT EACH WORK STATIONAT EACH WORK STATION

Assembly Line BalancingAssembly Line BalancingAPPLICATIONS
Cafeteria line
Carwash line
Appliance manufacturing line
Automobile manufacturing line
Registry of Motor Vehicles office line
Disassembly line
Fabrication line
Physical exams for military recruits
- POULTRY SLAUGHTER- AUTOMOBILE RECYCLING
- PRODUCTION OF PARTS VIA SERIES OF MACHINES
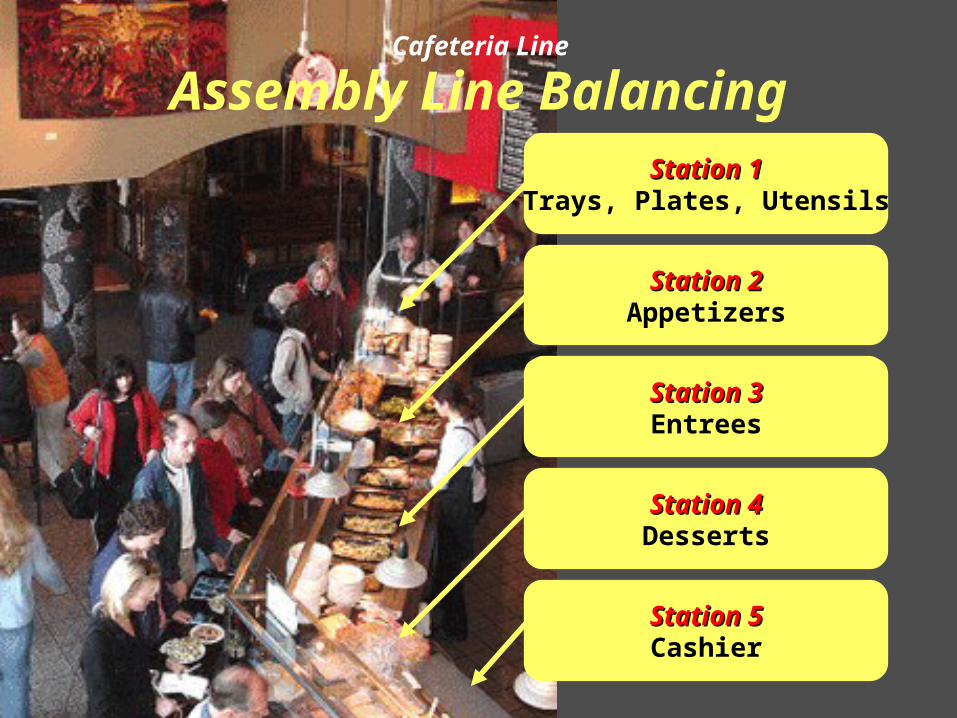
Assembly Line BalancingCafeteria Line
Station 1Station 1Trays, Plates, Utensils
Station 2Station 2Appetizers
Station 3Station 3Entrees
Station 4Station 4Desserts
Station 5Station 5Cashier

Assembly Line BalancingAssembly Line BalancingPoultry Dissassembly Line
Station 1
Station 2
Station 3
Station 4
Station 5
Station 6

Assembly Line BalancingRaw Recruit Physical Examinations
14 Stations includingReception
Eye ExaminationChest X-ray
Weight + Height MeasurementPsychological
Heart Rate

Assembly Line BalancingAssembly Line BalancingWHEN IT IS DONEWHEN IT IS DONE
BEFORE ACTUAL PRODUCTIONIN WESTERN MANUFACTURING
SYSTEMS
DURING ACTUAL PRODUCTIONIN ASIAN MANUFACTURING
SYSTEMS

Individual Task TimesIndividual Task Times
These are set well in advance by industrial engineers and time & motion specialists
They are called standard task times and consist of normal time to perform a particular task and extra time allowances for fatigue, personal needs, and unavoidable, but recurring delays.

The Assembly Line BalancingThe Assembly Line Balancing Concept Concept
Station1
Station2
Station3
The Assembly Line
towarehouse
orretailer
At the end of every cycle, each station hands itsAt the end of every cycle, each station hands its work-in-process unit to the next station.work-in-process unit to the next station.
A cycle is the amount of time that a work-in-process unit canstay in a work station before it must move onto the next.

The Assembly Line BalancingThe Assembly Line Balancing Concept Concept
Station1
Station2
Station3
The Assembly Line
towarehouse
orretailer
The effective production rate for the assembly line The effective production rate for the assembly line equals one completed product every equals one completed product every 1010 minutes, minutes,
even though each unit requires 30 minutes to build!even though each unit requires 30 minutes to build!
If the cycle time were 10 minutes, each station would hand its work-in-processunit over to the next station at the end of 10 minutes.

The The Assembly Line Balancing Assembly Line Balancing ConceptConcept
Station 1( 10 Minutes )
Station 2( 10 Minutes )
Station 3( 10 Minutes )
Total Time( 30 Minutes )
Task A( 10 minutes )
Task B( 5 minutes )
Task D( 2 minutes )
Task C( 5 minutes )
Task E( 3 minutes )
Task F( 5 minutes )
10 Minutes Productive
Time
10 Minutes Productive
Time
10 Minutes Productive
Time
30 MinutesTotal Productive Time
0 Minutes Idle Time
0 Minutes Idle Time
0 Minutes Idle Time
0 MinutesTotal Idle Time
Assumethe cycletime is
10minutes
A A PERFECTLY-BALANCEDPERFECTLY-BALANCED ASSEMBLY LINE ASSEMBLY LINE
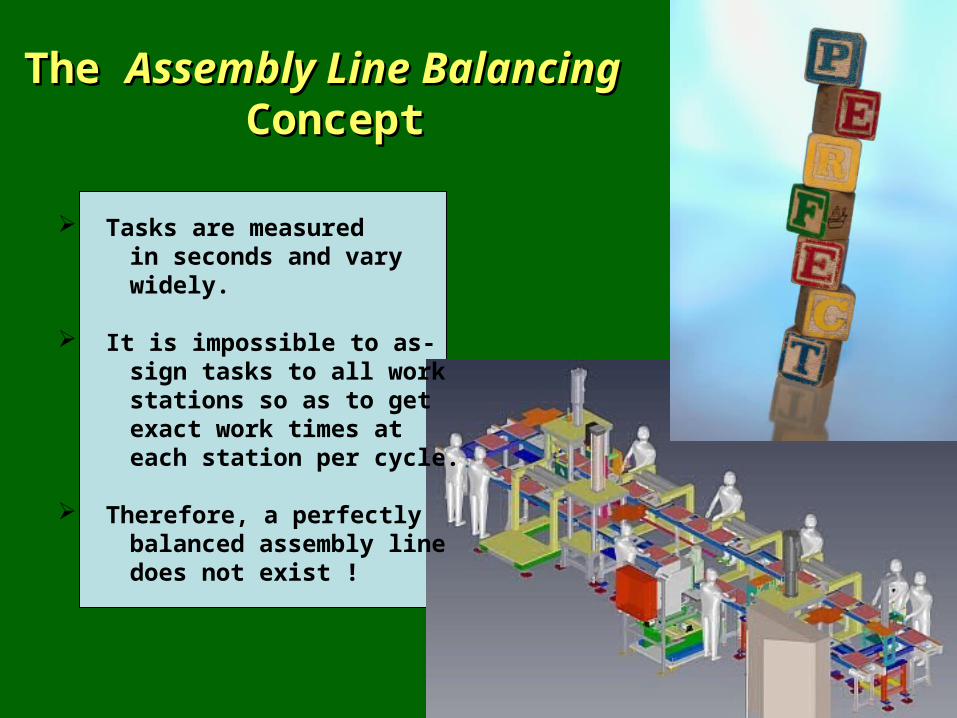
The The Assembly Line BalancingAssembly Line Balancing ConceptConcept
Tasks are measured in seconds and vary widely.
It is impossible to as- sign tasks to all work stations so as to get exact work times at each station per cycle. Therefore, a perfectly balanced assembly line does not exist !

The The Assembly Line Balancing Assembly Line Balancing ConceptConcept
Station 1( 10 Minutes )
Station 2( 10 Minutes )
Station 3( 10 Minutes )
Total Time( 30 Minutes )
Task A ( 9 minutes )
Task B( 4 minutes )
Task D( 2 minutes )
Task C( 4 minutes )
Task E( 2 minutes )
Task F( 5 minutes )
9 Minutes Productive
Time
8 Minutes Productive
Time
9 Minutes Productive
Time
26 MinutesTotal Productive Time
1 Minute Idle Time
2 Minutes Idle Time
1 Minute Idle Time
4 MinutesTotal Idle Time
Assumethe cycletime is
10minutes
A A NOTNOT PERFECTLY-BALANCEDPERFECTLY-BALANCED ASSEMBLY LINE ASSEMBLY LINE

Assembly Line Balancing Assembly Line Balancing StepsSteps
Provide the tools, equipment, and work methodsProvide the tools, equipment, and work methods to be used in producing a product or service at ato be used in producing a product or service at a desired volume.desired volume.

Assembly Line Balancing Assembly Line Balancing StepsSteps
Provide the tools, equipment, and work methodsProvide the tools, equipment, and work methods to be used in producing a product or service at ato be used in producing a product or service at a desired volume.desired volume.
Identify the Identify the standard time standard time for each assembly or for each assembly or service task involved in the creation of the productservice task involved in the creation of the product or service.or service.
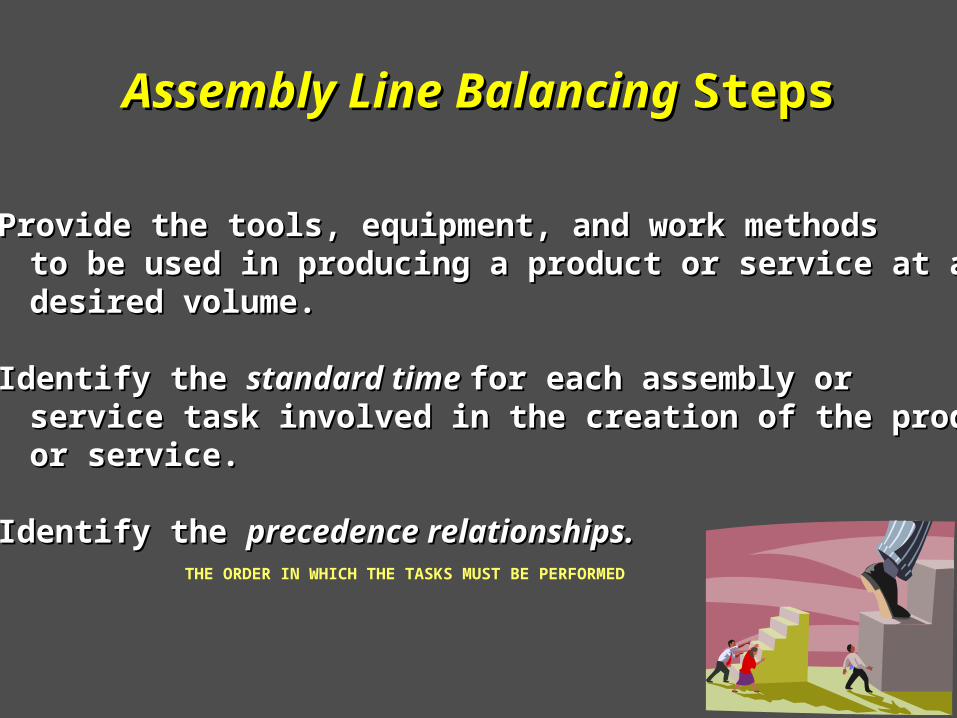
Identify the Identify the precedence relationships.precedence relationships.THE ORDER IN WHICH THE TASKS MUST BE PERFORMED

Practical Problem StatementPractical Problem Statement
Develop the Assembly Line !
A firm wants to produce160 units of a producteach 8-hour day on an
assembly line.
Nine ( 9 ) separatetasks are neededto complete eachunit of product.
Assume no break timeand no paid lunch time

Task Predecessor Standard TimeTask Predecessor Standard Time
A none 60
B A 80
C none 30
D C 40
E B,D 40
F none 50
G F 100
H D,G 70
I E,H 30
ΣΣ = = 500 seconds500 seconds

The Precedence DiagramThe Precedence Diagram
A network showing the sequential relationships among all tasks to be performed on the assembly line, together with their respective standard times.
An optional, useful tool for avoiding precedence relationship violations when assigning tasks to work stations, without benefit of the computer.

The Precedence DiagramThe Precedence DiagramTHE ORDER IN WHICH TASKS MUST BE PERFORMED
A60
C30
F50
B80
D40
G100
E40
H70
I30

The Cycle TimeThe Cycle Time
SHOWN IN SECONDSSHOWN IN SECONDS
The maximum period of time that a work-in-process
unit can stay in any givenwork station before it mustmove on to the next work
station.

The Cycle Time FormulaThe Cycle Time Formula
Total Available Daily Production Time
Daily Production Quota
28,800 Seconds
160 Units( FROM THE PROBLEM )
= 180 Seconds

The Minimum Number of Work StationsThe Minimum Number of Work Stations
The minimum number of work stations that theThe minimum number of work stations that the new assembly line, when balanced, will contain.new assembly line, when balanced, will contain.

The Minimum Number of Work StationsThe Minimum Number of Work Stations
The minimum number of work stations that theThe minimum number of work stations that the new assembly line, when balanced, will contain.new assembly line, when balanced, will contain.
The actual number of work stations may well The actual number of work stations may well exceed the minimum number by one or more. exceed the minimum number by one or more.
Also known as the Also known as the theoretical minimumtheoretical minimum number of work stations.number of work stations.
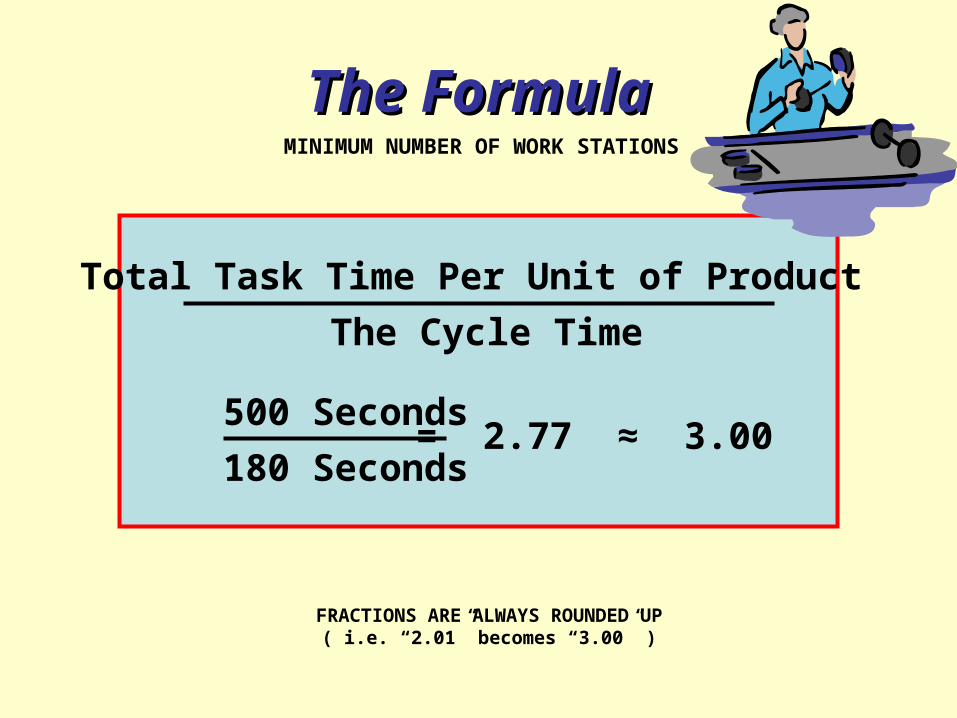
The FormulaThe Formula
Total Task Time Per Unit of Product
The Cycle Time
500 Seconds
180 Seconds= 2.77 ≈ 3.00
FRACTIONS ARE ALWAYS ROUNDED UP( i.e. “2.01” becomes “3.00” )
MINIMUM NUMBER OF WORK STATIONS
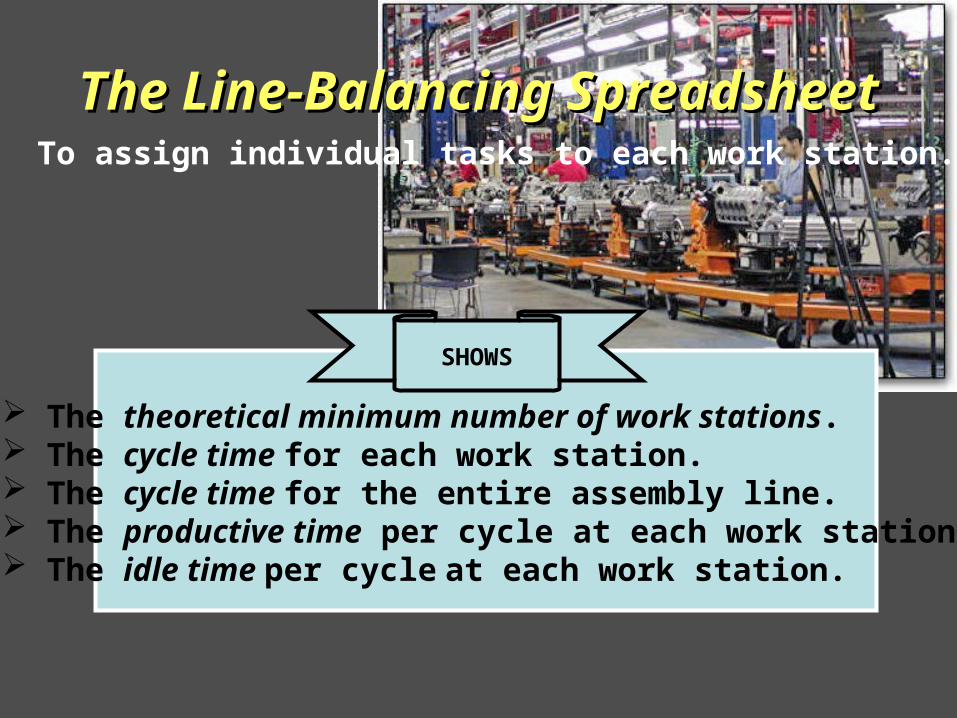
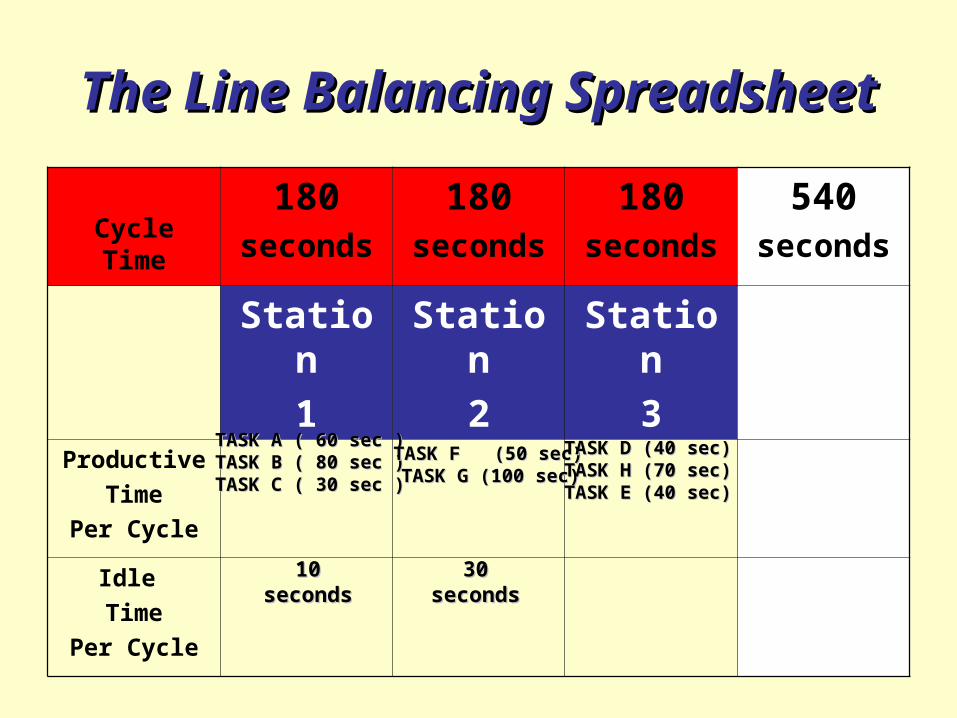
The Line-Balancing SpreadsheetThe Line-Balancing Spreadsheet To assign individual tasks to each work station.
The theoretical minimum number of work stations. The cycle time for each work station. The cycle time for the entire assembly line. The productive time per cycle at each work station. The idle time per cycle at each work station.
SHOWS

The Line Balancing SpreadsheetThe Line Balancing Spreadsheet
Cycle Time180
seconds
180seconds
180seconds
540seconds
Station
1
Station
2
Station
3Productive
Time
Per Cycle
Idle
Time
Per Cycle

Task Assignment HeuristicTask Assignment Heuristic
From the Greek From the Greek έύρϊσκεινέύρϊσκειν ( heuriskein ) ( heuriskein ) meaning “to discover” or “to guide”.meaning “to discover” or “to guide”.

Task Assignment HeuristicTask Assignment Heuristic
From the Greek From the Greek έύρϊσκεινέύρϊσκειν ( heuriskein ) ( heuriskein ) meaning “to discover” or “to guide”.meaning “to discover” or “to guide”.
A A rule of thumb rule of thumb or guideline for finding or guideline for finding a solution in general.a solution in general.
Here, a particular Here, a particular rationale rationale for assigning for assigning tasks to work stations in line balancing.tasks to work stations in line balancing.

Heuristic SelectionHeuristic Selection
I. The LOT rule – longest operating time
II. The SOT rule – shortest operating time
III. The MFT rule – the most follower tasks
IV. The LFT rule – the least follower tasks
V. The Ranked Positional Weight or Highest
Sum rule
FIVE POPULAR HEURISTICS FOR LINE BALANCING

The LOT Assignment HeuristicThe LOT Assignment Heuristic
Also known as the longest operating time rule.
Assigns the longest tasks to the work stations first.
SUBJECT TO MAINTAINING THE PRECEDENCERELATIONSHIPS AMONG THE WORK TASKS
Task A
before
B
B and D
before E

Precedence Diagram LegendPrecedence Diagram Legend
X
Y
Z
NON-CANDIDATE TASKS
( SHOWN IN BLUE )
A
D
AN ASSIGNED TASK( SHOWN WITH “X” ACROSS )
X
CANDIDATES FOR THE NEXTTASK ASSIGNMENT
( SHOWN IN RED )
B
C DX
DX

The Precedence DiagramThe Precedence Diagram
A60
C30
F50
B80
D40
G100
E40
H70
II3030

The Precedence DiagramThe Precedence Diagram
A60
C30
F50
B80
D40
G100
E40
H70
II3030
1st TASK ASSIGNMENTCANDIDATES FOR
STATION 1
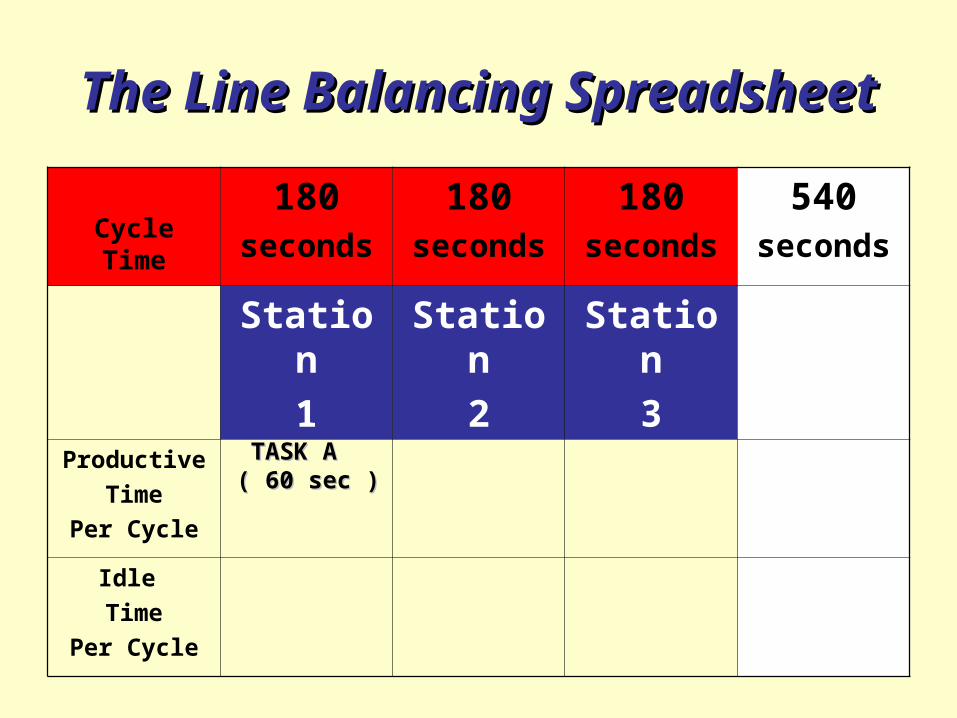
The Line Balancing SpreadsheetThe Line Balancing Spreadsheet
Cycle Time180
seconds
180seconds
180seconds
540seconds
Station
1
Station
2
Station
3Productive
Time
Per Cycle
Idle
Time
Per Cycle
TASK ATASK A( 60 sec )( 60 sec )

The Precedence DiagramThe Precedence Diagram
A60
C30
F50
B80
D40
G100
E40
H70
II3030
2nd TASK ASSIGNMENTCANDIDATES FOR
STATION 1X

The Line Balancing SpreadsheetThe Line Balancing Spreadsheet
Cycle Time180
seconds
180seconds
180seconds
540seconds
Station
1
Station
2
Station
3Productive
Time
Per Cycle
Idle
Time
Per Cycle
TASK ATASK A( 60 sec )( 60 sec ) TASK BTASK B( 80 sec )( 80 sec )

The Precedence DiagramThe Precedence Diagram
A60
C30
F50
B80
D40
G100
E40
H70
II3030
3rd TASK ASSIGNMENTCANDIDATES FOR
STATION 1X X
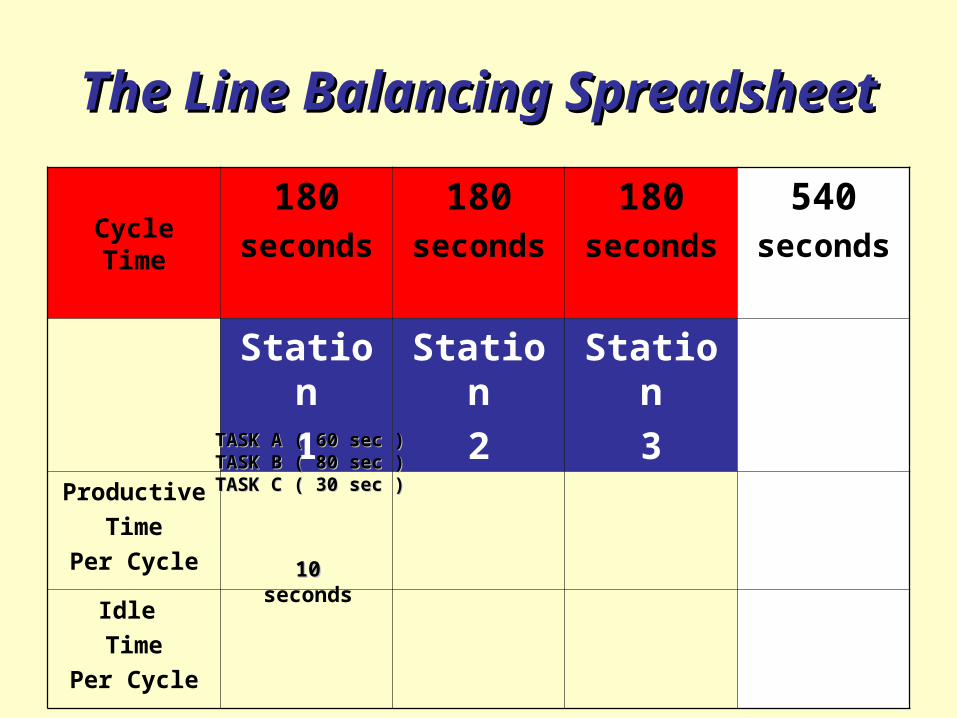
The Line Balancing SpreadsheetThe Line Balancing Spreadsheet
Cycle Time180
seconds
180seconds
180seconds
540seconds
Station
1
Station
2
Station
3Productive
Time
Per Cycle
Idle
Time
Per Cycle
TASK A ( 60 sec )TASK A ( 60 sec )TASK B ( 80 sec )TASK B ( 80 sec )TASK C ( 30 sec )TASK C ( 30 sec )
1010seconds

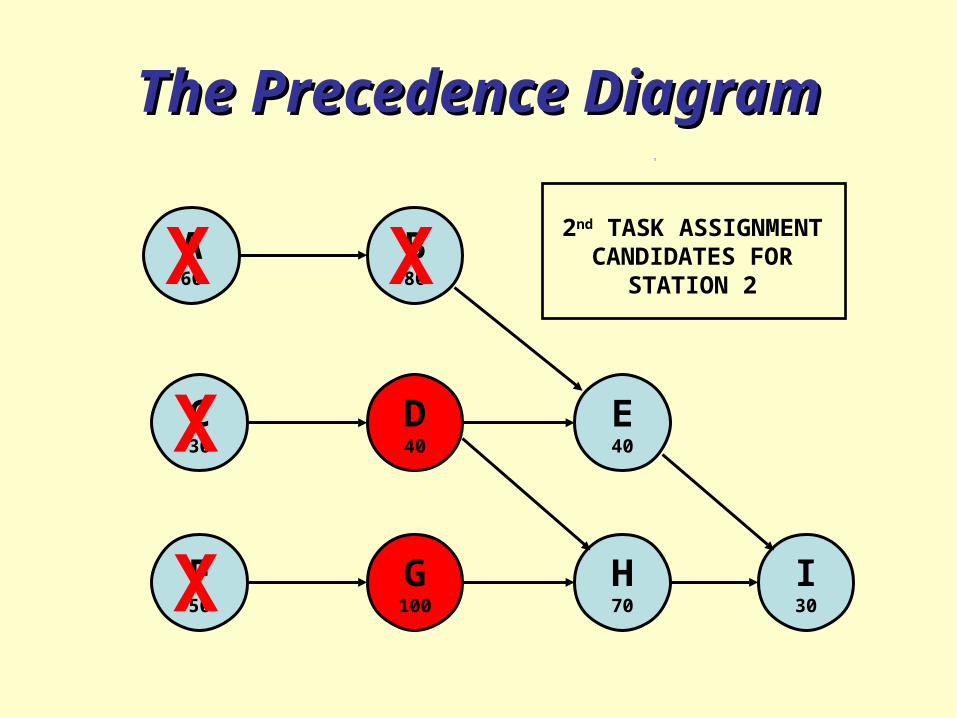
The Precedence DiagramThe Precedence Diagram
A60
C30
F50
B80
D40
G100
E40
H70
II3030
1st TASK ASSIGNMENTCANDIDATES FOR
STATION 2X X
X

The Line Balancing SpreadsheetThe Line Balancing Spreadsheet
Cycle Time180
seconds
180seconds
180seconds
540seconds
Station
1
Station
2
Station
3Productive
Time
Per Cycle
Idle
Time
Per Cycle
TASK A ( 60 sec )TASK A ( 60 sec )TASK B ( 80 sec )TASK B ( 80 sec )TASK C ( 30 sec )TASK C ( 30 sec )
1010secondsseconds
TASK FTASK F( 50 sec )( 50 sec )
The Precedence DiagramThe Precedence Diagram
A60
C30
F50
B80
D40
G100
E40
H70
I30
2nd TASK ASSIGNMENTCANDIDATES FOR
STATION 2X X
X
X

The Line Balancing SpreadsheetThe Line Balancing Spreadsheet
Cycle Time180
seconds
180seconds
180seconds
540seconds
Station
1
Station
2
Station
3Productive
Time
Per Cycle
Idle
Time
Per Cycle
TASK A ( 60 sec )TASK A ( 60 sec )TASK B ( 80 sec )TASK B ( 80 sec )TASK C ( 30 sec )TASK C ( 30 sec )
1010secondsseconds
TASK F ( 50 sec)TASK F ( 50 sec) TASK G (100 sec)TASK G (100 sec)
3030secondsseconds

The Precedence DiagramThe Precedence Diagram
A60
C30
F50
B80
D40
G100
E40
H70
I30
1st TASK ASSIGNMENTCANDIDATES FOR
STATION 3X X
X
X X

The Line Balancing SpreadsheetThe Line Balancing Spreadsheet
Cycle Time180
seconds
180seconds
180seconds
540seconds
Station
1
Station
2
Station
3Productive
Time
Per Cycle
Idle
Time
Per Cycle
TASK A ( 60 sec )TASK A ( 60 sec )TASK B ( 80 sec )TASK B ( 80 sec )TASK C ( 30 sec )TASK C ( 30 sec )
1010secondsseconds
TASK F (50 sec)TASK F (50 sec) TASK G (100 sec)TASK G (100 sec)
3030secondsseconds
TASK DTASK D( 40 sec )( 40 sec )

The Precedence DiagramThe Precedence Diagram
A60
C30
F50
B80
D40
G100
E40
H70
I30
2nd TASK ASSIGNMENTCANDIDATES FOR
STATION 3X X
X
X X
X

The Line Balancing SpreadsheetThe Line Balancing Spreadsheet
Cycle Time180
seconds
180seconds
180seconds
540seconds
Station
1
Station
2
Station
3Productive
Time
Per Cycle
Idle
Time
Per Cycle
TASK A ( 60 sec )TASK A ( 60 sec )TASK B ( 80 sec )TASK B ( 80 sec )TASK C ( 30 sec )TASK C ( 30 sec )
10seconds
TASK F (50 sec)TASK F (50 sec) TASK G (100 sec)TASK G (100 sec)
3030secondsseconds
TASK DTASK D( 40 sec )( 40 sec )TASK HTASK H
( 70 sec )( 70 sec )

The Precedence DiagramThe Precedence Diagram
A60
C30
F50
B80
D40
G100
E40
H70
I30
3rd TASK ASSIGNMENTCANDIDATES FOR
STATION 3X X
X
X X
X
X
The Line Balancing SpreadsheetThe Line Balancing Spreadsheet
Cycle Time180
seconds
180seconds
180seconds
540seconds
Station
1
Station
2
Station
3Productive
Time
Per Cycle
Idle
Time
Per Cycle
TASK A ( 60 sec )TASK A ( 60 sec )TASK B ( 80 sec )TASK B ( 80 sec )TASK C ( 30 sec )TASK C ( 30 sec )
1010secondsseconds
TASK F (50 sec)TASK F (50 sec) TASK G (100 sec)TASK G (100 sec)
3030secondsseconds
TASK D (40 sec)TASK D (40 sec)TASK H (70 sec)TASK H (70 sec)TASK E (40 sec)TASK E (40 sec)

The Precedence DiagramThe Precedence Diagram
A60
C30
F50
B80
D40
G100
E40
H70
I30
4th TASK ASSIGNMENTCANDIDATES FOR
STATION 3X X
X
X X
X
X
X

The Line Balancing SpreadsheetThe Line Balancing Spreadsheet
Cycle Time180
seconds
180seconds
180seconds
540seconds
Station
1
Station
2
Station
3Productive
Time
Per Cycle
Idle
Time
Per Cycle
TASK A ( 60 sec )TASK A ( 60 sec )TASK B ( 80 sec )TASK B ( 80 sec )TASK C ( 30 sec )TASK C ( 30 sec )
1010secondsseconds
TASK F (50 sec)TASK F (50 sec) TASK G (100 sec)TASK G (100 sec)
3030secondsseconds
TASK D (40 sec)TASK D (40 sec)TASK H (70 sec)TASK H (70 sec)TASK E (40 sec)TASK E (40 sec)TASK I (30 sec)TASK I (30 sec)
00secondsseconds
500seconds
40seconds
TOTAL
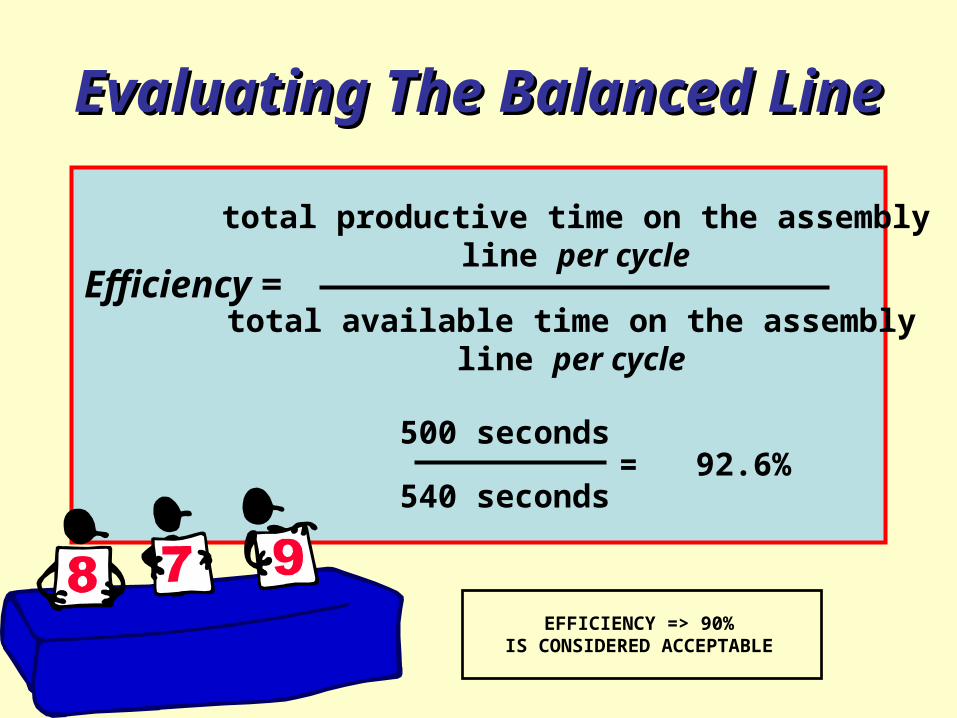
Evaluating The Balanced LineEvaluating The Balanced Line
Efficiency =
total productive time on the assemblyline per cycle
total available time on the assemblyline per cycle
500 seconds
540 seconds= 92.6%
EFFICIENCY => 90% IS CONSIDERED ACCEPTABLE

Evaluating The Balanced LineEvaluating The Balanced Line
Balance Delay Factor ( % IDLE TIME )
line idle time per cycle
line total time per cycle=
40 seconds
540 seconds= = 7.4%
A BALANCE DELAY FACTOR=< 10% IS CONSIDERED TO
BE ACCEPTABLE

Evaluating The Balanced LineEvaluating The Balanced Line
Effectiveness is achieved if theassembly line meets management’s
daily production quota
THE EMPLOYMENT OF THEMAXIMUM ALLOWABLE CYCLE
TIME GUARANTEED DAILY QUOTA COMPLIANCE !
10 10 10

Line Balancing under QM for WindowsLine Balancing under QM for Windows

We Select The ‘Assembly Line Balancing’
Program

We Desire ToSolve A New
Problem

The Dialog BoxAppears

Nine ( 9 ) TasksNeed To BeAssigned
To Work Stations
Task Times AreNormally Stated
In Seconds
We Label Tasksas A,B,C,D, etc.

THE DATA INPUT TABLEPROVIDES COLUMNSFOR LISTING EACH
TASK’S PREDECESSOR(S)
THE SOFTWAREDETERMINES
HOW MANY COLUMNSSHOULD BE PROVIDED
FOR LISTING PREDECESSOR TASKS

The Predecessor TasksMust Be Shown InIndividual Cells,Alphabetically
Here, We Entered TheCycle Time For
The Software ToWork With
We Selected The“LOT” Assignment
HeuristicFor Balancing This
Assembly Line
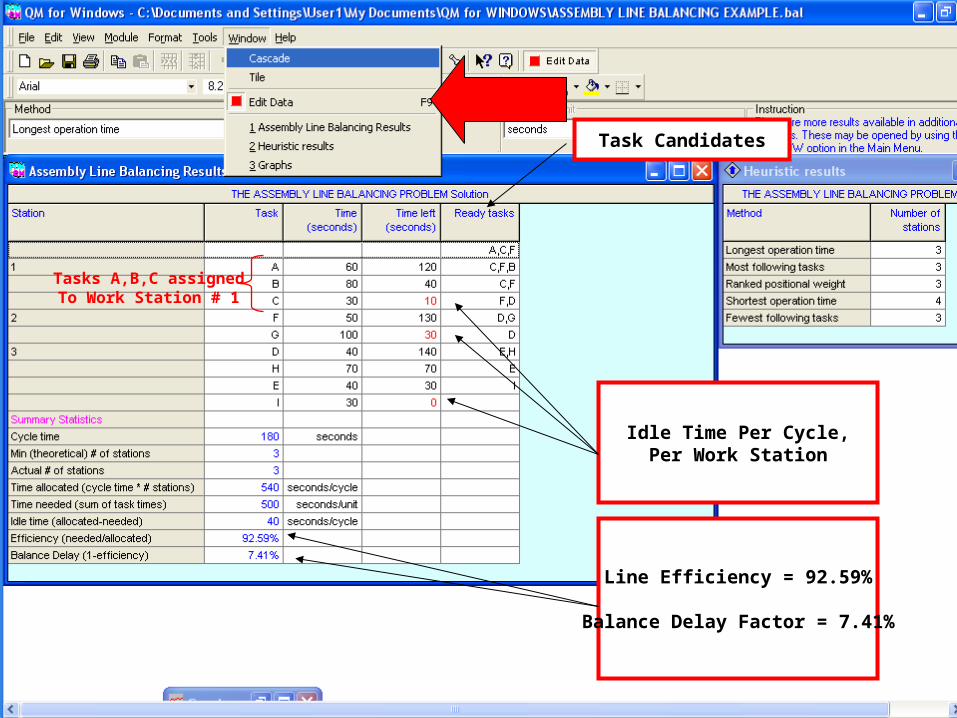
Line Efficiency = 92.59%
Balance Delay Factor = 7.41%
Idle Time Per Cycle,Per Work Station
Task Candidates
Tasks A,B,C assignedTo Work Station # 1

This Is The Program’s Way of Asking Us
If This Is The CorrectPrecedence RelationshipAmong The Nine Tasks

The Amount of ProductiveTime Per Cycle
In Each Work Station
The Cycle Timeis
180 seconds

If task “ I ” had a standard time offorty seconds…..
1. What changes must be made to the line-balancing spreadsheet?
2. How would the efficiency of the line be affected?
NEW SCENARIO
??

The New Precedence DiagramThe New Precedence Diagram
A60
C30
F50
B80
D40
G100
E40
H70
I40
TASK“ I “
BECOMESFORTY
SECONDS

The Line-Balancing SpreadsheetThe Line-Balancing Spreadsheet
Cycle time
180seconds
180seconds
180seconds
180seconds
Σ
720
station
1
station
2
station
3
station
4TASK ATASK A
TASK BTASK B
TASK CTASK C
170 seconds
TASK FTASK F
TASK GTASK G
150 seconds
TASK DTASK D
TASK HTASK H
TASK ETASK E
150 seconds
TASK I
40 seconds
Σ = 510seconds
Σ = 210seconds
MODIFIED FOR TASK “ I ” NEW STANDARD TIME
seconds
ProductiveTime
Per Cycle
Idle Time
Per Cycle10 seconds 30 seconds 30 seconds
140seconds

Spreadsheet ModificationsSpreadsheet Modifications
A 4th work station would need to be opened exclusively for task “I”.
Total assembly line available time per cycle would jump to 720 seconds ( 180 secs x 4 stations )
Total assembly line idle time per cycle would jump to 210 seconds ( under any assignment heuristic )
The balanced line would no longer be efficient ( 71% )

Evaluating The Balanced LineEvaluating The Balanced LineFOURTH STATION ADDED FOR TASK “I”
Efficiency = = 71%
Balance Delay Factor
210 seconds
720 seconds= = 29%
THE LINE FAILS IN THE LINE FAILS IN EFFICIENCYEFFICIENCY
510 seconds
720 seconds

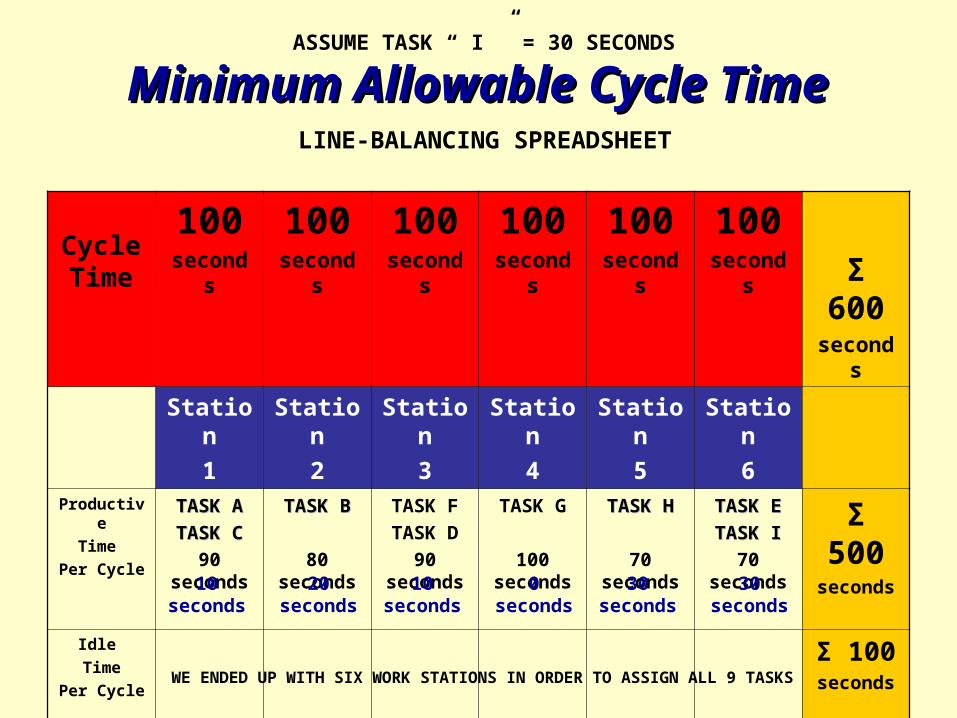
Minimum Allowable Cycle TimeMinimum Allowable Cycle Time THE “OTHER” CYCLE TIMETHE “OTHER” CYCLE TIME
Cycle time based on the bottleneck task*
No guarantee that the daily production quota will be met
Line efficiency will most likely change under this cycle time
* THE LONGEST TASK TIME

Minimum Allowable Cycle TimeMinimum Allowable Cycle Time
From the text example, the longest task is “G” which takes 100 seconds to perform.
The minimum allowable cycle time therefore is 100 seconds.
The theoretical minimum number of work stations:
EXAMPLE
500 seconds
100 seconds= 5
ASSUME TASK “ I “ = 30 SECONDS
100seconds
100seconds
100seconds
100seconds
100seconds
100seconds Σ 600
seconds
Station
1
Station
2
Station
3
Station
4
Station
5
Station
6
Productive
Time
Per Cycle
TASK ATASK A
TASK CTASK C
90 seconds
TASK BTASK B
80 seconds
TASK F
TASK D
90 seconds
TASK G
100 seconds
TASK HTASK H
70 seconds
TASK ETASK E
TASKTASK II
70 seconds
Σ 500seconds
Idle
Time
Per Cycle
Σ 100seconds
Minimum Allowable Cycle TimeMinimum Allowable Cycle TimeLINE-BALANCING SPREADSHEET
CycleTime
10seconds
20seconds
10seconds
0seconds
30seconds
30seconds
ASSUME TASK “ I ” = 30 SECONDS
WE ENDED UP WITH SIX WORK STATIONS IN ORDER TO ASSIGN ALL 9 TASKS

Evaluating The Balanced LineEvaluating The Balanced Line MINIMUM ALLOWABLE CYCLE TIME
Efficiency = 500 seconds = .833 = 83.3%
600 seconds
Balance DelayFactor = 100 seconds = .167 = 16.7%
600 seconds
THE LINE FAILS TOMEET ACCEPTABLE
EFFICIENCY
0 0 0
ASSUME TASK “I” = 30 SECONDS

100seconds
100seconds
100seconds
100seconds
100seconds
100seconds Σ 600
seconds
Station
1
Station
2
Station
3
Station
4
Station
5
Station
6
Productive
Time
Per Cycle
TASK ATASK A
TASK CTASK C
90 seconds
TASK BTASK B
80 seconds
TASK FTASK F
TASK DTASK D
90 seconds
TASK GTASK G
100 seconds
TASK HTASK H
70 seconds
TASK ETASK E
TASKTASK II
80 seconds
Σ 510seconds
Idle
Time
Per Cycle
Σ 90seconds
Minimum Allowable Cycle TimeMinimum Allowable Cycle TimeLINE-BALANCING SPREADSHEET
CycleTime
10seconds
20seconds
10seconds
0seconds
30seconds
20seconds
ASSUME TASK “ I ” = 40 SECONDS
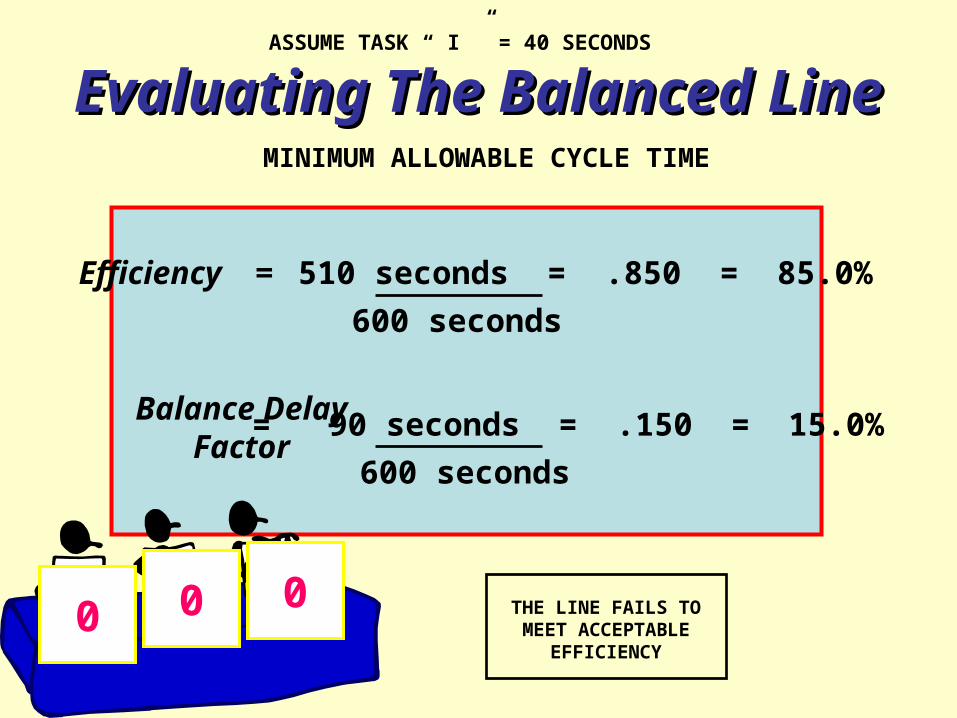
Evaluating The Balanced LineEvaluating The Balanced Line MINIMUM ALLOWABLE CYCLE TIME
Efficiency = 510 seconds = .850 = 85.0%
600 seconds
Balance DelayFactor
= 90 seconds = .150 = 15.0%
600 seconds
THE LINE FAILS TOMEET ACCEPTABLE
EFFICIENCY
0 0 0
ASSUME TASK “ I ” = 40 SECONDS

Evaluating The Balanced LineEvaluating The Balanced LineEffectiveness
Under
Maximum Allowable
Cycle Time
28,800 seconds
180 seconds
= 160 units produced daily
Effectiveness
Under
Minimum Allowable
Cycle Time
28,800 seconds
100 seconds
= 288 units produced daily
_________________________ __________________________
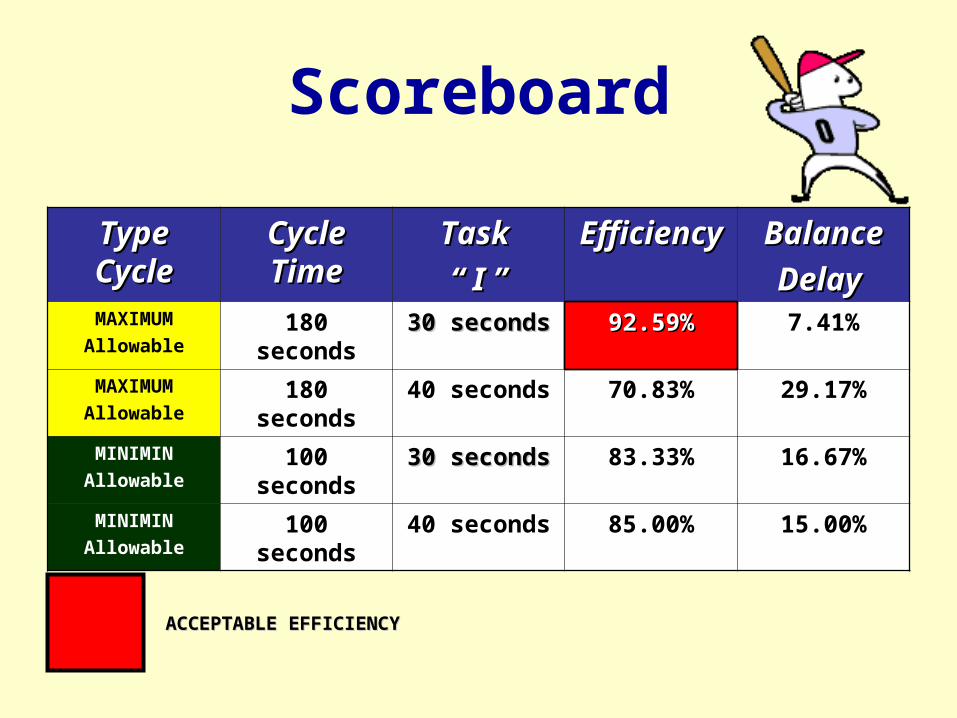
Scoreboard
Type Type CycleCycle
Cycle Cycle TimeTime
Task Task
“ “ I ”I ”
EfficiencyEfficiency BalanceBalance
Delay Delay MAXIMUM
Allowable180 seconds 30 seconds30 seconds 92.59%92.59% 7.41%
MAXIMUM
Allowable180 seconds 40 seconds 70.83% 29.17%
MINIMIN
Allowable100 seconds 30 seconds30 seconds 83.33% 16.67%
MINIMIN
Allowable100 seconds 40 seconds 85.00% 15.00%
ACCEPTABLE EFFICIENCYACCEPTABLE EFFICIENCY

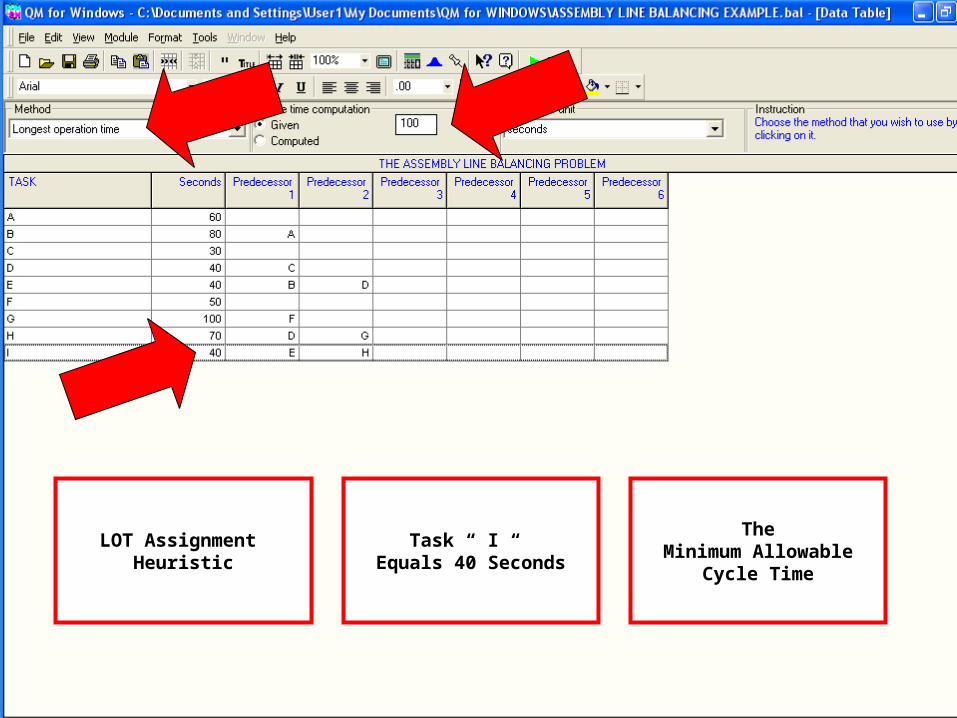
Line Balancing under QM for WindowsLine Balancing under QM for WindowsADDITIONAL SCENARIOS

The MaximumAllowable
Cycle Time
Assume Task “ I “
Equals 40 Seconds
TheLOT Assignment
Heuristic

Rebalanced Assembly Line
Maximum Allowable Cycle Time
Task “ I “ = 40 Seconds
LOT Assignment Heuristic

The Minimum Allowable
Cycle Time
Task “ I “ Equals
30 Seconds
TheLOT Assignment Heuristic
Is Employed

Rebalanced Assembly Line
Minimum Allowable Cycle Time
Task “ I “ = 30 Seconds
LOT Assignment Heuristic
LOT Assignment Heuristic
Task “ I “ Equals 40 Seconds
TheMinimum Allowable
Cycle Time

Rebalanced Assembly Line
LOT Assignment Heuristic
Minimum Allowable Cycle Time
Task “ I “ = 40 Seconds

Scoreboard
Type Type CycleCycle
Cycle Cycle TimeTime
Task Task
“ “ I ”I ”
EfficiencyEfficiency BalanceBalance
Delay Delay MAXIMUM
Allowable180 seconds 30 seconds30 seconds 92.59%92.59% 7.41%
MAXIMUM
Allowable180 seconds 40 seconds 70.83% 29.17%
MINIMIN
Allowable100 seconds 30 seconds30 seconds 83.33% 16.67%
MINIMIN
Allowable100 seconds 40 seconds 85.00% 15.00%
ACCEPTABLE EFFICIENCYACCEPTABLE EFFICIENCY

Decision ProcessDecision ProcessLine Efficiency < 90%
Try Minimum Allowable Cycle Time
Line Efficiency Still < 90%
Product RedesignWorker Training
Faster Equipmentetc.
Rebalance Line
OUTSIDETHE
REALM OF
LINEBALANCING
MAYTAKE
MONTHSTO
ACCOMPLISH

Why Labor Idleness Is CostlyWhy Labor Idleness Is Costly
Average worker wage rate is $25.00 per hour
Ten (10) seconds of idle time per cycle in one particular work station.
One hundred sixty (160) cycles per work day.
ASSUME THE FOLLOWING

IDLE TIME COSTSIDLE TIME COSTS
1 Station1 Station$11.20$11.20DailyDaily
1 Station1 Station$2,800.00$2,800.00AnnuallyAnnually
20 Stations20 Stations$56,000.00$56,000.00AnnuallyAnnually
5 Plants5 Plants$250,000.00$250,000.00
AnnuallyAnnually

Assembly Line EfficiencyAssembly Line Efficiency
The overall efficiency of the assembly line cannot be changed by employing a different task assign- ment heuristic. This would merely reshuffle the tasks among the work stations.
MFTSO
T
LFT
A FINAL WORDA FINAL WORD

Fairness in Line BalancingFairness in Line Balancing
Experimenting with different task assignment heuristics may prove useful if management is seeking a more equitable distribution of work among all of its work station employees.
Per Cycle STATION 1 STATION 2 STATION 3PRODUCTIVE TIME 167 seconds 167 seconds 167 seconds
IDLE TIME 13 seconds 13 seconds 13 secondsAVAILABLE TIME 180 seconds 180 seconds 180 seconds

Assembly Line BalancingAssembly Line Balancing
THE ENDTHE END
Applied Management Science for Decision Making, 1e Applied Management Science for Decision Making, 1e © 2011 Pearson Prentice-Hall, Inc. Philip A. Vaccaro, PhD© 2011 Pearson Prentice-Hall, Inc. Philip A. Vaccaro, PhD


