
May 21, 2015
ASMI annual meeting of shareholders © 2015 ASMI
Chuck del Prado, President & CEO
ASMI ANNUAL MEETING OF SHAREHOLDERS 2015
| 2 May 21, 2015 I ASMI annual meeting of shareholders
SAFE HARBOR STATEMENTS
Safe Harbor Statement under the U.S. Private Securities Litigation Reform Act of 1995: All matters
discussed in this business and strategy update, except for any historical data, are forward-looking
statements. Forward-looking statements involve risks and uncertainties that could cause actual
results to differ materially from those in the forward-looking statements. These include, but are not
limited to, economic conditions and trends in the semiconductor industry generally and the timing of
the industry cycles specifically, currency fluctuations, corporate transactions, financing and liquidity
matters, the success of restructurings, the timing of significant orders, market acceptance of new
products, competitive factors, litigation involving intellectual property, shareholder and other issues,
commercial and economic disruption due to natural disasters, terrorist activity, armed conflict or
political instability, epidemics and other risks indicated in the Company's filings from time to time
with the U.S. Securities and Exchange Commission, including, but not limited to, the Company’s
reports on Form 20-F and Form 6-K. The company assumes no obligation to update or revise any
forward-looking statements to reflect future developments or circumstances.

May 21, 2015 I ASMI annual meeting of shareholders | 3
OUTLINE
› Semiconductor capital spending in 2014
› ASMI results in 2014
› Corporate responsibility
› Products & business highlights
› Market outlook and conclusions
May 21, 2015 I ASMI annual meeting of shareholders | 4
OUTLINE
› Semiconductor capital spending in 2014
› ASMI results in 2014
› Corporate responsibility
› Products & business highlights
› Market outlook and conclusions

| 5 May 21, 2015 I ASMI annual meeting of shareholders
OUR INDUSTRY GREW IN 2014
SEMICONDUCTOR CAPITAL SPENDING
0
10
20
30
40
50
60
70
80
2009 2010 2011 2012 2013 2014
(USD billion)
-1.5% -16.1%
+17.9%
+118.4%
-41.2%
+11.6%
Source: Gartner, April 2015
Semiconductor capex was healthy in 2014 – up 11.6%

| 6 May 21, 2015 I ASMI annual meeting of shareholders
WAFER FAB EQUIPMENT WAS UP IN 2014
WAFER FAB EQUIPMENT BY DEVICE TYPE
Source: Gartner, April 2015
2014 WFE spending increased by 16% driven by memory
0
5
10
15
20
25
30
35
40
2009 2010 2011 2012 2013 2014
(USD billion)
Other
Memory
Logic
Foundry
-47%
+145%
+15%
-18% -8%
+16%

May 21, 2015 I ASMI annual meeting of shareholders | 7
OUTLINE
› Semiconductor capital spending in 2014
› ASMI results in 2014
› Corporate responsibility
› Products & business highlights
› Market outlook and conclusions

| 8 May 21, 2015 I ASMI annual meeting of shareholders
KEY HIGHLIGHTS – 2014
› ASMI revenues up 21% y-o-y
› Gross margin increased to 43%
› ASMI EBIT margin up from 10.4% in 2013 to 16.6% in 2014
› Cash flow from operations of €110 million in 2014
€100 million share buyback program announced October 2014
Proposal to ASMI 2015 AGM for dividend of €0.60 per share
› Comparable net earnings of €160 million up from €45 million in 2013
Excluding €1 billion PPA gain related to sale of ASMPT shares in 2013
ASMPT contributed €61 million to net earnings in 2014

| 9 May 21, 2015 I ASMI annual meeting of shareholders
NET EARNINGS 2014
FINANCIALS BASED ON US GAAP
EUR million
FULL YEAR
2013
comparable
FULL YEAR
2013
FULL YEAR
2014
Q1
2014
Q2
2014
Q3
2014
Q4
2014
Q1
2015
Front-end 452 452 546 151 148 122 124 162
Back-end 160 - - - - - - -
NET SALES 612 452 546 151 148 122 124 162
Front-end 39.0% 39.0% 43.1% 43.7% 42.3% 43.2% 43.0% 43.4%
Back-end 24.0% - - - - - - -
GROSS MARGIN 215 176 235 66 63 53 54 70
as % of sales 35.0% 39.0% 43.1% 43.7% 42.3% 43.3% 43.0% 43.3%
Selling, general and administrative (96) (71) (81) (19) (20) (20) (22) (21)
Research and development (75) (58) (64) (14) (15) (16) (19) (20)
Front-end 47 47 91 33 28 17 13 29
Back-end (100%) (4) - - - - - - -
EBIT (excl. restructuring/impairment) 43 47 91 33 28 17 13 29
as % of sales 7.0% 10.4% 16.6% 21.6% 18.5% 14.1% 10.8% 17.6%
Restructuring (3) (3) (0.1) - (0.1) - - -
Front-end 25 25 98 27 24 30 18 53
Back-end (ASMI interest) 21 21 61 6 16 31 9 13
PPA 1,006 1,006 (23) (5) (6) (6) (6) (7)
NET RESULT 1,052 1,052 137 27 35 55 21 60
| 10 May 21, 2015 I ASMI annual meeting of shareholders
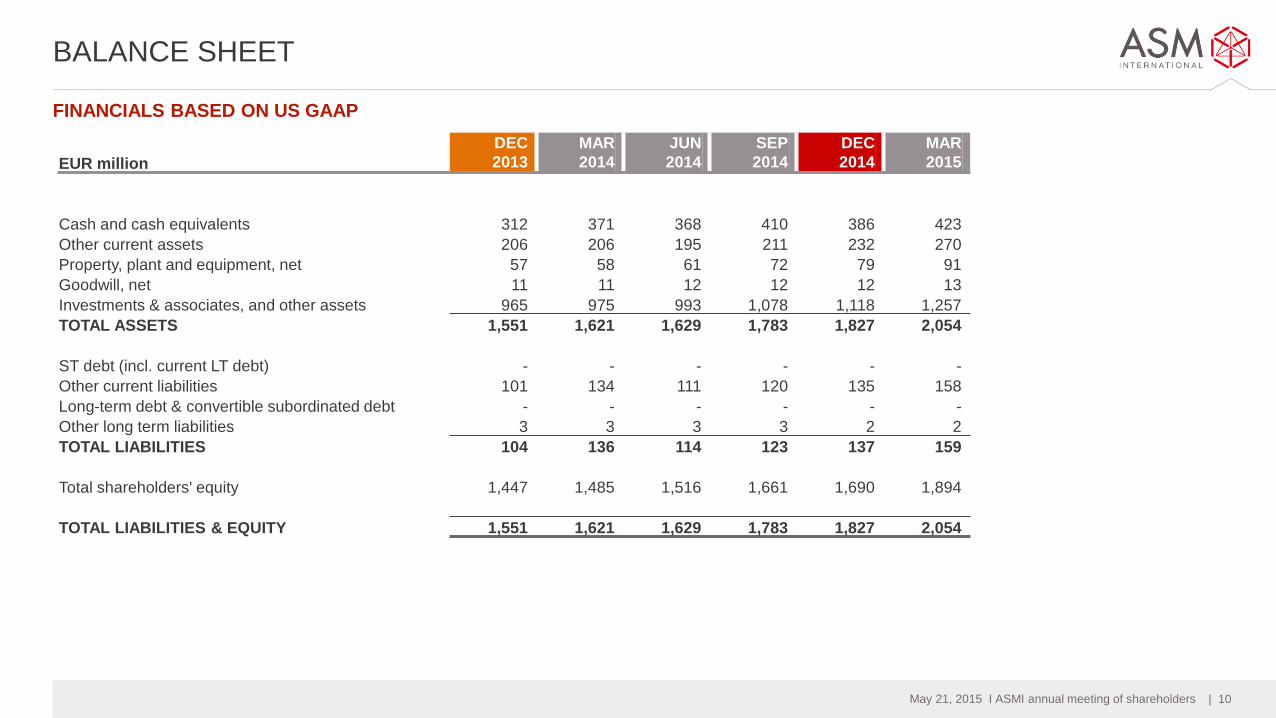
BALANCE SHEET
EUR million
DEC
2013
MAR
2014
JUN
2014
SEP
2014
DEC
2014
MAR
2015
Cash and cash equivalents 312 371 368 410 386 423
Other current assets 206 206 195 211 232 270
Property, plant and equipment, net 57 58 61 72 79 91
Goodwill, net 11 11 12 12 12 13
Investments & associates, and other assets 965 975 993 1,078 1,118 1,257
TOTAL ASSETS 1,551 1,621 1,629 1,783 1,827 2,054
ST debt (incl. current LT debt) - - - - - -
Other current liabilities 101 134 111 120 135 158
Long-term debt & convertible subordinated debt - - - - - -
Other long term liabilities 3 3 3 3 2 2
TOTAL LIABILITIES 104 136 114 123 137 159
Total shareholders' equity 1,447 1,485 1,516 1,661 1,690 1,894
TOTAL LIABILITIES & EQUITY 1,551 1,621 1,629 1,783 1,827 2,054
FINANCIALS BASED ON US GAAP

| 11 May 21, 2015 I ASMI annual meeting of shareholders
(EUR million)
WORKING CAPITAL
VALUE
DAYS
0
20
40
60
80
100
120
140
160
180
Q1 Q2 Q3 Q4 Q1 Q2 Q3 Q4 Q1 Q2 Q3 Q4 Q1 Q2 Q3 Q4 Q1
11 12 13 14 15
Working capital Quarterly sales
40
60
80
100
120
140
Q1 Q2 Q3 Q4 Q1 Q2 Q3 Q4 Q1 Q2 Q3 Q4 Q1 Q2 Q3 Q4 Q1
11 12 13 14 15
Days of working capital
| 12 May 21, 2015 I ASMI annual meeting of shareholders
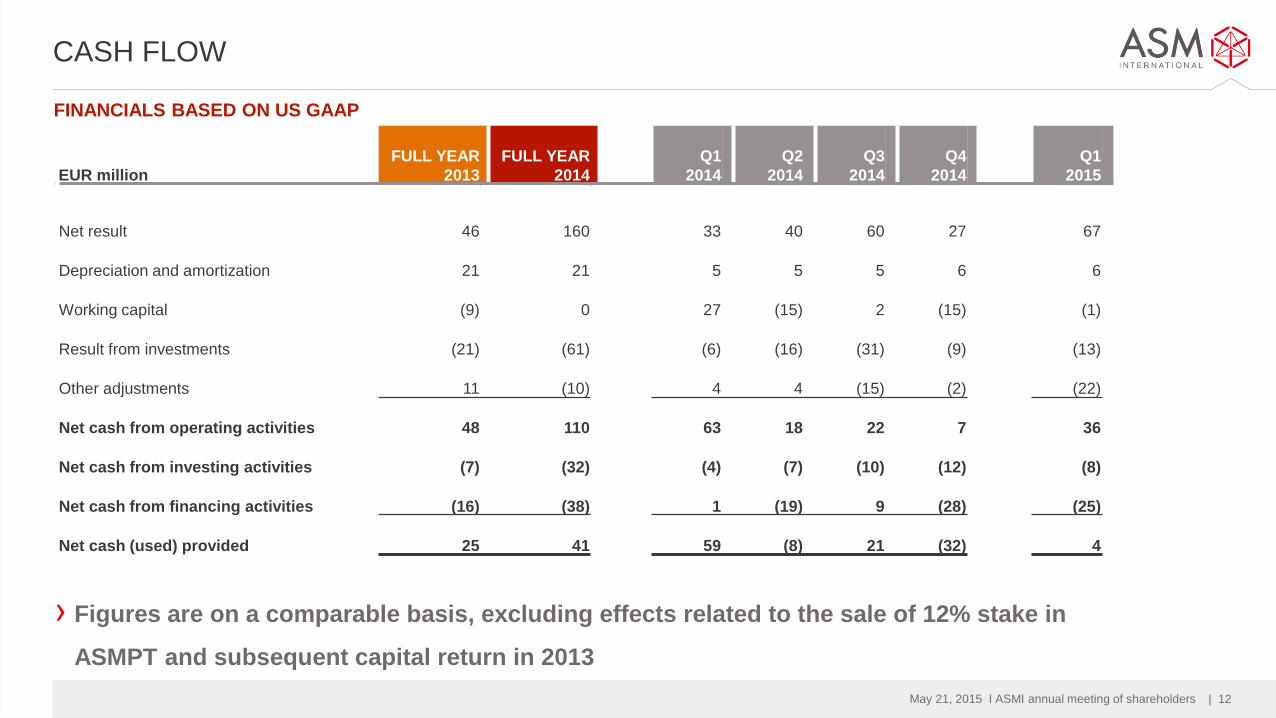
CASH FLOW
› Figures are on a comparable basis, excluding effects related to the sale of 12% stake in
ASMPT and subsequent capital return in 2013
EUR million
FULL YEAR
2013
FULL YEAR
2014
Q1
2014
Q2
2014
Q3
2014
Q4
2014
Q1
2015
Net result 46 160
33 40 60 27 67
Depreciation and amortization 21 21
5 5 5 6 6
Working capital (9) 0
27 (15) 2 (15) (1)
Result from investments (21) (61)
(6) (16) (31) (9) (13)
Other adjustments 11 (10)
4 4 (15) (2) (22)
Net cash from operating activities 48 110
63 18 22 7 36
Net cash from investing activities (7) (32)
(4) (7) (10) (12) (8)
Net cash from financing activities (16) (38)
1 (19) 9 (28) (25)
Net cash (used) provided 25 41
59 (8) 21 (32) 4
FINANCIALS BASED ON US GAAP
| 13 May 21, 2015 I ASMI annual meeting of shareholders
40-
30-
20-
10-
-
10
20
30
40
0
20
40
60
80
100
120
140
160
180
Q1 Q2 Q3 Q4 Q1 Q2 Q3 Q4 Q1 Q2 Q3 Q4 Q1 Q2 Q3 Q4 Q1 Q2 Q3 Q4 Q1 Q2 Q3 Q4 Q1
09 10 11 12 13 14 15
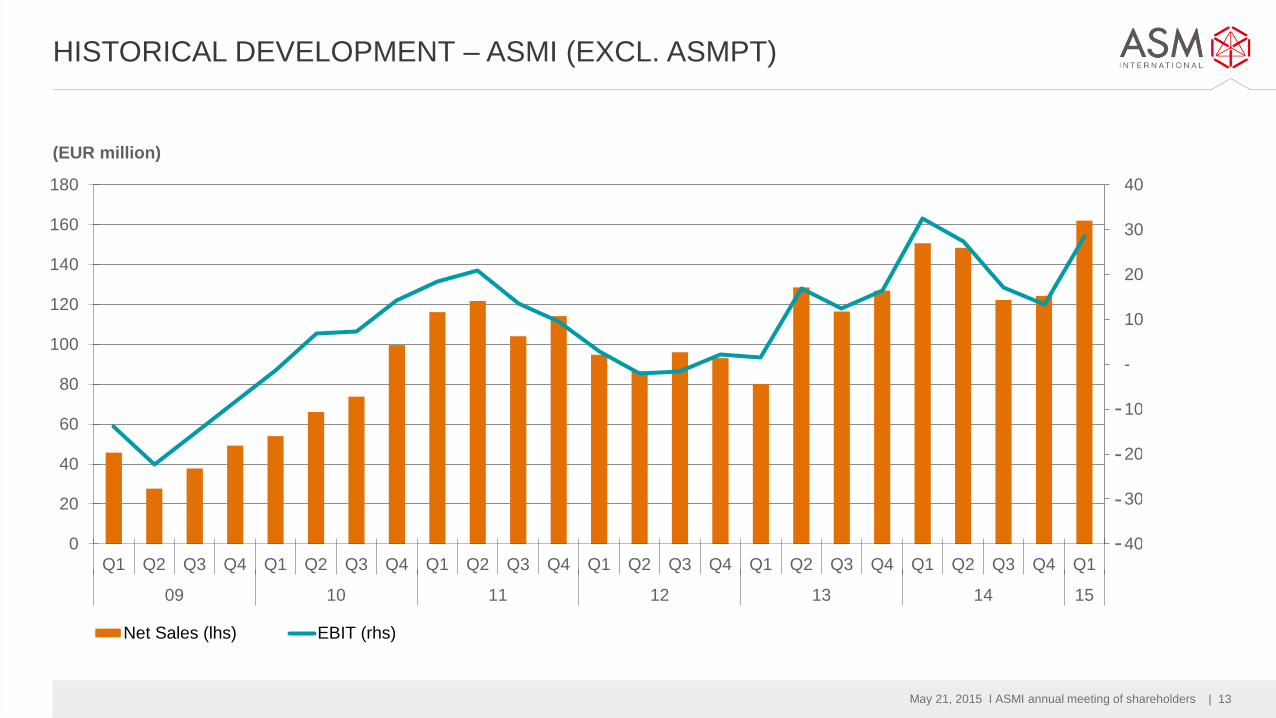
Net Sales (lhs) EBIT (rhs)
HISTORICAL DEVELOPMENT – ASMI (EXCL. ASMPT)
(EUR million)
-
-
-
-

| 14 May 21, 2015 I ASMI annual meeting of shareholders
0
20
40
60
80
100
120
140
160
180
200
Q1 Q2 Q3 Q4 Q1 Q2 Q3 Q4 Q1 Q2 Q3 Q4 Q1 Q2 Q3 Q4 Q1 Q2 Q3 Q4 Q1 Q2 Q3 Q4 Q1
09 10 11 12 13 14 15
Bookings Backlog
BOOKINGS & BACKLOG – ASMI (EXCL. ASMPT)
(EUR million)

| 15 May 21, 2015 I ASMI annual meeting of shareholders
**as of 20 May 2015, including proposed dividend *proposed
0
100
200
300
400
500
600
700
2010 2011 2012 2013 2014 2015 YTD*
Buyback convertibles Return of capital Dividends Buyback shares
SHAREHOLDER REMUNERATION
CUMULATIVE CASH RETURNED TO MARKET ‘10-’15 YTD (EUR M)
› Proposed dividend increases by 20% to €0.60 per share
› €100 million share buyback announced in October 2014
• To be executed in 2014/2015 timeframe; nearly fully completed as of 15 May 2015
• As part of commitment to use excess cash for the benefit of ASMI’s shareholders
0.00
0.10
0.20
0.30
0.40
0.50
0.60
0.70
2011 2012 2013 2014 2015*
DIVIDEND PER SHARE PAID (EUR)
**
| 16 May 21, 2015 I ASMI annual meeting of shareholders
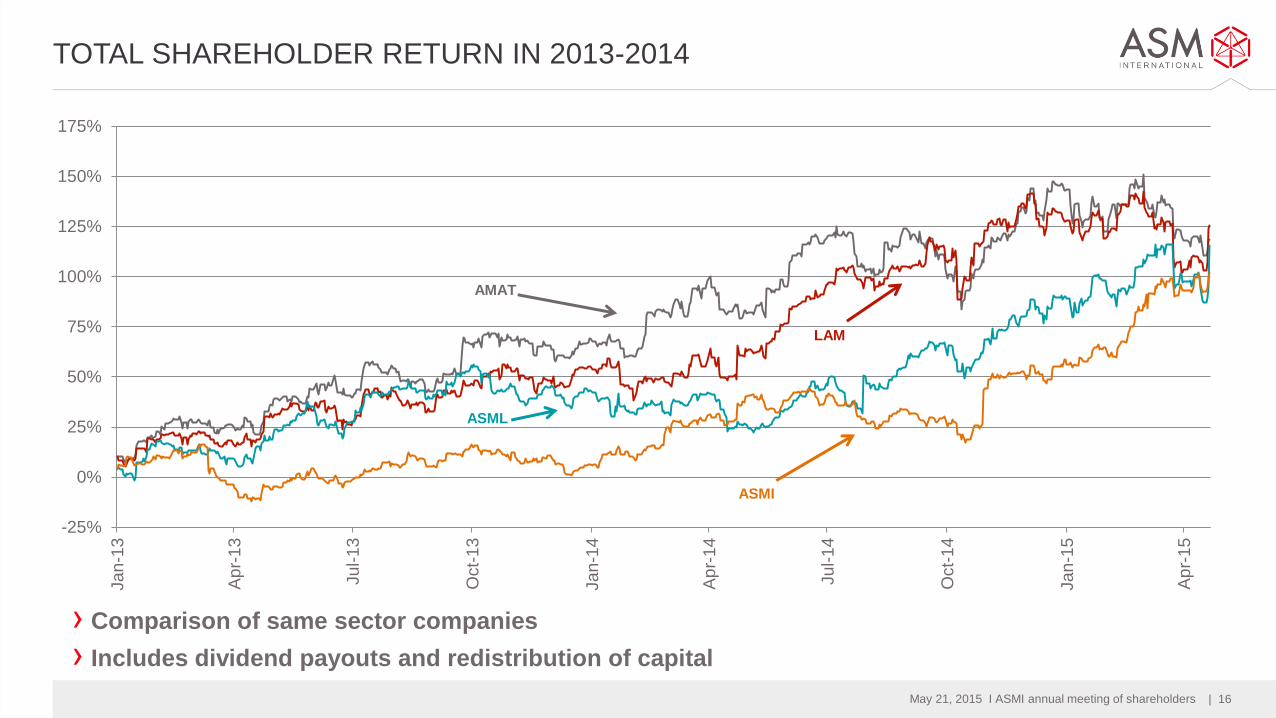
TOTAL SHAREHOLDER RETURN IN 2013-2014
› Comparison of same sector companies
› Includes dividend payouts and redistribution of capital
-25%
0%
25%
50%
75%
100%
125%
150%
175%Jan
-13
Ap
r-13
Ju
l-1
3
Oct-
13
Jan
-14
Ap
r-14
Ju
l-1
4
Oct-
14
Jan
-15
Ap
r-15
LAM
AMAT
ASML
ASMI
| 17 May 21, 2015 I ASMI annual meeting of shareholders
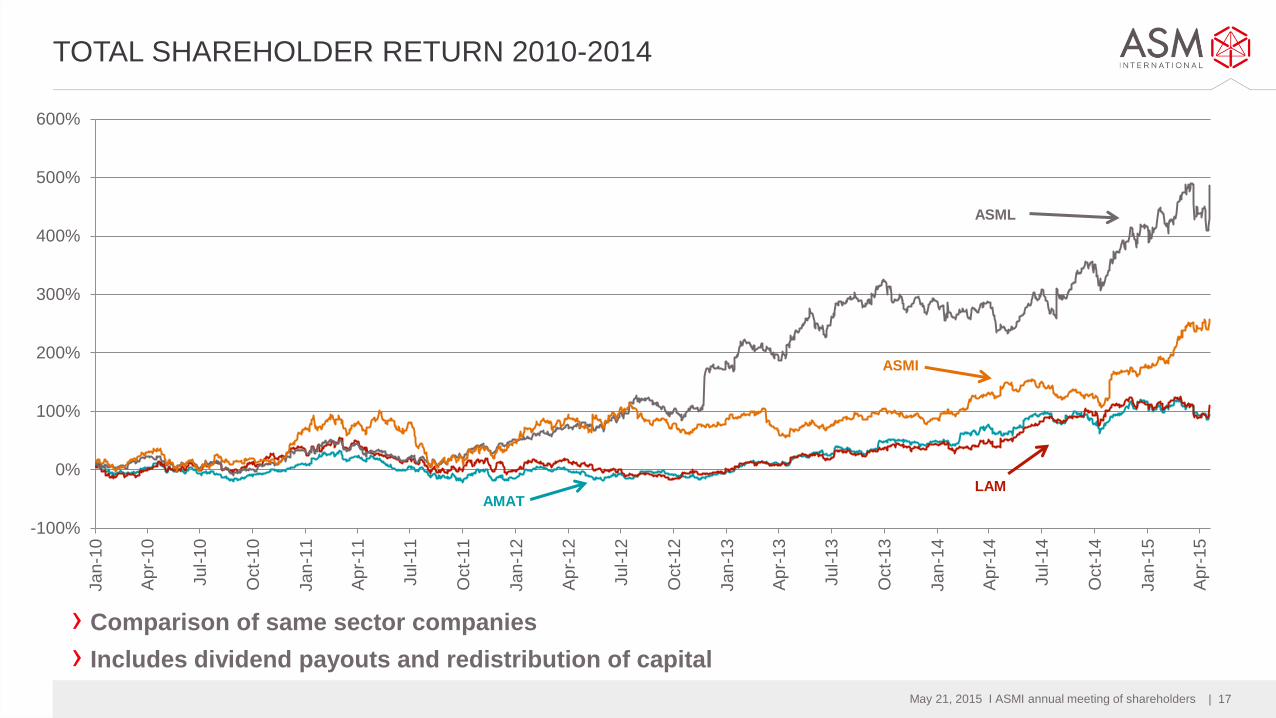
TOTAL SHAREHOLDER RETURN 2010-2014
› Comparison of same sector companies
› Includes dividend payouts and redistribution of capital
-100%
0%
100%
200%
300%
400%
500%
600%
Jan
-10
Ap
r-10
Jul-
10
Oct-
10
Jan
-11
Ap
r-11
Jul-
11
Oct-
11
Jan
-12
Ap
r-12
Jul-
12
Oct-
12
Jan
-13
Ap
r-13
Jul-
13
Oct-
13
Jan
-14
Ap
r-14
Jul-
14
Oct-
14
Jan
-15
Ap
r-15
LAM AMAT
ASML
ASMI

| 18 May 21, 2015 I ASMI annual meeting of shareholders
IMPLIED VALUE FRONT-END
› Strong increase in implied value from €400-500 million negative in May 2012 to
approximately €1.0 billion positive in May 2015
(800)
(600)
(400)
(200)
-
200
400
600
800
1,000
1,200
1,400
Jan-12 Apr-12 Jul-12 Oct-12 Jan-13 Apr-13 Jul-13 Oct-13 Jan-14 Apr-14 Jul-14 Oct-14 Jan-15 Apr-15
Value ASMI minus value PT stake and adjusted for excess net cash (EUR million)
(EUR million)

| 19 May 21, 2015 I ASMI annual meeting of shareholders
SHAREHOLDING IN ASMPT
› After the sale of 12% of the ASMPT shares on 15 March 2013, our 40% share of ASMPT
net profits is included in ‘result from investments’
› PPA regular amortization amounted to €23 million for full year 2014
EUR million
Full year
2013
Full year
2014
Q1 2015
Sales ASMPT (HK$ million) 10,841 14,229 3,056
Net profit ASMPT (EUR million, 100% based) 52 152 34
Result from investments (including ASMI’s 40% share of ASMPT
net profit) 21 61 13
Remeasurement gain, realized gain on sale of ASMPT shares,
amortization and fair value adjustments 1,006 (23) (7)
Result from investments 1,027 39 7

May 21, 2015 I ASMI annual meeting of shareholders | 20
OUTLINE
› Semiconductor capital spending in 2014
› ASMI results in 2014
› Corporate responsibility
› Products & business highlights
› Market outlook and conclusions

| 21 May 21, 2015 I ASMI annual meeting of shareholders
› Released first annual Corporate Responsibility (CR) report
› Electronics Industry Citizenship Coalition (EICC) Code of Conduct
EICC Committee formed to drive continuous improvement and oversight - Q2 2014
Score of “Low Risk” in Risk Assessment process (official EICC system) - Q2 2014
Started Top Tier Supplier compliance process in 2014
Next steps:
3rd Party EICC audit of all key sites to verify compliance - Q2 2015 to Q1 2016
Top Tier Supplier assessments - Q2-Q3 2015, and audits - Q4 2015
› Added full-time CR Manager – Q2 2014
› Exceeded major customer audit expectations – Q1 2015
Transparency ASM website – Corporate Responsibility
CORPORATE RESPONSIBILITY

| 22 May 21, 2015 I ASMI annual meeting of shareholders
› Continued reduction in injuries, Recordable Case Rate remains flat
› Safety Leadership engagement sessions within 2015
› Focused improvements in our Engineering Labs and Global Service
HEALTH & SAFETY
GLOBAL INJURY AND RCR RATES
2011 2013 2012 2014
2.0
1.5
1.0
0.5
0.0
| 23 May 21, 2015 I ASMI annual meeting of shareholders
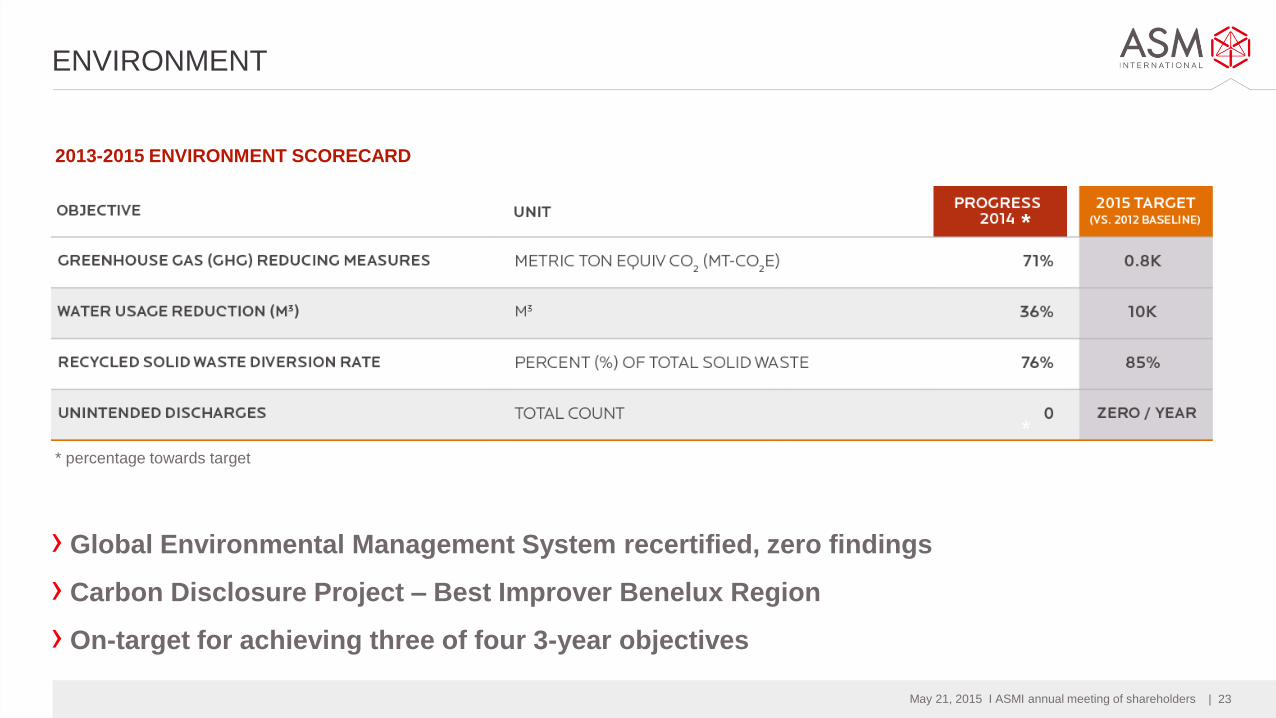
* percentage towards target
› Global Environmental Management System recertified, zero findings
› Carbon Disclosure Project – Best Improver Benelux Region
› On-target for achieving three of four 3-year objectives
ENVIRONMENT
*
2013-2015 ENVIRONMENT SCORECARD
*

May 21, 2015 I ASMI annual meeting of shareholders | 24
OUTLINE
› Semiconductor capital spending in 2014
› ASMI results in 2014
› Corporate responsibility
› Products & business highlights
› Market outlook and conclusions
| 25 May 21, 2015 I ASMI annual meeting of shareholders
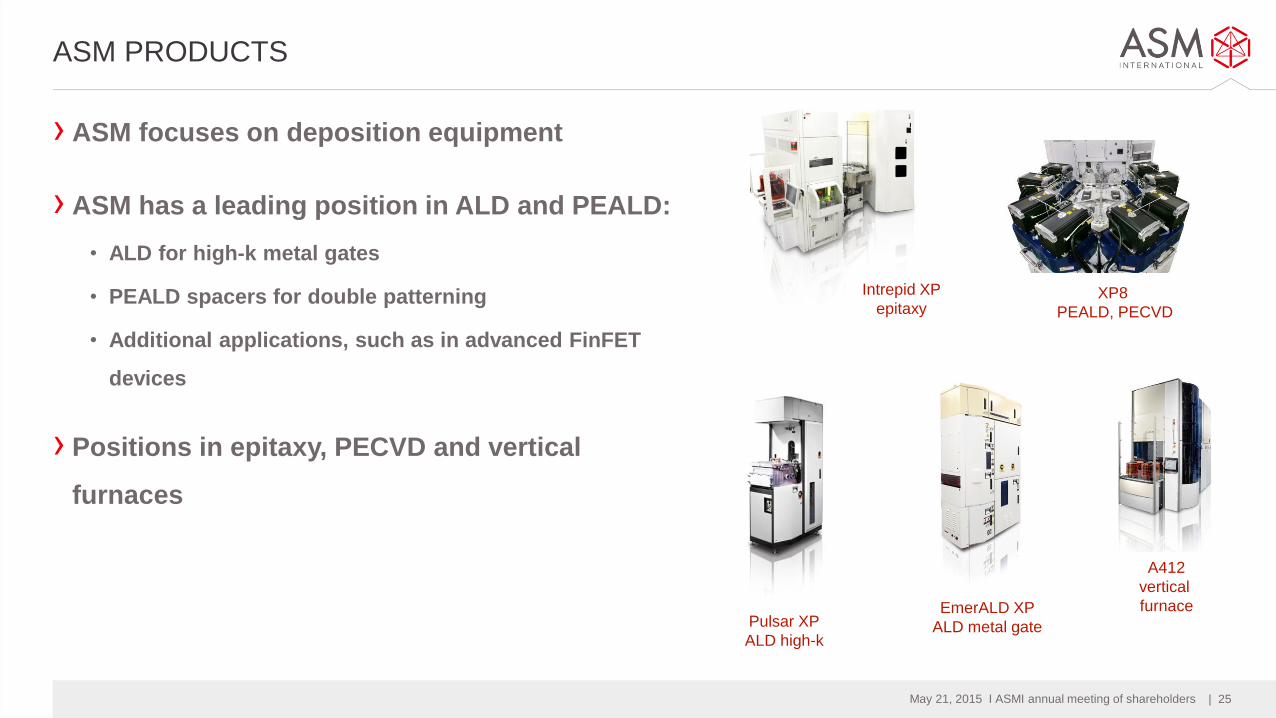
› ASM focuses on deposition equipment
› ASM has a leading position in ALD and PEALD:
• ALD for high-k metal gates
• PEALD spacers for double patterning
• Additional applications, such as in advanced FinFET
devices
› Positions in epitaxy, PECVD and vertical
furnaces
Pulsar XP
ALD high-k
XP8
PEALD, PECVD
A412
vertical
furnace EmerALD XP
ALD metal gate
Intrepid XP
epitaxy
ASM PRODUCTS

| 26 May 21, 2015 I ASMI annual meeting of shareholders
WHAT HAS CHANGED IN 2014?
› PEALD market further accelerated
› Revenue contribution of memory segment further increased
› Strengthened our position within the top-10 capex customers
› 2014 another year in which ASMI outgrew the wafer fab equipment market
| 27 May 21, 2015 I ASMI annual meeting of shareholders
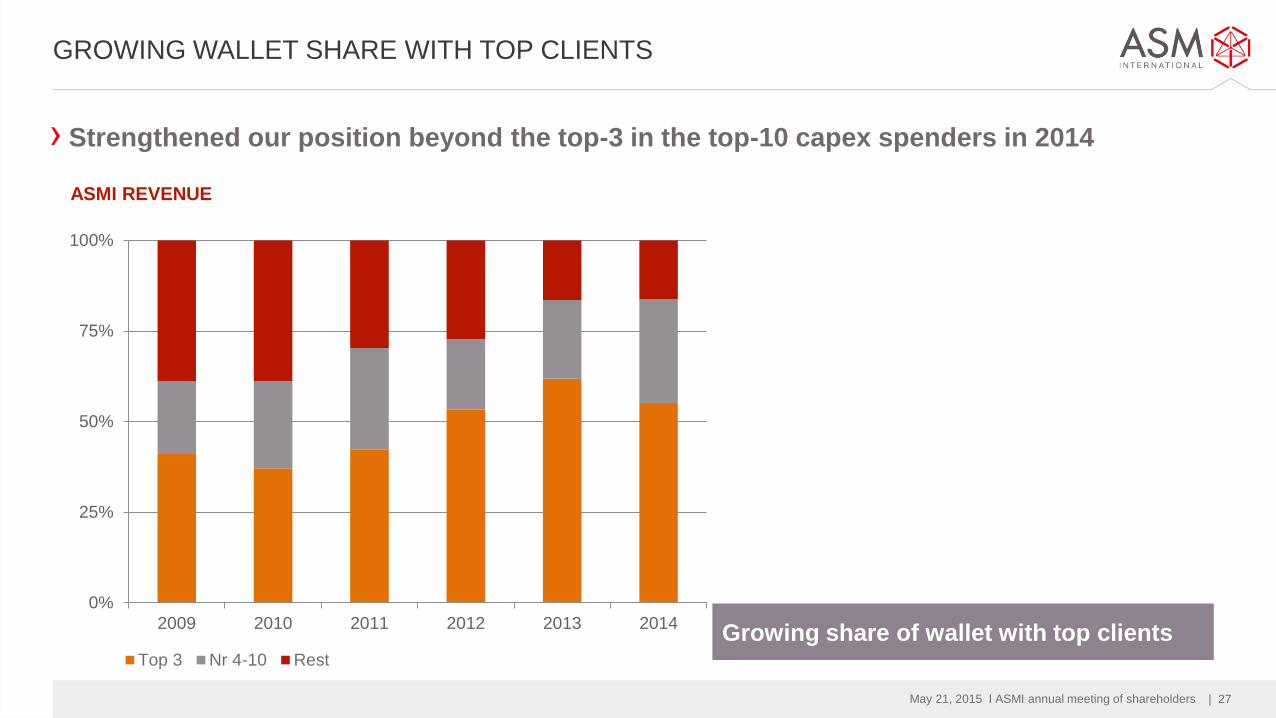
GROWING WALLET SHARE WITH TOP CLIENTS
ASMI REVENUE
› Strengthened our position beyond the top-3 in the top-10 capex spenders in 2014
Growing share of wallet with top clients
0%
25%
50%
75%
100%
2009 2010 2011 2012 2013 2014
Top 3 Nr 4-10 Rest

| 28 May 21, 2015 I ASMI annual meeting of shareholders
ALD BECOMING AN IMPORTANT DEPOSITION EQUIPMENT SEGMENT
› The CAGR ‘14-’18 of the ALD segment is highest within the
deposition equipment market
› ALD estimated to represent approximately 20% of the total
deposition equipment market by 2018
› Drivers for growth:
Strengths of ALD: (i) high-precision deposition of smooth and conformal
ultra-thin films; (ii) ability to deposit new materials
Device scaling, new materials and the use of 3D structures all are drivers
to increase demand for ALD and PEALD
| 29 May 21, 2015 I ASMI annual meeting of shareholders
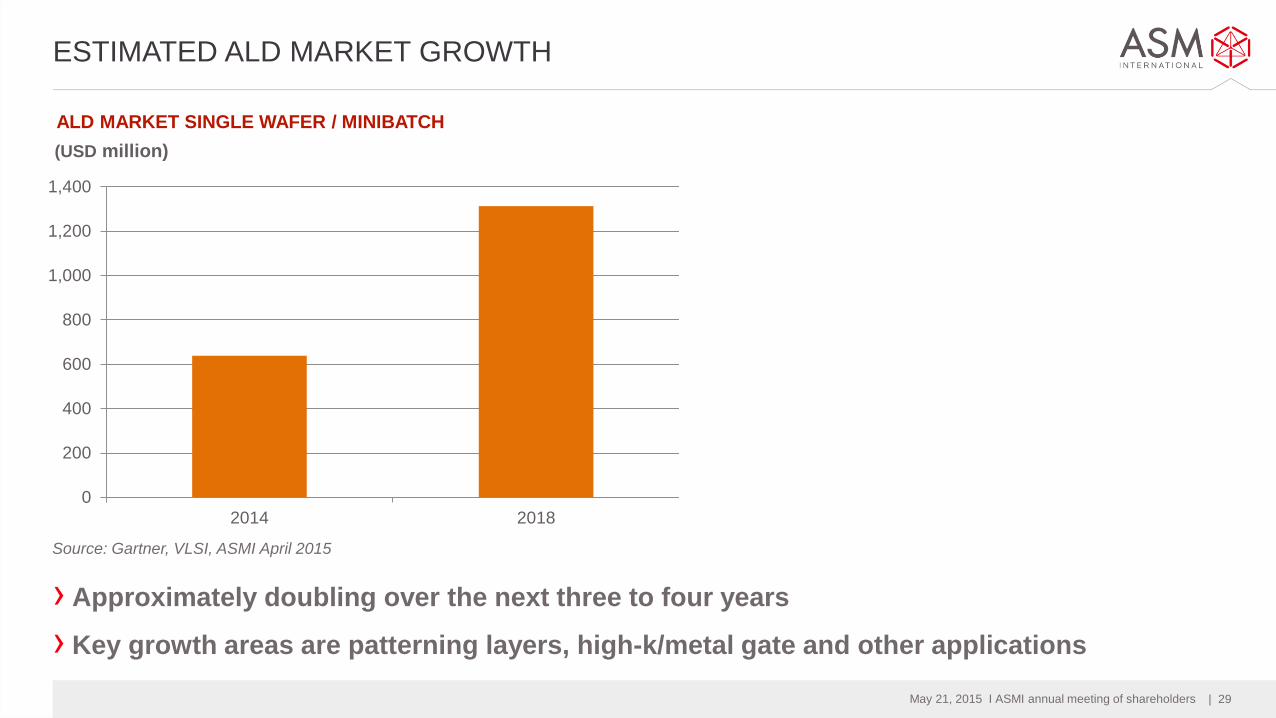
› Approximately doubling over the next three to four years
› Key growth areas are patterning layers, high-k/metal gate and other applications
ESTIMATED ALD MARKET GROWTH
Source: Gartner, VLSI, ASMI April 2015
ALD MARKET SINGLE WAFER / MINIBATCH
0
200
400
600
800
1,000
1,200
1,400
2014 2018
(USD million)
May 21, 2015 I ASMI annual meeting of shareholders | 30
OUTLINE
› Semiconductor capital spending in 2014
› ASMI results in 2014
› Corporate responsibility
› Products & business highlights
› Market outlook and conclusions
| 31 May 21, 2015 I ASMI annual meeting of shareholders
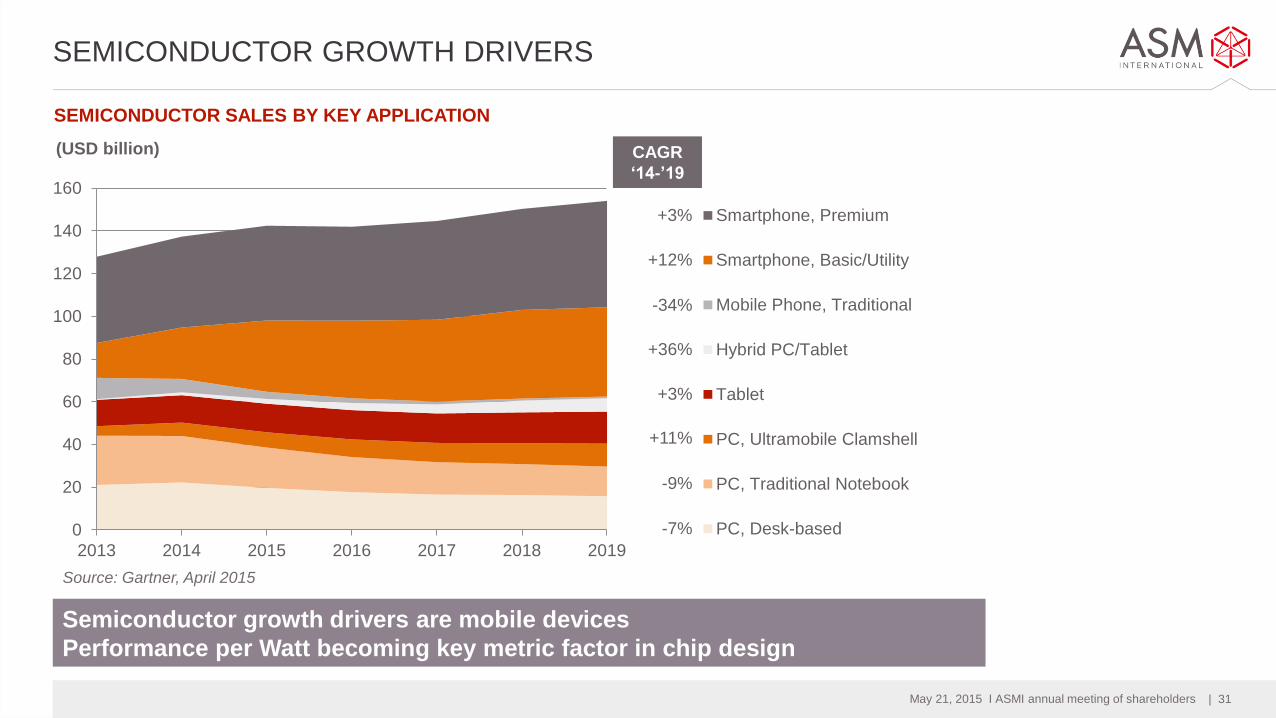
0
20
40
60
80
100
120
140
160
2013 2014 2015 2016 2017 2018 2019
(USD billion)
Smartphone, Premium
Smartphone, Basic/Utility
Mobile Phone, Traditional
Hybrid PC/Tablet
Tablet
PC, Ultramobile Clamshell
PC, Traditional Notebook
PC, Desk-based
+3%
+12%
SEMICONDUCTOR SALES BY KEY APPLICATION
SEMICONDUCTOR GROWTH DRIVERS
Semiconductor growth drivers are mobile devices
Performance per Watt becoming key metric factor in chip design
Source: Gartner, April 2015
CAGR
‘14-’19
+36%
+3%
+11%
-9%
-7%
-34%
| 32 May 21, 2015 I ASMI annual meeting of shareholders
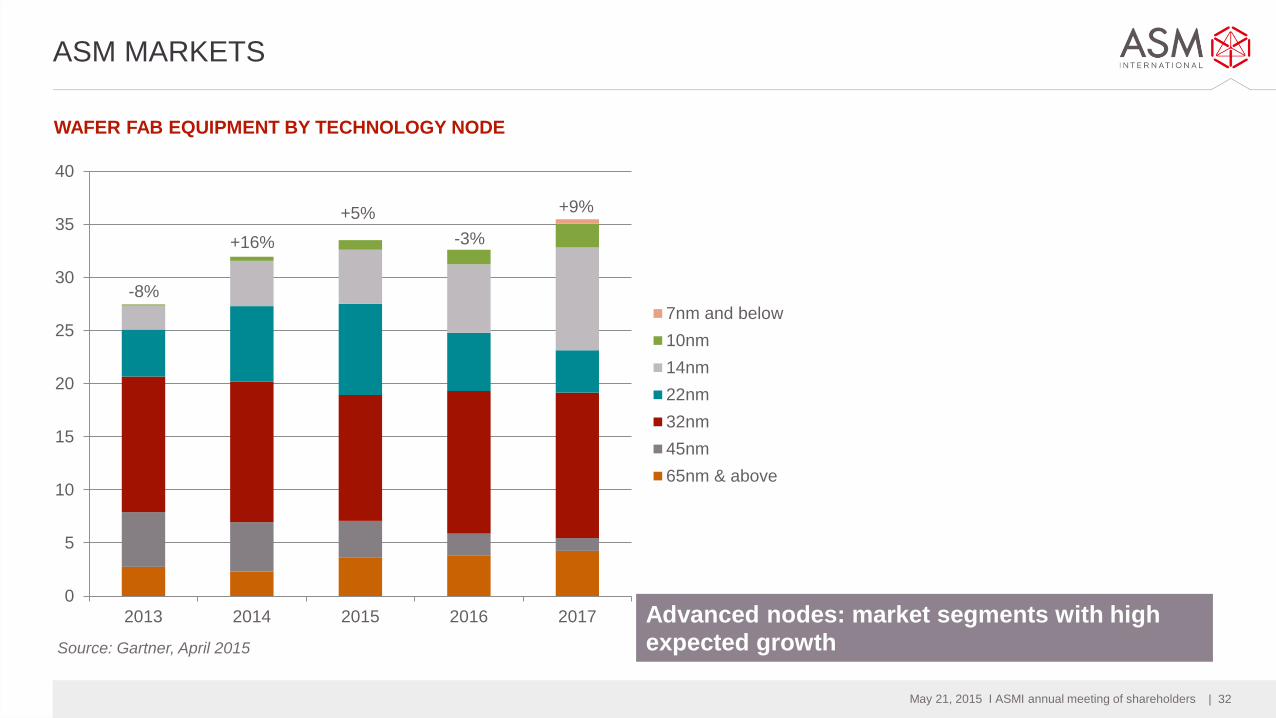
Source: Gartner, April 2015
ASM MARKETS
WAFER FAB EQUIPMENT BY TECHNOLOGY NODE
0
5
10
15
20
25
30
35
40
2013 2014 2015 2016 2017
7nm and below
10nm
14nm
22nm
32nm
45nm
65nm & above
-8%
+16%
+5%
-3%
+9%
Advanced nodes: market segments with high expected growth

| 33 May 21, 2015 I ASMI annual meeting of shareholders
Q2 2015 FINANCIAL OUTLOOK ASMI
Based upon the current backlog and our current visibility:
On a currency comparable level we expect Q2 sales to be
between €180 and €200 million, while the Q2 order intake is
expected to be in the range of €160-180 million.
For the second half of 2015 the current visibility remains limited.

| 34 May 21, 2015 I ASMI annual meeting of shareholders
SUMMARY
› Revenue increased 21% compared to 2013, outperforming the
overall wafer fab equipment market
› Strong traction in ALD (especially PEALD) continued in 2014
› Achieved strong gross margin improvements in 2014
› The Company believes to be well positioned for increased
number of ALD applications in the next technology nodes for
logic/foundry/memory

| 35 May 21, 2015 I ASMI annual meeting of shareholders


