

SEVIRI CHANNELS
Channel Gases Application
HRV 0.7 Broad band VIS Surface, aerosol, cloud detail (1 km)
VIS 0.6 Narrow band Ice or snow
VIS 0.8 Narrow band Vegetation
NIR 1.6 Window Aerosols, snow<>cloud
IR 3.8 Triple window SST, fog<>surface, ice cloud
WV 6.2 Water vapour Upper troposphere 300 Hpa humidity
WV 7.3 Water vapour Mid-troposphere 600 Hpa humidity
IR 8.7 Almost window Water vapour in boundary layer, ice<>liquid
IR 9.7 Ozone Stratospheric winds
IR 10.8 Split window CTH, cloud analysis, PW
IR 12.0 Split window Land and SST
IR 13.4 Carbon dioxide +10.8: Semitransparent-cloud top, air mass analysis
Properties
Cloud
Abs
orpt
ion
<--
----
----
----
----
----
----
> S
catt
erin
g
1 --
----
----
--<
----
----
----
E
mis
sivi
ty
----
->--
---
0 12
1
2
3
4
5
6
7
8
9
10
11

Energyspectrum
Ch07 Ch09 Ch10
H2O
CO2

Window channels characteristics
Low absorption by water vapour
Higher absorption by bigger droplets
Poorer cloud texture than VIS
Cloud Top Height and Sea Surface TemperatureLand is a gray body (emissivity < 1)Cloud emissivity increasing with drop sizeThin cloud looks warmer (semitransparency) than thick cloudSkin (a few microns thick) is neither bulk nor air temperature
Coastlines (especially summer and winter)
Cirrus well depicted: higher cloud opacity than in visible channels

Lesson objectives
Learn which are the window channels in the infrared portion of SEVIRI
Review the general characteristics of window channels
Understand the behaviour of channels at 8.7, 10.8 and 12.0µm for different ground surfaces and cloud types
Practice and exercise on scene identification through window channel differences, like 10.8 – 12.0µm
Review the concept of semi-transparency
Becoming aware of applications to precipitation, sea surface temperature and ash monitoring

Channels at 8.7, 10.8 and 12.0 µm
Channel 7
Channel 9
Channel10

Surface properties

Compositing 8.7, 10.8 and 12.0 µm
- Ch 7
- Ch 9
-Ch 10
Dust composite
Regional and local enhancements

Channel comparison on ice cloud
- Ch 7
- Ch 9
-Ch 10
F
A

Channel comparison on water cloud
- Ch 7
- Ch 9
-Ch 10

IR8.7
IR10.8290.6
287.4
Cloud free ocean:Weaker signal in IR8.7 because of water vapour absorption
212.7
210.0
Ice Cloud:Stronger signal in IR8.7 because of higher emissivity
. . . . .
. .
.. . . .
.. .... ...…
. …. … … . .. …. .….
…
….. .. . ………...
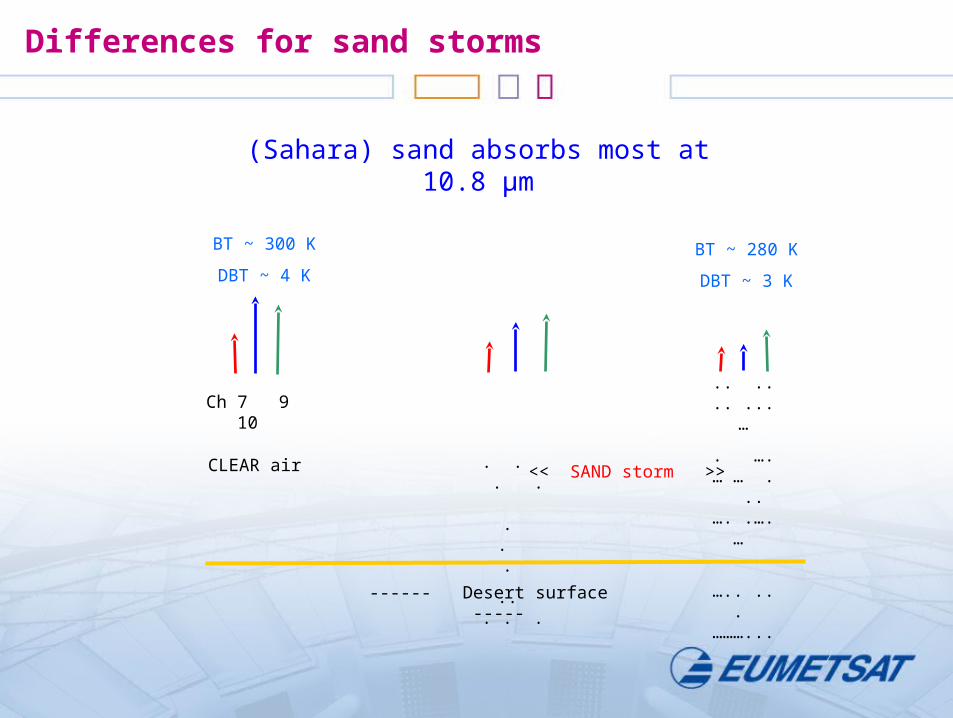
------ Desert surface -----
<< SAND storm >>
Ch 7 9 10
CLEAR air
BT ~ 300 K
DBT ~ 4 K
BT ~ 280 K
DBT ~ 3 K
(Sahara) sand absorbs most at 10.8 µm
Differences for sand storms
O o o O
o o o O
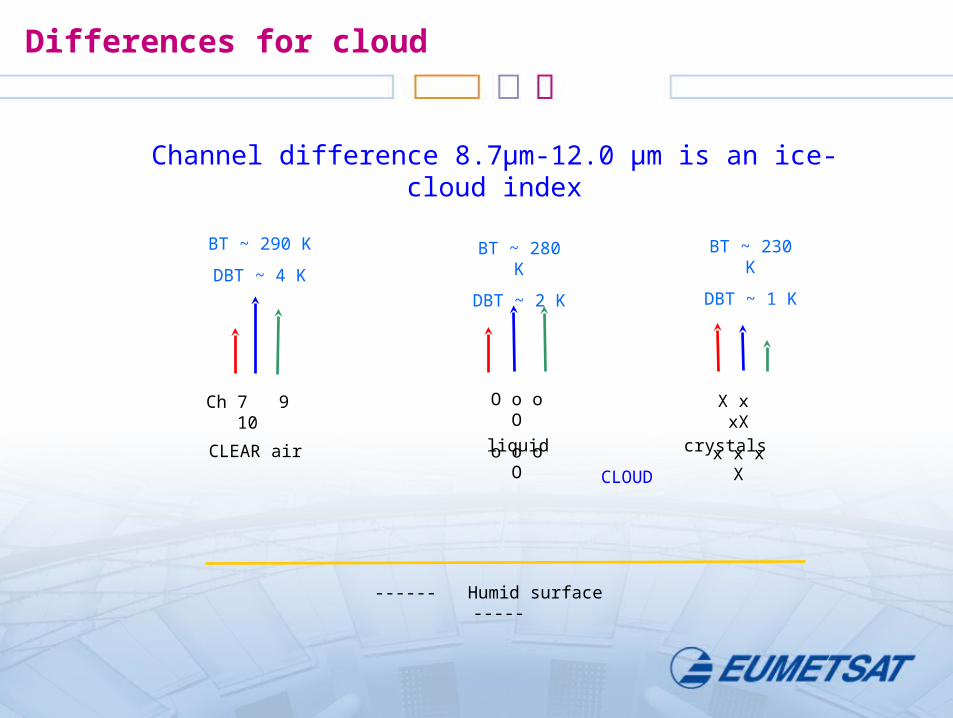
------ Humid surface -----
liquid crystals
CLOUD
Ch 7 9 10
CLEAR air
BT ~ 290 K
DBT ~ 4 K
BT ~ 230 K
DBT ~ 1 K
X x xX
x x x X
BT ~ 280 K
DBT ~ 2 K
Channel difference 8.7µm-12.0 µm is an ice-cloud index
Differences for cloud

The 7-9 difference
5 June 2003 12:00
Liquid cloud gulf of Sirte
Ice cloud over Pyrenees
Clear over grass
Clear desert

The 7-10 difference27 January 2006 11:00
(cold and cloudy)
Fog over France
Thick cloud over Iberia
Clear desert over Libya
Snow Ukraine

Absorption \ Channel 8.7µm 10.8 µm 12.0 µmWater vapour absorption -3K -1K -2KCloud absorption (liquid), n' 4% 8% 19%Cloud absorption (ice), n' 4% 19% 42%Desert/clay emissivity 85% 96% 98%Ocean emissivity Similar in all (99%+)
Absorption in the window channels

E*Tc + (1-E)*Tg < BT WARM BIAS!
Thin cloud pixels provide two contributions: cloud and ground, with a bias towards the warm source.
The bias is weaker with increasing wavelength: flatter Planck response, lower S
The bias grows with cloud height
Semi-transparency

Semitransparency
0
0.5
1
1.5
2
2.5
3
210 230 250 270 290
T10.8
T10
.8-T
12
E=1
E=0.8
E=0.6
E=0.3
Assume the same cloud emissivity in both channels: semitransparency effect

Transparency: Mie and Planck
PLANCKMIE
Additional variation if different emissivities at the two channels
E
1-E
Ground
Cloud
GroundCloud

Planck dependencies: wavelength and temperature
1% temperature change results in a S% increase in the energy count:
S ~ 14400 / Wavelength (µm) / Temperature (K))
S=14% at 3.9µm and scene temperature of 260 K
S ~ 4% for a warm scene at the split window
Radiation = Temperature raised to the S-th power: R ~ T ^ S
Inside a pixel, S determines the bias towards the warm part of the signal
Bigger bias for lower temperatures
Fire onset is better detected than its progress.
Cloud dissipation is better detected than cloud growth.
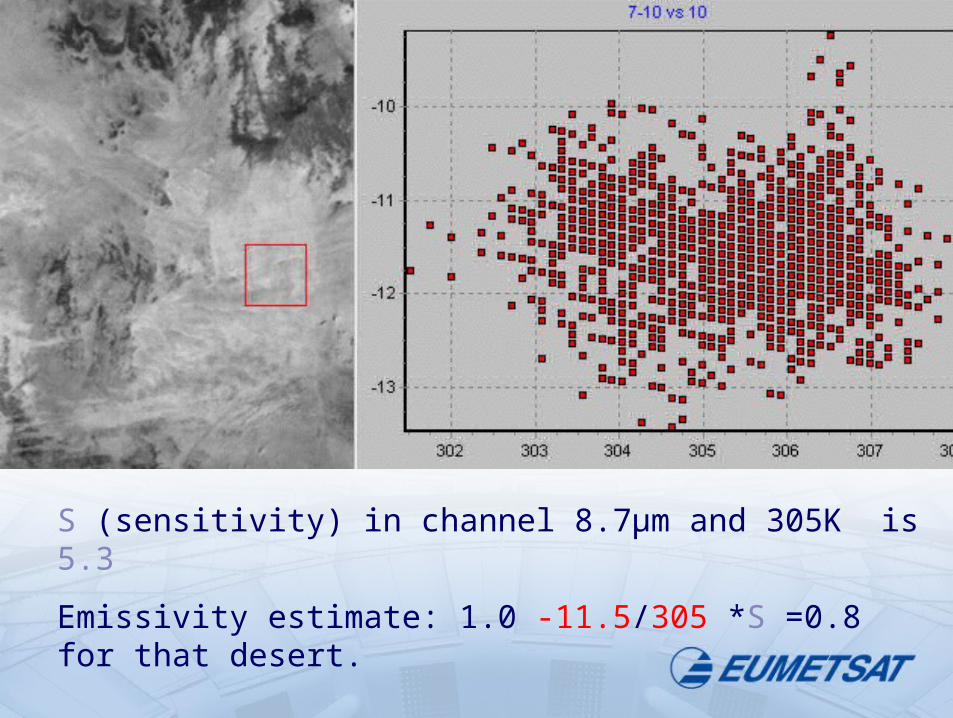
S (sensitivity) in channel 8.7µm and 305K is 5.3
Emissivity estimate: 1.0 -11.5/305 *S =0.8 for that desert.

The difference Ch7 - Ch9
Water cloud ~ -3K
Ice cloud ~ 0K
Snow ~ -3K (water vapour)
Cloud boundaries < 6K

Ch9 17-Feb-03 midday over desert
Several arcs indicate multilayered cloud
Pixels with a mixture of scenes show in the highest part of the arcs

Semitransparent cloud shows higher difference (in ch7-ch9 or ch9-ch10) than opaque cloud (left hand side of graph) or ground (right hand side of graph)
MSG Channel HRV, 16:00

The difference Ch9 – Ch10
Semitransparent cloud shows higher difference (ch9-ch10) than in (ch7-ch9)
Double arch: southern boundary is lower in height
MSG Channel 12, 16:00

Double arc marks two cloud levels: arc height is cloud height
Occasional negative difference in 9-10 due to small ice particles
MSG Channel 12, 16:00

10.8µm is more absorbed and backscattered by sand than 12.0µm
For sand or ash, reversed arc for the semitransparent pixels
MSG Natural RGB, 4-July-2003 10:00 UTC

Negative ch9-ch10:
Thermal inversions in humid valleys
Dust cloud
Ash silicates

The difference 10.8 µm -12.0 µm
is slightly negative > -2K for:
desert or clay surfaces under dry air
dust cloud
is positive < 15K for:
ocean ~ 2K
cloud or thin cloud
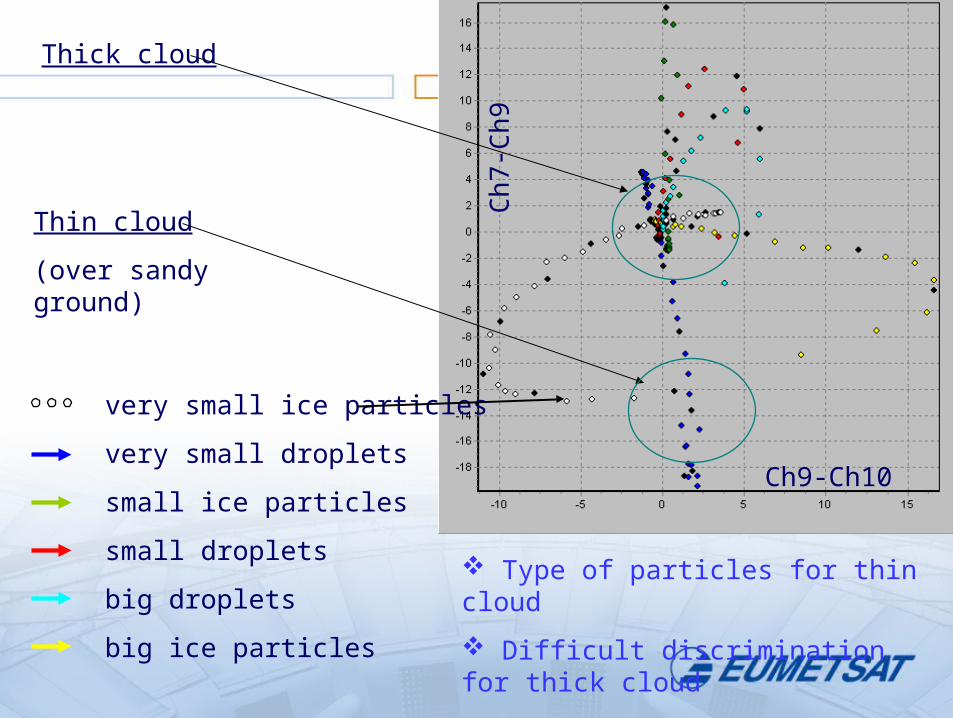
very small ice particles
very small droplets
small ice particles
small droplets
big droplets
big ice particles
Ch7
-Ch9
Ch9-Ch10
Thick cloud
Thin cloud
(over sandy ground)
Type of particles for thin cloud
Difficult discrimination for thick cloud
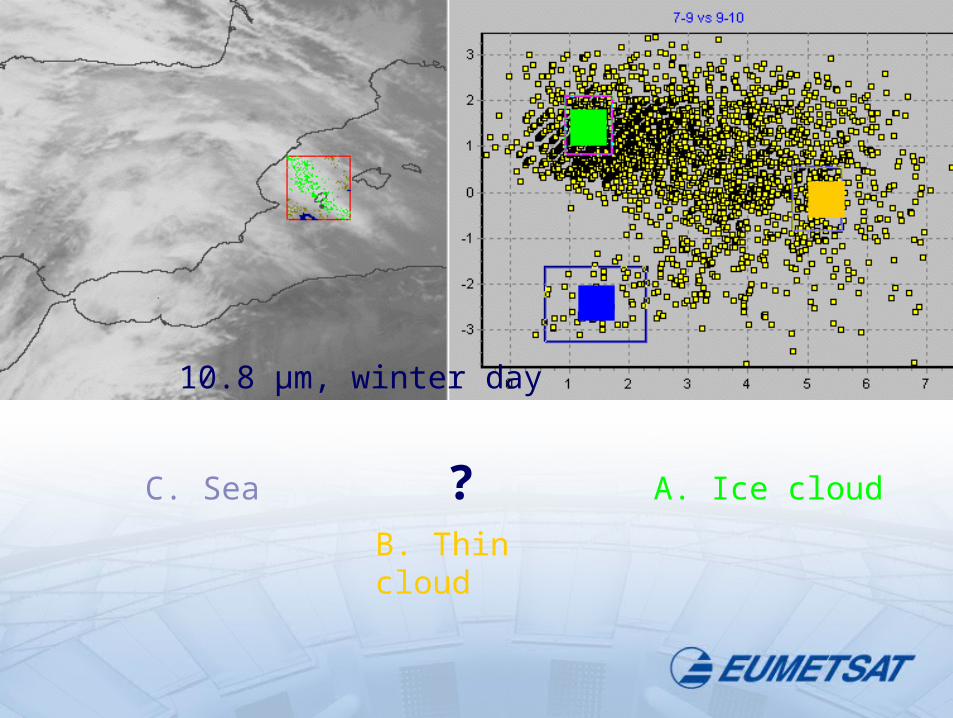
C. Sea
B. Thin cloud
A. Ice cloud?
10.8 µm, winter day
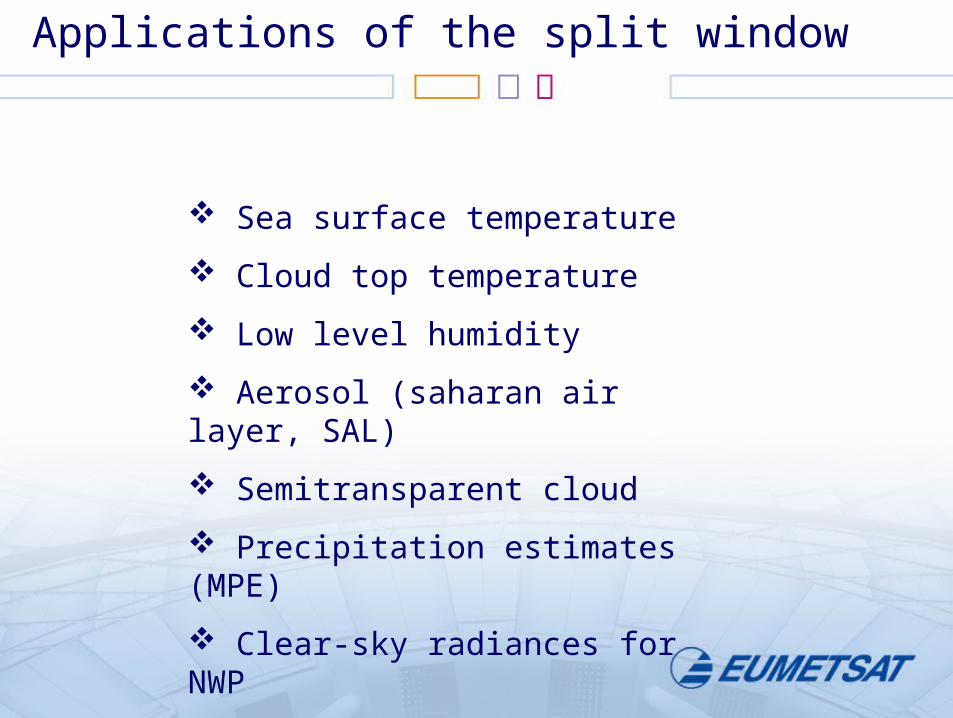
Sea surface temperature
Cloud top temperature
Low level humidity
Aerosol (saharan air layer, SAL)
Semitransparent cloud
Precipitation estimates (MPE)
Clear-sky radiances for NWP
Applications of the split window

Precipitation estimation
Multisensor Precipitation Estimate: IR calibrated with SSM/I
24 July 2005 14:00
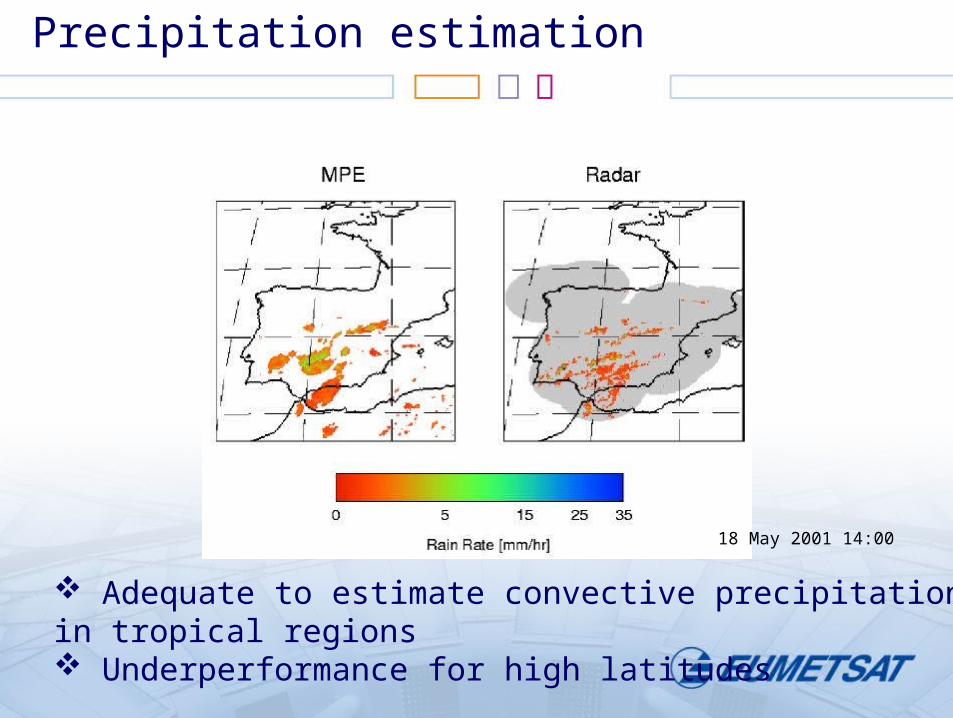
Precipitation estimation
Adequate to estimate convective precipitation in tropical regions Underperformance for high latitudes
18 May 2001 14:00

Sea Surface Temperature
-Clear areas, exclude ice areas because of uncertain emissivity.
-First approach: channel 10.8µm brightness temperature
-Correction for humidity ~ T10.8 - T12.0
-Correction for viewing angle (cosine of zenithal angle)
-Example: SST= 1.03 *T10.8 + 2.6 *(T10.8 - T12.0) - 10.0
(McClain et al. 1985)
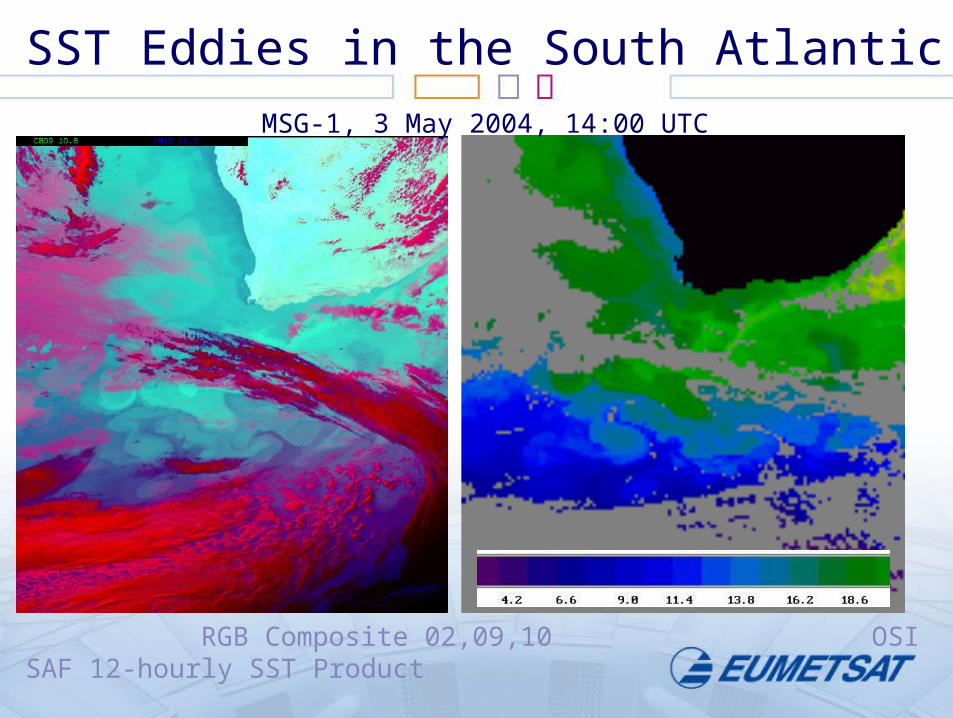
RGB Composite 02,09,10 OSI SAF 12-hourly SST Product
SST Eddies in the South Atlantic
MSG-1, 3 May 2004, 14:00 UTC

Ch9 – Ch10
6-March-2004
Sand front
(smooth
transition)
Low cloud
(sharper boundaries)

dust cloud
Channel 10.8 µm
14 July 03 12:00

Aerosol, ash, fumes
Ash and dust scatter mainly in the solar and near-infrared, but the split-window channels offer sharp differences
Small negative channel difference 10.8 µm - 12.0 µm identifies silicates and volcanic ash
Volcanic gases only show in the window channels, due to specific gas absorption: Channels 7.3µm and 8.7µm respond to SO2. At high level, the first is preferable. Negative channel difference (8.7 µm - 12.0 µm) identifies burnt sulphur compounds. Note: possible confusion of SO2 with desert surfaces or dust cloud
Over clear desert, the strong difference Ch7-Ch9 gets blurred by dust (more absorbing on 10.8 µm)
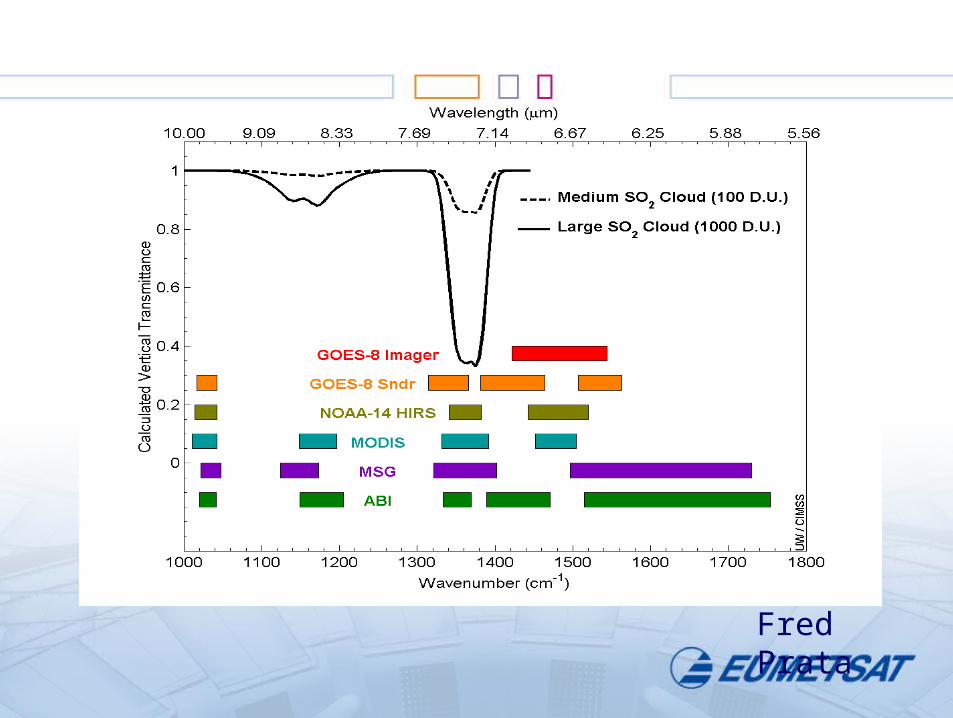
Fred Prata

Low level sulphur oxide shows a strong 7-9 difference. After reaching the high level it dilutes and the difference decreases.

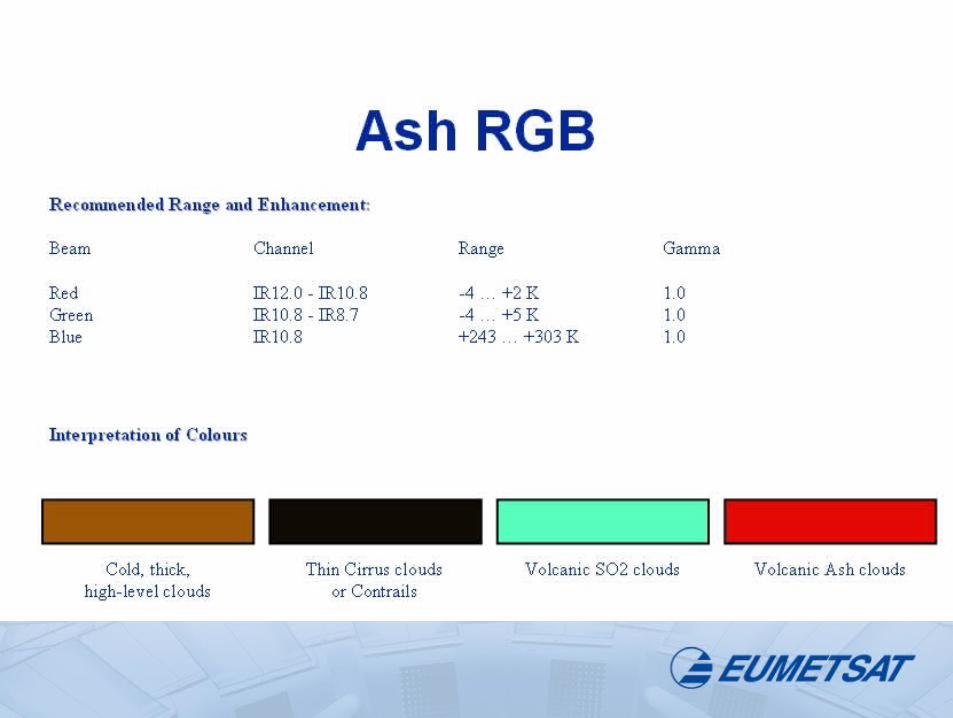
Ash RGB Product: Animation

Ash RGB Product
Eruption of
Karthala volcano
24-Nov-2005

Conclusions
Channels at 8.7µm, 10.8µm and 12.0µm provide information on cloud phase and height, even allow inferences on particle size for thin cloud
Those channels provide information on ground characteristics, in particular for discrimination of humid and arid areas
A novel application is the monitoring of sand and smoke clouds, as a major risk for air navigation and ground pollution


