
Application of imaging techniques to oral dosage forms.
Examples of in-situ imaging.Paolo Avalle
Merck Sharp & Dohme
(UK)

Introduction•
Direction of modern formulation efforts: –
improve the solubility of the drugs with effective formulation–
tune the drug release profile to meet the desired Pharmacokinetic criteria.
•
Focus of the talk:
use of imaging techniques as a characterization tool of drug-polymers system
•
Remit of imaging characterization techniques–
Provide surface and internal chemical imaging of the whole dosage form or of individual components on a macro-, micro-
or nanoscale.
–
Temporal and spatial mapping of the drug release from the tablet
matrix and obtaining novel mechanistic insights into the drug liberation phenomena.
–
Understanding the interplay between the underlying diffusion and
erosion mechanism of release and how these can be related to the solubility of the drug.

Agenda
•Mechanism of dissolution explored by imaging techniques
– NIR microscopy
– MRI
– Raman Microscopy
•Conclusions & Acknowledgements
•Backup slides–In situ NIR of high solubility drugs
•Chloropheniramine
maleate
•MK-2: Understanding Failure mode
–Optical microscopy: hydration of polymers.

NIR microscopy
•
Applications & Case studies:1. Distribution of API and excipients.
–
Formulation development: CR pellets–
Formulation troubleshooting CR pellets
2. In-situ NIR: Imaging the dissolution mechanism.–
Diffusion –
based systems (“high”
solubility)–
Erosion –based systems (low solubility)–
Failure mode of erosion based matrices
NIR spectroscopy•
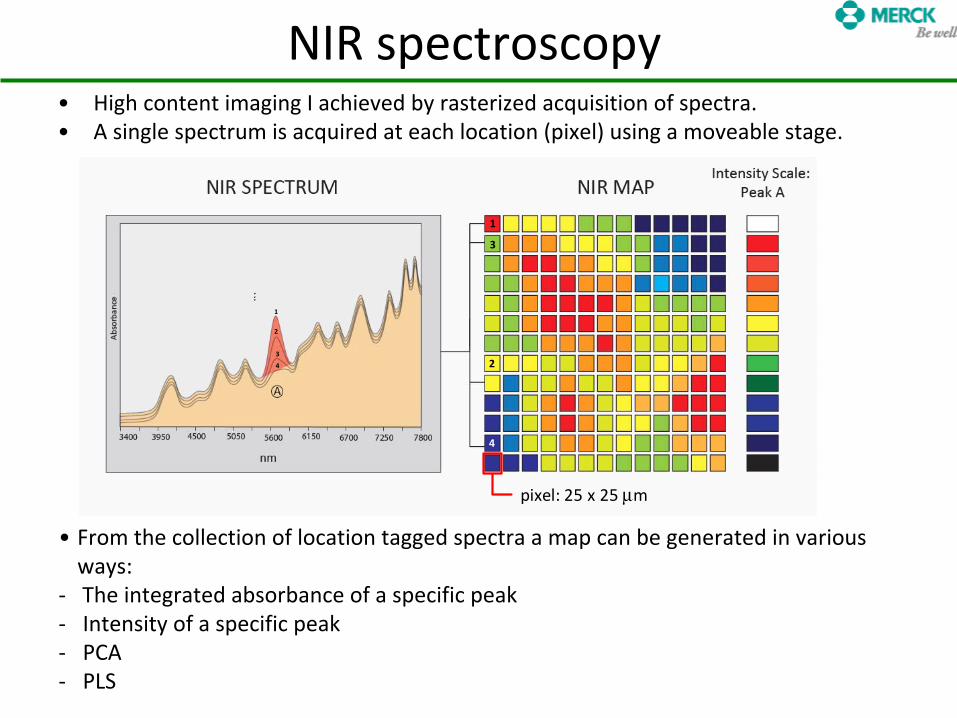
High content imaging I achieved by rasterized
acquisition of spectra. •
A single spectrum is acquired at each location (pixel) using a moveable stage.
•
From the collection of location tagged spectra a map can be generated in various ways:
-
The integrated absorbance of a specific peak-
Intensity of a specific peak-
PCA-
PLS
pixel: 25 x 25 μm
1
2
3
4
1
2
3
4
pixel: 25 x 25 μm
1
2
3
4
1
2
3
4
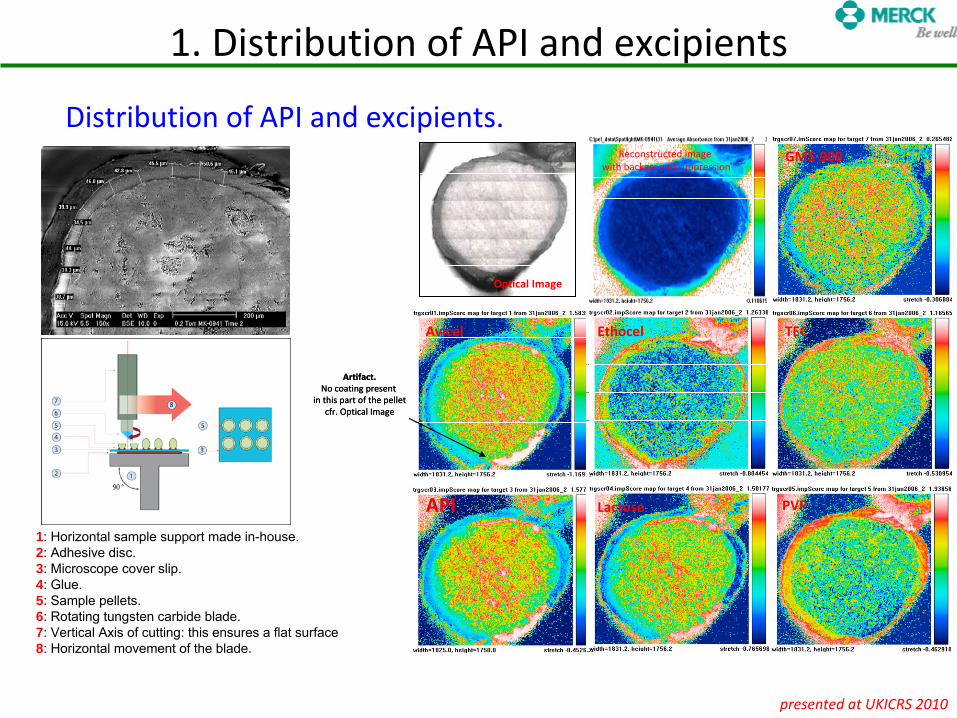
GMS-900
PVP
Optical Image
PVP
Avicel Ethocel TEC
API Lactose
Reconstructed image with background suppression
Artifact.No coating present
in this part of the pelletcfr. Optical Image
GMS-900
PVP
Optical Image
PVP
Avicel Ethocel TEC
API Lactose
GMS-900
PVP
Optical Image
PVP
Avicel Ethocel TEC
API Lactose
Reconstructed image with background suppression
Artifact.No coating present
in this part of the pelletcfr. Optical Image
presented at UKICRS 2010
Distribution of API and excipients.
1. Distribution of API and excipients
1: Horizontal sample support made in-house. 2: Adhesive disc. 3: Microscope cover slip. 4: Glue. 5: Sample pellets. 6: Rotating tungsten carbide blade. 7: Vertical Axis of cutting: this ensures a flat surface 8: Horizontal movement of the blade.
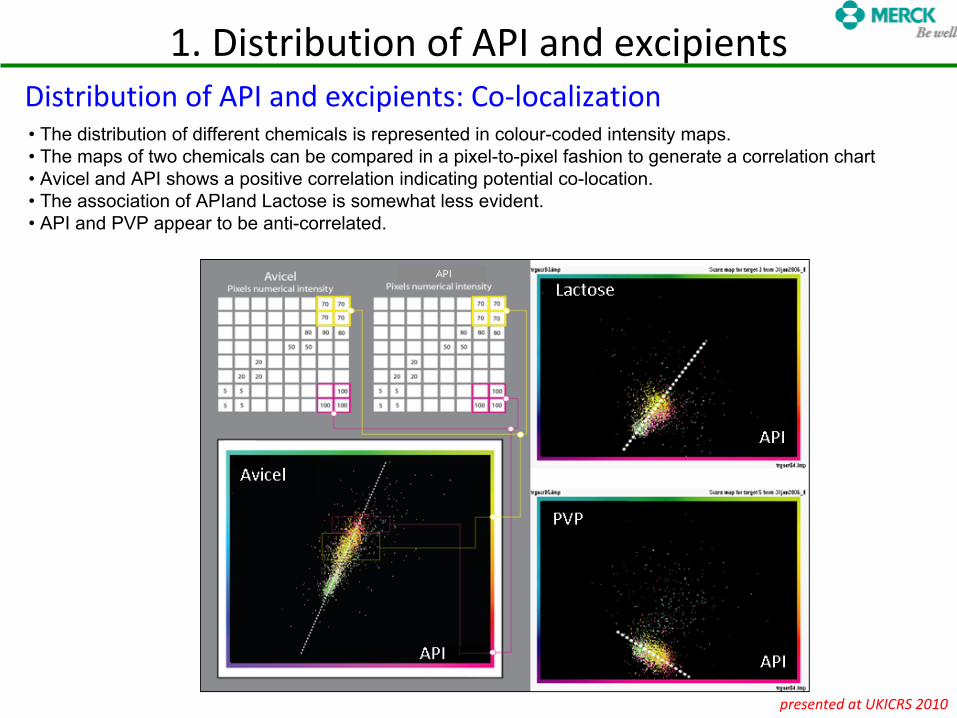
• The distribution of different chemicals is represented in colour-coded intensity maps. • The maps of two chemicals can be compared in a pixel-to-pixel fashion to generate a correlation chart • Avicel
and API shows a positive correlation indicating potential co-location. • The association of APIand
Lactose is somewhat less evident.• API and PVP appear to be anti-correlated.
1. Distribution of API and excipients
presented at UKICRS 2010
Distribution of API and excipients: Co-localization
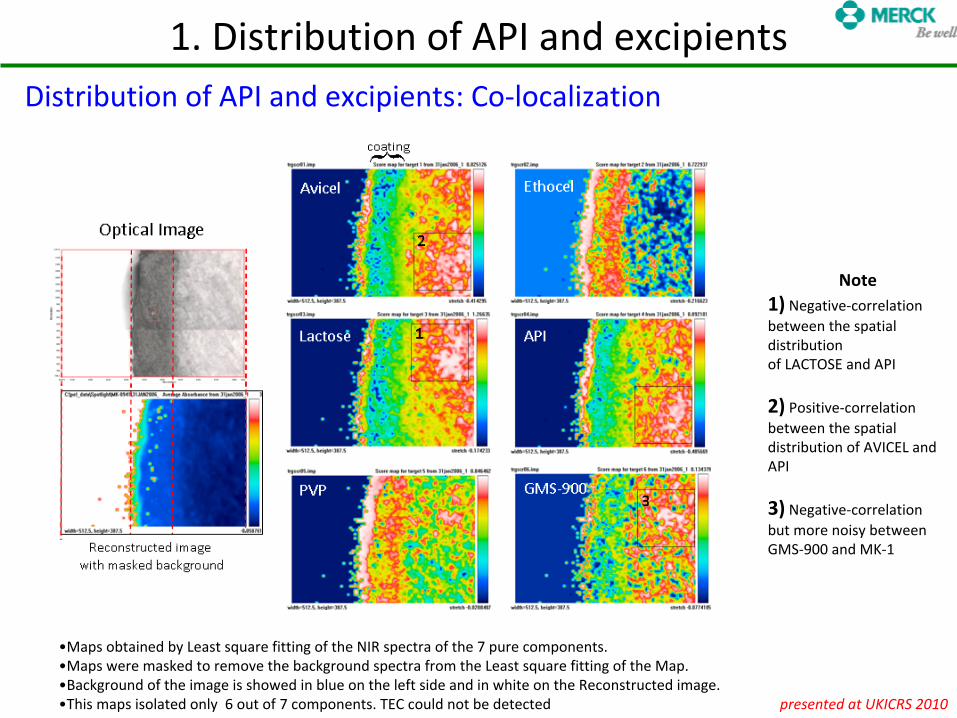
•Maps obtained by Least square fitting of the NIR spectra of the 7 pure components. •Maps were masked to remove the background spectra from the Least
square fitting of the Map. •Background of the image is showed in blue on the left side and in white on the Reconstructed image.•This maps isolated only 6 out of 7 components. TEC could not be
detected
Note1)
Negative-correlationbetween the spatial distributionof LACTOSE and API
2)
Positive-correlationbetween the spatial distribution of AVICEL and API
3)
Negative-correlationbut more noisy betweenGMS-900 and MK-1
1. Distribution of API and excipients
presented at UKICRS 2010
Distribution of API and excipients: Co-localization
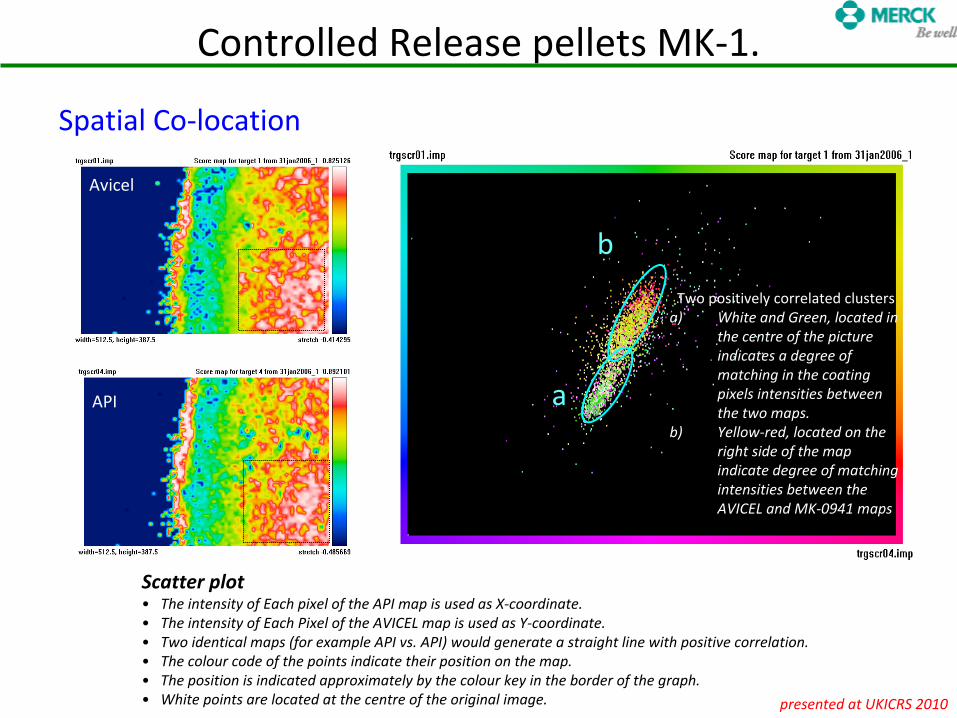
Scatter plot• The intensity of Each pixel of the API map is used as X-coordinate.• The intensity of Each Pixel of the AVICEL map is used as Y-coordinate.• Two identical maps (for example API vs. API) would generate a
straight line with positive correlation. • The colour code of the points indicate their position on the map.• The position is indicated approximately by the colour key in the border of the graph. • White points are located at the centre of the original image.
Avicel
API
Two positively correlated clustersa)
White and Green, located in the centre of the picture indicates a degree of matching in the coating pixels intensities between the two maps.
b)
Yellow-red, located on the right side of the map indicate degree of matching intensities between the AVICEL and MK-0941 maps
a
b
Controlled Release pellets MK-1.
Spatial Co-location
presented at UKICRS 2010

6100.0 5800 5600 5400 5200 5000 4800 4600 4400 4200 4000 3800.0-0.0256
-0.020
-0.015
-0.010
-0.005
0.000
0.005
0.010
0.015
0.0196
cm-1
A
6100.0 5800 5600 5400 5200 5000 4800 4600 4400 4200 4000 3800.0-0.0139
-0.012
-0.010
-0.008
-0.006
-0.004
-0.002
0.000
0.002
0.004
0.006
0.008
0.010
0.012
0.014
0.016
0.018
0.020
0.022
0.024
0.026
0.0278
cm-1
A
6100.0 5800 5600 5400 5200 5000 4800 4600 4400 4200 4000 3800.0-0.0108
-0.008
-0.006
-0.004
-0.002
0.000
0.002
0.004
0.006
0.008
0.010
0.012
0.014
0.016
0.018
0.0199
cm-1
A
6100.0 5800 5600 5400 5200 5000 4800 4600 4400 4200 4000 3800.0-0.0256
-0.020
-0.015
-0.010
-0.005
0.000
0.005
0.010
0.015
0.0196
cm-1
A
6100.0 5800 5600 5400 5200 5000 4800 4600 4400 4200 4000 3800.0-0.180
-0.16
-0.14
-0.12
-0.10
-0.08
-0.06
-0.04
-0.02
0.00
0.02
0.04
0.06
0.08
0.10
0.12
0.140
cm-1
A
6100.0 5800 5600 5400 5200 5000 4800 4600 4400 4200 4000 3800.0-0.0157
-0.014
-0.012
-0.010
-0.008
-0.006
-0.004
-0.002
0.000
0.002
0.004
0.006
0.008
0.010
0.012
0.014
0.0156
cm-1
A
1. Distribution of API and excipients
Formulation troubleshooting CR pellets: PLS data representation
FITACTUAL
FITACTUAL
FITACTUAL
FITACTUAL
FITACTUAL
FITACTUAL
presented at UKICRS 2010

Scheme for tablet hydration.-
swelling. -
drug migration vs. dissolution -
polymer dissolution within a controlled release formulation.
The particle labelled ‘A’
indicates the drug. While it is commonly accepted that swelling is subsequent to permeation and hydration of the tablet the extent of those event and the extent of drug migration vs. dissolution is largely dependent on the solubility of the drug and the viscosity of the polymer. Together, these parameters modulate the release profile.
2. In-situ NIR: Imaging the dissolution mechanism
Basic Concepts

TABLETS:400 mg, 8 mm, flat-faced tablets containing 125 mg dose of a low solubility drug (MK-1), IN FLOW ANALYSIS:A bespoke tablet hydration cell enabled the acquisition of NIR data during the dissolution process.
RESULTSEXPERIMENT SET-UP
• Image Size: 3000 x 1000 µm• Pixel Size: 25 µm• Scan Time: ~ 18 min• Scan Frequency: Every 30 min
•Medium: Deionised Water•Temperature: 37°C•Flow Rate: 10 mL/min
2. In-situ NIR: Imaging the dissolution mechanism

The subsequent acquisition of spectral map and their processing Allow to follow the evolution of the API signal and the HPMC signals.
0’ 10’ 20’ 30’ 40’ 50’ 60’ 180’120’90’
dry
HPMC
API
2. In-situ NIR: Imaging the dissolution mechanism
European Journal of Pharmaceutical Sciences 43(5) 400-408
Diffusion based systems:
: comparing two diffusion-based formulation

Fast
Slow
Fast
Slow
Fast
Slow
The hydration profiles exhibited several trends: 1.
An apparent high intensity plateau, corresponding to a uniform distribution of HPMC (dry tablet core) 2.
A sloped region indicative of a decreasing drug/HPMC concentration across the pseudo-gel layer 3.
A plateau of low intensity arising from the bulk of the hydration medium.
Drug and HPMC profiles from the fast and slow formulations As the tablet was exposed to the hydration media, polymer relaxation occurred and the HPMC began to swell and hence the increment in the intensity profile became progressively sloped as a consequence.
2. In-situ NIR: Imaging the dissolution mechanismDiffusion based systems:
: comparing two diffusion-based formulation
European Journal of Pharmaceutical Sciences 43(5) 400-408

The erosion, swelling and API dissolution front for both formulation SLOW AND FAST with data modellingThe data were modelled using the equation first proposed by Peppas
and Sahlin
to describe solute
release from polymeric devices, where FP indicates the Front Position (either (i) the erosion front, (ii) the swelling front or (iii) the API front). FP is expressed in microns.
2. In-situ NIR: Imaging the dissolution mechanismDiffusion based systems:
: comparing two diffusion-based formulation
European Journal of Pharmaceutical Sciences 43(5) 400-408
mm tktkFP 221 +=
mm tktkFP 221 +=

• Image Size: 6000 x 2000 µm• Pixel Size: 25 µm• Scan Time: ~ 18 min• Scan Frequency: Every 30 min
•Medium: Deionised Water•Temperature: 37°C•Flow Rate: 10 mL/min
Component %
API (MK-1) 31.25
HPMC K4M 20.00
Avicel PH102 47.75
Magnesium Stearate
1.00
In-situ NIR: Imaging the dissolution mechanism
In-situ and in-flow imaging experiments
Erosion –based systems: Low solubility / non homogeneous formulation
European Journal of Pharmaceutical Sciences 43(5) 400-408

STEP by STEP processing roadmap
Black = experimental spectrum (PLS target) Blue = PLS Fit
Load *.fsm in Transmittance
Load *.fsm in Transmittance
Reload
*.fsm file
Load masked .fsm
in Absorbance
Process /
DerivativeProcess / PCA
“20 factors”
Review Targets
Reload
masked .fsm file
Process / LSQ Fit
Load Target
SpectraProcess / Subtract Average 7800-3800
Process / Range
7800-3800
Process / Derivative
Load Target
SpectraProcess / Subtract Average 7800-3800
Process / Range
7800-3800
Review LSQ Fit
Masking
PLS Fitting
API HPMC AVICEL
Since the fitting obtained from the PLS is very good the representation of API, HPMC, and AVICEL maps Is to be considered valid and accurate.
Process / PCA “10 factors”
Process / Mask
Process / PCA “20 factors”
and spatial masking “ALL”
In-situ NIR: Imaging the dissolution mechanism
Presented at UKPharmSCI
2011, paper in progress

API Maps from PLS30’ 60’ 90’ 120’ 150’ 180’ 210’ 240’
#1
#2
#3
30’ 60’ 90’ 120’ 150’ 180’ 210’ 240’HPMC Maps from PLS
In-situ NIR: Imaging the dissolution mechanism
• Undissolved
API is present up to 3 hours and seems to migrate in the gel Layer• Can we zoom in and follow closely the fate of API particles?
Erosion –based systems: Low
solubility / non homogeneous formulation
Presented at UKPharmSCI
2011, paper in progress

API depletion and hydration profiles from PLS API maps
selective enhancement
8 bit Blue ChannelconversionR3 240’
8 bitGrayscaleconversion R3 240’
R1
R2
R3
R1
R2
R3
API depletionHydration
In-situ NIR: Imaging the dissolution mechanism
Presented at UKPharmSCI
2011, paper in progress

Mechanism of release: Swelling and Erosion fronts.
Physical tablet boundary
PLS API mapR2 30’
PLS API mapR2 240’
Is it possible to further explore the NIR maps and gain a better
understanding at a more microscopic level of the mechanism of release?
Presented at UKPharmSCI
2011, paper in progress

R1 R2 R3
ZOOM-IN on EROSION AND DISSOLUTION FRONTS
Mechanism of release: Swelling and Erosion fronts. Source of error bars
Physical tablet boundary
R2 30’
EROSION FRONT
SWELLINGFRONT
Presented at UKPharmSCI
2011, paper in progress

API / HPMC
Spatial Co-location of API and HPMC• API and HPMC are clearly co-located •Their distribution is not mutually exclusive within the section sampled by NIR• co-location can be applied to the PLS images to create a superposition map of API and HPMC.•Thresholding
can be judiciously chosen to optimize the API particles separation contrast
PLS IMAGES
API
HPMC
http://rsbweb.nih.gov/ij/plugins/colocalization.html
Contrast enhancement of PLS API/HPMC intensity maps
Presented at UKPharmSCI
2011, paper in progress

•
This approach enables the editing of a sequence of images •
The gel layer region (dark green) show low API concentration, and progressive dissolution.
•
However larger aggregates of API (yellow) remains unchanged even
when fully “immersed”
in the gel Layer (240’).•
This colour band discrimination makes the images amenable to further analysis.
30’ 60’ 90’ 120’ 150’ 180’ 210’ 240’
GELerosion
swelling
Contrast enhancement of PLS API/HPMC intensity maps
Presented at UKPharmSCI
2011, paper in progress

1 1
NIR post PLS
NIR post PLS
API-HPMCcorrelation
API-HPMCcorrelation
2 2 2 2 2 2
API distribution time course
• From the correlation maps it is possible to further filter out
the signal of the pure APIgenerating a highly contrasted image that enable single particle
tracking.
• The comparison between the post-PLS (A), post Colocalization
(B) and thresholding
(C)shows that the signal of API distribution is retained throughout the processing.
•
The highly contrasted images enable the study of the evolution
of single API particle (or clusters of)
A AB BC C
1
30’ 60’ 90’ 120’ 150’ 180’ 210’
2
240’Two different particles are tracked (1) and (2)
2
Contrast enhancement of PLS API/HPMC intensity maps: Single particle tracking
Presented at UKPharmSCI
2011, paper in progress

30’ 60’ 90’ 120’
150’ 180’ 210’ 240’
Single particle tracking : Particle 1
Presented at UKPharmSCI
2011, paper in progress

30’ 60’ 90’ 120’
150’ 180’ 210’ 240’
1. Aggregation
2. Migration 3. Disintegration
Blue contour: indicated the particle frame at 120’
minutes chosen as reference. The aggregation process occurring in the first 90 minutes, seems
to have stopped and the migration process of the whole particle will dominate for the subsequent 90 minutes before significant erosion will takes place.
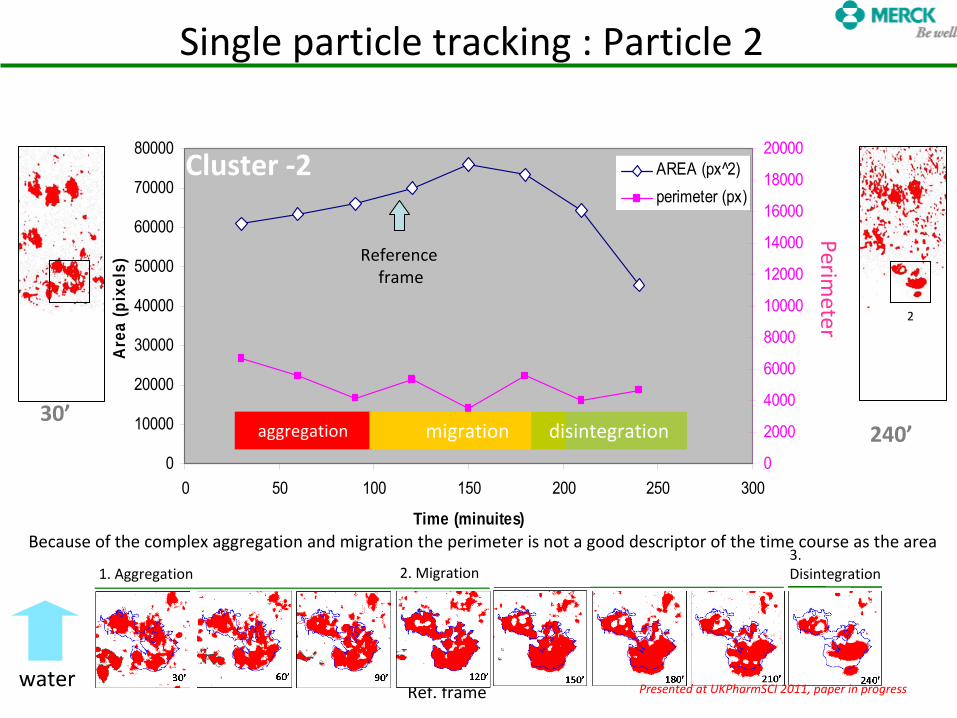
Single particle tracking : Particle 2
Presented at UKPharmSCI
2011, paper in progress

30’ 60’ 90’ 120’ 150’ 180’ 210’ 240’
0
5000
10000
15000
20000
25000
0 50 100 150 200 250 300
time (minutes)
ARE
A (p
x^2)
0
500
1000
1500
2000
2500
PER
IME
TER
(px)
area (px 2̂)perimeter (px)
Particle -1
dissolved
Particle -1 show a a dissolution behaviour, fragmentation is also visible.Blue line: initial particle outline. Red area: actual particle at each time point.
water
Single particle tracking : Particle 1
Presented at UKPharmSCI
2011, paper in progress
Ref. frame
Because of the complex aggregation and migration the perimeter is not a good descriptor of the time course as the area
0
10000
20000
30000
40000
50000
60000
70000
80000
0 50 100 150 200 250 300
Time (minuites)
Area
(pix
els)
0
2000
4000
6000
8000
10000
12000
14000
16000
18000
20000AREA (px^2)perimeter (px)
aggregation migration disintegration
Reference frame
Perimeter
Cluster -2
2
240’30’
1. Aggregation 2. Migration3. Disintegration
water
Single particle tracking : Particle 2
Presented at UKPharmSCI
2011, paper in progress

•In-situ MRI-
Acquisition of MRI data during the dissolution,
-
Hyphenation of USP-IV dissolution with MRI.

Hyphenation of USP-IV dissolution with MRI.
NMR spectrometerPeristaltic
pump SGF
USP-IVFlow-through cell
x
yz
Imaging plane
FaSSIF
22.6 mm
Lescol®
XL tablet
In-situ MRI
0.0
0.2
0.4
0.6
0.8
1.0
0 5 10 15 20
Standard USP-IV experiment
In line UV measurement
UV
abs
orpt
ion
(a.u
.)
Time (h)
IN PRESS: Journal of Controlled Release

In-situ MRI
Fluvastatin
1
2
3
Fluvastatin
1
2
3
pKa1 = 4.27pKa2 = 13.98pKa3 = 14.96
Formulation composition- 84.24 mg Fluvastatin
Sodium, - 8.42 mg Potassium Bicarbonate, -
111.26 mg Avicel, 4.88 mg Povidone, -
16.25 mg HPC (Klucel
HXF),-
97.5 mg HPMC (K100 LV), -
2.44 mg MgSt, -
9.75 mg Opadry
Yellow (coating)
Hyphenation of USP-IV dissolution with MRI. LESCOL XL
IN PRESS: Journal of Controlled Release
In-situ MRI
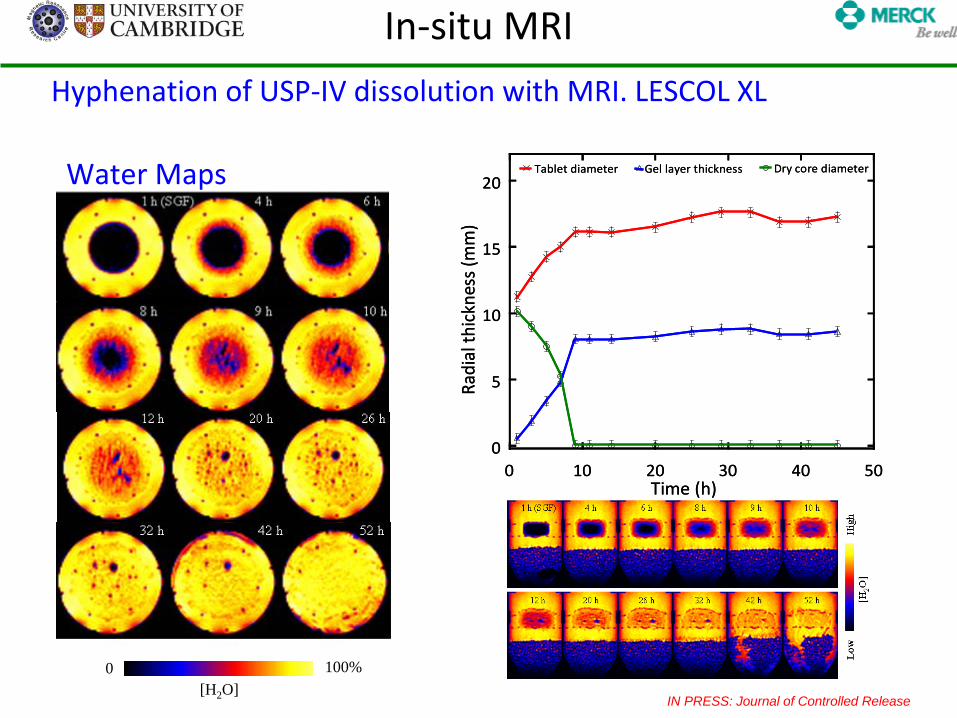
Hyphenation of USP-IV dissolution with MRI. LESCOL XL
Water Maps
0
5
10
15
20
0 10 20 30 40 50
Dry core diameterGel layer thicknessTablet diameter
Radi
al th
ickn
ess
(mm
)Time (h)
0
5
10
15
20
0 10 20 30 40 50
Dry core diameterGel layer thicknessTablet diameter
Radi
al th
ickn
ess
(mm
)Time (h)
0 100%[H2 O]
IN PRESS: Journal of Controlled Release

In-situ MRI
Hyphenation of USP-IV dissolution with MRI. LESCOL XL
T2
relaxation mapsT2-relxation maps shown indicate a quite different behaviour:
-
The structural integrity of the tablet
remains intact, even after 42 hours.
-
This indicates that the gel erosion process is now slow and evenly distributed.
-
Collectively, figures 3 and 4 show that after 42 hours the gel matrix was highly hydrated and distributed.
IN PRESS: Journal of Controlled Release

(a) (b)
In-situ MRI
Hyphenation of USP-IV dissolution with MRI. LESCOL XL
19F Signals: Combining imaging with high resolution spectroscopy
IN PRESS: Journal of Controlled Release

Raman Microscopy
•
Applications & Case studies:
1. API polymorphic changes during dissolution
2. Analysis of enabled formulations

Background: API behaviour in water: 250 uL
cell
T=0h
T=4h
Raman MicroscopyAPI polymorphic changes during dissolution

-2
0
2
4
6
8
1
2
4
6
2
950 960 970 980 990 10000
2
4
6
8
3
Raman Shift (1/cm)950 960 970 980 990 1000
0
5
10
15
204
Tablet: 10mg dose Uncoated
Hydrated
Raman: API polymorphic changes during dissolution
Anhydrous
API polymorphic changes during dissolution
Multivariate Analysison mapped area post 4 h in water
Water ingress
Water ingress

Conclusions
•
Imaging: Seeing is believing.
•
Current and more complex formulation do require more sophisticated analysis techniques.
•
API dissolution need to be supported by more sophisticated test to ensure that the mechanism of drug dissolution is known and stable over time.

Acknowledgements & Credits
•
Rob Saklatvala
•
Brett Cooper
•
Sam Pygall
•
Agnieszka
Jamstreszka
•
Katryn
Bradley
•
Nick Gower
•
Jonathan Pritchard
•
Dr. Mick Mantle
•
Qilei
Zhang
•
Prof. Lynn Gladden

BACKUP

Optical Microscopy
•
Widely used!–
Paolo Colombo demonstrated the gel layer growth and the evidence of
–
Colin Melia

Swelling rate of: HPMC K4M, HPMC K100LV, PEO301, PEO1105
Correlation with in the physicochemical properties of the polymers.
Based on the approach of Gao
and Meury
and Paolo Colombo
(Colombo et al, 1999, Colombo et al, 1996, Li et al, 2005, Kiil
and Dam-Johansen, 2003, Gao
and Meury
et al. 1996)
Optical Microscopy
HPMC K4M HPMC K100LV PEO 301 PEO 1105
60’
120’
180’
0’
(Colombo et al, 1999) (Avalle, Pygall
Pritchard, Jamstrenzka
-
MSD, Unpublished)

Previous work findings:
1.
For a low solubility drug (MK-1) There is differing behaviour
with respect to drug release from CR matrices based on PEO and HPMC
2. The mechanism and the extent
of drug and polymer dissolution varies greatly upon the polymer used
•Evaluating the performance of poly(ethylene
oxide) (PEO), hydroxyethylcellulose
(HEC) and hydroxypropy
methylcellulose (HPMC) in erosion-based hydrophilic matrices for low solubility drugs –
(Pygall
et al.
in preparation)T im e (h o u rs )
0 5 1 0 1 5 2 0
% d
rug
rele
ase
0
1 0
2 0
3 0
4 0
5 0
P E O 1 1 0 5P E O 3 0 1H E C 2 5 0H P M C K 4 MH P M C K 1 0 0 L V
Drug release from matrices-
125 mg of compound (MK-1 )-40% polymer
USP apparatus II dissolution test at 100 rpm, 37±1°C. Mean values (n=3) ±
1SD
Optical Microscopy

original tablet boundary
Raw Image: Light intensity expressed as a gray scale 0-255 (black to white)
Numerical average: each column of pixel is averaged for each position. Each column give one point on the chart. A &B indicates swelling and erosion front positions
-10
10
30
50
70
90
110
-30-200-1000100200300400500
position (microns)
Nor
mal
ized
sig
nal i
nten
sity Physical tablet
boundary @ t0
Time course: The process is repeated for each time point.From this plot we can calculate the erosionand swelling front A & B
60’
0
20
40
60
80
100
120
-400-300-200-1000100200300400500600
Physical tablet boundary @ t0Erosion front
Swelling front
-300
-200
-100
0
100
200
300
400
500
600
0 50 100 150 200
time (minutes)
POSI
TIO
N
SWELLING FRONTEROSION FRONT
Physical tablet boundary @ t0
Physical tablet boundary @ t0
0’
149’
49.5’
(not all curves are displayed)
The movement of the front position can be plotted as function of time.
A
B
The fronts position are taken fromThe mean intensity of the 2 inflection points (A) and (B)
Optical Microscopy

PEO1105PEO301
HPMC K100LVHPMC K4M
HPMC K4M HPMC K100LVPEO301PEO1105
•The gel layer for each polymer matrix system clearly shows the development of different gel layer morphologies •With concomitant discrimination of swelling and erosion front profiles
•The PEO polymers expand rapidly and continue to expand over the next 2 hours.•The HPMC polymers expand then slows down after the first hour.•The larger particle size and lower compressibility of PEO leads to faster gel layer formation compared to HPMC with smaller particle sizes and higher compressibility. •The fast initial wetting and swelling of PEO implies that they are more hygroscopic than HPMC. This may be due to the hydrophobic methoxyl
group in HPMC, or to the lower compressibility index, allowing the polymer to hydrate faster.
Optical microscopy RESULTS
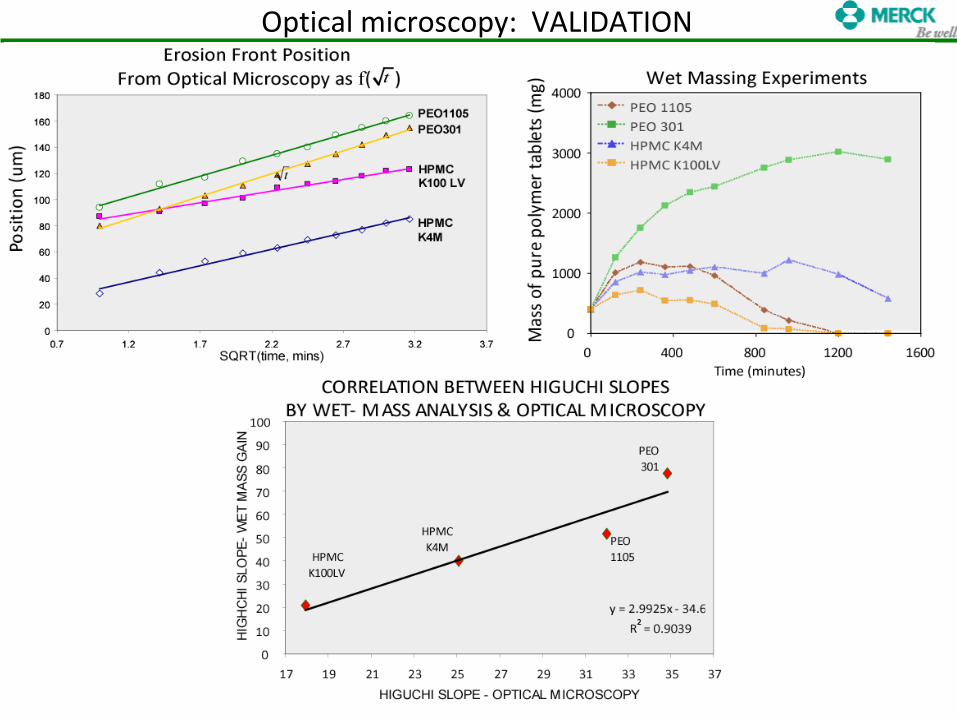
Optical microscopy: VALIDATION
IN SITU NIR OF HIGH SOLUBILITY DRUGS
•
Chloropheniramine
maleate
•
MK-2: Understanding Failure mode

Chloropheniramine
maleate
CHLOROPHENIRAMINE MALEATE vs ACETYL SALICYLIC ACIDDissolution of 6.4 mm Flat Disc Tablets into Water Using Baskets
0
20
40
60
80
100
120
0 5 10 15 20
Time (hrs)
% C
laim
Case 2: highly soluble drug in a non-homogeneous formulations
CHLOROPHENIRAMINEThe movement of HPMC gel fronts with time
-2000
-1500
-1000
-500
0
500
1000
1500
0 100 200 300 400
time (min)
front
pos
ition
(mic
rons
)
Erosion frontSwelling front
5.5 g/L solubility in waterFormulation:10% drug loading, 20% HPMC
2. In-situ NIR: Imaging the dissolution mechanism

Mapping chloropheniramine
maleate
0’
60’
4175μm
3250μm
PLS images for HPMC Water front movement
Erosion –based systems: High solubility / non homogeneous formulation

Mapping chloropheniramine
maleate
Time (minutes)
Posi
tion
(mic
rons
)
Posi
tion
(mic
rons
)
0
1000
2000
3000
4000
5000
6000
7000
0 10 20 30 40 50 60 70
0
50
100
150
200
250
300
350
Area
Perim.
-800
-700
-600
-500
-400
-300
-200
-100
0
0 10 20 30 40 50 60 70
WATER FRONT MOVEMENT AREA & PERIMETER DEPLETION
Time (minutes)
ARE
A
Peri
met
er
Frame 1
Frame 1
y = 0.1143x + 98.557R2 = 0.9951
0
20
40
60
80
100
120
-800 -600 -400 -200 0
water front movement
% o
f par
ticle
dep
lete
d (p
erim
eter
)
0
10'20'
30'40'50'
60'
PERIMETER & FRONT MOVEMENT
Erosion –based systems: High solubility / non homogeneous formulation

Understanding Failure Mode

0
10
20
30
40
50
60
70
80
90
100
110
0 2 4 6 8 10 12 14 16 18 20Time / hours
% L
abel
Cla
im
Understanding Failure modes
The problem
□
NON STRESSED●
STRESSED 1 week 40°C / 75% RH
•
MK-2 is an erosion based controlled release formulation, with a high load of a highly soluble, but slowly dissolving molecule.•
Hypothesis: given the high drug loading the shift in dissolution could be caused by changes in the API.
Failure mode of erosion based matrices

Understanding Failure modes
Approach: replace the API with another of similar properties and study the dissolution
0
10
20
30
40
50
60
70
80
90
100
110
0 2 4 6 8 10 12 14 16 18 20Time / hours
% L
abel
Cla
im
6 % K100M_ Niacin - Initial6 % K100M_ Niacin - 1 week at 40/75 open6 % K100M_Caffeine - 1 week at 40/75 open6 % K100M_Caffeine - Initial6 % K100M_Caffeine - 1 week at 50/75 open
MK-2 NON STRESSED
MK-1 STRESSED 1 w 40°C / 75% RH
Caffeine STRESSED 1 w40°C / 75% RH
Caffeine NON STRESSED
Caffeine 1 week at 50/75
Failure mode of erosion based matrices

•
The stressed formulation showed a much more rapid and deeper -initial-
erosion which is then followed by a long period in which the dissolution appear slower.
•
This is confirmed by both MK-2 release signal and water penetration signal
Understanding Failure modes
NIACIN SIGNAL
H2O
H2O
H2O
H2O
H2O
H2O
H2O
H2O
H2O
H2O
H2O
H2O
TABLET CORE
TABLET CORE
NIACIN SIGNAL
H2O
H2O
H2O
H2O
H2O
H2O
H2O
H2O
H2O
H2O
H2O
H2O
TABLET CORE
TABLET CORE
MK-2 signal: faster tablet erosion in stressed tablets
Failure mode of erosion based matrices

MK-2: Rate of Water penetrationfaster in stressed tablets
Physical tablet boundary
Understanding Failure modesFailure mode of erosion based matrices

Caffeine: Stressed vsUnstressed tablets
Caffeine was used as a control for MK-2 NIR in-situ work; data processing was applied as for Niacin-based formulation (MK2) And data showed no difference in API and
water penetration rates between stressed and unstressed
Understanding Failure modesFailure mode of erosion based matrices

-1-
Significant erosion for stressed Niacin formulations-2-
No gross changes in the position of dissolution and erosion fronts for Caffeine
Understanding Failure modesFailure mode of erosion based matrices

Conclusion (seeing is believing)
NON STRESSED MK-2 STRESSED MK-2
Time lapse photography: Schematics
Pharmaceutical Research, Vol. 17, No. 10, 2000
Sequential Layer model Siepman Peppas 2000
NON STRESSED MK-2 STRESSED MK-2
Time lapse photography: Schematics
Pharmaceutical Research, Vol. 17, No. 10, 2000
Sequential Layer model Siepman Peppas 2000
Failure mode of erosion based matrices


