
APEC Demand and Supply Outlook 5th Edition
A Preliminary APERC View
5 March, 2012
APERC Workshop, Kuala Lumpur
Ralph D. Samuelson Vice President
Asia Pacific Energy Research Centre
1

• In 2009, APERC published the APEC Energy Demand and Supply Outlook 4th Edition
• Work now underway on the 5th edition, to be published in late 2012
APEC Energy Outlook
2

• A 25 year look ahead (2010-2035) assuming business-as-usual and several alternative cases
• Project energy supply by fuel and demand by sector, electricity generation by fuel; installed generation capacity, CO2 emissions, energy intensity
• Published in two volumes: – Volume 1: Mainly sector discussions– Volume 2: Mainly individual economy discussions
• Draws on expertise of APERC researchers as well as other expert advice
Outlook 5th Edition Description
3

• Entirely new modelling software has been developed• Preliminary business-as-usual projections have been
estimated for all economies. • A thorough internal review of the business-as-usual
projections for each economy is now underway.• Software to summarize and graph key results by
economy, by region, and APEC-wide has been developed• APERC researchers are currently writing the Volume 2
sections, which discuss the results for each economy.
The Progress So Far
4

• Alternative cases to business-as-usual will be developed over the next few months and included in the Outlook
• Writing of Volume 1 and the remaining writing of Volume 2, including editing by a professional editor
• Peer reviews of the results for each economy will be invited through APEC EGEDA representatives late this year
• The complete Outlook is expected to be published by the end of the year
Remaining Tasks
5

South Pacific Business-As-Usual
6

South Pacific Will Be a Rapidly Growing Gas Producer and Exporter
7
-600
-400
-200
0
200
400
600
1990
1995
2000
2005
2010
2015
2020
2025
2030
2035
Pro
du
ctio
n a
nd
Imp
ort
(MT
OE
)
Coal Oil Gas Coal Imports Oil Imports Gas Imports

Gas and NRE Have Growing Roles in South Pacific Electricity Generation
8
65% 67% 71% 69%64%
57%52% 51% 51% 50%
11% 9%10% 14%
18%27%
31% 31% 30% 32%
20% 21% 16% 13% 12% 10% 10% 10% 10% 10%
6% 7% 8% 9% 9%
1990 1995 2000 2005 2010 2015 2020 2025 2030 2035
Coal Oil Gas Hydro NRE Nuclear Import

And Growth in South Pacific Primary Energy Demand is in Lower-Emissions Fuels
90
20
40
60
80
100
120
140
160
180
1990 1995 2000 2005 2010 2015 2020 2025 2030 2035
MT
OE
Coal Oil Gas Hydro NRE Nuclear Electricity-Net Import

Consequently, South Pacific CO2 Emissions Almost Level Off
100
50
100
150
200
250
300
350
400
450
500
1990 1995 2000 2005 2010 2015 2020 2025 2030 2035
Mil
lio
n T
on
nes
CO
2
Coal Oil Gas
Southeast Asia Business-As-Usual
11

Southeast Asia Energy Demand Will Grow Quickly
120
200
400
600
800
1000
1200
1990 1995 2000 2005 2010 2015 2020 2025 2030 2035
MT
OE
Industry Other Non-Energy Domestic Transport International Transport
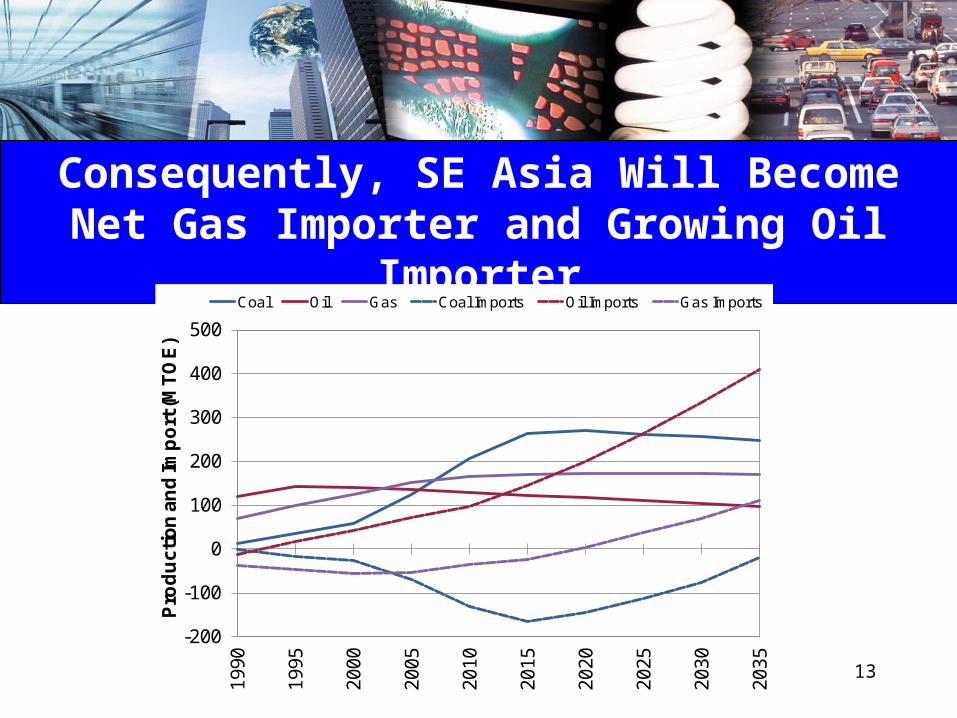
Consequently, SE Asia Will Become Net Gas Importer and Growing Oil Importer
13
-200
-100
0
100
200
300
400
500
1990
1995
2000
2005
2010
2015
2020
2025
2030
2035
Pro
du
ctio
n a
nd
Imp
ort
(MT
OE
)
Coal Oil Gas Coal Imports Oil Imports Gas Imports
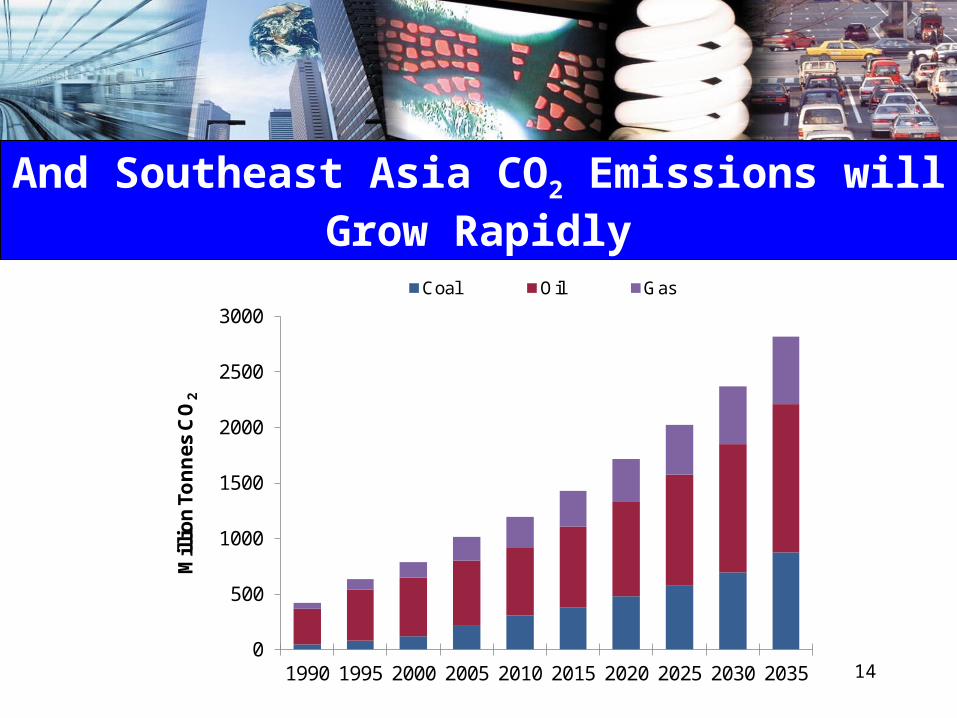
And Southeast Asia CO2 Emissions will Grow Rapidly
140
500
1000
1500
2000
2500
3000
1990 1995 2000 2005 2010 2015 2020 2025 2030 2035
Mil
lio
n T
on
nes
CO
2
Coal Oil Gas

North America Business-As-Usual
15

North America Will Increase Oil and Gas Production
16
-400
-200
0
200
400
600
800
1000
1200
1990
1995
2000
2005
2010
2015
2020
2025
2030
2035
Pro
du
ctio
n a
nd
Imp
ort
(MT
OE
)
Coal Oil Gas Coal Imports Oil Imports Gas Imports

N.A. Gas and Renewables Have Increased Roles in Electricity Generation
17
48% 47% 49% 46% 44%39% 36% 33% 30% 28%
11% 13%14% 17%
20%22%
23%25% 28% 31%
15% 16%13% 13%
13%13% 13% 12% 12% 12%
7% 10% 11% 12% 12%
19% 20% 19% 18% 19% 18% 18% 18% 17% 17%
1990 1995 2000 2005 2010 2015 2020 2025 2030 2035
Coal Oil Gas Hydro NRE Nuclear Import

And N.A. Growth in Primary Energy Demand is in Low-Emissions Fuels
180
500
1000
1500
2000
2500
3000
1990 1995 2000 2005 2010 2015 2020 2025 2030 2035
MT
OE
Coal Oil Gas Hydro NRE Nuclear Electricity-Net Import
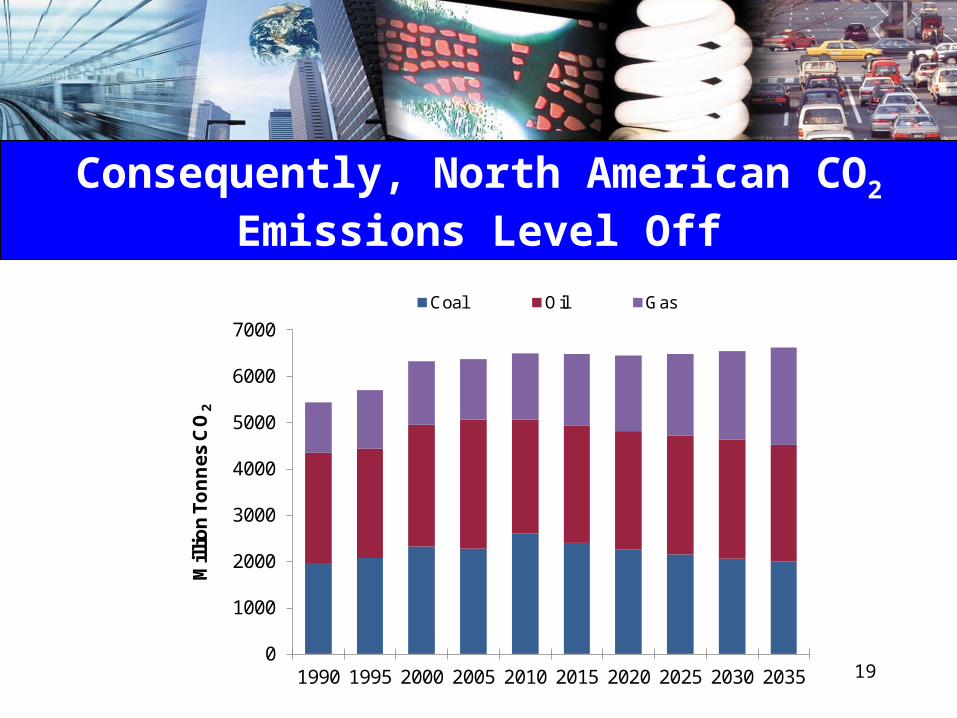
Consequently, North American CO2 Emissions Level Off
190
1000
2000
3000
4000
5000
6000
7000
1990 1995 2000 2005 2010 2015 2020 2025 2030 2035
Mil
lio
n T
on
nes
CO
2
Coal Oil Gas

Northeast Asia Business-As-Usual
20

The Incredible Chinese Growth Story Continues
21
0
200
400
600
800
1000
1200
1400
1600
0
5000
10000
15000
20000
25000
30000
35000
40000
45000
50000
1990
1995
2000
2005
2010
2015
2020
2025
2030
2035
Po
pu
lati
on
(Mil
lion
)
Rea
l GD
P (2
005
Bil
lio
n U
S$
PP
P)
Population
GDP
US$31,000/person
Assumed China GDP Growth Rates: 2010-2020: 8.1% 2020-2030: 6.0% 2030-2035: 4.5%

NE Asia Primary Energy Demand Grows
22
0
100
200
300
400
500
600
1990
1995
2000
2005
2010
2015
2020
2025
2030
2035
Ind
ex (2
005
= 1
00)
Total Primary Energy Supply Index GDP Index Primary Energy Intensity Index

Although China’s Energy Production Grows, NE Asia Oil Imports Grow Rapidly
23
0
500
1000
1500
2000
2500
3000
1990
1995
2000
2005
2010
2015
2020
2025
2030
2035
Pro
du
ctio
n a
nd
Imp
ort
(MT
OE
)
Coal Oil Gas Coal Imports Oil Imports Gas Imports

NE Asia Nuclear, NRE, Hydro, and Gas Generation Grow, But Coal is Still King
24
38%45%
52%61%
66% 64% 61% 59% 59% 59%
20%15%
9%
6%11% 10% 11%9% 6% 7%
9% 10% 11% 12%
14% 12% 11%11% 18% 15%
15% 14% 13% 11%
6% 7% 7% 7%
17% 18% 17% 13%5% 8% 10% 10% 10% 10%
1990 1995 2000 2005 2010 2015 2020 2025 2030 2035
Coal Oil Gas Hydro NRE Nuclear Import

So Northeast Asia’s CO2 Emissions Grow…
250
2000
4000
6000
8000
10000
12000
14000
16000
18000
1990 1995 2000 2005 2010 2015 2020 2025 2030 2035
Mil
lio
n T
on
nes
CO
2
Coal Oil Gas
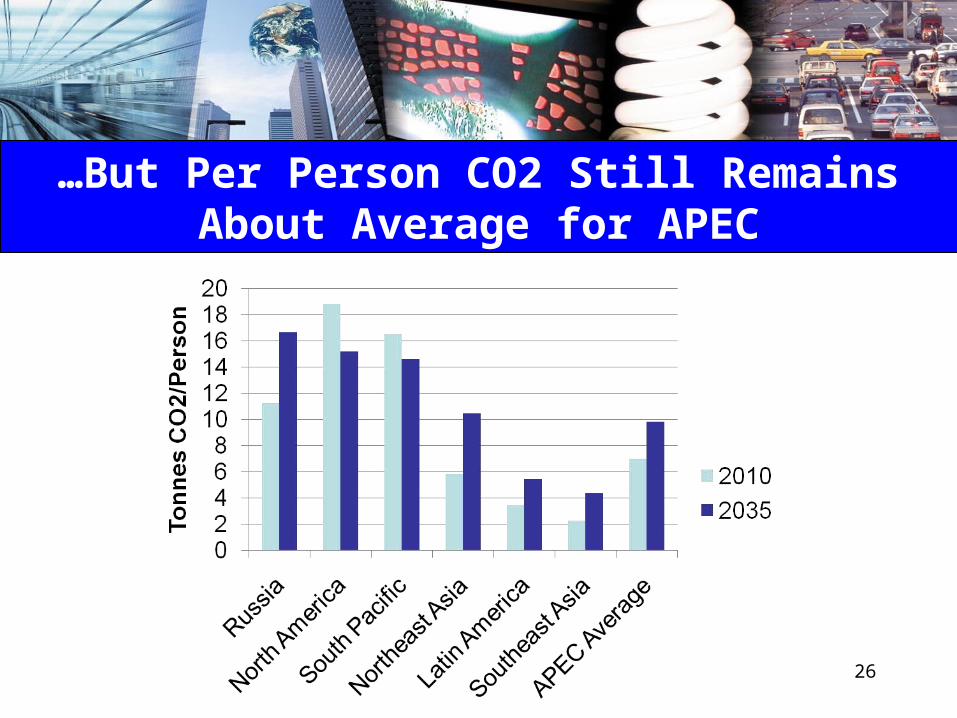
…But Per Person CO2 Still Remains About Average for APEC
26

Russian Federation Business-As-Usual
27

Russia’s Gas Production and Exports Grow, But Oil Production and Oil Exports Peak Then Decline
28
-600
-400
-200
0
200
400
600
800
1990
1995
2000
2005
2010
2015
2020
2025
2030
2035
Pro
du
ctio
n a
nd
Imp
ort
(MT
OE
)
Coal Oil Gas Coal Imports Oil Imports Gas Imports
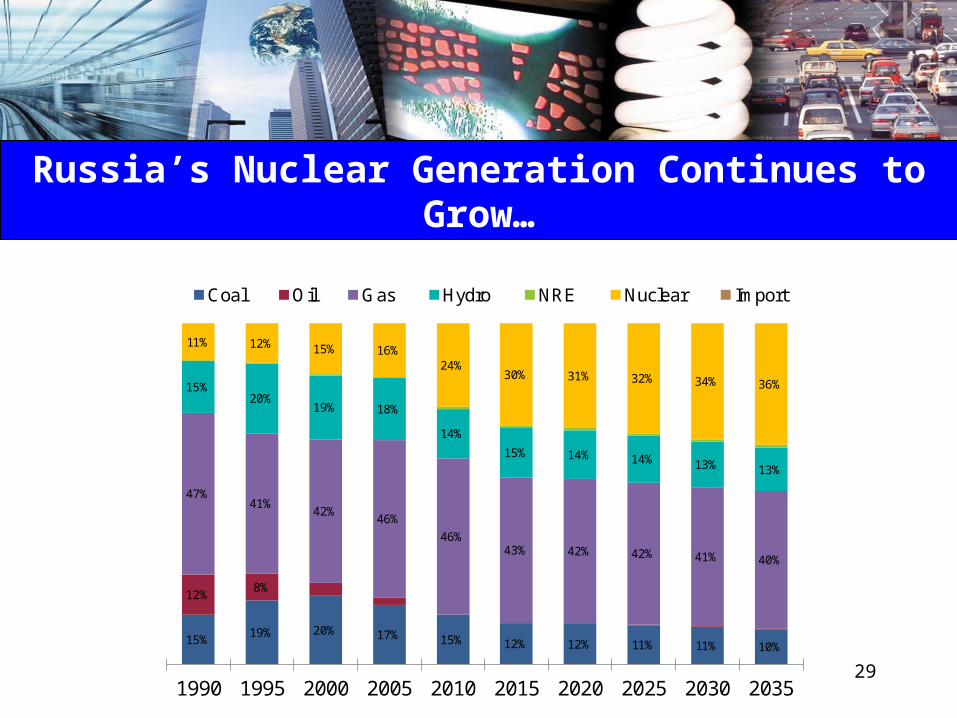
Russia’s Nuclear Generation Continues to Grow…
29
15%19% 20% 17% 15% 12% 12% 11% 11% 10%
12%8%
47%41%
42%46%
46%43% 42% 42% 41% 40%
15%20%
19% 18%
14%
15% 14% 14% 13% 13%
11% 12% 15% 16%24%
30% 31% 32% 34% 36%
1990 1995 2000 2005 2010 2015 2020 2025 2030 2035
Coal Oil Gas Hydro NRE Nuclear Import

…Slowing the Growth of Russia’s CO2 Emissions
300
500
1000
1500
2000
2500
3000
1990 1995 2000 2005 2010 2015 2020 2025 2030 2035
Mil
lio
n T
on
nes
CO
2
Coal Oil Gas

Latin America Business-As-Usual
31

Latin America Energy Gas Production Grows, But Oil Production is More Stagnant
32-100
-50
0
50
100
150
200
250
1990
1995
2000
2005
2010
2015
2020
2025
2030
2035
Pro
du
ctio
n a
nd
Imp
ort
(MT
OE
)
Coal Oil Gas Coal Imports Oil Imports Gas Imports

Latin America Final Demand Grows Rapidly in All Sectors
330
50
100
150
200
250
300
350
1990 1995 2000 2005 2010 2015 2020 2025 2030 2035
MT
OE
Industry Other Non-Energy Domestic Transport International Transport

Latin America’s Electricity Generation Shows Growing Share of Gas
34
10% 11% 11% 13% 12% 15% 16% 18% 18% 18%
45%37% 37%
22%
12% 9% 6% 5%
10%
13%20%
35%50% 51% 53% 54% 55% 56%
29%30%
25% 22%21% 20% 19% 18% 17% 16%
5%
1990 1995 2000 2005 2010 2015 2020 2025 2030 2035
Coal Oil Gas Hydro NRE Nuclear Import

So Latin America’s CO2 Emissions Grow
35
0
200
400
600
800
1000
1200
1990 1995 2000 2005 2010 2015 2020 2025 2030 2035
Mil
lio
n T
on
nes
CO
2
Coal Oil Gas
APEC-Wide Concerns
36

Conclusion #1: Oil Security Remains a Major Threat to the APEC Economies
37
-1000
0
1000
2000
3000
4000
5000
1990
1995
2000
2005
2010
2015
2020
2025
2030
2035
Pro
du
ctio
n a
nd
Imp
ort
(MT
OE
)
Coal Oil Gas Coal Imports Oil Imports Gas Imports

Conclusion #2: Business-As-Usual is Environmentally Unsustainable
38
0
5000
10000
15000
20000
25000
30000
35000
1990 1995 2000 2005 2010 2015 2020 2025 2030 2035
Mil
lio
n T
on
nes
CO
2
Electricity Generation Other Transformation IndustryOthers Domestic Transport International Transport
Potential Alternative Cases
39

• What would be the impact if APEC economies adopted policies– limiting ‘urban sprawl’ – focusing on developing smart/low-carbon cities/towns
designed for walking, bicycling, and public transportation?
• APERC has a model capable of dealing with this question, but need better data, especially on vehicle ownership and GDP by city
Possible Alternative Case #1: Better City Planning/Compact Cities
40

• What would be the impact if APEC economies adopted stricter standards for vehicle fuel economy?
• APERC has a model capable of dealing with this question, but need better data on the current composition of the vehicle fleet in each economy
• Variant of this case might look at vehicle R&D priorities; would APEC be better off if next generation vehicles were:– Electric and other alternative fuel vehicles; or– Made of carbon fiber so as to be super-light and super-efficient?
Alternative Case #2: More Efficient Vehicles
41

• What would happen if the APEC economies could more rapidly develop their gas resources, including unconventional gas?
– Use the gas to back out coal in electricity generation
– Thereby reduce greenhouse gas emissions and air pollution
• Potential shale gas resource data available from the US Geological survey for some APEC economies, gap is Southeast Asia; coal bed methane unknown
• Need better resource data, cost data, comparable coal generation costs
• What are the barriers to gas development?
Alternative Case #3: High Gas
42

• APERC is looking for alternative cases that:– Could provide interesting insights – Have not been well-examined previously (such
as by IEA)– Can be done in a very limited time
• We welcome your suggestions and your assistance!
Other Alternative Cases?
43

Thank you for your kind attention
http://www.ieej.or.jp/aperc/http://www.ieej.or.jp/aperc/
44


