
ANT D1.3 Product User Guide (PUG)
Ref. SICCI-ANT-SD-PUG-14-08
Version 2.0 / 05 May 2015
ESA UNCLASSIFIED - For Official Use 1
Sea Ice Climate Change Initiative: Phase 1
ANT D1.3 Product User Guide (PUG) This PUG is for Antarctic AMSR-E snow depth product SD v1.1
Doc Ref: SICCI-ANT-SD-PUG-14-08
Version: 2.0
Date: 05 May 2015
ANT D1.3 Product User Guide (PUG)
Ref. SICCI-ANT-SD-PUG-14-08
Version 2.0 / 05 May 2015
ESA UNCLASSIFIED - For Official Use 2
Change Record
Issue Date Reason for Change Author(s)
1.0 05 December 2014
First Issue to be provided together with ANT-SIT-Option Snow Depth product SDv1.0
Stefan Kern, Torben Frost
1.1 09 December 2014
Final issue Stefan Kern, Torben Frost,
Georg Heygster
2.0 30 April 2015 Final issue for ANT-SIT-Option Snow Depth product SDv1.1
Stefan Kern, Torben Frost, Georg Heygster
Authorship
Role Name Signature
Written by: Stefan Kern, Torben Frost, Georg Heygster
Checked by:
Approved by:
Authorised by:
Distribution
Organisation Names Contact Details
ESA Pascal Lecomte [email protected]
NERSC Stein Sandven [email protected]
CGI (previously Logica)
Gary Timms, Ed Pechorro [email protected]; [email protected];
AWI Sandra Schwegmann, Marcel Nicolaus
[email protected], [email protected]
FMI Eero Rinne [email protected]
University of Hamburg
Stefan Kern [email protected];
University of Bremen
Georg Heygster, Torben Frost [email protected], [email protected]
University of Cambridge
Peter Wadhams [email protected]
ANT D1.3 Product User Guide (PUG)
Ref. SICCI-ANT-SD-PUG-14-08
Version 2.0 / 05 May 2015
ESA UNCLASSIFIED - For Official Use 3
Table of Contents
1 Introduction ................................................................................... 4 1.1 Document Structure ........................................................................4 1.2 Document Status ............................................................................4 1.3 Reference Documents and Datasets ...................................................4 1.4 Acronyms and Abbreviations ............................................................6
2 Snow Depth (SD) from Advanced Microwave Scanning Radiometer
(AMSR-E) ........................................................................................ 8 2.1 Introduction ...................................................................................8 2.2 Scientific Description of the product ...................................................8 2.3 Technical description of the product ................................................. 14
ANT D1.3 Product User Guide (PUG)
Ref. SICCI-ANT-SD-PUG-14-08
Version 2.0 / 05 May 2015
ESA UNCLASSIFIED - For Official Use 4
1 Introduction
1.1 Document Structure
This document describes the dataset for the Sea Ice ECV project produced
in Phase 1 of ESA's Climate Change Initiative – Antarctic Sea Ice Thickness
Option.
1.2 Document Status
This is the 1st issue of the PUG document for the Antarctic Sea Ice
Thickness option snow depth product.
1.3 Reference Documents and Datasets
Acronym Title Reference Issue
RD-01 ANT D1.1 Passive Microwave Snow Depth on Antarctic sea ice assessment.
Frost, T., G. Heygster, and S. Kern, SICCI-ANT-SD-PUG-14-08
v1.0 Nov. 2014
RD-02 ANT D1.2 Antarctic Snow Depth from Alternative Sources
Kern, S., SICCI-ANT-SD-PUG-14-08
v1.0 Nov. 2014
RD-03 D3.4 Product User Guide (PUG)
Lavergne, T., and E. Rinne, SICCI-PUG-13-07
v2.0 Aug. 2014
RD-04 Snow depth distribution over sea ice in the southern ocean from satellite passive microwave data
Markus, T., and D. J. Cavalieri, Antarctic Sea Ice: Physical Processes, Interactions, and Variability, M. O. Jeffries (Ed.), AGU Antarctic Research Series, vol. 74, pp. 19-39, 1998
n.a.
RD-05 Sea ice concentration, ice temperature, and snow depth using AMSR-E data
Comiso, J. C., D. J. Cavalieri, and T. Markus, IEEE Transactions on Geoscience and Remote Sensing, 41(2), 243-252, 2003
n.a.
RD-06 Algorithm Theoretical Basis Document: Sea Ice Products
Markus, T., D. J. Cavalieri, and A. Ivanoff, Technical Report, Cryospheric Sciences Laboratory,
NASA Goddard Space Flight Center, Greenbelt, MD 20771, 2011a.
Dec. 2011
RD-07 Comparison of SSM/I and AMSR-E sea ice concentrations with ASPeCt ship observations around Antarctica
Beitsch, A., S. Kern, and L. Kaleschke, IEEE Transaction on Geoscience and Remote Sensing, 53(4), 10.1109/TGRS.2014.2351497, 2015.
n.a.

ANT D1.3 Product User Guide (PUG)
Ref. SICCI-ANT-SD-PUG-14-08
Version 2.0 / 05 May 2015
ESA UNCLASSIFIED - For Official Use 5
Acronym Title Reference Issue
RD-08 Evaluation of AMSR-E snow depth product over East Antarctic sea ice using in situ measurements and aerial photography
Worby, A. P., T. Markus, A. D. Steer, V. I. Lytle, and R. A. Massom, Journal of Geophysical Research, 113, C05S94, doi:10.1029/2007JC004181, 2008b
n.a.
RD-09 Microwave Signatures of Snow on Sea Ice: Observations
Markus, T., D. J. Cavalieri, A. J. Gasiewski, M. Klein, J. A. Maslanik, D. C. Powell, B. B. Stankov, J. C. Stroeve, and M. Sturm, IEEE Transactions on Geoscience and Remote Sensing, 44(11), 3081-3090, doi: 10.1109/TGRS.2006.883134, 2006a.
n.a.
RD-10 Intercomparisons of
Antarctic sea ice types from visual ship, RADARSAT-1 SAR, Envisat ASAR, QuikSCAT, and AMSR-E satellite observations in the Bellingshausen Sea,
Ozsoy-Cicek, B., S. Kern, S. F.
Ackley, H. Xie, and A. E. Tekeli, Deep-Sea Research, part II, 58(9-10),1092-1111, doi:10.1016/j.dsr2.2010.10.031, 2011
n.a.
RD-11 An intercomparison between AMSR-E snow
depth and satellite C- and Ku-Band radar backscatter data for Antarctic sea ice,
Kern, S., B. Ozsoy-Cicek, S. Willmes, M. Nicolaus, C. Haas, and
S. F. Ackley, Annals of Glaciology, 52(57), 279-290, 2011
n.a.
RD-12 Winter snow cover variability on East Antarctic sea ice
Massom, R. A., V. I. Lytle, A. P. Worby, and I. Allison, Journal of Geophysical Research, 103(C11), 24,837–24,855, 1998
n.a.
RD-13 Winter snow cover on sea ice in the Weddell Sea
Massom, R. A., M. R. Drinkwater, and C. Haas, Journal of Geophysical Research, 102(C1), 1101–1117, 1997
n.a.
RD-14 The thickness distribution of sea ice and snow cover during late winter in the Bellingshausen and Amundsen Seas, Antarctica
Worby, A. P., M. O. Jeffries, W. F. Weeks, K. Morris, and R. Jana, Journal of Geophysical Research, 101(C12), 28,441–28,455, 1996
n.a.
RD-15 A description of the snow cover on the winter sea ice of the Amundsen and Ross Seas
Sturm, M., K. Morris, and R. A. Massom, Antarctic Journal of the US, 30(1-4), 21-24, 1995
n.a.
RD-16 Characteristics and distribution patterns of snow and meteoric ice in the Weddell Sea and
their contribution to the mass balance of sea ice
Eicken, H., M. A. Lange, H.-W. Hubberten, and P. Wadhams, Annals Geophysicae, 12, 80-93, 1994
n.a.

ANT D1.3 Product User Guide (PUG)
Ref. SICCI-ANT-SD-PUG-14-08
Version 2.0 / 05 May 2015
ESA UNCLASSIFIED - For Official Use 6
Acronym Title Reference Issue
RD-17 Sea-ice– and snow–thickness distributions in late winter 1993 and 1994 in the Ross, Amundsen, and Bellingshausen Seas
Jeffries, M. O., R. Jana, S. Li, and S. McCullars, Antarctic Journal of the US, 30(1-4), 18-21, 1995
n.a.
RD-18 Snow on Antarctic sea ice Massom, R. A., et al., Reviews in Geophysics, 39(3), 413-445, 2001
n.a.
RD-19 Antarctic sea ice thickness and snow-to-ice conversion from atmospheric reanalysis and passive microwave snow depth
Maksym, T., and T. Markus, Journal of Geophysical Research, 113, C02S12, doi:10.1029/2006JC004085, 2008
n.a.
RD-20 AMSR-E/Aqua L1A Raw Observation Counts
Japan Aerospace Exploration Agency (JAXA), 2003, updated daily. Version 3. June, 2002 - October, 2011. Boulder, Colorado USA: NASA DAAC at the National Snow and Ice Data Center. http://dx.doi.org/10.5067/AMSR-E/AMSREL1A.003.
v03
RD-21 SSM/I sea ice remote
sensing for mesoscale ocean-atmosphere interaction analysis: Ice and Icebergs
Kaleschke, L., C. Lüpkes, T.
Vihma, J. Haarpaintner, A. Bochert, J. Hartmann, and G. Heygster. Canadian Journal of Remote Sensing, 27(5), 526– 537, 2001.
n.a.
RD-22 Sea Ice Remote Sensing Using AMSR-E 89 GHz Channels
Spreen, G., L. Kaleschke, and G. Heygster, Journal of Geophysical Research, 113(C2), C02S03, doi: 10.1029/2005JC003384, 2008.
n.a.
RD-23 Polar Stereographic Projection and Grid
National Snow and Ice Data Center (NSIDC), http://nsidc.org/data/polar_stereo/ps_grids.html, accessed Dec 5 2014
Table 1-1: Reference Documents
1.4 Acronyms and Abbreviations
Acronym Meaning
AMSR-E Advanced Microwave Scanning Radiometer aboard EOS
AO Announcement of Opportunity
ASCII American Standard Code for Information Interchange
ASIRAS Airborne Synthetic Aperture and Interferometric Radar Altimeter System
CM-SAF Climate Monitoring Satellite Application Facility
CRDP Climate Research Data Package
DMSP Defence Meteorological Satellite Program
DWD Deutscher Wetterdienst
ECV Essential Climate Variable

ANT D1.3 Product User Guide (PUG)
Ref. SICCI-ANT-SD-PUG-14-08
Version 2.0 / 05 May 2015
ESA UNCLASSIFIED - For Official Use 7
Acronym Meaning
Envisat Environmental Satellite
ESA European Space Agency
EUMETSAT European Organisation for the Exploitation of Meteorological Satellites
FCDR Fundamental Climate Data Record
FOC Free of Charge
FOV Field-of-View
FTP File Transfer Protocol
GB GigaByte
GCOM Global Change Observation Mission
H Horizontal polarization
H+V Horizontal and vertical polarization
MB MegaByte
MODIS Moderate Resolution Imaging Spectroradiometer
n.a. Not applicable
NetCDF Network Common Data Format
NSIDC National Snow and Ice Data Center
OIB Operation Ice Bridge
OSI-SAF Ocean and Sea Ice Satellite Application Facility
PI Principal Investigator
PMW Passive Microwave
POES Polar Operational Environmental Satellite
PRF Pulse Repetition Frequency
RADAR Radio Detection and Ranging
SAR Synthetic Aperture Radar
SIC Sea Ice Concentration
SIRAL SAR/Interferometric Radar Altimeter
SIT Sea Ice Thickness
SMMR Satellite Multichannel Microwave Radiometer
SSM/I Special Sensor Microwave / Imager
SSM/IS Special Sensor Microwave / Imager+Sounder
Tb Brightness Temperature
TB TeraByte
t.b.d. To be determined
TM Thematic Mapper
ULS Upward Looking Sonar
URL Uniform Resource Locator
V Vertical polarization
Table 1-2: Acronyms

ANT D1.3 Product User Guide (PUG)
Ref. SICCI-ANT-SD-PUG-14-08
Version 2.0 / 05 May 2015
ESA UNCLASSIFIED - For Official Use 8
2 Snow Depth (SD) from Advanced Microwave
Scanning Radiometer (AMSR-E)
2.1 Introduction
This part of the Product User Guide (PUG) provides the entry point to the
European Space Agency Climate Change Initiative (ESA CCI) Antarctic Sea
Ice Thickness Option snow depth (SD) on sea ice dataset, both from a
scientific and a technical point of view. Details of the scientific description of
the processing chain and algorithms are however willingly kept out of this
PUG, and the interested readers are rather directed to the documents
Passive Microwave Snow Depth on Antarctic sea ice assessment [RD-01]
and the ANT Snow Depth from Alternative Sources [RD-02]. First evaluation
results are also contained in [RD-01].
This is issue 2.0 of the PUG. It is provided along with version 1.1 of the
AMSR-E snow depth data set for Antarctic sea ice: SDv1.1. Major
improvements compared to SDv1.0 are that file format and naming
convention comply to the format used for the ESA CCI SIC and SIT
prototype products (see [RD-03]), that daily and monthly data files are
available and that all monthly data files contain additional information about
sea ice concentration, quality flags, etc., as are detailed below.
In short, the SICCI ANT SD dataset is:
Daily & monthly gridded SD fields based on Passive Microwave
Radiometer measurements;
Maps of Southern Hemisphere with 12.5 km grid spacing;
Based on AMSR-E data;
Daily & Monthly maps of total standard error (uncertainty);
Built upon the algorithms reviewed and modified in [RD-01].
2.2 Scientific Description of the product
This section gives a summary of the science features of the ANT SD dataset.
First we point potential users to the known limitations and caveats which we
first describe before we give a recommendation to the user in italic font.
Note that this version of PUG is written before an extensive validation
exercise of the dataset, and that the results described below are based on
the investigations and literature review results given in [RD-01; RD-02].
2.2.1 Known limitations and caveats
Users of this dataset should be fully aware of the fact that the general
methodology used to retrieve snow depth from AMSR-E brightness
temperatures does not differ from the known approach [RD-04 to RD-06].

ANT D1.3 Product User Guide (PUG)
Ref. SICCI-ANT-SD-PUG-14-08
Version 2.0 / 05 May 2015
ESA UNCLASSIFIED - For Official Use 9
2.2.1.1 Using an Empirical approach
The original algorithm [RD-04 to RD-06] is an empirical one, linearly
relating observed SD to brightness temperatures measured at 19 GHz and
37 GHz. The new algorithm is similar – except that the coefficients of linear
regression used are solely derived from AMSR-E brightness temperature
measurements.
The new SD retrieval algorithm is similar to the original one. This applies in
particular to the maximal retrieval SD value which is around 50 cm.
However, the skill and usability of such an empirical approach is for sure
limited and is determined in particular by
representativity and quality of the SD observations used in terms of
spatio-temporal coverage and ice types (see 2.2.1.2)
encountered sea ice type (see 2.2.1.3)
encountered environmental conditions (see 2.2.1.4)
2.2.1.2 Representativity
Figure 2.1 ASPeCt ship tracks during 2002-2010 projected onto an AMSR-E
sea ice extent map of September 7, 2005 (from [RD-07]).
Figure 2.1 gives the distribution of the ship tracks along which SD
observations were carried out which are used to derive the new empirical
relationship (see [RD-01]). The map illustrates that large areas of the
Antarctic sea ice cover and hence its SD are under-represented in the data
set used to derive the empirical approach; we note that also the original
algorithm used SD data from a limited region [RD-04]. The similarity of the

ANT D1.3 Product User Guide (PUG)
Ref. SICCI-ANT-SD-PUG-14-08
Version 2.0 / 05 May 2015
ESA UNCLASSIFIED - For Official Use 10
results of the inter-comparison between these observations and SSM/I data
on the one hand and AMSR-E data on the other hand [RD-01] allows us
taking this spatially limited suite of SD observations as the basis for the SD
algorithm.
Users should keep in mind though that also the new SD data of the ESA CCI
ANT SD v1.1 product could be less representative for snow conditions in
some regions while it is more suitable for snow conditions in other regions.
In situ observations of SD are rarely available for months April to July
because of the small number of expeditions into the Southern Ocean sea ice
cover during that time of the year. The majority of SD data observed in situ
is collected during months September to March.
Snow metamorphism caused by melt-refreeze cycles which can occur
basically during the entire summer period, i.e. November to February,
causes a combination of snow properties and brightness temperatures which
are less suitable for the development of the SD retrieval algorithm. Hence
the main information for the SD retrieval algorithm development stems from
months August to October.
Users should be aware that also the new SD data ESA CCI ANT SD v1.1
product is potentially not suitable for snow conditions of the months outside
the winter period April to October and also could potentially be less reliable
for months April to June.
The in situ SD observations used to develop the SD retrieval have an
accuracy of the magnitude of 5 cm to 10 cm. They are valid for undeformed
sea ice. They are not representative for SD on sea ice of the entire sea ice
thickness distribution (e.g. [RD-08]). Also, in order to filter out outliers, the
new algorithm relies on SD observations which have a low variability on
daily temporal and of the magnitude of 100 km spatial scale [RD-01].
Users should keep in mind that also the new SD data ESA CCI ANT SD v1.1
product is potentially less suitable for deformed sea ice.
We note that the three issues mentioned above are not reflected in the SD
retrieval uncertainties. These could however be reflected in some way in the
SD standard deviation which is provided along with the monthly mean SD
data. The SD standard deviation can be taken as a measure of the
variability of the SD in the respective grid cell.
2.2.1.3 Sea Ice Types
There is evidence from numerous publications that SD retrieval based on
satellite microwave radiometry under-estimates the actual snow depth in
areas of deformed sea ice [RD-08 to RD-11]. It can be expected that the
same applies to the ESA-CCI ANT SD v1.0 data set; this is reflected in the
partly poor agreement of SD observations and ESA-CCI ANT SD v1.1 data in
the sea ice regions of the Eastern Antarctic [RD-01].
The new algorithm has not been improved with regard to the documented
under-estimation of SD over deformed sea ice.
The new algorithm utilizes the gradient ratio of the 37 GHz and 19 GHz
channel vertically polarized brightness temperatures (GR3719) – similar to
[RD-04]. Hence the algorithm cannot be used over multiyear ice.

ANT D1.3 Product User Guide (PUG)
Ref. SICCI-ANT-SD-PUG-14-08
Version 2.0 / 05 May 2015
ESA UNCLASSIFIED - For Official Use 11
Users should be aware of the fact that even though the classical multiyear
ice, as is typical for the Arctic, does not exist in the Southern Ocean, the
ESA CCI ANT SD v1.1 product could be biased over old or perennial ice, as
occurs in the Weddell Sea, in the Bellingshausen/Amundsen Sea and
sometimes also can occur all around Antarctica.
The gradient ratio GR3719 is primarily influenced by the fraction of sea ice.
This influence is corrected for before the snow depth is computed. Further,
SD is not computed for sea ice concentrations below 20%. Despite these
precautions negative SD values exist in areas of reduced sea ice
concentrations. These areas are also characterized by an elevated SD
retrieval uncertainty.
In the daily SD maps of ESA CCI ANT SD v1.1 product negative SD values –
which occur primarily along the ice edge – are not flagged out. In these
areas usually the SD retrieval uncertainty exceeds 0.5 m.
In the daily SD files of the ESA CCI ANT SD v1.1 product neither an ice
concentration nor a quality flag map pointing to these negative SD values is
included. In order to avoid being confused by negative SD values and/or
very large SD retrieval uncertainties we recommend:
Do not use any negative SD values.
Do not use any SD-values for which the ratio |SD uncertainty| / |SD|
is larger than 1.
In the monthly SD maps of the ESA CCI ANT SD v1.1 product negative SD
values – which occur primarily along the ice edge – are flagged out. Hence
the monthly mean SD map does not cover the entire sea ice covered area.
This can be seen by, e.g. comparing the SD map with the map of the
monthly mean sea ice concentration which is provided along with the SD.
This can also be seen by the additional maps included in the monthly
product: number of days with negative SD in the respective grid cell;
number of days with valid data for computation of the monthly mean sea ice
concentration; number of days with valid, e.g. positive SD values, for
computation of the monthly mean SD.
2.2.1.4 Environmental conditions
Snow properties are known to vary a lot on Antarctic sea ice [RD-12 to RD-
18]. Some of these, e.g. the snow density, the snow grain size and the
snow wetness influence SD retrieval using microwave radiometry [RD-04;
RD-19]. These properties can either change directly at the snow surface,
e.g. due to direct atmosphere-snow interaction like snow fall or rain on
snow or surface melt. These can however also change due to more complex
atmosphere-snow-sea ice-ocean interaction, e.g. due to flooding of the ice-
snow interface with sea water because of a too heavy snow load and
subsequent re-freezing of the flooded snow layer. All these influence the
accuracy of the SD product.
Neither the actual variations in the atmospheric conditions nor in the snow
properties are known. Therefore, these variations cannot be included in the
uncertainty estimation and hence the SD retrieval uncertainties do not show
elevated values in case environmental conditions are exceptional. However,
in the monthly ESA CCI ANT SD v1.1 product files the SD standard deviation
within the respective month is given for every grid cell. This standard

ANT D1.3 Product User Guide (PUG)
Ref. SICCI-ANT-SD-PUG-14-08
Version 2.0 / 05 May 2015
ESA UNCLASSIFIED - For Official Use 12
deviation can be taken as a measure of the temporal variability of the SD in
the respective month and grid cell. High variability can be caused by both
actual variations in SD due to continued snow accumulation on sea ice but
also by artificial variations in SD due to weather-induced changes in snow
properties, e.g. grain size.
Users should be careful with interpretation of SD values in areas of large SD
variability and should be especially alerted by sudden drops in SD during the
freezing period.
2.2.2 Description of the algorithm
In this section, we highlight the features of the SD processing [RD-01].
AMSR-E L1A Raw Observation Count data (Version 3), provided by the
NSIDC (http://nsidc.org/data/amsrel1a, [RD-20]) are used to derive the
brightness temperature gradient ratio GR3719 (henceforth GRV) and to
compute the sea ice concentration using the ARTIST Sea Ice (ASI) algorithm
[RD-21; RD-22]. Daily averages are computed from the swath data.
Brightness temperatures are not corrected for atmospheric influence.
New regression coefficients for the empirical relation between SD
observations (collocated ASPeCt ship-based SD observations) and GRV were
derived following [RD-04]. For this purpose new open water tie points based
on AMSR-E data are required and computed. They are 184.7 K ± 0.7 K for
the 18.7 GHz channel and 210.5 K ± 0.8 K for the 36.5 GHz channel and
kept fixed for the entire AMSR-E period. The resulting values for GRV were
compared with ASPeCt SD observations for the winter months (April to
October) by means of linear regression analysis. For the derivation of the
final set of regression coefficients the following constrains were applied:
1. The uncertainty of the GRV - SD pairs had to be < 0.004 for GRV.
2. The ratio of the observed (ASPeCt) mean, daily along-track SD to its
standard deviation had to be < 0.3.
3. Three artificial regression points were added at SD = 0 cm and GRV
values 0.004, 0.005 and 0.006 to include GRV for thin bare sea ice.
The resulting regression equation which is used for the SD retrieval is:
𝑆𝐴𝑆𝑃𝑒𝐶𝑡 = (−864 ± 131) cm ∙ 𝐺𝑅𝑉 + (5.4 ± 2.1) cm (2.1)
The calculated uncertainties represent the 1𝜎-standard deviation of the fit.
The correlation coefficient is -0.87. Compared to the old regression
coefficients for AMSR-E (slope: -782 cm, y-intercept: 2.9 cm) the slope is
only slightly lower but the y-intercept did significantly increase.
The SD uncertainty is computed using Gaussian error propagation. The input
uncertainties of the fit are given in the equation above. The input
uncertainties of the GRV are derived based on the noise of the brightness
temperatures and the theoretical uncertainty of the ASI sea ice
concentration [RD-22]. Hence the ESA CCI ANT SD v1.1 dataset comes with
uncertainty estimates for every grid cell with a SD value. All uncertainties
are intended as one standard deviation around the provided SD value
(acting as the mean of the distribution).
The retrieval of SD and SD uncertainty is carried out on a swath-by-swath
basis. Subsequently daily averages are computed and form the ESA CCI ANT
SD v1.1 data set.

ANT D1.3 Product User Guide (PUG)
Ref. SICCI-ANT-SD-PUG-14-08
Version 2.0 / 05 May 2015
ESA UNCLASSIFIED - For Official Use 13
The daily gridded snow depth and snow depth uncertainty products are then
used to calculate the monthly mean snow depth, the monthly snow depth
uncertainty and snow depth variability.
Here, the snow depth within one pixel only represents the sea ice covered
fraction of this pixel. In the monthly mean snow depth this is considered by
weighting the snow depth pixel value by sea ice concentration
S̅ =∑ CiSi
Ni=1
∑ CjNj=1
(2.2)
where Si is the daily averaged snow depth, Ci is the daily averaged sea ice
concentration, and N is the number of days contributing to the monthly
average. Here, to calculate the monthly snow depth average the daily
averaged ASI sea ice concentration [RD-21; RD-22] is used (University of
Bremen; http://www.iup.uni-bremen.de:8084/amsr/amsre.html). The sea
ice concentration product has a grid resolution of 6.25 km x 6.25 km. Since
the snow depth product is provided at 12.5 km x 12.5 km grid resolution the
resolution of the sea ice concentration is reduced to 12.5 km x 12.5 km
beforehand.
The monthly snow depth uncertainty is then calculated via
σS,err = ±√∑ (CiσS,i
∑ CjNj=1
)
2
+ ∑ (Si ∑ Cj − ∑ CkSk
Nk=1
Nj=1
(∑ ClNl=1 )2
σC,i)
2N
i=1
N
i=1
(2.3)
where σS,i is the uncertainty of the daily snow depth average, σC,i is the
uncertainty of the sea ice concentration estimated from Figure 9 in Spreen
et al. [RD-22]. The sea ice concentration uncertainty is estimated from the
figure in 10% intervals (except for 100%) and is given in Table 2.1.
Table 2.1 Sea ice concentration uncertainties estimated from Fig. 9 in
Spreen et al. [RD-22].
C [%] σ [%]
20 - 29
30 - 39
40 - 49
50 - 59
60 - 69
70 - 79
80 - 89
90 - 99
100
21
19
16
13
11
9
7.5
7
6
The snow depth variability is calculated from the snow depth averages and
the daily snow depth averages via
σS,var = √∑ (Si − S̅)2N
i=1
N − 1 (2.4)

ANT D1.3 Product User Guide (PUG)
Ref. SICCI-ANT-SD-PUG-14-08
Version 2.0 / 05 May 2015
ESA UNCLASSIFIED - For Official Use 14
where S̅ is the monthly averaged snow depth according to Eq. 2.2.
2.3 Technical description of the product
In this section, the SD product files are described in terms of content, file
name, data format, grid, and others.
2.3.1 Example
To support the reading of the technical specifications, we start this section
by providing an example of the SD (Figure 2.2) and the SD retrieval
uncertainty (Figure 2.3) for Sep. 7 2005.
Figure 2.2 Map of the daily snow depth distribution for Sep. 7 2005 in the
Southern Ocean. Regions with negative snow depths are given in black. Sea
ice areas where the snow depth exceeds the theoretically possible upper
limit of the snow depth of around 50 cm are shown in white.
Figure 2.2 shows the kind of classic distribution of the snow depth on sea ice
as can be expected based on the distribution of different ice types. In the
northern and north-western Weddell Sea, the southern parts of the
Bellingshausen Sea and some areas of the Amundsen and Ross Seas snow
depths are relatively large and exceed 30 cm. Regions downstream of major
polynyas producing and exporting thin ice northwards, e.g. the Ross Ice
Shelf polynya in the Ross Sea and the Filchner-Ronne Ice Shelf polynya in
the Weddell Sea show substantially less snow: < 10 cm. The majority of the
sea ice enclosing East Antarctica shows snow depths between 5 cm and 20
cm. In these regions deformation might be more wide-spread and hence the
ANT D1.3 Product User Guide (PUG)
Ref. SICCI-ANT-SD-PUG-14-08
Version 2.0 / 05 May 2015
ESA UNCLASSIFIED - For Official Use 15
potential that the snow depth is under-estimated might be larger than on
the sea ice enclosing West Antarctica.
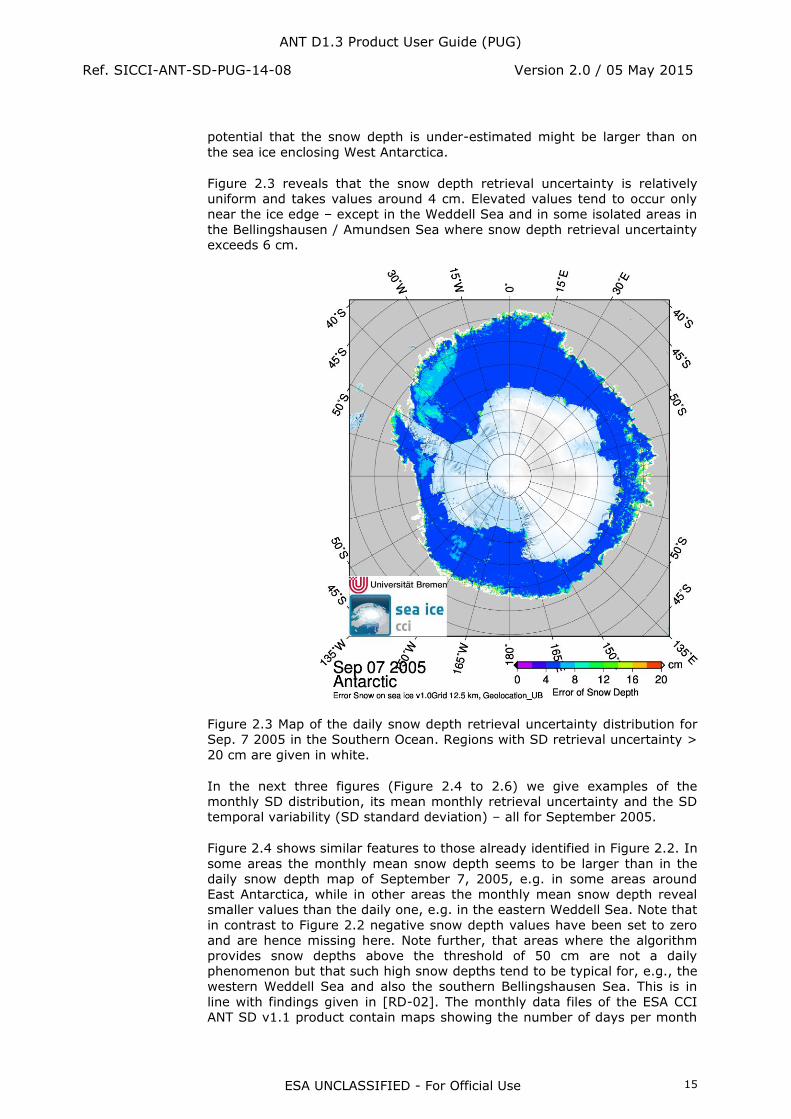
Figure 2.3 reveals that the snow depth retrieval uncertainty is relatively
uniform and takes values around 4 cm. Elevated values tend to occur only
near the ice edge – except in the Weddell Sea and in some isolated areas in
the Bellingshausen / Amundsen Sea where snow depth retrieval uncertainty
exceeds 6 cm.
Figure 2.3 Map of the daily snow depth retrieval uncertainty distribution for
Sep. 7 2005 in the Southern Ocean. Regions with SD retrieval uncertainty >
20 cm are given in white.
In the next three figures (Figure 2.4 to 2.6) we give examples of the
monthly SD distribution, its mean monthly retrieval uncertainty and the SD
temporal variability (SD standard deviation) – all for September 2005.
Figure 2.4 shows similar features to those already identified in Figure 2.2. In
some areas the monthly mean snow depth seems to be larger than in the
daily snow depth map of September 7, 2005, e.g. in some areas around
East Antarctica, while in other areas the monthly mean snow depth reveal
smaller values than the daily one, e.g. in the eastern Weddell Sea. Note that
in contrast to Figure 2.2 negative snow depth values have been set to zero
and are hence missing here. Note further, that areas where the algorithm
provides snow depths above the threshold of 50 cm are not a daily
phenomenon but that such high snow depths tend to be typical for, e.g., the
western Weddell Sea and also the southern Bellingshausen Sea. This is in
line with findings given in [RD-02]. The monthly data files of the ESA CCI
ANT SD v1.1 product contain maps showing the number of days per month
ANT D1.3 Product User Guide (PUG)
Ref. SICCI-ANT-SD-PUG-14-08
Version 2.0 / 05 May 2015
ESA UNCLASSIFIED - For Official Use 16
where the snow depth was negative or where the snow depth exceeds 50
cm.
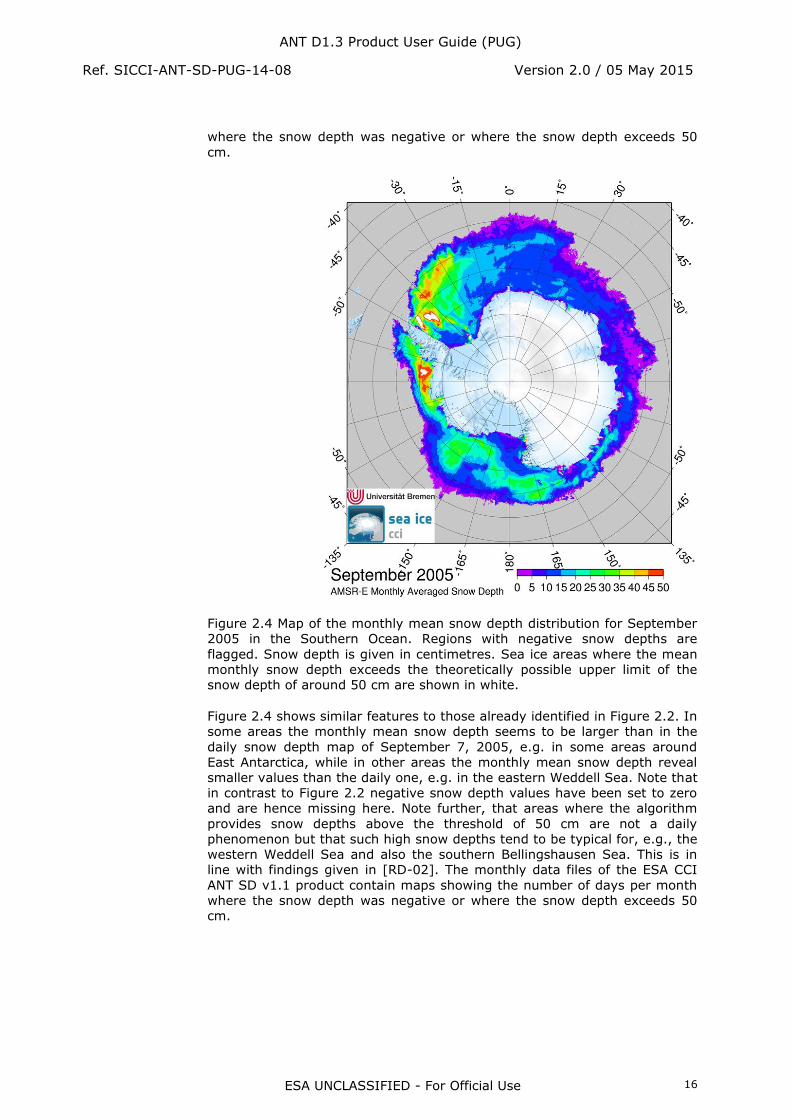
Figure 2.4 Map of the monthly mean snow depth distribution for September
2005 in the Southern Ocean. Regions with negative snow depths are
flagged. Snow depth is given in centimetres. Sea ice areas where the mean
monthly snow depth exceeds the theoretically possible upper limit of the
snow depth of around 50 cm are shown in white.
Figure 2.4 shows similar features to those already identified in Figure 2.2. In
some areas the monthly mean snow depth seems to be larger than in the
daily snow depth map of September 7, 2005, e.g. in some areas around
East Antarctica, while in other areas the monthly mean snow depth reveal
smaller values than the daily one, e.g. in the eastern Weddell Sea. Note that
in contrast to Figure 2.2 negative snow depth values have been set to zero
and are hence missing here. Note further, that areas where the algorithm
provides snow depths above the threshold of 50 cm are not a daily
phenomenon but that such high snow depths tend to be typical for, e.g., the
western Weddell Sea and also the southern Bellingshausen Sea. This is in
line with findings given in [RD-02]. The monthly data files of the ESA CCI
ANT SD v1.1 product contain maps showing the number of days per month
where the snow depth was negative or where the snow depth exceeds 50
cm.
ANT D1.3 Product User Guide (PUG)
Ref. SICCI-ANT-SD-PUG-14-08
Version 2.0 / 05 May 2015
ESA UNCLASSIFIED - For Official Use 17
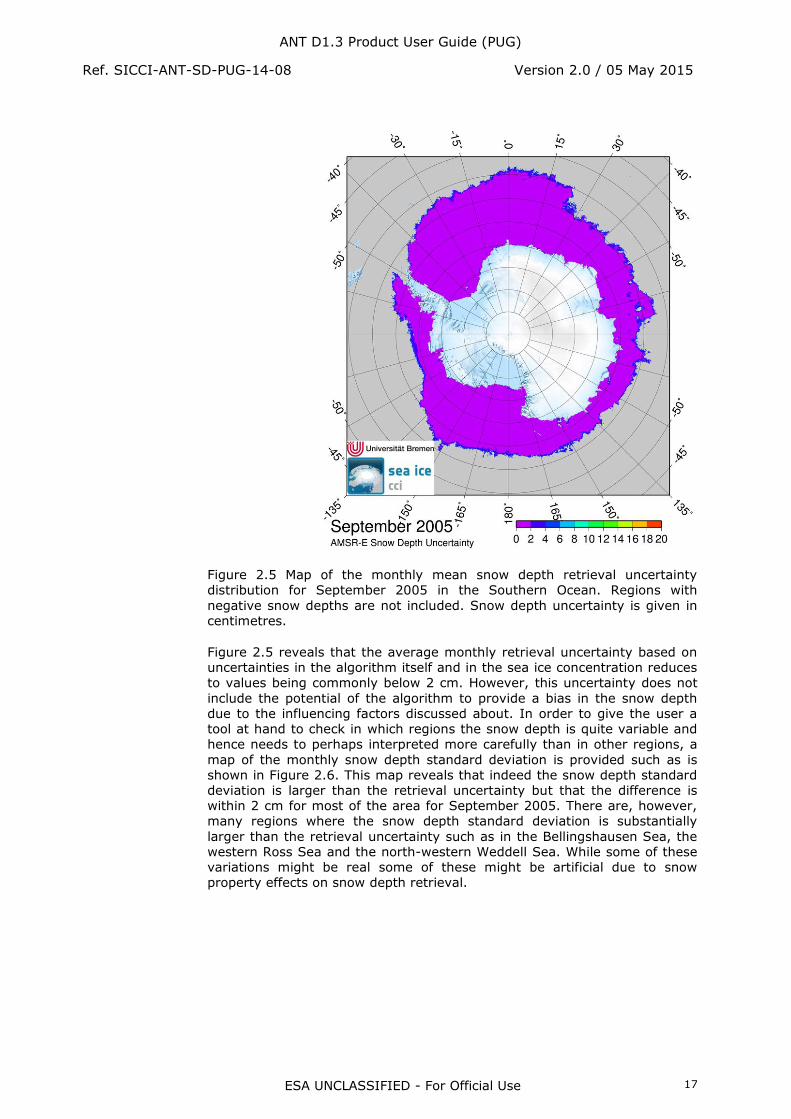
Figure 2.5 Map of the monthly mean snow depth retrieval uncertainty
distribution for September 2005 in the Southern Ocean. Regions with
negative snow depths are not included. Snow depth uncertainty is given in
centimetres.
Figure 2.5 reveals that the average monthly retrieval uncertainty based on
uncertainties in the algorithm itself and in the sea ice concentration reduces
to values being commonly below 2 cm. However, this uncertainty does not
include the potential of the algorithm to provide a bias in the snow depth
due to the influencing factors discussed about. In order to give the user a
tool at hand to check in which regions the snow depth is quite variable and
hence needs to perhaps interpreted more carefully than in other regions, a
map of the monthly snow depth standard deviation is provided such as is
shown in Figure 2.6. This map reveals that indeed the snow depth standard
deviation is larger than the retrieval uncertainty but that the difference is
within 2 cm for most of the area for September 2005. There are, however,
many regions where the snow depth standard deviation is substantially
larger than the retrieval uncertainty such as in the Bellingshausen Sea, the
western Ross Sea and the north-western Weddell Sea. While some of these
variations might be real some of these might be artificial due to snow
property effects on snow depth retrieval.

ANT D1.3 Product User Guide (PUG)
Ref. SICCI-ANT-SD-PUG-14-08
Version 2.0 / 05 May 2015
ESA UNCLASSIFIED - For Official Use 18
Figure 2.6 Map of the snow depth standard deviation distribution for
September 2005 in the Southern Ocean. Regions with negative snow depths
are not included. Snow depth standard deviation is given in centimetres.
2.3.2 Content of product files
The distributed product files are so called “Level 4” files that are daily and
monthly gridded maps of snow depth (SD) and SD retrieval uncertainties for
the Southern Hemisphere. Each map has dimension 632 (x-coordinate,
number of columns) times 664 (y-coordinate, number of rows). Each file
contains:
Latitude and longitude for each grid point. Name of the variable is
Latitude and Longitude. These are based on the NSIDC grid with 12.5 km
x 12.5 km grid resolution, in degrees north and degrees east,
respectively
A map of analysed, daily or monthly averaged snow depth. Name of the
variable is SNOW_DEPTH or MONTHLY_AVERAGED_SNOW_DEPTH. This
variable has the unit m and provides a snow depth estimate wherever
the mean daily or monthly sea ice concentration is > 20% (as derived
with the ASI algorithm (see above). Negative SD values are not flagged
in the daily product. Negative SD values are set to zero in the monthly
product.
A map of daily or monthly snow depth retrieval uncertainties. Name of
the variable is SNOW_DEPTH_UNCERTAINTY. This variable has the unit
ANT D1.3 Product User Guide (PUG)
Ref. SICCI-ANT-SD-PUG-14-08
Version 2.0 / 05 May 2015
ESA UNCLASSIFIED - For Official Use 19
m and provides an estimate of the snow depth retrieval uncertainty for
every grid cell with a valid snow depth value (see above).
Each monthly data product file contains in addition:
A map of the snow depth standard deviation for the respective month.
The name of the variable is SNOW_DEPTH_VARIABILITY. This variable
has unit m and provides a measure of the temporal variability of the
snow depth for every grid cell. All non-negative daily snow depth values
of the respective month are considered.
A map of the monthly mean sea ice concentration derived from ASI
algorithm daily sea ice concentration estimates. This variable is
MONTHLY_AVERAGED_SEA_ICE_CONCENTRATION and has unit %.
A map of the occurrence of negative daily SD values. The name of the
variable is NUMBER_OF_NEGATIVE_SNOW_DEPTH. It has no units and
simply counts the number of days for which at the respective grid cell in
the respective month the daily SD values is negative.
A map of the occurrence of daily SD values above 50 cm. The name of
the variable is NUMBER_OF_SNOW_DEPTHS_GT_50_CM. It has no units
and simply counts the number of days for which at the respective grid
cell in the respective month the daily SD values is above 50 cm.
A map of the number of days with valid daily sea ice concentration data.
The name of the variable is
NUMBER_OF_DAYS_FOR_SEA_ICE_CONCENTRATION_AVERAGE. It has
no units and counts the number of days for which at the respective grid
cell in the respective month a valid daily sea ice concentration value
exists. This map can also serve as the land distribution map.
A map of the number of days with valid daily snow depth data. The name
of the variable is NUMBER_OF_DAYS_FOR_SNOW_DEPTH_AVERAGE. It
has no units and counts the number of days for which at the respective
grid cell in the respective month a valid, i.e. non-zero, daily SD value
exists.
2.3.3 Temporal coverage
The daily data set is available in the ESA CCI ANT SD v1.1 product for the
entire AMSR-E period: from June 19, 2002, to October 4, 2011. The monthly
data set is available from June 2002 to September 2011.
Temporal resolution is daily and monthly.
2.3.4 Product grid and geographic projection
The SD datasets is (still) delivered on the NSIDC polar-stereographic grid
[RD-23] and not on the EASE grid v2.0 as the other ESA SICCI products.
Grid center is the South Pole. The tangential plane is located at 70degS. The
grid is not symmetric around to pole along axis given by the 0degE /
180degE meridians but is covering 32 more rows in the direction centered at
the 0degE meridian. The grid coordinates are given in Table 2.1.

ANT D1.3 Product User Guide (PUG)
Ref. SICCI-ANT-SD-PUG-14-08
Version 2.0 / 05 May 2015
ESA UNCLASSIFIED - For Official Use 20
Dimensions X [km] Y [km] Latitude [deg N] Longitude [deg E]
X: 632
Y: 664
X1 … X632: 7900 km
Y1 … Y664: 8300 km
-3950
0
3950
3950
3950
0
-3950
-3950
4350
4350
4350
0
-3950
-3950
-3950
0
-39.2979
-51.3757
-39.2979
-54.7095
-41.5152
-54.7095
-41.5152
-54.7095
317.7633
0.0000
42.2367
90.0
135.0
180.0
225.0
270.0
Table 2.2: Definition of the Southern Hemisphere grid used for the Snow Depth
dataset.
2.3.5 Convention for file names
The ESA CCI ANT SD v1.1 dataset widely follows the ESA-CCI convention for
file names. The daily files are named
ESACCI-SEAICE-L4-SNOWDEPTH-AMSR-SH12kmNSIDCPOLSTEREO-
<YYYYMMDD>-fv01.01.nc
where <YYYYMMDD> denotes the date string with YYYY for the year, e.g.
2002, MM for the month, i.e. 06, and DD for the day, i.e. 19.
<SH12kmNSIDCPOLSTEREO> stands for Southern Hemisphere, NSIDC
polar-stereographic grid with 12.5 km grid resolution.
The monthly files are named
ESACCI-SEAICE-L4-SNOWDEPTH-Monthly-Mean-AMSR-
SH12kmNSIDCPOLSTEREO-<YYYYMMDD>-fv01.01.nc
2.3.6 File format
The Snow Depth datasets are netCDF files following convention CF1.6.
All variables are stored a short (16 bit) integer except the coordinates which
are stored as double precision floating point (double).
2.3.7 Access to data
The Snow Depth dataset can be accessed via:
http://icdc.zmaw.de/projekte/esa-cci-sea-ice-ecv0.html
http://www.iup.uni-bremen.de:8084/amsredata/AMSRE_Snow_Netcdf/
2.3.8 Dataset version history
v1.1: This version.
v1.0: Basic first release; only daily SD and SD uncertainty estimates, no
monthly values; files not following CF-convention; no further information
such as flags and sea ice concentration included.

ANT D1.3 Product User Guide (PUG)
Ref. SICCI-ANT-SD-PUG-14-08
Version 2.0 / 05 May 2015
ESA UNCLASSIFIED - For Official Use 21
< End of Document >


