
Department of Fisheries Annual Report to Parliament 2016/17
Department of Fisheries
Annual Report to Parliament 2016/17
Feedback and queries Each year we strive to improve on our previous year’s Annual Report to ensure the
current publication is as reader-friendly, relevant and engaging as possible.
We would welcome any feedback or suggestions you may have about how we can
improve on this report – please send any comments or queries to
[email protected] or by post to the address below.
Contact details Office address:
Department of Fisheries
Gordon Stephenson House, 140 William Street, Perth WA 6000
Postal Address:
Locked Bag 39, Cloisters Square, WA 6850
Website: www.fish.wa.gov.au
Telephone: 08 6551 4444
Email: [email protected]
ABN: 55 689 794 771
ISSN: 1833-198X
Contents
Welcome to our 2016/17 Annual Report ................................................................. 1
Statement of compliance ................................................................................. 2
Executive summary ......................................................................................... 3
Department overview .............................................................................................. 8
About us .......................................................................................................... 9
The year at a glance ............................................................................................... 13
How we benefit the community of Western Australia ..................................... 14
Stand-out achievements ................................................................................ 16
Significant issues for the Department ............................................................ 21
Performance summary .................................................................................. 23
Financial summary ........................................................................................ 25
How we operate ...................................................................................................... 27
Governance ................................................................................................... 28
Our organisational structure .......................................................................... 31
Our divisions .................................................................................................. 33
Performance management framework .......................................................... 39
How we performed ................................................................................................. 43
Outcomes ...................................................................................................... 44
Fisheries in action .................................................................................................. 56
Cutting red tape to help grow the aquaculture industry ................................. 57
Protecting ocean-users from sharks .............................................................. 59
Recovering the Abrolhos Islands and Shark Bay scallop fisheries ................ 60
Preventing white spot syndrome virus infecting WA crustaceans .................. 62
Enhancing recreational fishing opportunities ................................................. 64
Tackling fishing offences in the rock lobster fishery ....................................... 66
Disclosures and legal compliance ........................................................................ 68
Financial statements ...................................................................................... 69
Key performance indicators 2016/17 ........................................................... 132
Ministerial directives .................................................................................... 153
Capital works program ................................................................................. 154
Governance disclosures .............................................................................. 156
Compliance with relevant written laws ......................................................... 157
Corporate Credit Cards ............................................................................... 160
Board and committee remuneration ............................................................ 161
Other legal requirements ............................................................................. 163
Government policy requirements ................................................................. 171
Appendices ........................................................................................................... 173
Appendix 1 – Stock status and catch ranges for major fisheries ................. 174
Appendix 2 – State Register of authorisations, exemptions and aquaculture leases ...................................................................................... 195

Department of Fisheries Annual Report 2016/17 | Welcome to our 2016/17 Annual Report | Page 1
Welcome to our 2016/17 Annual Report This report provides a comprehensive overview of the Department, its operations
and its performance over the past financial year (ending 30 June 2017). For a brief
summary of our achievements in 2016/17, go to our year at a glance section on page
13. More detailed information on the agency’s operations and performance can be
found in the following sections:
• Go to our Department overview on page 8
• Go to How we operate on page 27
• Go to How we performed on page 43
• Go to Disclosures and legal compliance on page 68
• Go to the Appendices (including the status of fisheries and aquatic resources
table) on page 174
The report has been prepared in accordance with the requirements of the Financial
Management Act 2006, the Fish Resources Management Act 1994 and the Public
Sector Commission’s Annual reporting framework – 2016/17 reporting year.
Making this report accessible Ensuring our publications are accessible to all our readers is a high priority for us.
In this regard, we have been careful to ensure this report meets the accessibility
requirements in the Public Sector Commission’s Annual reporting framework –
2016/17 reporting year and the State Government Access Guidelines for Information,
Services and Facilities.
We have made the information in the report clear and easy to understand.
The design and content ensure it is accessible to people using assistive technologies
and we have included clear explanations of photographs and graphs through
‘alternative text’ descriptions, as well as captions.
To meet the communication requirements of people with disabilities, this report is
also available in alternative formats on request.
Department of Fisheries Annual Report 2016/17 | Welcome to our 2016/17 Annual Report | Page 2
Statement of compliance
To the Hon Dave Kelly, MLA Minister for Fisheries Sir,
In accordance with section 61 of the Financial Management Act 2006 and section
263 of the Fish Resources Management Act 1994 (FRMA), I submit for your
information and presentation to Parliament, the Annual Report of the Department of
Fisheries for the financial year ending 30 June 2017.
The Department also produces the companion publication Status Reports of the
fisheries and aquatic resources of Western Australia, as required by section 263 (a)
of the FRMA. This annual report includes a table on stock status and catch ranges
for major commercial fisheries, derived from the Status Reports of the fisheries and
aquatic resources of Western Australia 2016/2017.
Bruno Mezzatesta
Reporting Officer
Department of Fisheries Annual Report 2016/17 | Welcome to our 2016/17 Annual Report | Page 3
Executive summary
The 2016/17 financial year saw a continuation of the outstanding results achieved in
fisheries management to ensure the continued sustainability of the State’s aquatic
resources. It was also a year in which the Department worked closely with key
stakeholders to prepare for the future legislative and administrative frameworks
within which the agency will provide future services to the State of Western Australia.
This year, 95 per cent of our fisheries were assessed as not at risk from fishing with
the remaining fisheries impacted largely by environmental factors and subject to
recovery programs.
A major milestone was reached during 2016/17 with the passage through Parliament
of the Aquatic Resources Management Bill 2015. Royal Assent was given on
29 November 2016 as Act No. 53 of 2016. The Aquatic Resources Management Act
2016 (ARMA) is a once-in-a-generation change that provides a modern, innovative
framework that will provide a sound basis for effective, efficient and integrated
fisheries and aquatic resource management for decades to come. It is based on the
principles of ecologically sustainable development, and will provide the legal
framework for improved governance.
The ARMA provides the legal framework for improved governance in eight key policy
areas:
• ensuring ecological sustainability;
• risk-based assessment and transparent outcome-focused resource use planning;
• integration of resource protection and use across all sectors;
• security of resource access and allocation of proportional harvest entitlements for
the fishing sectors;
• management of aquaculture and pearling activities;
• protection from the negative impacts of aquatic disease and harmful organisms
(biosecurity);
• devolution and delegation of decision-making, and deregulation; and
• co-operative management arrangements with the non-government sector.
Department of Fisheries Annual Report 2016/17 | Welcome to our 2016/17 Annual Report | Page 4
A key feature of the ARMA is that it is based around the aquatic resource – rather
than the traditional approach based on a fishery or fishing activity. This enables an
integrated approach to providing secure fishing access rights for all sectors, with
resource sustainability at its core. The ARMA allows for existing management
arrangements and resource access rights to remain effective for the State’s
commercial fishing and pearling industries, until each is separately migrated to the
new legislative framework.
The ARMA provides for substantial deregulation of the fish processing sector, and
incorporates new powers that allow the Minister for Fisheries to enter cooperative
management arrangements with, or delegate specific responsibilities to, accountable
non-government organisations. This framework will allow for far greater flexibility in
the long-term for the use of fishing access rights and for developing effective
deregulated arrangements to achieve improved environmental, economic and social
outcomes.
The Department is working with stakeholders towards achieving a structured
implementation of ARMA, but it is important to understand that the transition to
management arrangements facilitated under the ARMA will be evolutionary. For
most commercial and recreational fishers, there will be no immediate significant
change when the ARMA commences.
The Department has continued to harness the enthusiasm of the fishing sector for
implementation of the Marine Stewardship Council (MSC) certification program for
fisheries. The deep-sea crab fishery and abalone fishery were certified by MSC in
2016 as sustainable seafood suppliers. These fisheries join other MSC-certified
fisheries in Western Australia including west coast rock lobster, Shark Bay prawn,
Exmouth Gulf prawn and the Peel-Harvey sea mullet and blue swimmer crab
fisheries.
The Government’s 90-day regulation mapping project identified opportunities to
streamline approval processes within the aquaculture sector. Collaboration between
the Department and the Department of Finance’s Economic Reform Unit has led to
the identification of regulatory changes to cut ‘red tape’ and to simplify and
streamline processes without compromising high biosecurity standards.
Department of Fisheries Annual Report 2016/17 | Welcome to our 2016/17 Annual Report | Page 5
In 2016, the Government announced a project to develop an ‘investment-ready’
aquaculture development zone along Western Australia’s south coast. The area
covered includes the South West, Great Southern and Goldfields-Esperance
regions. The south coast aquaculture development zone will support large-scale
development of the aquaculture industry by attracting investment and jobs into the
region. Planning for the zone has commenced in liaison with key stakeholders.
The work to establish a marine shellfish hatchery at the Albany Aquaculture Park is
progressing on schedule. On-site works have commenced and are expected to be
concluded by October 2017. The hatchery, when operational, will underpin growth of
the marine shellfish sector, particularly oysters and mussels, by providing mass
quantities of spat to grow-out farms.
Another red tape reduction involves relaxing rock lobster catching restrictions on
fishing charter boats. This initiative is aimed at the tourism sector by allowing fishing
charter operators to pull a small number of lobster pots to provide seafood to tourists
on their boats or at accredited restaurants. This year also saw a trial to allow 12,500
additional western rock lobsters to be sold to the local market. This trial allows
commercial rock lobster fishers to catch and tag an additional 50 lobsters each year
for local sale.
During the year, the Government approved nine new Recreational Fishing Initiatives
Fund projects including the development of artificial reefs for Esperance, Dampier
and Exmouth. Two 12-metre-high fish towers will be deployed between Rottnest and
Garden islands to attract pelagic species such as Samson fish, yellowtail kingfish
and yellowfin tuna.
The Department contributed to the Government’s shark hazard mitigation strategies
by upgrading obsolete components of the Shark Monitoring Network (SMN) and
maintaining ‘real time’ alerts to Sharksmart, Surf Life Saving (SLSWA) and Twitter.
Funding was also secured for a continuation of the aerial and beach surveillance
services provided by SLSWA. The Department also maintained its shark hazard
monitoring and operational response capability. Most recently, the Department has
worked to implement a number of new government priorities including a rebate
program for those purchasing approved personal deterrent devices, expansion of the
SMN and early planning for a beach emergency numbering system.
Department of Fisheries Annual Report 2016/17 | Welcome to our 2016/17 Annual Report | Page 6
The Department launched a comprehensive operation codenamed Bagana with a
focus on offending in the rock lobster fishery, particularly in relation to interference
with other people’s fishing gear. This was in response to an upward trend in reports
from the community over previous seasons. As part of the operation an innovative
education and deterrent campaign was launched using a seized vessel with unique
branding which was displayed at various boat ramps and other locations to remind
people of the potential consequences of breaking the rules. Ten vessels have been
seized over the course of the operation to date, with a number of offenders facing
prosecution for a range of rock lobster related offences.
A coordinated response by the Department to a positive detection in Queensland of
White Spot Syndrome Virus has reduced the risk of White Spot Disease in Western
Australian crustacean populations. Arrangements were put in place to ensure that
only products with an acceptable risk profile were allowed into the State. In addition,
statewide biosecurity messaging was distributed to recreational fishers to assist with
identification of the disease and to reduce the risk of the disease in Western
Australia’s aquaculture ventures and iconic commercial and recreational fisheries.
During 2016, the Department undertook many projects to implement a digital
transformation program to improve the customer experience of interactions with
Fisheries. This included continued work on online reporting systems for reporting
catch data for west coast rock lobster fishers as well as simplifying and standardising
catch reporting for many other fisheries. The Department also improved systems to
allow online licensing transactions. A mobile application to provide Fisheries and
Marine Officers (FMOs) with access to recreational fishing licence details while in the
field has enhanced the compliance capability of the agency.
The achievements for the year are testament to the commitment and dedication of
the Department’s staff. Thank you to all. I would also like to thank the previous
Minister for Fisheries, the Hon Joe Francis MLA, and his office for the support and
guidance provided in his tenure as the Minister for Fisheries. Since the election of
the new Government in March 2017, we have welcomed the support of our new
Minister, the Hon Dave Kelly MLA and his staff.
In closing, this is the final Annual Report for the Department of Fisheries, with the
Department to become part of the new Department of Primary Industries and
Department of Fisheries Annual Report 2016/17 | Welcome to our 2016/17 Annual Report | Page 7
Regional Development (DPIRD) from 1 July 2017. I would like to acknowledge the
outstanding contribution the Department and its staff have made to the fisheries and
aquaculture sector in Western Australia over some 30 years. I would also like to
thank our many stakeholders for working with us to achieve sustainable fisheries,
valuable industries and healthy ecosystems. We should all be justifiably proud of our
achievements. I look forward to the opportunities provided with the formation of
DPIRD and to continuing to provide high-quality services and outcomes for the
Western Australian community.
Heather Brayford
DIRECTOR GENERAL
Department of Fisheries Annual Report 2016/17 | Department overview | Page 8
Department overview
Department of Fisheries Annual Report 2016/17 | Department overview | Page 9
About us
The Department of Fisheries’ mandate is set by Parliament through the Fish
Resources Management Act 1994, and the objects of which are:
To develop and manage fisheries and aquaculture in a sustainable way; and
To share and conserve the State’s fish and other aquatic resources and their
habitats for the benefit of present and future generations.
We do this through managing fisheries and aquatic ecosystems, fish stock
assessment and monitoring, enforcement and education, biosecurity management
and commercial and recreational fishing licensing, including commercial aquaculture.
A variety of complex issues impact on the sustainable management of the State’s
fish and aquatic resources. To meet these challenges we employ an integrated
approach to the planning, priority setting and project management of our key
service areas:
Fisheries management; covering policy development, licensing and legislation
related to the State’s commercial and recreational fisheries, pearling, aquaculture,
the aquatic charter industry, customary fishing and protection of aquatic ecosystems,
including safeguarding our aquatic biosecurity.
Enforcement and education; covering statewide fisheries compliance,
communications and community education.
Research and assessment; providing timely, high-quality scientific knowledge and
objective advice to support the management, conservation and sustainable use of
the State’s fish resources and aquatic environment.
These services are delivered by our four divisions, under the management of the
Corporate Executive:
• Strategy and aquatic resources;
• Science and resource assessment;
• Regional services; and
• Corporate services.
Department of Fisheries Annual Report 2016/17 | Department overview | Page 10
Our vision We aspire to be recognised and respected by the WA community for our leadership
in fisheries and aquatic resource management.
Our purpose To deliver sustainable management and development of the State’s fisheries and
aquatic resources by being responsive, resilient and results-focused.
Our values In working with our stakeholders and our colleagues, we demonstrate:
• Excellence in everything we do – delivery of sustained high performance
that meets or exceeds the expectations of clients.
• Unity by working together for a common purpose – working with a shared
purpose with a culture of collaboration and support.
• Respect through working with integrity and courtesy – valuing each other
and all contributions to the Department both internal and external.
• Innovation by developing new ways and embracing change – being open
to challenges and working to find solutions.
• Leadership by showing the way – empowering and developing staff to be
motivated and creative in their work.
Our objectives • Community and stakeholder benefits – working together to provide value
to, and to be valued by, the community and our stakeholders.
• Sustainability – sustainably managing WA’s aquatic resources and fisheries
through a risk-based, dynamic and adaptive approach; and supporting
resilient aquatic resources and ecosystems by being responsive to changing
conditions and management needs.
• Management excellence – striving for excellence through strong
accountability and governance systems, and effective and efficient practices
across all areas of the Department.
Department of Fisheries Annual Report 2016/17 | Department overview | Page 11
What we do We are required by the Fish Resources Management Act 1994 to conserve fish and
protect their environment. In doing so, the Act recognises that sustainable fisheries
management is inextricably linked to the protection of the rich and diverse
ecosystems that support healthy fish stocks and, therefore, fish for the future.
By agreement with the Commonwealth, our responsibilities extend seaward beyond
the three nautical mile limit of the State to the 200 nautical mile limit of the Australian
Fishing Zone.
To achieve our objectives and meet our legislative requirements, we undertake:
• ecosystem-based fisheries management;
• pearling and aquaculture management;
• fisheries research and assessment, enforcement and education services;
• biosecurity management;
• licensing; and
• management of fish habitat protection areas and the Houtman Abrolhos
Islands.
We are also responsible for providing fisheries management and education services
to the communities at the Cocos (Keeling) Islands and Christmas Island, on behalf of
the Commonwealth Government, under Commonwealth legislation that mirrors the
Fish Resources Management Act 1994.
Our other responsibilities include providing at-sea marine safety compliance services
on behalf of the Department of Transport and implementation of the Government's
shark hazard mitigation strategy.
Our stakeholders We regard anyone who values Western Australia’s extensive and diverse aquatic
ecosystems as our stakeholder. Stakeholders have a role to play in ensuring fish
stocks and their habitats are protected, now and into the future. We encourage
stakeholders to participate in consultation about the management and use of aquatic
resources to ensure sustainable and balanced outcomes for the community.

Department of Fisheries Annual Report 2016/17 | Department overview | Page 12
We identify the following groups as stakeholders with an interest in ensuring there
will be fish for the future:
• the community of Western Australia;
• commercial, recreational and customary fishers;
• the pearling and aquaculture industries;
• charter fishing operators;
• fish processors and others involved in the commercial use of Western
Australia’s aquatic resources;
• fisheries volunteers;
• environmental groups and passive users;
• businesses and communities directly and indirectly dependent upon fishing
and aquaculture activities;
• the offshore oil and gas sector; and
• other state, national and international government agencies and
tertiary institutions.
We are committed to consultation with our stakeholders and to ensure efficient and
effective decisions are made.
Department of Fisheries Annual Report 2016/17 | The year at a glance | Page 13
The year at a glance
Department of Fisheries Annual Report 2016/17 | The year at a glance | Page 14
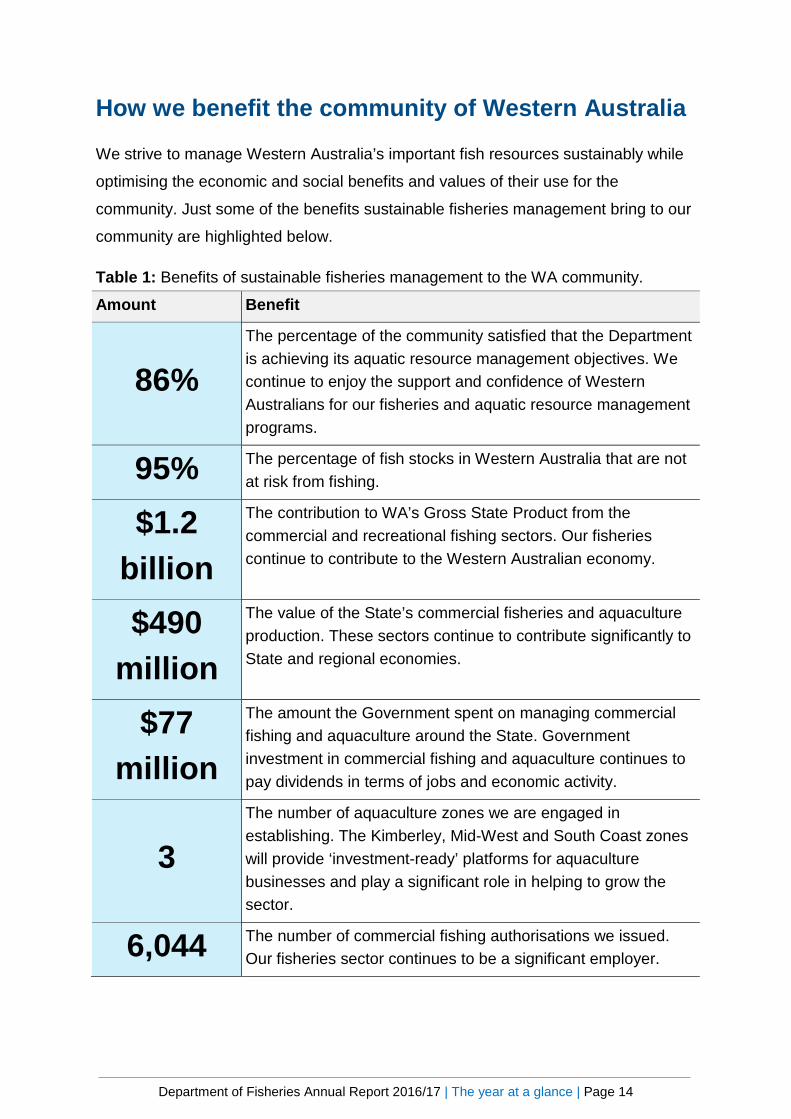
How we benefit the community of Western Australia
We strive to manage Western Australia’s important fish resources sustainably while
optimising the economic and social benefits and values of their use for the
community. Just some of the benefits sustainable fisheries management bring to our
community are highlighted below.
Table 1: Benefits of sustainable fisheries management to the WA community.
Amount Benefit
86% The percentage of the community satisfied that the Department is achieving its aquatic resource management objectives. We continue to enjoy the support and confidence of Western Australians for our fisheries and aquatic resource management programs.
95% The percentage of fish stocks in Western Australia that are not at risk from fishing.
$1.2 billion
The contribution to WA’s Gross State Product from the commercial and recreational fishing sectors. Our fisheries continue to contribute to the Western Australian economy.
$490 million
The value of the State’s commercial fisheries and aquaculture production. These sectors continue to contribute significantly to State and regional economies.
$77 million
The amount the Government spent on managing commercial fishing and aquaculture around the State. Government investment in commercial fishing and aquaculture continues to pay dividends in terms of jobs and economic activity.
3 The number of aquaculture zones we are engaged in establishing. The Kimberley, Mid-West and South Coast zones will provide ‘investment-ready’ platforms for aquaculture businesses and play a significant role in helping to grow the sector.
6,044 The number of commercial fishing authorisations we issued. Our fisheries sector continues to be a significant employer.
Department of Fisheries Annual Report 2016/17 | The year at a glance | Page 15
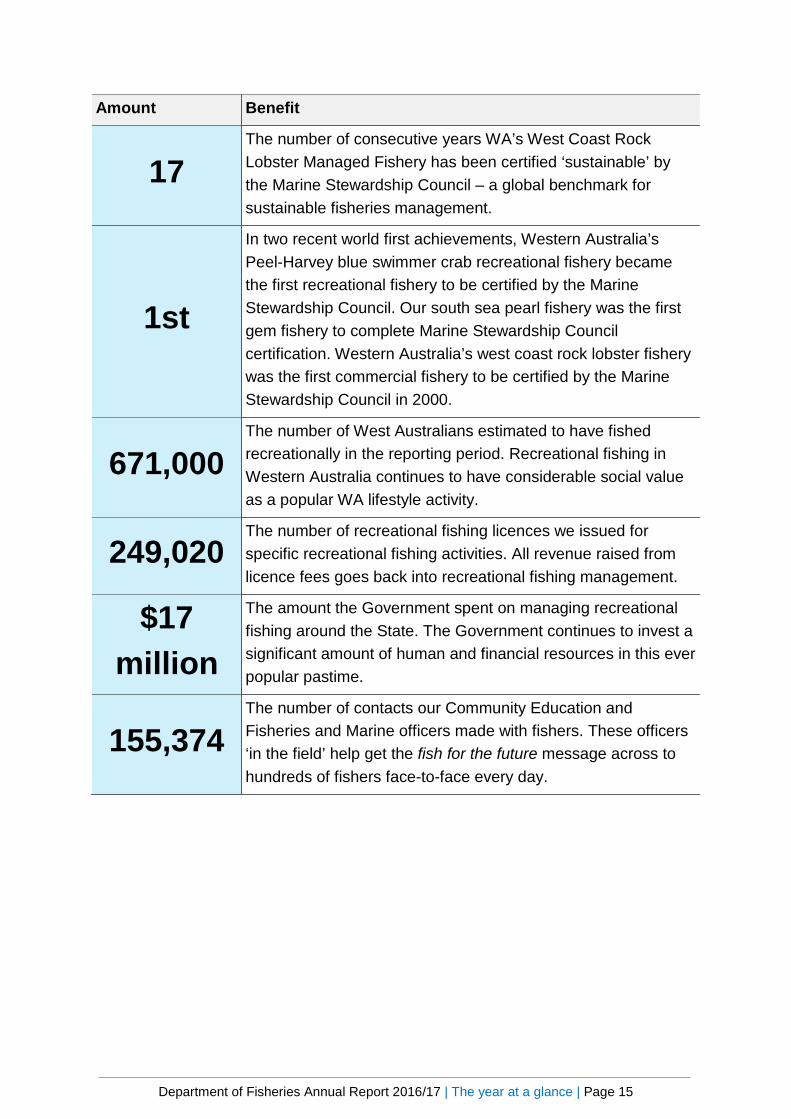
Amount Benefit
17 The number of consecutive years WA’s West Coast Rock Lobster Managed Fishery has been certified ‘sustainable’ by the Marine Stewardship Council – a global benchmark for sustainable fisheries management.
1st
In two recent world first achievements, Western Australia’s Peel-Harvey blue swimmer crab recreational fishery became the first recreational fishery to be certified by the Marine Stewardship Council. Our south sea pearl fishery was the first gem fishery to complete Marine Stewardship Council certification. Western Australia’s west coast rock lobster fishery was the first commercial fishery to be certified by the Marine Stewardship Council in 2000.
671,000 The number of West Australians estimated to have fished recreationally in the reporting period. Recreational fishing in Western Australia continues to have considerable social value as a popular WA lifestyle activity.
249,020 The number of recreational fishing licences we issued for specific recreational fishing activities. All revenue raised from licence fees goes back into recreational fishing management.
$17 million
The amount the Government spent on managing recreational fishing around the State. The Government continues to invest a significant amount of human and financial resources in this ever popular pastime.
155,374 The number of contacts our Community Education and Fisheries and Marine officers made with fishers. These officers ‘in the field’ help get the fish for the future message across to hundreds of fishers face-to-face every day.
Department of Fisheries Annual Report 2016/17 | The year at a glance | Page 16
Stand-out achievements
Aquatic Resources Management Act The Aquatic Resources Management Act 2016 (ARMA) passed through Parliament
in November 2016 following a five-year development phase. The ARMA replaces the
Fish Resources Management Act 1994 and the Pearling Act 1990 to provide a
modern, innovative framework that will provide a sound basis for effective, efficient
and integrated fisheries and aquatic resource management. It is based on the
principles of ecologically sustainable development, and will provide the legal
framework for improved governance.
The ARMA has a 1 January 2019 implementation date, although the transition to
management frameworks facilitated under the ARMA will be an evolutionary one. For
most commercial and recreational fishers, there will be no immediate significant
change. Department staff are working with key stakeholders to develop ARMA
related policies.
As a priority project for the Department, groups across the agency have been busily
developing subsidiary legislation, policy and systems to allow for the implementation
of the ARMA.
The pearl oyster (Pinctada maxima) resource will be the first to be declared an
aquatic resource and transitioned to an ‘Aquatic Resource Management Strategy’
framework when the ARMA commences as the currently separate pearling
legislation will be consolidated under the ARMA.
Making improvements in the rock lobster fishery As part of the red tape reduction program, the Government approved the relaxing of
rock lobster catching restrictions to enhance the tourism experience by allowing
fishing charter operators to pull a small number of lobster pots to allow
holiday-makers the chance to catch and eat rock lobster while on a fishing charter
boat. The changed regulations also allow accredited accommodation facilities to
provide fish storage facilities for their guests and for accredited restaurants to cook
lobster for recreational fishers and fishing charter clients.
Department of Fisheries Annual Report 2016/17 | The year at a glance | Page 17
The Government approved a trial to allow 12,500 additional western rock lobsters to
be sold to the local market. This trial allows commercial rock lobster fishers to catch
and tag an additional 50 lobsters each year for local sale to provide locals and
tourists new opportunities to enjoy seafood over the summer and festive season.
After being the first fishery in the world to achieve MSC certification back in 2000,
and holding its accreditation ever since, WA's western rock lobster fishery is also
now celebrating the renewal of its certification for a further five years.
The Department launched a comprehensive operation codenamed Bagana with a
focus on offending in the rock lobster fishery, particularly in relation to interference
with other people’s fishing gear. This was in response to an upward trend in
information reports from the community over previous seasons. Ten vessels were
seized over the course of the operation in the reporting period, with a number of
offenders facing prosecution for a range of rock lobster related offences.
Aquaculture The Department anticipates the Minister for Fisheries will declare Western
Australia’s second aquaculture development zone in the mid-west Region in late
2017.
The Kimberley Aquaculture Development Zone is now fully allocated. The two
licence holders in the zone, MPA Fish Farms Pty Ltd and Aarli Mayi Aquaculture
Project Pty Ltd, are authorised to grow, respectively, 15,000 and 5,000 tonnes of
barramundi per annum.
The work to establish a marine shellfish hatchery at the Albany Aquaculture Park is
progressing on schedule. On-site works have commenced and are expected to be
concluded by October 2017. The hatchery, when operational, will underpin growth of
the marine shellfish sector, particularly oysters and mussels, by providing mass
quantities of spat to grow-out farms.
Government is also committed to enhancing fish health services to support
aquaculture development with planning well underway for a new state-of-the-art
laboratory within the Indian Ocean Marine Research Centre at Watermans Bay.
The Department is working to streamline aquaculture approval processes through
implementation of the recommendations from the Department of Finance’s 90 Day
Department of Fisheries Annual Report 2016/17 | The year at a glance | Page 18
Red Tape Review. The Department (of Fisheries) has prepared an implementation
plan, has completed one recommendation through revision of the Administrative
Guideline for assessing applications and is in the process of implementing the
remainder.
The Department is undertaking a major project in coastal waters off the south coast.
The aim of the project is to identify areas and zones suitable for large-scale
aquaculture development and to facilitate investment within the sector. Having
identified these locations, the project will also seek to secure the relevant planning
and environmental approvals necessary in order to provide an ‘investment ready’
platform for aquaculture proponents.
Digital transformation We undertook a digital transformation program to transition the Department’s
business processes away from manual processes towards online (digital) platforms,
including the initiatives outlined below.
We developed a new online application portal which allows members of public to
apply for new commercial fishing licences anytime at their convenience. The
development of a new online lodging system, embedded within the Fish Eye Online
Services, now allows fish receivers to upload returns/lodgements onto our system for
processing. The next electronic catch reporting system will be implemented in the
commercial marine aquarium fishery.
We opened up access to aggregated data to communicate shark hazard information,
as part of Western Australia’s shark notification and response system. Our shark
monitoring system provides ‘real time’ information on shark sightings and detections
to response agencies and the public so they can make an informed decision about
their water use.
To assist in the day-to-day activities of Fisheries and Marine Officers a new mobile
application, nicknamed ‘Marlin’, was developed to check recreational fishing
licences. The data records are updated every 24 hours to ensure an officer in the
field has the latest information. In addition, the recently released Infringement
Payment Portal will allow payments to be made by members of the public online.
Department of Fisheries Annual Report 2016/17 | The year at a glance | Page 19
Our finance systems were updated including system processes, interfaces and
activities to allow managers to review and track monthly and year to date
expenditure against budget improving financial management within the Department.
The integration of human resource system with the IT-user directory allows for up to
date information about users within the Department. We implemented digital
workflows to improve transparency, turn-around time and integration with the IT
service desk system. We developed a set of tools to assist fisheries officers and their
managers to track hours worked annually to assist in accurate reporting.
The State Records Act 2000 requires agencies to have an approved Recordkeeping
Plan (RKP) and for this to be reviewed every five years. The Department’s review of
its 2011 RKP was tabled at the State Records Commission meeting in August. Our
review provided evidence of our progress towards better practice recordkeeping.
Subsequently to the review, the Department submitted its amended RKP for
approval by the State Records Commission. The amended RKP demonstrates the
Department’s significant improvements in its recordkeeping practices and a
commitment to progress and maintain its recordkeeping to meet both legislative and
business requirements.
Investing in our people This year the Department invested in further defining and developing the
Department's values. Through a consultative approach run across the Department,
we have been able to develop a behavioural charter, enabling us to translate the
values into a shared understanding of the appropriate behaviours that should guide
our decision making and conduct.
In addition, the Department participated in an evaluation of its misconduct
management arrangements, run by the Public Sector Commission (PSC). The
evaluation reviewed our misconduct management framework, procedures and
processes. The outcomes of the evaluation were positive and provide us with an
opportunity to further enhance those currently in place.
Similar to previous years, the Department has continued its investment in leadership,
with the development of our ‘Women in Leadership’ speaker series. The series

Department of Fisheries Annual Report 2016/17 | The year at a glance | Page 20
invited experienced leaders from across the sector to speak to our staff about their
leadership journey and experience, and was very well received.
In recognition of our continued commitment to initiatives within the workplace that
support positive mental health, the Department was proud to have been nominated
as a finalist for the Mentally Healthy Workplace Award at the WA Mental Health
Awards.

Department of Fisheries Annual Report 2016/17 | The year at a glance | Page 21
Significant issues for the Department
New legislation The new Aquatic Resources Management Act 2016 was passed by Parliament on
17 November 2016 and will provide significant opportunities for us to enhance
fisheries management arrangements in Western Australia for long-term
sustainability, including a focus on risk-based resource management and
strengthening of access rights for the commercial and recreational sectors.
The new legislation will also provide enhanced capacity for aquaculture and
biosecurity management. The Act will commence on 1 January 2019.
Growing the aquaculture sector During the year, all the water earmarked for aquaculture use in the Kimberley
Aquaculture Development Zone was fully allocated with the potential to increase
annual barramundi production to 20,000 tonnes
In addition, the work to establish the Mid West Aquaculture Development Zone is
nearing completion. The Department anticipates the Minister for Fisheries will
declare Western Australia’s second Aquaculture Development Zone in the Mid West
Region in late 2017. A major project is also under way to identify areas and zones
suitable for large-scale shellfish aquaculture on the south coast and to facilitate
investment at those areas.
Capital infrastructure to support aquaculture includes the development of a state-of-
the-art fish health laboratory and construction of a shellfish hatchery near Albany.
Third-party fishery sustainability certification Following the achievement of a world first for the certification of a recreational fishery
(Peel-Harvey blue swimmer crab fishery) and an Australia first certification of a
finfish fishery (Peel-Harvey commercial sea mullet fishery) in June 2016, Western
Australian fishers also secured the certification of an export-based fishery, the west
coast deep sea crab fishery. The deep sea crab fishery operates from Carnarvon to
Bremer Bay and has an annual harvest quota of 140 tonnes. The majority of the
catch is exported to Asian markets with about 30 per cent exported to China. Some
six Western Australian fisheries are now fully assessed for MSC certification.

Department of Fisheries Annual Report 2016/17 | The year at a glance | Page 22
Environmental fluctuations and major climatic events A three-year Fisheries Research and Development Corporation-funded project,
which examined the potential effects of climate change on the marine environment
and key fisheries, as well as management implications, has now been completed.
The study identified that climate changes such as decadal shifts and extreme events
were already having a major impact on fish stocks that required significant shifts in
management. New management policies will be developed in consultation with
stakeholders over time to deal with climate change effects on fish stocks.
The Department is a key collaborator in the National RedMap (Range Extension
Database and Mapping project) project which uses a citizen-science approach to
document range extensions of a number of key, climate-change affected species.
Understanding shifts in populations is likely to be increasingly important to adaptive
fisheries management.
The management of nearshore resources, given their vulnerability to environmental
change and their value to multiple stakeholders, continues to be a focus.
Department of Fisheries Annual Report 2016/17 | The year at a glance | Page 23
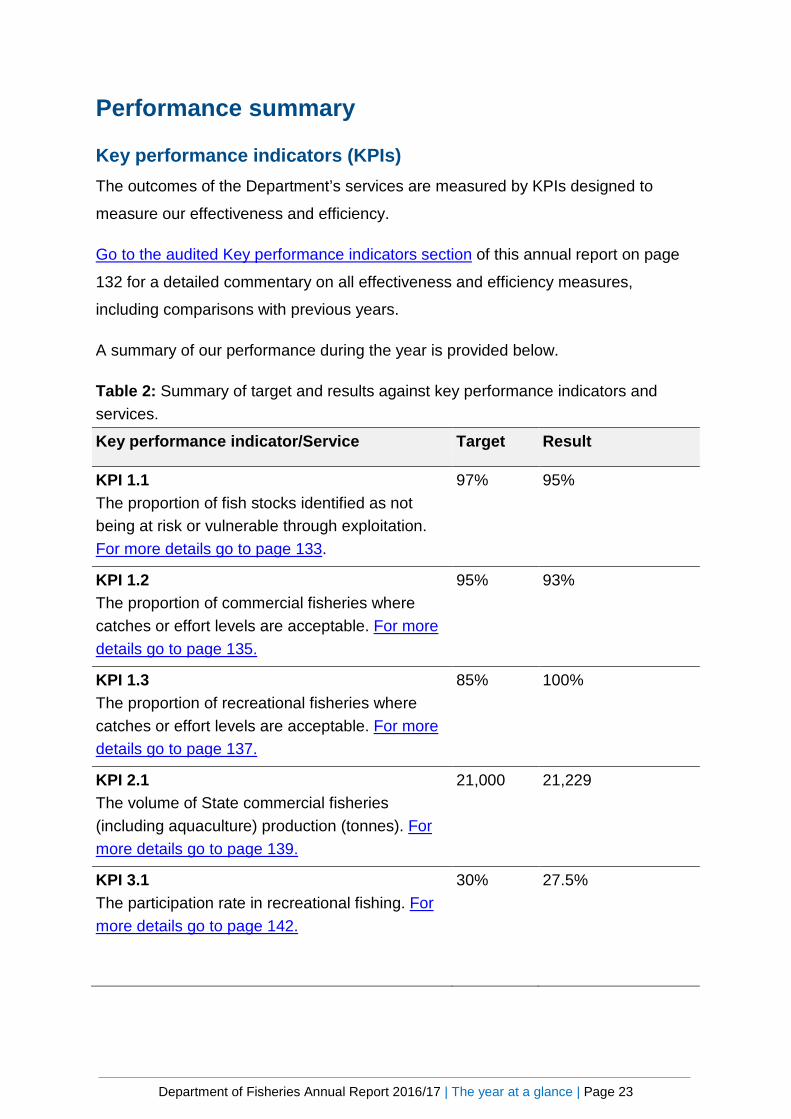
Performance summary
Key performance indicators (KPIs) The outcomes of the Department’s services are measured by KPIs designed to
measure our effectiveness and efficiency.
Go to the audited Key performance indicators section of this annual report on page
132 for a detailed commentary on all effectiveness and efficiency measures,
including comparisons with previous years.
A summary of our performance during the year is provided below.
Table 2: Summary of target and results against key performance indicators and services.
Key performance indicator/Service Target Result
KPI 1.1 The proportion of fish stocks identified as not being at risk or vulnerable through exploitation. For more details go to page 133.
97%
95%
KPI 1.2 The proportion of commercial fisheries where catches or effort levels are acceptable. For more details go to page 135.
95%
93%
KPI 1.3 The proportion of recreational fisheries where catches or effort levels are acceptable. For more details go to page 137.
85%
100%
KPI 2.1 The volume of State commercial fisheries (including aquaculture) production (tonnes). For more details go to page 139.
21,000
21,229
KPI 3.1 The participation rate in recreational fishing. For more details go to page 142.
30%
27.5%
Department of Fisheries Annual Report 2016/17 | The year at a glance | Page 24
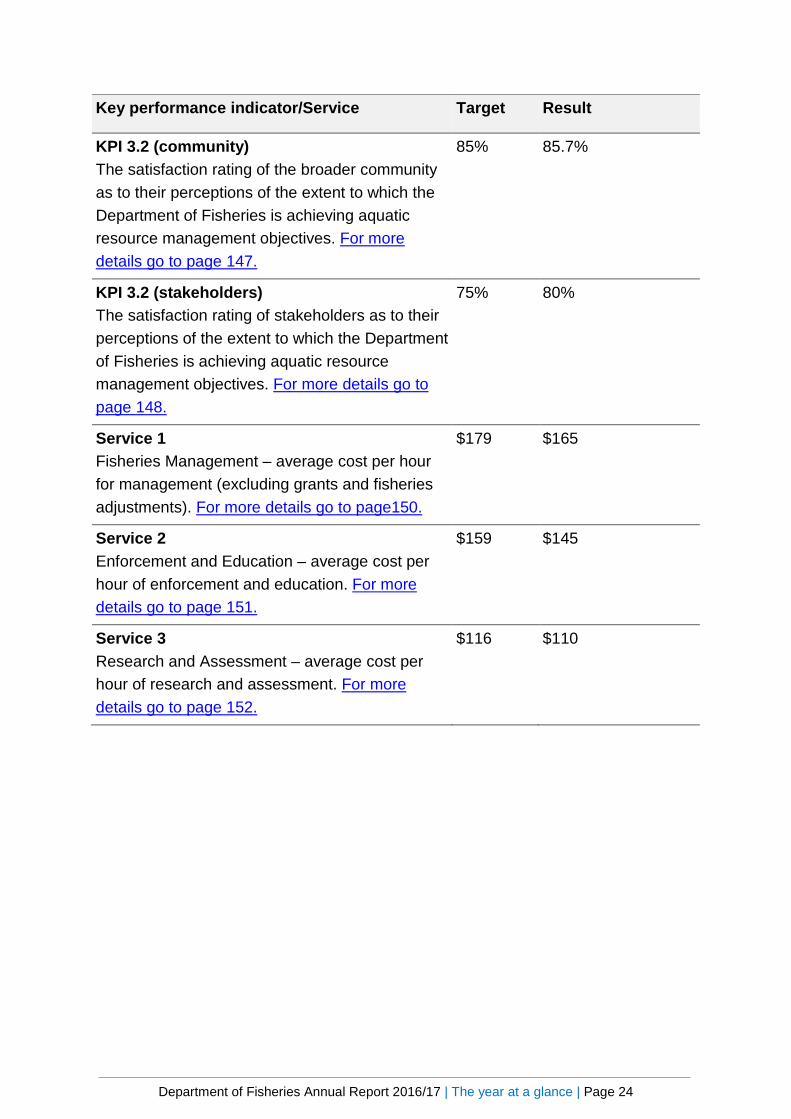
Key performance indicator/Service Target Result
KPI 3.2 (community) The satisfaction rating of the broader community as to their perceptions of the extent to which the Department of Fisheries is achieving aquatic resource management objectives. For more details go to page 147.
85%
85.7%
KPI 3.2 (stakeholders) The satisfaction rating of stakeholders as to their perceptions of the extent to which the Department of Fisheries is achieving aquatic resource management objectives. For more details go to page 148.
75%
80%
Service 1 Fisheries Management – average cost per hour for management (excluding grants and fisheries adjustments). For more details go to page150.
$179 $165
Service 2 Enforcement and Education – average cost per hour of enforcement and education. For more details go to page 151.
$159
$145
Service 3 Research and Assessment – average cost per hour of research and assessment. For more details go to page 152.
$116
$110
Department of Fisheries Annual Report 2016/17 | The year at a glance | Page 25
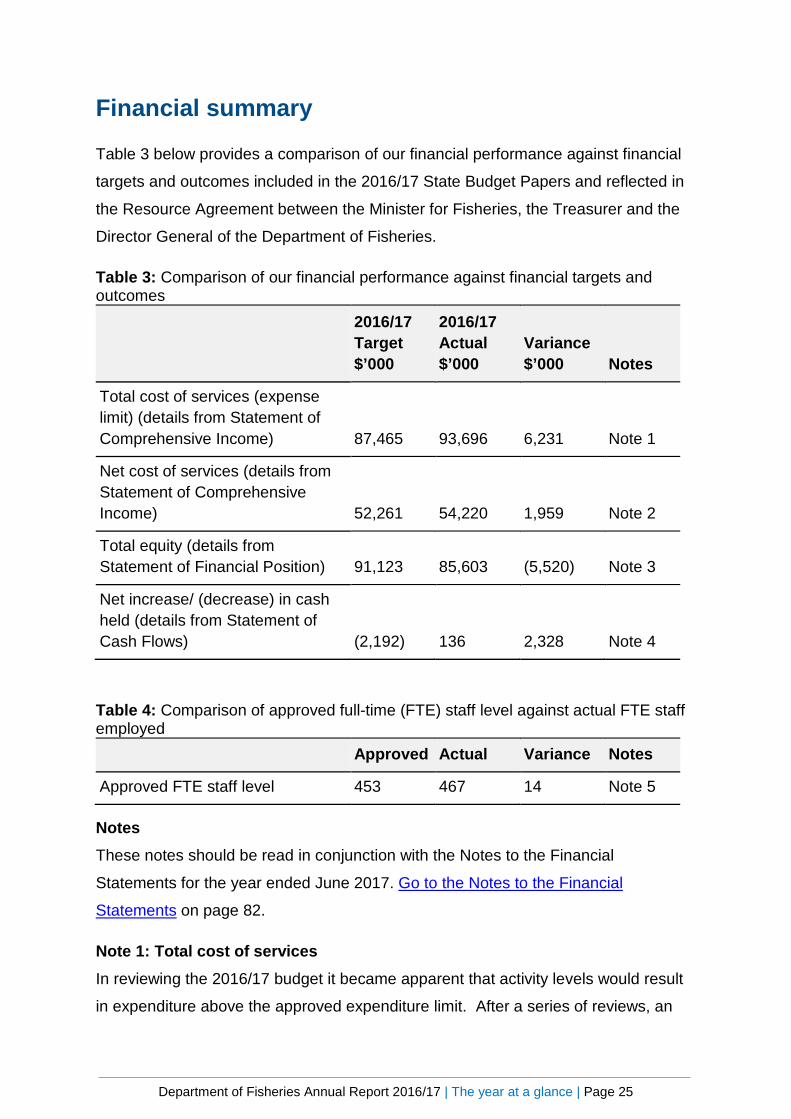
Financial summary
Table 3 below provides a comparison of our financial performance against financial
targets and outcomes included in the 2016/17 State Budget Papers and reflected in
the Resource Agreement between the Minister for Fisheries, the Treasurer and the
Director General of the Department of Fisheries.
Table 3: Comparison of our financial performance against financial targets and outcomes
2016/17 Target $’000
2016/17 Actual $’000
Variance $’000 Notes
Total cost of services (expense limit) (details from Statement of Comprehensive Income) 87,465 93,696 6,231 Note 1
Net cost of services (details from Statement of Comprehensive Income) 52,261 54,220 1,959 Note 2
Total equity (details from Statement of Financial Position) 91,123 85,603 (5,520) Note 3
Net increase/ (decrease) in cash held (details from Statement of Cash Flows) (2,192) 136 2,328 Note 4
Table 4: Comparison of approved full-time (FTE) staff level against actual FTE staff employed Approved Actual Variance Notes
Approved FTE staff level 453 467 14 Note 5
Notes These notes should be read in conjunction with the Notes to the Financial
Statements for the year ended June 2017. Go to the Notes to the Financial
Statements on page 82.
Note 1: Total cost of services In reviewing the 2016/17 budget it became apparent that activity levels would result
in expenditure above the approved expenditure limit. After a series of reviews, an
Department of Fisheries Annual Report 2016/17 | The year at a glance | Page 26
increased expenditure limit of $93m was approved which was funded from increases
in own sourced revenue and cash balances.
Note 2: Net cost of services The increase in net cost of service is due to an increase in total cost of services as
detailed in note 1, which was significantly offset by growth in commercial access fees
revenue.
Note 3: Total equity The reduction in total equity was primarily due to a downward revaluation of the
Fremantle Marine Operation Centre building.
Note 4: Net decrease in cash held The target reduction in cash was due to the planned use of internal cash balances to
fund the planned capital program. During the course of the year it became apparent
that the capital program could only be achieved with additional funding. Approval
was given to increase the drawdown of cash from the holding accounts.
Note 5: Approved full-time equivalent (FTE) The increase in FTEs is reflective of activity levels being greater than approved
expenditure levels as described in note 1 above.
Department of Fisheries Annual Report 2016/17 | How we operate | Page 27
How we operate
Department of Fisheries Annual Report 2016/17 | How we operate | Page 28
Governance
Our Corporate Executive
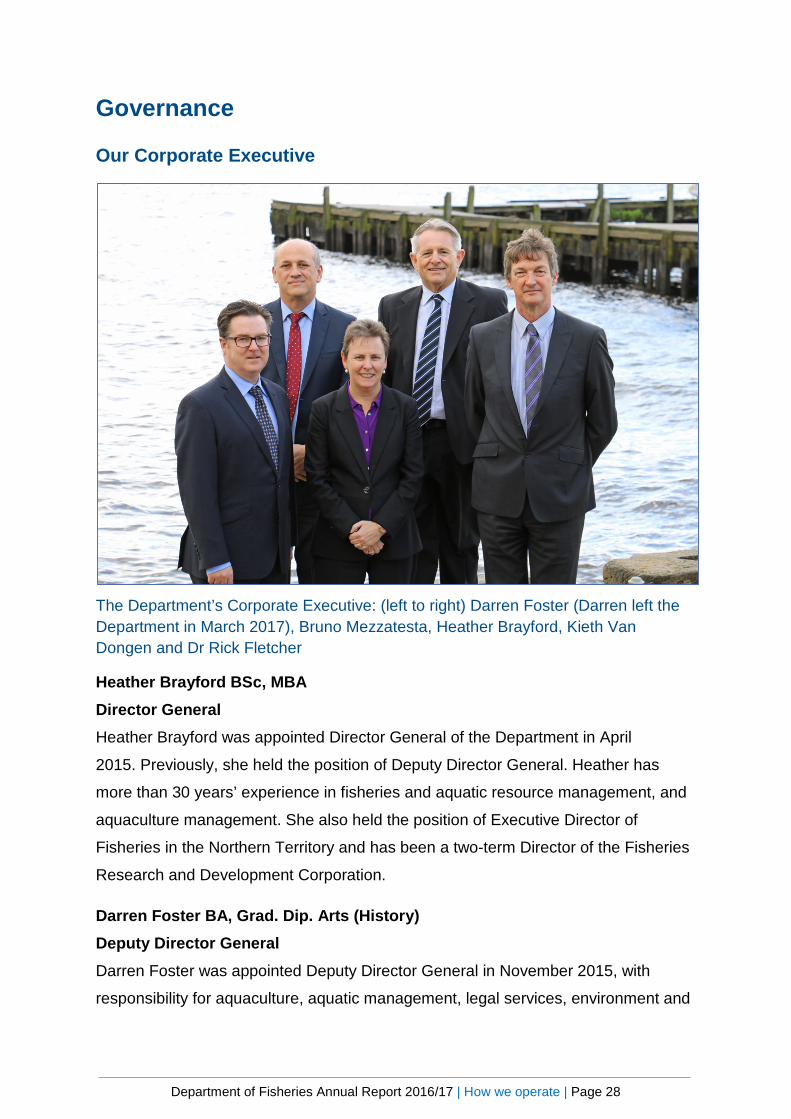
The Department’s Corporate Executive: (left to right) Darren Foster (Darren left the Department in March 2017), Bruno Mezzatesta, Heather Brayford, Kieth Van Dongen and Dr Rick Fletcher
Heather Brayford BSc, MBA Director General Heather Brayford was appointed Director General of the Department in April
2015. Previously, she held the position of Deputy Director General. Heather has
more than 30 years’ experience in fisheries and aquatic resource management, and
aquaculture management. She also held the position of Executive Director of
Fisheries in the Northern Territory and has been a two-term Director of the Fisheries
Research and Development Corporation.
Darren Foster BA, Grad. Dip. Arts (History) Deputy Director General Darren Foster was appointed Deputy Director General in November 2015, with
responsibility for aquaculture, aquatic management, legal services, environment and

Department of Fisheries Annual Report 2016/17 | How we operate | Page 29
biosecurity. Darren left the Department on a secondment to Premier and Cabinet in
March 2017.
Dr Rick Fletcher, BSc (Hons), PhD Executive Director, Science and Resource Assessment Dr Rick Fletcher was appointed as Executive Director, Science and Resource
Assessment, in 2006. This position is responsible for the overall management and
strategic direction of our science and assessment group, which provides the
information needed to underpin our successful aquatic resource management
programs. Rick has more than 30 years’ experience conducting and managing
science and governance programs for fisheries and aquaculture-related issues
across multiple jurisdictions in Australia and the South Pacific, including in the
position of Director of Research for New South Wales Fisheries. His recent research
focus has been on the development of ecosystem-based management frameworks
for marine and coastal systems, for which he is the leader of a number of State,
national and international initiatives.
Bruno Mezzatesta, BBus MBA FCPA Executive Director, Regional Services Bruno Mezzatesta is responsible for our Regional Services Division, which includes
community education and compliance, licensing and communications. Before this
role, Bruno was Director of our Corporate Services Division. He has more than
30 years’ experience in the public sector, including periods with the Office of the
Auditor General and the Department of Treasury.
Kieth Van Dongen, BA, Grad. Dip. Criminal Investigation, Grad. Cert. (Forensic Archaeology) Executive Director, Corporate Services Kieth Van Dongen is responsible for our Corporate Services Division, which includes
people services, information communication technology, records, finance, assets,
procurement and internal audit. Before this role, Kieth was Regional Manager,
Gascoyne Region. He has more than 25 years’ experience in the public sector,
including periods with the Office of the Public Advocate, Ministry of Justice and the
Northern Territory Police Service.

Department of Fisheries Annual Report 2016/17 | How we operate | Page 30
Management Committee The Management Committee is responsible for assisting the Corporate Executive in
setting the Department’s work agenda against identified fisheries and aquatic
management priorities within a five-year plan. Taking a strategic and risk-based
approach to establishing priorities, the committee’s role includes setting clear
objectives and allocating associated budgets; coordinating project planning,
management, monitoring and reporting; and ensuring effective, efficient and
accountable service delivery across the organisation.
The committee includes our four executive directors and the Director, Aquatic
Management.
Internal Audit Committee The Internal Audit Committee maintains and manages our internal audit function on
behalf of the Director General. The committee assists the Director General to identify
and quantify risks to the Department in achieving our goals, and to guide the
development and implementation of risk-mitigation strategies.
Joint Consultative Committee The Joint Consultative Committee acts as a consultative mechanism between
management and nominated ‘workplace’ representatives of the Community and
Public Sector Union/Civil Service Association of WA (CPSU/CSA) for the exchange
of information regarding decisions that impact staff.
Occupational Safety and Health Committee The Department has an active and engaged Occupational Safety and Health (OSH)
Committee made up of elected employee representatives and management
representatives. The committee discusses OSH issues, policies and procedures and
makes recommendations for continuous improvement in the area of staff wellbeing.
Department of Fisheries Annual Report 2016/17 | How we operate | Page 31
Our organisational structure
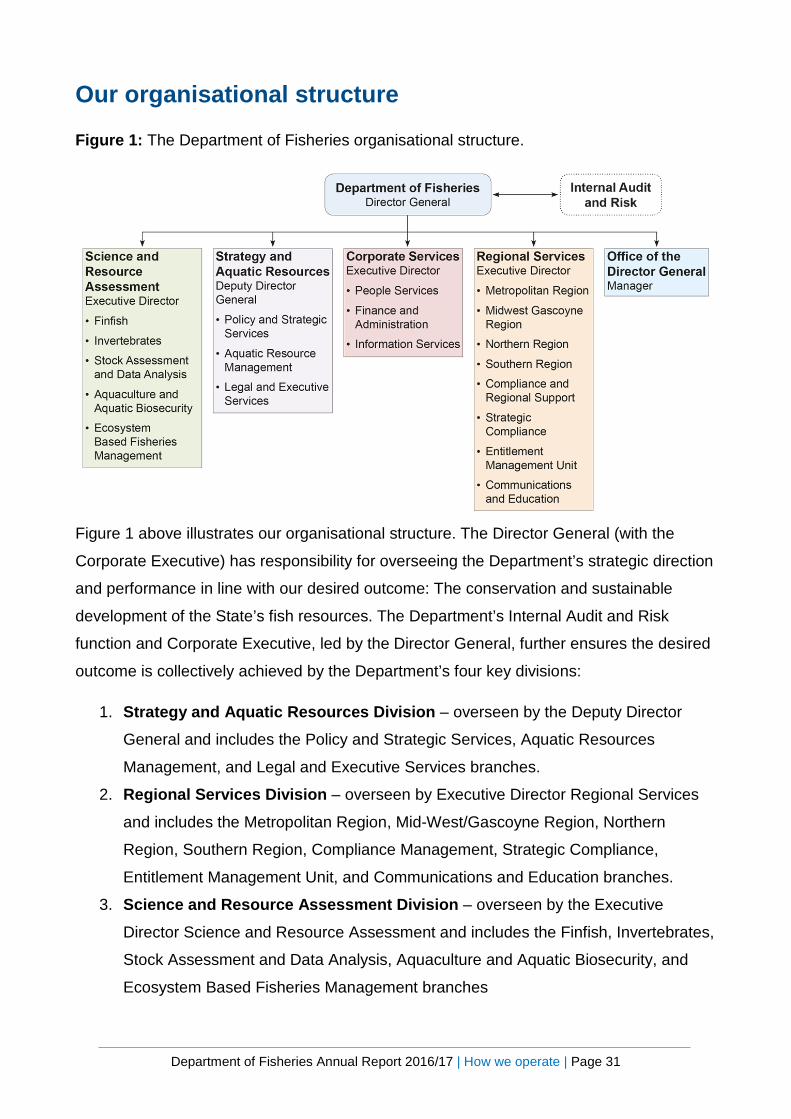
Figure 1: The Department of Fisheries organisational structure.
Figure 1 above illustrates our organisational structure. The Director General (with the
Corporate Executive) has responsibility for overseeing the Department’s strategic direction
and performance in line with our desired outcome: The conservation and sustainable
development of the State’s fish resources. The Department’s Internal Audit and Risk
function and Corporate Executive, led by the Director General, further ensures the desired
outcome is collectively achieved by the Department’s four key divisions:
1. Strategy and Aquatic Resources Division – overseen by the Deputy Director
General and includes the Policy and Strategic Services, Aquatic Resources
Management, and Legal and Executive Services branches.
2. Regional Services Division – overseen by Executive Director Regional Services
and includes the Metropolitan Region, Mid-West/Gascoyne Region, Northern
Region, Southern Region, Compliance Management, Strategic Compliance,
Entitlement Management Unit, and Communications and Education branches.
3. Science and Resource Assessment Division – overseen by the Executive
Director Science and Resource Assessment and includes the Finfish, Invertebrates,
Stock Assessment and Data Analysis, Aquaculture and Aquatic Biosecurity, and
Ecosystem Based Fisheries Management branches
Department of Fisheries Annual Report 2016/17 | How we operate | Page 32
4. Corporate Services Division – overseen by the Executive Director Corporate
Services and includes the People Services, Finance and Administration, and
Information Services branches.
Department of Fisheries Annual Report 2016/17 | How we operate | Page 33
Our divisions
Strategy and Aquatic Resources Division Our Strategy and Aquatic Resources Division works with our Science and Resource
Assessment and Regional Services divisions to develop, implement and review
management strategies aimed at ensuring the sustainability of fisheries resources and
aquatic ecosystems. We carry out fisheries management through the branches below.
Our Aquatic Resources Management Branch manages the State’s commercial,
recreational and customary fishing covering an array of fish, crustacean and molluscs and
stretching across temperate and tropical waters. In addition, the branch is responsible for
managing the pearling industry, land and marine-based aquaculture, and the aquatic
charter industry, as well as overseeing statewide fisheries administration.
It manages and regulates Western Australia’s aquaculture industry, which is currently
showing signs of substantial growth.
The Policy and Strategic Services Branch provides input to the Integrated Fisheries
Allocation Advisory Committee (IFAAC), which advises the Minister for Fisheries on fish
resource allocations between commercial, recreational and customary users. It develops
policy and procedures to protect fish and their habitats throughout WA. This includes
protecting aquatic biodiversity and safeguarding the State’s aquatic biosecurity.
It also provides advice for environmental impact assessments and contributes to state,
Commonwealth and regional marine planning initiatives. Freshwater fish protection and
management are part of its remit.
Our Legal and Executive Branch oversees and develops the Department’s legislative
framework. It provides the Department with legal and strategic policy advice, legal
interpretation, litigation services and management of matters coming before the State
Administrative Tribunal.
It coordinates our regulatory ‘gate-keeping’ requirements and collaborates with the State
Law Publisher to maintain up-to-date versions of the Department’s legislation on its
website for the benefit of stakeholders and the wider community.

Department of Fisheries Annual Report 2016/17 | How we operate | Page 34
Regional Services Division Our Regional Services Division is responsible for our communications, education,
enforcement and licensing activities. These activities ensure fishing rules are understood
and followed, helping us meet our fish for the future objective.
The various activities are developed and delivered by the branches below:
Our Regional Services Branches deliver fisheries compliance and education in
recreational and commercial fisheries, the pearling and aquaculture industries, and in fish
habitat protection areas and marine parks.
Enforcement activities carried out by the branch include marine, land and sea patrols,
aerial surveillance, covert operations, high profile mobile patrols and intelligence driven
operations. The branch has four regional offices –
Mid-West/Gascoyne, Metropolitan, North and South each having a number of district
offices and metropolitan specialist units. The regionally-based staff deliver statewide
biosecurity, shark hazard and fish kill responses.
These regional operational areas are supported by our Perth-based Central Support
Services, Strategic Compliance Policy and Shark Response Unit sections.
The Regional Services Division also supports marine safety initiatives through marine
safety, compliance and education on behalf of the Department of Transport.
Our Entitlement Management Branch provides and oversees licensing for commercial
fishing, recreational fishing, pearling and aquaculture. It manages our licensing systems
(FLAMS and Navigate) and online renewal and payment services. It also maintains a
register of authorisations, exemptions and aquaculture leases, as required under Part 12
of the Fish Resources Management Act 1994. The branch also manages the compliance
with quota allocations in fisheries managed against a set quota.
Our Communications and Education Branch builds community knowledge, values and
attitudes to promote behaviour that supports a healthy aquatic environment.
The branch does this through a range of online, digital and printed communication tools
and engagement activities. Through these channels the branch informs the local
community and visitors about developments in fisheries management, marine science and
compliance to promote adherence to fishing rules and support of our fish for the future
ethos.
Department of Fisheries Annual Report 2016/17 | How we operate | Page 35
Science and Resource Assessment Division The primary role of our Science and Resource Assessment Division is to provide scientific
research information and objective risk-based advice to support the management,
conservation and sustainable use of the State’s fishery resources and aquatic
environment.
Ongoing monitoring and assessment programs support the management of the State’s
major fish stocks and the marine ecosystems that underpin these resources.
The Division works in collaboration with various other organisations with an interest in the
maintenance of sustainable fisheries and marine ecosystems including universities, the
Commonwealth Scientific and Industrial Research Organisation (CSIRO), Australian
Institute of Marine Science, Western Australian Museum, Department of Parks and
Wildlife, other State agencies that operate in the marine environment, Commonwealth
fisheries and environment agencies and border protection agencies.
The Science and Resource Assessment Division is organised into the five branches
below.
Our Invertebrate Branch undertakes scientific programs to assess and monitor the
crustacean, molluscan and other invertebrate stocks that constitute the State’s major
fisheries including rock lobsters, prawns, pearl oysters, scallops, abalone and crabs.
These fisheries support export values of over $400 million as well as valuable recreational
fisheries.
Our Finfish Branch undertakes scientific programs to assess and monitor the State’s
diverse finfish resources. Some of the species monitored include West Australian dhufish,
pink snapper and red emperor – all indicator species for the health of demersal scalefish
resources. Other indicator species monitored and assessed include other temperate and
tropical shallow water and deep water demersal species, sharks, and estuarine and
nearshore species such as bream, whiting and Australian herring.
These species are harvested by commercial fishers (supplying local, national and
overseas seafood markets), the recreational fishing sector and the managed recreational
charter fishing sector.
Our Aquaculture and Aquatic Biosecurity Branch undertakes research and monitoring
activities in order to provide evidence-based advice relating to aquatic animal health,
Department of Fisheries Annual Report 2016/17 | How we operate | Page 36
biosecurity and aquaculture. The branch oversees the State’s aquatic biosecurity and fish
pathology monitoring services, undertakes freshwater fish production research, manages
the production of trout and native fish species, supports the development of marine
aquaculture industry and is responsible for the management of the Department’s marine
aquarium facilities. It also provides chemical and molecular testing and environmental data
collection and analytical support for the wider division and maintains the Department’s
statewide fish kill response program.
Our Surveys, Assessments and Data Analyses Branch (SADA) is responsible for
statistical design and analysis, resource risk assessment, data management, monitoring of
fishery catch and effort, recreational fishing and community surveys, and Departmental
library services.
SADA collects and maintains fisheries catch and effort data. The branch develops and
implements databases to improve the capture and maintenance of the Department’s
extensive data from long-term commercial fisheries, recreational and charter boat sectors.
Combining fishery data with biological data, the branch undertakes statistical analysis and
risk assessment of fisheries and their associated resources.
This branch also organises and conducts all major recreational fishing catch and
community and stakeholder attitude surveys, the results of which are used for some of our
key performance indicators.
Our Ecosystem Based Fisheries Management Branch (EBFM) is a new branch with
dedicated staff that support and help coordinate the compilation of information and inputs
needed to support the submissions required to meet Marine Stewardship Council full
assessment and annual audit criteria. The branch also monitors the health of marine
ecosystems including benthic (seabed and reef) habitats plus the levels of bycatch and
interactions of fisheries with listed and protected species.
Corporate Services Division Our Corporate Services Division provides a range of professional services and support
systems in human resources (HR) management, finance and administration, and
information technology and knowledge management to assist the Department in delivering
its services effectively and efficiently meeting its statutory reporting requirements.

Department of Fisheries Annual Report 2016/17 | How we operate | Page 37
Our People Services Branch provides services across a range of strategic and
transactional functional areas. We manage our own in-house payroll service and HR
management system plus operational HR services including recruitment, job design and
classification, and workforce data reporting. The branch delivers HR policy, strategy and
program development, workforce planning, training and development services,
occupational safety and wellbeing programs. The People Services Branch also provides
management advisory services covering all HR areas, including employee conduct and
behaviour, industrial relations and performance management.
Our Finance and Administration Branch provides accounting services including the
payment of invoices, receipt of payments, preparation of financial statements, bank
account reconciliations, management of credit cards and maintenance of the asset
register. The budget area coordinates the preparation of State budget papers, manages
the interaction with Treasury and coordinates internal budgets and management reporting
processes. The administration group looks after the Department’s building assets,
accommodation leases, facilities management, asset maintenance, vehicle fleet
management and asset investment program.
The Information Services Branch delivers services to ensure that departmental
decisions are based on the best information available within the Department. To this end,
the Information Services Branch delivers support for the management of records and their
supporting databases, information and communications technology and software used by
the Department.
Our operations The Department operates from its head office in the Perth central business district and in
the following metropolitan and regional areas:
• Our Science and Resource Assessment Division operates out of our Western
Australian Fisheries and Marine Research Laboratories in Hillarys, the Pemberton
Freshwater Research Centre and at our Fish Health Section in South Perth.
• Our Communications and Education Branch is based at our Hillarys centre and our
Regional Services Branch also runs some compliance operations from there.
• Our Marine Operations Centre and the Metropolitan Regional Office are in premises
in Capo D’Orlando Drive in Fremantle.

Department of Fisheries Annual Report 2016/17 | How we operate | Page 38
• Our Regional Services Division has four regional offices – Broome, Geraldton,
Fremantle and Albany – and 15 district offices located throughout the State. We
operate the Saville Kent Centre field station on Rat Island at the Houtman Abrolhos
Islands. The Abrolhos Islands Research Institute is located at Separation Point in
Geraldton.
• Our Fisheries Operations Centre in South Perth is where our Biosecurity
Compliance Unit and the Rock Lobster Quota Management Unit is located.
The Watermans Bay Marine Centre has been refurbished as part of a collaborative project
with the Australian Institute of Marine Science, CSIRO and the Oceans Institute at the
University of Western Australia. It opened in 2015, forming part of the Indian Ocean
Marine Research Centre and will bring together more than 200 researchers carrying out
projects in oceanography, fisheries and marine ecology, technologies and engineering.
Addresses and contact details for all our offices can be found on our website in the
‘Contact us’ section. View the contact us section on our website.1
1 http://www.fish.wa.gov.au/About-Us/Contact-Us/Pages/default.aspx
Department of Fisheries Annual Report 2016/17 | How we operate | Page 39
Performance management framework
The Department directly contributes to the Government’s goal of ‘Social and
Environmental Responsibility: Ensuring that economic activity is managed in a socially and
environmentally responsible manner for the long-term benefit of the State’. Our services
are aimed at achieving ‘the conservation and sustainable development of the State’s fish
resources’, the Government’s stated ‘desired outcome’ for the Department.
Successfully managing the conservation and sustainable development of the State’s fish
resources and aquatic environment is based on a continuing interchange of information
between fisheries managers, researchers and fishers. Robust legislation, targeted
enforcement and community education programs play a crucial role in achieving these
outcomes.
When these elements combine effectively, fisheries and their environments are usually
sustainable. If they do not, fish resources and aquatic environments can be put at
significant risk.
Our services are organised to ensure the conservation and sustainable development of the
State’s fish resources and the aquatic environment. We do this through the following
service areas.
Service 1 – Fisheries management includes the development of policy and procedural
frameworks for the management of the State’s fisheries, aquaculture and aquatic
environment including legislation and management plans, consultation with fishing industry
stakeholders and the community.
Service 2 – Enforcement and education raises community awareness and
understanding of fisheries and aquatic management issues and the need to adhere to the
rules governing these activities. This service enforces fishing rules and also plans and
instigates investigations and enforcement strategies.
Service 3 – Research and assessment provides scientific knowledge for the
sustainable management of the State’s fisheries and aquatic resources and the associated
environment.

Department of Fisheries Annual Report 2016/17 | How we operate | Page 40
Performance evaluation and reporting We report on our performance through key performance indicators that contain a mix of
high level effectiveness and efficiency indicators.
Effectiveness indicators show the extent to which we achieved our goal of conserving and
sustainably developing the State’s aquatic resources.
Efficiency indicators are a measure of the cost of resources used in the delivery of
individual services.
Measuring effectiveness in fisheries management presents challenges to fisheries
management agencies worldwide. Therefore, we use dynamic scientific modelling and
robust reporting and assessment systems to estimate the abundance of fish and measure
our effectiveness in achieving the sustainability of fish stocks and the aquatic environment.
The results of this work are published annually in our Status reports of the fisheries and
aquatic resources of Western Australia (the Status Reports). View the Status Reports2 on
our website.
The Status Reports form a snapshot of fisheries sustainability over the preceding 12 to 18
months. We use it, in consultation with stakeholders’ feedback, to review fisheries past
management results. Together with current scientific observations, it informs decisions
about the priorities for fisheries and environmental management, research, compliance
and education in the year under review and future years.
The Status Reports document is tabled in Parliament along with our Annual Report. Go to
the Stock status and catch ranges for major fisheries in Appendix 1 on page 174 for a
summary from the Status Reports’ fisheries sustainability results for 2016/17.
2 http://www.fish.wa.gov.au/About-Us/Publications/Pages/State-of-the-Fisheries-report.aspx
Department of Fisheries Annual Report 2016/17 | How we operate | Page 41
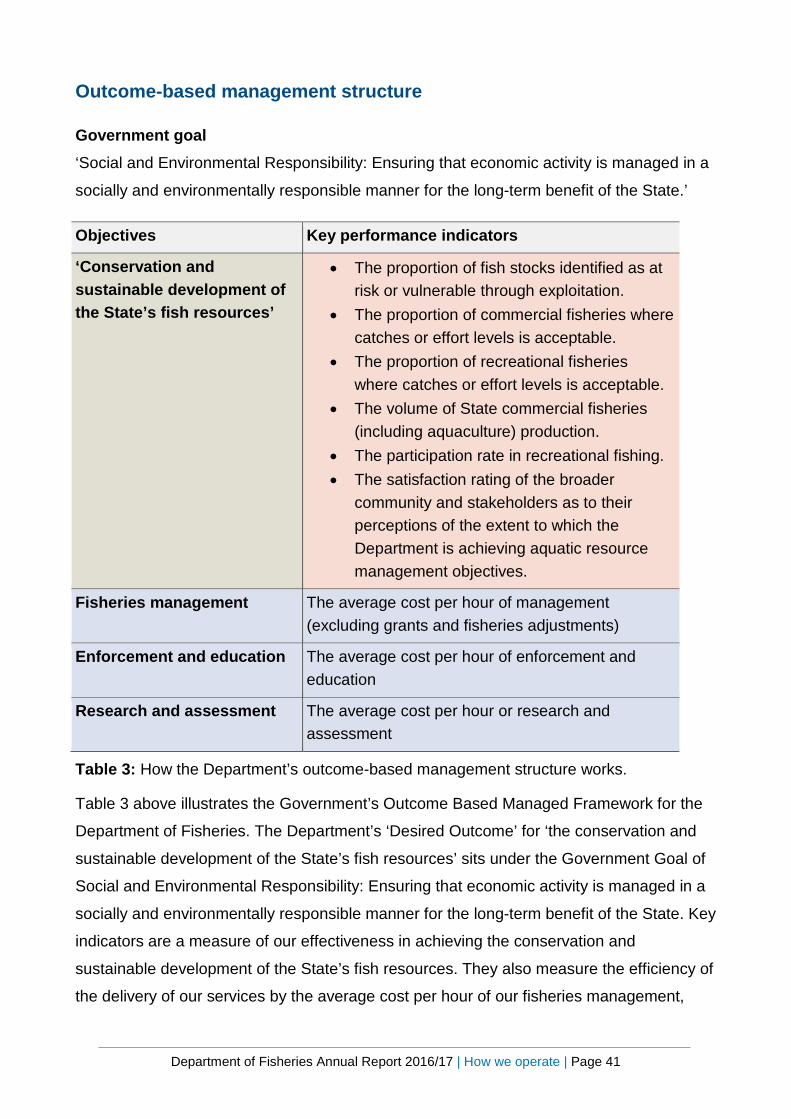
Outcome-based management structure
Government goal ‘Social and Environmental Responsibility: Ensuring that economic activity is managed in a
socially and environmentally responsible manner for the long-term benefit of the State.’
Objectives Key performance indicators
‘Conservation and sustainable development of the State’s fish resources’
• The proportion of fish stocks identified as at risk or vulnerable through exploitation.
• The proportion of commercial fisheries where catches or effort levels is acceptable.
• The proportion of recreational fisheries where catches or effort levels is acceptable.
• The volume of State commercial fisheries (including aquaculture) production.
• The participation rate in recreational fishing. • The satisfaction rating of the broader
community and stakeholders as to their perceptions of the extent to which the Department is achieving aquatic resource management objectives.
Fisheries management The average cost per hour of management (excluding grants and fisheries adjustments)
Enforcement and education The average cost per hour of enforcement and education
Research and assessment The average cost per hour or research and assessment
Table 3: How the Department’s outcome-based management structure works.
Table 3 above illustrates the Government’s Outcome Based Managed Framework for the
Department of Fisheries. The Department’s ‘Desired Outcome’ for ‘the conservation and
sustainable development of the State’s fish resources’ sits under the Government Goal of
Social and Environmental Responsibility: Ensuring that economic activity is managed in a
socially and environmentally responsible manner for the long-term benefit of the State. Key
indicators are a measure of our effectiveness in achieving the conservation and
sustainable development of the State’s fish resources. They also measure the efficiency of
the delivery of our services by the average cost per hour of our fisheries management,

Department of Fisheries Annual Report 2016/17 | How we operate | Page 42
enforcement and education and research and assessment services that we deliver on
behalf of the community.
The Department also participated in cross-agency initiatives with the Department of Parks
and Wildlife to manage the State’s marine parks at Lalang-garrum (Camden sound), Ngari
Capes and the Great Kimberley Marine Park.
Contribution to other Government goals During 2016/17, we also contributed to achieving the following Government goals:
Financial and economic responsibility We continue to achieve more efficient use of the Government’s marine patrol vessels by
collaborating on management, compliance and research responsibilities in the marine
environment with other government agencies including the Department
of Parks and Wildlife, the Department of Transport and the Western
Australian Museum.
Stronger focus on the regions We maintain a strong focus on the State’s regional areas, where most fisheries are
located. The State’s fisheries make a valuable contribution to regional economies,
employment, lifestyle and culture. The Department has regional offices in the Kimberley,
Gascoyne, Mid-West, south metropolitan and Great Southern regions and maintains a
number of district offices from Kununurra to Esperance.
About 75 per cent of departmental expenditure is allocated to activities of benefit to
regional communities.

Department of Fisheries Annual Report 2016/17 | How we performed | Page 43
How we performed
Department of Fisheries Annual Report 2016/17 | How we performed | Page 44
Outcomes
Below we outline the environmental, economic, social and internal management outcomes
achieved during 2016/17. They are presented against the objectives and strategies of our
Strategic Plan 2016-2020, which is designed to achieve the Government’s ‘Desired
Outcome’ for the Department of Fisheries: ‘The conservation and sustainable development
of the State’s fish resources.’
Objective 1: Community and stakeholder benefits Working together to provide value to, and to be valued by, the community
and stakeholders.
Strategy 1.1 Promote sustainable management of aquatic resources and ecosystems to
the community.
• Three fisheries successfully completed the Marine Stewardship Council (MSC)
certification process including the South Sea pearl industry, WA Abalone Fishery, and
the West Coast Deep Sea Crustacean Fishery.
• The West Coast Rock Lobster Fishery was recertified by MSC for the third time in May
2017.
• The Shark Bay and Exmouth Gulf Prawn Managed fisheries underwent the first annual
audit of their MSC Certification. Most conditions were on target with one condition
‘closed out’ (complete) for each fishery at first audit.
• We completed an abalone harvest strategy in consultation with stakeholders during
2016/17.
• The Department undertook a comprehensive review of finfish size limits in consultation
with our stakeholders and, in 2016, we adopted a formal policy that provides a
framework for the application of size limits in Western Australia.
• In March 2017, we extended our social media program to include corporate Facebook
and Twitter accounts, further promoting awareness of the Department’s leadership in
fisheries and aquatic resource management. Communicating through these platforms
has also strengthened our capacity to build relationships with customers, communities
and other stakeholders, providing an opportunity for two-way engagement with clients
and stakeholders. In its first four months, our Facebook and Twitter pages have built up
a sizeable audience with nearly 4,000 followers on Facebook and nearly 500 on
Department of Fisheries Annual Report 2016/17 | How we performed | Page 45
Twitter. Our audience is actively engaged, with each post and tweet consistently
resulting in an audience reach in the tens of thousands and sometimes more.
• We continued to send out our e-newsletter, Catch! (sent to more than 85,000
recreational fishers every two months), providing information on a range of topics from
fishing rules updates to updates on the status of popular fish stocks. The newsletter is
open to all subscribers and is directly offered to people purchasing or renewing a
recreational fishing licence on our website. In addition, we send out our Fish eNews e-
newsletter, which provides news on the State, national and international commercial
fishing industry to anyone involved, or interested, in the WA fishing and seafood
industries.
• We completed a three-year Recreational Fishing Initiatives Fund project that adopted a
Citizen Science approach to engage local crabbing communities in the Swan-Canning
Estuary, the Leschenault Estuary and Geographe Bay to develop cost-effective
methods that deliver information annually on recreational crabbing in these fisheries.
• The number of interactions between whales and rock lobster gear was contained to a
relatively low level of four in 2016, reflecting the success of the gear modifications
introduced in 2014.
• We successfully implemented and completed an observer program in conjunction with
industry and the Western Australian Fishing Industry Council on south coast purse
seine fishery vessels to quantify seabird interactions and mortalities, in accordance
with MSC pre-assessments and reflecting our Ecosystem Based Fisheries
Management approach.
• We delivered aquatic biosecurity training workshops to traditional owners in the
Kimberley, as part of the broader Great Kimberley Marine Park education program.
More than 60 indigenous rangers attended, supported by the Kimberley Land Council,
the Department of Parks and Wildlife and the Yawuru, Dambimangari and Yamatji
Marlpa Aboriginal ranger groups in Broome and further north. The training enables the
rangers to identify and report aquatic pests, diseases and fish kills in the north of the
State. The Department and Dambimangari rangers also delivered aquatic biosecurity
classes to junior rangers and over 60 students at the Derby District High School.
• In 2016, working in partnership with the University of Western Australia (UWA), we
published research showing the endemic freshwater western minnow assists in the
control of mosquito-borne disease in south-west WA by predating upon mosquito
larvae. With UWA and the Department of Health, we evaluated mosquito larvae
Department of Fisheries Annual Report 2016/17 | How we performed | Page 46
predation by estuarine species in the Peel-Harvey region to control mosquito-borne
disease.
• In 2016, in collaboration with university researchers (Murdoch University and UWA), we
identified that half of the endemic freshwater fish in south-west WA are now listed as
threatened. The study also identified that the remaining endemic species, not yet listed
as threatened, are now absent from most permanent waterbodies on the Swan Coastal
Plain.
Strategy 1.2 Ensure appropriate consultation and funding arrangements
with stakeholders.
• In 2016, we established an Aquaculture Research Management Group, to work
collaboratively with the Aquaculture Council of WA (ACWA) to ensure a joined-up
industry/government approach to prioritising the research and development needs of
the developing Western Australian Aquaculture industry.
• We developed and implemented stakeholder engagement guidelines to provide
increased opportunities for stakeholder engagement in the Department’s decision-
making processes
Strategy 1.3 Provide frameworks and supporting systems to enable growth and
development of fisheries and aquaculture resources.
• During 2016/17, our aquaculture research focused on the development of bivalve
aquaculture in the State with work undertaken at the Albany multi-species hatchery.
This has involved identifying suitable bivalve species for aquaculture development, as
well as addressing issues associated with bivalve spat settlement and off-migration. In
addition, significant work has been undertaken on assessing the genetic diversity of
various bivalve species (e.g. scallops and edible oyster species) to provide science-
based policy guidance to the developing industry on likely permissible scenarios for
animal movements that will not pose unacceptable genetic consequences.
• In early 2017, a million-dollar State Government commitment was made to support the
Development of the Watermans Fish Health Laboratory, a state-of-the-art facility
specifically designed to deliver research and investigative needs of the developing
Western Australian aquaculture industry, with a focus on aquatic animal health. The
facility will provide a key hub for interaction with industry, providing a range of support,
training and advisory services and for supporting and coordinating collaborative

Department of Fisheries Annual Report 2016/17 | How we performed | Page 47
government, academic and industry research programs in the field of aquaculture and
aquatic animal health.
• In 2016, we produced and stocked around 500,000 fish for public recreational fishing,
particularly in artificial impoundments, and in 2017, we established a breeding
population of marron to support research that can potentially lead to the enhancement
of the recreational marron fishing experience. The hatchery production and stocking for
these sustainable recreational fisheries is funded by licence revenue.
• The Department submitted its strategic proposal for the Mid West Aquaculture
Development Zone under the Environmental Protection Act 1986 public environmental
review process. As a component of the environmental assessment, the strategic
proposal was published as a fisheries publication with public comment and input invited
for consideration by the Environmental Protection Authority (go to our Fisheries in
action section on page 57 for more information).
• We are reviewing a three-year quota management trial for scallops in Shark Bay. The
quota system has provided industry and the Department with certainty around total
annual catch for the recovering stock and increased security of access for licence
holders.
Strategy 1.4 Work with national, state and regional partners, and with stakeholders to
achieve government outcomes and priorities
• The invertebrate trawl staff assisted with sample collection from key prawn fisheries for
a national traceability project, funded through the Fisheries Research and Development
Corporation (FRDC) national prawn industry partnership agreement.
• We have continued to support FRDC’s national Status of Australian Fish Stocks
reporting process in delivering the third biennial report in 2016 – this included leading
or contributing to 45 national species reports.
• A research workshop was held with partners of the Indian Ocean Marine Research
Centre (UWA, Australian Institute of Marine Science and the Department) to identify
areas of current and future collaborations between the partners.
• Our biosecurity research team continued to lead work at national and international
levels to ensure a joined-up approach to biosecurity research and the development of
state-of-the art surveillance methods, now being implemented throughout the state to
greatly increase our capacity for the early detection of unwanted marine pest species.
• We are working with the Commonwealth Department of Agriculture and Water
Resources (DAWR) to align with developing national management arrangements for
Department of Fisheries Annual Report 2016/17 | How we performed | Page 48
biofouling and ballast water on vessels, under the federal Biosecurity Act 2016.
Workshops with multiple state agencies and other stakeholders were held to ensure
the national arrangements fit with state legislative requirements and protect high-value
State assets.
• In line with a WA Government commitment to provide services to the Indian Ocean
Territories (IOTs), there continues to be a service level agreement between the
Minister for Fisheries and the Commonwealth Department of Infrastructure and
Regional Development to provide fisheries management, research, community
education and compliance services at the IOTs.
• The Department is working with the Department of Premier and Cabinet and other
government departments on the Strategic Assessment of the Perth and Peel Regions
(SAPPR). The SAPPR is a WA Government priority which seeks to streamline
approvals (particularly Commonwealth) for major developments over the next 20 years
in the Perth and Peel Regions, taking into account forecast population growth and
matters of national environmental significance.
• The Department worked with the Shark Monitoring Systems company, local
government, Curtin University and the Office of the Government Chief Information
Officer to trial the ‘Clever Buoy’ shark detection technology at City Beach (go to our
Fisheries in action section on page 59 for more information).
• In 2017, we implemented the WA Government’s rebate scheme for purchasers of
approved shark deterrent devices and expanded the State’s shark monitoring system
by deploying two new satellite-linked receivers off the coast of Esperance (go to our
Fisheries in action section on page 59 for more information).
• We have continued to support the establishment of artificial reefs funded through the
Recreational Fishing Initiatives Fund to enhance recreational fishing opportunities (go
to our Fisheries in action section on page 64 for more information).
• In February 2017, the Department undertook a new initiative to survey community and
stakeholder views on licence sanctions to assist in the preparation of sanction
guidelines. The survey indicated overwhelming community support for the use of
licence sanctions for a range of serious offences.
Strategy 1.5 Have regard for social and economic considerations in addition to ecological
outcomes in decision making.
• We undertook a collaborative project with a number of Shark Bay Prawn Fishery
licence holders to identify ways to improve the economic performance of the fishery
Department of Fisheries Annual Report 2016/17 | How we performed | Page 49
through bio-economic modelling of the daily costs and revenue of fishing and
assessing the value of closures near the full moon periods.
• The Department worked with the Western Rock Lobster Council (WRLC) in a trial
initiative in late 2016, to enable local residents, tourists and local businesses to access
fresh, locally caught rock lobster in regional Western Australia. The trial, which
concluded in April 2017, allowed the master of an active fishing boat to sell 50 rock
lobster locally and in some cases from the back of the boat. Eight tonnes of rock
lobster entered local markets and communities in this way. The trial received positive
community feedback and we are working with WRLC with a view to continuing and
developing the initiative. We also relaxed rules relating to taking rock lobsters on
fishing charters. This will allow the fishing charter industry to offer a broader range of
fishing and seafood related experiences.
• The Department launched Operation Bagana with a focus on rock lobster fishery
offences, particularly those that involved interfering with other people’s fishing
gear. The ‘Don’t risk your boat’ campaign was complemented by the use of
sophisticated surveillance and other compliance checks on land and sea, day and
night. We partnered with other environmental and law enforcement agencies to help
gather intelligence and target offenders, as well as appealing to the community through
a variety of media and communication channels to encourage them to come forward
with information to support the operation (go to our Fisheries in action section on page
66 for more information).
• Two draft harvest strategies (for the Gascoyne demersal scalefish resource and the
Australian herring resource) were developed and released for public comment during
2016/17.
• In early 2017, the Shark Bay Crab Stock Assessment Working Group, comprised of
Department staff and industry representatives, was established to develop a harvest
strategy for the fishery that will guide annual total allowable commercial catch
recommendations and overall management decisions.
Objective 2: Sustainability Sustainably managing WA’s aquatic resources and fisheries through a risk-based,
dynamic and adaptive approach, and supporting resilient aquatic resources and
ecosystems by being responsive to changing conditions and management needs.
Department of Fisheries Annual Report 2016/17 | How we performed | Page 50
Strategy 2.1 Ensure all significant impacts on aquatic resources and ecosystems are
understood and managed according to risk.
• The monitoring of invertebrate stocks affected on the extreme marine heatwave of the
summer of 2010/11 has shown the recovery of scallop stocks in Shark Bay and the
Abrolhos Islands, the crab stocks in Shark Bay and the tiger prawn stocks in Exmouth
Gulf (go to our Fisheries in action section on page 60 for more information).
• A reassessment of the risks for the full set of aquatic resources identified for Western
Australia through the Ecosystem Based Fishery Management (EBFM) initiative was
completed in 2016/17. These 80 regional-level risks are taken into account for the
Department’s planning processes to determine appropriate adjustments in agency-wide
priorities and activities.
• A risk assessment of the western rock lobster fishery, based on EBFM principles, was
undertaken assessing ecological, economic and social factors relating to the fishery’s
management as well as associated governance issues.
• We changed management from effort controls to catch quota controls for Shark Bay
scallop and crab fisheries to make the fishery more sustainable and resource-sharing
between the prawn trawl fishery, scallop trawl fishery and crab trap fishery more
equitable. The new approach also provides fishers with greater flexibility around when
they fish the resource.
• In 2016/17, the Department continued to progress the south coast line and net fishery
review and, in September 2016, we released the Review of South Coast Commercial
Fish Trap, G-net and Open-Access Line, Net and Squid Jig Fisheries – South Coast
Independent Access Panel’s (IAP) draft report for public comment. After feedback on
the draft, the IAP provided its final report to the Department in November 2016. The
Department continues to work on the review with a view to establishing new
management plans for south coast line, fish trap, squid jig and net fisheries by the end
of 2018.
• A review of abalone aquaculture was undertaken with a subsequent paper published in
May 2017.
• Fishing resumed in the Abrolhos Island and Mid-West Trawl Managed Fishery for
scallops after a five-year closure due to adverse environmental conditions with over
100 tonnes of scallop meat landed and positive signs for fishing in 2018. A scallop
stock enhancement project is also taking place at the Abrolhos, with scallops tagged
and translocated from recovering areas to historical areas of abundance that have

Department of Fisheries Annual Report 2016/17 | How we performed | Page 51
shown limited signs of recovery (go to our Fisheries in action section on page 60 for
more information).
• There were a number of fish kill responses launched in 2016/17, including repeated
fish kill events in the Murray River.
• The Department worked closely with state and federal stakeholders in an emergency
response to the significant threat posed by the white spot disease outbreak which
occurred in Queensland during 2016/17. This involved increased levels of surveillance
of imported product, regulatory control, national representation and stakeholder
education in order to effectively mitigate the risk to Western Australia (go to our
Fisheries in action section on page 62 for more information).
• We continued to work closely with industry stakeholders (Chevron Australia, Ports WA
and Curtin University) to continue to validate and implement new marine surveillance
tools. This new program uses both passive and active surveillance measures with the
objective of identifying the first stages of any marine pest invasion.
• Our biosecurity staff managed an incident in which Asian green mussel, a nationally
significant marine pest not established in Australia, had been detected on the hull of a
cruise ship. We worked with the cruise company and port authorities to minimise the
risk of the mussels spreading into WA. Multiple dives, supervised by specialist
biosecurity compliance staff, took place to remove any pest mussels. This reduced the
risk sufficiently to enable the vessel to continue operating until it could be fully cleaned
when subsequently dry-docked. The response balanced the need to protect the State’s
marine environment and the importance of cruise ship stop-overs to our regional towns
and their economies.
• We ran Operation SAKAR in February 2017 over a two-week period targeting the
importation to WA of noxious and high-risk fish through the domestic airport. The level
of trade, value and fish species coming into the State was not previously known and
this information will assist with the formation of policy in this area and inform the
development of regulations under the new Aquatic Resource Management Act and
future biosecurity management.
• We launched the completed version of ‘Vessel Check’, an online biofouling risk
assessment tool for stakeholders to assess the risk of marine pests on incoming
vessels to WA. The fully automated tool is now state standard for biofouling risk
assessment, and is available online to all commercial stakeholders such as shipping
managers, biofouling inspectors, and the environmental managers in the oil and gas

Department of Fisheries Annual Report 2016/17 | How we performed | Page 52
sector. This tool empowers stakeholders to take responsibility for managing marine
biosecurity risks for themselves.
Strategy 2.2 Share the State’s aquatic resources and ecosystems in an equitable, open,
transparent and sustainable manner.
• Aarli Mayi Aquaculture Project Pty Ltd was granted a licence and lease for a site in the
Kimberley Aquaculture Development Zone and MPA Fish Farms Pty Ltd was granted
approval to expand its operational area within the zone. The zone is now fully allocated
with MPA Fish Farms Pty Ltd and Aarli Mayi Aquaculture Project Pty Ltd authorised to
grow, respectively, 15,000 and 5,000 tonnes of barramundi per annum.
• In November 2016 the Integrated Fisheries Allocation Advisory Committee released its
draft allocation report on its proposals for the allocation of the Pinctada maxima pearl
oyster resource. At the same time, the Department released its integrated fisheries
management resource report on the P. maxima resource.
Strategy 2.3 Ensure legislation meets contemporary fisheries and aquatic resource
management requirements.
• The new Aquatic Resources Management Act was passed by Parliament on 17
November 2016 and will provide significant opportunities for us to enhance fisheries
management arrangements in Western Australia for long-term sustainability, including
a focus on risk-based resource management and strengthening of access rights for the
commercial and recreational fishing sectors. The new legislation will also provide
enhanced capacity for aquaculture and aquatic biosecurity management. The Act will
commence on 1 January 2019.
• The Department is working to streamline aquaculture approval processes through
implementation of the recommendations from the Department of Finance’s ‘90 day red
tape review’. The Department has prepared an implementation plan, revised the
administrative guidelines for assessing applications and is in the process of
implementing other recommendations identified in the review.
Objective 3: Management excellence Striving for excellence through strong accountability and governance systems, and
effective and efficient practices across all areas of the Department.
Department of Fisheries Annual Report 2016/17 | How we performed | Page 53
Strategy 3.1 Use risk-based approaches for all agency resource management and
planning decisions.
• The Department reached formal agreement with the Shark Bay Prawn Trawler
Operator’s Association for the provision of aggregated VMS information to assist and
enhance the management of voluntary area closures within the fishery. The
arrangement has been successful in improving both voluntary and statutory closed
area compliance. Using a risk-based approach this has supported decision making for
increased use of voluntary closures to manage both economic and sustainability
closures, thereby reducing statutory resourcing and costs. It has also increased
operational flexibility for licensees.
• During 2016/17, the Department led a national project to build a model for measuring
the effectiveness of compliance effort to ensure that resources are efficiently deployed.
• During the year, the Department transitioned a further 29 commercial fisheries into a
licensing system capable of facilitating electronic transaction processing by clients.
• A portal to allow fishers to apply for commercial fishing licences online was
implemented and a payment portal was introduced during 2016/17 to allow for online
payments for infringement notices.
Strategy 3.2 Promote and maintain a high performance, agile culture with staff working
together to achieve our priorities.
• During 2016/17, the Department refreshed its performance management system and
greatly increased the number of staff engaging in performance management.
• Our Corporate Services Division continued to support and coach managers dealing
with workplace performance and other issues, making managers more confident and
capable.
• In 2016/17, the Department continued work to support women in leadership, with a
series of events featuring presentations from inspirational women in leadership
positions.
• We increased our use of online training, engaging with a new flexible online learning
platform, to ensure efficient delivery of tailored information to all staff. We continued to
support the development of senior managers attending and participating in whole of
sector training courses and seminars.
• We progressed the Department’s recordkeeping program with a review of the
recordkeeping plan and the development and implementation of policies and
Department of Fisheries Annual Report 2016/17 | How we performed | Page 54
procedures. Consultation, training and support was conducted across the Department
including within regional offices.
Strategy 3.3 Develop and align strategy and resource management of finances, our staff,
physical infrastructure, information and technology to support the delivery of Department
priorities.
• Electronic catch reporting through our Fish Eye system has been developed for the
Marine Aquarium Fishery and is included as an operational part of a new integrated
management plan. • In 2016/17, we enhanced the integration of our finance and payroll systems including
system processes, interfaces and activities to allow managers to review and track
monthly and year-to-date expenditure against budget improving financial management
within the Department.
• In 2016, we launched Map Portal, a simple-to-use interactive map viewer that provides
staff with access to fishing and other government location information for better
situation awareness.
• We have continued to manage staff leave to reduce agency leave liability, while
ensuring the Department’s high priority activities continue and strategic objectives are
met.
• In the 2016/17 financial year, through comprehensive analysis and management of
leave records, following disengagement from the now defunct Shared Services system,
the Department was able to satisfy the Office of the Auditor General that our employee
benefit calculations are reliable.
• Our digital transformation continued in 2016/17 with improved online application and
data capture systems for commercial fishers and receivers. We enhanced our
enforcement capacity with a new mobile application to check recreational fishing
licenses. We improved access to shark monitoring for the public and simplified some
administrative processes by creating online forms, simplified charts and process maps.
• In 2016/17, we launched a Go Digital program to move the Department towards a
wholly digital recordkeeping environment. This has improved access to information and
reduced the risk of losing it as well as improving the security and confidentiality of
records. An environmentally friendly measure, it has also substantially reduced the use
of paper, ink and toner.

Department of Fisheries Annual Report 2016/17 | How we performed | Page 55
Strategy 3.4 Ensure that our greatest asset (our people) are valued and their welfare is a
priority. • We refreshed our Strategic Plan during the year, with an emphasis on involvement of
staff from across the Department. A collaborative review of corporate values and an
internal communications plan followed, which were implemented within the year.
• We continued to develop and implement our mental health strategy with a broadened
focus from suicide prevention to general mental health. We were named as finalists in
the 2017 Mentally Healthy Workplace Awards.
• RUOK? Day was promoted in 2016 with the theme ‘Look Deeper to Support a
Colleague'.
• Following our Occupational Safety and Health (OSH) audit and Silver Worksafe
Accreditation, our risk-based OSH improvement plan is in place, and work is under way
to address priorities.
• Our grievance management policy and procedures have been reviewed and updated,
introducing a new complaint form to enable easier reporting. These are available for
employees on our Intranet.
• We have incorporated a dedicated gift and secondary employment declaration process
into our conduct and behaviour policy and procedure, to facilitate reporting and
decision making.
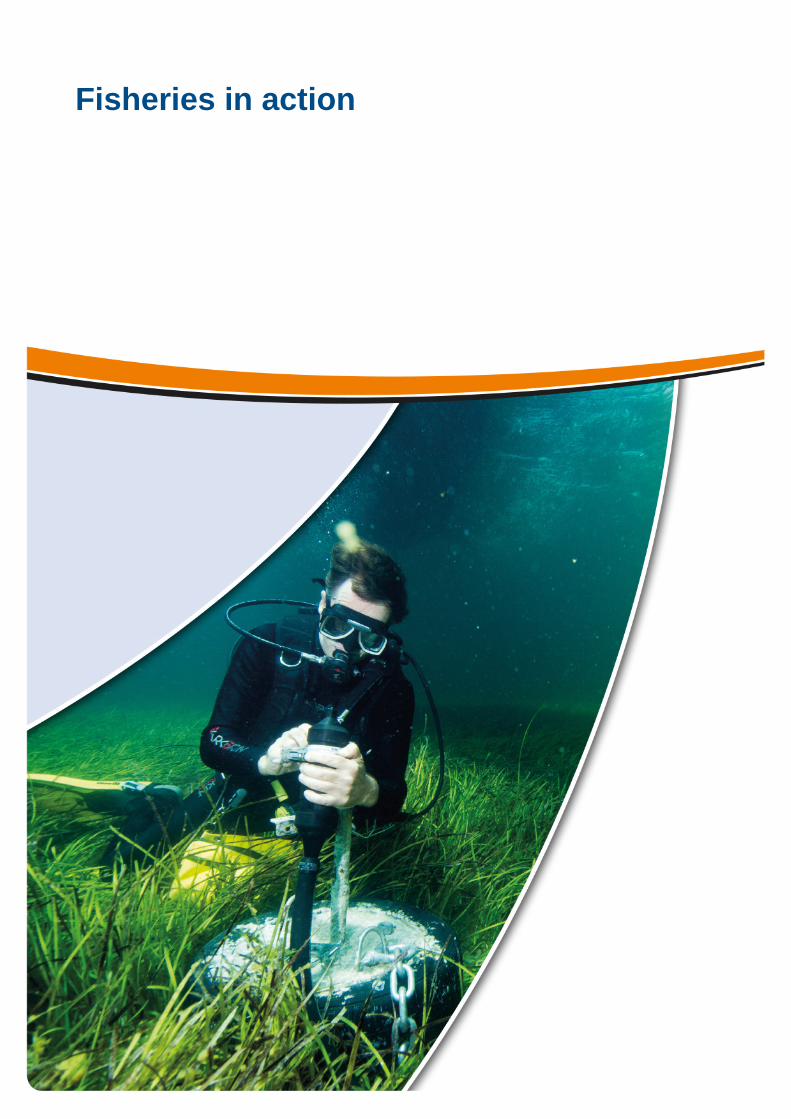
Department of Fisheries Annual Report 2016/17 | Fisheries in action | Page 56
Fisheries in action
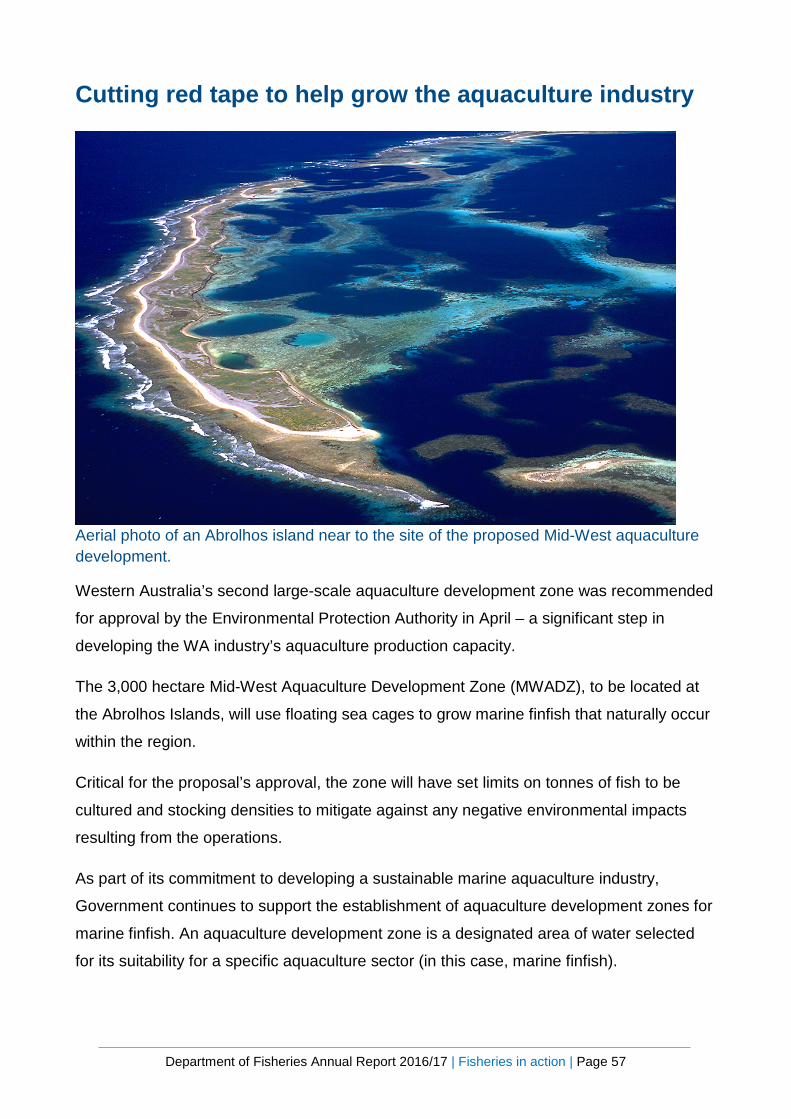
Department of Fisheries Annual Report 2016/17 | Fisheries in action | Page 57
Cutting red tape to help grow the aquaculture industry
Aerial photo of an Abrolhos island near to the site of the proposed Mid-West aquaculture development.
Western Australia’s second large-scale aquaculture development zone was recommended
for approval by the Environmental Protection Authority in April – a significant step in
developing the WA industry’s aquaculture production capacity.
The 3,000 hectare Mid-West Aquaculture Development Zone (MWADZ), to be located at
the Abrolhos Islands, will use floating sea cages to grow marine finfish that naturally occur
within the region.
Critical for the proposal’s approval, the zone will have set limits on tonnes of fish to be
cultured and stocking densities to mitigate against any negative environmental impacts
resulting from the operations.
As part of its commitment to developing a sustainable marine aquaculture industry,
Government continues to support the establishment of aquaculture development zones for
marine finfish. An aquaculture development zone is a designated area of water selected
for its suitability for a specific aquaculture sector (in this case, marine finfish).

Department of Fisheries Annual Report 2016/17 | Fisheries in action | Page 58
These zones provide ‘investment ready’ platforms with strategic environmental approvals
and management policies already in place, allowing commercial aquaculture operations to
be set up without the need for lengthy, complex and expensive approval processes.
Consequently, opportunities for existing aquaculture operations (fish farms) to expand are
being created and for new ones to be established, with the objective of providing economic
benefits to the local community through job creation and regional economic diversification.
Department of Fisheries Annual Report 2016/17 | Fisheries in action | Page 59
Protecting ocean-users from sharks
Government adopted a renewed focus on effective measures to reduce the likelihood of a shark attack.
Government has implemented a number of initiatives to help improve community
awareness of shark activity, provide protection at WA’s most popular beaches and provide
community safety information to allow ocean-users to make informed decisions about
participating in ocean-based activities.
More than $33 million has been invested in a broad range of shark hazard mitigation
strategies, including initiatives such as helicopter and beach patrols, science, education
and awareness, emerging technologies, and beach enclosures.
And, in May 2017, Government adopted a renewed focus on effective measures to reduce
the likelihood of a shark attack occurring, by providing additional protection for those at
most risk, including divers and surfers. These measures include a trial rebate for
independently verified personal shark deterrents, funding for a beach emergency
numbering system, using drones to support helicopter and beach patrols, and extending
the shark monitoring network to Esperance. Funding for Surf Life Saving WA aerial and
beach patrols was also secured.
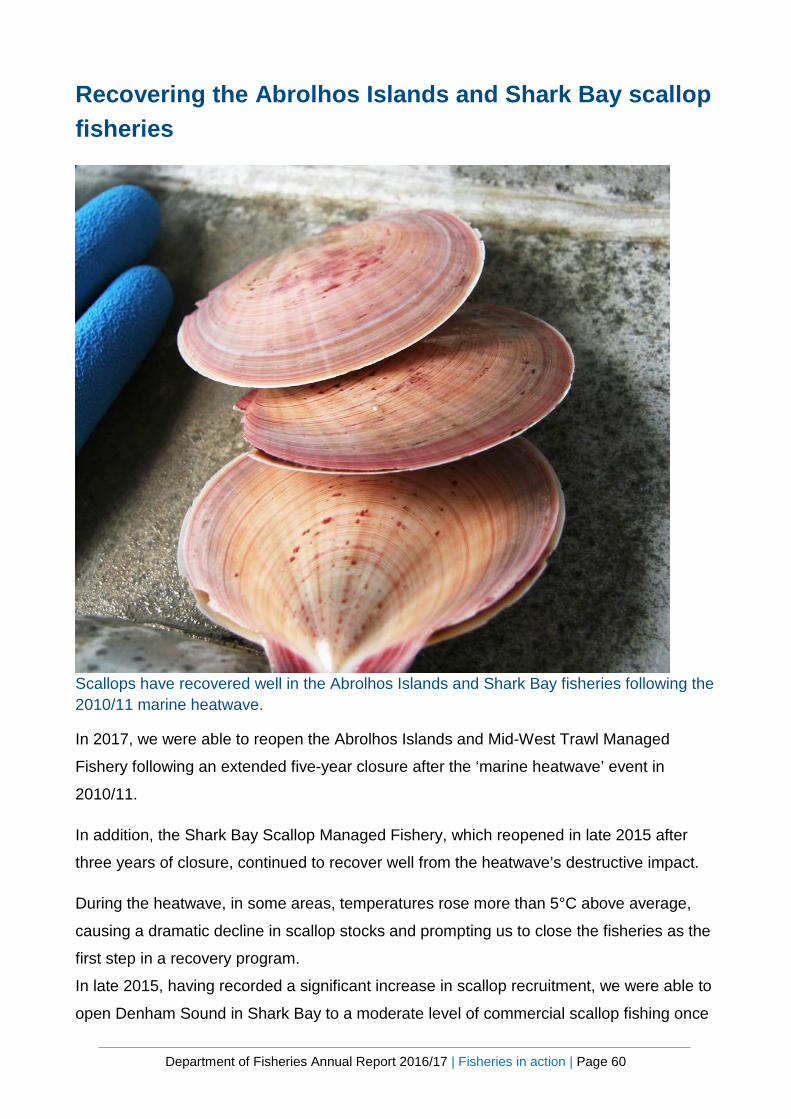
Department of Fisheries Annual Report 2016/17 | Fisheries in action | Page 60
Recovering the Abrolhos Islands and Shark Bay scallop fisheries
Scallops have recovered well in the Abrolhos Islands and Shark Bay fisheries following the 2010/11 marine heatwave.
In 2017, we were able to reopen the Abrolhos Islands and Mid-West Trawl Managed
Fishery following an extended five-year closure after the ‘marine heatwave’ event in
2010/11.
In addition, the Shark Bay Scallop Managed Fishery, which reopened in late 2015 after
three years of closure, continued to recover well from the heatwave’s destructive impact.
During the heatwave, in some areas, temperatures rose more than 5°C above average,
causing a dramatic decline in scallop stocks and prompting us to close the fisheries as the
first step in a recovery program.
In late 2015, having recorded a significant increase in scallop recruitment, we were able to
open Denham Sound in Shark Bay to a moderate level of commercial scallop fishing once

Department of Fisheries Annual Report 2016/17 | Fisheries in action | Page 61
again under a trial quota management system limiting the overall catch to sustainable
levels.
Taking a precautionary approach, northern Shark Bay remained closed to fishing, as
scallop recruitment in the area had not yet increased to levels sustainable for fishing,
unlike in Denham Sound.
Monitoring in 2015 again showed increased recruitment and, from a post-season
workshop with commercial scallop fishers, the Shark Bay Scallop Working Group was
formed to develop a total allowable commercial catch limit (TACC) for the fishery and the
associated fishing arrangement recommendations.
Both Denham Sound and northern Shark Bay were opened for the 2016/17 season and a
total of 163 tonnes (meat weight) were landed out of a TACC of 166 tonnes, valued at over
$6 million. By the end of 2016, Denham Sound had completely recovered with scallop
abundances at the higher end of the historical range, although northern Shark Bay
remained in the lower end of its historical abundance range.
As a result, the approved catch limit increased to 330 tonne meat weight (valued at more
than $12 million) for the 2017/18 season.
In the Abrolhos Islands and Mid-West Trawl Managed Fishery, after years of monitoring
and sampling, our research scientists identified catch rates high enough in the southern
grounds of the fishery to allow commercial fishing to recommence during 2017. More than
100 tonnes were landed in 2017, valued at in excess of $4 million.
Prior to the closure five years ago, the Gross Value of Production of this fishery was highly
variable ($1-15 million), with an average of approximately $6 million per year.
We continue to work closely with the commercial operators involved in scallop fishing in
these fisheries to monitor the resource’s status and to review management measures as
stock recovery continues.
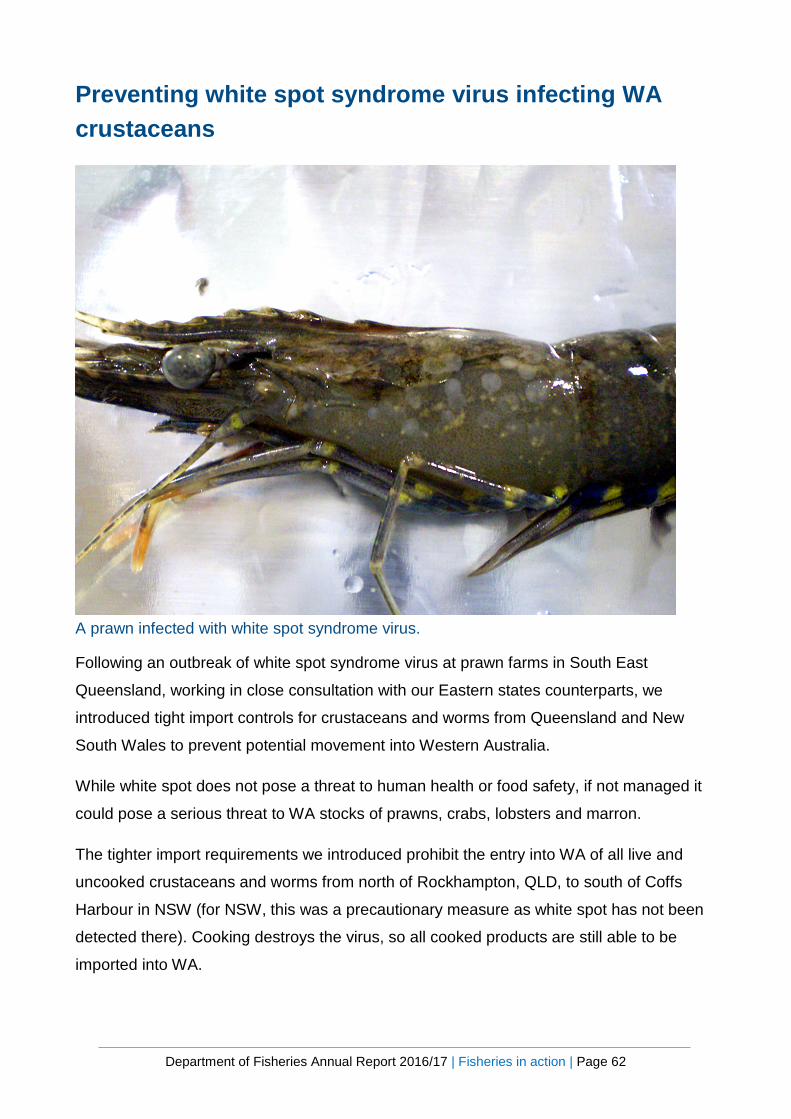
Department of Fisheries Annual Report 2016/17 | Fisheries in action | Page 62
Preventing white spot syndrome virus infecting WA crustaceans
A prawn infected with white spot syndrome virus.
Following an outbreak of white spot syndrome virus at prawn farms in South East
Queensland, working in close consultation with our Eastern states counterparts, we
introduced tight import controls for crustaceans and worms from Queensland and New
South Wales to prevent potential movement into Western Australia.
While white spot does not pose a threat to human health or food safety, if not managed it
could pose a serious threat to WA stocks of prawns, crabs, lobsters and marron.
The tighter import requirements we introduced prohibit the entry into WA of all live and
uncooked crustaceans and worms from north of Rockhampton, QLD, to south of Coffs
Harbour in NSW (for NSW, this was a precautionary measure as white spot has not been
detected there). Cooking destroys the virus, so all cooked products are still able to be
imported into WA.
Department of Fisheries Annual Report 2016/17 | Fisheries in action | Page 63
At the same time, we issued a white spot alert, a number of media releases and social
media posts urging recreational fishers to not use food-grade prawns as bait and to report
to us any signs of white spot through our FishWatch hotline.
Consequently, the outbreak has so far been successfully contained to South East
Queensland.
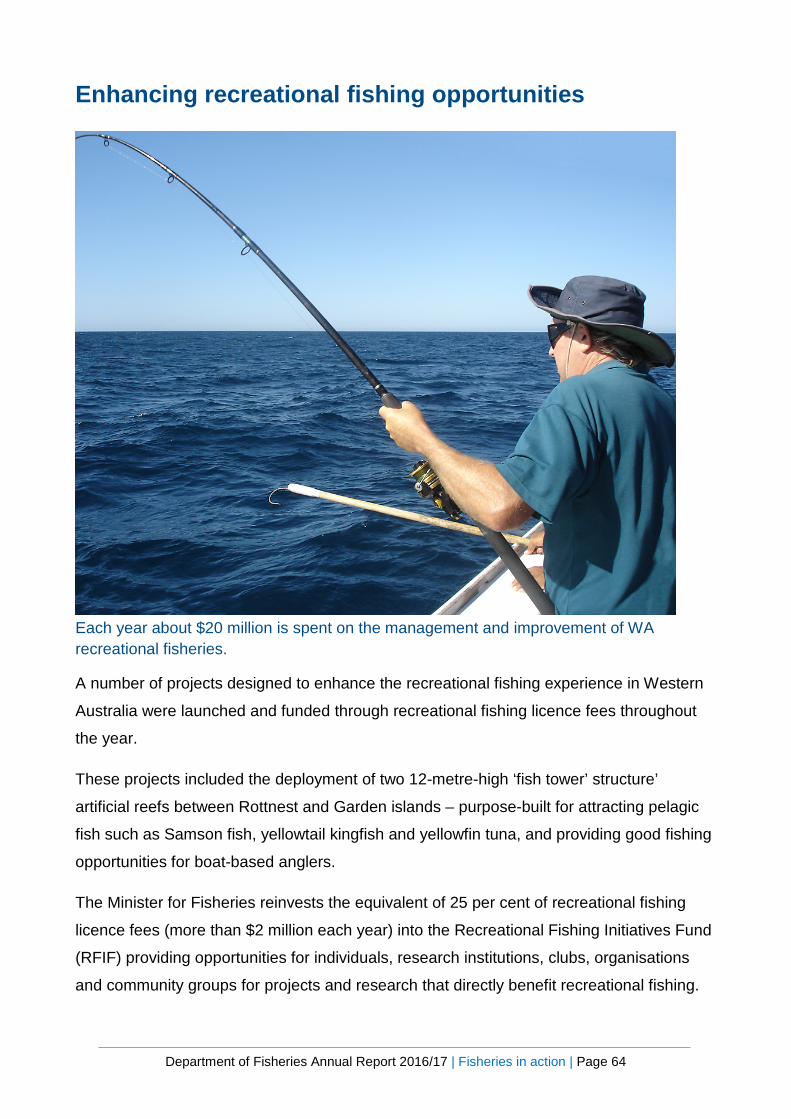
Department of Fisheries Annual Report 2016/17 | Fisheries in action | Page 64
Enhancing recreational fishing opportunities
Each year about $20 million is spent on the management and improvement of WA recreational fisheries.
A number of projects designed to enhance the recreational fishing experience in Western
Australia were launched and funded through recreational fishing licence fees throughout
the year.
These projects included the deployment of two 12-metre-high ‘fish tower’ structure’
artificial reefs between Rottnest and Garden islands – purpose-built for attracting pelagic
fish such as Samson fish, yellowtail kingfish and yellowfin tuna, and providing good fishing
opportunities for boat-based anglers.
The Minister for Fisheries reinvests the equivalent of 25 per cent of recreational fishing
licence fees (more than $2 million each year) into the Recreational Fishing Initiatives Fund
(RFIF) providing opportunities for individuals, research institutions, clubs, organisations
and community groups for projects and research that directly benefit recreational fishing.
Department of Fisheries Annual Report 2016/17 | Fisheries in action | Page 65
Other projects to benefit from RFIF funding include additional artificial reefs projects off
Exmouth, Esperance and Dampier, a blue swimmer crab stocking trial, bringing oyster
reefs back to Albany’s Oyster Harbour and increasing opportunities for disabled fishers
through the ‘Fishability Capacity Building Project.’
Each year about $20 million is spent on the management and improvement of WA
recreational fisheries. Recreational fishers contribute about $8.5 million to this cost through
licence fees, all of which is spent on recreational fishing.
The State Government contributes the remaining $11.5 million to ensure the continuation
of sustainable management of recreational fishing in Western Australia.
The revenue from recreational fishing licence fees is set to increase with the first price rise
for recreational licences in seven years announced by the incoming State Government in
June. The $5 increase from July will provide an additional $1 million annually for
recreational fishing management and initiatives.
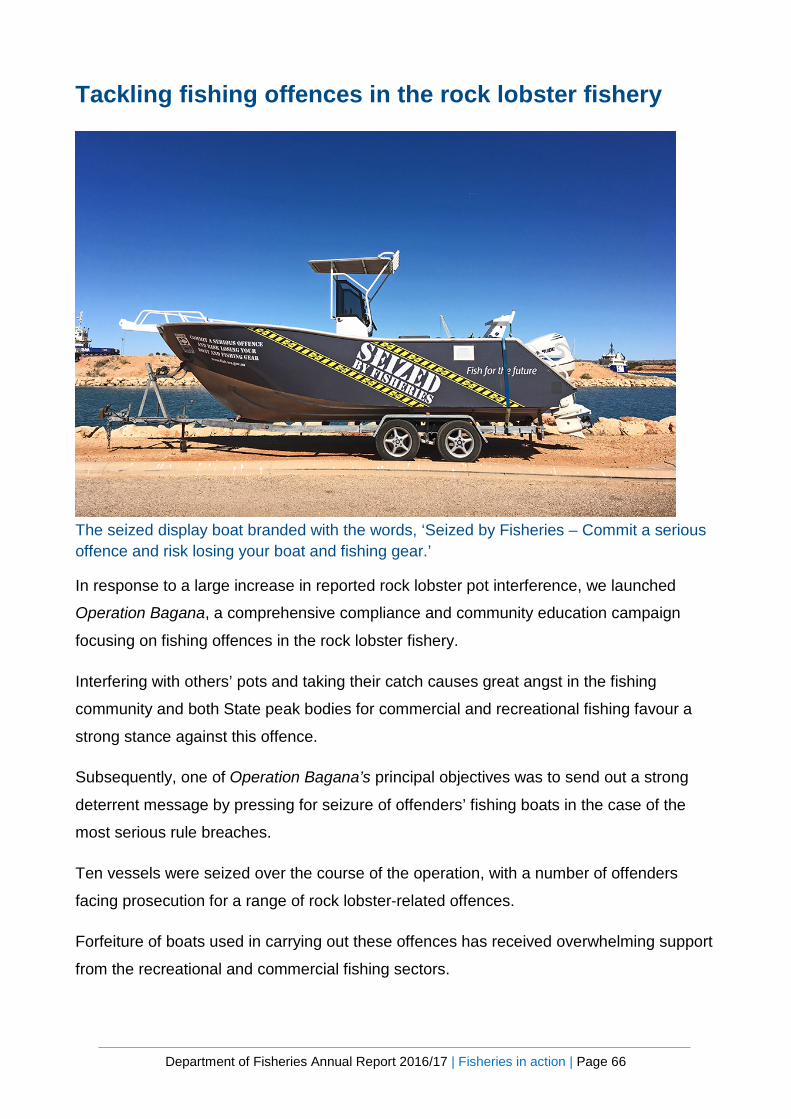
Department of Fisheries Annual Report 2016/17 | Fisheries in action | Page 66
Tackling fishing offences in the rock lobster fishery
The seized display boat branded with the words, ‘Seized by Fisheries – Commit a serious offence and risk losing your boat and fishing gear.’
In response to a large increase in reported rock lobster pot interference, we launched
Operation Bagana, a comprehensive compliance and community education campaign
focusing on fishing offences in the rock lobster fishery.
Interfering with others’ pots and taking their catch causes great angst in the fishing
community and both State peak bodies for commercial and recreational fishing favour a
strong stance against this offence.
Subsequently, one of Operation Bagana’s principal objectives was to send out a strong
deterrent message by pressing for seizure of offenders’ fishing boats in the case of the
most serious rule breaches.
Ten vessels were seized over the course of the operation, with a number of offenders
facing prosecution for a range of rock lobster-related offences.
Forfeiture of boats used in carrying out these offences has received overwhelming support
from the recreational and commercial fishing sectors.
Department of Fisheries Annual Report 2016/17 | Fisheries in action | Page 67
To highlight the potential consequences of breaking the rules, we branded one of the
seized boats with the message, ‘Seized by Fisheries – Commit a serious offence and risk
losing your boat and your fishing gear’.
We toured the branded boat at various boat ramps, boat shows and coastal events
highlighting the tough stance against gear interference and the potential consequences for
offenders if caught.
The surveillance component of the campaign was complemented by the use of
sophisticated surveillance and other compliance checks on land and sea, day and night,
sometimes in collaboration with other environmental and law enforcement agencies.
Operation Bagana has also allowed us to focus on a range of other offences in the
recreational rock lobster fishery, including exceeding bag limits, taking or possessing
totally protected species, using excess or illegal gear and obstructing Fisheries officers.
Department of Fisheries Annual Report 2016/17 | Disclosures and legal compliance | Page 68
Disclosures and legal compliance
Department of Fisheries Annual Report 2016/17 | Disclosures and legal compliance | Page 69
Financial statements
Independent audit opinion of the financial statements and key performance indicators
Department of Fisheries Annual Report 2016/17 | Disclosures and legal compliance | Page 70
Department of Fisheries Annual Report 2016/17 | Disclosures and legal compliance | Page 71
Department of Fisheries Annual Report 2016/17 | Disclosures and legal compliance | Page 72
Department of Fisheries Annual Report 2016/17 | Disclosures and legal compliance | Page 73
Certification of financial statements for the year ended 30 June 2017
The accompanying financial statements of the Department of Fisheries have been
prepared in compliance with the provisions of the Financial Management Act 2006 from
proper accounts and records to present fairly the financial transactions for the financial
year ending 30 June 2017 and the financial position as at 30 June 2017.
At the date of signing I am not aware of any circumstances which would render any
particulars included in the financial statements misleading or inaccurate.
Bruno Mezzatesta Reporting Officer
11 September 2017

STATEMENT OF COMPREHENSIVE INCOME FOR THE YEAR ENDED 30 JUNE
Department of Fisheries Annual Report 2016/17 | Disclosures and legal compliance | Page 74
2017 2016 Restated* Note $'000 $'000 Cost of services Expenses Employee benefits expense 6 54,580 55,453 Supplies and services 8 22,789 20,291 Depreciation and amortisation expense 9 5,253 5,207 Finance costs 10 1,725 1,962 Accommodation expenses 11 5,076 4,901 Grants and subsidies 12 1,610 1,797 Fisheries Adjustment Scheme Buybacks 13 40 63 Loss on disposal of non-current assets 20 67 19 Other expenses 14 2,556 2,007 Total cost of services 93,696 91,700 Income Revenue User charges and fees 16 33,828 30,444 Grants and contributions 17 1,054 1,656 Interest revenue 18 180 204 Other revenue 19 4,414 4,556 Total revenue 39,476 36,860 Total income other than income from State Government 39,476 36,860 NET COST OF SERVICES 54,220 54,840 Income from State Government 21 Service appropriations 49,668 49,161 Services received free of charge 552 863 Royalties for Regions Fund 807 930 Grants and Contributions 53 75 Total Income from State Government 51,080 51,029 SURPLUS/(DEFICIT) FOR THE PERIOD (3,140) (3,811) OTHER COMPREHENSIVE INCOME Changes in asset revaluation surplus/(deficit) 34 (5,687) 9,899 Total other comprehensive income (5,687) 9,899 TOTAL COMPREHENSIVE INCOME FOR THE PERIOD (8,827) 6,088
*Refer Note 5b ‘Correction of Prior Year Error’. See also the ‘Schedule of Income and Expenses by Service’. The Statement of Comprehensive Income should be read in conjunction with the accompanying notes.
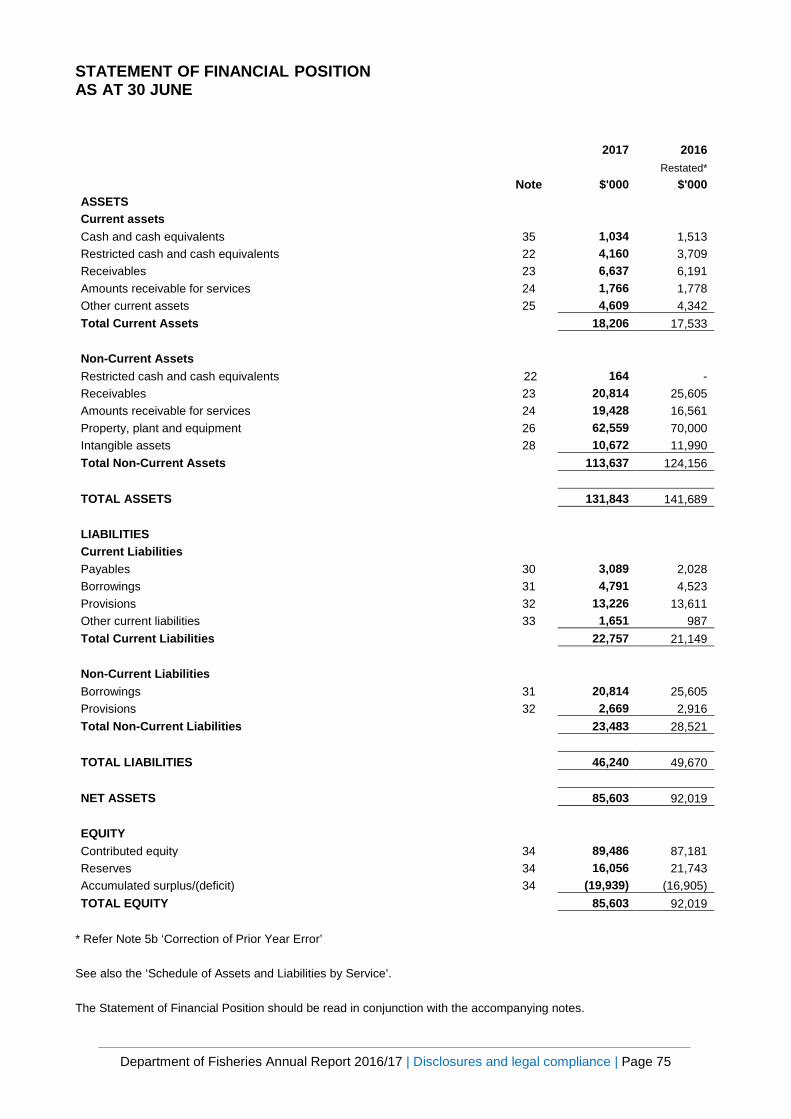
STATEMENT OF FINANCIAL POSITION AS AT 30 JUNE
Department of Fisheries Annual Report 2016/17 | Disclosures and legal compliance | Page 75
2017 2016 Restated* Note $'000 $'000 ASSETS Current assets Cash and cash equivalents 35 1,034 1,513 Restricted cash and cash equivalents 22 4,160 3,709 Receivables 23 6,637 6,191 Amounts receivable for services 24 1,766 1,778 Other current assets 25 4,609 4,342 Total Current Assets 18,206 17,533 Non-Current Assets Restricted cash and cash equivalents 22 164 - Receivables 23 20,814 25,605 Amounts receivable for services 24 19,428 16,561 Property, plant and equipment 26 62,559 70,000 Intangible assets 28 10,672 11,990 Total Non-Current Assets 113,637 124,156 TOTAL ASSETS 131,843 141,689 LIABILITIES Current Liabilities Payables 30 3,089 2,028 Borrowings 31 4,791 4,523 Provisions 32 13,226 13,611 Other current liabilities 33 1,651 987 Total Current Liabilities 22,757 21,149 Non-Current Liabilities Borrowings 31 20,814 25,605 Provisions 32 2,669 2,916 Total Non-Current Liabilities 23,483 28,521 TOTAL LIABILITIES 46,240 49,670 NET ASSETS 85,603 92,019 EQUITY Contributed equity 34 89,486 87,181 Reserves 34 16,056 21,743 Accumulated surplus/(deficit) 34 (19,939) (16,905) TOTAL EQUITY 85,603 92,019
* Refer Note 5b ‘Correction of Prior Year Error’ See also the ‘Schedule of Assets and Liabilities by Service’. The Statement of Financial Position should be read in conjunction with the accompanying notes.
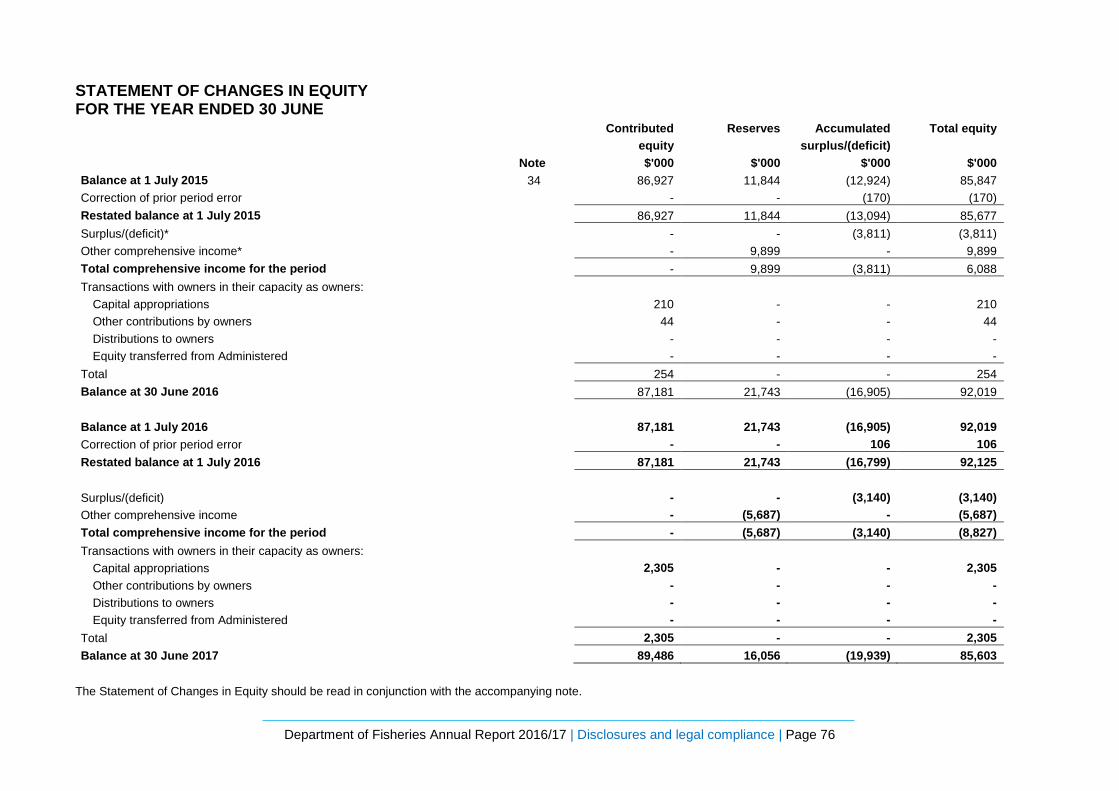
STATEMENT OF CHANGES IN EQUITY FOR THE YEAR ENDED 30 JUNE
Department of Fisheries Annual Report 2016/17 | Disclosures and legal compliance | Page 76
Contributed
equity Reserves Accumulated
surplus/(deficit) Total equity
Note $'000 $'000 $'000 $'000 Balance at 1 July 2015 34 86,927 11,844 (12,924) 85,847 Correction of prior period error - - (170) (170) Restated balance at 1 July 2015 86,927 11,844 (13,094) 85,677 Surplus/(deficit)* - - (3,811) (3,811) Other comprehensive income* - 9,899 - 9,899 Total comprehensive income for the period - 9,899 (3,811) 6,088 Transactions with owners in their capacity as owners:
Capital appropriations 210 - - 210 Other contributions by owners 44 - - 44 Distributions to owners - - - - Equity transferred from Administered - - - -
Total 254 - - 254 Balance at 30 June 2016 87,181 21,743 (16,905) 92,019 Balance at 1 July 2016 87,181 21,743 (16,905) 92,019 Correction of prior period error - - 106 106 Restated balance at 1 July 2016 87,181 21,743 (16,799) 92,125 Surplus/(deficit) - - (3,140) (3,140) Other comprehensive income - (5,687) - (5,687) Total comprehensive income for the period - (5,687) (3,140) (8,827) Transactions with owners in their capacity as owners:
Capital appropriations 2,305 - - 2,305 Other contributions by owners - - - - Distributions to owners - - - - Equity transferred from Administered - - - -
Total 2,305 - - 2,305 Balance at 30 June 2017 89,486 16,056 (19,939) 85,603
The Statement of Changes in Equity should be read in conjunction with the accompanying note.
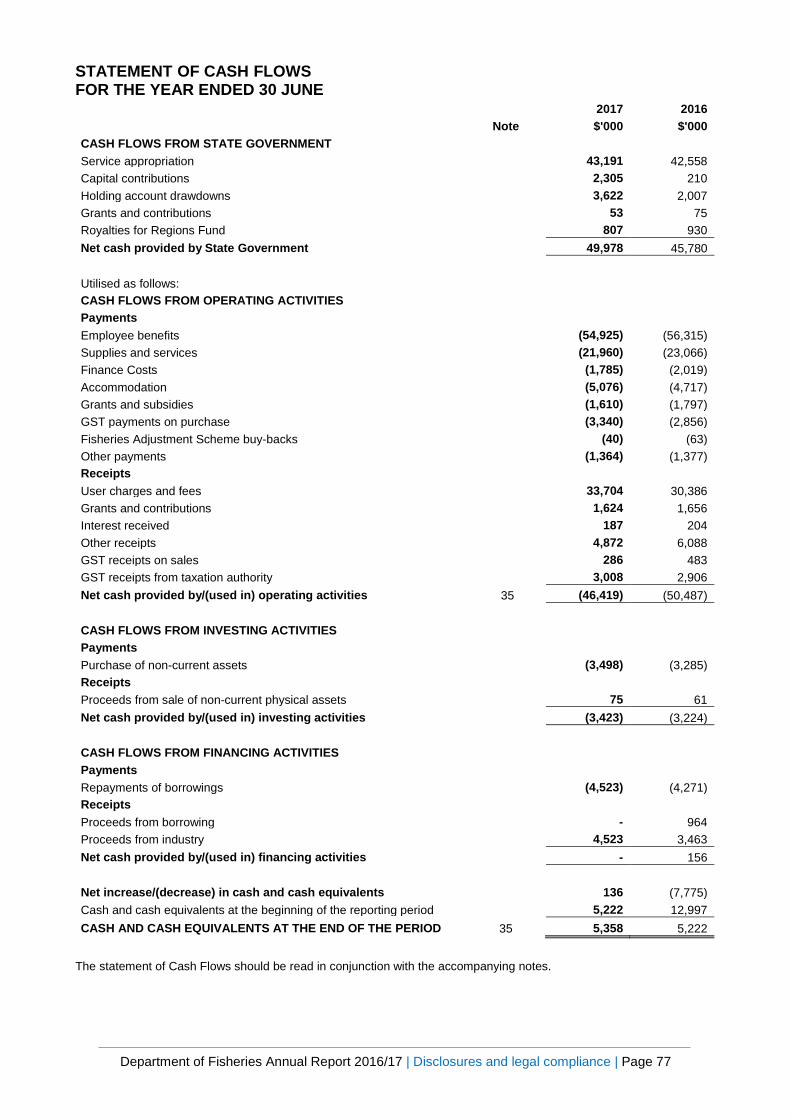
STATEMENT OF CASH FLOWS FOR THE YEAR ENDED 30 JUNE
Department of Fisheries Annual Report 2016/17 | Disclosures and legal compliance | Page 77
2017 2016
Note $'000 $'000 CASH FLOWS FROM STATE GOVERNMENT Service appropriation 43,191 42,558 Capital contributions 2,305 210 Holding account drawdowns 3,622 2,007 Grants and contributions 53 75 Royalties for Regions Fund 807 930 Net cash provided by State Government 49,978 45,780 Utilised as follows: CASH FLOWS FROM OPERATING ACTIVITIES Payments Employee benefits (54,925) (56,315) Supplies and services (21,960) (23,066) Finance Costs (1,785) (2,019) Accommodation (5,076) (4,717) Grants and subsidies (1,610) (1,797) GST payments on purchase (3,340) (2,856) Fisheries Adjustment Scheme buy-backs (40) (63) Other payments (1,364) (1,377) Receipts User charges and fees 33,704 30,386 Grants and contributions 1,624 1,656 Interest received 187 204 Other receipts 4,872 6,088 GST receipts on sales 286 483 GST receipts from taxation authority 3,008 2,906 Net cash provided by/(used in) operating activities 35 (46,419) (50,487) CASH FLOWS FROM INVESTING ACTIVITIES Payments Purchase of non-current assets (3,498) (3,285) Receipts Proceeds from sale of non-current physical assets 75 61 Net cash provided by/(used in) investing activities (3,423) (3,224) CASH FLOWS FROM FINANCING ACTIVITIES Payments Repayments of borrowings (4,523) (4,271) Receipts Proceeds from borrowing - 964 Proceeds from industry 4,523 3,463 Net cash provided by/(used in) financing activities - 156 Net increase/(decrease) in cash and cash equivalents 136 (7,775) Cash and cash equivalents at the beginning of the reporting period 5,222 12,997 CASH AND CASH EQUIVALENTS AT THE END OF THE PERIOD 35 5,358 5,222
The statement of Cash Flows should be read in conjunction with the accompanying notes.
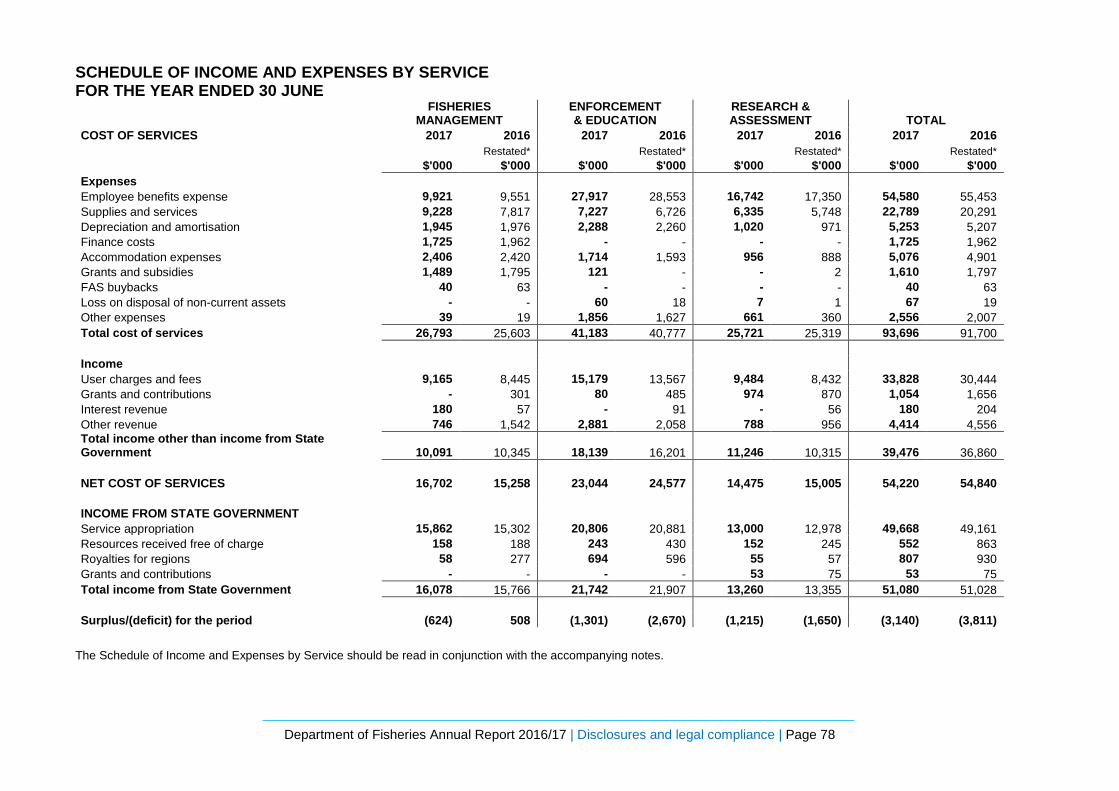
SCHEDULE OF INCOME AND EXPENSES BY SERVICE FOR THE YEAR ENDED 30 JUNE
Department of Fisheries Annual Report 2016/17 | Disclosures and legal compliance | Page 78
FISHERIES
MANAGEMENT ENFORCEMENT & EDUCATION
RESEARCH & ASSESSMENT TOTAL
COST OF SERVICES 2017 2016 2017 2016 2017 2016 2017 2016 Restated* Restated* Restated* Restated* $'000 $'000 $'000 $'000 $'000 $'000 $'000 $'000 Expenses Employee benefits expense 9,921 9,551 27,917 28,553 16,742 17,350 54,580 55,453 Supplies and services 9,228 7,817 7,227 6,726 6,335 5,748 22,789 20,291 Depreciation and amortisation 1,945 1,976 2,288 2,260 1,020 971 5,253 5,207 Finance costs 1,725 1,962 - - - - 1,725 1,962 Accommodation expenses 2,406 2,420 1,714 1,593 956 888 5,076 4,901 Grants and subsidies 1,489 1,795 121 - - 2 1,610 1,797 FAS buybacks 40 63 - - - - 40 63 Loss on disposal of non-current assets - - 60 18 7 1 67 19 Other expenses 39 19 1,856 1,627 661 360 2,556 2,007 Total cost of services 26,793 25,603 41,183 40,777 25,721 25,319 93,696 91,700 Income User charges and fees 9,165 8,445 15,179 13,567 9,484 8,432 33,828 30,444 Grants and contributions - 301 80 485 974 870 1,054 1,656 Interest revenue 180 57 - 91 - 56 180 204 Other revenue 746 1,542 2,881 2,058 788 956 4,414 4,556 Total income other than income from State Government 10,091 10,345 18,139 16,201 11,246 10,315 39,476 36,860 NET COST OF SERVICES 16,702 15,258 23,044 24,577 14,475 15,005 54,220 54,840 INCOME FROM STATE GOVERNMENT Service appropriation 15,862 15,302 20,806 20,881 13,000 12,978 49,668 49,161 Resources received free of charge 158 188 243 430 152 245 552 863 Royalties for regions 58 277 694 596 55 57 807 930 Grants and contributions - - - - 53 75 53 75 Total income from State Government 16,078 15,766 21,742 21,907 13,260 13,355 51,080 51,028 Surplus/(deficit) for the period (624) 508 (1,301) (2,670) (1,215) (1,650) (3,140) (3,811)
The Schedule of Income and Expenses by Service should be read in conjunction with the accompanying notes.

SCHEDULE OF ASSETS AND LIABILITIES BY SERVICE AS AT 30 JUNE
Department of Fisheries Annual Report 2016/17 | Disclosures and legal compliance | Page 79
FISHERIES
MANAGEMENT ENFORCEMENT & EDUCATION
RESEARCH & ASSESSMENT TOTAL
2017 2016 2017 2016 2017 2016 2017 2016 Restated* Restated* Restated* Restated* $'000 $'000 $'000 $'000 $'000 $'000 $'000 $'000 ASSETS Current assets Cash and cash equivalents 296 596 454 621 284 296 1,034 1,513 Restricted cash and cash equivalents 3,051 2,676 49 658 1,060 375 4,160 3,709 Receivables 5,319 5,146 811 708 507 337 6,637 6,191 Amounts receivable for services 505 701 776 730 485 347 1,766 1,778 Other current assets 290 1,711 398 1,783 3,921 848 4,609 4,342 Total Current Assets 9,461 10,830 2,488 4,500 6,257 2,203 18,206 17,533 Non-current assets Restricted cash and cash equivalents 47 - 72 - 45 - 164 - Receivables 20,814 25,605 - - - - 20,814 25,605 Amounts receivable for services 5,558 6,527 8,536 6,800 5,333 3,235 19,428 16,561 Property, plant and equipment 2,782 3,278 30,589 36,936 29,188 29,786 62,559 70,000 Intangible assets 8,823 9,744 1,271 1,591 578 655 10,672 11,990 Total Non-Current Assets 38,024 45,154 40,468 45,327 35,145 33,675 113,637 124,156 Total Assets 47,485 55,984 42,956 49,827 41,402 35,878 131,843 141,689 LIABILITIES Current liabilities Payables 884 643 1,357 670 848 318 3,089 1,631 Borrowings 4,791 4,523 - - - - 4,791 4,523 Provisions 3,784 5,364 5,811 5,588 3,632 2,659 13,226 13,611 Other current liabilities 1,203 546 275 568 172 270 1,651 1,384 Total Current Liabilities 10,662 11,076 7,443 6,826 4,651 3,247 22,756 21,149 Non-current liabilities Borrowings 20,814 25,605 - - - - 20,814 25,605 Provisions 764 1,149 1,173 1,197 732 570 2,669 2,916 Total Non-Current Liabilities 21,578 26,754 1,173 1,197 732 570 23,483 28,521 Total Liabilities 32,240 37,830 8,616 8,023 5,384 3,817 46,240 49,670 NET ASSETS 15,245 18,154 34,340 41,804 36,018 32,061 85,603 92,019
The Schedule of Assets and Liabilities by Service should be read in conjunction with the accompanying notes.

SUMMARY OF CONSOLIDATED ACCOUNT APPROPRIATIONS AND INCOME ESTIMATES FOR THE YEAR ENDED 30 JUNE
Department of Fisheries Annual Report 2016/17 | Disclosures and legal compliance | Page 80
2017 2017 2017 2016 Estimate Actual Variance Actual Actual Variance $'000 $'000 $'000 $'000 $'000 $'000 Delivery of Services Item 65 Net amount appropriated to deliver services 49,592 49,316 (276) 49,316 48,818 (498) Royalties for Region 1,516 807 (709) 807 930 123 Amount authorised by other statutes - Salaries and Allowances Act 1975 352 352 - 352 343 (9) Total appropriations provided to deliver services 51,460 50,475 (985) 50,475 50,091 (384) Capital Item 136 Capital appropriations 1,005 2,305 1,300 2,305 210 (2,095) Other contributions by owners - - - - - Total Capital 1,005 2,305 1,300 2,305 210 (2,095) Administered Transactions Section 25 administered capital appropriations - - - - - - Total Administered - - - - - - GRAND TOTAL 52,465 52,780 315 52,780 50,301 (2,479) Details of Expense by Service Fisheries Management 21,686 26,793 5,107 26,793 25,603 (1,190) Enforcement and Education 40,912 41,183 271 41,183 40,777 (406) Research and Assessment 24,867 25,721 854 25,721 25,319 (402) Total Cost of Services 87,465 93,696 6,231 93,696 91,700 (1,996) Less Total Income (35,204) (39,476) (4,272) (39,476) (36,860) 2,616 Net Cost of Services 52,261 54,220 1,959 54,220 54,840 620 Adjustments (801) (3,082) (2,281) (3,082) (4,749) (1,667) Total appropriations provided to deliver services 51,460 51,138 (322) 51,138 50,091 (1,047) Capital Expenditures Purchase of non-current physical assets 5,528 3,498 (2,030) 3,498 3,285 (213) Adjustments for other funding sources (4,523) (1,193) 3,330 (1,193) (3,075) (1,882) Capital appropriations 1,005 2,305 1,300 2,305 210 (2,095) Details of Income Estimates Income disclosed as Administered Income - 323 323 323 313 (10) - 323 323 323 313 (10)
Adjustments comprise movements in cash balances and other accrual items such as receivables, payables and superannuation. Note 39 ‘Explanatory statement’ provides details of any significant variations between estimates and actual results for 2017 and between the actual results for 2016.
Department of Fisheries Annual Report 2016/17 | Disclosures and legal compliance | Page 81
DEPARTMENT OF FISHERIES
NOTES TO THE FINANCIAL STATEMENTS
FOR THE YEAR ENDED 30 JUNE 2017
1 AUSTRALIAN ACCOUNTING STANDARDS
General
The Department’s financial statements for the year ended 30 June 2017 have been prepared in accordance with Australian Accounting Standards. The term ‘Australian Accounting Standards’ includes Standards and Interpretations issued by the Australian Accounting Standard Board (AASB).
The Department has adopted any applicable new and revised Australian Accounting Standards from their operative dates.
Early adoption of standards
The Department cannot early adopt an Australian Accounting Standard unless specifically permitted by TI 1101 Application of Australian Accounting Standards and Other Pronouncements. There has been no early adoption of any Australian Accounting Standards that have been issued or amended (but not operative) by the Department for the annual reporting period ended 30 June 2017.
2 SUMMARY OF SIGNIFICANT ACCOUNTING POLICIES
(a) General Statement
The Department is a not-for-profit reporting entity that prepares general purpose financial statements in accordance with the Australian Accounting Standards, the Framework, Statements of Accounting Concepts and other authoritative pronouncements of the AASB as applied by the Treasurer’s Instructions. Several of these are modified by the Treasurer’s Instructions to vary application, disclosure, format and wording.
The Financial Management Act 2006 and the Treasurer's Instructions impose legislative provisions that govern the preparation of financial statements and take precedence over Australian Accounting Standards, the Framework, Statements of Accounting Concepts and other authoritative pronouncements of the AASB.
Where modification is required and has had a material or significant financial effect upon the reported results, details of that modification and the resulting financial effect are disclosed in the notes to the financial statements.
(b) Basis of Preparation
The financial statements have been prepared on the accrual basis of accounting using the historical cost convention, except for land and buildings which have been measured at fair value.
The accounting policies adopted in the preparation of the financial statements have been consistently applied throughout all periods presented unless otherwise stated.
The financial statements are presented in Australian dollars and all values are rounded to the nearest thousand dollars ($'000).
Note 3 ‘Judgements made by management in applying accounting policies’ discloses judgements that have been made in the process of applying the Department’s accounting policies resulting in the most significant effect on amounts recognised in the financial statements.
Note 4 ‘Key sources of estimation uncertainty’ discloses key assumptions made concerning the future, and other key sources of estimation uncertainty at the end of the reporting period, that have a significant risk of causing a material adjustment to the carrying amounts of assets and liabilities within the next financial year.
Department of Fisheries Annual Report 2016/17 | Disclosures and legal compliance | Page 82
(c) Reporting Entity
The reporting entity is the Department which has no ‘related bodies’.
Mission
The Department’s mission is “To conserve, sustainably develop and share the use of the State’s aquatic resources and their ecosystems for the benefit of present and future generations.”
Services
The budget is framed in terms of services, consequently financial reporting for the year is also analysed in terms of services.
Information about the Department’s services is set out in the Schedule of Income and Expenses by Service and the Schedule of Assets and Liabilities by Service.
The services of the Department detailed below closely align with the functional organisational structure of:
• Fisheries Management; • Enforcement and Education; and • Research and Assessment. A description of each service is as follows:
Fisheries Management
In accordance with Government Policy, the management of the state’s fish and aquatic resources is undertaken within an integrated fisheries management framework – a shift from the management of individual sectors (e.g. the commercial fishing sector) to the holistic management of the aquatic ecosystem. Management, often in association with other related Government agencies, includes the development of policy and procedural frameworks (legislation and management plans), licensing, consultation with stakeholders and the community.
Enforcement and Education
Without the support of the community and stakeholders, the Department is unable to effectively manage the aquatic environment. To encourage this support, the Department must raise community awareness and understanding of the issues and of the need to adhere to the rules governing activities in this environment. There also needs to be enforcement of the rules through penalties for non-compliance. The Department plans and implements education and communications programs to raise levels of awareness and understanding of fishery management objective. It also plans and instigates investigations and enforcement strategies.
Research and Assessment
The aquatic environment is subject to ongoing change – both natural and man-made. In order to ensure that management arrangements continue to adapt to environmental changes (e.g. climate change impacts) and community expectations, research and monitoring is required, including innovative science (e.g. impacts of expected climate change, social, and economic research) and the ongoing monitoring of fish stocks.
(d) Contributed Equity
AASB Interpretation 1038 Contributions by Owners Made to Wholly-Owned Public Sector Entities requires transfers in the nature of equity contributions, other than as a result of a restructure of administrative arrangements, to be designated by the Government (the owner) as contributions by owners (at the time of, or prior to transfer) before such transfers can be recognised as equity contributions. Capital appropriations have been designated as contributions by owners according to TI 955 Contribution by Owners made to Wholly Owned Public Sector Entities and have been credited directly to Contributed Equity.
The transfers of net assets to/from other agencies, other than as a result of a restructure of administrative arrangements, are designated as contributions by owners where the transfers are non-discretionary and non-reciprocal.
Department of Fisheries Annual Report 2016/17 | Disclosures and legal compliance | Page 83
(e) Income
Revenue recognition
Revenue is recognised and measured at the fair value of consideration received or receivable. Revenue is recognised for the major business activities as follows:
Sale of goods
Revenue is recognised from the sale of goods and disposal of other assets when the significant risks and rewards of ownership transfer to the purchaser and can be measured reliably.
Provision of services
Revenue is recognised by reference to the stage of completion of the transaction. Fees paid for access to managed fisheries are levied on a seasonal, not financial year basis and may be paid in instalments. The revenue for access fees is recognised at the time of receipt.
Interest
Revenue is recognised as the interest accrues.
Service appropriations
Service Appropriations are recognised as revenues at fair value in the period in which the Department gains control of the appropriated funds. The Department gains control of appropriated funds at the time those funds are deposited to the bank account or credited to the ‘Amounts receivable for services’ (holding account) held at the Department of Treasury.
Net Appropriation Determination
The Treasurer may make a determination providing for prescribed receipts to be retained for services under the control of the Department. In accordance with the most recent determination, as quantified in the 2016-17 Budget Statements, the Department retained $39.476 million in 2017 ($36.860 million in 2016) from the following:
• proceeds from fees and charges; • sale; • Commonwealth specific purpose grants and contributions; • Interest revenue.
Grants, donations, gifts and other non-reciprocal contributions
Revenue is recognised at fair value when the Department obtains control over the assets comprising the contributions, usually when cash is received.
Other non-reciprocal contributions that are not contributions by owners are recognised at their fair value. Contributions of services are only recognised when a fair value can be reliably determined and the services would be purchased if not donated.
Where contributions recognised as revenues during the reporting period were obtained on the condition that they will be expended in a specified manner, and those conditions had yet to be made at the end of the reporting period, the amounts and nature of, and the conditions attaching to them are to be disclosed in the notes.
Where contributions recognised as revenues during the reporting period were obtained specifically for the provision of goods or services over a future period, the amounts and nature of, and the periods to which they relate are to be disclosed.
Where contributions recognised as revenues in a previous reporting period were obtained in respect of the current reporting period, the amounts and nature are to be disclosed.
Royalties for Regions funds are recognised as revenue at fair value in the period in which the Department obtains control over the funds. The Department obtains control of the funds at the time the funds are deposited into the Department's bank account.
Gains
Realised or unrealised gains are usually recognised on a net basis. These include gains arising on the disposal of non-current assets and some revaluations of non-current assets.
Department of Fisheries Annual Report 2016/17 | Disclosures and legal compliance | Page 84
(f) Borrowing costs
Borrowing costs are expensed when incurred.
(g) Property, Plant and Equipment and Infrastructure
Capitalisation/expensing of assets
Items of property, plant and equipment and infrastructure costing $5,000 or more are recognised as assets and the cost of utilising assets is expensed (depreciated) over their useful lives. Items of property, plant and equipment and infrastructure costing less than $5,000 are immediately expensed direct to the Statement of Comprehensive Income (other than where they form part of a group of similar items which are significant in total).
Initial recognition and measurement
Property, plant and equipment and infrastructure are initially recognised at cost.
For items of property, plant and equipment and infrastructure acquired at no cost or for nominal cost, the cost is the fair value at the date of acquisition.
Subsequent measurement
Subsequent to initial recognition of an asset, the revaluation model is used for the measurement of land and buildings and historical cost for all other property, plant and equipment. Land and buildings are carried at fair value less accumulated depreciation (buildings only) and accumulated impairment losses. All other items of property, plant and equipment are stated at historical cost less accumulated depreciation and accumulated impairment losses.
Where market-based evidence is available, the fair value of land and buildings is determined on the basis of current market values determined by reference to recent market transactions. When buildings are revalued by reference to recent market transactions, the accumulated depreciation is eliminated against the gross carrying amount of the asset and the net amount restated to the revalued amount.
In the absence of market-based evidence, fair value of land and buildings is determined on the basis of existing use. This normally applies where buildings are specialised or where land use is restricted. Fair value for existing use assets is determined by reference to the cost of replacing the remaining future economic benefits embodied in the asset, i.e. the depreciated replacement cost. Where the fair value of buildings is determined on the depreciated replacement cost basis, the gross carrying amount and the accumulated depreciation are restated proportionately. Fair value for restricted use land is determined by comparison with market evidence for land with similar approximate utility (high restricted use land) or market value of comparable unrestricted land (low restricted use land).
Land and buildings are independently valued annually by the Western Australian Land Information Authority (Valuation Services) and recognised annually to ensure that the carrying amount does not differ materially from the asset’s fair value at the end of the reporting period.
The most significant assumptions and judgements in estimating fair value are made in assessing whether to apply the existing use basis to assets and in determining estimated useful life. Professional judgment by the valuer is required where the evidence does not provide a clear distinction between market type assets and existing use assets.
De-recognition
Upon disposal or de-recognition of an item of property, plant and equipment and infrastructure, any revaluation surplus relating to that asset is retained in the asset revaluation surplus.
Asset revaluation surplus
The asset revaluation surplus is used to record increments and decrements on the revaluation of non-current assets as described in note 26 'Property, Plant and Equipment'.
Depreciation
All non-current assets having a limited useful life are systematically depreciated over their estimated useful lives in a manner that reflects the consumption of their future economic benefits.
Department of Fisheries Annual Report 2016/17 | Disclosures and legal compliance | Page 85
Depreciation is calculated using the straight line method, using rates which are reviewed annually. Estimated useful lives for each class of depreciable asset are:
Asset category Life (years)
Buildings 20 to 40
Vessels 5 to 6
Communication equipment 5
Computer equipment 3
Furniture and fittings 10
Infrastructure 30
Motor vehicles 3 to 7
Office equipment 5
Other equipment 5 to 10
Plant and equipment 10
Works of Art controlled by the Department are classified as property, plant and equipment. These are anticipated to have indefinite useful lives. Their service potential has not, in any material sense, been consumed during the reporting period and consequently no depreciation has been recognised.
Land is not depreciated.
(h) Intangible Assets
Capitalisation/Expensing of assets
Acquisitions of intangible assets costing $5,000 or more and internally generated intangible assets costing $5,000 or more are capitalised. The cost of utilising the assets is expensed (amortised) over their useful lives.
Costs incurred below these thresholds are immediately expensed directly to the Statement of Comprehensive Income. Intangible assets are initially recognised at cost. For assets acquired at no cost or for nominal cost, the cost is their fair value at the date of acquisition.
The cost model is applied for subsequent measurement requiring the asset to be carried at cost less any accumulated amortisation and accumulated impairment losses.
Amortisation for intangible assets with finite useful lives is calculated for the period of the expected benefit (estimated useful life which is reviewed annually) on the straight line basis. All intangible assets controlled by the Department have a finite useful life and zero residual value.
The expected useful lives for each class of intangible asset are:
Licences up to 10 years
Development costs 3 to 5 years
Software (a) 3 to 10 years
Website costs 3 to 5 years (a) Software that is not integral to the operation of any related hardware.
Licences
Licences have a finite useful life and are carried at cost less accumulated amortisation and accumulated impairment losses. Research and Development
Research costs are expensed as incurred. Development costs incurred for an individual project are carried forward when the future economic benefits can reasonably be regarded as assured and the total project costs are likely to exceed $50,000. Other development costs are expensed as incurred.
Department of Fisheries Annual Report 2016/17 | Disclosures and legal compliance | Page 86
Computer Software
Software that is an integral part of the related hardware is recognised as property, plant and equipment. Software that is not an integral part of the related hardware is recognised as an intangible asset. Software costing less than $5,000 is expensed in the year of acquisition.
Website Costs
Website costs are charged as expenses when they are incurred unless they relate to the acquisition or development of an asset when they may be capitalised and amortised. Generally, costs in relation to feasibility studies during the planning phase of a website, and ongoing costs of maintenance during the operating phase are expensed. Costs incurred in building or enhancing a website that can be reliably measured, are capitalised to the extent that they represent probable future economic benefits.
(i) Impairment of Assets
Property, plant, equipment, infrastructure and intangible assets are tested for any indication of impairment at the end of each reporting period. Where there is an indication of impairment, the recoverable amount is estimated.
Where the recoverable amount is less than the carrying amount, the asset is considered impaired and is written down to the recoverable amount and an impairment loss is recognised. Where an asset measured at cost is written down to recoverable amount, an impairment loss is recognised in profit or loss. Where a previously revalued asset is written down to recoverable amount, the loss is recognised as a revaluation decrement in other comprehensive income. As the Department is a not for profit entity, unless an asset has been identified as a surplus asset, the recoverable amount is the higher of an asset’s fair value less costs to sell and depreciated replacement cost.
The risk of impairment is generally limited to circumstances where an asset’s depreciation is materially understated, where the replacement cost is falling or where there is a significant change in useful life. Each relevant class of assets is reviewed annually to verify that the accumulated depreciation/amortisation reflects the level of consumption or expiration of asset’s future economic benefits and to evaluate any impairment risk from falling replacement costs.
Intangible assets with an indefinite useful life and intangible assets not yet available for use are tested for impairment at the end of each reporting period irrespective of whether there is any indication of impairment.
The recoverable amount of assets identified as surplus assets is the higher of fair value less costs to sell and the present value of future cash flows expected to be derived from the asset. Surplus assets carried at fair value have no risk of material impairment where fair value is determined by reference to market-based evidence. Where fair value is determined by reference to depreciated replacement cost, surplus assets are at risk of impairment and the recoverable amount is measured. Surplus assets at cost are tested for indications of impairment at the end of each reporting period.
(j) Non-current Assets (or disposal groups) classified as held for sale
Non-current assets (or disposal groups) held for sale are recognised at the lower of carrying amount and fair value less costs to sell, and are disclosed separately from other assets in the Statement of Financial Position. Assets classified as held for sale are not depreciated or amortised.
All Crown land holdings are vested in the Department by the Government. The Department of Lands (DoL) is the only agency with the power to sell Crown land. The Department transfers the Crown land and any attached buildings to DoL when the land becomes available for sale.
(k) Leases
Finance lease rights and obligations are initially recognised, at the commencement of the lease term, as assets and liabilities equal in amount to the fair value of the leased item or, if lower, the present value of the minimum lease payments, determined at the inception of the lease. The assets are disclosed as plant, equipment and vehicles under lease, and are depreciated over the period during which the Department is expected to benefit from their use. Minimum lease payments are apportioned between the finance charge and the reduction of the outstanding lease liability, according to the interest rate implicit in the lease.
Department of Fisheries Annual Report 2016/17 | Disclosures and legal compliance | Page 87
The Department holds operating leases for its head office and a number of branch office buildings. Operating leases are expensed on a straight line basis over the lease term as this represents the pattern of benefits derived from the leased properties.
(l) Financial Instruments
In addition to cash, the Department has two categories of financial instrument:
• Loans and receivables; and • Financial liabilities measured at amortised cost Financial instruments have been disaggregated into the following classes
Financial Assets
• Cash and cash equivalents • Restricted cash and cash equivalents • Receivables • Amounts receivable for services
Financial Liabilities
• Payables • WATC borrowings • Finance lease liabilities Initial recognition and measurement of financial instruments is at fair value which normally equates to the transaction cost or the face value.
Subsequent measurement is at amortised cost using the effective interest method. The fair value of short-term receivables and payables is the transaction cost or the face value because there is no interest rate applicable and subsequent measurement is not required as the effect of discounting is not material.
(m) Cash and Cash Equivalents
For the purpose of the Statement of Cash Flows, cash and cash equivalent (and restricted cash and cash equivalent) assets comprise cash on hand and short-term deposits with original maturities of three months or less that are readily convertible to a known amount of cash and which are subject to insignificant risk of changes in value.
(n) Accrued Salaries
Accrued salaries (refer note 33 ‘Other liabilities’) represent the amount due to staff but unpaid at the end of the financial year. Accrued salaries are settled within a fortnight of the financial year end. The Department considers the carrying amount of accrued salaries to be equivalent to its net fair value.
The accrued salaries suspense account (see note 22 ‘Restricted cash and cash equivalents’) consists of amounts paid annually into a suspense account over a period of 10 financial years to largely meet the additional cash outflow in each eleventh year when 27 pay days occur instead of the normal 26. No interest is received on this account.
(o) Amounts Receivable for Services (Holding Account)
The Department receives funding on an accrual basis. The appropriations are paid partly in cash and partly as an asset (holding account receivable). The accrued amount receivable is accessible on the emergence of the cash funding requirement to cover leave entitlements and asset replacement.
See also note 21 ‘Income from State Government’ and note 24 ‘Amounts receivable for services (holding account)’.
(p) Receivables
Receivables are recognised at original invoice amount less an allowance for uncollectible amounts (i.e. impairment).
The collectability of receivables is reviewed on an ongoing basis and any receivables identified as uncollectible are written off against the allowance account. The allowance for uncollectible amounts (doubtful debts) is raised
Department of Fisheries Annual Report 2016/17 | Disclosures and legal compliance | Page 88
when there is objective evidence that the Department will not be able to collect the debts. The carrying amount is equivalent to fair value as it is due for settlement within 30 days. See also note 2(l) ‘Financial Instruments' and note 23 ‘Receivables’.
(q) Payables
Payables are recognised at the amounts payable when the Department becomes obliged to make future payments as a result of a purchase of assets or services. The carrying amount is equivalent to fair value, as settlement is generally within 30 days. See also note 2(I) ‘Financial Instruments' and note 30 ‘Payables’.
(r) Borrowings
All loans payable are initially recognised at fair value being the net proceeds received. Subsequent measurement is at amortised cost using the effective interest rate method.
(s) Provisions
Provisions are liabilities of uncertain timing or amount and are recognised where there is a present legal or constructive obligation as a result of a past event and when the outflow of resources embodying economic benefits is probable and a reliable estimate can be made of the amount of the obligation. Provisions are reviewed at the end of each reporting period. See also note 32 ‘Provisions’.
Provisions - Employee benefits
All annual leave and long service leave provisions are in respect of employees' services up to the end of the reporting period.
Annual Leave
Annual leave that is not expected to be settled wholly within 12 months after the end of the reporting period and is therefore considered to be other long-term employee benefits'. The annual leave liability is recognised and measured at the present value of amounts expected to be paid when the liabilities are settled using the remuneration rate expected to apply at the time of settlement.
When assessing expected future payments consideration is given to expected future wage and salary levels including non-salary components such as employer superannuation contributions, as well as the experience of employee departures and periods of service. The expected future payments are discounted using market yields at the end of the reporting period on national government bonds with terms to maturity that match, as closely as possible, the estimated future cash outflows.
The provision for annual leave is classified as a current liability as the Department does not have an unconditional right to defer settlement of the liability for at least 12 months after the end of the reporting period.
Long Service Leave
Long service leave is not expected to be settled wholly within 12 months after the end of the reporting period and is therefore recognised and measured at the present value of amounts expected to be paid when the liabilities are settled using the remuneration rate expected to apply at the time of settlement.
When assessing expected future payments consideration is given to expected future wage and salary levels including non-salary components such as employer superannuation contributions, as well as the experience of employee departures and periods of service. The expected future payments are discounted using market yields at the end of the reporting period on national government bonds with terms to maturity that match, as closely as possible, the estimated future cash outflows.
Unconditional long service leave provisions are classified as current liabilities as the Department does not have an unconditional right to defer settlement of the liability for at least 12 months after the end of the reporting period. Pre-conditional and conditional long service leave provisions are classified as non-current liabilities because the Department has an unconditional right to defer the settlement of the liability until the employee has completed the requisite years of service.
Sick Leave
Liabilities for sick leave are recognised when it is probable that sick leave paid in the future will be greater than the entitlement that will accrue in the future. Past history indicates that on average, sick leave taken each
Department of Fisheries Annual Report 2016/17 | Disclosures and legal compliance | Page 89
reporting period is less than the entitlement accrued. This is expected to continue in future periods. Accordingly, it is unlikely that existing accumulated entitlements will be used by employees and no liability for unused sick leave entitlements is recognised. As sick leave is non-vesting, an expense is recognised in the Statement of Comprehensive Income for this leave as it is taken.
Deferred Leave
The provision of deferred leave relates to Public Service employees who have entered into an agreement to self-fund an additional 12 months leave in the fifth year of the agreement. The provision recognises the value of salary set aside for employees to be used in the fifth year. This liability is measured on the same basis as annual leave. Deferred leave is reported as a current provision as employees can leave the scheme at their discretion at any time.
Purchased Leave
The provision of purchased leave relates to Public Service employees who have entered into an agreement to self-fund up to an additional 10 weeks leave per calendar year. The provision recognises the value of salary set aside for employees and is measured at the undiscounted amounts expected to be paid when the liabilities are settled.
Superannuation
The Government Employees Superannuation Board (GESB) and other fund providers administer public sector superannuation arrangements in Western Australia in accordance with legislative requirements. Eligibility criteria for membership in particular schemes for public sector employees vary according to commencement and implementation dates.
Eligible employees contribute to the Pension Scheme, a defined benefit pension scheme closed to new members since 1987, or the Gold State Superannuation Scheme (GSS), a defined benefit lump sum scheme also closed to new members since 1995.
Employees commencing employment prior to 16 April 2007 who were not members of either the Pension Scheme or the GSS became non-contributory members of the West State Superannuation Scheme (WSS). Employees commencing employment on or after 16 April 2007 became members of the GESB Super Scheme (GESB).
From 30 March 2012, existing members of the WSS or GESB and new employees have been able to choose their preferred superannuation fund provider. The Department makes contributions to GESB or other fund provider on behalf of employees in compliance with the Commonwealth Government’s Superannuation Guarantee (Administration) Act 1992. Contributions to these accumulation schemes extinguish the Department’s liability for superannuation charges in respect of employees who are not members of the Pension Scheme or GSS.
The GSS is a defined benefit scheme for the purposes of employees and whole-of-government reporting. However, it is a defined contribution plan for agency purposes because the concurrent contributions (defined contributions) made by the Department to GESB extinguishes the agency’s obligations to the related superannuation liability.
The Department has no liabilities under the Pension Scheme or the GSS. The liabilities for the unfunded Pension Scheme and the unfunded GSS transfer benefits attributable to members who transferred from the Pension Scheme, are assumed by the Treasurer. All other GSS obligations are funded by concurrent contributions made by the Department to the GESB.
The GESB makes all benefit payments in respect of the Pension Scheme and GSS, and is recouped from the Treasurer for the employer’s share.
Provisions – Other
Employment On-Costs
Employment on-costs, including workers’ compensation insurance, are not employee benefits and are recognised separately as liabilities and expenses when the employment to which they relate has occurred. Employment on-costs are included as part of ‘Other expenses’ and are not included as part of the Department’s ‘Employee benefits expense’. The related liability is included in ‘Employment on-costs’ provision. See notes 14 ‘Other Expenses’ and 30 ‘Provisions’.

Department of Fisheries Annual Report 2016/17 | Disclosures and legal compliance | Page 90
(t) Superannuation Expense
The superannuation expense in the Statement of Comprehensive Income comprises of employer contributions paid to the GSS (concurrent contributions), the WSS, the GESBS, or other superannuation funds. The employer contribution paid to the GESB in respect of the GSS is paid back into the Consolidated Account by the GESB.
(u) Assets and services received free of charge or for nominal cost
Assets or services received free of charge or for nominal cost that the department would otherwise purchase if not donated, are recognised as income at the fair value of the assets or services where they can be reliably measured. A corresponding expense is recognised for services received. Receipts of assets are recognised in the Statement of Financial Position. Assets or services received from other State Government agencies are separately disclosed under Income from State Government in the Statement of Comprehensive Income.
(v) Jointly controlled operations
The Department has interests in joint arrangements that are joint operations. A joint arrangement is a contractual arrangement whereby two or more parties undertake an economic activity that is subject to joint control. A joint operation involves the use of assets and other resources of the operators rather than the establishment of a separate entity. The Department recognises its interests in the joint operations by recognising the assets it controls and the liabilities that it incurs in respect of the joint arrangements. The Department also recognises the expenses that it incurs and its share of the income that it earns from the sale of goods or services by the joint operations.
(w) Comparative Figures
Comparative figures are, where appropriate, reclassified to be comparable with the figures presented in the current financial year.
(x) Access Fees - Major Commercial Fisheries
The Department and the commercial fishing industry entered into an agreement in 1995 that provided for the Department to recover the costs associated with the management of major commercial fisheries. The costs were recovered through the annual fee charged for access to the fishery concerned.
Effective 1 July 2010 the use of cost recovery as the mechanism for setting access fees was discontinued. Access fees are now levied as a percentage of the gross value of production of each fishery.
3 JUDGEMENTS MADE BY MANAGEMENT IN APPLYING ACCOUNTING POLICIES
The preparation of financial statements requires management to make judgements about the application of accounting policies that have a significant effect on the amounts recognised in the financial statements. The Department evaluates these judgements regularly.
Operating lease commitments
The Department has entered into a number of leases for buildings for branch office accommodation. Some of these leases relate to buildings of a temporary nature and it has been determined that the lessor retains substantially all the risks and rewards incidental to ownership. Accordingly, these leases have been classified as operating leases.
4 KEY SOURCES OF ESTIMATION UNCERTAINTY
Key estimates and assumptions concerning the future are based on historical experience and various other factors that have a significant risk of causing a material adjustment to the carrying amount of assets and liabilities within the next financial year.
These include:
• Estimating the useful life and residual values of key assets; • Estimating depreciated replacement cost; and • Estimating future salary rates, salary inflation, expected future payments, retention rates and discount rates
for long service leave.

Department of Fisheries Annual Report 2016/17 | Disclosures and legal compliance | Page 91
5 DISCLOSURE OF CHANGES IN ACCOUNTING POLICY AND ESTIMATES
a. Initial application of an Australian Accounting Standard:
The Department has applied the following Australian Accounting Standards effective, or adopted, for annual reporting periods beginning on or after 1 July 2016 that impacted on the Department:
AASB 1057 - Application of Australian Accounting Standards
This Standard lists the application paragraphs for each other Standard (and Interpretation), grouped where they are the same. There is no financial impact.
AASB 2014-3 - Amendments to Australian Accounting Standards Accounting for Acquisitions of Interests in Joint Operations [AASB 1 & 11]
The Department establishes Joint Operations in pursuit of its objectives and does not routinely acquire interests in Joint Operations. Therefore, there is no financial impact on application of the Standard.
AASB 2014-4 - Amendments to Australian Accounting Standards Clarification of Acceptable Methods of Depreciation and Amortisation [AASB 116 & 138]
The adoption of this Standard has no financial impact for the Department as depreciation and amortisation is not determined by reference to revenue generation, but by reference to consumption of future economic benefits.
AASB 2014-9 - Amendments to Australian Accounting Standards Equity Method in Separate Financial Statements [AASB 1, 127 & 128]
This Standard amends AASB 127, and consequentially amends AASB 1 and AASB 128, to allow entities to use the equity method of accounting for investments in subsidiaries, joint ventures and associates in their separate financial statements. As the Department has no joint ventures and associates, the application of the Standard has no financial impact.
AASB 2015-1 - Amendments to Australian Accounting Standards Annual Improvements to Australian Accounting Standards 2012 2014 Cycle [AASB 1, 2, 3, 5, 7, 11, 110, 119, 121, 133, 134, 137 & 140]
These amendments arise from the issuance of International Financial Reporting Standard Annual Improvements to IFRSs 2012 2014 Cycle in September 2014, and editorial corrections. The Department has determined that the application of the Standard has no financial impact.
AASB 2015-2 - Amendments to Australian Accounting Standards Disclosure Initiative: Amendments to AASB 101 [AASB 7, 101, 134 & 1049]
This Standard amends AASB 101 to provide clarification regarding the disclosure requirements in AASB 101. Specifically, the Standard proposes narrow-focus amendments to address some of the concerns expressed about existing presentation and disclosure requirements and to ensure entities are able to use judgement when applying a Standard in determining what information to disclose in their financial statements. There is no financial impact.
AASB 2015-6 - Amendments to Australian Accounting Standards – Extending Related Party Disclosures to Not-for-Profit Public Sector Entities [AASB 10, 124 & 1049]
The amendments extend the scope of AASB 124 to include application by not-for-profit public sector entities. Implementation guidance is included to assist application of the Standard by not-for-profit public sector entities. There is no financial impact.
AASB 2015-10 - Amendments to Australian Accounting Standards Effective Date of Amendments to AASB 10 & 128
This Standard defers the mandatory effective date (application date) of amendments to AASB 10 & AASB 128 that were originally made in AASB 2014 10 so that the amendments are required to be applied for annual reporting periods beginning on or after 1 January 2018 instead of 1 January 2016. There is no financial impact.
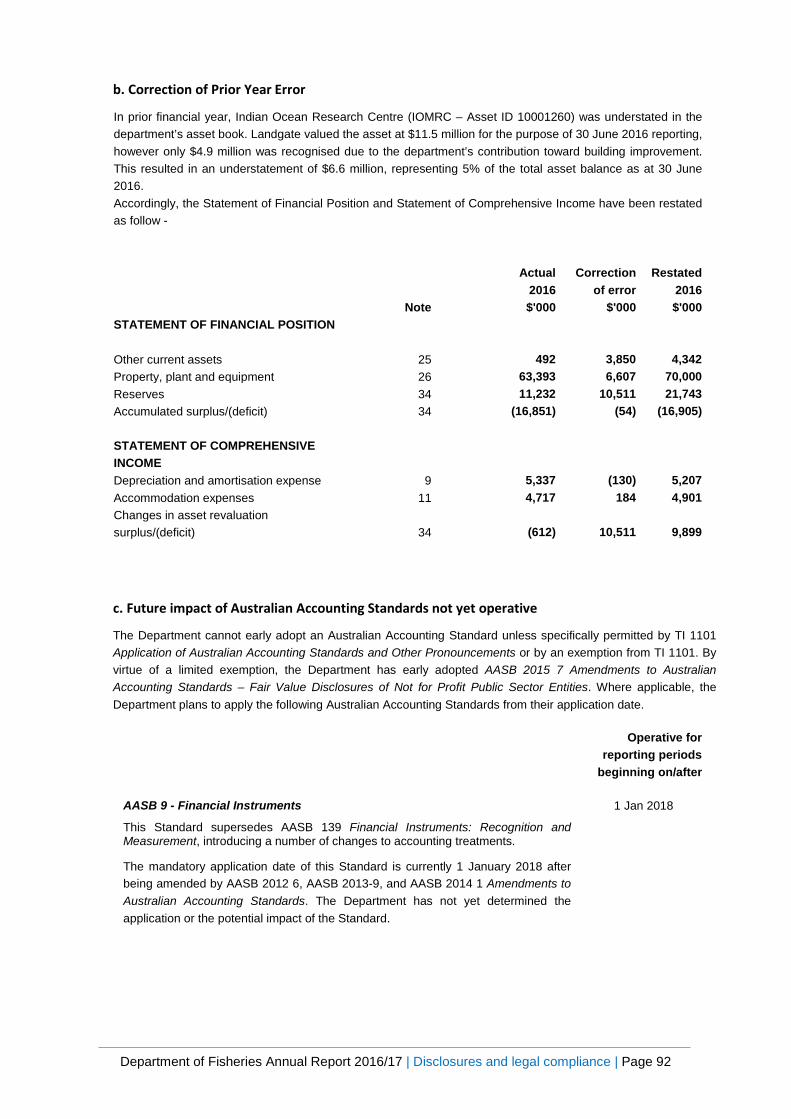
Department of Fisheries Annual Report 2016/17 | Disclosures and legal compliance | Page 92
b. Correction of Prior Year Error
In prior financial year, Indian Ocean Research Centre (IOMRC – Asset ID 10001260) was understated in the department’s asset book. Landgate valued the asset at $11.5 million for the purpose of 30 June 2016 reporting, however only $4.9 million was recognised due to the department’s contribution toward building improvement. This resulted in an understatement of $6.6 million, representing 5% of the total asset balance as at 30 June 2016. Accordingly, the Statement of Financial Position and Statement of Comprehensive Income have been restated as follow -
Actual 2016
Correction of error
Restated 2016
Note $'000 $'000 $'000 STATEMENT OF FINANCIAL POSITION Other current assets 25 492 3,850 4,342 Property, plant and equipment 26 63,393 6,607 70,000 Reserves 34 11,232 10,511 21,743 Accumulated surplus/(deficit) 34 (16,851) (54) (16,905) STATEMENT OF COMPREHENSIVE INCOME
Depreciation and amortisation expense 9 5,337 (130) 5,207 Accommodation expenses 11 4,717 184 4,901 Changes in asset revaluation surplus/(deficit)
34 (612) 10,511 9,899
c. Future impact of Australian Accounting Standards not yet operative
The Department cannot early adopt an Australian Accounting Standard unless specifically permitted by TI 1101 Application of Australian Accounting Standards and Other Pronouncements or by an exemption from TI 1101. By virtue of a limited exemption, the Department has early adopted AASB 2015 7 Amendments to Australian Accounting Standards – Fair Value Disclosures of Not for Profit Public Sector Entities. Where applicable, the Department plans to apply the following Australian Accounting Standards from their application date.
Operative for reporting periods
beginning on/after
AASB 9 - Financial Instruments
This Standard supersedes AASB 139 Financial Instruments: Recognition and Measurement, introducing a number of changes to accounting treatments.
The mandatory application date of this Standard is currently 1 January 2018 after being amended by AASB 2012 6, AASB 2013-9, and AASB 2014 1 Amendments to Australian Accounting Standards. The Department has not yet determined the application or the potential impact of the Standard.
1 Jan 2018
Department of Fisheries Annual Report 2016/17 | Disclosures and legal compliance | Page 93
Operative for reporting periods
beginning on/after
AASB 15 - Revenue from Contracts with Customers
This Standard establishes the principles that the Department shall apply to report useful information to users of financial statements about the nature, amount, timing and uncertainty of revenue and cash flows arising from a contract with a customer.
The Department's income is principally derived from appropriations which will be measured under AASB 1058 Income of Not for Profit Entities and will be unaffected by this change. However, the Department has not yet determined the potential impact of the Standard on ‘User charges and fees’ and ‘Sales’ revenues. In broad terms, it is anticipated that the terms and conditions attached to these revenues will defer revenue recognition until the Department has discharged its performance obligations.
1 Jan 2019
AASB 16 - Leases
This Standard introduces a single lessee accounting model and requires a lessee to recognise assets and liabilities for all leases with a term of more than 12 months, unless the underlying asset is of low value.
Whilst the impact of AASB 16 has not yet been quantified, the entity currently has operating lease commitments for $22,220,000. The worth of non-cancellable operating leases which the Department anticipates most of this amount will be brought onto the statement of financial position, excepting amounts pertinent to short term or low value leases. Interest and amortisation expense will increase and rental expense will decrease.
1 Jan 2019
AASB 1058 - Income of Not-for-Profit Entities
This Standard clarifies and simplifies the income recognition requirements that apply to not for profit (NFP) entities, more closely reflecting the economic reality of NFP entity transactions that are not contracts with customers. Timing of income recognition is dependent on whether such a transaction gives rise to a liability, or a performance obligation (a promise to transfer a good or service), or, an obligation to acquire an asset. The Department has not yet determined the application or the potential impact of the Standard.
1 Jan 2019
AASB 2010-7 - Amendments to Australian Accounting Standards arising from AASB 9 (December 2010) [AASB 1, 3, 4, 5, 7, 101, 102, 108, 112, 118, 120, 121, 127, 128, 131, 132, 136, 137, 139, 1023 & 1038 and Int 2, 5, 10, 12, 19 & 127]
This Standard makes consequential amendments to other Australian Accounting Standards and Interpretations as a result of issuing AASB 9 in December 2010.
The mandatory application date of this Standard has been amended by AASB 2012 6 and AASB 2014 1 to 1 January 2018. The Department has not yet determined the application or the potential impact of the Standard.
1 Jan 2018
AASB 2014-1 - Amendments to Australian Accounting Standards
Part E of this Standard makes amendments to AASB 9 and consequential amendments to other Standards. It has not yet been assessed by the Department to determine the application or potential impact of the Standard.
1 Jan 2018
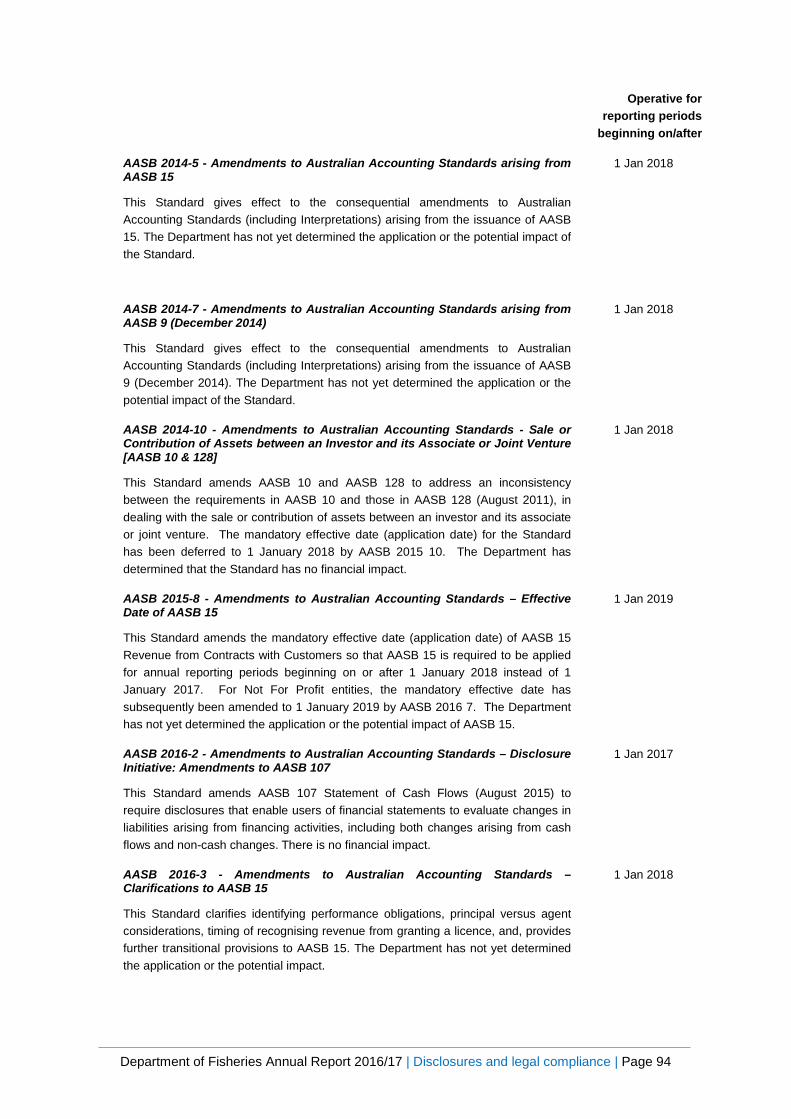
Department of Fisheries Annual Report 2016/17 | Disclosures and legal compliance | Page 94
Operative for reporting periods
beginning on/after
AASB 2014-5 - Amendments to Australian Accounting Standards arising from AASB 15
This Standard gives effect to the consequential amendments to Australian Accounting Standards (including Interpretations) arising from the issuance of AASB 15. The Department has not yet determined the application or the potential impact of the Standard.
1 Jan 2018
AASB 2014-7 - Amendments to Australian Accounting Standards arising from AASB 9 (December 2014)
This Standard gives effect to the consequential amendments to Australian Accounting Standards (including Interpretations) arising from the issuance of AASB 9 (December 2014). The Department has not yet determined the application or the potential impact of the Standard.
1 Jan 2018
AASB 2014-10 - Amendments to Australian Accounting Standards - Sale or Contribution of Assets between an Investor and its Associate or Joint Venture [AASB 10 & 128]
This Standard amends AASB 10 and AASB 128 to address an inconsistency between the requirements in AASB 10 and those in AASB 128 (August 2011), in dealing with the sale or contribution of assets between an investor and its associate or joint venture. The mandatory effective date (application date) for the Standard has been deferred to 1 January 2018 by AASB 2015 10. The Department has determined that the Standard has no financial impact.
1 Jan 2018
AASB 2015-8 - Amendments to Australian Accounting Standards – Effective Date of AASB 15
This Standard amends the mandatory effective date (application date) of AASB 15 Revenue from Contracts with Customers so that AASB 15 is required to be applied for annual reporting periods beginning on or after 1 January 2018 instead of 1 January 2017. For Not For Profit entities, the mandatory effective date has subsequently been amended to 1 January 2019 by AASB 2016 7. The Department has not yet determined the application or the potential impact of AASB 15.
1 Jan 2019
AASB 2016-2 - Amendments to Australian Accounting Standards – Disclosure Initiative: Amendments to AASB 107
This Standard amends AASB 107 Statement of Cash Flows (August 2015) to require disclosures that enable users of financial statements to evaluate changes in liabilities arising from financing activities, including both changes arising from cash flows and non-cash changes. There is no financial impact.
1 Jan 2017
AASB 2016-3 - Amendments to Australian Accounting Standards – Clarifications to AASB 15
This Standard clarifies identifying performance obligations, principal versus agent considerations, timing of recognising revenue from granting a licence, and, provides further transitional provisions to AASB 15. The Department has not yet determined the application or the potential impact.
1 Jan 2018
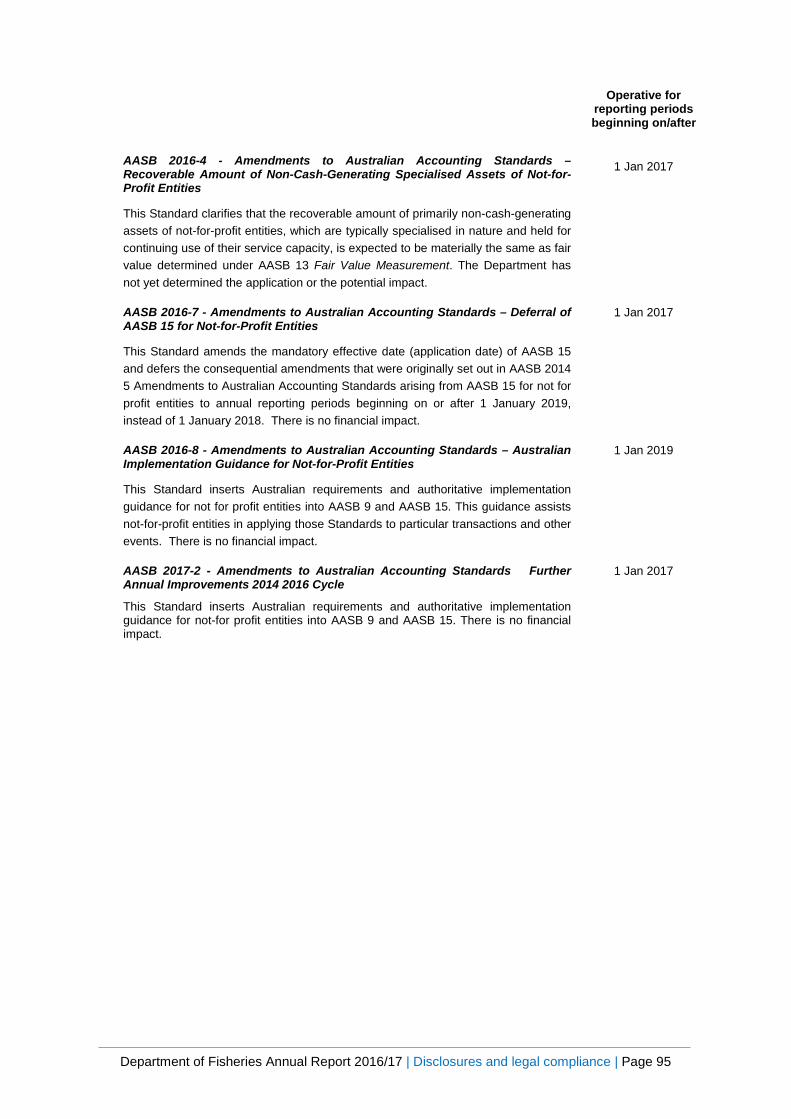
Department of Fisheries Annual Report 2016/17 | Disclosures and legal compliance | Page 95
AASB 2016-4 - Amendments to Australian Accounting Standards – Recoverable Amount of Non-Cash-Generating Specialised Assets of Not-for-Profit Entities
This Standard clarifies that the recoverable amount of primarily non-cash-generating assets of not-for-profit entities, which are typically specialised in nature and held for continuing use of their service capacity, is expected to be materially the same as fair value determined under AASB 13 Fair Value Measurement. The Department has not yet determined the application or the potential impact.
Operative for reporting periods beginning on/after
1 Jan 2017
AASB 2016-7 - Amendments to Australian Accounting Standards – Deferral of AASB 15 for Not-for-Profit Entities
This Standard amends the mandatory effective date (application date) of AASB 15 and defers the consequential amendments that were originally set out in AASB 2014 5 Amendments to Australian Accounting Standards arising from AASB 15 for not for profit entities to annual reporting periods beginning on or after 1 January 2019, instead of 1 January 2018. There is no financial impact.
1 Jan 2017
AASB 2016-8 - Amendments to Australian Accounting Standards – Australian Implementation Guidance for Not-for-Profit Entities
This Standard inserts Australian requirements and authoritative implementation guidance for not for profit entities into AASB 9 and AASB 15. This guidance assists not-for-profit entities in applying those Standards to particular transactions and other events. There is no financial impact.
1 Jan 2019
AASB 2017-2 - Amendments to Australian Accounting Standards Further Annual Improvements 2014 2016 Cycle
This Standard inserts Australian requirements and authoritative implementation guidance for not-for profit entities into AASB 9 and AASB 15. There is no financial impact.
1 Jan 2017

Department of Fisheries Annual Report 2016/17 | Disclosures and legal compliance | Page 96
Note 6: EMPLOYEE BENEFITS EXPENSE 2017 2016 $'000 $'000 Wages and salaries(a) 47,554 48,404 Superannuation - defined contribution plans(b) 4,809 4,667 Other related expenses(c) 2,217 2,382 54,580 55,453
(a) Includes the value of leave entitlements including superannuation contribution component. (b) Defined contribution plans include West State ($3.788m), Gold State ($1.021m) and other eligible funds. (c) Includes the value of fringe benefit to the employees plus the fringe benefits tax component. Employment on-costs expenses, such as workers’ compensation insurance, are included at note 14 ‘Other expenses’. The employment on costs liability is included at note 32 ‘Provisions’.
Note 7: COMPENSATION OF KEY MANAGEMENT PERSONNEL 2017 2016 Compensation Band ($) 380,001 - 390,000 1 1 220,001 - 230,000 1 - 210,001 - 220,000 - 1 200,001 - 210,000 2 1 190,001 - 200,000 - 1 180,001 - 190,000 1 - 130,001 - 140,000 - 1
$'000 $'000 Short-term employee benefits 923 910 Post-employment benefits 258 204 Other long-term benefits 21 23 Termination benefits - - Total compensation of senior officers 1,203 1,137
Note 8: SUPPLIES AND SERVICES 2017 2016 $'000 $'000 Communications 1,391 949 Freight & Mail 236 237 Contractors & Consultants 9,171 8,190 Payments to stakeholder groups (a) 2,334 1,752 Consumables 2,382 2,659 Minor equipment acquisitions 509 208 Travel 1,377 1,572 Advertising 359 452 Insurance 1,267 970 Other lease rentals 1,592 1,743 Licence Fees & Registration 1,291 678 Catering 37 43 Other 842 838 22,789 20,291 (a) The legislation governing fisheries management and common law principles associated with “property rights” impose obligations on fisheries managers to consult with affected individuals. The provision of these funds allows the recipient to act as a single point for consultation. Given this the arrangement is a fee for service rather than grant.
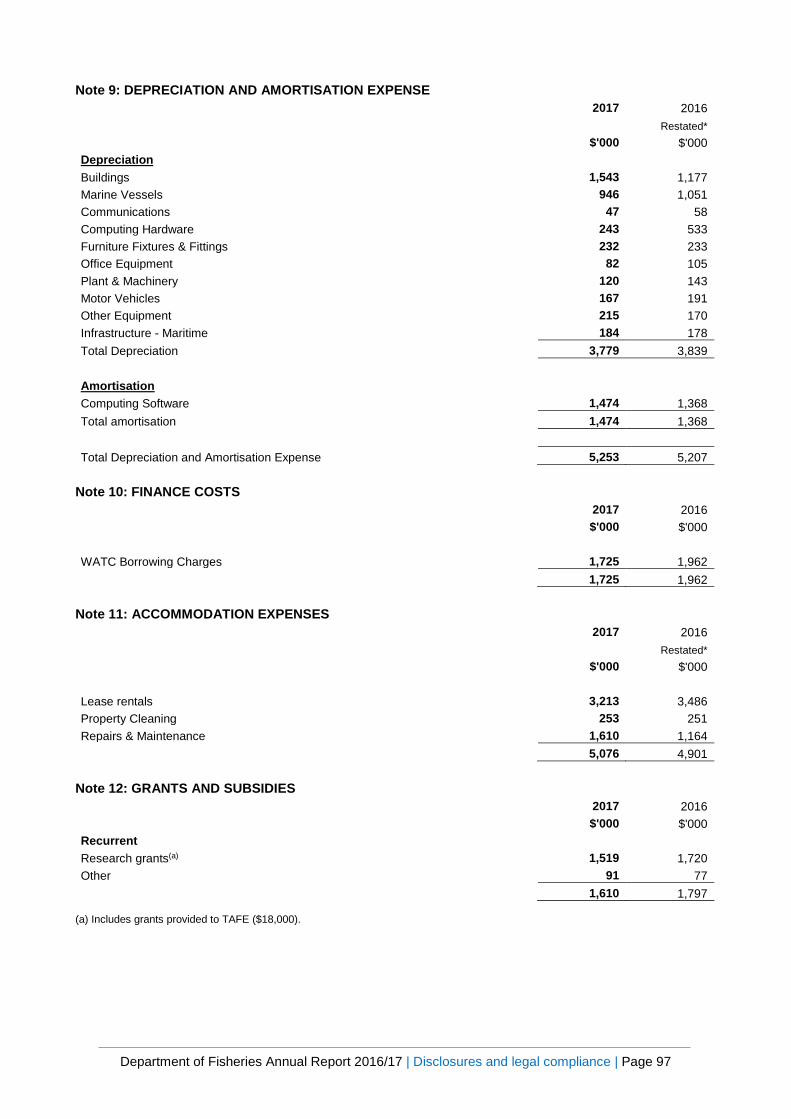
Department of Fisheries Annual Report 2016/17 | Disclosures and legal compliance | Page 97
Note 9: DEPRECIATION AND AMORTISATION EXPENSE 2017 2016 Restated* $'000 $'000 Depreciation Buildings 1,543 1,177 Marine Vessels 946 1,051 Communications 47 58 Computing Hardware 243 533 Furniture Fixtures & Fittings 232 233 Office Equipment 82 105 Plant & Machinery 120 143 Motor Vehicles 167 191 Other Equipment 215 170 Infrastructure - Maritime 184 178 Total Depreciation 3,779 3,839 Amortisation Computing Software 1,474 1,368 Total amortisation 1,474 1,368 Total Depreciation and Amortisation Expense 5,253 5,207
Note 10: FINANCE COSTS 2017 2016 $'000 $'000 WATC Borrowing Charges 1,725 1,962 1,725 1,962
Note 11: ACCOMMODATION EXPENSES 2017 2016 Restated* $'000 $'000 Lease rentals 3,213 3,486 Property Cleaning 253 251 Repairs & Maintenance 1,610 1,164 5,076 4,901
Note 12: GRANTS AND SUBSIDIES 2017 2016 $'000 $'000 Recurrent Research grants(a) 1,519 1,720 Other 91 77 1,610 1,797
(a) Includes grants provided to TAFE ($18,000).
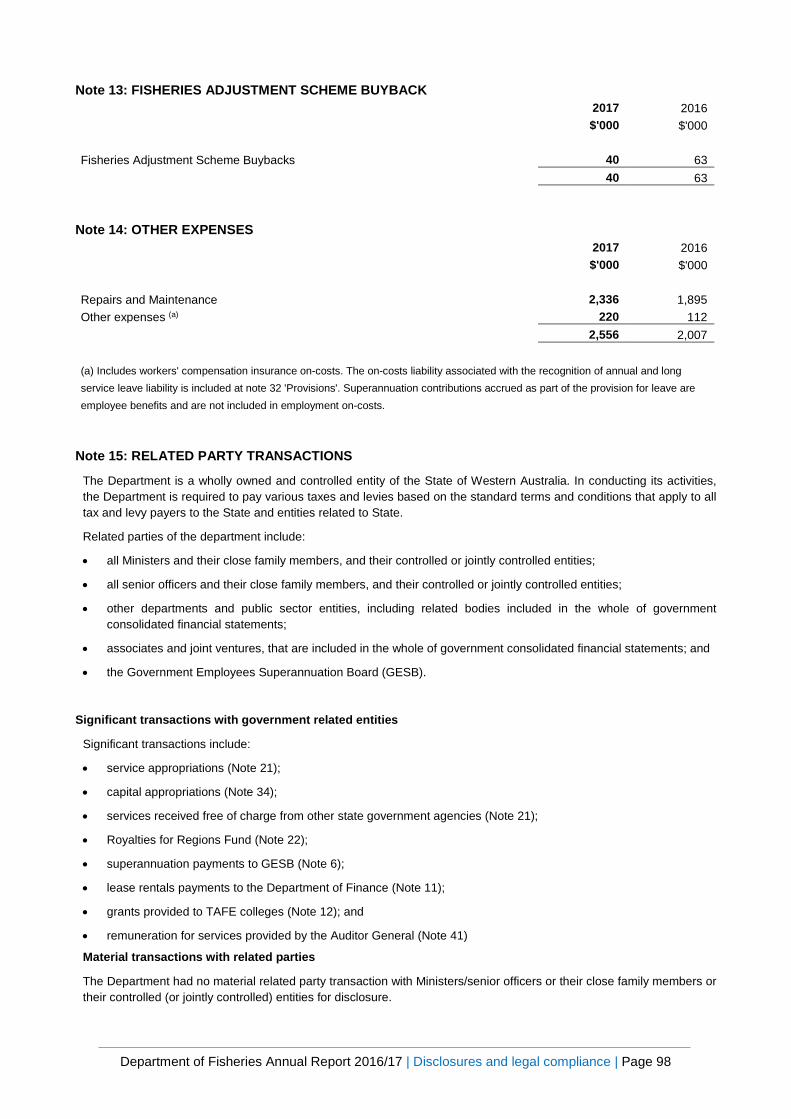
Department of Fisheries Annual Report 2016/17 | Disclosures and legal compliance | Page 98
Note 13: FISHERIES ADJUSTMENT SCHEME BUYBACK 2017 2016 $'000 $'000 Fisheries Adjustment Scheme Buybacks 40 63 40 63
Note 14: OTHER EXPENSES 2017 2016 $'000 $'000 Repairs and Maintenance 2,336 1,895 Other expenses (a) 220 112 2,556 2,007 (a) Includes workers' compensation insurance on-costs. The on-costs liability associated with the recognition of annual and long service leave liability is included at note 32 'Provisions'. Superannuation contributions accrued as part of the provision for leave are employee benefits and are not included in employment on-costs.
Note 15: RELATED PARTY TRANSACTIONS
The Department is a wholly owned and controlled entity of the State of Western Australia. In conducting its activities, the Department is required to pay various taxes and levies based on the standard terms and conditions that apply to all tax and levy payers to the State and entities related to State.
Related parties of the department include:
• all Ministers and their close family members, and their controlled or jointly controlled entities;
• all senior officers and their close family members, and their controlled or jointly controlled entities;
• other departments and public sector entities, including related bodies included in the whole of government consolidated financial statements;
• associates and joint ventures, that are included in the whole of government consolidated financial statements; and
• the Government Employees Superannuation Board (GESB).
Significant transactions with government related entities
Significant transactions include:
• service appropriations (Note 21);
• capital appropriations (Note 34);
• services received free of charge from other state government agencies (Note 21);
• Royalties for Regions Fund (Note 22);
• superannuation payments to GESB (Note 6);
• lease rentals payments to the Department of Finance (Note 11);
• grants provided to TAFE colleges (Note 12); and
• remuneration for services provided by the Auditor General (Note 41)
Material transactions with related parties
The Department had no material related party transaction with Ministers/senior officers or their close family members or their controlled (or jointly controlled) entities for disclosure.
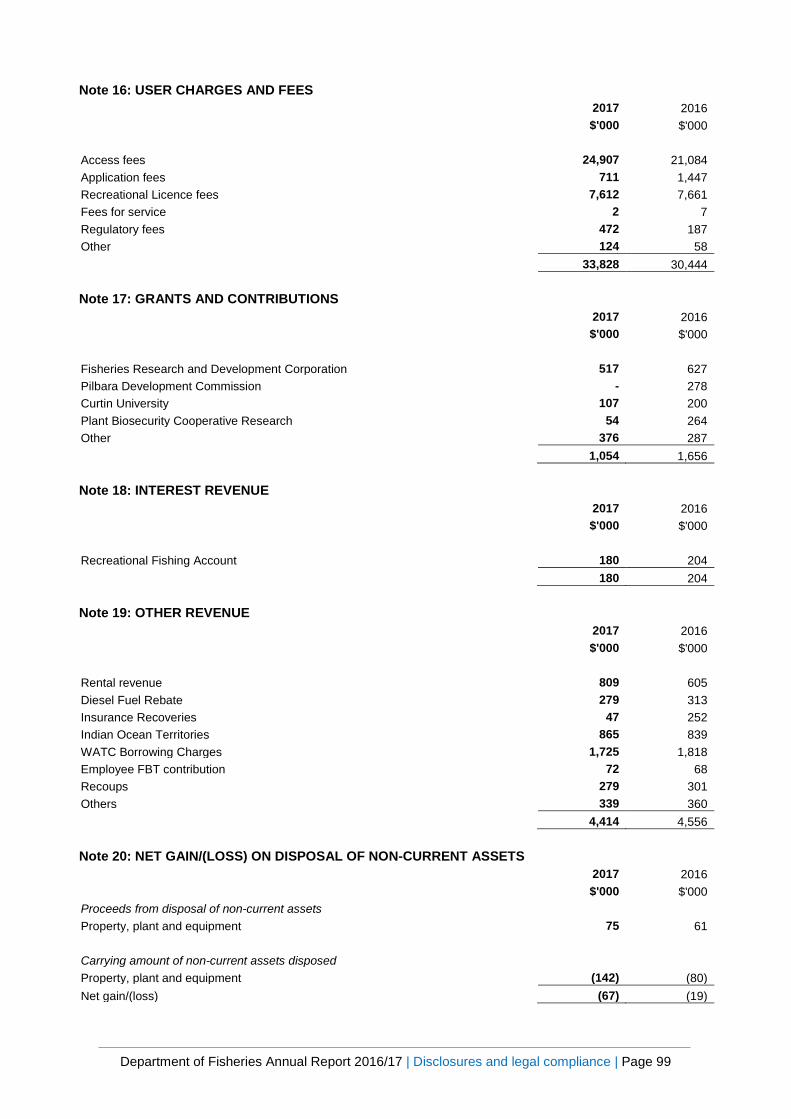
Department of Fisheries Annual Report 2016/17 | Disclosures and legal compliance | Page 99
Note 16: USER CHARGES AND FEES 2017 2016 $'000 $'000 Access fees 24,907 21,084 Application fees 711 1,447 Recreational Licence fees 7,612 7,661 Fees for service 2 7 Regulatory fees 472 187 Other 124 58 33,828 30,444
Note 17: GRANTS AND CONTRIBUTIONS 2017 2016 $'000 $'000 Fisheries Research and Development Corporation 517 627 Pilbara Development Commission - 278 Curtin University 107 200 Plant Biosecurity Cooperative Research 54 264 Other 376 287 1,054 1,656
Note 18: INTEREST REVENUE 2017 2016 $'000 $'000 Recreational Fishing Account 180 204 180 204
Note 19: OTHER REVENUE 2017 2016 $'000 $'000 Rental revenue 809 605 Diesel Fuel Rebate 279 313 Insurance Recoveries 47 252 Indian Ocean Territories 865 839 WATC Borrowing Charges 1,725 1,818 Employee FBT contribution 72 68 Recoups 279 301 Others 339 360 4,414 4,556
Note 20: NET GAIN/(LOSS) ON DISPOSAL OF NON-CURRENT ASSETS 2017 2016 $'000 $'000 Proceeds from disposal of non-current assets Property, plant and equipment 75 61 Carrying amount of non-current assets disposed Property, plant and equipment (142) (80) Net gain/(loss) (67) (19)
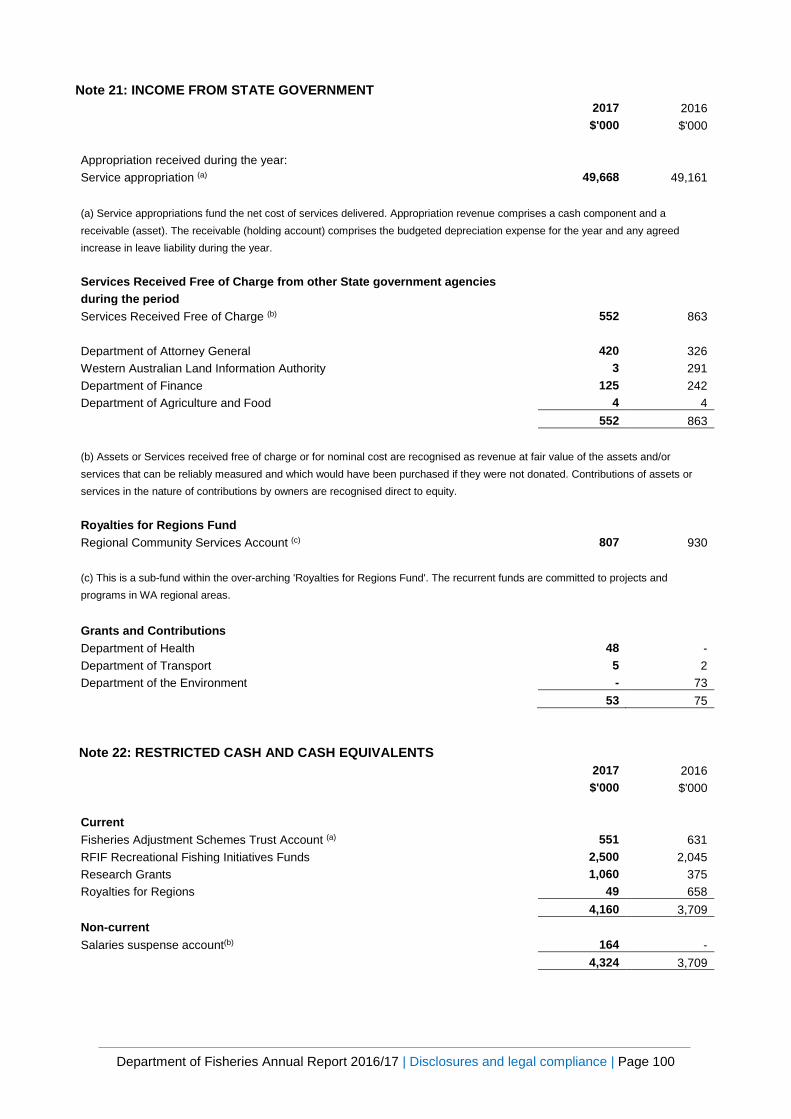
Department of Fisheries Annual Report 2016/17 | Disclosures and legal compliance | Page 100
Note 21: INCOME FROM STATE GOVERNMENT 2017 2016 $'000 $'000 Appropriation received during the year: Service appropriation (a) 49,668 49,161 (a) Service appropriations fund the net cost of services delivered. Appropriation revenue comprises a cash component and a receivable (asset). The receivable (holding account) comprises the budgeted depreciation expense for the year and any agreed increase in leave liability during the year. Services Received Free of Charge from other State government agencies during the period Services Received Free of Charge (b) 552 863 Department of Attorney General 420 326 Western Australian Land Information Authority 3 291 Department of Finance 125 242 Department of Agriculture and Food 4 4 552 863 (b) Assets or Services received free of charge or for nominal cost are recognised as revenue at fair value of the assets and/or services that can be reliably measured and which would have been purchased if they were not donated. Contributions of assets or services in the nature of contributions by owners are recognised direct to equity. Royalties for Regions Fund Regional Community Services Account (c) 807 930 (c) This is a sub-fund within the over-arching 'Royalties for Regions Fund'. The recurrent funds are committed to projects and programs in WA regional areas.
Grants and Contributions Department of Health 48 - Department of Transport 5 2 Department of the Environment - 73 53 75
Note 22: RESTRICTED CASH AND CASH EQUIVALENTS 2017 2016 $'000 $'000 Current Fisheries Adjustment Schemes Trust Account (a) 551 631 RFIF Recreational Fishing Initiatives Funds 2,500 2,045 Research Grants 1,060 375 Royalties for Regions 49 658 4,160 3,709 Non-current Salaries suspense account(b) 164 - 4,324 3,709

Department of Fisheries Annual Report 2016/17 | Disclosures and legal compliance | Page 101
(a) Monies held in the Fisheries Adjustment Schemes Trust Account are only available for use as prescribed by the Fisheries Adjustment Scheme Act 1987. (b) Amount held in suspense account is only to be used for the purpose of meeting the 27th pay in a financial year that occurs every 11 years.
Note 23: RECEIVABLES 2017 2016 $'000 $'000 Current Receivables 426 480 Less: Allowance for impairment of receivables (6) (6) GST receivable 366 360 786 834 Other debtors (a) 5,851 5,357 Total current 6,637 6,191 Non-Current Other debtors (a) 20,814 25,605 Total non-current 20,814 25,605 Total receivables 27,451 31,796 Reconciliation of changes in the allowance for impairment of receivables: Balance at start of period 6 6 Doubtful debts expense 8 - Amounts written off during the period (8) - Amounts recovered during the period - - Balance at the end of the period 6 6 (a) The 'Other Debtors' relates to an advance made to industry. The Department does not hold any collateral or other credit enhancements as security for receivables. See also note 2(p) 'Receivables' and note 40 'Financial Instruments'
Note 24: AMOUNTS RECEIVABLE FOR SERVICES (HOLDING ACCOUNT) 2017 2016 $'000 $'000 Current 1,766 1,778 Non-current 19,428 16,561 21,194 18,339 Represents the non-cash component of service appropriations. It is restricted in that it can only be used for asset replacement or payment of leave liability. See note 2(o) 'Amounts Receivable for Services (Holding Account)'.

Department of Fisheries Annual Report 2016/17 | Disclosures and legal compliance | Page 102
Note 25: OTHER ASSETS 2017 2016 Restated* $'000 $'000 Prepayments Licence and rentals 4,564 4,290 Accrued Income Accrued Interest 45 52 4,609 4,342
Note 26: PROPERTY, PLANT AND EQUIPMENT 2017 2016 Restated* $'000 $'000 LAND Land at fair value (i) 6,180 6,530 6,180 6,530 BUILDINGS At fair value (i) 40,447 46,931 Accumulated depreciation - - 40,447 46,931 MARINE VESSELS At cost 18,629 17,299 Accumulated depreciation (11,387) (10,523) 7,242 6,776 COMMUNICATION EQUIPMENT At cost 714 730 Accumulated depreciation (660) (624) 54 106 COMPUTER HARDWARE At cost 3,807 3,682 Accumulated depreciation (3,344) (3,190) 463 492 FURNITURE AND FITTINGS At cost 2,929 3,173 Accumulated depreciation (1,503) (1,384) 1,426 1,789 OFFICE EQUIPMENT At cost 599 703 Accumulated depreciation (454) (464) 145 239 2017 2016 $'000 $'000 PLANT AND MACHINERY At cost 2,012 2,000 Accumulated depreciation (1,318) (1,275) 694 725 MOTOR VEHICLES At cost 1,495 1,525 Accumulated depreciation (1,047) (956) 448 569
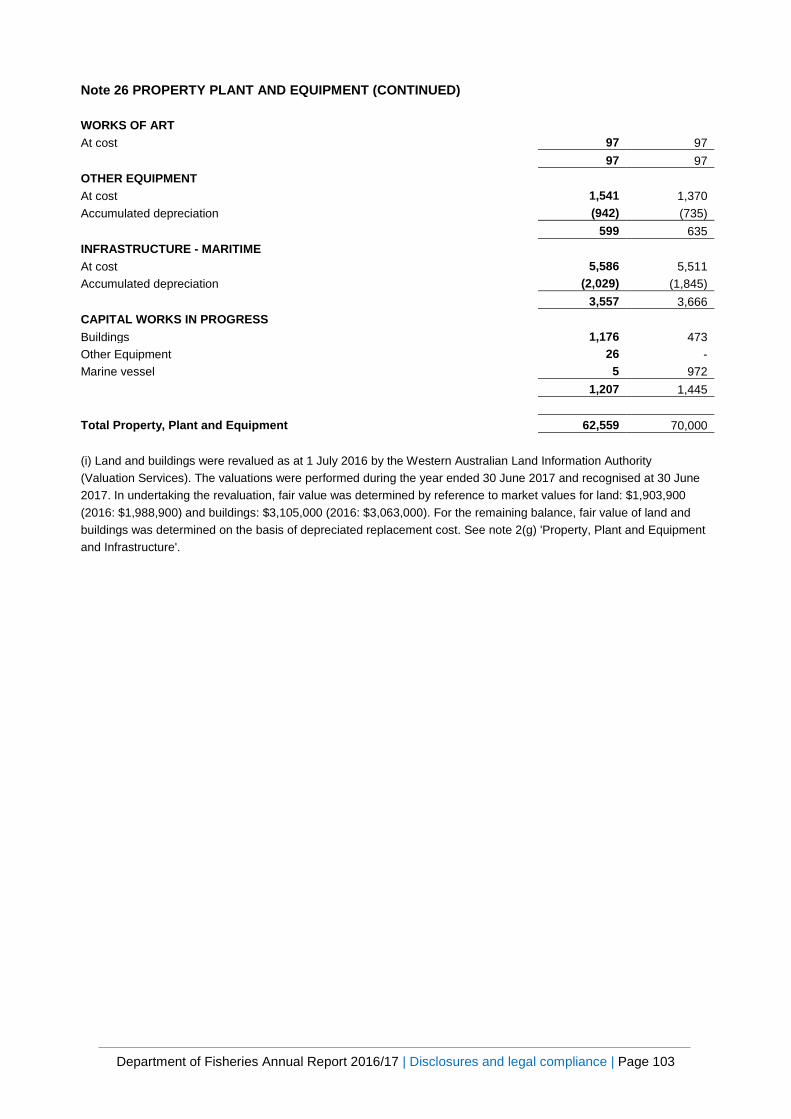
Department of Fisheries Annual Report 2016/17 | Disclosures and legal compliance | Page 103
Note 26 PROPERTY PLANT AND EQUIPMENT (CONTINUED) WORKS OF ART At cost 97 97 97 97 OTHER EQUIPMENT At cost 1,541 1,370 Accumulated depreciation (942) (735) 599 635 INFRASTRUCTURE - MARITIME At cost 5,586 5,511 Accumulated depreciation (2,029) (1,845) 3,557 3,666 CAPITAL WORKS IN PROGRESS Buildings 1,176 473 Other Equipment 26 - Marine vessel 5 972 1,207 1,445 Total Property, Plant and Equipment 62,559 70,000 (i) Land and buildings were revalued as at 1 July 2016 by the Western Australian Land Information Authority (Valuation Services). The valuations were performed during the year ended 30 June 2017 and recognised at 30 June 2017. In undertaking the revaluation, fair value was determined by reference to market values for land: $1,903,900 (2016: $1,988,900) and buildings: $3,105,000 (2016: $3,063,000). For the remaining balance, fair value of land and buildings was determined on the basis of depreciated replacement cost. See note 2(g) 'Property, Plant and Equipment and Infrastructure'.
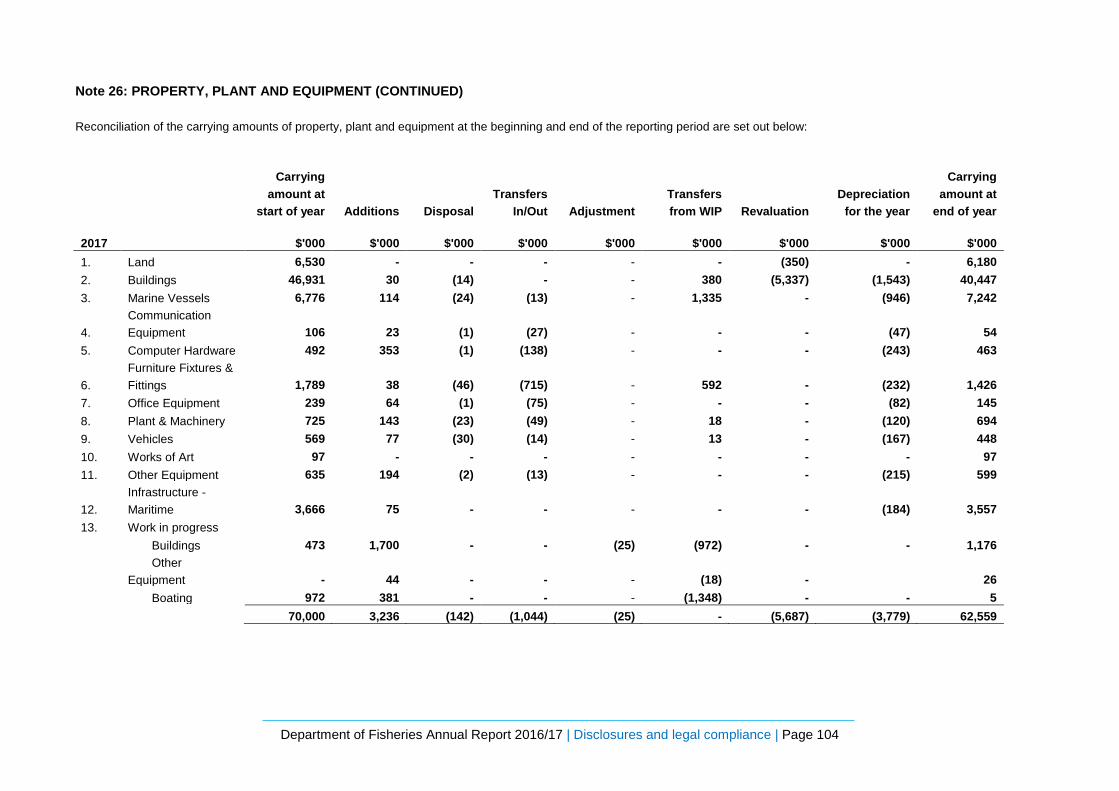
Department of Fisheries Annual Report 2016/17 | Disclosures and legal compliance | Page 104
Note 26: PROPERTY, PLANT AND EQUIPMENT (CONTINUED) Reconciliation of the carrying amounts of property, plant and equipment at the beginning and end of the reporting period are set out below:
Carrying amount at
start of year Additions Disposal Transfers
In/Out Adjustment Transfers from WIP Revaluation
Depreciation for the year
Carrying amount at
end of year
2017 $'000 $'000 $'000 $'000 $'000 $'000 $'000 $'000 $'000 1. Land 6,530 - - - - - (350) - 6,180 2. Buildings 46,931 30 (14) - - 380 (5,337) (1,543) 40,447 3. Marine Vessels 6,776 114 (24) (13) - 1,335 - (946) 7,242
4. Communication Equipment 106 23 (1) (27) - - - (47) 54
5. Computer Hardware 492 353 (1) (138) - - - (243) 463
6. Furniture Fixtures & Fittings 1,789 38 (46) (715) - 592 - (232) 1,426
7. Office Equipment 239 64 (1) (75) - - - (82) 145 8. Plant & Machinery 725 143 (23) (49) - 18 - (120) 694 9. Vehicles 569 77 (30) (14) - 13 - (167) 448 10. Works of Art 97 - - - - - - - 97 11. Other Equipment 635 194 (2) (13) - - - (215) 599
12. Infrastructure - Maritime 3,666 75 - - - - - (184) 3,557
13. Work in progress Buildings 473 1,700 - - (25) (972) - - 1,176
Other
Equipment - 44 - - - (18) - 26 Boating 972 381 - - - (1,348) - - 5
70,000 3,236 (142) (1,044) (25) - (5,687) (3,779) 62,559

Department of Fisheries Annual Report 2016/17 | Disclosures and legal compliance | Page 105
Note 26: PROPERTY, PLANT AND EQUIPMENT (CONTINUED)
Carrying amount at
start of year Additions Disposal Transfers
In/Out Adjustment Transfers from WIP Revaluation
Depreciation for the year
Carrying amount at
end of year Restated* Restated* 2016 $'000 $'000 $'000 $'000 $'000 $'000 $'000 $'000 $'000 1. Land 6,967 - - - - - (437) - 6,530 2. Buildings 36,494 - - - - 1,278 10,336 (1,177) 46,931 3. Marine Vessels 7,476 195 - - - 156 - (1,051) 6,776
4. Communication Equipment 153 11 - - - - - (58) 106
5. Computer Hardware 895 130 - - - - - (533) 492
6. Furniture Fixtures & Fittings 1,920 91 - - - 11 - (233) 1,789
7. Office Equipment 250 98 (4) - - - - (105) 239 8. Plant & Machinery 792 93 (38) 21 - - - (143) 725 9. Vehicles 627 159 (35) - - 9 - (191) 569 10. Works of Art 97 - - - - - - - 97 11. Other Equipment 534 274 (3) - - - - (170) 635
12. Infrastructure - Maritime 3,579 138 - (21) - 148 - (178) 3,666
13. Work in progress - Buildings 5,329 615 - - (4,034) (1,437) - - 473 Other Equipment - - - - - - - - - Boating 539 598 - - - (165) - - 972
65,652 2,402 (80) - (4,034) - 9,899 (3,839) 70,000
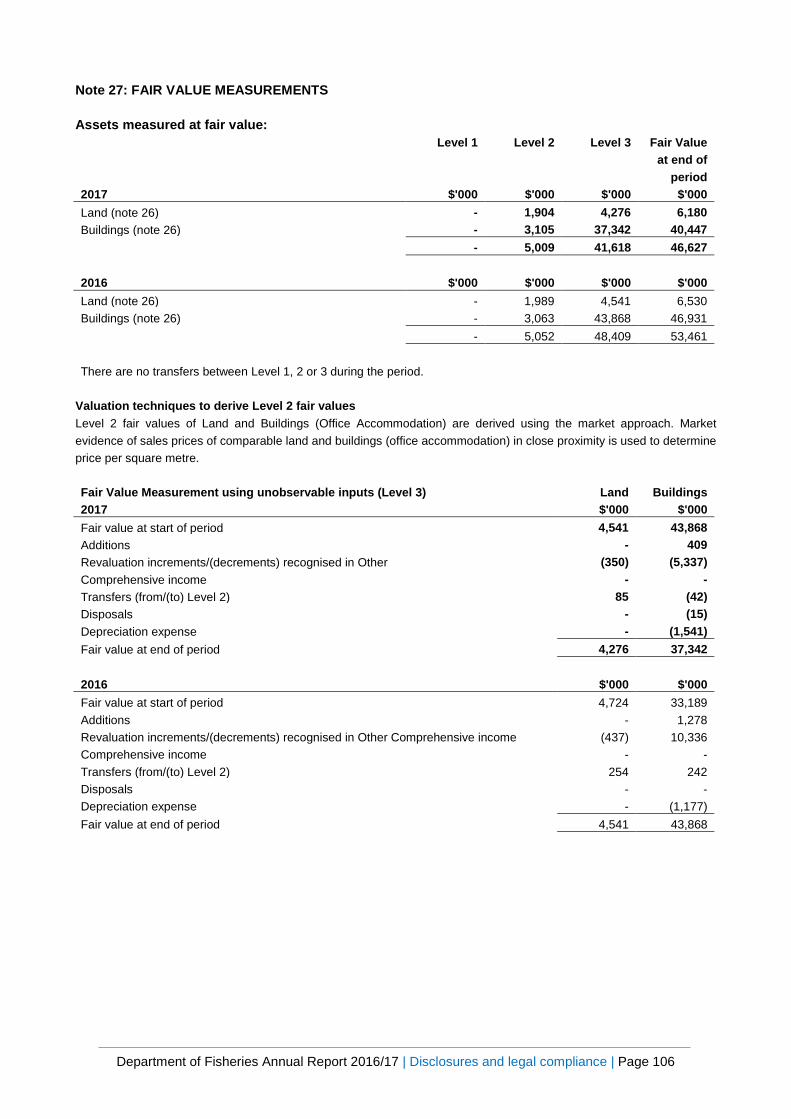
Department of Fisheries Annual Report 2016/17 | Disclosures and legal compliance | Page 106
Note 27: FAIR VALUE MEASUREMENTS Assets measured at fair value:
Level 1 Level 2 Level 3 Fair Value at end of
period 2017 $'000 $'000 $'000 $'000 Land (note 26) - 1,904 4,276 6,180 Buildings (note 26) - 3,105 37,342 40,447 - 5,009 41,618 46,627 2016 $'000 $'000 $'000 $'000 Land (note 26) - 1,989 4,541 6,530 Buildings (note 26) - 3,063 43,868 46,931 - 5,052 48,409 53,461 There are no transfers between Level 1, 2 or 3 during the period.
Valuation techniques to derive Level 2 fair values Level 2 fair values of Land and Buildings (Office Accommodation) are derived using the market approach. Market evidence of sales prices of comparable land and buildings (office accommodation) in close proximity is used to determine price per square metre. Fair Value Measurement using unobservable inputs (Level 3) Land Buildings 2017 $'000 $'000 Fair value at start of period 4,541 43,868 Additions - 409 Revaluation increments/(decrements) recognised in Other (350) (5,337) Comprehensive income - - Transfers (from/(to) Level 2) 85 (42) Disposals - (15) Depreciation expense - (1,541) Fair value at end of period 4,276 37,342 2016 $'000 $'000 Fair value at start of period 4,724 33,189 Additions - 1,278 Revaluation increments/(decrements) recognised in Other Comprehensive income (437) 10,336 Comprehensive income - - Transfers (from/(to) Level 2) 254 242 Disposals - - Depreciation expense - (1,177) Fair value at end of period 4,541 43,868
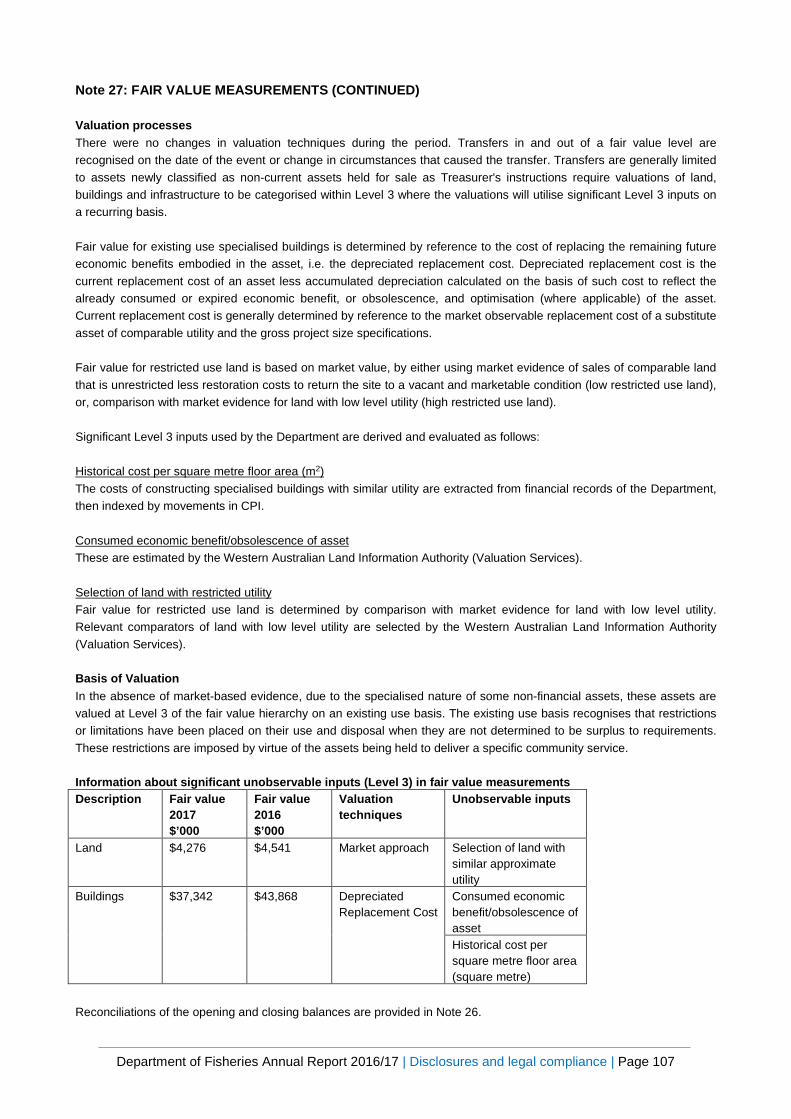
Department of Fisheries Annual Report 2016/17 | Disclosures and legal compliance | Page 107
Note 27: FAIR VALUE MEASUREMENTS (CONTINUED)
Valuation processes There were no changes in valuation techniques during the period. Transfers in and out of a fair value level are recognised on the date of the event or change in circumstances that caused the transfer. Transfers are generally limited to assets newly classified as non-current assets held for sale as Treasurer's instructions require valuations of land, buildings and infrastructure to be categorised within Level 3 where the valuations will utilise significant Level 3 inputs on a recurring basis. Fair value for existing use specialised buildings is determined by reference to the cost of replacing the remaining future economic benefits embodied in the asset, i.e. the depreciated replacement cost. Depreciated replacement cost is the current replacement cost of an asset less accumulated depreciation calculated on the basis of such cost to reflect the already consumed or expired economic benefit, or obsolescence, and optimisation (where applicable) of the asset. Current replacement cost is generally determined by reference to the market observable replacement cost of a substitute asset of comparable utility and the gross project size specifications. Fair value for restricted use land is based on market value, by either using market evidence of sales of comparable land that is unrestricted less restoration costs to return the site to a vacant and marketable condition (low restricted use land), or, comparison with market evidence for land with low level utility (high restricted use land). Significant Level 3 inputs used by the Department are derived and evaluated as follows: Historical cost per square metre floor area (m2) The costs of constructing specialised buildings with similar utility are extracted from financial records of the Department, then indexed by movements in CPI. Consumed economic benefit/obsolescence of asset These are estimated by the Western Australian Land Information Authority (Valuation Services). Selection of land with restricted utility Fair value for restricted use land is determined by comparison with market evidence for land with low level utility. Relevant comparators of land with low level utility are selected by the Western Australian Land Information Authority (Valuation Services). Basis of Valuation In the absence of market-based evidence, due to the specialised nature of some non-financial assets, these assets are valued at Level 3 of the fair value hierarchy on an existing use basis. The existing use basis recognises that restrictions or limitations have been placed on their use and disposal when they are not determined to be surplus to requirements. These restrictions are imposed by virtue of the assets being held to deliver a specific community service. Information about significant unobservable inputs (Level 3) in fair value measurements Description
Fair value 2017 $’000
Fair value 2016 $’000
Valuation techniques
Unobservable inputs
Land $4,276 $4,541 Market approach Selection of land with similar approximate utility
Buildings $37,342 $43,868 Depreciated Replacement Cost
Consumed economic benefit/obsolescence of asset Historical cost per square metre floor area (square metre)
Reconciliations of the opening and closing balances are provided in Note 26.
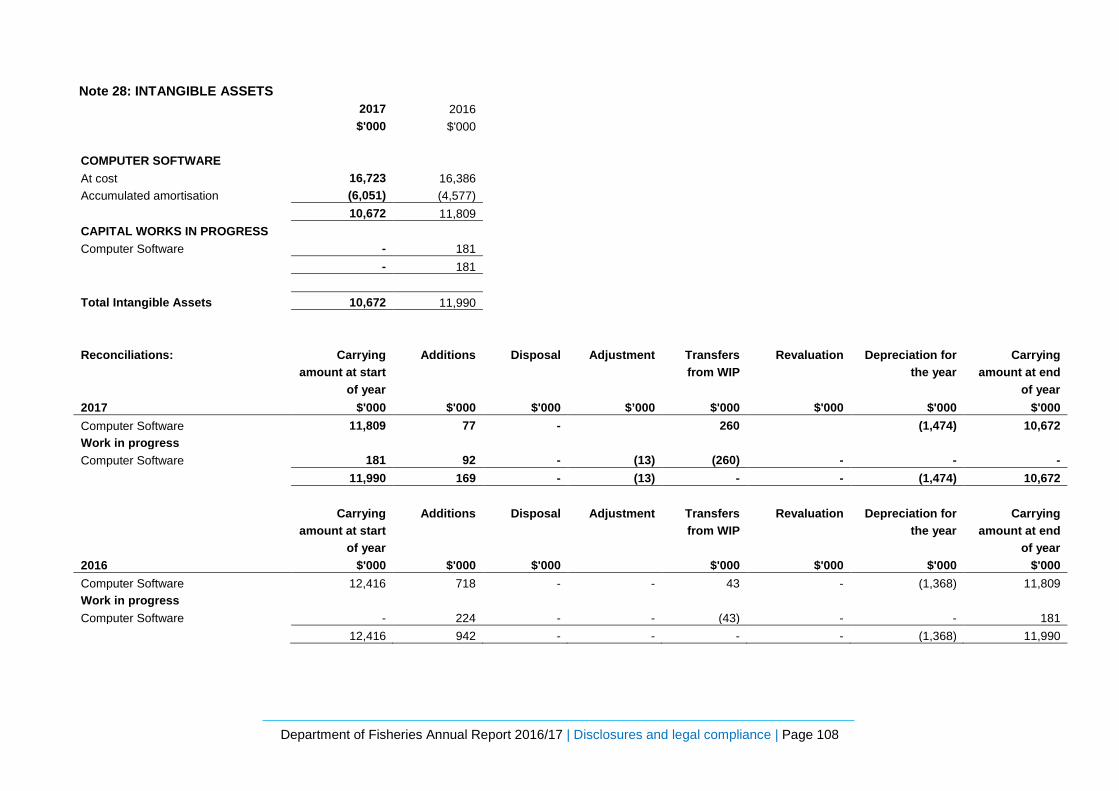
Department of Fisheries Annual Report 2016/17 | Disclosures and legal compliance | Page 108
Note 28: INTANGIBLE ASSETS 2017 2016 $'000 $'000 COMPUTER SOFTWARE At cost 16,723 16,386 Accumulated amortisation (6,051) (4,577) 10,672 11,809 CAPITAL WORKS IN PROGRESS Computer Software - 181 - 181 Total Intangible Assets 10,672 11,990 Reconciliations: Carrying
amount at start of year
Additions Disposal Adjustment Transfers from WIP
Revaluation Depreciation for the year
Carrying amount at end
of year 2017 $'000 $'000 $'000 $’000 $'000 $'000 $'000 $'000 Computer Software 11,809 77 - 260 (1,474) 10,672 Work in progress Computer Software 181 92 - (13) (260) - - - 11,990 169 - (13) - - (1,474) 10,672 Carrying
amount at start of year
Additions Disposal Adjustment Transfers from WIP
Revaluation Depreciation for the year
Carrying amount at end
of year 2016 $'000 $'000 $'000 $'000 $'000 $'000 $'000 Computer Software 12,416 718 - - 43 - (1,368) 11,809 Work in progress Computer Software - 224 - - (43) - - 181 12,416 942 - - - - (1,368) 11,990
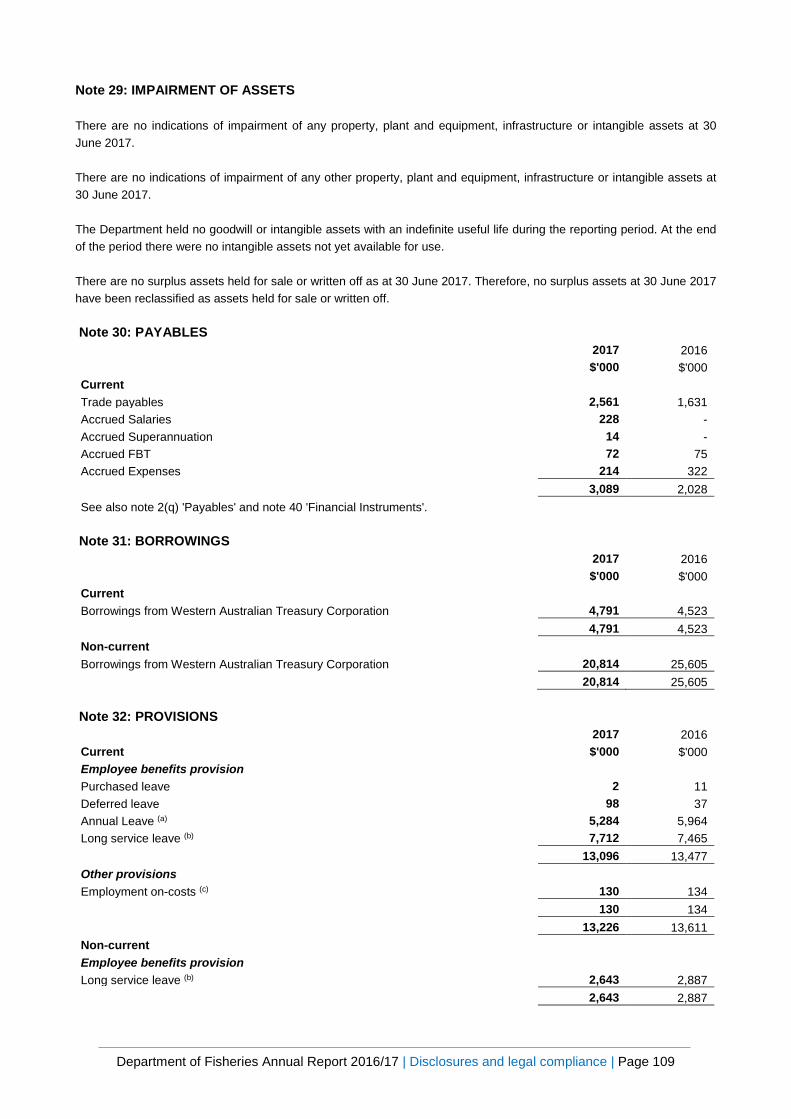
Department of Fisheries Annual Report 2016/17 | Disclosures and legal compliance | Page 109
Note 29: IMPAIRMENT OF ASSETS
There are no indications of impairment of any property, plant and equipment, infrastructure or intangible assets at 30 June 2017. There are no indications of impairment of any other property, plant and equipment, infrastructure or intangible assets at 30 June 2017. The Department held no goodwill or intangible assets with an indefinite useful life during the reporting period. At the end of the period there were no intangible assets not yet available for use. There are no surplus assets held for sale or written off as at 30 June 2017. Therefore, no surplus assets at 30 June 2017 have been reclassified as assets held for sale or written off. Note 30: PAYABLES 2017 2016 $'000 $'000 Current Trade payables 2,561 1,631 Accrued Salaries 228 - Accrued Superannuation 14 - Accrued FBT 72 75 Accrued Expenses 214 322 3,089 2,028 See also note 2(q) 'Payables' and note 40 'Financial Instruments'.
Note 31: BORROWINGS 2017 2016 $'000 $'000 Current Borrowings from Western Australian Treasury Corporation 4,791 4,523 4,791 4,523 Non-current Borrowings from Western Australian Treasury Corporation 20,814 25,605 20,814 25,605
Note 32: PROVISIONS 2017 2016 Current $'000 $'000 Employee benefits provision Purchased leave 2 11 Deferred leave 98 37 Annual Leave (a) 5,284 5,964 Long service leave (b) 7,712 7,465 13,096 13,477 Other provisions Employment on-costs (c) 130 134 130 134 13,226 13,611 Non-current Employee benefits provision Long service leave (b) 2,643 2,887 2,643 2,887
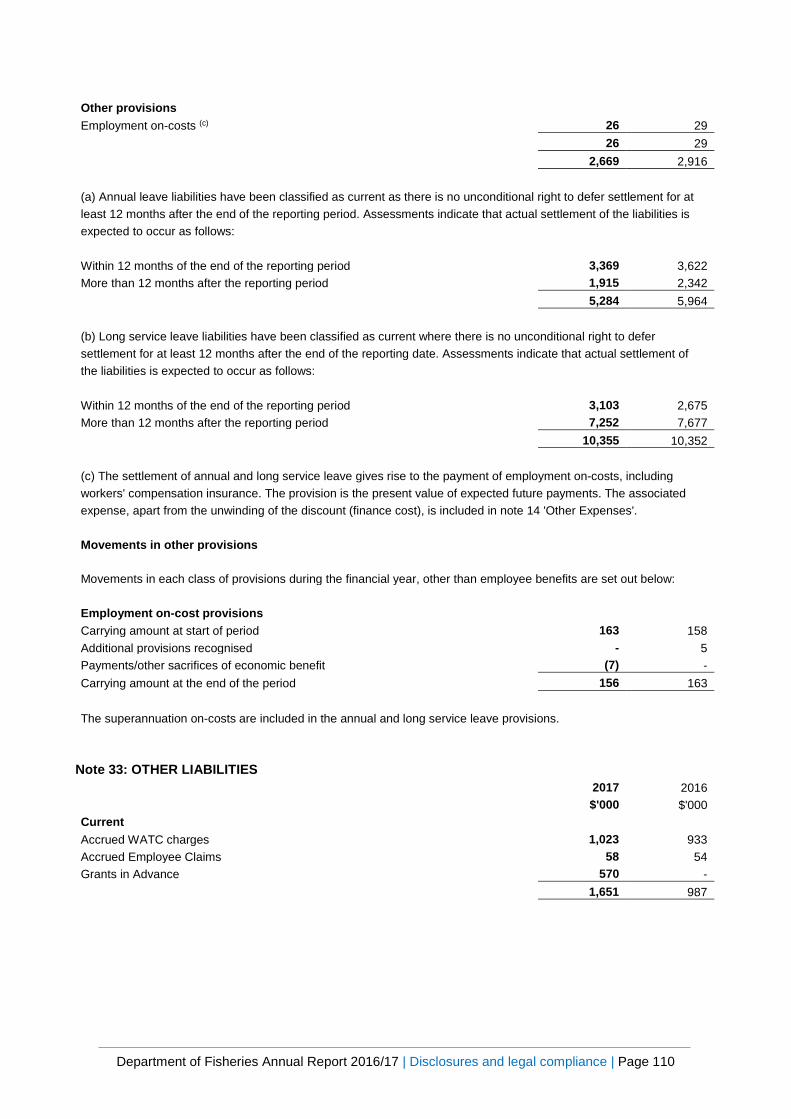
Department of Fisheries Annual Report 2016/17 | Disclosures and legal compliance | Page 110
Other provisions Employment on-costs (c) 26 29 26 29 2,669 2,916 (a) Annual leave liabilities have been classified as current as there is no unconditional right to defer settlement for at least 12 months after the end of the reporting period. Assessments indicate that actual settlement of the liabilities is expected to occur as follows: Within 12 months of the end of the reporting period 3,369 3,622 More than 12 months after the reporting period 1,915 2,342 5,284 5,964 (b) Long service leave liabilities have been classified as current where there is no unconditional right to defer settlement for at least 12 months after the end of the reporting date. Assessments indicate that actual settlement of the liabilities is expected to occur as follows: Within 12 months of the end of the reporting period 3,103 2,675 More than 12 months after the reporting period 7,252 7,677 10,355 10,352 (c) The settlement of annual and long service leave gives rise to the payment of employment on-costs, including workers' compensation insurance. The provision is the present value of expected future payments. The associated expense, apart from the unwinding of the discount (finance cost), is included in note 14 'Other Expenses'. Movements in other provisions
Movements in each class of provisions during the financial year, other than employee benefits are set out below: Employment on-cost provisions Carrying amount at start of period 163 158 Additional provisions recognised - 5 Payments/other sacrifices of economic benefit (7) - Carrying amount at the end of the period 156 163 The superannuation on-costs are included in the annual and long service leave provisions.
Note 33: OTHER LIABILITIES 2017 2016 $'000 $'000 Current Accrued WATC charges 1,023 933 Accrued Employee Claims 58 54 Grants in Advance 570 - 1,651 987
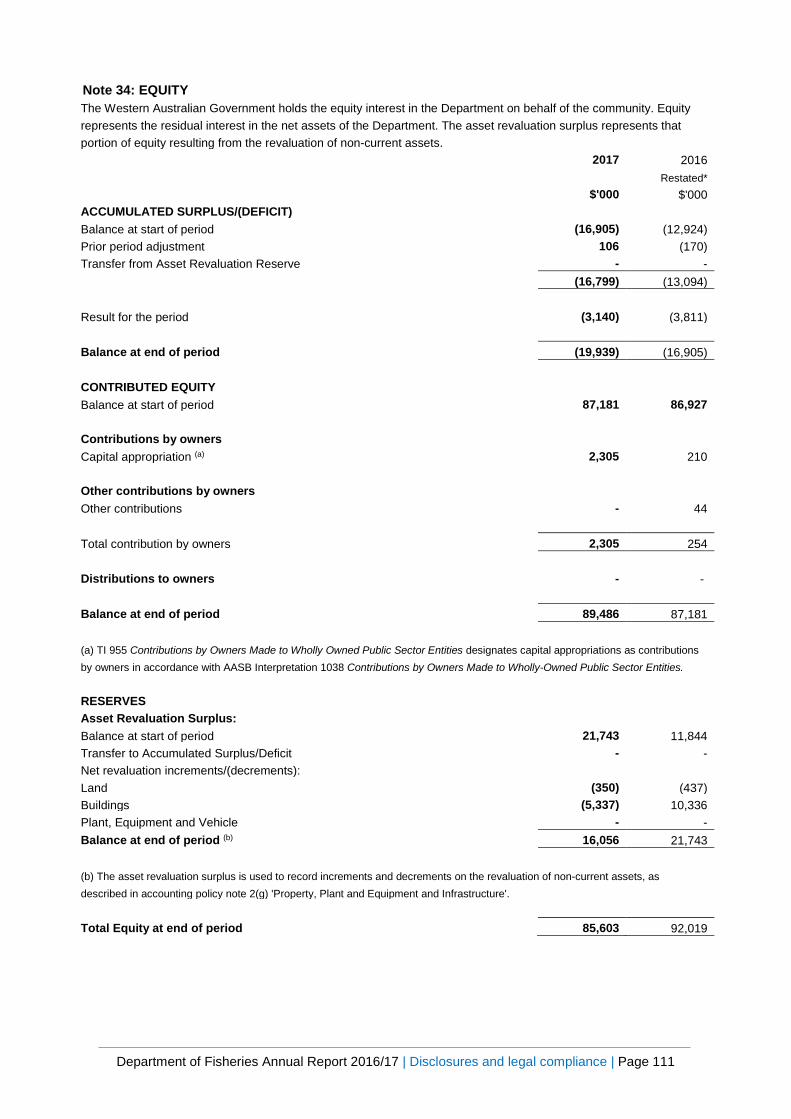
Department of Fisheries Annual Report 2016/17 | Disclosures and legal compliance | Page 111
Note 34: EQUITY The Western Australian Government holds the equity interest in the Department on behalf of the community. Equity represents the residual interest in the net assets of the Department. The asset revaluation surplus represents that portion of equity resulting from the revaluation of non-current assets. 2017 2016 Restated* $'000 $'000 ACCUMULATED SURPLUS/(DEFICIT) Balance at start of period (16,905) (12,924) Prior period adjustment 106 (170) Transfer from Asset Revaluation Reserve - - (16,799) (13,094) Result for the period (3,140) (3,811) Balance at end of period (19,939) (16,905) CONTRIBUTED EQUITY Balance at start of period 87,181 86,927 Contributions by owners Capital appropriation (a) 2,305 210 Other contributions by owners Other contributions - 44 Total contribution by owners 2,305 254 Distributions to owners - - Balance at end of period 89,486 87,181 (a) TI 955 Contributions by Owners Made to Wholly Owned Public Sector Entities designates capital appropriations as contributions by owners in accordance with AASB Interpretation 1038 Contributions by Owners Made to Wholly-Owned Public Sector Entities. RESERVES Asset Revaluation Surplus: Balance at start of period 21,743 11,844 Transfer to Accumulated Surplus/Deficit - - Net revaluation increments/(decrements): Land (350) (437) Buildings (5,337) 10,336 Plant, Equipment and Vehicle - - Balance at end of period (b) 16,056 21,743 (b) The asset revaluation surplus is used to record increments and decrements on the revaluation of non-current assets, as described in accounting policy note 2(g) 'Property, Plant and Equipment and Infrastructure'. Total Equity at end of period 85,603 92,019
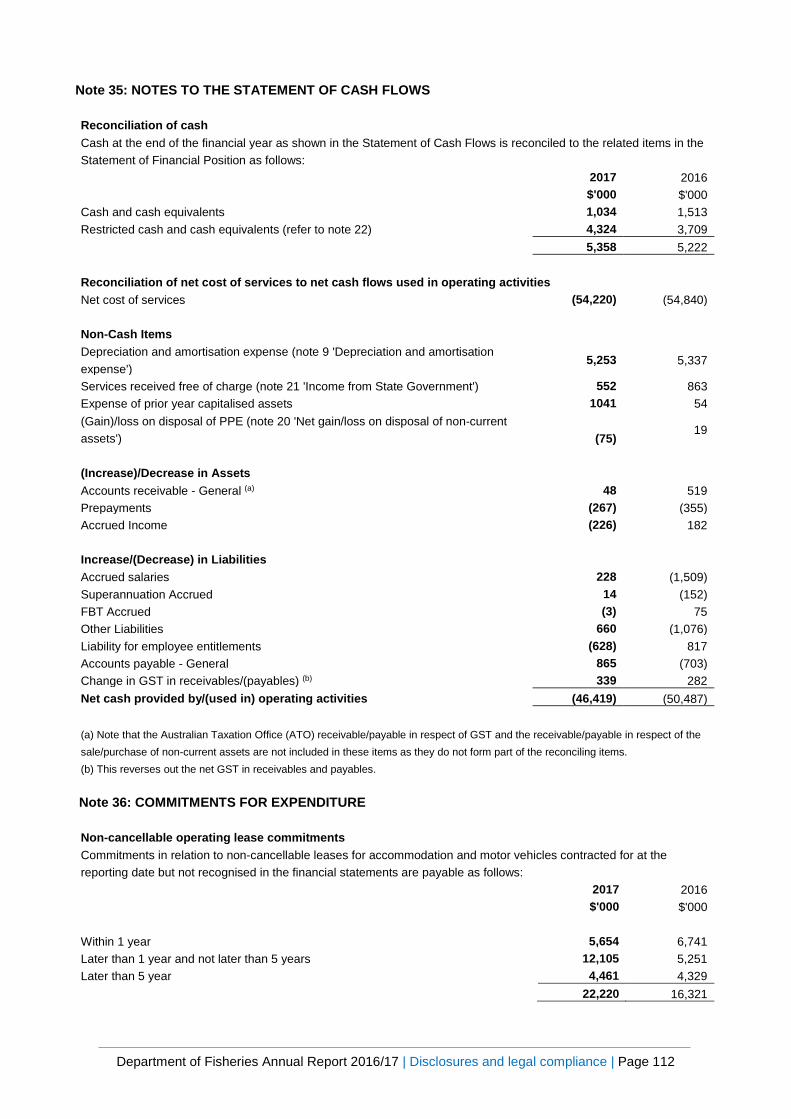
Department of Fisheries Annual Report 2016/17 | Disclosures and legal compliance | Page 112
Note 35: NOTES TO THE STATEMENT OF CASH FLOWS
Reconciliation of cash Cash at the end of the financial year as shown in the Statement of Cash Flows is reconciled to the related items in the Statement of Financial Position as follows: 2017 2016 $'000 $'000 Cash and cash equivalents 1,034 1,513 Restricted cash and cash equivalents (refer to note 22) 4,324 3,709 5,358 5,222 Reconciliation of net cost of services to net cash flows used in operating activities Net cost of services (54,220) (54,840) Non-Cash Items Depreciation and amortisation expense (note 9 'Depreciation and amortisation expense')
5,253 5,337
Services received free of charge (note 21 'Income from State Government') 552 863 Expense of prior year capitalised assets 1041 54 (Gain)/loss on disposal of PPE (note 20 'Net gain/loss on disposal of non-current assets') (75)
19
(Increase)/Decrease in Assets Accounts receivable - General (a) 48 519 Prepayments (267) (355) Accrued Income (226) 182 Increase/(Decrease) in Liabilities Accrued salaries 228 (1,509) Superannuation Accrued 14 (152) FBT Accrued (3) 75 Other Liabilities 660 (1,076) Liability for employee entitlements (628) 817 Accounts payable - General 865 (703) Change in GST in receivables/(payables) (b) 339 282 Net cash provided by/(used in) operating activities (46,419) (50,487) (a) Note that the Australian Taxation Office (ATO) receivable/payable in respect of GST and the receivable/payable in respect of the sale/purchase of non-current assets are not included in these items as they do not form part of the reconciling items. (b) This reverses out the net GST in receivables and payables.
Note 36: COMMITMENTS FOR EXPENDITURE Non-cancellable operating lease commitments Commitments in relation to non-cancellable leases for accommodation and motor vehicles contracted for at the reporting date but not recognised in the financial statements are payable as follows: 2017 2016 $'000 $'000 Within 1 year 5,654 6,741 Later than 1 year and not later than 5 years 12,105 5,251 Later than 5 year 4,461 4,329 22,220 16,321

Department of Fisheries Annual Report 2016/17 | Disclosures and legal compliance | Page 113
The Department has entered into a property lease which is a non-cancellable lease with a five year term, with rent payable monthly in advance. Contingent rent provisions within the lease agreement require that the minimum lease payments shall be increased by 4% CPI per annum. The commitments below are inclusive of GST where relevant. Capital Expenditure Commitments Capital expenditure commitments, being contracted capital expenditure additional to the amounts reported in the financial statements, are payable as follows: 2017 2016 Within 1 year
$'000 637
$'000 1,067
Later than 1 year and not later than 5 years 204 531 Later than 5 year - 841 1,598
Note 37: EVENTS AFTER THE BALANCE SHEET DATE As a result of the change in Machinery of Government, the Department will cease to operate on 30 June 2017 and will be amalgamated as part of the Department of Primary Industries and Regional Development from 1 July 2017.
Note 38: CONTINGENT LIABILITIES AND CONTINGENT ASSETS The following contingent liabilities are additional to the liabilities included in the financial statements. Contaminated sites
Under the Contaminated Sites Act 2003, the Department is required to report known and suspected contaminated sites to the Department of Environment Regulation (DER). In accordance with the Act, DER classifies these sites on the basis of the risk to human health, the environment and environmental values. Where sites are classified as contaminated - remediation required or possibly contaminated - investigation required, the Department may have a liability in respect of investigation or remediation expenses.
The Department has previously reported a suspected contaminated site at the Albany Aquaculture Park to DER. This has been classified by DER as requiring further investigation. The Department is unable to assess the likely outcome of the classification process until the contamination sites auditor completes an assessment, and accordingly, it is not practicable to estimate the potential financial effect or to identify the uncertainties relating to the amount or timing of any outflows. The Department, in consultation with the relevant authorities, is in the process of finalising a re-write of the original (1998) Preliminary Site Investigation report and the Site Management Plan in accordance with the ‘Assessment and management of contaminated sites (Contaminated Sites guidelines) 2014’ under provisions of the Contaminated Sites Act 2003. Negotiations in progress
The Department is negotiating on behalf of the Minister for Fisheries the settlement of amounts of compensation payable under Fishing and Related Industries Compensation (Marine Reserves) Act 1997. The maximum financial effect is $1,975,000.
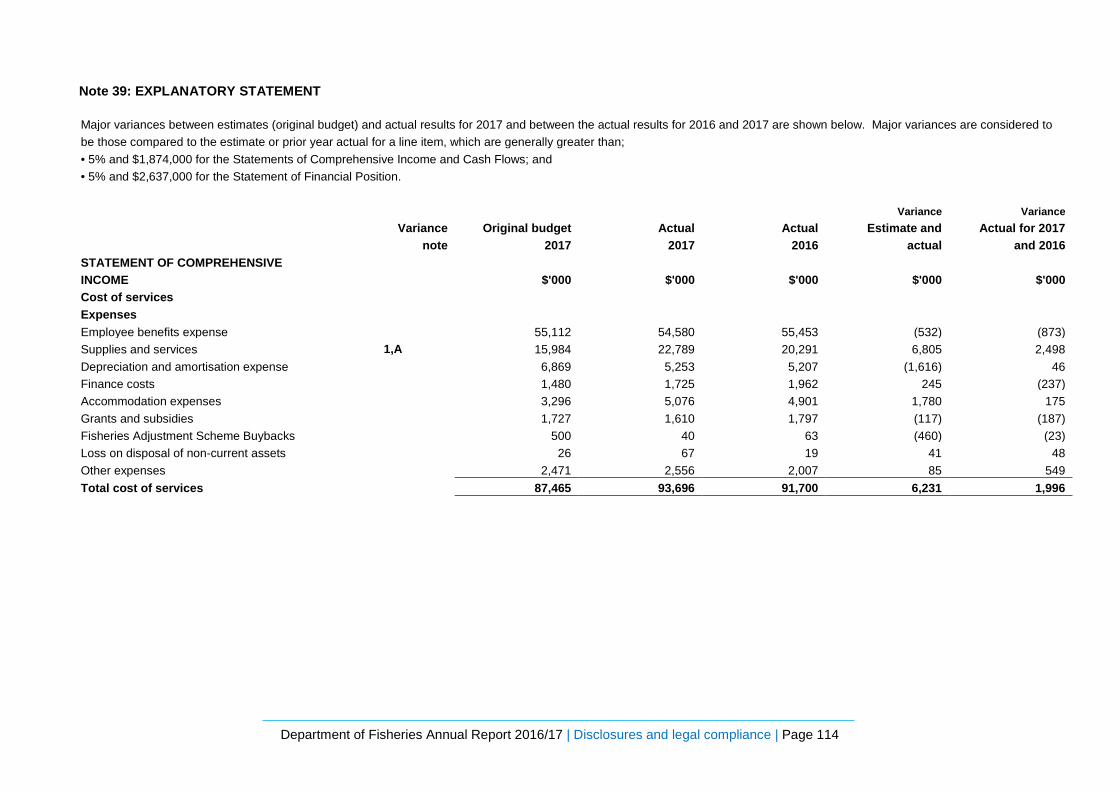
Department of Fisheries Annual Report 2016/17 | Disclosures and legal compliance | Page 114
Note 39: EXPLANATORY STATEMENT
Major variances between estimates (original budget) and actual results for 2017 and between the actual results for 2016 and 2017 are shown below. Major variances are considered to be those compared to the estimate or prior year actual for a line item, which are generally greater than; • 5% and $1,874,000 for the Statements of Comprehensive Income and Cash Flows; and • 5% and $2,637,000 for the Statement of Financial Position. Variance Variance
Variance
note Original budget
2017 Actual
2017 Actual
2016 Estimate and
actual Actual for 2017
and 2016 STATEMENT OF COMPREHENSIVE INCOME $'000 $'000 $'000 $'000 $'000 Cost of services Expenses Employee benefits expense 55,112 54,580 55,453 (532) (873) Supplies and services 1,A 15,984 22,789 20,291 6,805 2,498 Depreciation and amortisation expense 6,869 5,253 5,207 (1,616) 46 Finance costs 1,480 1,725 1,962 245 (237) Accommodation expenses 3,296 5,076 4,901 1,780 175 Grants and subsidies 1,727 1,610 1,797 (117) (187) Fisheries Adjustment Scheme Buybacks 500 40 63 (460) (23) Loss on disposal of non-current assets 26 67 19 41 48 Other expenses 2,471 2,556 2,007 85 549 Total cost of services 87,465 93,696 91,700 6,231 1,996
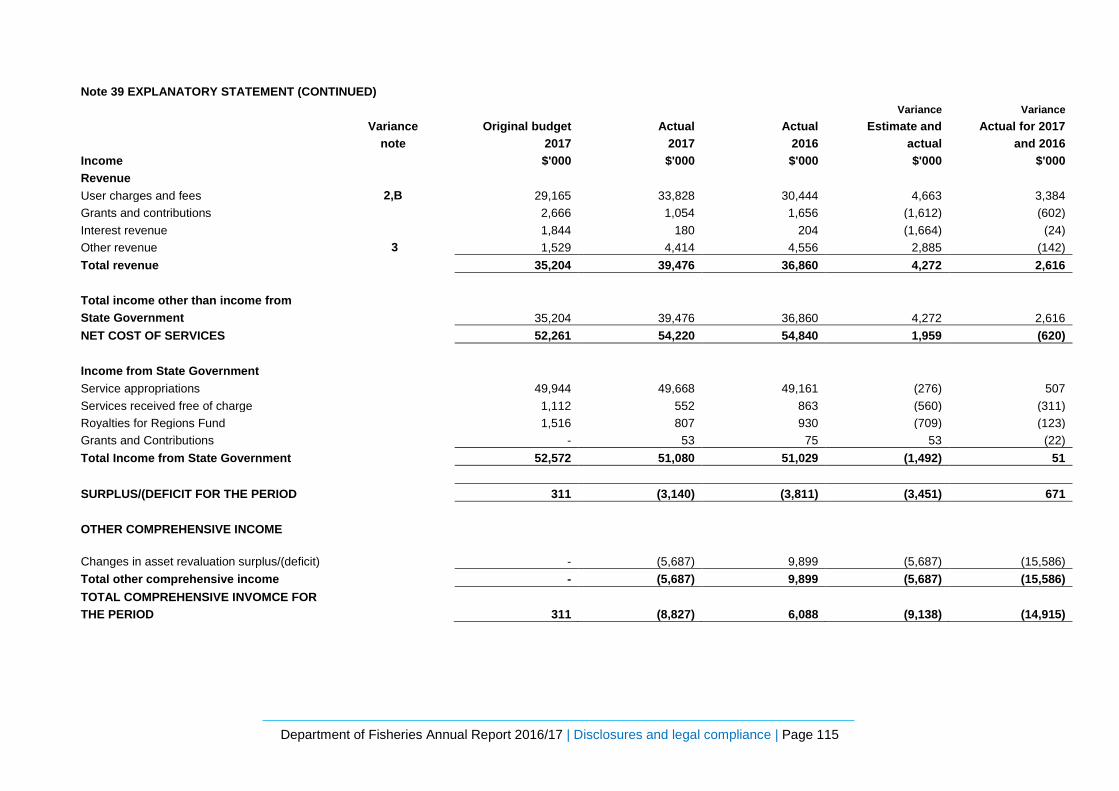
Department of Fisheries Annual Report 2016/17 | Disclosures and legal compliance | Page 115
Note 39 EXPLANATORY STATEMENT (CONTINUED) Variance Variance
Variance
note Original budget
2017 Actual
2017 Actual
2016 Estimate and
actual Actual for 2017
and 2016 Income $'000 $'000 $'000 $'000 $'000 Revenue User charges and fees 2,B 29,165 33,828 30,444 4,663 3,384 Grants and contributions 2,666 1,054 1,656 (1,612) (602) Interest revenue 1,844 180 204 (1,664) (24) Other revenue 3 1,529 4,414 4,556 2,885 (142) Total revenue 35,204 39,476 36,860 4,272 2,616 Total income other than income from State Government 35,204 39,476 36,860 4,272 2,616 NET COST OF SERVICES 52,261 54,220 54,840 1,959 (620) Income from State Government Service appropriations 49,944 49,668 49,161 (276) 507 Services received free of charge 1,112 552 863 (560) (311) Royalties for Regions Fund 1,516 807 930 (709) (123) Grants and Contributions - 53 75 53 (22) Total Income from State Government 52,572 51,080 51,029 (1,492) 51 SURPLUS/(DEFICIT FOR THE PERIOD 311 (3,140) (3,811) (3,451) 671 OTHER COMPREHENSIVE INCOME
Changes in asset revaluation surplus/(deficit) - (5,687) 9,899 (5,687) (15,586) Total other comprehensive income - (5,687) 9,899 (5,687) (15,586) TOTAL COMPREHENSIVE INVOMCE FOR THE PERIOD 311 (8,827) 6,088 (9,138) (14,915)

Department of Fisheries Annual Report 2016/17 | Disclosures and legal compliance | Page 116
Note 39 EXPLANATORY STATEMENT (CONTINUED) Variance Variance
Variance
note Original budget
2017 Actual
2017 Actual
2016 Estimate and
actual Actual for 2017
and 2016 STATEMENT OF FINANCIAL POSITION $'000 $'000 $'000 $'000 $'000 ASSETS Current assets Cash and cash equivalents 2,415 1,034 1,513 (1,381) (479) Restricted cash and cash equivalents 3,379 4,160 3,709 781 451 Receivables 4 2,683 6,637 6,191 3,954 446 Amounts receivable for services 2,637 1,766 1,778 (871) (12) Other current assets 4,799 4,609 4,342 (190) 267 Total Current Assets 15,913 18,206 17,533 2,293 673 Non-Current Assets Restricted cash and cash equivalents
227 164 - (63) 164
Receivables C 19,943 20,814 25,605 871 (4,791) Amounts receivable for services D 20,802 19,428 16,561 (1,374) 2,867 Property, plant and equipment 5,E 67,239 62,559 70,000 (4,680) (7,441) Intangible assets
9,512 10,672 11,990 1,160 (1,318)
Total Non-Current Assets
117,723 113,637 124,156 (4,086) (10,519)
TOTAL ASSETS
133,636 131,843 141,689 (1,793) (9,846)

Department of Fisheries Annual Report 2016/17 | Disclosures and legal compliance | Page 117
Note 39 EXPLANATORY STATEMENT (CONTINUED)
Variance
Variance
Variance note
Original budget 2017
Actual 2017
Actual 2016
Estimate and actual
Actual for 2017 and 2016
LIABILITIES
$'000 $'000 $'000 $'000 $'000 Current Liabilities
Payables
3,118 3,089 2,028 (29) 1061 Borrowings
4,748 4,791 4,523 43 268
Provisions 6 9,990 13,226 13,611 3,236 (385) Other current liabilities
2,424 1,651 987 (773) 664
Total Current Liabilities
20,280 22,757 21,149 2,477 1,608
Non-Current Liabilities
Borrowings F 19,896 20,814 25,605 918 (4,791) Provisions
2,337 2,669 2,916 332 (247)
Total Non-Current Liabilities
22,233 23,483 28,521 1,250 (5,038)
TOTAL LIABILITIES
42,513 46,240 49,670 3,727 (3,430)
NET ASSETS
91,123 85,603 92,019 (5,520) (6,416)
EQUITY
Contributed equity
88,507 89,486 87,181 979 2,305
Reserves 7,G 12,428 16,056 21,743 3,628 (5,687) Accumulated surplus/(deficit) (9,812) (19,939) (16,905) (10,127) (3,034) TOTAL EQUITY
91,123 85,603 92,019 (5,520) (6,416)
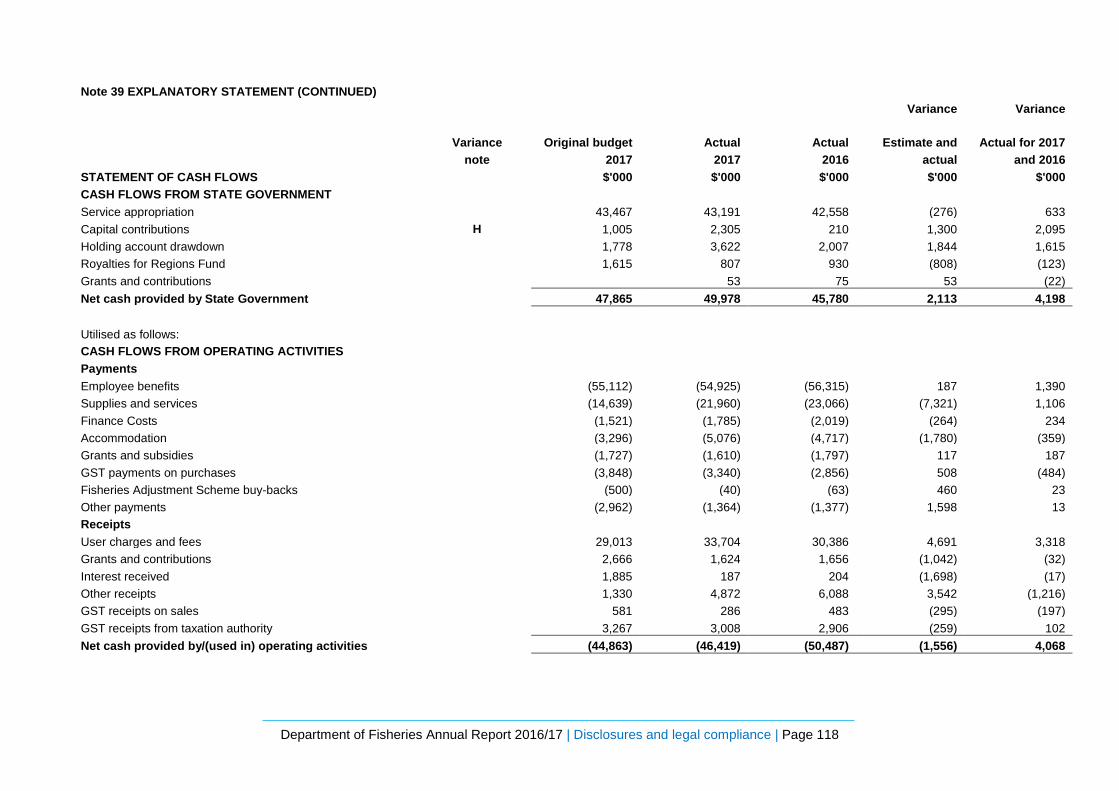
Department of Fisheries Annual Report 2016/17 | Disclosures and legal compliance | Page 118
Note 39 EXPLANATORY STATEMENT (CONTINUED) Variance Variance
Variance
note Original budget
2017 Actual
2017 Actual
2016 Estimate and
actual Actual for 2017
and 2016 STATEMENT OF CASH FLOWS $'000 $'000 $'000 $'000 $'000 CASH FLOWS FROM STATE GOVERNMENT Service appropriation
43,467 43,191 42,558 (276) 633
Capital contributions H 1,005 2,305 210 1,300 2,095 Holding account drawdown 1,778 3,622 2,007 1,844 1,615 Royalties for Regions Fund 1,615 807 930 (808) (123) Grants and contributions
53 75 53 (22)
Net cash provided by State Government 47,865 49,978 45,780 2,113 4,198
Utilised as follows:
CASH FLOWS FROM OPERATING ACTIVITIES
Payments
Employee benefits (55,112) (54,925) (56,315) 187 1,390 Supplies and services
(14,639) (21,960) (23,066) (7,321) 1,106
Finance Costs (1,521) (1,785) (2,019) (264) 234 Accommodation (3,296) (5,076) (4,717) (1,780) (359) Grants and subsidies (1,727) (1,610) (1,797) 117 187 GST payments on purchases (3,848) (3,340) (2,856) 508 (484) Fisheries Adjustment Scheme buy-backs (500) (40) (63) 460 23 Other payments (2,962) (1,364) (1,377) 1,598 13 Receipts
User charges and fees
29,013 33,704 30,386 4,691 3,318 Grants and contributions 2,666 1,624 1,656 (1,042) (32) Interest received 1,885 187 204 (1,698) (17) Other receipts
1,330 4,872 6,088 3,542 (1,216)
GST receipts on sales 581 286 483 (295) (197) GST receipts from taxation authority 3,267 3,008 2,906 (259) 102 Net cash provided by/(used in) operating activities (44,863) (46,419) (50,487) (1,556) 4,068
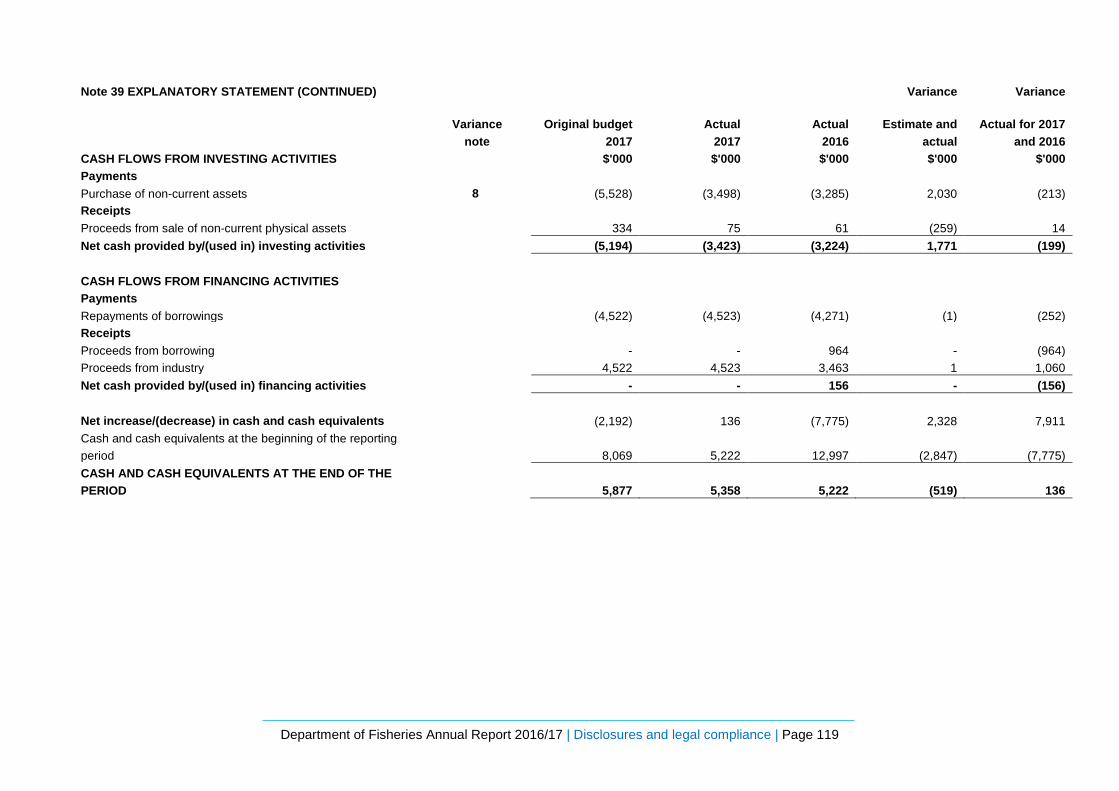
Department of Fisheries Annual Report 2016/17 | Disclosures and legal compliance | Page 119
Note 39 EXPLANATORY STATEMENT (CONTINUED) Variance Variance
Variance
note Original budget
2017 Actual
2017 Actual
2016 Estimate and
actual Actual for 2017
and 2016 CASH FLOWS FROM INVESTING ACTIVITIES $'000 $'000 $'000 $'000 $'000 Payments Purchase of non-current assets 8 (5,528) (3,498) (3,285) 2,030 (213) Receipts
Proceeds from sale of non-current physical assets 334 75 61 (259) 14 Net cash provided by/(used in) investing activities (5,194) (3,423) (3,224) 1,771 (199)
CASH FLOWS FROM FINANCING ACTIVITIES
Payments
Repayments of borrowings (4,522) (4,523) (4,271) (1) (252) Receipts
Proceeds from borrowing - - 964 - (964) Proceeds from industry 4,522 4,523 3,463 1 1,060 Net cash provided by/(used in) financing activities - - 156 - (156) Net increase/(decrease) in cash and cash equivalents (2,192) 136 (7,775) 2,328 7,911 Cash and cash equivalents at the beginning of the reporting period 8,069 5,222 12,997 (2,847) (7,775) CASH AND CASH EQUIVALENTS AT THE END OF THE PERIOD 5,877 5,358 5,222 (519) 136
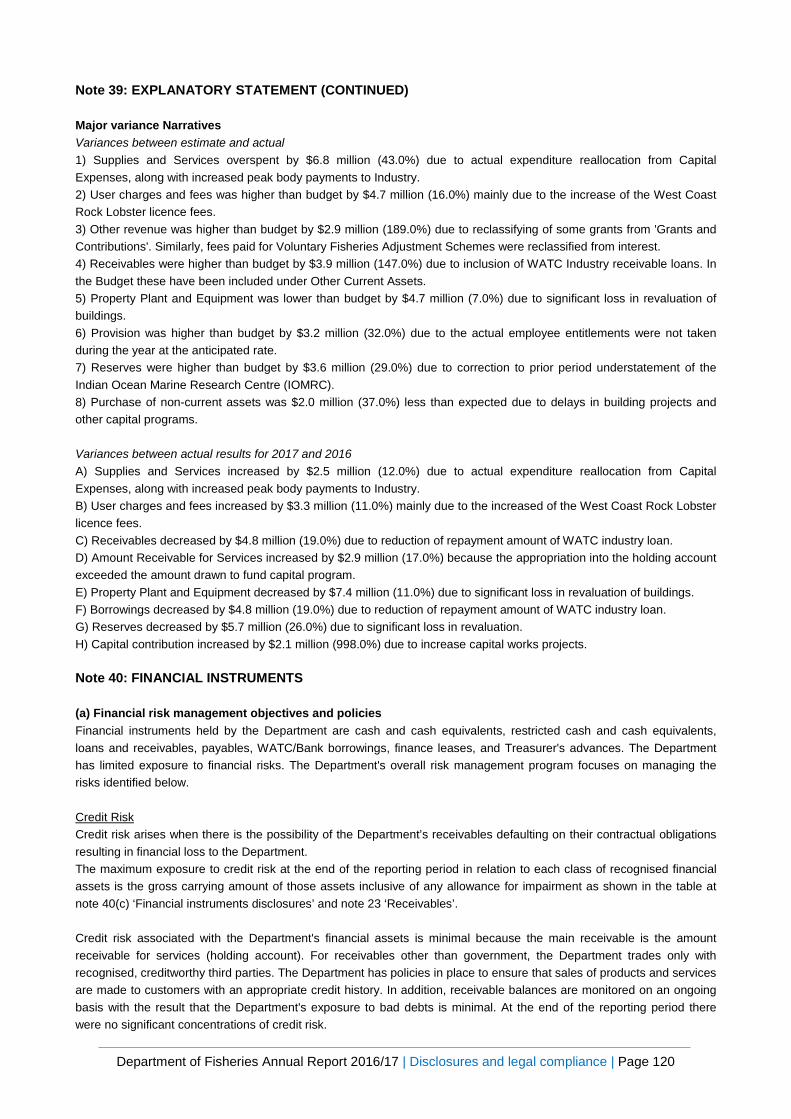
Department of Fisheries Annual Report 2016/17 | Disclosures and legal compliance | Page 120
Note 39: EXPLANATORY STATEMENT (CONTINUED) Major variance Narratives Variances between estimate and actual 1) Supplies and Services overspent by $6.8 million (43.0%) due to actual expenditure reallocation from Capital Expenses, along with increased peak body payments to Industry. 2) User charges and fees was higher than budget by $4.7 million (16.0%) mainly due to the increase of the West Coast Rock Lobster licence fees. 3) Other revenue was higher than budget by $2.9 million (189.0%) due to reclassifying of some grants from 'Grants and Contributions'. Similarly, fees paid for Voluntary Fisheries Adjustment Schemes were reclassified from interest. 4) Receivables were higher than budget by $3.9 million (147.0%) due to inclusion of WATC Industry receivable loans. In the Budget these have been included under Other Current Assets. 5) Property Plant and Equipment was lower than budget by $4.7 million (7.0%) due to significant loss in revaluation of buildings. 6) Provision was higher than budget by $3.2 million (32.0%) due to the actual employee entitlements were not taken during the year at the anticipated rate. 7) Reserves were higher than budget by $3.6 million (29.0%) due to correction to prior period understatement of the Indian Ocean Marine Research Centre (IOMRC). 8) Purchase of non-current assets was $2.0 million (37.0%) less than expected due to delays in building projects and other capital programs. Variances between actual results for 2017 and 2016 A) Supplies and Services increased by $2.5 million (12.0%) due to actual expenditure reallocation from Capital Expenses, along with increased peak body payments to Industry. B) User charges and fees increased by $3.3 million (11.0%) mainly due to the increased of the West Coast Rock Lobster licence fees. C) Receivables decreased by $4.8 million (19.0%) due to reduction of repayment amount of WATC industry loan. D) Amount Receivable for Services increased by $2.9 million (17.0%) because the appropriation into the holding account exceeded the amount drawn to fund capital program. E) Property Plant and Equipment decreased by $7.4 million (11.0%) due to significant loss in revaluation of buildings. F) Borrowings decreased by $4.8 million (19.0%) due to reduction of repayment amount of WATC industry loan. G) Reserves decreased by $5.7 million (26.0%) due to significant loss in revaluation. H) Capital contribution increased by $2.1 million (998.0%) due to increase capital works projects. Note 40: FINANCIAL INSTRUMENTS
(a) Financial risk management objectives and policies Financial instruments held by the Department are cash and cash equivalents, restricted cash and cash equivalents, loans and receivables, payables, WATC/Bank borrowings, finance leases, and Treasurer's advances. The Department has limited exposure to financial risks. The Department's overall risk management program focuses on managing the risks identified below. Credit Risk Credit risk arises when there is the possibility of the Department’s receivables defaulting on their contractual obligations resulting in financial loss to the Department. The maximum exposure to credit risk at the end of the reporting period in relation to each class of recognised financial assets is the gross carrying amount of those assets inclusive of any allowance for impairment as shown in the table at note 40(c) ‘Financial instruments disclosures’ and note 23 ‘Receivables’. Credit risk associated with the Department's financial assets is minimal because the main receivable is the amount receivable for services (holding account). For receivables other than government, the Department trades only with recognised, creditworthy third parties. The Department has policies in place to ensure that sales of products and services are made to customers with an appropriate credit history. In addition, receivable balances are monitored on an ongoing basis with the result that the Department's exposure to bad debts is minimal. At the end of the reporting period there were no significant concentrations of credit risk.

Department of Fisheries Annual Report 2016/17 | Disclosures and legal compliance | Page 121
Allowance for impairment of financial assets is calculated based on objective evidence such as observable data in client credit ratings. For financial assets that are either past due or impaired, refer to note 40(c) 'Financial instruments disclosures'. Liquidity Risk Liquidity risk arises when the Department is unable to meet its financial obligations as they fall due. The Department is exposed to liquidity risk through its trading in the normal course of business. The Department has appropriate procedures to manage cash flows including drawdown of appropriations by monitoring forecast cash flows to ensure that sufficient funds are available to meet its commitments. Market Risk Market risk is the risk that changes in market prices such as foreign exchange rates and interest rates will affect the Department’s income or the value of its holdings of financial instruments. The Department does not trade in foreign currency and is not materially exposed to other price risks. The Department's exposure to market risk for changes in interest rates relates primarily to the long-term debt obligations. All borrowings are due to the Western Australian Treasury Corporation (WATC) and are repayable at fixed rates with varying maturities. Other than as detailed in the interest rate sensitivity analysis table at note 40(c), the Department is not exposed to interest rate risk because apart from minor amounts of restricted cash, all other cash and cash equivalents and restricted cash are non-interest bearing and have no borrowings other than the Treasurer’s advance (non-interest bearing), WATC borrowings and finance leases (fixed interest rate). (b) Categories of Financial Instruments The carrying amounts of each of the following categories of the financial assets and financial liabilities at the end of the reporting date are as follows. 2017 2016 $'000 $'000 Financial Assets Cash and cash equivalents 1,034 1,513 Restricted cash and cash equivalents 4,324 3,709 Loans and receivables (a) 47,264 49,827 Financial Liabilities Financial liabilities measured at amortised cost 28,694 34,019 (a) The amount of loans and receivables excludes GST recoverable from the ATO (statutory receivable).
(c) Financial Instrument Disclosures The following table details the Department’s maximum exposure to credit risk and the ageing analysis of financial assets. The Department’s maximum exposure to credit risk at the end of the reporting period is the carrying amount of financial assets as shown below. The table discloses the ageing of financial assets that are past due but not impaired and impaired financial assets. The table is based on information provided to senior management of the Department.
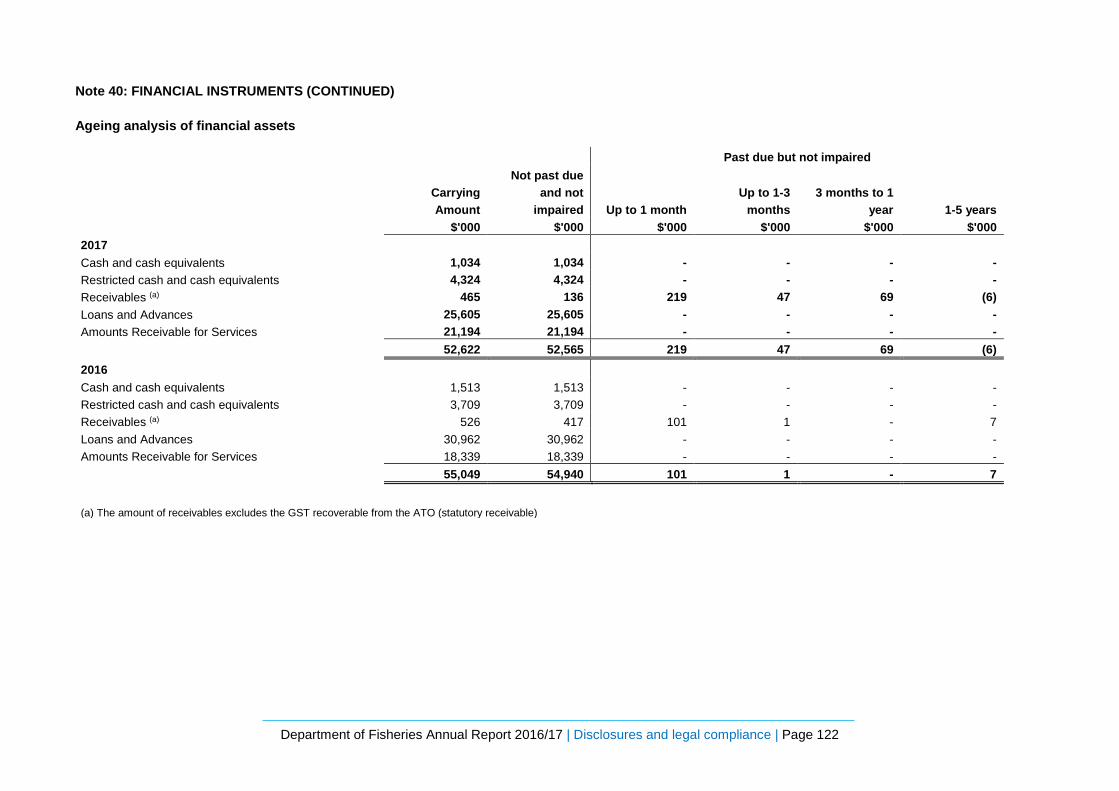
Department of Fisheries Annual Report 2016/17 | Disclosures and legal compliance | Page 122
Note 40: FINANCIAL INSTRUMENTS (CONTINUED)
Ageing analysis of financial assets Past due but not impaired
Carrying Amount
Not past due and not
impaired Up to 1 month Up to 1-3
months 3 months to 1
year 1-5 years $'000 $'000 $'000 $'000 $'000 $'000 2017 Cash and cash equivalents 1,034 1,034 - - - - Restricted cash and cash equivalents 4,324 4,324 - - - - Receivables (a) 465 136 219 47 69 (6) Loans and Advances 25,605 25,605 - - - - Amounts Receivable for Services 21,194 21,194 - - - - 52,622 52,565 219 47 69 (6) 2016 Cash and cash equivalents 1,513 1,513 - - - - Restricted cash and cash equivalents 3,709 3,709 - - - - Receivables (a) 526 417 101 1 - 7 Loans and Advances 30,962 30,962 - - - - Amounts Receivable for Services 18,339 18,339 - - - - 55,049 54,940 101 1 - 7 (a) The amount of receivables excludes the GST recoverable from the ATO (statutory receivable)
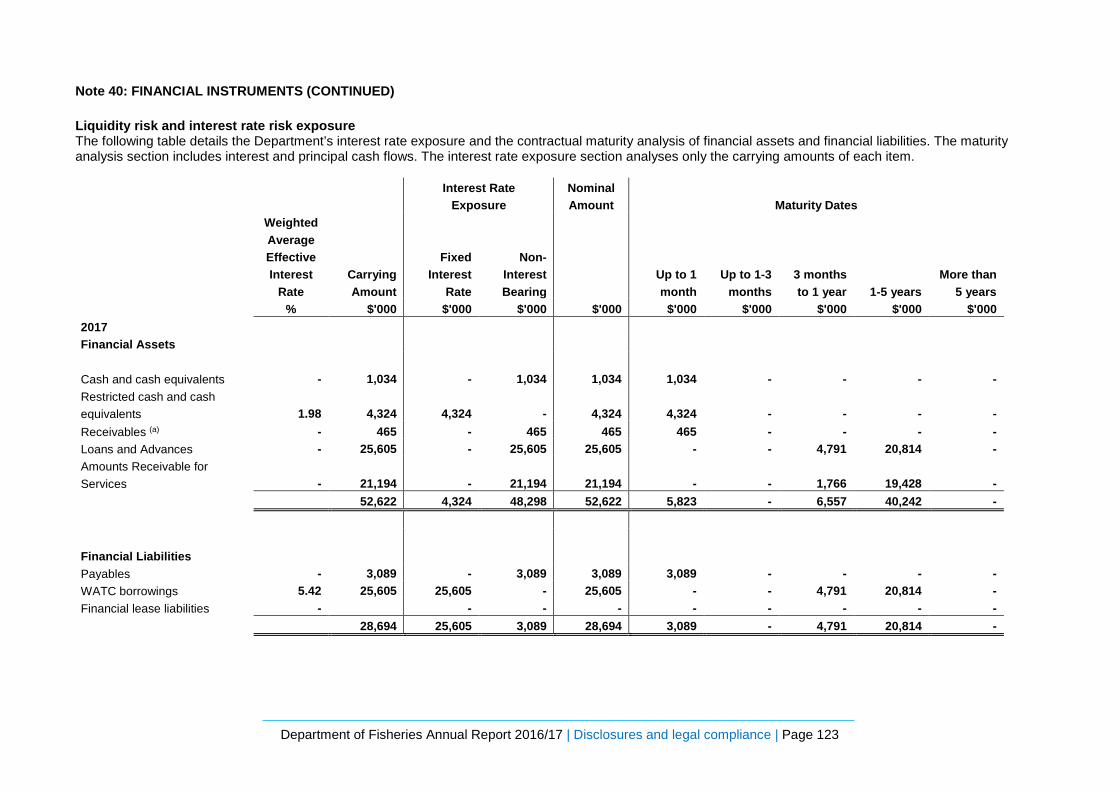
Department of Fisheries Annual Report 2016/17 | Disclosures and legal compliance | Page 123
Note 40: FINANCIAL INSTRUMENTS (CONTINUED) Liquidity risk and interest rate risk exposure The following table details the Department’s interest rate exposure and the contractual maturity analysis of financial assets and financial liabilities. The maturity analysis section includes interest and principal cash flows. The interest rate exposure section analyses only the carrying amounts of each item.
Interest Rate
Exposure Nominal Amount Maturity Dates
Weighted Average Effective Interest
Rate Carrying Amount
Fixed Interest
Rate
Non- Interest Bearing
Up to 1 month
Up to 1-3 months
3 months to 1 year 1-5 years
More than 5 years
% $'000 $'000 $'000 $'000 $'000 $'000 $'000 $'000 $'000 2017 Financial Assets
Cash and cash equivalents - 1,034 - 1,034 1,034 1,034 - - - - Restricted cash and cash equivalents 1.98 4,324 4,324 - 4,324 4,324 - - - - Receivables (a) - 465 - 465 465 465 - - - - Loans and Advances - 25,605 - 25,605 25,605 - - 4,791 20,814 - Amounts Receivable for Services - 21,194 - 21,194 21,194 - - 1,766 19,428 - 52,622 4,324 48,298 52,622 5,823 - 6,557 40,242 - Financial Liabilities Payables - 3,089 - 3,089 3,089 3,089 - - - - WATC borrowings 5.42 25,605 25,605 - 25,605 - - 4,791 20,814 - Financial lease liabilities - - - - - - - - - 28,694 25,605 3,089 28,694 3,089 - 4,791 20,814 -

Department of Fisheries Annual Report 2016/17 | Disclosures and legal compliance | Page 124
Note 40: FINANCIAL INSTRUMENTS (CONTINUED)
Interest Rate
Exposure Nominal Amount Maturity Dates
Weighted Average Effective Interest
Rate Carrying Amount
Fixed Interest
Rate
Non- Interest Bearing
Up to 1 month
Up to 1-3 months
3 months to 1 year 1-5 years
More than 5 years
% $'000 $'000 $'000 $'000 $'000 $'000 $'000 $'000 $'000 2016 Financial Assets Cash and cash equivalents - 1,513 - 1,513 1,513 1,513 - - - - Restricted cash and cash equivalents 2.27 3,709 3,709 - 3,709 3,709 - - - - Receivables (a) - 526 - 526 526 526 - - - - Loans and Advances - 30,962 - 30,962 30,962 834 - 4,523 23,655 1,950 Amounts Receivable for Services - 18,339 - 18,339 18,339 - - 2,007 16,332 - 55,049 3,709 51,340 55,049 6,582 - 6,530 39,987 1,950 Financial Liabilities Payables - 2,958 - 2,958 2,958 2,958 - - - - WATC borrowings 5.42 31,061 31,061 - 31,061 933 - 4,523 23,655 1,950 Financial lease liabilities - - - - - - - - - - 34,019 31,061 2,958 34,019 3,891 - 4,523 23,655 1,950 (a) The amount of receivables excludes the GST recoverable from the ATO (statutory receivable)
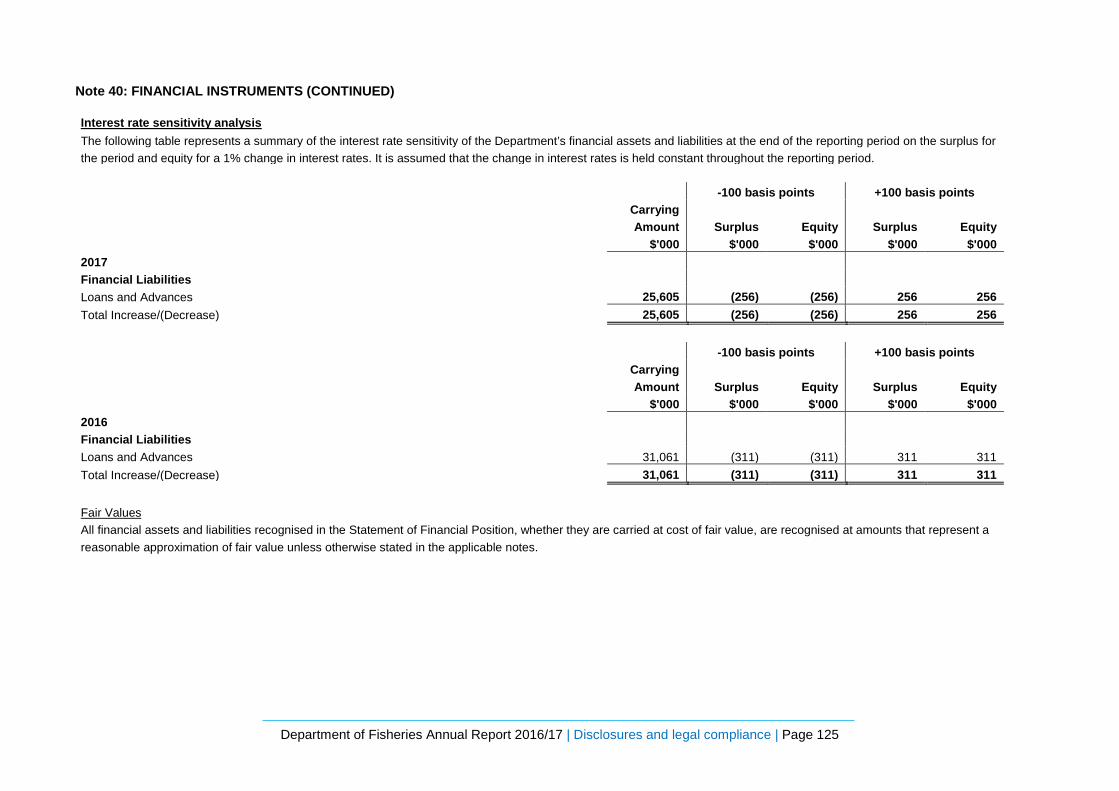
Department of Fisheries Annual Report 2016/17 | Disclosures and legal compliance | Page 125
Note 40: FINANCIAL INSTRUMENTS (CONTINUED) Interest rate sensitivity analysis The following table represents a summary of the interest rate sensitivity of the Department’s financial assets and liabilities at the end of the reporting period on the surplus for the period and equity for a 1% change in interest rates. It is assumed that the change in interest rates is held constant throughout the reporting period.
-100 basis points +100 basis points
Carrying Amount Surplus Equity Surplus Equity
$'000 $'000 $'000 $'000 $'000 2017 Financial Liabilities Loans and Advances 25,605 (256) (256) 256 256 Total Increase/(Decrease) 25,605 (256) (256) 256 256 -100 basis points +100 basis points
Carrying Amount Surplus Equity Surplus Equity
$'000 $'000 $'000 $'000 $'000 2016 Financial Liabilities Loans and Advances 31,061 (311) (311) 311 311 Total Increase/(Decrease) 31,061 (311) (311) 311 311 Fair Values All financial assets and liabilities recognised in the Statement of Financial Position, whether they are carried at cost of fair value, are recognised at amounts that represent a reasonable approximation of fair value unless otherwise stated in the applicable notes.
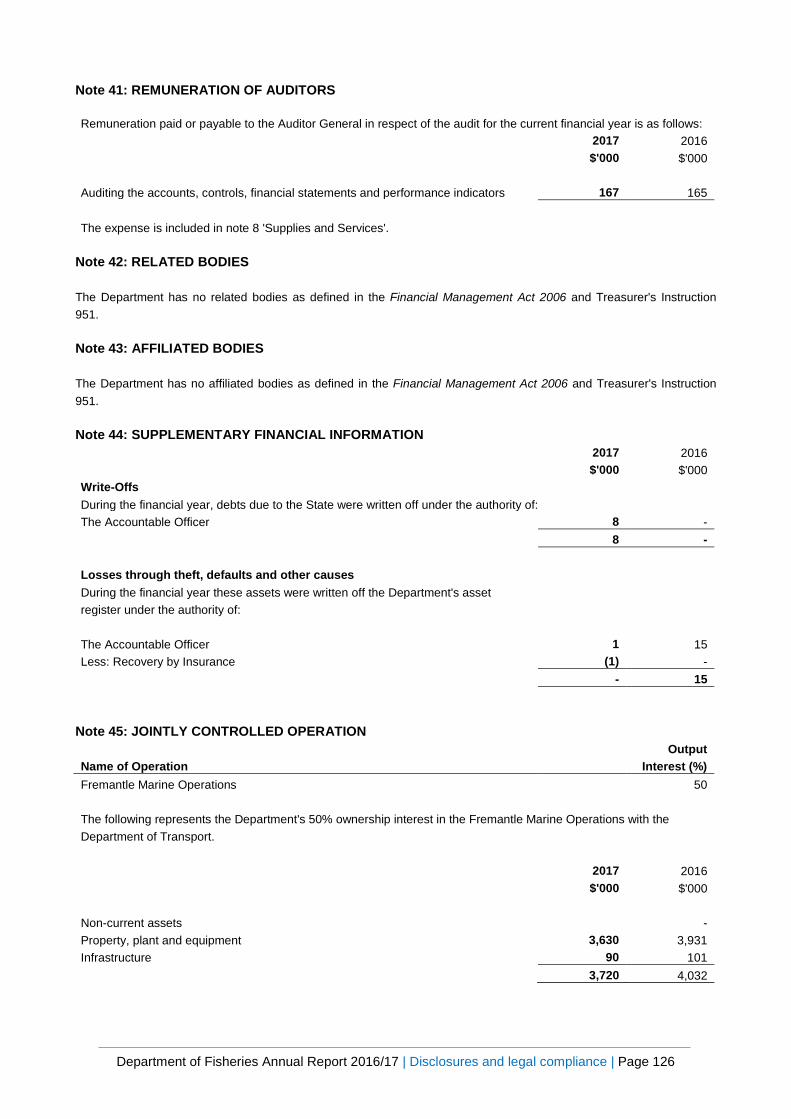
Department of Fisheries Annual Report 2016/17 | Disclosures and legal compliance | Page 126
Note 41: REMUNERATION OF AUDITORS
Remuneration paid or payable to the Auditor General in respect of the audit for the current financial year is as follows: 2017 2016 $'000 $'000 Auditing the accounts, controls, financial statements and performance indicators 167 165 The expense is included in note 8 'Supplies and Services'.
Note 42: RELATED BODIES
The Department has no related bodies as defined in the Financial Management Act 2006 and Treasurer's Instruction 951.
Note 43: AFFILIATED BODIES
The Department has no affiliated bodies as defined in the Financial Management Act 2006 and Treasurer's Instruction 951. Note 44: SUPPLEMENTARY FINANCIAL INFORMATION 2017 2016 $'000 $'000 Write-Offs During the financial year, debts due to the State were written off under the authority of: The Accountable Officer 8 - 8 - Losses through theft, defaults and other causes During the financial year these assets were written off the Department's asset register under the authority of: The Accountable Officer 1 15 Less: Recovery by Insurance (1) - - 15
Note 45: JOINTLY CONTROLLED OPERATION
Name of Operation Output
Interest (%) Fremantle Marine Operations 50 The following represents the Department's 50% ownership interest in the Fremantle Marine Operations with the Department of Transport. 2017 2016 $'000 $'000 Non-current assets - Property, plant and equipment 3,630 3,931 Infrastructure 90 101 3,720 4,032
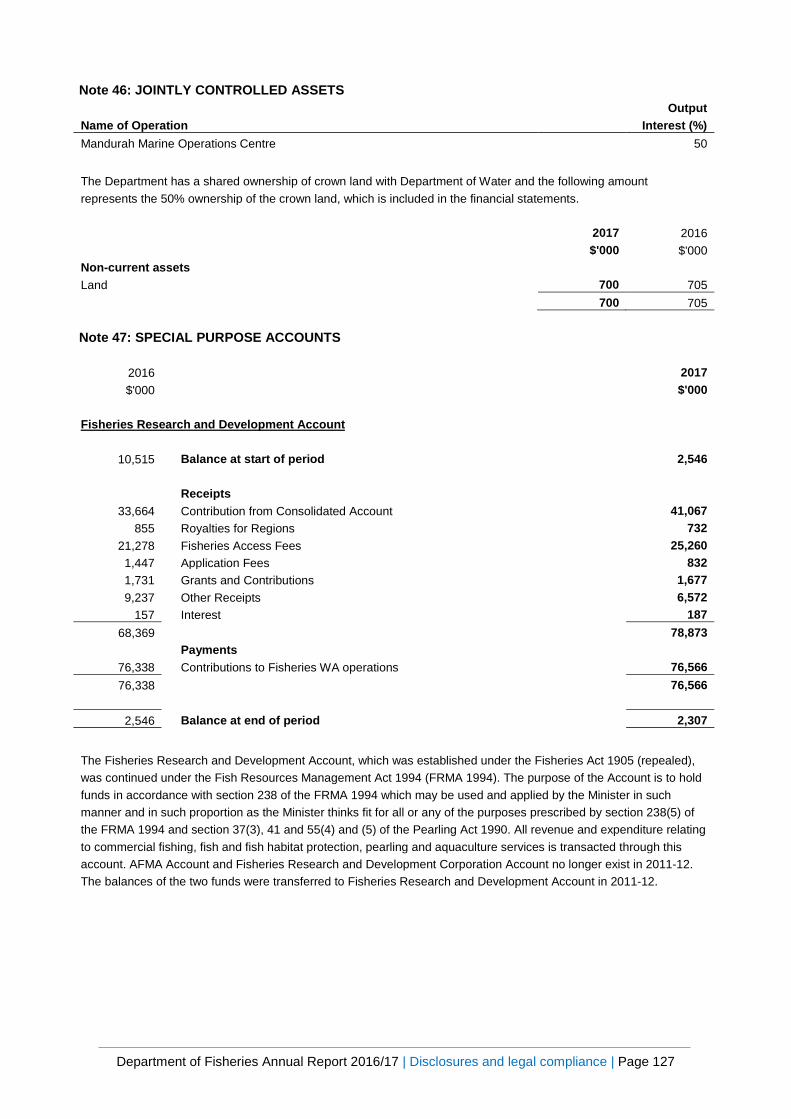
Department of Fisheries Annual Report 2016/17 | Disclosures and legal compliance | Page 127
Note 46: JOINTLY CONTROLLED ASSETS
Name of Operation Output
Interest (%) Mandurah Marine Operations Centre 50
The Department has a shared ownership of crown land with Department of Water and the following amount represents the 50% ownership of the crown land, which is included in the financial statements. 2017 2016 $'000 $'000 Non-current assets Land 700 705 700 705
Note 47: SPECIAL PURPOSE ACCOUNTS
2016 2017 $'000 $'000
Fisheries Research and Development Account
10,515 Balance at start of period 2,546 Receipts
33,664 Contribution from Consolidated Account 41,067 855 Royalties for Regions 732
21,278 Fisheries Access Fees 25,260 1,447 Application Fees 832 1,731 Grants and Contributions 1,677 9,237 Other Receipts 6,572
157 Interest 187 68,369 78,873
Payments 76,338 Contributions to Fisheries WA operations 76,566 76,338 76,566
2,546 Balance at end of period 2,307
The Fisheries Research and Development Account, which was established under the Fisheries Act 1905 (repealed), was continued under the Fish Resources Management Act 1994 (FRMA 1994). The purpose of the Account is to hold funds in accordance with section 238 of the FRMA 1994 which may be used and applied by the Minister in such manner and in such proportion as the Minister thinks fit for all or any of the purposes prescribed by section 238(5) of the FRMA 1994 and section 37(3), 41 and 55(4) and (5) of the Pearling Act 1990. All revenue and expenditure relating to commercial fishing, fish and fish habitat protection, pearling and aquaculture services is transacted through this account. AFMA Account and Fisheries Research and Development Corporation Account no longer exist in 2011-12. The balances of the two funds were transferred to Fisheries Research and Development Account in 2011-12.
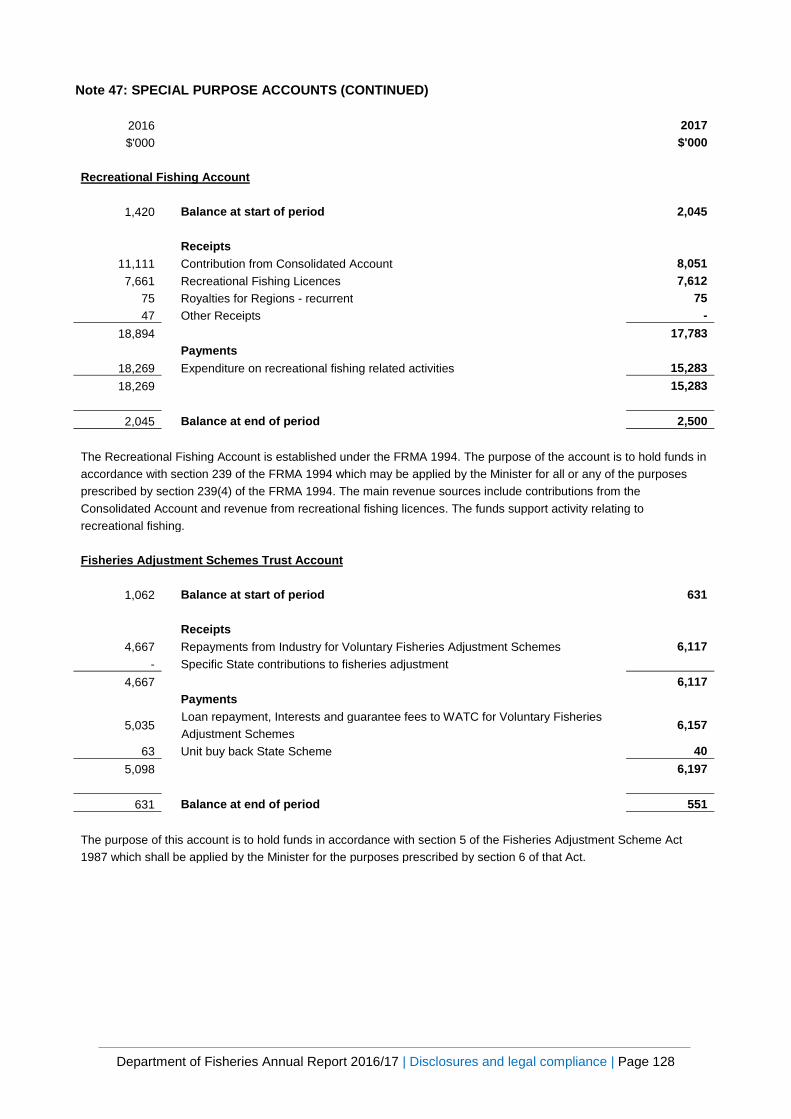
Department of Fisheries Annual Report 2016/17 | Disclosures and legal compliance | Page 128
Note 47: SPECIAL PURPOSE ACCOUNTS (CONTINUED)
2016 2017 $'000 $'000
Recreational Fishing Account
1,420 Balance at start of period 2,045 Receipts
11,111 Contribution from Consolidated Account 8,051 7,661 Recreational Fishing Licences 7,612
75 Royalties for Regions - recurrent 75 47 Other Receipts -
18,894 17,783 Payments
18,269 Expenditure on recreational fishing related activities 15,283 18,269 15,283
2,045 Balance at end of period 2,500
The Recreational Fishing Account is established under the FRMA 1994. The purpose of the account is to hold funds in accordance with section 239 of the FRMA 1994 which may be applied by the Minister for all or any of the purposes prescribed by section 239(4) of the FRMA 1994. The main revenue sources include contributions from the Consolidated Account and revenue from recreational fishing licences. The funds support activity relating to recreational fishing. Fisheries Adjustment Schemes Trust Account
1,062 Balance at start of period 631 Receipts
4,667 Repayments from Industry for Voluntary Fisheries Adjustment Schemes 6,117 - Specific State contributions to fisheries adjustment
4,667 6,117 Payments
5,035 Loan repayment, Interests and guarantee fees to WATC for Voluntary Fisheries Adjustment Schemes
6,157
63 Unit buy back State Scheme 40 5,098 6,197
631 Balance at end of period 551
The purpose of this account is to hold funds in accordance with section 5 of the Fisheries Adjustment Scheme Act 1987 which shall be applied by the Minister for the purposes prescribed by section 6 of that Act.
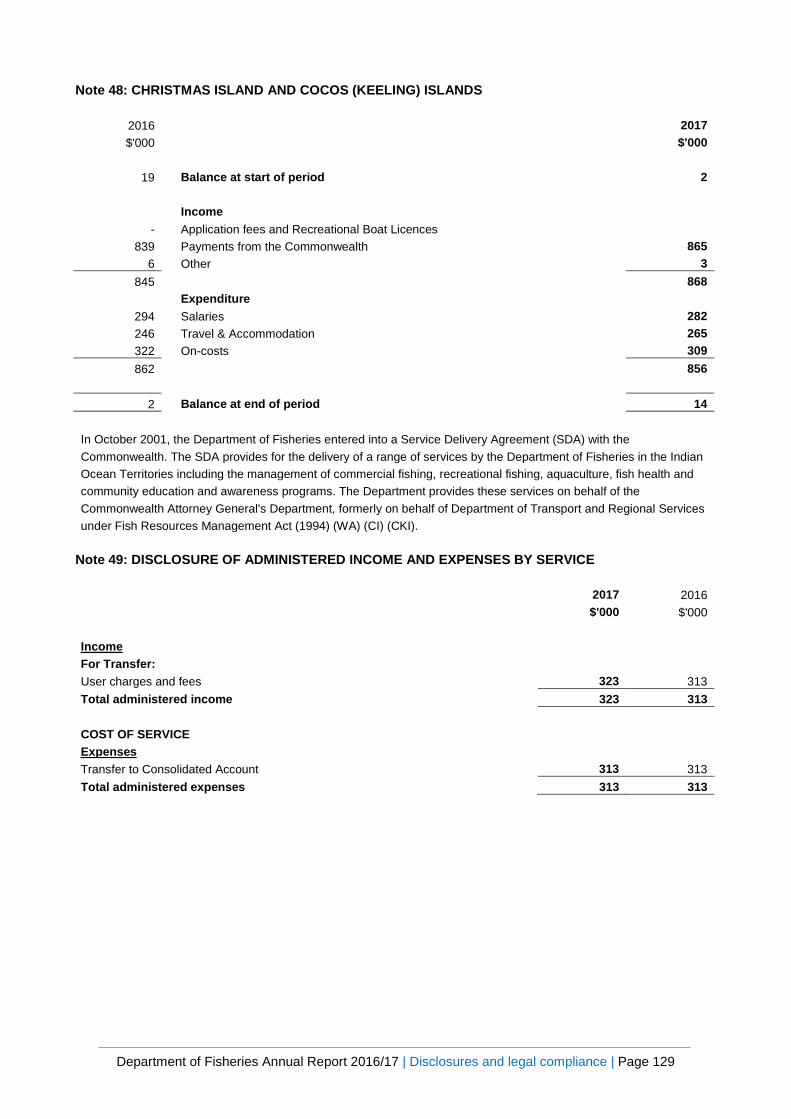
Department of Fisheries Annual Report 2016/17 | Disclosures and legal compliance | Page 129
Note 48: CHRISTMAS ISLAND AND COCOS (KEELING) ISLANDS
2016 2017 $'000 $'000
19 Balance at start of period 2
Income
- Application fees and Recreational Boat Licences 839 Payments from the Commonwealth 865
6 Other 3 845 868
Expenditure 294 Salaries 282 246 Travel & Accommodation 265 322 On-costs 309 862 856
2 Balance at end of period 14
In October 2001, the Department of Fisheries entered into a Service Delivery Agreement (SDA) with the Commonwealth. The SDA provides for the delivery of a range of services by the Department of Fisheries in the Indian Ocean Territories including the management of commercial fishing, recreational fishing, aquaculture, fish health and community education and awareness programs. The Department provides these services on behalf of the Commonwealth Attorney General's Department, formerly on behalf of Department of Transport and Regional Services under Fish Resources Management Act (1994) (WA) (CI) (CKI).
Note 49: DISCLOSURE OF ADMINISTERED INCOME AND EXPENSES BY SERVICE
2017 2016 $'000 $'000 Income For Transfer: User charges and fees 323 313 Total administered income 323 313 COST OF SERVICE Expenses Transfer to Consolidated Account 313 313 Total administered expenses 313 313
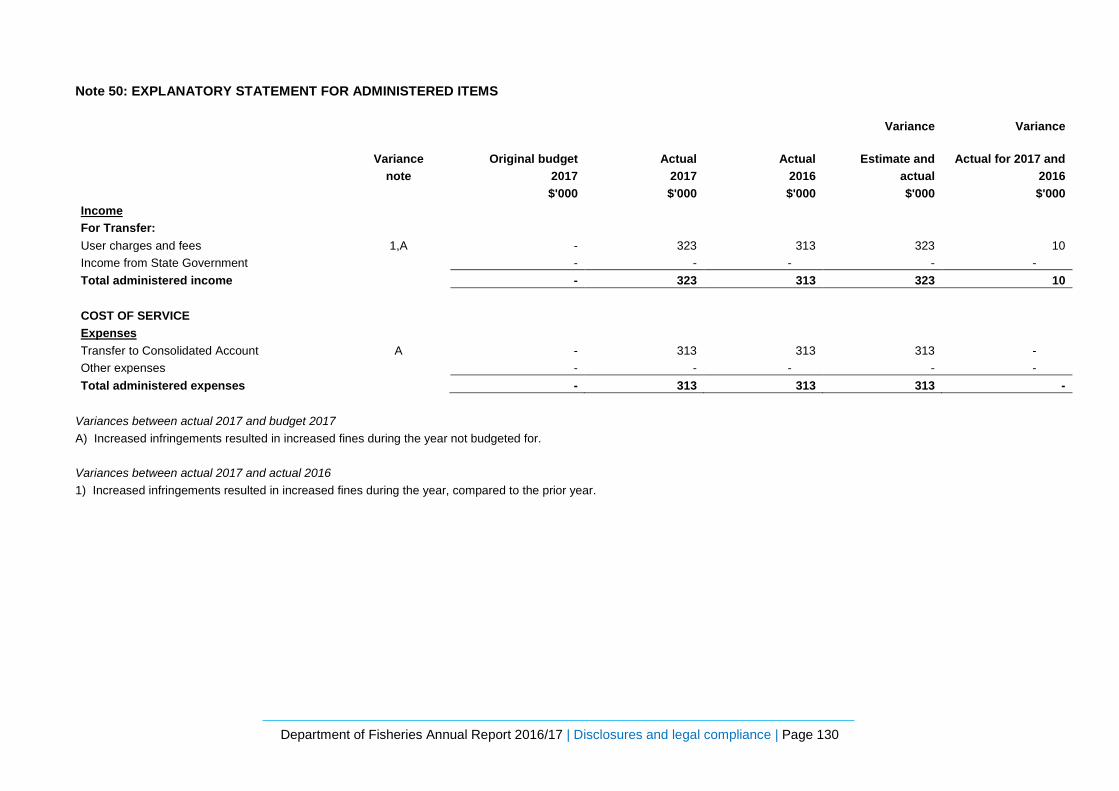
Department of Fisheries Annual Report 2016/17 | Disclosures and legal compliance | Page 130
Note 50: EXPLANATORY STATEMENT FOR ADMINISTERED ITEMS Variance Variance
Variance
note Original budget
2017 Actual
2017 Actual
2016 Estimate and
actual Actual for 2017 and
2016 $'000 $'000 $'000 $'000 $'000 Income For Transfer: User charges and fees 1,A - 323 313 323 10 Income from State Government - - - - - Total administered income - 323 313 323 10 COST OF SERVICE Expenses Transfer to Consolidated Account A - 313 313 313 - Other expenses - - - - - Total administered expenses - 313 313 313 -
Variances between actual 2017 and budget 2017 A) Increased infringements resulted in increased fines during the year not budgeted for. Variances between actual 2017 and actual 2016 1) Increased infringements resulted in increased fines during the year, compared to the prior year.
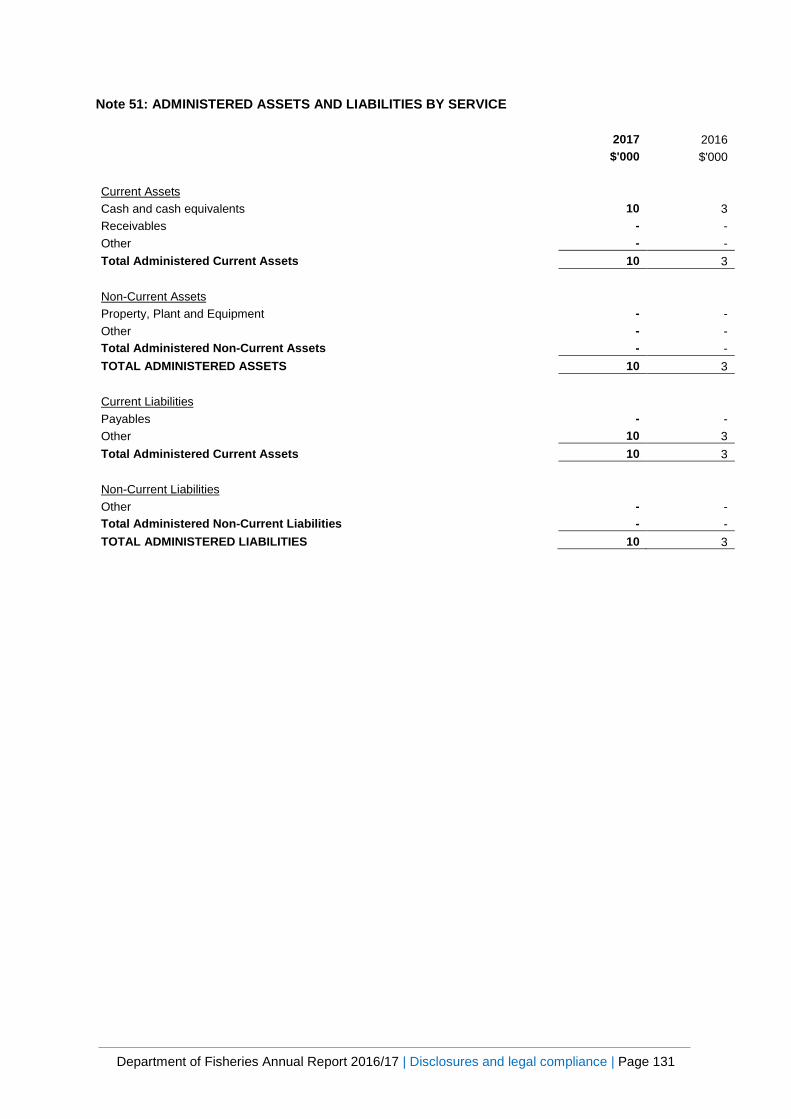
Department of Fisheries Annual Report 2016/17 | Disclosures and legal compliance | Page 131
Note 51: ADMINISTERED ASSETS AND LIABILITIES BY SERVICE
2017 2016 $'000 $'000 Current Assets Cash and cash equivalents 10 3 Receivables - - Other - - Total Administered Current Assets 10 3 Non-Current Assets Property, Plant and Equipment - - Other - - Total Administered Non-Current Assets - - TOTAL ADMINISTERED ASSETS 10 3 Current Liabilities
Payables - - Other 10 3 Total Administered Current Assets 10 3 Non-Current Liabilities Other - - Total Administered Non-Current Liabilities - - TOTAL ADMINISTERED LIABILITIES 10 3
Department of Fisheries Annual Report 2016/17 | Disclosures and legal compliance | Page 132
Key performance indicators 2016/17
Certification of performance indicators for the year ended 30 June 2017 I hereby certify that the performance indicators are based on proper records, are
relevant and appropriate for assisting users to assess the Department of Fisheries
performance, and fairly represent the performance of the Department of Fisheries for
the financial year ended 30 June 2017.
Bruno Mezzatesta Reporting Officer
11 September 2017

Department of Fisheries Annual Report 2016/17 | Disclosures and legal compliance | Page 133
1.1 The proportion of fish stocks identified as not being at risk or vulnerable through exploitation.
Annual stock assessments of the fisheries that are subject to management are
undertaken by the Department’s Science and Resource Assessment Division.
These assessments, together with trends in catch and fishing activity, have been
used to determine the sustainability status of the State’s most significant commercial
and recreational fisheries (full details of which are in the companion Status Reports
on the Western Australia’s Fisheries and Aquatic Resources 2016/17). Performance
is measured as the proportion of fisheries (which have sufficient data) for which the
breeding stocks of each of the major target or indicator species are being maintained
at levels that ensure catches could be sustained at desirable levels given effort
levels and normal environmental conditions; or they are recovering from a depleted
state at an appropriate rate following management intervention. The Department’s
2016/17 Budget Papers state that the target is for the proportion of fish stocks not at
risk from fishing is 97%.
For the 2016/17 performance review, 40 fisheries have been reviewed, which
includes two recreational only fisheries. For the 40 fisheries reviewed, the ‘Stock
Status and Catch Ranges for Major Fisheries’ section of the Annual Report records
that breeding stock assessments are available for the major species taken in 39
(97%) of these fisheries. The one fishery where there are insufficient data to make
an assessment on the target species to make a critical assessment was due to the
fishery having not operated for more than six years.
Within the group of 39 assessed fisheries, 32 were considered to have adequate
breeding stock levels and a further four fisheries (West Coast Demersal Scalefish
Fishery (WCDSF); the Shark Bay Crab Fishery, the Shark Bay Scallop Fishery and
the Cockburn Sound Crab Fishery) had breeding stocks considered to be recovering
at acceptable rates (collectively 92% of fisheries). The WCDSF targets relatively long
lived species so its recovery is expected to take a number of years to complete. The
initial strong management actions taken in Shark Bay combined with the
conservative Total Allowable Commercial Catches (TACCs) imposed since the
For the 2016/17 reporting period, the proportion of fish stocks identified as not
being at risk or vulnerable through exploitation is 95%.
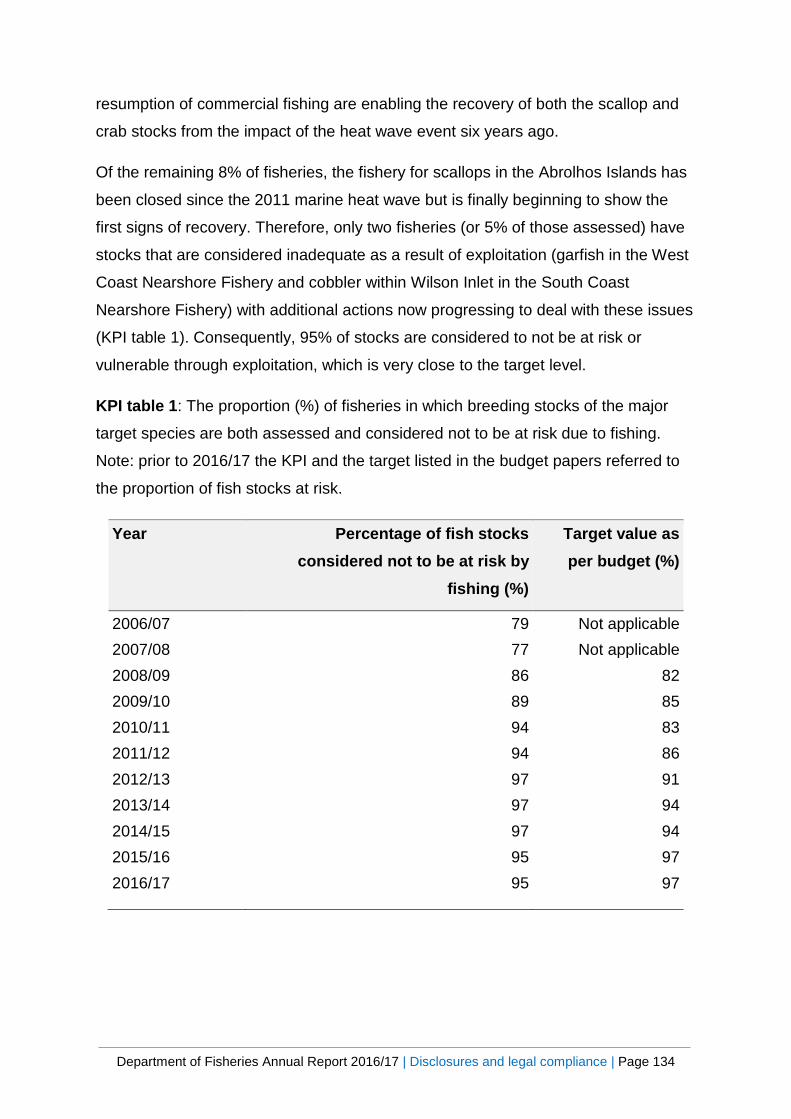
Department of Fisheries Annual Report 2016/17 | Disclosures and legal compliance | Page 134
resumption of commercial fishing are enabling the recovery of both the scallop and
crab stocks from the impact of the heat wave event six years ago.
Of the remaining 8% of fisheries, the fishery for scallops in the Abrolhos Islands has
been closed since the 2011 marine heat wave but is finally beginning to show the
first signs of recovery. Therefore, only two fisheries (or 5% of those assessed) have
stocks that are considered inadequate as a result of exploitation (garfish in the West
Coast Nearshore Fishery and cobbler within Wilson Inlet in the South Coast
Nearshore Fishery) with additional actions now progressing to deal with these issues
(KPI table 1). Consequently, 95% of stocks are considered to not be at risk or
vulnerable through exploitation, which is very close to the target level.
KPI table 1: The proportion (%) of fisheries in which breeding stocks of the major
target species are both assessed and considered not to be at risk due to fishing.
Note: prior to 2016/17 the KPI and the target listed in the budget papers referred to
the proportion of fish stocks at risk.
Year Percentage of fish stocks considered not to be at risk by
fishing (%)
Target value as per budget (%)
2006/07 79 Not applicable 2007/08 77 Not applicable 2008/09 86 82 2009/10 89 85 2010/11 94 83 2011/12 94 86 2012/13 97 91 2013/14 97 94 2014/15 97 94 2015/16 95 97 2016/17 95 97
Department of Fisheries Annual Report 2016/17 | Disclosures and legal compliance | Page 135
1.2 The proportion of commercial fisheries where acceptable catches (or effort levels) are achieved.
This indicator provides an assessment of the success of the Department’s
commercial management plans and regulatory activities in keeping fish catches at
appropriate levels (including those in a recovery phase). For most of the commercial
fisheries in WA, each management plan seeks to directly control the amount of
fishing effort applied to stocks, with the level of catch taken providing an indication of
the effectiveness of the plan. Where the plan is operating effectively, the catch by the
fishery should fall within a projected range. The extent of this range reflects the
degree to which normal environmental variations affect the recruitment of juveniles to
the stock which cannot be ‘controlled’ by the management plan. Additional
considerations include market conditions, fleet rationalisation or other factors that
may result in ongoing changes to the amount of effort expended in a fishery which
will in turn influence the appropriateness of acceptable catch ranges for certain
fisheries.
A target catch or effort range has been determined for each of the major commercial
fisheries (see the ‘Stock Status and Catch Ranges for Major Fisheries’ section of the
Annual Report) by the Department’s Science and Resource Assessment Division.
The Department’s 2016/17 Budget Papers state that the target is 95%.
For quota-managed fisheries, the measure of success of management arrangements
is that the majority of the Total Allowable Commercial Catch (TACC) is achieved,
and additionally, that it has been possible to take this catch using an acceptable
amount of fishing effort. If an unusually large expenditure of effort is needed to take
the TACC, or the industry fails to achieve the TACC by a significant margin, this may
indicate that the abundance of the stock is significantly lower than anticipated. For
these reasons, an appropriate range of fishing effort to take the TACC has also been
incorporated for assessing the performance of quota-managed fisheries (see the
‘Stock Status and Catch Ranges for Major Fisheries’ section of the Annual Report).
For the 2016/17 reporting period, the proportion of commercial fisheries where
acceptable catches (or effort levels) are achieved is 93%.

Department of Fisheries Annual Report 2016/17 | Disclosures and legal compliance | Page 136
The major commercial fisheries which have target catch or effort ranges account for
most of the commercial value of WA’s landed catch. Comparisons between the
actual catches (or effort) with the target ranges have been undertaken for 29 of the
38 commercial fisheries referred to in ‘Stock Status and Catch Ranges for Major
Fisheries’ section of the Annual Report. There is still a relatively high number of
fisheries not assessed which is due to a combination of ongoing environmentally
induced stock issues in some regions (see above) and poor economic conditions for
some fisheries which meant a number of fisheries were either closed or did not have
material levels of catches during this reporting period. This includes two fisheries
(Cockburn Sound crabs, Abrolhos Islands and Mid-West [scallops] Trawl) still
affected by unusual environmental conditions to the extent that the fisheries were
again closed. These stocks continue to be closely monitored and are starting to both
show signs of recovery which highlights the benefits of strong management actions
taken by the Department.
Of the 29 fisheries where ‘target ranges’ were available and a material level of
fishing was undertaken in the relevant reporting period, 11 were catch-quota
managed with 18 subject to effort control management.
Ten of the 11 individually transferable quota managed fisheries operated within their
target effort/catch ranges or were acceptably below the effort range (e.g. Roe’s
abalone, pearl oysters, purse seine fisheries). The Gascoyne Demersal Scalefish
Fishery catch rates that fell below the threshold level, and a review of the stock
status of snapper, will be completed in the coming year.
In the 18 effort-controlled fisheries, eleven were within or acceptably above (one) or
below (five) their target catch ranges. For effort-controlled fisheries, the current catch
level of southern garfish required suitable adjustments to management which have
already been initiated.
In summary, 27 of the 29 commercial fisheries assessed (93%) were considered to
have met their performance criteria, or were affected by factors outside the purview
of the management plan/arrangements. This figure is close to the target level of 95%
(KPI table 2).
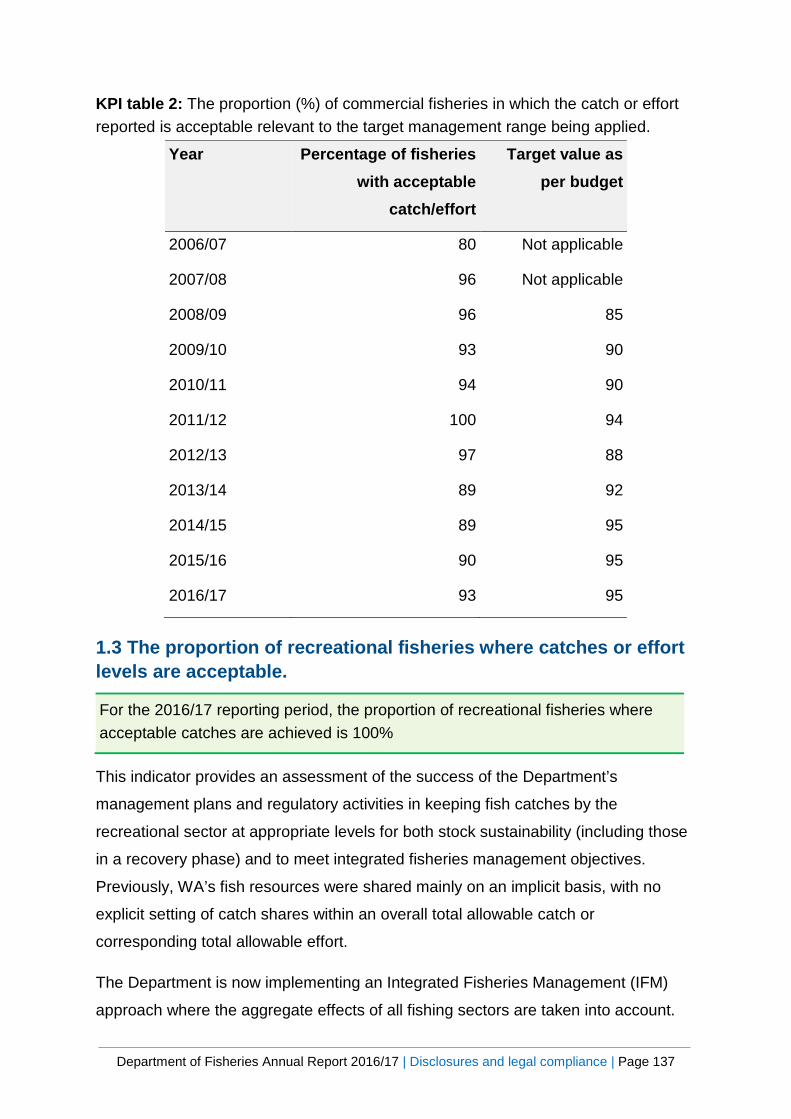
Department of Fisheries Annual Report 2016/17 | Disclosures and legal compliance | Page 137
KPI table 2: The proportion (%) of commercial fisheries in which the catch or effort reported is acceptable relevant to the target management range being applied.
Year Percentage of fisheries with acceptable
catch/effort
Target value as per budget
2006/07 80 Not applicable
2007/08 96 Not applicable
2008/09 96 85
2009/10 93 90
2010/11 94 90
2011/12 100 94
2012/13 97 88
2013/14 89 92
2014/15 89 95
2015/16 90 95
2016/17 93 95
1.3 The proportion of recreational fisheries where catches or effort levels are acceptable.
This indicator provides an assessment of the success of the Department’s
management plans and regulatory activities in keeping fish catches by the
recreational sector at appropriate levels for both stock sustainability (including those
in a recovery phase) and to meet integrated fisheries management objectives.
Previously, WA’s fish resources were shared mainly on an implicit basis, with no
explicit setting of catch shares within an overall total allowable catch or
corresponding total allowable effort.
The Department is now implementing an Integrated Fisheries Management (IFM)
approach where the aggregate effects of all fishing sectors are taken into account.
For the 2016/17 reporting period, the proportion of recreational fisheries where acceptable catches are achieved is 100%
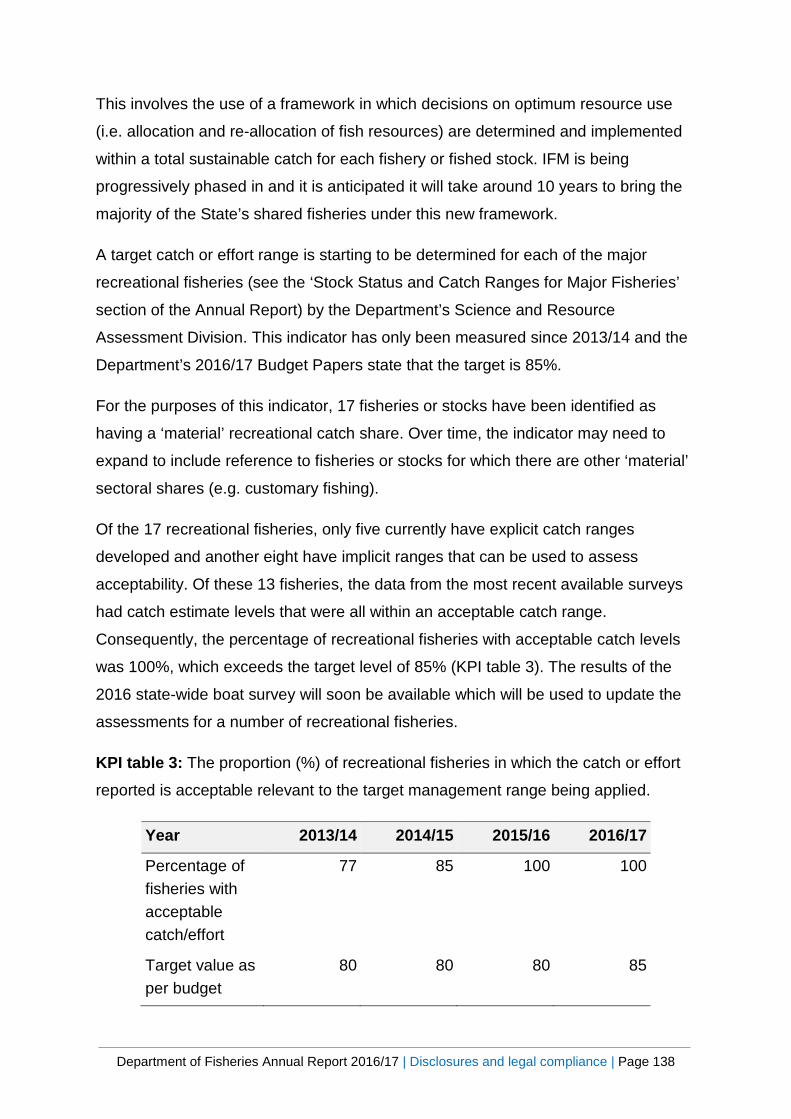
Department of Fisheries Annual Report 2016/17 | Disclosures and legal compliance | Page 138
This involves the use of a framework in which decisions on optimum resource use
(i.e. allocation and re-allocation of fish resources) are determined and implemented
within a total sustainable catch for each fishery or fished stock. IFM is being
progressively phased in and it is anticipated it will take around 10 years to bring the
majority of the State’s shared fisheries under this new framework.
A target catch or effort range is starting to be determined for each of the major
recreational fisheries (see the ‘Stock Status and Catch Ranges for Major Fisheries’
section of the Annual Report) by the Department’s Science and Resource
Assessment Division. This indicator has only been measured since 2013/14 and the
Department’s 2016/17 Budget Papers state that the target is 85%.
For the purposes of this indicator, 17 fisheries or stocks have been identified as
having a ‘material’ recreational catch share. Over time, the indicator may need to
expand to include reference to fisheries or stocks for which there are other ‘material’
sectoral shares (e.g. customary fishing).
Of the 17 recreational fisheries, only five currently have explicit catch ranges
developed and another eight have implicit ranges that can be used to assess
acceptability. Of these 13 fisheries, the data from the most recent available surveys
had catch estimate levels that were all within an acceptable catch range.
Consequently, the percentage of recreational fisheries with acceptable catch levels
was 100%, which exceeds the target level of 85% (KPI table 3). The results of the
2016 state-wide boat survey will soon be available which will be used to update the
assessments for a number of recreational fisheries.
KPI table 3: The proportion (%) of recreational fisheries in which the catch or effort
reported is acceptable relevant to the target management range being applied.
Year 2013/14 2014/15 2015/16 2016/17
Percentage of fisheries with acceptable catch/effort
77 85 100 100
Target value as per budget
80 80 80 85

Department of Fisheries Annual Report 2016/17 | Disclosures and legal compliance | Page 139
2.1 The volume of State commercial fisheries (including aquaculture) production
We aim to manage the State’s fisheries in an economically, socially and
environmentally sustainable manner. This performance indicator deals with the
production component of the ‘triple bottom line’ approach. Sustainably managed
commercial fisheries provide benefits to the State as a result of significant local and
export earnings from fish and fish products. Commercial fisheries that are not
managed sustainably will suffer reduced production, as less fish products will be
available to the catching sectors.
The production from WA’s commercial, pearling and aquaculture sectors is published
annually by the Australian Bureau of Agricultural and Resource Economics and
Sciences (ABARES), based on data supplied by industry to our Science and
Resource Assessment Division. Information for the years 2013/14 to 2015/16 in
broad groupings is provided in KPI table 4 below.
The 2016/17 Budget Papers state that the target for production is 21,000 tonnes,
which represents a production level that is increasing slowly.
The overall tonnage of commercially caught crustaceans and other categories in
2015/16 were both similar to 2014/15. The production from the mollusc fisheries in
2015/16 increased again from the previous year due to the continued recovery of the
Shark Bay Scallop Fishery.
The annual finfish production in 2015/16 was the highest level in a number of years
close to 10,000 tonnes level due to changes occurring across a number of fisheries.
Total aquaculture production declined marginally in 2015/16 due to a drop in finfish
production.
In summary, the overall tonnage of production in 2015/16 continues the increasing
trend of recent years. The WA commercial fishing and aquaculture sectors will,
however, continue to be affected by a combination of external influences including
For the 2016/17 reporting period, the volume of State commercial fishing
(including aquaculture) production was 21,229 tonnes.
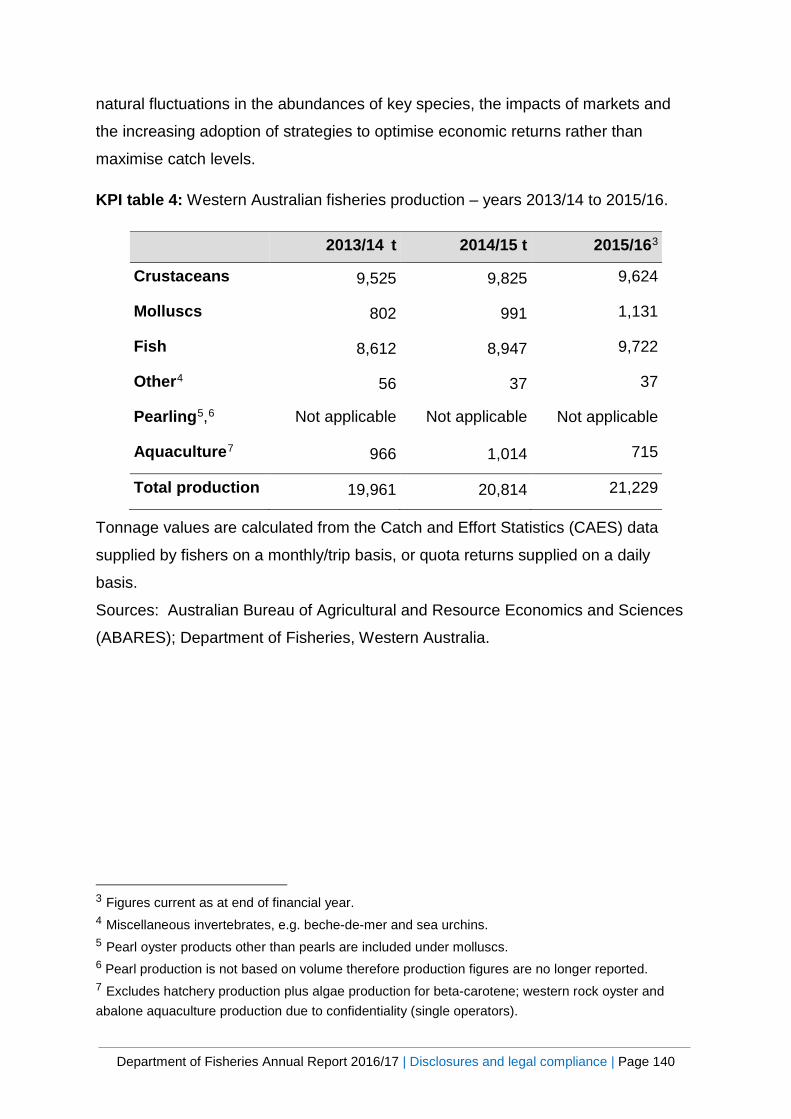
Department of Fisheries Annual Report 2016/17 | Disclosures and legal compliance | Page 140
natural fluctuations in the abundances of key species, the impacts of markets and
the increasing adoption of strategies to optimise economic returns rather than
maximise catch levels.
KPI table 4: Western Australian fisheries production – years 2013/14 to 2015/16.
2013/14 t 2014/15 t 2015/163
Crustaceans 9,525 9,825 9,624
Molluscs 802 991 1,131
Fish 8,612 8,947 9,722
Other4 56 37 37
Pearling5,6 Not applicable Not applicable Not applicable
Aquaculture7 966 1,014 715
Total production 19,961 20,814 21,229
Tonnage values are calculated from the Catch and Effort Statistics (CAES) data
supplied by fishers on a monthly/trip basis, or quota returns supplied on a daily
basis.
Sources: Australian Bureau of Agricultural and Resource Economics and Sciences
(ABARES); Department of Fisheries, Western Australia.
3 Figures current as at end of financial year. 4 Miscellaneous invertebrates, e.g. beche-de-mer and sea urchins. 5 Pearl oyster products other than pearls are included under molluscs. 6 Pearl production is not based on volume therefore production figures are no longer reported. 7 Excludes hatchery production plus algae production for beta-carotene; western rock oyster and abalone aquaculture production due to confidentiality (single operators).
Department of Fisheries Annual Report 2016/17 | Disclosures and legal compliance | Page 141
Community Outcomes
We aim to manage the State’s fisheries in an economically, socially and
environmentally sustainable manner. Sustainably managed fisheries and aquatic
environments provide benefits to the State by providing a range of recreational
opportunities and experiences to the community from snorkeling and looking at fish
in their natural environment to ‘catching a feed’ for the family. Effectiveness
indicators associated with community outcomes are:
• The participation rate in recreational fishing; and
• The satisfaction rating of the broader community and stakeholders as to their
perceptions of the extent to which the Department of Fisheries is achieving
aquatic resources management objectives.
The information used to assess our performance against these effectiveness
indicators is derived from an annual telephone-based community survey and a
biennial telephone-based stakeholder survey. These surveys are conducted in order
to:
• Measure the level of recall and awareness of our informational and
promotional activities;
• Assess the understanding and satisfaction of the Western Australian
community and fisheries stakeholders of our management strategies across
commercial fisheries, recreational fisheries; aquaculture/pearling, and fish and
fish habitat protection; and
• To examine the key aspects of fishing and appreciation of the aquatic
environment by the Western Australian community.
The results from these surveys are used to monitor, evaluate and improve the
effectiveness of the Department’s programs, activities and functions.
An external research company contracted by the Department conducted the 2017
community survey in April 2017. Survey respondents were about asked their
experiences and views for the 12-month period prior to their interview date (i.e.
March 2016 to April 2017). Of a total of 6,522 in-scope respondents (Western
Australian residents aged 18 years and older), 700 interviews were completed
Department of Fisheries Annual Report 2016/17 | Disclosures and legal compliance | Page 142
representing a response rate of 11% which was lower than in the previous
community survey (20% in 2016). The 700 interviews comprised:
• 560 respondents from major cities;
• 60 respondents from inner regional areas; and
• 80 respondents from outer regional/remote/very remote areas or who
were migratory residents.
This sample was weighted to reflect the population based on March 2017 Estimated
Residential Population data from the Australian Bureau of Statistics (ABS), with the
survey providing estimates for the 2016/17 financial year.
3.1 Participation in recreational fishing
The level of participation in recreational fisheries and frequency that respondents
participate in recreational fishing is a measure of the utilisation of this community
resource. Recreational fisheries also provide social and economic benefits for the
community. These may include social benefits, such as spending time with family or
friends and/or economic benefits, such as the sale of tackle, boats and other gear,
and economic support for boating and tourism industries based on fishing.
The Department’s 2016/17 Budget Papers state that the target participation rate in
recreational fisheries in Western Australia is 30 %. Based on survey data, the
2016/17 participation rate was estimated as 27.5 % (95 % CI [24.2 %, 30.8 %]) of the
population. This participation rate was marginally lower than the rate reported in
recent years (i.e. ~ 29 – 33 %; KPI figure 1) consistent with the long-term, slight
declining trend observed since the late-1990s. With increasing population levels,
based on the estimated residential population of Western Australia aged five and
older at 30 September 2016 (ABS 2016), the number of people in Western Australia
who participated in recreational fishing at least once in the previous 12-month period
was approximately 671,000 (95 % CI [590,000, 752,000]). Persons age four or
younger were out of scope for this survey.
For 2016/17 the participation rate in recreational fishing is 27.5% of the population
or approximately 671,000 people

Department of Fisheries Annual Report 2016/17 | Disclosures and legal compliance | Page 143
KPI figure 1. Estimated (± 95 % CI; blue bars – diagonal lines) and target (red bars
– horizontal lines) participation rate of Western Australian residents in recreational
fisheries from 2008/09 to 2016/17.
The graph above illustrates the yearly estimated participation rate of Western
Australian residents in recreational fisheries from 2008/09 through to 2016/17
against the annual target participation rate.
These data are reproduced in a table below for people using assistive technologies
to read this report.
KPI table 5: Estimated (+ 95% CI) and target participation rate of Western Australian
residents in recreational fisheries from 2008/09 through 2016/17.
Year Estimated participation rate Target participation rate
2008/09 33 30
2009/10 32 30
2010/11 32 33
2011/12 32 32
2012/13 33 32
33 32 33 32 3329
30 3128
30 3033 32 32 32 33
30 30
0
10
20
30
40Pa
rtic
ipat
ion
rate
(%)
Survey year
Estimated
Target
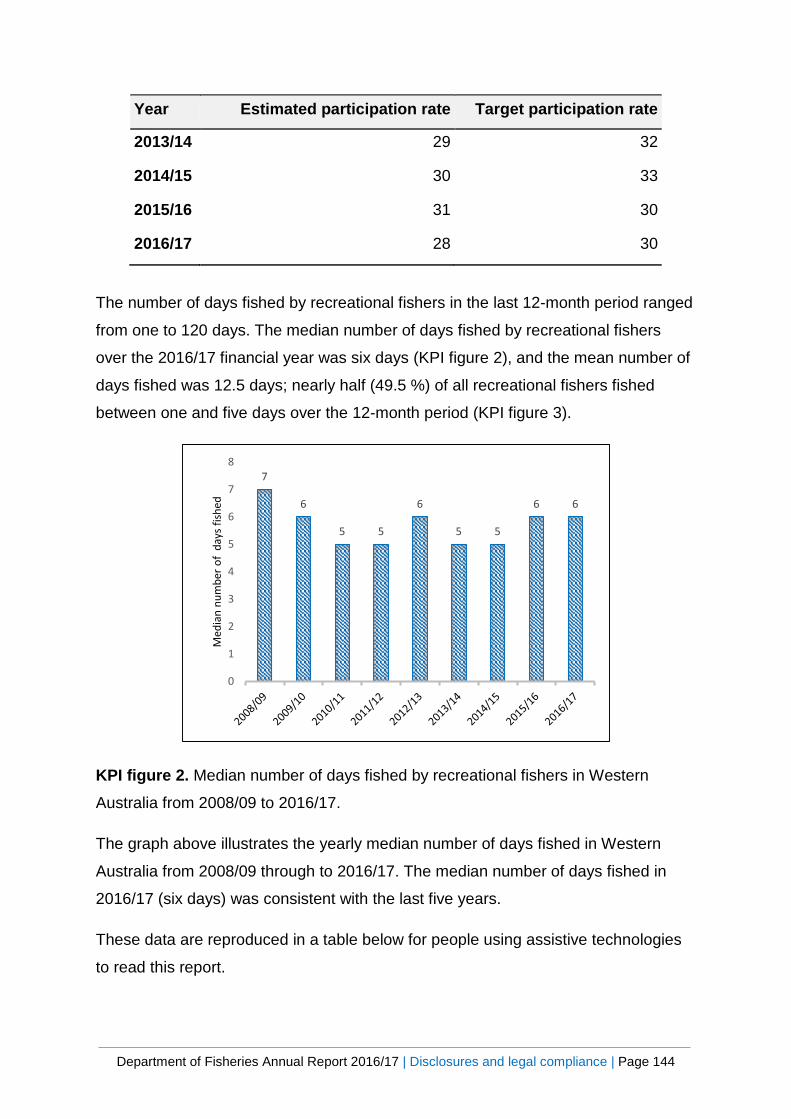
Department of Fisheries Annual Report 2016/17 | Disclosures and legal compliance | Page 144
Year Estimated participation rate Target participation rate
2013/14 29 32
2014/15 30 33
2015/16 31 30
2016/17 28 30
The number of days fished by recreational fishers in the last 12-month period ranged
from one to 120 days. The median number of days fished by recreational fishers
over the 2016/17 financial year was six days (KPI figure 2), and the mean number of
days fished was 12.5 days; nearly half (49.5 %) of all recreational fishers fished
between one and five days over the 12-month period (KPI figure 3).
KPI figure 2. Median number of days fished by recreational fishers in Western
Australia from 2008/09 to 2016/17.
The graph above illustrates the yearly median number of days fished in Western
Australia from 2008/09 through to 2016/17. The median number of days fished in
2016/17 (six days) was consistent with the last five years.
These data are reproduced in a table below for people using assistive technologies
to read this report.
7
6
5 5
6
5 5
6 6
0
1
2
3
4
5
6
7
8
Med
ian
num
ber o
f da
ys fi
shed
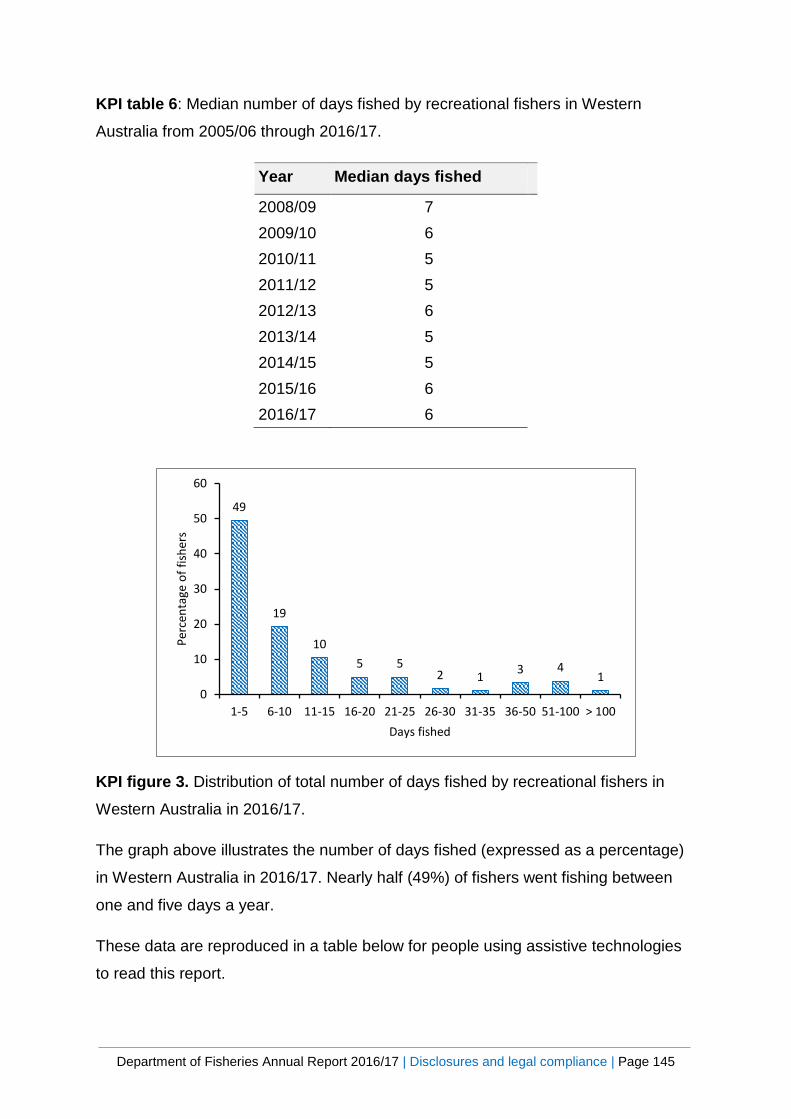
Department of Fisheries Annual Report 2016/17 | Disclosures and legal compliance | Page 145
KPI table 6: Median number of days fished by recreational fishers in Western
Australia from 2005/06 through 2016/17.
Year Median days fished
2008/09 7 2009/10 6 2010/11 5 2011/12 5 2012/13 6 2013/14 5 2014/15 5 2015/16 6 2016/17 6
KPI figure 3. Distribution of total number of days fished by recreational fishers in
Western Australia in 2016/17.
The graph above illustrates the number of days fished (expressed as a percentage)
in Western Australia in 2016/17. Nearly half (49%) of fishers went fishing between
one and five days a year.
These data are reproduced in a table below for people using assistive technologies
to read this report.
49
19
105 5
2 1 3 41
0
10
20
30
40
50
60
1-5 6-10 11-15 16-20 21-25 26-30 31-35 36-50 51-100 > 100
Perc
enta
ge o
f fish
ers
Days fished
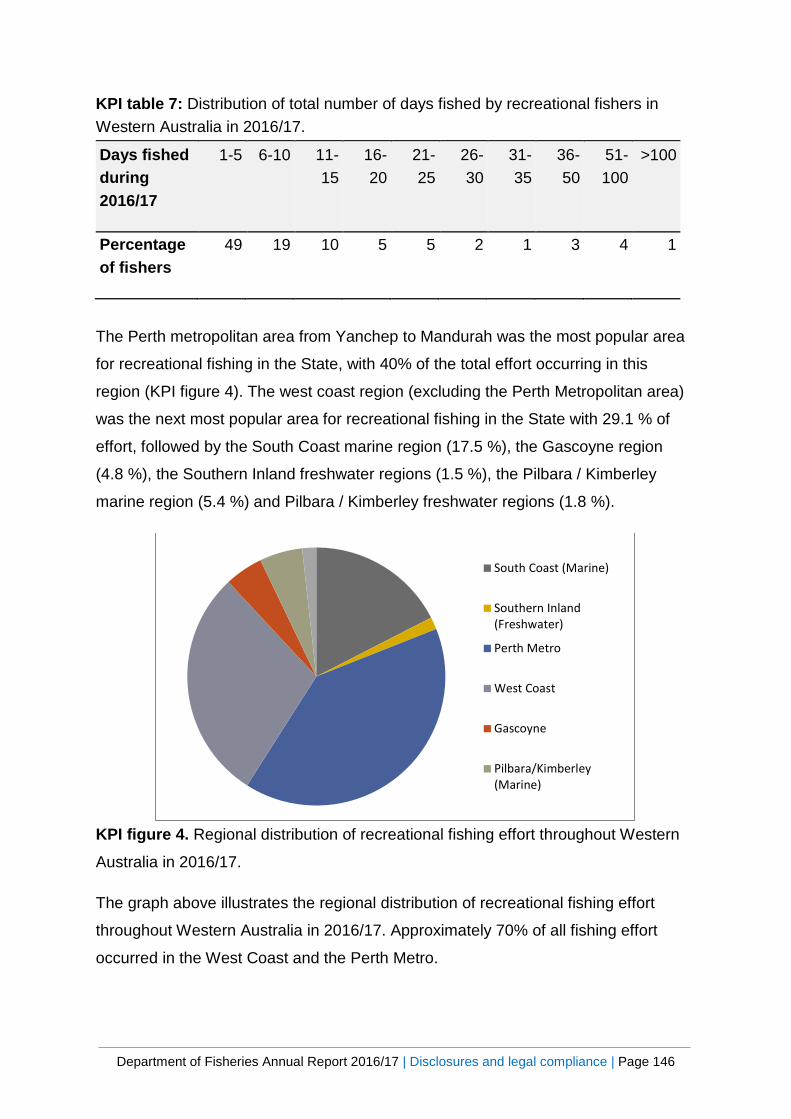
Department of Fisheries Annual Report 2016/17 | Disclosures and legal compliance | Page 146
KPI table 7: Distribution of total number of days fished by recreational fishers in Western Australia in 2016/17.
Days fished during 2016/17
1-5 6-10 11-15
16-20
21-25
26-30
31-35
36-50
51-100
>100
Percentage of fishers
49 19 10 5 5 2 1 3 4 1
The Perth metropolitan area from Yanchep to Mandurah was the most popular area
for recreational fishing in the State, with 40% of the total effort occurring in this
region (KPI figure 4). The west coast region (excluding the Perth Metropolitan area)
was the next most popular area for recreational fishing in the State with 29.1 % of
effort, followed by the South Coast marine region (17.5 %), the Gascoyne region
(4.8 %), the Southern Inland freshwater regions (1.5 %), the Pilbara / Kimberley
marine region (5.4 %) and Pilbara / Kimberley freshwater regions (1.8 %).
KPI figure 4. Regional distribution of recreational fishing effort throughout Western
Australia in 2016/17.
The graph above illustrates the regional distribution of recreational fishing effort
throughout Western Australia in 2016/17. Approximately 70% of all fishing effort
occurred in the West Coast and the Perth Metro.
South Coast (Marine)
Southern Inland(Freshwater)
Perth Metro
West Coast
Gascoyne
Pilbara/Kimberley(Marine)
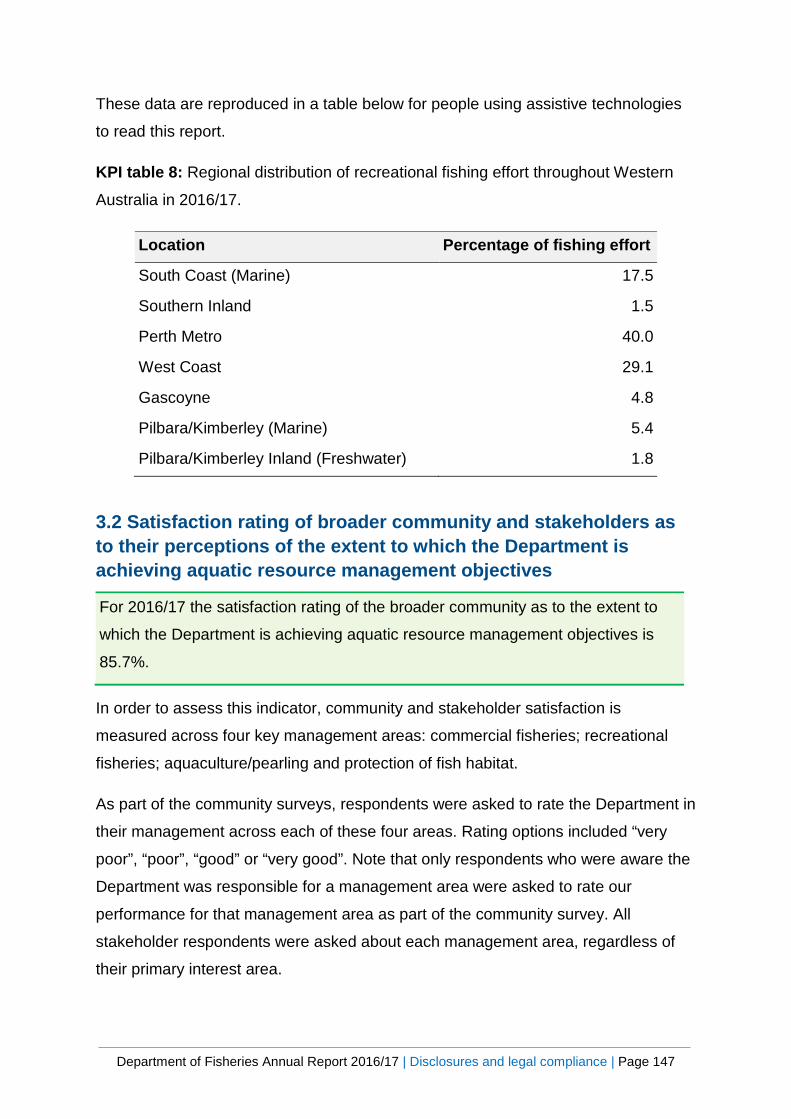
Department of Fisheries Annual Report 2016/17 | Disclosures and legal compliance | Page 147
These data are reproduced in a table below for people using assistive technologies
to read this report.
KPI table 8: Regional distribution of recreational fishing effort throughout Western
Australia in 2016/17.
Location Percentage of fishing effort
South Coast (Marine) 17.5
Southern Inland 1.5
Perth Metro 40.0
West Coast 29.1
Gascoyne 4.8
Pilbara/Kimberley (Marine) 5.4
Pilbara/Kimberley Inland (Freshwater) 1.8
3.2 Satisfaction rating of broader community and stakeholders as to their perceptions of the extent to which the Department is achieving aquatic resource management objectives
In order to assess this indicator, community and stakeholder satisfaction is
measured across four key management areas: commercial fisheries; recreational
fisheries; aquaculture/pearling and protection of fish habitat.
As part of the community surveys, respondents were asked to rate the Department in
their management across each of these four areas. Rating options included “very
poor”, “poor”, “good” or “very good”. Note that only respondents who were aware the
Department was responsible for a management area were asked to rate our
performance for that management area as part of the community survey. All
stakeholder respondents were asked about each management area, regardless of
their primary interest area.
For 2016/17 the satisfaction rating of the broader community as to the extent to
which the Department is achieving aquatic resource management objectives is
85.7%.
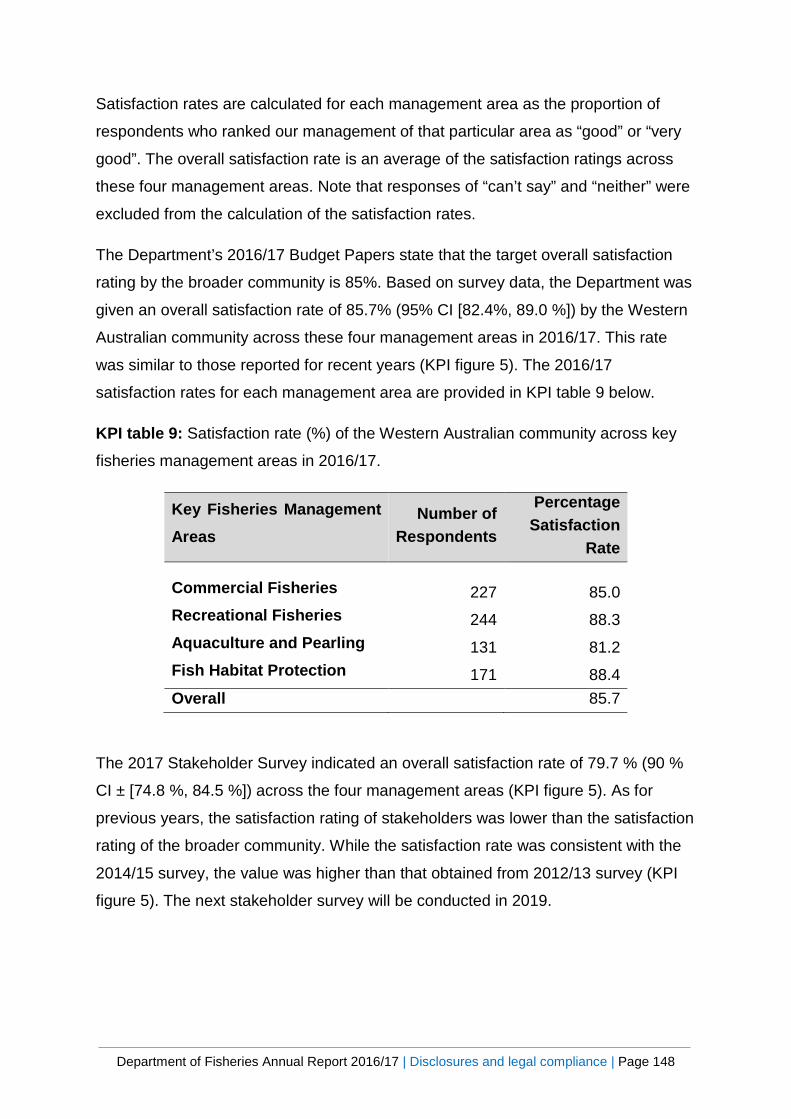
Department of Fisheries Annual Report 2016/17 | Disclosures and legal compliance | Page 148
Satisfaction rates are calculated for each management area as the proportion of
respondents who ranked our management of that particular area as “good” or “very
good”. The overall satisfaction rate is an average of the satisfaction ratings across
these four management areas. Note that responses of “can’t say” and “neither” were
excluded from the calculation of the satisfaction rates.
The Department’s 2016/17 Budget Papers state that the target overall satisfaction
rating by the broader community is 85%. Based on survey data, the Department was
given an overall satisfaction rate of 85.7% (95% CI [82.4%, 89.0 %]) by the Western
Australian community across these four management areas in 2016/17. This rate
was similar to those reported for recent years (KPI figure 5). The 2016/17
satisfaction rates for each management area are provided in KPI table 9 below.
KPI table 9: Satisfaction rate (%) of the Western Australian community across key
fisheries management areas in 2016/17.
Key Fisheries Management Areas
Number of Respondents
Percentage Satisfaction
Rate
Commercial Fisheries 227 85.0 Recreational Fisheries 244 88.3 Aquaculture and Pearling 131 81.2 Fish Habitat Protection 171 88.4 Overall 85.7
The 2017 Stakeholder Survey indicated an overall satisfaction rate of 79.7 % (90 %
CI ± [74.8 %, 84.5 %]) across the four management areas (KPI figure 5). As for
previous years, the satisfaction rating of stakeholders was lower than the satisfaction
rating of the broader community. While the satisfaction rate was consistent with the
2014/15 survey, the value was higher than that obtained from 2012/13 survey (KPI
figure 5). The next stakeholder survey will be conducted in 2019.

Department of Fisheries Annual Report 2016/17 | Disclosures and legal compliance | Page 149
KPI figure 5. Estimated overall satisfaction rate of the broader Western Australian
community (blue bars – diagonal lines) and Departmental stakeholders (red bar –
horizontal lines) from 2008/09 to 2016/17
The graph above illustrates the estimated satisfaction rating of the Western Australian community and stakeholders between 2008/09 and 2016/17. These data are reproduced in a table below for people using assistive technologies to read this report. KPI table 10: Estimated satisfaction rate (± 95 % CI) of the Western Australian
community between 2008/09 and 2016/17.
Year ‘08/09 ‘09/10 ‘10/11 ‘11/12 ‘12/13 ‘13/14 ‘14/15 ‘15/16 ‘16/17
Mean 81 75 81 85 85 85 85 86 86
Key efficiency indicators The Department's efficiency indicators have been calculated by dividing the total
service cost in a functional area by the hours delivered in that functional area.
The measures enable analysis of variance in costs from year-to-year and provide a
benchmark for comparison against like service delivery.
81
75
81 85 85 85 85 86 86
6567
7580
80
0
10
20
30
40
50
60
70
80
90
100
Satis
fact
ion
Rate
(%)
Survey Year
Community
Stakeholders
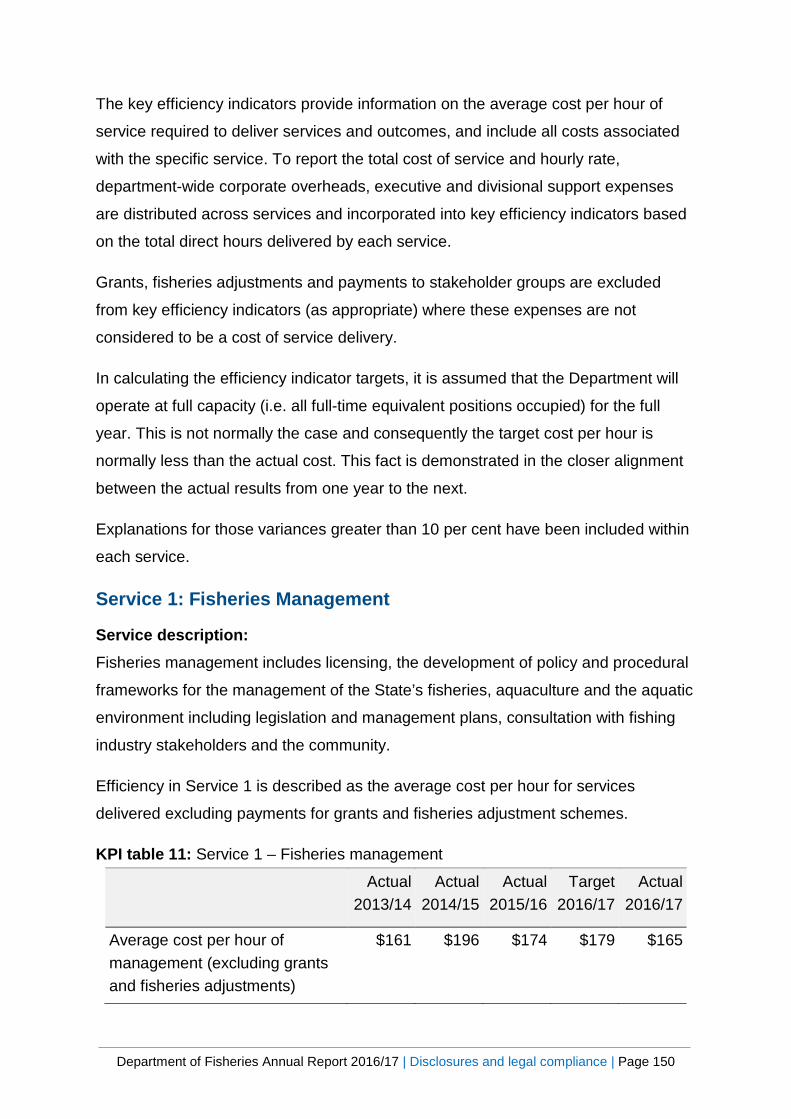
Department of Fisheries Annual Report 2016/17 | Disclosures and legal compliance | Page 150
The key efficiency indicators provide information on the average cost per hour of
service required to deliver services and outcomes, and include all costs associated
with the specific service. To report the total cost of service and hourly rate,
department-wide corporate overheads, executive and divisional support expenses
are distributed across services and incorporated into key efficiency indicators based
on the total direct hours delivered by each service.
Grants, fisheries adjustments and payments to stakeholder groups are excluded
from key efficiency indicators (as appropriate) where these expenses are not
considered to be a cost of service delivery.
In calculating the efficiency indicator targets, it is assumed that the Department will
operate at full capacity (i.e. all full-time equivalent positions occupied) for the full
year. This is not normally the case and consequently the target cost per hour is
normally less than the actual cost. This fact is demonstrated in the closer alignment
between the actual results from one year to the next.
Explanations for those variances greater than 10 per cent have been included within
each service.
Service 1: Fisheries Management
Service description: Fisheries management includes licensing, the development of policy and procedural
frameworks for the management of the State’s fisheries, aquaculture and the aquatic
environment including legislation and management plans, consultation with fishing
industry stakeholders and the community.
Efficiency in Service 1 is described as the average cost per hour for services
delivered excluding payments for grants and fisheries adjustment schemes.
KPI table 11: Service 1 – Fisheries management
Actual 2013/14
Actual 2014/15
Actual 2015/16
Target 2016/17
Actual 2016/17
Average cost per hour of management (excluding grants and fisheries adjustments)
$161 $196 $174 $179 $165
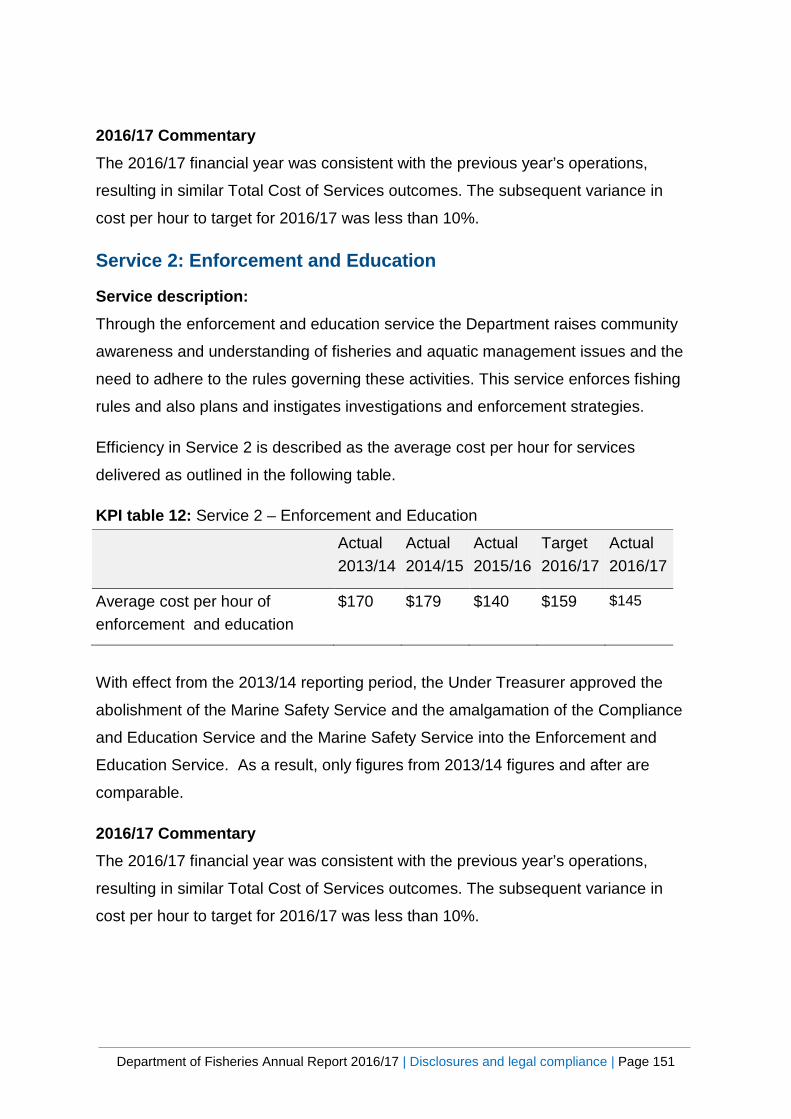
Department of Fisheries Annual Report 2016/17 | Disclosures and legal compliance | Page 151
2016/17 Commentary The 2016/17 financial year was consistent with the previous year’s operations,
resulting in similar Total Cost of Services outcomes. The subsequent variance in
cost per hour to target for 2016/17 was less than 10%.
Service 2: Enforcement and Education
Service description: Through the enforcement and education service the Department raises community
awareness and understanding of fisheries and aquatic management issues and the
need to adhere to the rules governing these activities. This service enforces fishing
rules and also plans and instigates investigations and enforcement strategies.
Efficiency in Service 2 is described as the average cost per hour for services
delivered as outlined in the following table.
KPI table 12: Service 2 – Enforcement and Education
Actual 2013/14
Actual 2014/15
Actual 2015/16
Target 2016/17
Actual 2016/17
Average cost per hour of enforcement and education
$170 $179 $140 $159 $145
With effect from the 2013/14 reporting period, the Under Treasurer approved the
abolishment of the Marine Safety Service and the amalgamation of the Compliance
and Education Service and the Marine Safety Service into the Enforcement and
Education Service. As a result, only figures from 2013/14 figures and after are
comparable.
2016/17 Commentary The 2016/17 financial year was consistent with the previous year’s operations,
resulting in similar Total Cost of Services outcomes. The subsequent variance in
cost per hour to target for 2016/17 was less than 10%.
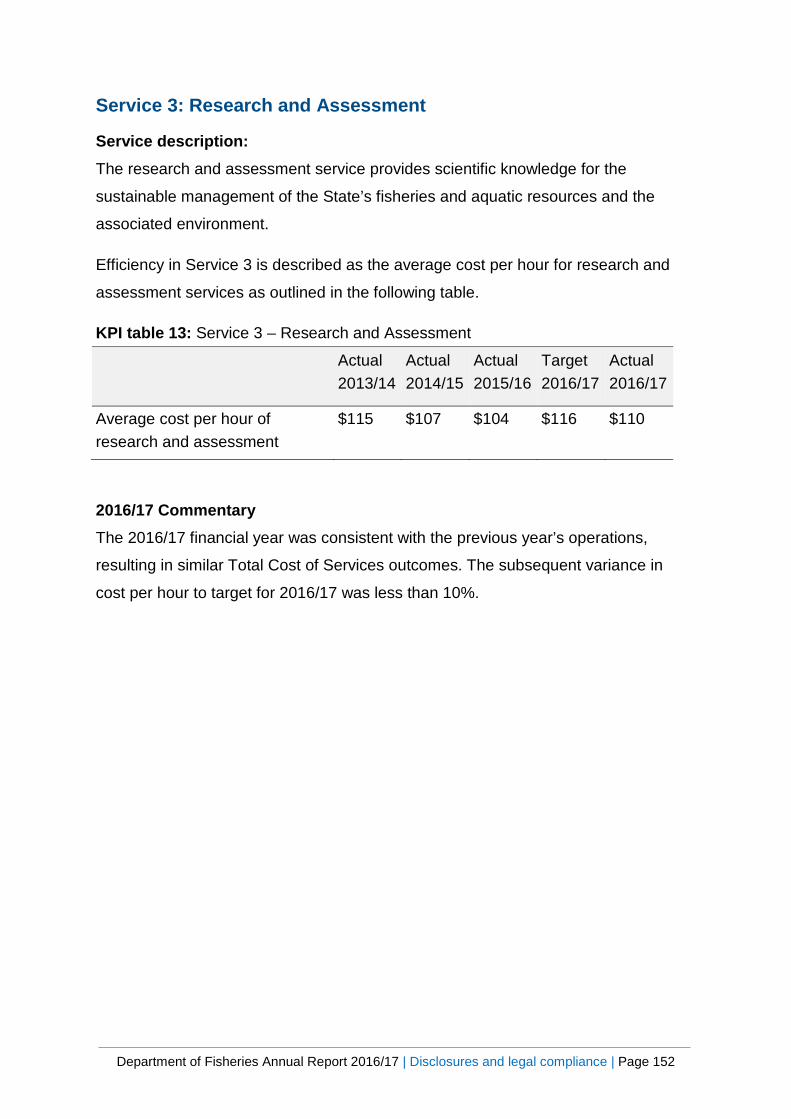
Department of Fisheries Annual Report 2016/17 | Disclosures and legal compliance | Page 152
Service 3: Research and Assessment
Service description: The research and assessment service provides scientific knowledge for the
sustainable management of the State’s fisheries and aquatic resources and the
associated environment.
Efficiency in Service 3 is described as the average cost per hour for research and
assessment services as outlined in the following table.
KPI table 13: Service 3 – Research and Assessment
Actual 2013/14
Actual 2014/15
Actual 2015/16
Target 2016/17
Actual 2016/17
Average cost per hour of research and assessment
$115 $107 $104 $116 $110
2016/17 Commentary The 2016/17 financial year was consistent with the previous year’s operations,
resulting in similar Total Cost of Services outcomes. The subsequent variance in
cost per hour to target for 2016/17 was less than 10%.
Department of Fisheries Annual Report 2016/17 | Disclosures and legal compliance | Page 153
Ministerial directives
No ministerial directives were received during the year.
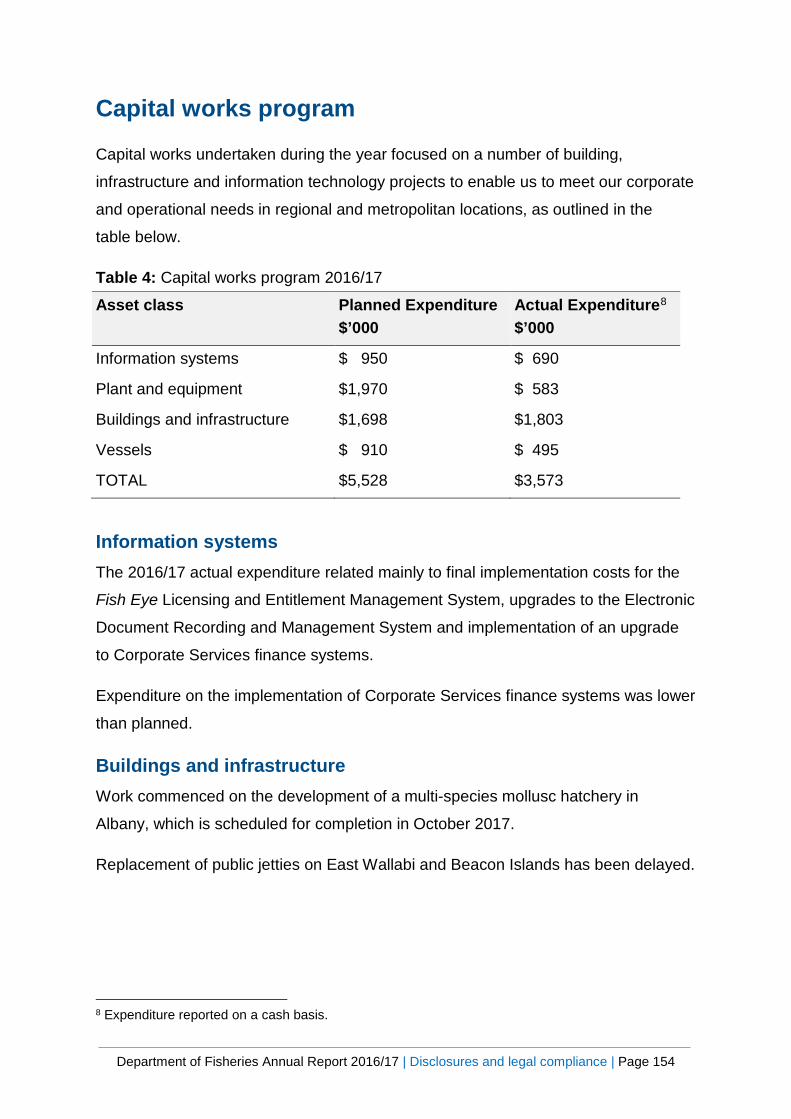
Department of Fisheries Annual Report 2016/17 | Disclosures and legal compliance | Page 154
Capital works program
Capital works undertaken during the year focused on a number of building,
infrastructure and information technology projects to enable us to meet our corporate
and operational needs in regional and metropolitan locations, as outlined in the
table below.
Table 4: Capital works program 2016/17
Asset class Planned Expenditure $’000
Actual Expenditure8 $’000
Information systems $ 950 $ 690
Plant and equipment $1,970 $ 583
Buildings and infrastructure $1,698 $1,803
Vessels $ 910 $ 495
TOTAL $5,528 $3,573
Information systems The 2016/17 actual expenditure related mainly to final implementation costs for the
Fish Eye Licensing and Entitlement Management System, upgrades to the Electronic
Document Recording and Management System and implementation of an upgrade
to Corporate Services finance systems.
Expenditure on the implementation of Corporate Services finance systems was lower
than planned.
Buildings and infrastructure Work commenced on the development of a multi-species mollusc hatchery in
Albany, which is scheduled for completion in October 2017.
Replacement of public jetties on East Wallabi and Beacon Islands has been delayed.
8 Expenditure reported on a cash basis.

Department of Fisheries Annual Report 2016/17 | Disclosures and legal compliance | Page 155
Vessels The capital program for 2016/17 funded the continuing maintenance of a variety of
vessels to support our enforcement, education and research services. Major
replacements of larger vessels have been postponed.
Pricing policy for services provided We receive a large proportion of our revenue from regulatory fees and charges
related to commercial fishing, aquaculture and recreational fishing. These fees are
set in accordance with Government policy and the level of cost recovery is based on
the nature of the transaction. Commercial access to fish resources is determined to
reflect an appropriate payment to the community for access to that resource.
The Department reviewed the process for cost allocation for transactional and
application fees under the Fish Resources Management Regulations 1995 in
2015/16 to ensure the correct cost attribution to these fees. We have used this
formula for the 2016/17 financial year.
Charges for goods and services are determined in accordance with Costing and
Pricing Government Services: Guidelines for Use by Agencies in the Western
Australian Public Sector published by the Department of Treasury.
Department of Fisheries Annual Report 2016/17 | Disclosures and legal compliance | Page 156
Governance disclosures
Contracts with senior officers During the reporting period, other than normal contracts of employment, no senior
officers, or firms of which senior officers are members, or entities in which senior
officers have substantial interests, had any interests in existing or proposed
contracts with the Department of Fisheries.
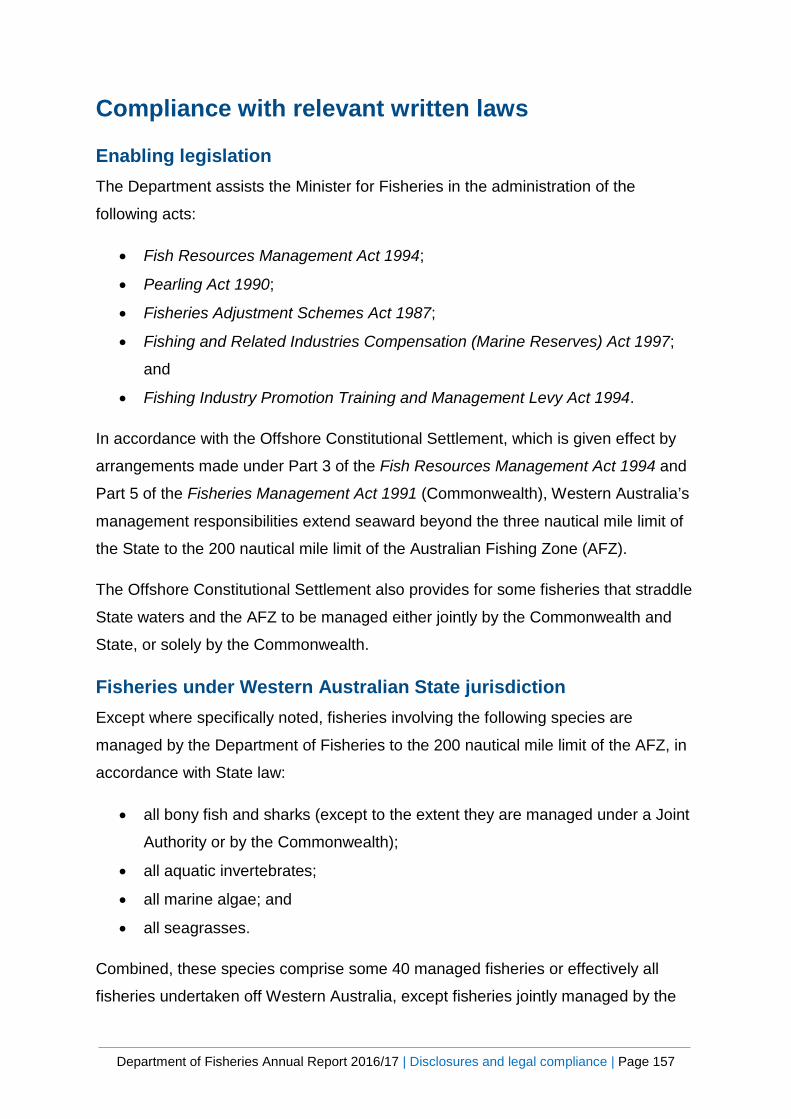
Department of Fisheries Annual Report 2016/17 | Disclosures and legal compliance | Page 157
Compliance with relevant written laws
Enabling legislation The Department assists the Minister for Fisheries in the administration of the
following acts:
• Fish Resources Management Act 1994;
• Pearling Act 1990;
• Fisheries Adjustment Schemes Act 1987;
• Fishing and Related Industries Compensation (Marine Reserves) Act 1997;
and
• Fishing Industry Promotion Training and Management Levy Act 1994.
In accordance with the Offshore Constitutional Settlement, which is given effect by
arrangements made under Part 3 of the Fish Resources Management Act 1994 and
Part 5 of the Fisheries Management Act 1991 (Commonwealth), Western Australia’s
management responsibilities extend seaward beyond the three nautical mile limit of
the State to the 200 nautical mile limit of the Australian Fishing Zone (AFZ).
The Offshore Constitutional Settlement also provides for some fisheries that straddle
State waters and the AFZ to be managed either jointly by the Commonwealth and
State, or solely by the Commonwealth.
Fisheries under Western Australian State jurisdiction Except where specifically noted, fisheries involving the following species are
managed by the Department of Fisheries to the 200 nautical mile limit of the AFZ, in
accordance with State law:
• all bony fish and sharks (except to the extent they are managed under a Joint
Authority or by the Commonwealth);
• all aquatic invertebrates;
• all marine algae; and
• all seagrasses.
Combined, these species comprise some 40 managed fisheries or effectively all
fisheries undertaken off Western Australia, except fisheries jointly managed by the
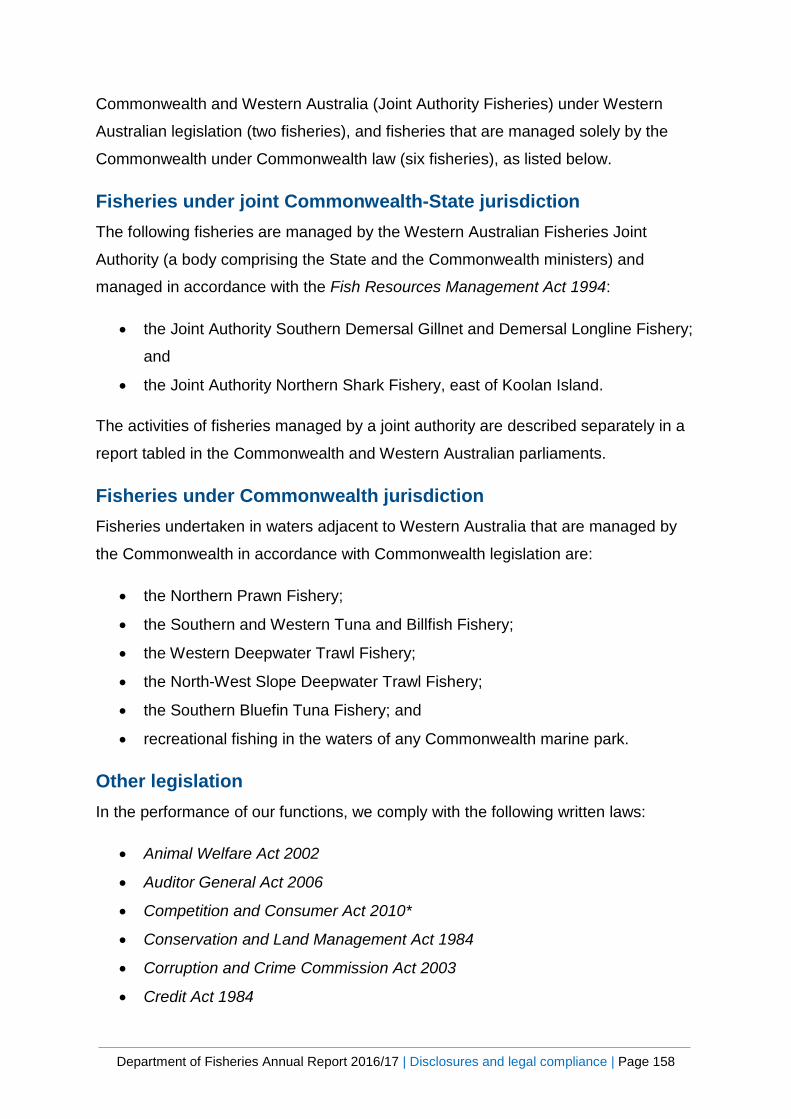
Department of Fisheries Annual Report 2016/17 | Disclosures and legal compliance | Page 158
Commonwealth and Western Australia (Joint Authority Fisheries) under Western
Australian legislation (two fisheries), and fisheries that are managed solely by the
Commonwealth under Commonwealth law (six fisheries), as listed below.
Fisheries under joint Commonwealth-State jurisdiction The following fisheries are managed by the Western Australian Fisheries Joint
Authority (a body comprising the State and the Commonwealth ministers) and
managed in accordance with the Fish Resources Management Act 1994:
• the Joint Authority Southern Demersal Gillnet and Demersal Longline Fishery;
and
• the Joint Authority Northern Shark Fishery, east of Koolan Island.
The activities of fisheries managed by a joint authority are described separately in a
report tabled in the Commonwealth and Western Australian parliaments.
Fisheries under Commonwealth jurisdiction Fisheries undertaken in waters adjacent to Western Australia that are managed by
the Commonwealth in accordance with Commonwealth legislation are:
• the Northern Prawn Fishery;
• the Southern and Western Tuna and Billfish Fishery;
• the Western Deepwater Trawl Fishery;
• the North-West Slope Deepwater Trawl Fishery;
• the Southern Bluefin Tuna Fishery; and
• recreational fishing in the waters of any Commonwealth marine park.
Other legislation In the performance of our functions, we comply with the following written laws:
• Animal Welfare Act 2002
• Auditor General Act 2006
• Competition and Consumer Act 2010*
• Conservation and Land Management Act 1984
• Corruption and Crime Commission Act 2003
• Credit Act 1984
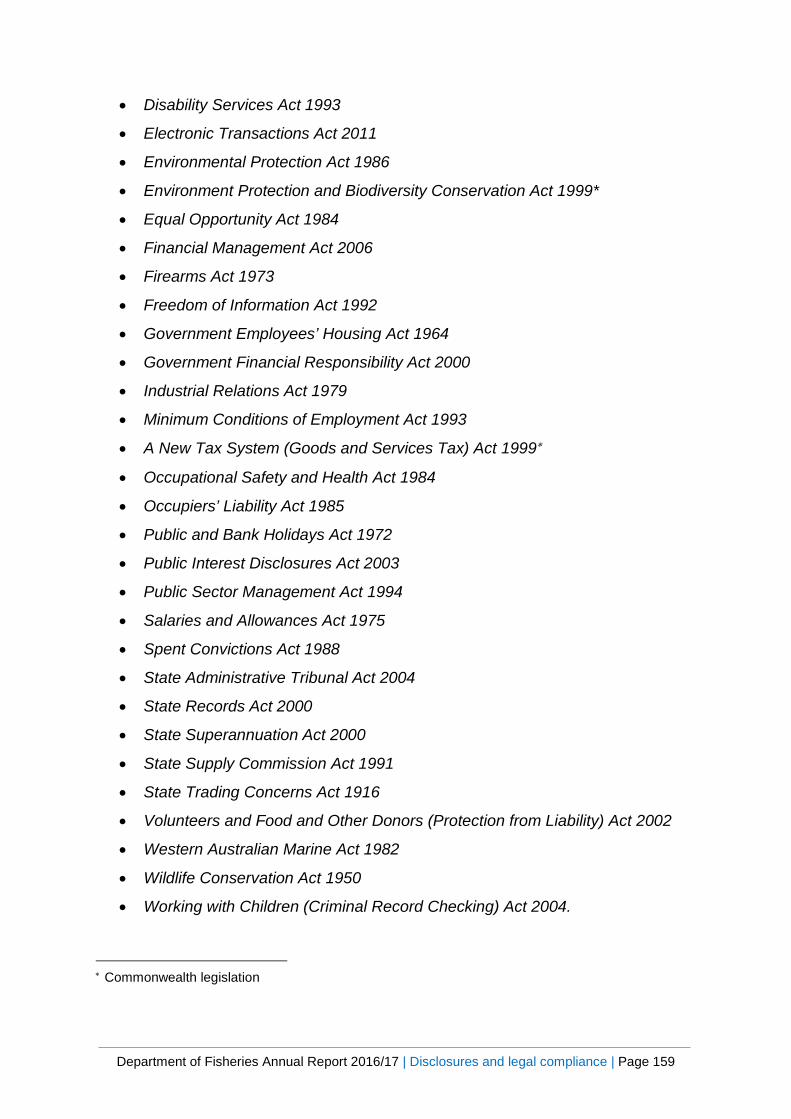
Department of Fisheries Annual Report 2016/17 | Disclosures and legal compliance | Page 159
• Disability Services Act 1993
• Electronic Transactions Act 2011
• Environmental Protection Act 1986
• Environment Protection and Biodiversity Conservation Act 1999*
• Equal Opportunity Act 1984
• Financial Management Act 2006
• Firearms Act 1973
• Freedom of Information Act 1992
• Government Employees’ Housing Act 1964
• Government Financial Responsibility Act 2000
• Industrial Relations Act 1979
• Minimum Conditions of Employment Act 1993
• A New Tax System (Goods and Services Tax) Act 1999∗
• Occupational Safety and Health Act 1984
• Occupiers’ Liability Act 1985
• Public and Bank Holidays Act 1972
• Public Interest Disclosures Act 2003
• Public Sector Management Act 1994
• Salaries and Allowances Act 1975
• Spent Convictions Act 1988
• State Administrative Tribunal Act 2004
• State Records Act 2000
• State Superannuation Act 2000
• State Supply Commission Act 1991
• State Trading Concerns Act 1916
• Volunteers and Food and Other Donors (Protection from Liability) Act 2002
• Western Australian Marine Act 1982
• Wildlife Conservation Act 1950
• Working with Children (Criminal Record Checking) Act 2004.
∗ Commonwealth legislation

Department of Fisheries Annual Report 2016/17 | Disclosures and legal compliance | Page 160
Corporate Credit Cards
Personal use – financial reporting During the year ended 30 June 2017 expenditure was incurred on the Department’s
purchasing cards for personal use, and details are as follows:
Table 5: Details of expenditure incurred on the Department’s purchasing cards for personal use
Reporting requirement: Total amount for 2016/17
Number of instances the Western Australian Government Purchasing Card has been used for a personal purpose
27
Aggregate amount of personal use expenditure for the reporting period $3,256
Aggregate amount of personal use expenditure settled by the due date $1,629
Aggregate amount of personal use expenditure settled after the period required
$1,627
The aggregate amount of personal use expenditure outstanding at the end of the reporting period
Nil
The number of referrals for disciplinary action instigated by the notifiable authority during the reporting period
Nil
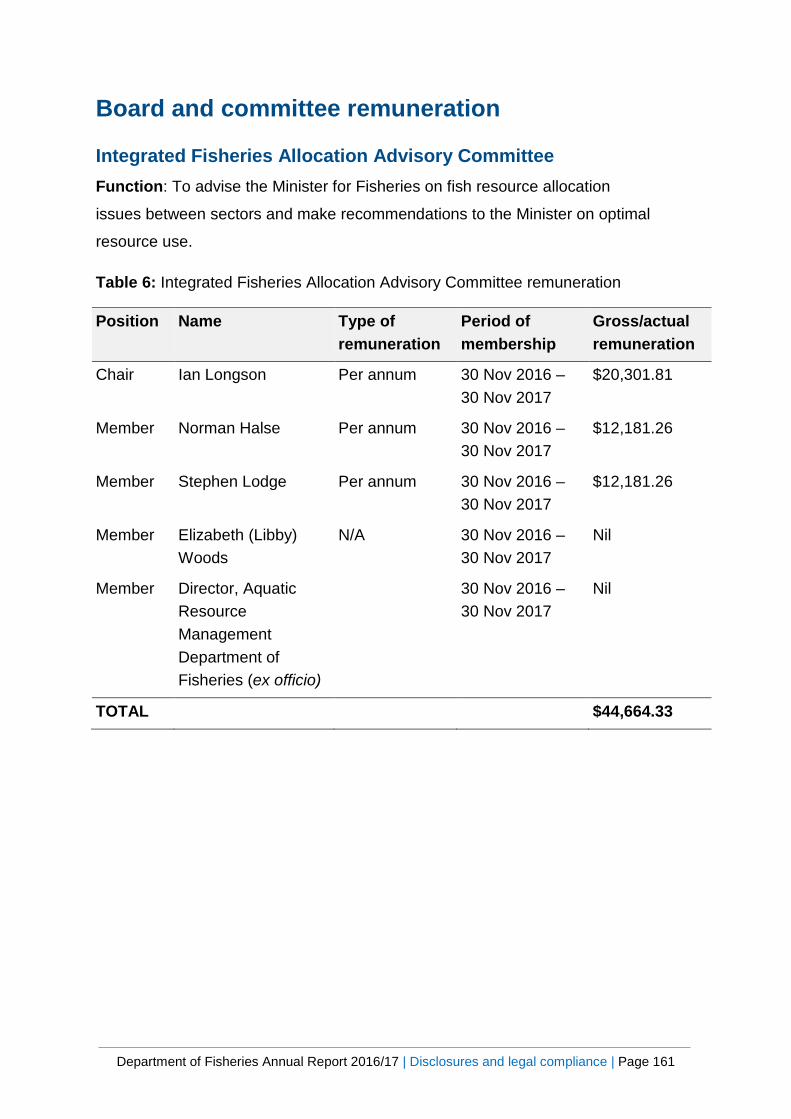
Department of Fisheries Annual Report 2016/17 | Disclosures and legal compliance | Page 161
Board and committee remuneration
Integrated Fisheries Allocation Advisory Committee Function: To advise the Minister for Fisheries on fish resource allocation
issues between sectors and make recommendations to the Minister on optimal
resource use.
Table 6: Integrated Fisheries Allocation Advisory Committee remuneration
Position Name Type of remuneration
Period of membership
Gross/actual remuneration
Chair Ian Longson Per annum 30 Nov 2016 – 30 Nov 2017
$20,301.81
Member Norman Halse Per annum 30 Nov 2016 – 30 Nov 2017
$12,181.26
Member Stephen Lodge Per annum 30 Nov 2016 – 30 Nov 2017
$12,181.26
Member Elizabeth (Libby) Woods
N/A 30 Nov 2016 – 30 Nov 2017
Nil
Member Director, Aquatic Resource Management Department of Fisheries (ex officio)
30 Nov 2016 – 30 Nov 2017
Nil
TOTAL $44,664.33

Department of Fisheries Annual Report 2016/17 | Disclosures and legal compliance | Page 162
South Coast Herring G-Trap Fishery Voluntary Fisheries Adjustment Scheme Committee of Management Function: To make recommendations to the Minister with respect to the desirability
of the establishment and implementation of a Voluntary Fisheries Adjustment
Scheme for the South Coast Herring G-Trap Fishery.
Table 7: South Coast Herring G-Trap Fishery Voluntary Fisheries Adjustment
Scheme Committee of Management remuneration
Position Name Type of remuneration
Period of membership
Gross/actual remuneration
Chair Ross Donald Per meeting 31 Jan 2017 – 30 June 2018
$591.30
Member Katherine Weber Per meeting 31 Jan 2017 – 30 June 2018
$383.25
Member Keith Tocas Per meeting 31 Jan 2017 – 30 June 2018
Nil
Member Bruno Mezzatesta N/A 31 Jan 2017 – 30 June 2018
Nil
TOTAL $974.55
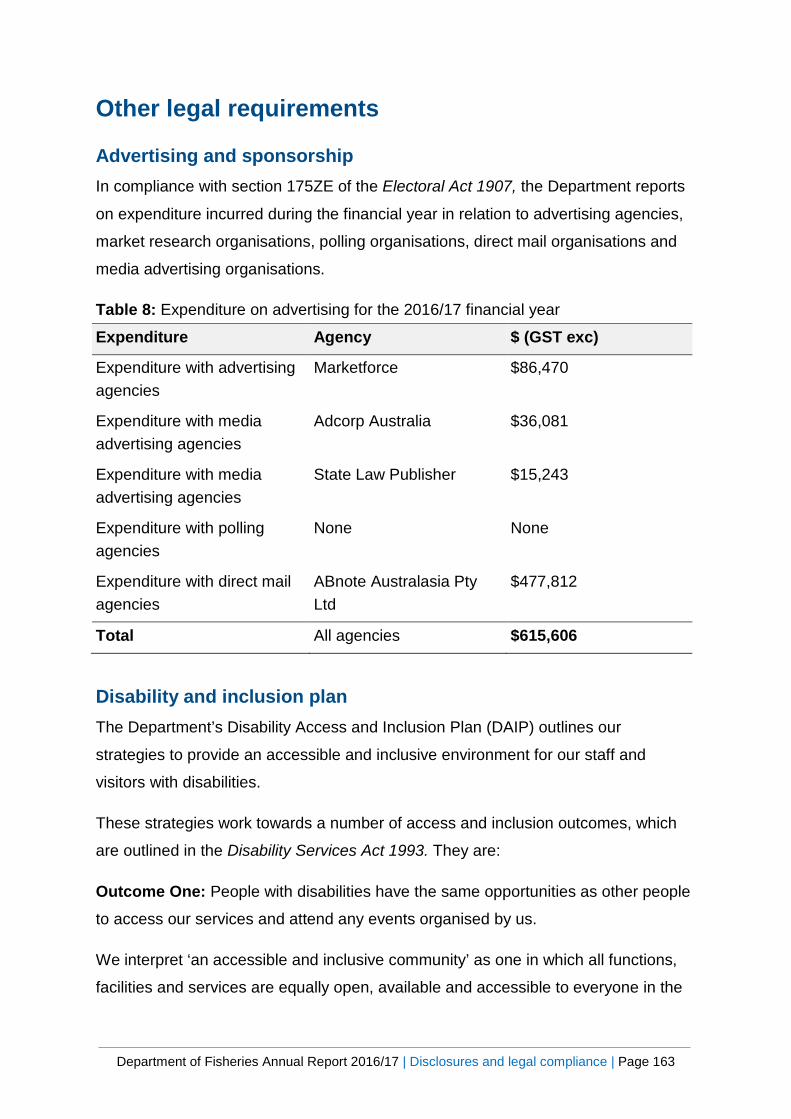
Department of Fisheries Annual Report 2016/17 | Disclosures and legal compliance | Page 163
Other legal requirements
Advertising and sponsorship In compliance with section 175ZE of the Electoral Act 1907, the Department reports
on expenditure incurred during the financial year in relation to advertising agencies,
market research organisations, polling organisations, direct mail organisations and
media advertising organisations.
Table 8: Expenditure on advertising for the 2016/17 financial year
Expenditure Agency $ (GST exc)
Expenditure with advertising agencies
Marketforce $86,470
Expenditure with media advertising agencies
Adcorp Australia
$36,081
Expenditure with media advertising agencies
State Law Publisher $15,243
Expenditure with polling agencies
None None
Expenditure with direct mail agencies
ABnote Australasia Pty Ltd
$477,812
Total All agencies $615,606
Disability and inclusion plan The Department’s Disability Access and Inclusion Plan (DAIP) outlines our
strategies to provide an accessible and inclusive environment for our staff and
visitors with disabilities.
These strategies work towards a number of access and inclusion outcomes, which
are outlined in the Disability Services Act 1993. They are:
Outcome One: People with disabilities have the same opportunities as other people
to access our services and attend any events organised by us.
We interpret ‘an accessible and inclusive community’ as one in which all functions,
facilities and services are equally open, available and accessible to everyone in the
Department of Fisheries Annual Report 2016/17 | Disclosures and legal compliance | Page 164
community, including people with disabilities, providing them with the same
opportunities, rights and responsibilities enjoyed by other members of the
community. We are committed to:
• working in partnership with community groups and other public authorities to
assist people with disabilities through improved access to information,
services and facilities;
• ensuring that our staff, volunteers, agents and contractors are aware of the
requirements of the Disability Services Act 1993;
• providing information about our services and functions on request in formats
that meet the needs of people with disabilities; and
• developing a process to promote DAIP initiatives across the Department.
Outcome Two: People with disabilities have the same opportunities as other people
to enter our buildings and use our other facilities.
Our capital works program addresses access by people with disabilities to our
buildings and facilities. We are committed to:
• ensuring that the design and construction of our buildings and facilities comply
with the Building Code of Australia (BCA) and the Commonwealth Disability
Discrimination Act (DDA) Access to Premises Standards;
• ensuring we have appropriate signage for people with disabilities;
• conducting audits to identify access barriers to premises; and
• implementing work health and safety emergency evacuation procedures.
Outcome Three: People with disabilities receive information from us in a format that
will enable them to readily access it. We are committed to:
• improving community awareness by providing information in appropriate
alternative formats;
• ensuring staff know how to obtain information in other formats when
necessary and can advise people with disabilities or their carers;
• investigating and facilitating the use of interpreters to improve the accessibility
of our meetings and events for people with a hearing impairment; and
• ensuring our information, including the website, meets accessibility standards.
Department of Fisheries Annual Report 2016/17 | Disclosures and legal compliance | Page 165
Outcome Four: People with disabilities receive the same level and quality of service
from our staff as other people. We are committed to:
• improving staff awareness of disability and access issues and improving skills
to provide a good service to people with disabilities;
• improving awareness of new and existing staff about disability and access
issues; and
• generating and sustaining staff awareness of disability and access issues.
Outcome Five: People with disabilities have the same opportunities as other people
to complain to us. We are committed to:
• ensuring that current grievance mechanisms are accessible for people with
disabilities; and
• providing training to new and existing customer service staff on handling
complaints from people with disabilities.
Outcome Six: People with disabilities have the same opportunities as other people
to participate in any public consultation. We are committed to:
• improving community awareness about consultation processes; and
• monitoring of the DAIP to ensure implementation and satisfactory outcomes.
Outcome Seven: People with disabilities have the same opportunities as other
people to obtain and maintain employment with a public authority.
We review inclusive recruitment practices and support employees with disabilities.
We are committed to:
• ensuring all recruitment policies, procedures, templates, language and
formats are inclusive of people with disabilities; and
• ensuring all documents relating to recruitment are made available promptly in
alternative formats upon request.
Department of Fisheries Annual Report 2016/17 | Disclosures and legal compliance | Page 166
Compliance with public sector standards and ethical codes During 2016/17, seven compliance matters arose regarding public sector standards
and ethical codes within the Department. Two disciplinary matters are ongoing, one
matter was discontinued, one matter was completed with a finding that no breach
occurred, and three matters were substantiated as breaches of discipline.
There were two breach claims lodged against the Employment Standard and one
against the Grievance Standard. All three claims were investigated by the Public
Sector Commission and found to be unsubstantiated.
Actions that were implemented in the cases where breaches of discipline were
substantiated included additional training, formal reprimands, a transfer, and
termination of employment.
Our efforts to support compliance with the public sector standards and ethical codes
include:
• Participation in a Public Sector Commission-led review of our misconduct
management arrangements;
• The development and delivery of a tailored misconduct risk management
course for the Department’s covert operations group;
• Updating our grievance management policy and procedures to reflect our
learnings of best practice and to clarify areas where ambiguity existed;
• Developing an agreed list of behaviours that support our values, and also a
list that illustrate behaviours that do not fit our values.
• The development of a ‘Filling a Vacancy Policy’.
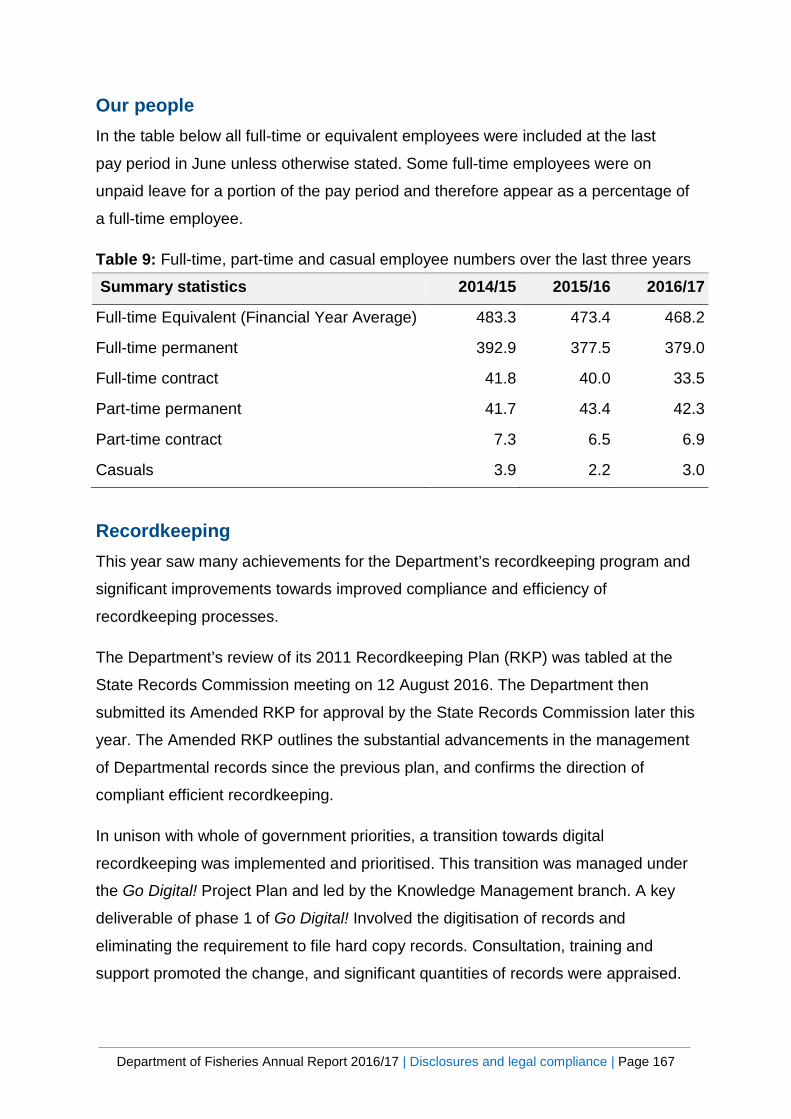
Department of Fisheries Annual Report 2016/17 | Disclosures and legal compliance | Page 167
Our people In the table below all full-time or equivalent employees were included at the last
pay period in June unless otherwise stated. Some full-time employees were on
unpaid leave for a portion of the pay period and therefore appear as a percentage of
a full-time employee.
Table 9: Full-time, part-time and casual employee numbers over the last three years
Summary statistics 2014/15 2015/16 2016/17
Full-time Equivalent (Financial Year Average) 483.3 473.4 468.2
Full-time permanent 392.9 377.5 379.0
Full-time contract 41.8 40.0 33.5
Part-time permanent 41.7 43.4 42.3
Part-time contract 7.3 6.5 6.9
Casuals 3.9 2.2 3.0
Recordkeeping This year saw many achievements for the Department’s recordkeeping program and
significant improvements towards improved compliance and efficiency of
recordkeeping processes.
The Department’s review of its 2011 Recordkeeping Plan (RKP) was tabled at the
State Records Commission meeting on 12 August 2016. The Department then
submitted its Amended RKP for approval by the State Records Commission later this
year. The Amended RKP outlines the substantial advancements in the management
of Departmental records since the previous plan, and confirms the direction of
compliant efficient recordkeeping.
In unison with whole of government priorities, a transition towards digital
recordkeeping was implemented and prioritised. This transition was managed under
the Go Digital! Project Plan and led by the Knowledge Management branch. A key
deliverable of phase 1 of Go Digital! Involved the digitisation of records and
eliminating the requirement to file hard copy records. Consultation, training and
support promoted the change, and significant quantities of records were appraised.
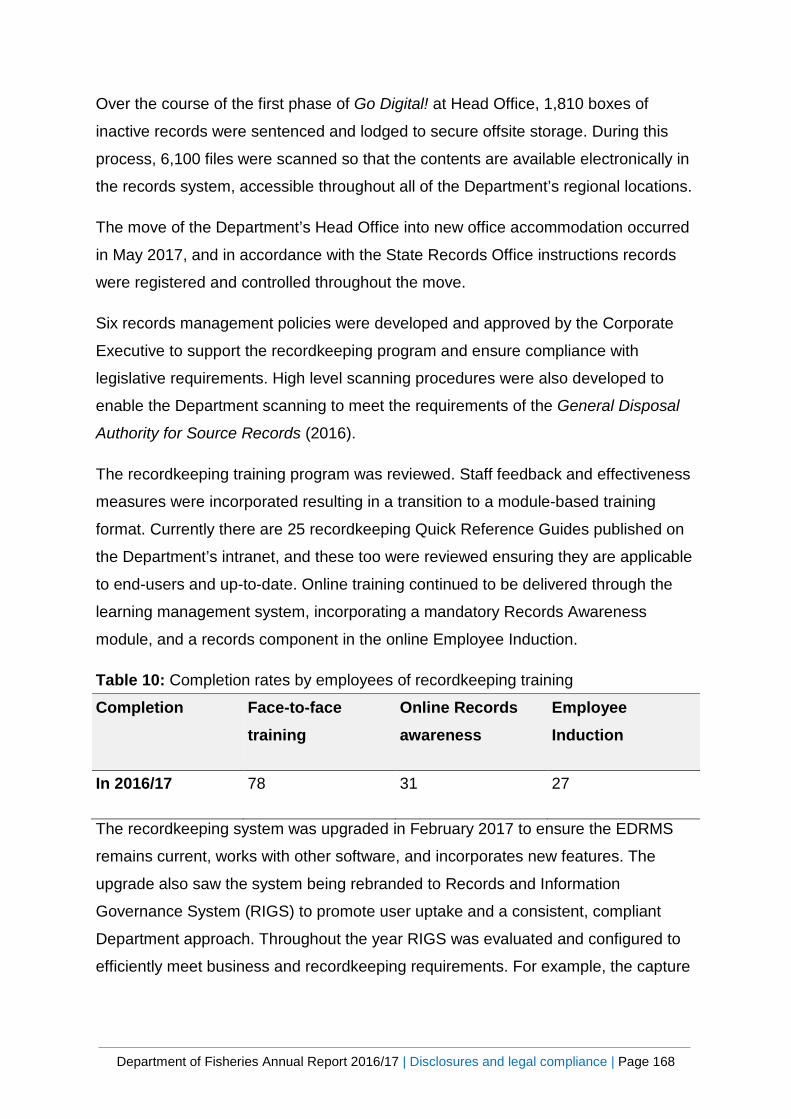
Department of Fisheries Annual Report 2016/17 | Disclosures and legal compliance | Page 168
Over the course of the first phase of Go Digital! at Head Office, 1,810 boxes of
inactive records were sentenced and lodged to secure offsite storage. During this
process, 6,100 files were scanned so that the contents are available electronically in
the records system, accessible throughout all of the Department’s regional locations.
The move of the Department’s Head Office into new office accommodation occurred
in May 2017, and in accordance with the State Records Office instructions records
were registered and controlled throughout the move.
Six records management policies were developed and approved by the Corporate
Executive to support the recordkeeping program and ensure compliance with
legislative requirements. High level scanning procedures were also developed to
enable the Department scanning to meet the requirements of the General Disposal
Authority for Source Records (2016).
The recordkeeping training program was reviewed. Staff feedback and effectiveness
measures were incorporated resulting in a transition to a module-based training
format. Currently there are 25 recordkeeping Quick Reference Guides published on
the Department’s intranet, and these too were reviewed ensuring they are applicable
to end-users and up-to-date. Online training continued to be delivered through the
learning management system, incorporating a mandatory Records Awareness
module, and a records component in the online Employee Induction.
Table 10: Completion rates by employees of recordkeeping training
Completion Face-to-face training
Online Records awareness
Employee Induction
In 2016/17 78 31 27
The recordkeeping system was upgraded in February 2017 to ensure the EDRMS
remains current, works with other software, and incorporates new features. The
upgrade also saw the system being rebranded to Records and Information
Governance System (RIGS) to promote user uptake and a consistent, compliant
Department approach. Throughout the year RIGS was evaluated and configured to
efficiently meet business and recordkeeping requirements. For example, the capture
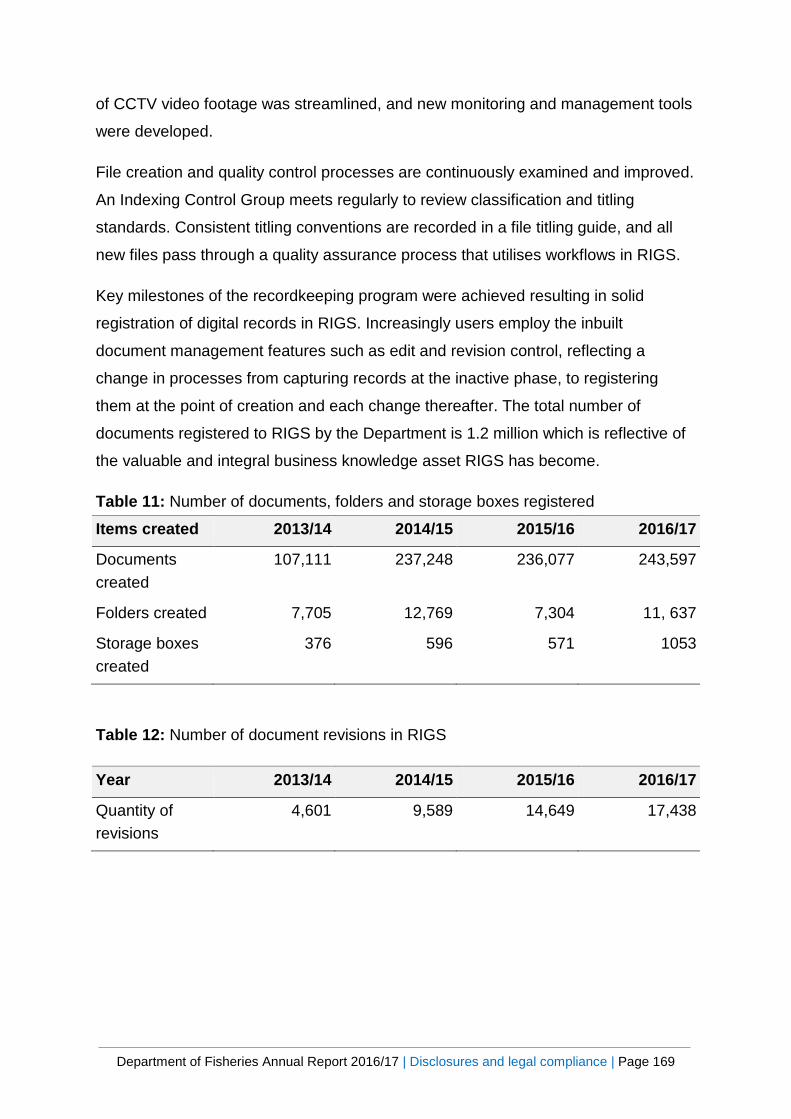
Department of Fisheries Annual Report 2016/17 | Disclosures and legal compliance | Page 169
of CCTV video footage was streamlined, and new monitoring and management tools
were developed.
File creation and quality control processes are continuously examined and improved.
An Indexing Control Group meets regularly to review classification and titling
standards. Consistent titling conventions are recorded in a file titling guide, and all
new files pass through a quality assurance process that utilises workflows in RIGS.
Key milestones of the recordkeeping program were achieved resulting in solid
registration of digital records in RIGS. Increasingly users employ the inbuilt
document management features such as edit and revision control, reflecting a
change in processes from capturing records at the inactive phase, to registering
them at the point of creation and each change thereafter. The total number of
documents registered to RIGS by the Department is 1.2 million which is reflective of
the valuable and integral business knowledge asset RIGS has become.
Table 11: Number of documents, folders and storage boxes registered
Items created 2013/14 2014/15 2015/16 2016/17
Documents created
107,111 237,248 236,077 243,597
Folders created 7,705 12,769 7,304 11, 637
Storage boxes created
376 596 571 1053
Table 12: Number of document revisions in RIGS
Year 2013/14 2014/15 2015/16 2016/17
Quantity of revisions
4,601 9,589 14,649 17,438
Department of Fisheries Annual Report 2016/17 | Disclosures and legal compliance | Page 170
Public interest disclosures (Public Interest Disclosure Act 2003, S23(1)(f))The Public Interest Disclosure Act
2003 requires the Department to:
• facilitate disclosure of public interest information;
• provide protection to those who make disclosures; and
• provide protection for those who are the subject of a disclosure.
In accordance with the Act, the Department has duly appointed public interest
disclosure officers and has published internal policies and procedures related to
its obligations.
One public interest disclosure was received during 2016/17.
Department of Fisheries Annual Report 2016/17 | Disclosures and legal compliance | Page 171
Government policy requirements
Substantive equality We are committed to communicating and engaging effectively and appropriately with
our culturally diverse stakeholders. Examples of ways we have done this include:
• a translation function on our website allowing visitors to translate content on
the site into more than 30 languages;
• legislative recognition of the customary fishing rights of Indigenous Australian
fishers exempting them from recreational fishing licences;
• production of a number of multilingual publications including our crab fishing
brochure for the west coast region in Vietnamese, Cantonese, Mandarin,
Korean, Malay (Bahasa) Bahasa Melyu on our website);
• a concerted campaign to engage with recreational crab fishers in the
Peel-Harvey Estuary whose first language is not English, including through
multi-lingual publicity materials, community newspaper advertising and
advertising on a Chinese community website; and
• support for Fishers with Disabilities, a not for profit organisation that seeks to
provide fishing opportunities for people with disabilities.
Occupational health, safety and injury management The Department’s Occupational Safety and Health (OSH) team and committee spent
the year progressing the action items in its OSH Improvement Plan. These have
included our Corporate Executive undertaking systematic tracking of items identified
as high-risk in the plan, consolidating the different risk assessment forms used
across the Department to the one ‘Safe Work Method Statement’ template, and the
development and implementation of several online risk management courses.
We reviewed our Injury Management Procedure, which focuses on returning
employees to the workplace following a physical or mental health issue or injury. We
continue to have a strong focus on the mental, as well as physical, health of our
employees and as such have reviewed our EAP providers to ensure everyone can
access professional help, assistance or advice as and when they require it.

Department of Fisheries Annual Report 2016/17 | Disclosures and legal compliance | Page 172
Table 13: Occupational safety and health injury management performance against key indicators
Measure Actual results 2015/16
Actual results 2016/17
Results against target
Comment on results
Number of Fatalities 0% 0% 0% Target achieved
Lost time injury incidence rate
0.21% 0.15% < 10% reduction
Target achieved
Lost time injury severity rate 0% 0% < 10% reduction
Target achieved
Percentage of injured workers returned to work within 13 weeks
66.67%
100%
> 80% Not achieved still have one RTWP – restricted duties
Percentage of injured workers returned to work within 26 weeks
0% 0% Not applicable
Not applicable
Percentage of managers trained in occupational safety, health and injury management responsibilities
95%
100%
> 80%
Target achieved
Note: In the table above, calculations are consistent with the requirements of the
Public Sector Commission (PSC) Circular 2012-05 and the Code of Practice:
Occupational Safety and Health in the Western Australian Public Sector: 2007
Government building training policy No contracts have been issued that are within the scope of the policy.
Department of Fisheries Annual Report 2016/17 | Appendices | Page 173
Appendices

Department of Fisheries Annual Report 2016/17 | Appendices | Page 174
Appendix 1 – Stock status and catch ranges for major fisheries
A summary of the sustainability status for individual fisheries under management is
provided in the tables below. The term ‘sustainable' is given to those fisheries where
the breeding stocks are considered adequate as well as to fisheries in which
breeding stocks are recovering.
Fisheries assessed as 'inadequate' or ‘environmentally limited’ include those
fisheries where additional actions need to be taken or confirmation is required to
ensure the breeding stocks are either adequate or are now recovering. The term
‘overfished’ is only given to those fisheries that are inadequate due to exploitation
(i.e. overfishing) that have been identified but for which definitive management
actions have yet to be fully implemented.
More detailed information on the management status and future directions of
commercial fisheries, recreational fisheries and aquaculture industries can be viewed
in the Status Reports of the Fisheries and Aquatic Resources of Western Australia
(State of the Fisheries).
Key: Sustainable Additional actions have been undertaken Stocks are inadequate Stocks are inadequate due to environmental conditions Not assessed

Department of Fisheries Annual Report 2016/17 | Appendices | Page 175
West Coast Bioregion
West Coast Rock Lobster
Criteria Outcome
Status Sustainable
Stock assessment complete Yes
Breeding stock assessment Adequate
Allowable catch (effort) tolerance ranges Commercial: 6,000 t (TACC 2016) Recreational: 422 t (TARC 2015/16)
Commercial catch for 2016 6,087 t (includes 1.5% for drip loss)
Recreational catch (95% CI) for 2015/16 season
272-400 t (1) 346-481 t (2)
Catch (or effort) level acceptable Commercial: Yes Recreational: Yes
(1) based on historical data; (2) based on updated average weight data for
metropolitan region. A full review of methods used for estimating recreational catch
is underway.
Roe’s Abalone Criteria Outcome
Status Sustainable
Stock assessment complete Yes
Breeding stock assessment Adequate (open areas)
Allowable catch (effort) tolerance range Commercial: 87t (TACC) (530-640 days) Recreational: 18-22t (TARC) Perth Metro Area
Commercial catch (and effort) for season 2016
49 t (383 days)
Recreational catch (95% CI) for 2015/16 season
26-30 t Perth Metro Area 14 t Other
Catch (or effort) level acceptable Commercial: Yes Recreational: Yes
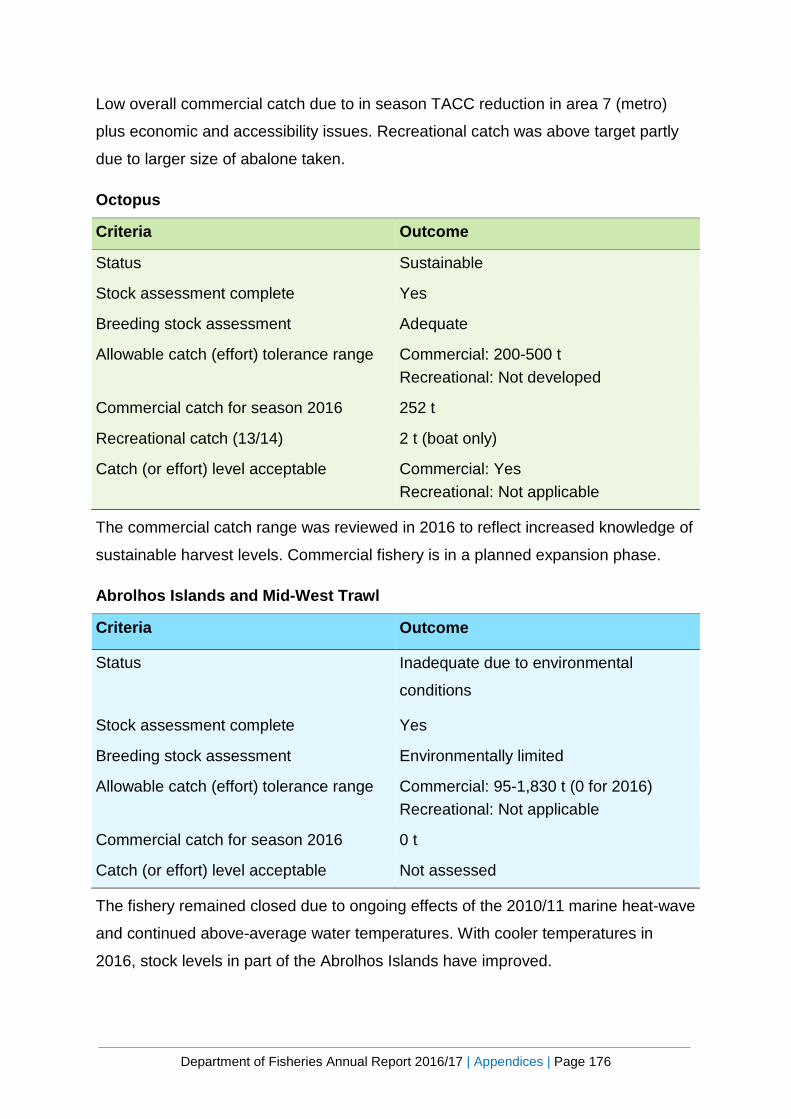
Department of Fisheries Annual Report 2016/17 | Appendices | Page 176
Low overall commercial catch due to in season TACC reduction in area 7 (metro)
plus economic and accessibility issues. Recreational catch was above target partly
due to larger size of abalone taken.
Octopus
Criteria Outcome
Status Sustainable
Stock assessment complete Yes
Breeding stock assessment Adequate
Allowable catch (effort) tolerance range Commercial: 200-500 t Recreational: Not developed
Commercial catch for season 2016 252 t
Recreational catch (13/14) 2 t (boat only)
Catch (or effort) level acceptable Commercial: Yes Recreational: Not applicable
The commercial catch range was reviewed in 2016 to reflect increased knowledge of
sustainable harvest levels. Commercial fishery is in a planned expansion phase.
Abrolhos Islands and Mid-West Trawl
Criteria Outcome
Status Inadequate due to environmental
conditions
Stock assessment complete Yes
Breeding stock assessment Environmentally limited
Allowable catch (effort) tolerance range Commercial: 95-1,830 t (0 for 2016) Recreational: Not applicable
Commercial catch for season 2016 0 t
Catch (or effort) level acceptable Not assessed
The fishery remained closed due to ongoing effects of the 2010/11 marine heat-wave
and continued above-average water temperatures. With cooler temperatures in
2016, stock levels in part of the Abrolhos Islands have improved.
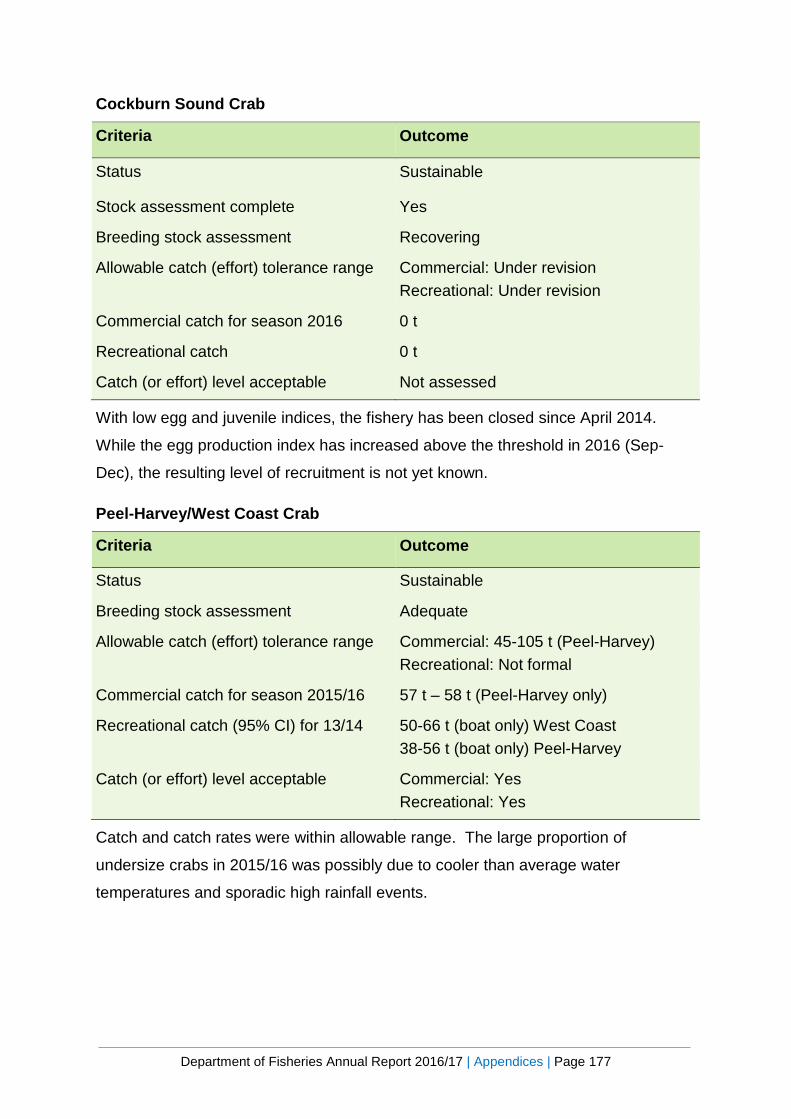
Department of Fisheries Annual Report 2016/17 | Appendices | Page 177
Cockburn Sound Crab
Criteria Outcome
Status Sustainable
Stock assessment complete Yes
Breeding stock assessment Recovering
Allowable catch (effort) tolerance range Commercial: Under revision Recreational: Under revision
Commercial catch for season 2016 0 t
Recreational catch 0 t
Catch (or effort) level acceptable Not assessed
With low egg and juvenile indices, the fishery has been closed since April 2014.
While the egg production index has increased above the threshold in 2016 (Sep-
Dec), the resulting level of recruitment is not yet known.
Peel-Harvey/West Coast Crab
Criteria Outcome
Status Sustainable
Breeding stock assessment Adequate
Allowable catch (effort) tolerance range Commercial: 45-105 t (Peel-Harvey) Recreational: Not formal
Commercial catch for season 2015/16 57 t – 58 t (Peel-Harvey only)
Recreational catch (95% CI) for 13/14 50-66 t (boat only) West Coast 38-56 t (boat only) Peel-Harvey
Catch (or effort) level acceptable Commercial: Yes Recreational: Yes
Catch and catch rates were within allowable range. The large proportion of
undersize crabs in 2015/16 was possibly due to cooler than average water
temperatures and sporadic high rainfall events.

Department of Fisheries Annual Report 2016/17 | Appendices | Page 178
West Coast Nearshore and Estuarine Finfish
Criteria Outcome
Status Inadequate/actions taken
Stock assessment complete Yes
Breeding stock assessment Adequate – Mullet/Whiting Actions taken – Herring Inadequate – Southern garfish
Allowable catch (effort) tolerance range Commercial: Peel-Harvey: 46-166 t Herring: Under review Recreational: Not developed
Commercial catch for season 2016 Peel-Harvey: 128 t (all species) Herring: statewide 72 t WCB 49 t
Recreational catch (95% CI) for 13/14 survey
69-87 t (boat only, top 10 species)
Catch (or effort) level acceptable Commercial: Yes Recreational: Not assessed.
Status of herring stock to be reviewed in 2017 using a level 3 assessment. New
management arrangements for garfish are being developed.
West Coast Beach Bait and South West Beach Seine
Criteria Outcome
Status Sustainable
Stock assessment complete Yes
Breeding stock assessment Adequate
Allowable catch (effort) tolerance range Commercial: 60-275 t (whitebait only) Recreational: Not applicable
Commercial catch for season 2015/16 34 t (whitebait only)
Catch (or effort) level acceptable Commercial: No Recreational: Not applicable
Available evidence suggests gradual decline in whitebait stock level over the past
decade in line with environmental shifts requiring a review of the acceptable catch
range.
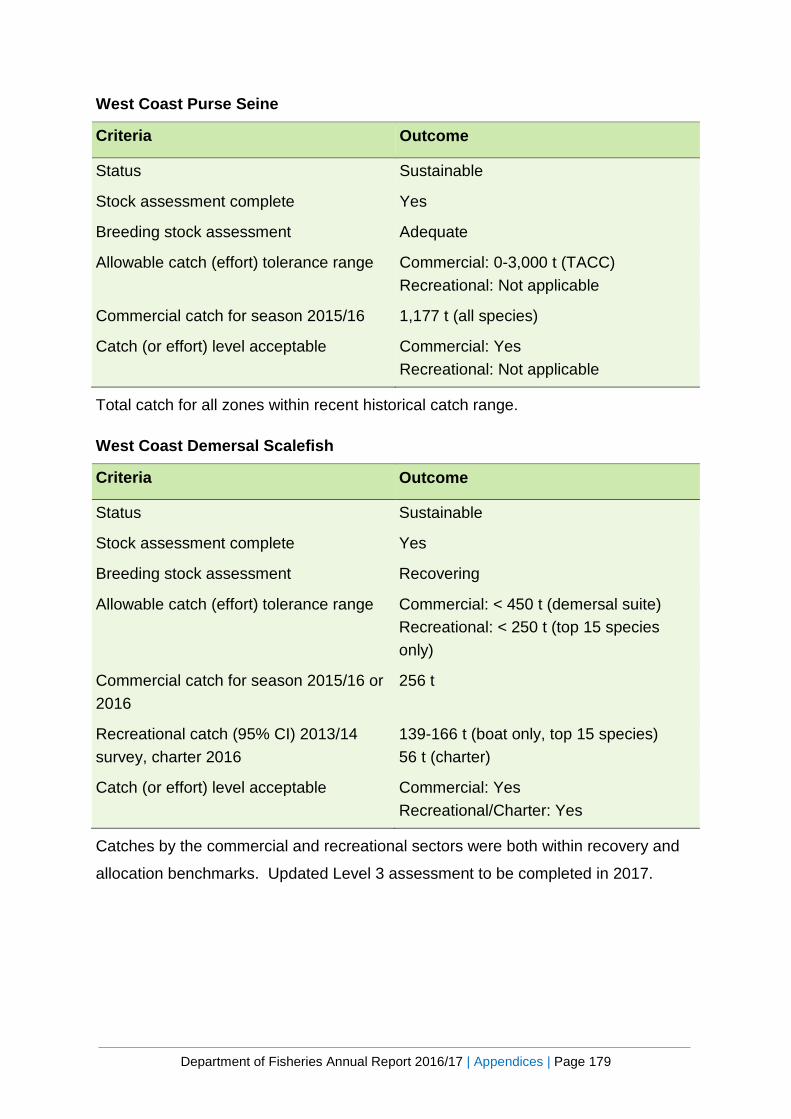
Department of Fisheries Annual Report 2016/17 | Appendices | Page 179
West Coast Purse Seine
Criteria Outcome
Status Sustainable
Stock assessment complete Yes
Breeding stock assessment Adequate
Allowable catch (effort) tolerance range Commercial: 0-3,000 t (TACC) Recreational: Not applicable
Commercial catch for season 2015/16 1,177 t (all species)
Catch (or effort) level acceptable Commercial: Yes Recreational: Not applicable
Total catch for all zones within recent historical catch range.
West Coast Demersal Scalefish
Criteria Outcome
Status Sustainable
Stock assessment complete Yes
Breeding stock assessment Recovering
Allowable catch (effort) tolerance range Commercial: < 450 t (demersal suite) Recreational: < 250 t (top 15 species only)
Commercial catch for season 2015/16 or 2016
256 t
Recreational catch (95% CI) 2013/14 survey, charter 2016
139-166 t (boat only, top 15 species) 56 t (charter)
Catch (or effort) level acceptable Commercial: Yes Recreational/Charter: Yes
Catches by the commercial and recreational sectors were both within recovery and
allocation benchmarks. Updated Level 3 assessment to be completed in 2017.

Department of Fisheries Annual Report 2016/17 | Appendices | Page 180
Gascoyne Coast Bioregion
Shark Bay Prawn
Criteria Outcome
Status Sustainable
Stock assessment complete Yes
Breeding stock assessment Adequate
Allowable catch (effort) tolerance range Commercial: 1,350-2,150 t Recreational: Not applicable
Commercial catch for season 2016 1,524 t
Catch (or effort) level acceptable Commercial: Yes Recreational: Not applicable
Western king and brown tiger prawn annual landings were within their respective
acceptable ranges.
Exmouth Gulf Prawn
Criteria Outcome
Status Sustainable
Stock assessment complete Yes
Breeding stock assessment Adequate
Allowable catch (effort) tolerance range Commercial: 771-1,276 t Recreational: Not applicable
Commercial catch for season 2016 822 t
Catch (or effort) level acceptable Commercial: Yes Recreational: Not applicable
Landings of brown tiger and endeavor prawns were within their acceptable range,
western king prawns were below their acceptable range but spawning stock above
the threshold.
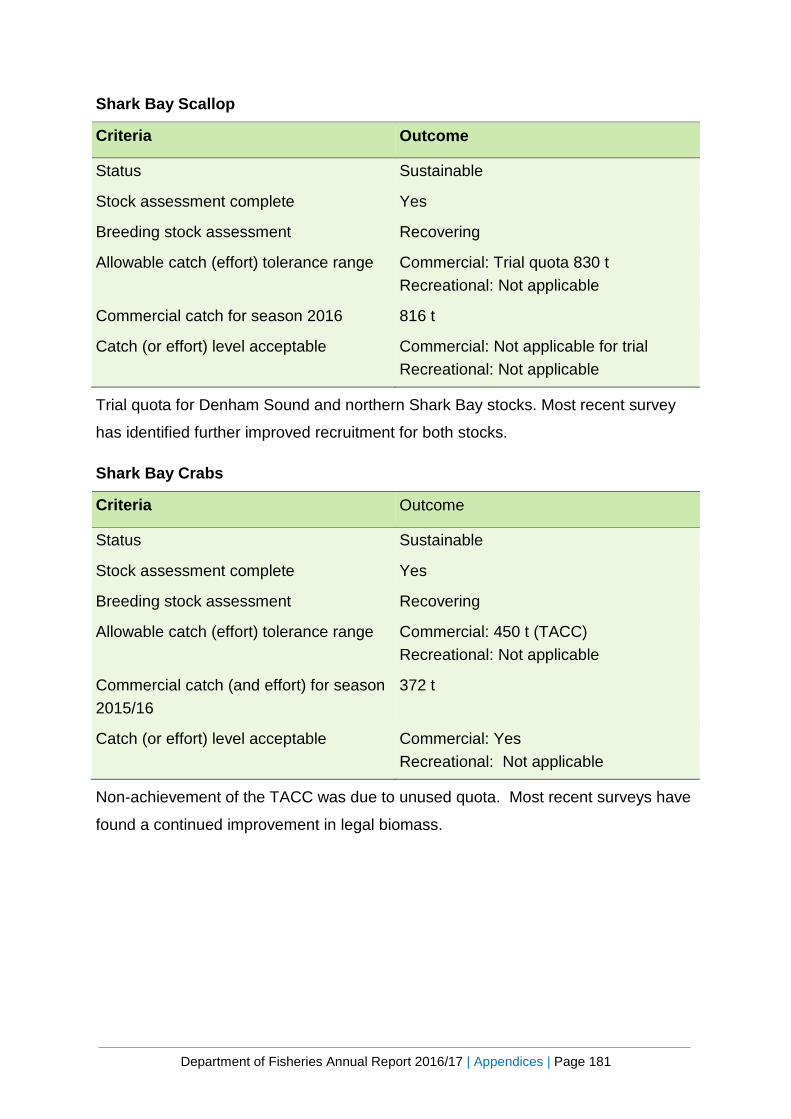
Department of Fisheries Annual Report 2016/17 | Appendices | Page 181
Shark Bay Scallop
Criteria Outcome
Status Sustainable
Stock assessment complete Yes
Breeding stock assessment Recovering
Allowable catch (effort) tolerance range Commercial: Trial quota 830 t Recreational: Not applicable
Commercial catch for season 2016 816 t
Catch (or effort) level acceptable Commercial: Not applicable for trial Recreational: Not applicable
Trial quota for Denham Sound and northern Shark Bay stocks. Most recent survey
has identified further improved recruitment for both stocks.
Shark Bay Crabs
Criteria Outcome
Status Sustainable
Stock assessment complete Yes
Breeding stock assessment Recovering
Allowable catch (effort) tolerance range Commercial: 450 t (TACC) Recreational: Not applicable
Commercial catch (and effort) for season 2015/16
372 t
Catch (or effort) level acceptable Commercial: Yes Recreational: Not applicable
Non-achievement of the TACC was due to unused quota. Most recent surveys have
found a continued improvement in legal biomass.
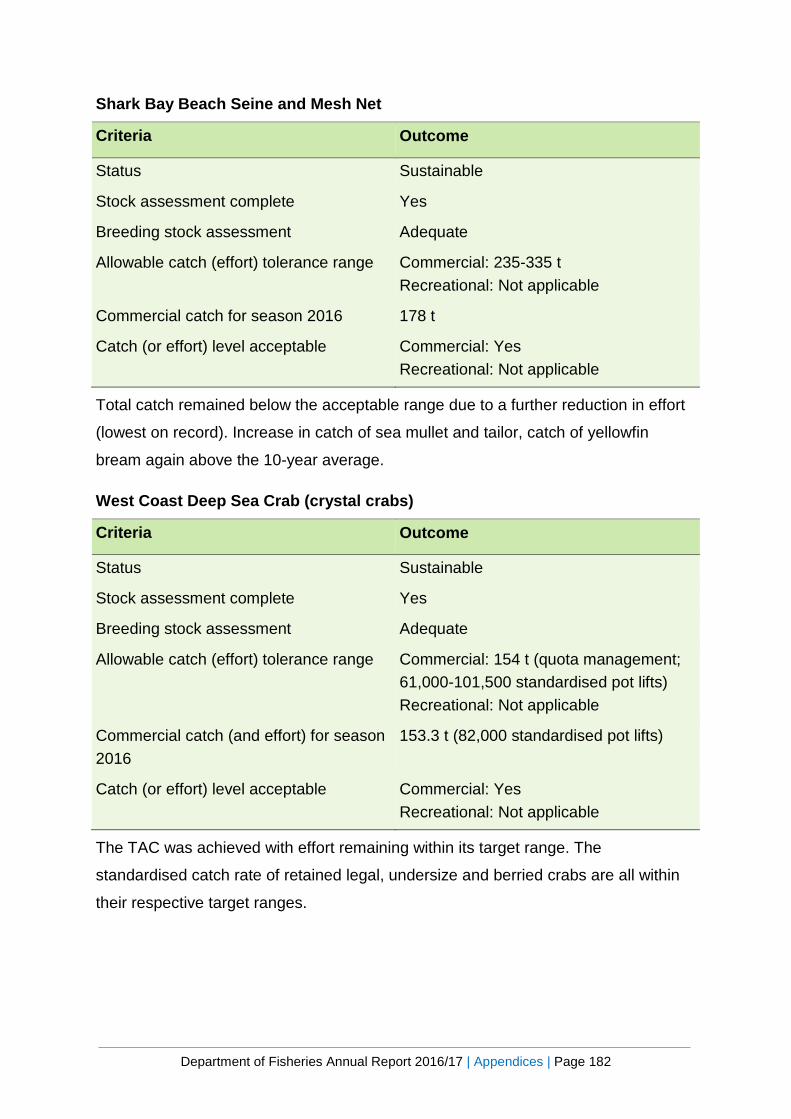
Department of Fisheries Annual Report 2016/17 | Appendices | Page 182
Shark Bay Beach Seine and Mesh Net
Criteria Outcome
Status Sustainable
Stock assessment complete Yes
Breeding stock assessment Adequate
Allowable catch (effort) tolerance range Commercial: 235-335 t Recreational: Not applicable
Commercial catch for season 2016 178 t
Catch (or effort) level acceptable Commercial: Yes Recreational: Not applicable
Total catch remained below the acceptable range due to a further reduction in effort
(lowest on record). Increase in catch of sea mullet and tailor, catch of yellowfin
bream again above the 10-year average.
West Coast Deep Sea Crab (crystal crabs)
Criteria Outcome
Status Sustainable
Stock assessment complete Yes
Breeding stock assessment Adequate
Allowable catch (effort) tolerance range Commercial: 154 t (quota management; 61,000-101,500 standardised pot lifts) Recreational: Not applicable
Commercial catch (and effort) for season 2016
153.3 t (82,000 standardised pot lifts)
Catch (or effort) level acceptable Commercial: Yes Recreational: Not applicable
The TAC was achieved with effort remaining within its target range. The
standardised catch rate of retained legal, undersize and berried crabs are all within
their respective target ranges.
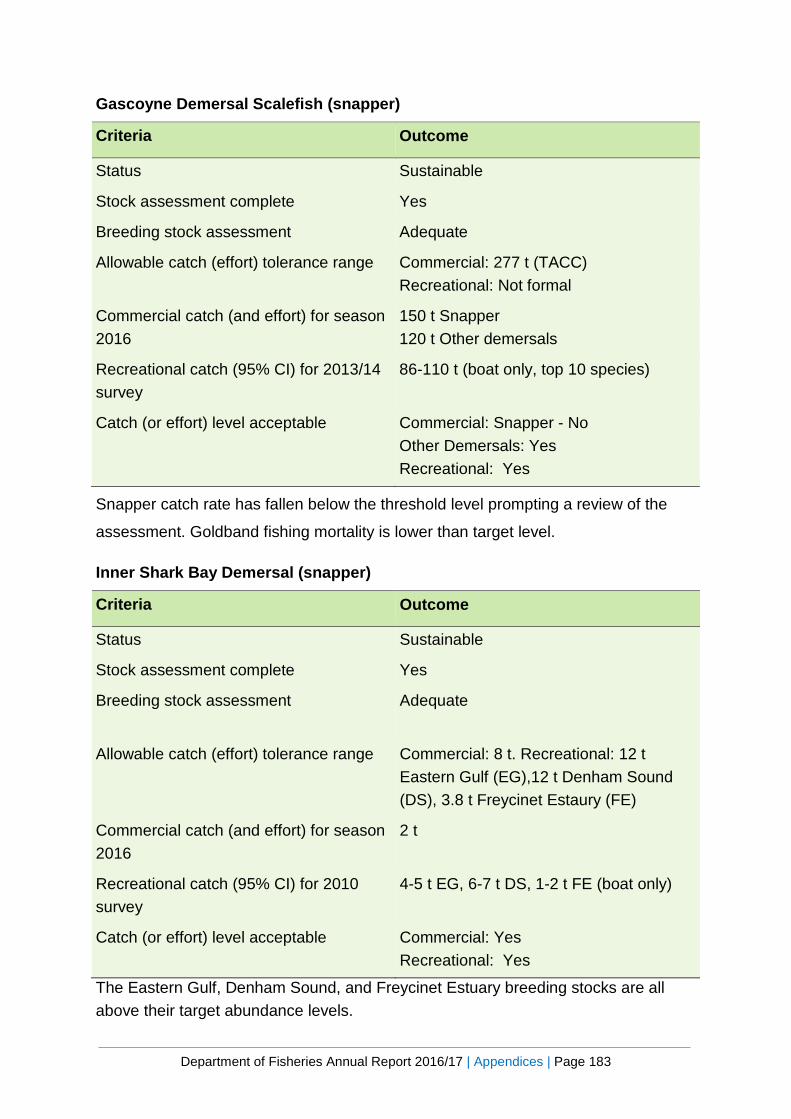
Department of Fisheries Annual Report 2016/17 | Appendices | Page 183
Gascoyne Demersal Scalefish (snapper)
Criteria Outcome
Status Sustainable
Stock assessment complete Yes
Breeding stock assessment Adequate
Allowable catch (effort) tolerance range Commercial: 277 t (TACC) Recreational: Not formal
Commercial catch (and effort) for season 2016
150 t Snapper 120 t Other demersals
Recreational catch (95% CI) for 2013/14 survey
86-110 t (boat only, top 10 species)
Catch (or effort) level acceptable Commercial: Snapper - No Other Demersals: Yes Recreational: Yes
Snapper catch rate has fallen below the threshold level prompting a review of the
assessment. Goldband fishing mortality is lower than target level.
Inner Shark Bay Demersal (snapper)
Criteria Outcome
Status Sustainable
Stock assessment complete Yes
Breeding stock assessment Adequate
Allowable catch (effort) tolerance range Commercial: 8 t. Recreational: 12 t Eastern Gulf (EG),12 t Denham Sound (DS), 3.8 t Freycinet Estaury (FE)
Commercial catch (and effort) for season 2016
2 t
Recreational catch (95% CI) for 2010 survey
4-5 t EG, 6-7 t DS, 1-2 t FE (boat only)
Catch (or effort) level acceptable Commercial: Yes Recreational: Yes
The Eastern Gulf, Denham Sound, and Freycinet Estuary breeding stocks are all above their target abundance levels.
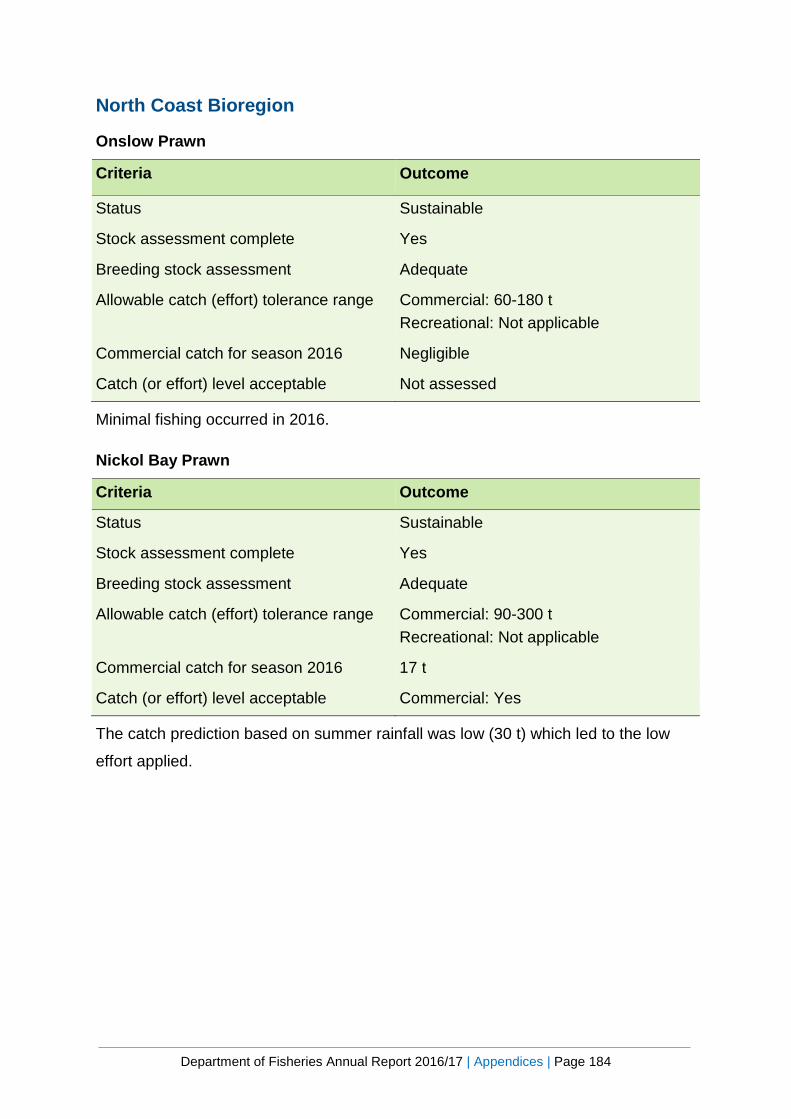
Department of Fisheries Annual Report 2016/17 | Appendices | Page 184
North Coast Bioregion
Onslow Prawn
Criteria Outcome
Status Sustainable
Stock assessment complete Yes
Breeding stock assessment Adequate
Allowable catch (effort) tolerance range Commercial: 60-180 t Recreational: Not applicable
Commercial catch for season 2016 Negligible
Catch (or effort) level acceptable Not assessed
Minimal fishing occurred in 2016.
Nickol Bay Prawn
Criteria Outcome
Status Sustainable
Stock assessment complete Yes
Breeding stock assessment Adequate
Allowable catch (effort) tolerance range Commercial: 90-300 t Recreational: Not applicable
Commercial catch for season 2016 17 t
Catch (or effort) level acceptable Commercial: Yes
The catch prediction based on summer rainfall was low (30 t) which led to the low
effort applied.

Department of Fisheries Annual Report 2016/17 | Appendices | Page 185
Broome Prawn
Criteria Outcome
Status Sustainable
Stock assessment complete Yes
Breeding stock assessment Adequate
Allowable catch (effort) tolerance range Commercial: 55-260 t Recreational: Not applicable
Commercial catch for season 2016 Negligible
Catch (or effort) level acceptable Not assessed.
Minimal fishing occurred in 2016.
Kimberley Prawn
Criteria Outcome
Status Sustainable
Stock assessment complete Yes
Breeding stock assessment Adequate
Allowable catch (effort) tolerance range Commercial: 240-500 t Recreational: Not applicable
Commercial catch for season 2016 155 t
Catch (or effort) level acceptable Commercial: Yes Recreational: Not applicable
With landings of banana prawns below the catch prediction, the total catch was low
due to drop in fishing effort in the second part of the season.
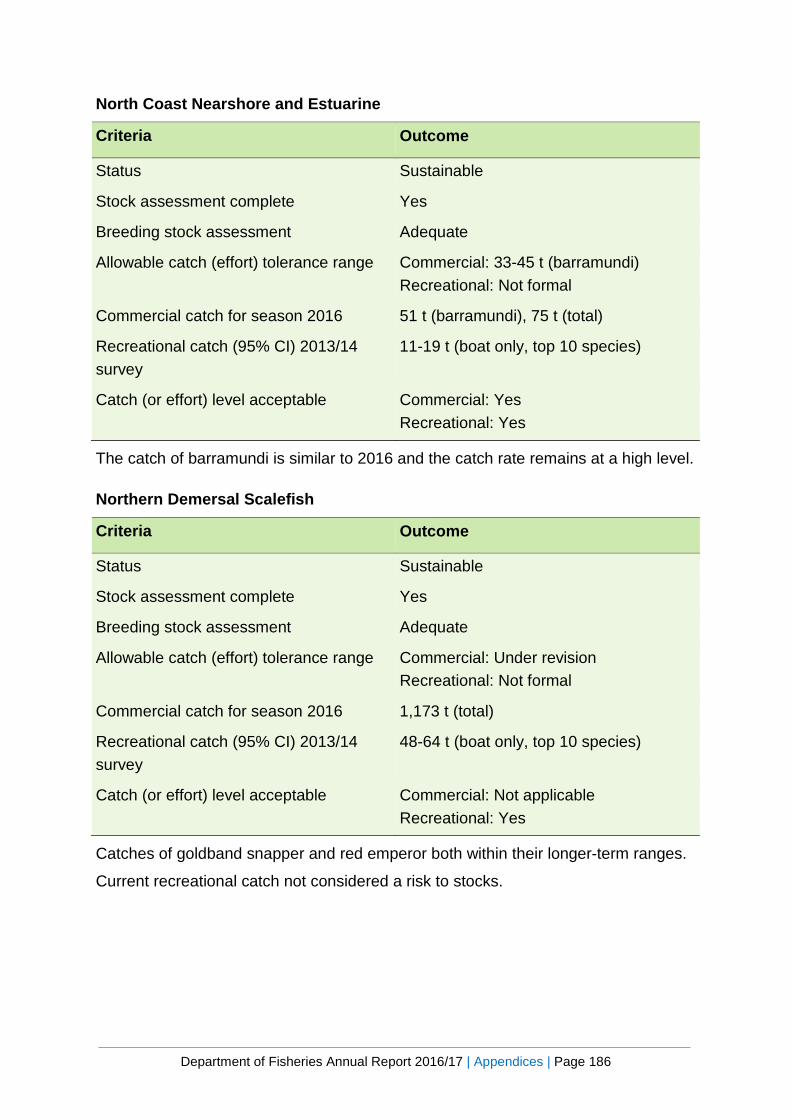
Department of Fisheries Annual Report 2016/17 | Appendices | Page 186
North Coast Nearshore and Estuarine
Criteria Outcome
Status Sustainable
Stock assessment complete Yes
Breeding stock assessment Adequate
Allowable catch (effort) tolerance range Commercial: 33-45 t (barramundi) Recreational: Not formal
Commercial catch for season 2016 51 t (barramundi), 75 t (total)
Recreational catch (95% CI) 2013/14 survey
11-19 t (boat only, top 10 species)
Catch (or effort) level acceptable Commercial: Yes Recreational: Yes
The catch of barramundi is similar to 2016 and the catch rate remains at a high level.
Northern Demersal Scalefish
Criteria Outcome
Status Sustainable
Stock assessment complete Yes
Breeding stock assessment Adequate
Allowable catch (effort) tolerance range Commercial: Under revision Recreational: Not formal
Commercial catch for season 2016 1,173 t (total)
Recreational catch (95% CI) 2013/14 survey
48-64 t (boat only, top 10 species)
Catch (or effort) level acceptable Commercial: Not applicable Recreational: Yes
Catches of goldband snapper and red emperor both within their longer-term ranges.
Current recreational catch not considered a risk to stocks.
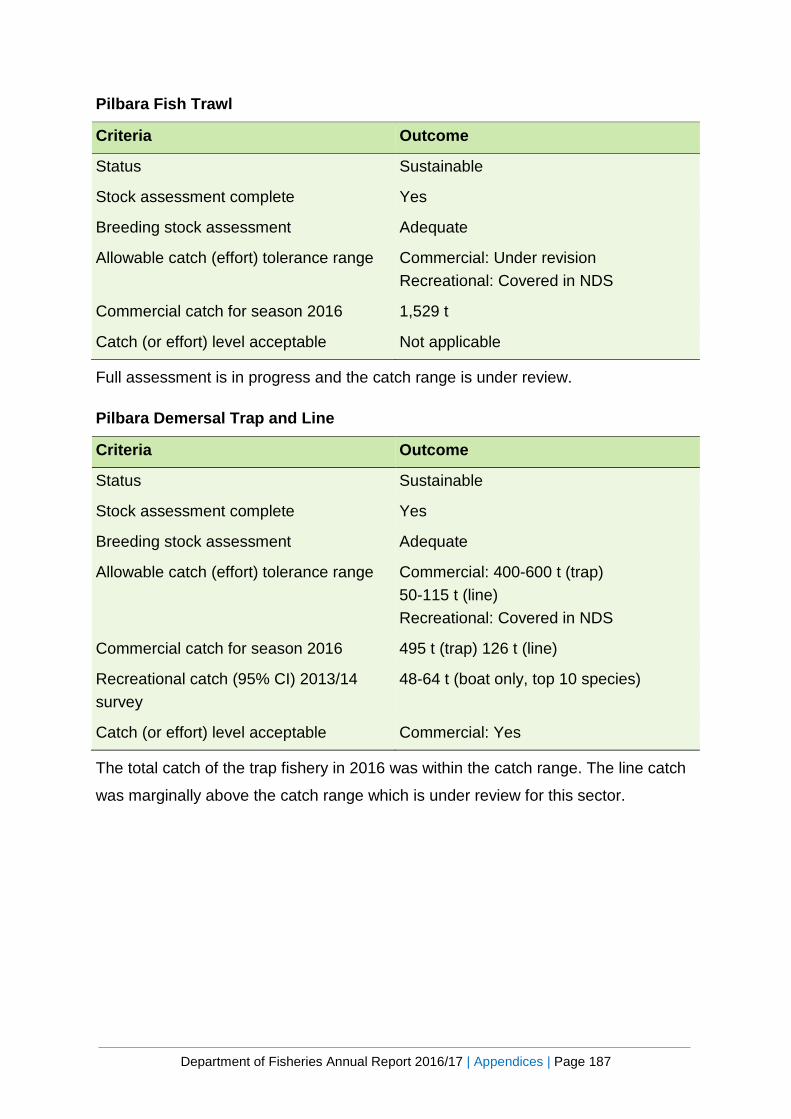
Department of Fisheries Annual Report 2016/17 | Appendices | Page 187
Pilbara Fish Trawl
Criteria Outcome
Status Sustainable
Stock assessment complete Yes
Breeding stock assessment Adequate
Allowable catch (effort) tolerance range Commercial: Under revision Recreational: Covered in NDS
Commercial catch for season 2016 1,529 t
Catch (or effort) level acceptable Not applicable
Full assessment is in progress and the catch range is under review.
Pilbara Demersal Trap and Line
Criteria Outcome
Status Sustainable
Stock assessment complete Yes
Breeding stock assessment Adequate
Allowable catch (effort) tolerance range Commercial: 400-600 t (trap) 50-115 t (line) Recreational: Covered in NDS
Commercial catch for season 2016 495 t (trap) 126 t (line)
Recreational catch (95% CI) 2013/14 survey
48-64 t (boat only, top 10 species)
Catch (or effort) level acceptable Commercial: Yes
The total catch of the trap fishery in 2016 was within the catch range. The line catch
was marginally above the catch range which is under review for this sector.

Department of Fisheries Annual Report 2016/17 | Appendices | Page 188
Mackerel
Criteria Outcome
Status Sustainable
Stock assessment complete Yes
Breeding stock assessment Adequate
Allowable catch (effort) tolerance range Commercial: 246-410 t (TACC, Spanish mackerel) Recreational: Not formal
Commercial catch for season 2016 276 t
Recreational catch (95% CI) 2013/14 survey
22-37 t (boat only)
Catch (or effort) level acceptable Commercial: Yes Recreational: Yes
The commercial catch within the tolerance range since the management plan was
introduced. Current recreational catch levels are not considered to pose any stock
issues.
Northern Shark
Criteria Outcome
Status Not assessed
Stock assessment complete No
Breeding stock assessment Not assessed
Allowable catch (effort) tolerance range Commercial: < 20 t (sandbar) Recreational: Not applicable
Commercial catch for season 2015/16 0
Catch (or effort) level acceptable Not applicable
No fishing effort since 2008/09.
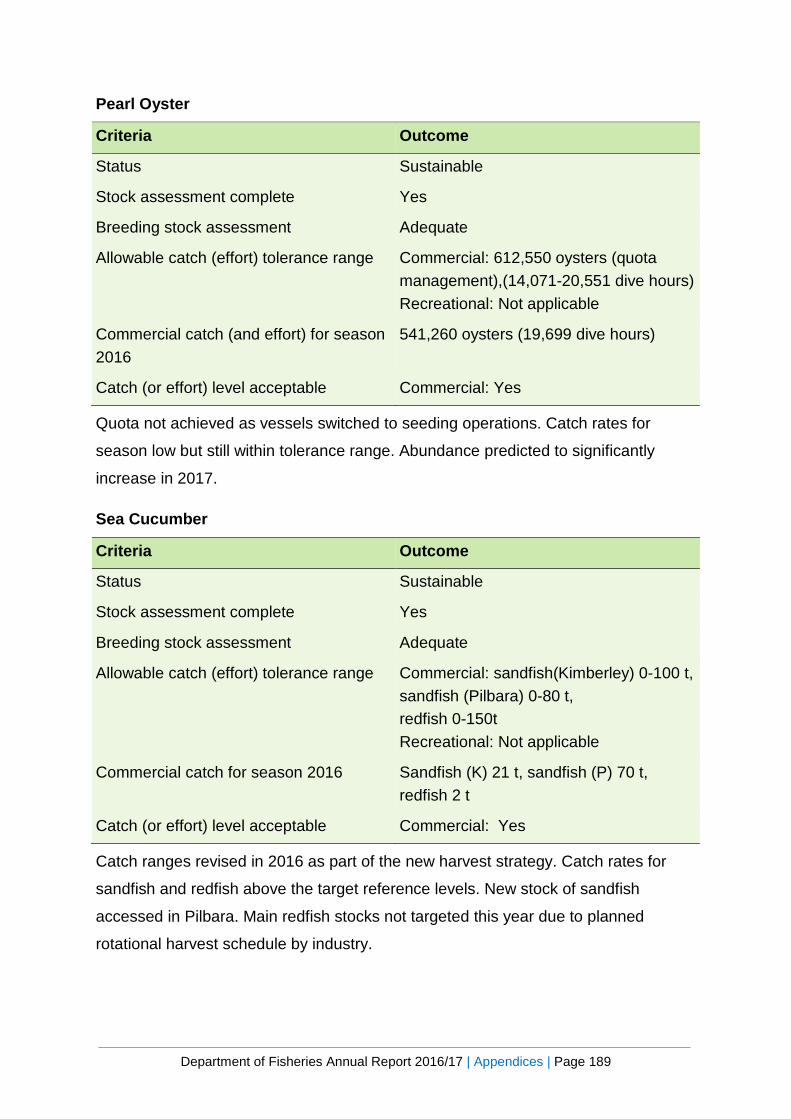
Department of Fisheries Annual Report 2016/17 | Appendices | Page 189
Pearl Oyster
Criteria Outcome
Status Sustainable
Stock assessment complete Yes
Breeding stock assessment Adequate
Allowable catch (effort) tolerance range Commercial: 612,550 oysters (quota management),(14,071-20,551 dive hours) Recreational: Not applicable
Commercial catch (and effort) for season 2016
541,260 oysters (19,699 dive hours)
Catch (or effort) level acceptable Commercial: Yes
Quota not achieved as vessels switched to seeding operations. Catch rates for
season low but still within tolerance range. Abundance predicted to significantly
increase in 2017.
Sea Cucumber
Criteria Outcome
Status Sustainable
Stock assessment complete Yes
Breeding stock assessment Adequate
Allowable catch (effort) tolerance range Commercial: sandfish(Kimberley) 0-100 t, sandfish (Pilbara) 0-80 t, redfish 0-150t Recreational: Not applicable
Commercial catch for season 2016 Sandfish (K) 21 t, sandfish (P) 70 t, redfish 2 t
Catch (or effort) level acceptable Commercial: Yes
Catch ranges revised in 2016 as part of the new harvest strategy. Catch rates for
sandfish and redfish above the target reference levels. New stock of sandfish
accessed in Pilbara. Main redfish stocks not targeted this year due to planned
rotational harvest schedule by industry.
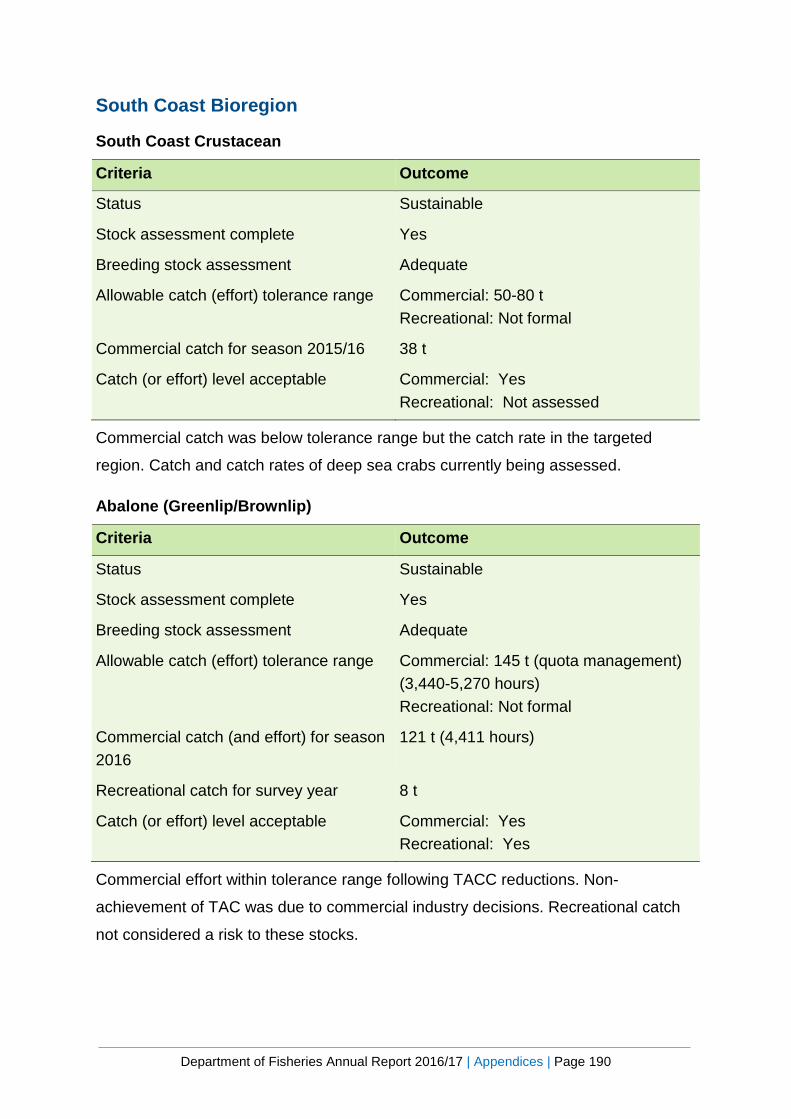
Department of Fisheries Annual Report 2016/17 | Appendices | Page 190
South Coast Bioregion
South Coast Crustacean
Criteria Outcome
Status Sustainable
Stock assessment complete Yes
Breeding stock assessment Adequate
Allowable catch (effort) tolerance range Commercial: 50-80 t Recreational: Not formal
Commercial catch for season 2015/16 38 t
Catch (or effort) level acceptable Commercial: Yes Recreational: Not assessed
Commercial catch was below tolerance range but the catch rate in the targeted
region. Catch and catch rates of deep sea crabs currently being assessed.
Abalone (Greenlip/Brownlip)
Criteria Outcome
Status Sustainable
Stock assessment complete Yes
Breeding stock assessment Adequate
Allowable catch (effort) tolerance range Commercial: 145 t (quota management) (3,440-5,270 hours) Recreational: Not formal
Commercial catch (and effort) for season 2016
121 t (4,411 hours)
Recreational catch for survey year 8 t
Catch (or effort) level acceptable Commercial: Yes Recreational: Yes
Commercial effort within tolerance range following TACC reductions. Non-
achievement of TAC was due to commercial industry decisions. Recreational catch
not considered a risk to these stocks.
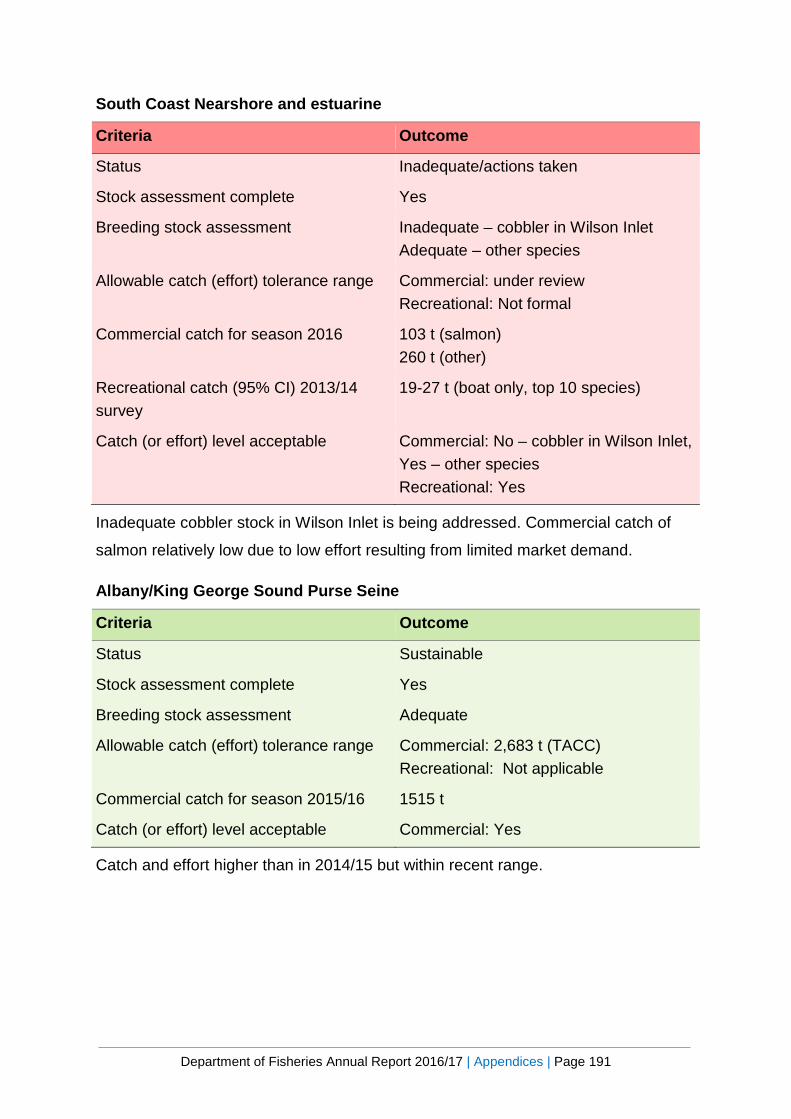
Department of Fisheries Annual Report 2016/17 | Appendices | Page 191
South Coast Nearshore and estuarine
Criteria Outcome
Status Inadequate/actions taken
Stock assessment complete Yes
Breeding stock assessment Inadequate – cobbler in Wilson Inlet Adequate – other species
Allowable catch (effort) tolerance range Commercial: under review Recreational: Not formal
Commercial catch for season 2016 103 t (salmon) 260 t (other)
Recreational catch (95% CI) 2013/14 survey
19-27 t (boat only, top 10 species)
Catch (or effort) level acceptable Commercial: No – cobbler in Wilson Inlet, Yes – other species Recreational: Yes
Inadequate cobbler stock in Wilson Inlet is being addressed. Commercial catch of
salmon relatively low due to low effort resulting from limited market demand.
Albany/King George Sound Purse Seine
Criteria Outcome
Status Sustainable
Stock assessment complete Yes
Breeding stock assessment Adequate
Allowable catch (effort) tolerance range Commercial: 2,683 t (TACC) Recreational: Not applicable
Commercial catch for season 2015/16 1515 t
Catch (or effort) level acceptable Commercial: Yes
Catch and effort higher than in 2014/15 but within recent range.
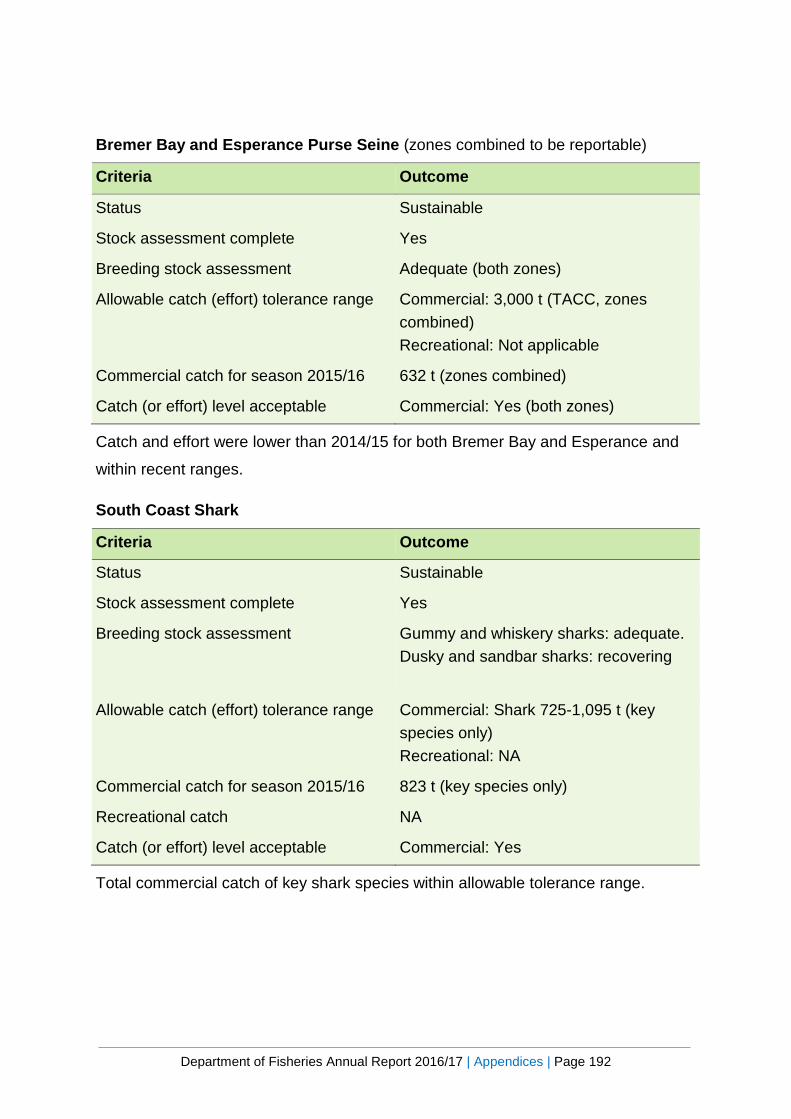
Department of Fisheries Annual Report 2016/17 | Appendices | Page 192
Bremer Bay and Esperance Purse Seine (zones combined to be reportable)
Criteria Outcome
Status Sustainable
Stock assessment complete Yes
Breeding stock assessment Adequate (both zones)
Allowable catch (effort) tolerance range Commercial: 3,000 t (TACC, zones combined) Recreational: Not applicable
Commercial catch for season 2015/16 632 t (zones combined)
Catch (or effort) level acceptable Commercial: Yes (both zones)
Catch and effort were lower than 2014/15 for both Bremer Bay and Esperance and
within recent ranges.
South Coast Shark
Criteria Outcome
Status Sustainable
Stock assessment complete Yes
Breeding stock assessment Gummy and whiskery sharks: adequate. Dusky and sandbar sharks: recovering
Allowable catch (effort) tolerance range Commercial: Shark 725-1,095 t (key species only) Recreational: NA
Commercial catch for season 2015/16 823 t (key species only)
Recreational catch NA
Catch (or effort) level acceptable Commercial: Yes
Total commercial catch of key shark species within allowable tolerance range.
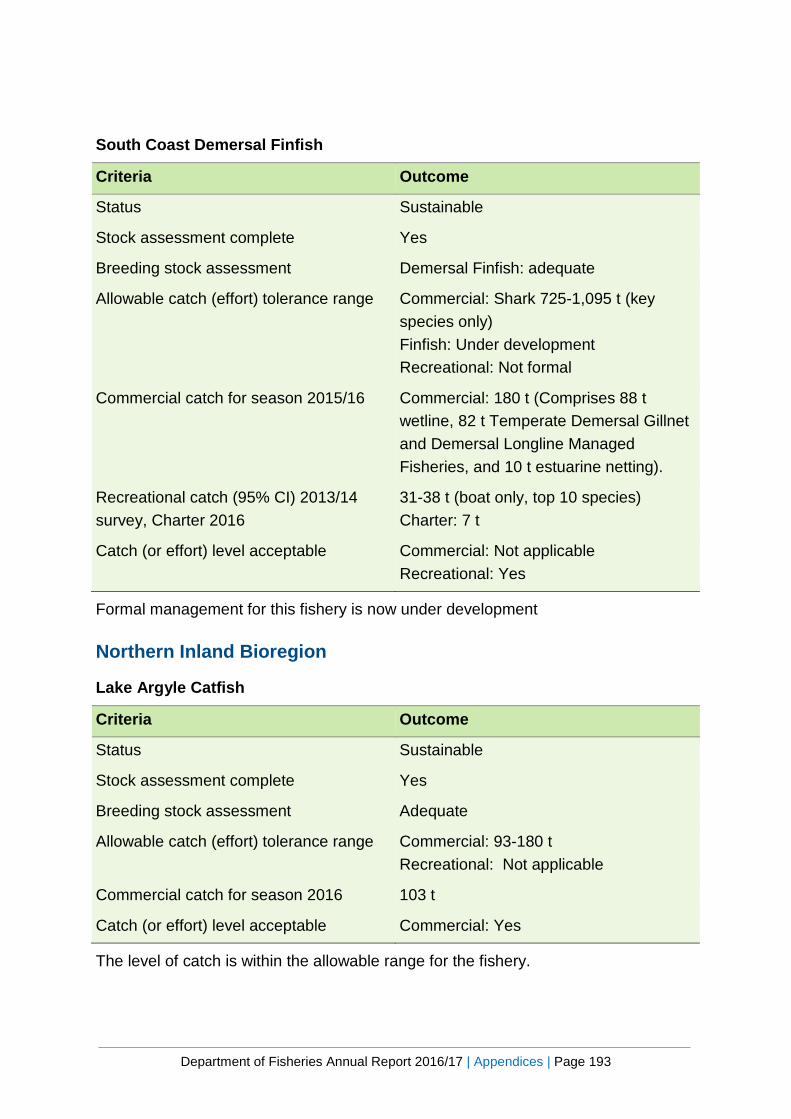
Department of Fisheries Annual Report 2016/17 | Appendices | Page 193
South Coast Demersal Finfish
Criteria Outcome
Status Sustainable
Stock assessment complete Yes
Breeding stock assessment Demersal Finfish: adequate
Allowable catch (effort) tolerance range Commercial: Shark 725-1,095 t (key species only) Finfish: Under development Recreational: Not formal
Commercial catch for season 2015/16 Commercial: 180 t (Comprises 88 t wetline, 82 t Temperate Demersal Gillnet and Demersal Longline Managed Fisheries, and 10 t estuarine netting).
Recreational catch (95% CI) 2013/14 survey, Charter 2016
31-38 t (boat only, top 10 species) Charter: 7 t
Catch (or effort) level acceptable Commercial: Not applicable Recreational: Yes
Formal management for this fishery is now under development
Northern Inland Bioregion
Lake Argyle Catfish
Criteria Outcome
Status Sustainable
Stock assessment complete Yes
Breeding stock assessment Adequate
Allowable catch (effort) tolerance range Commercial: 93-180 t Recreational: Not applicable
Commercial catch for season 2016 103 t
Catch (or effort) level acceptable Commercial: Yes
The level of catch is within the allowable range for the fishery.

Department of Fisheries Annual Report 2016/17 | Appendices | Page 194
South Inland Bioregion
Marron
Criteria Outcome
Status Sustainable
Stock assessment complete Yes
Breeding stock assessment Adequate
Allowable catch (effort) tolerance range Commercial: Not applicable Recreational: 50,000-100,000 marron
Recreational catch (95% CI) 2016 season 52,669 marron (± 4,801 se) marron
Catch (or effort) level acceptable Recreational: Yes
Total catch was within the historic catch range recorded since 2003.
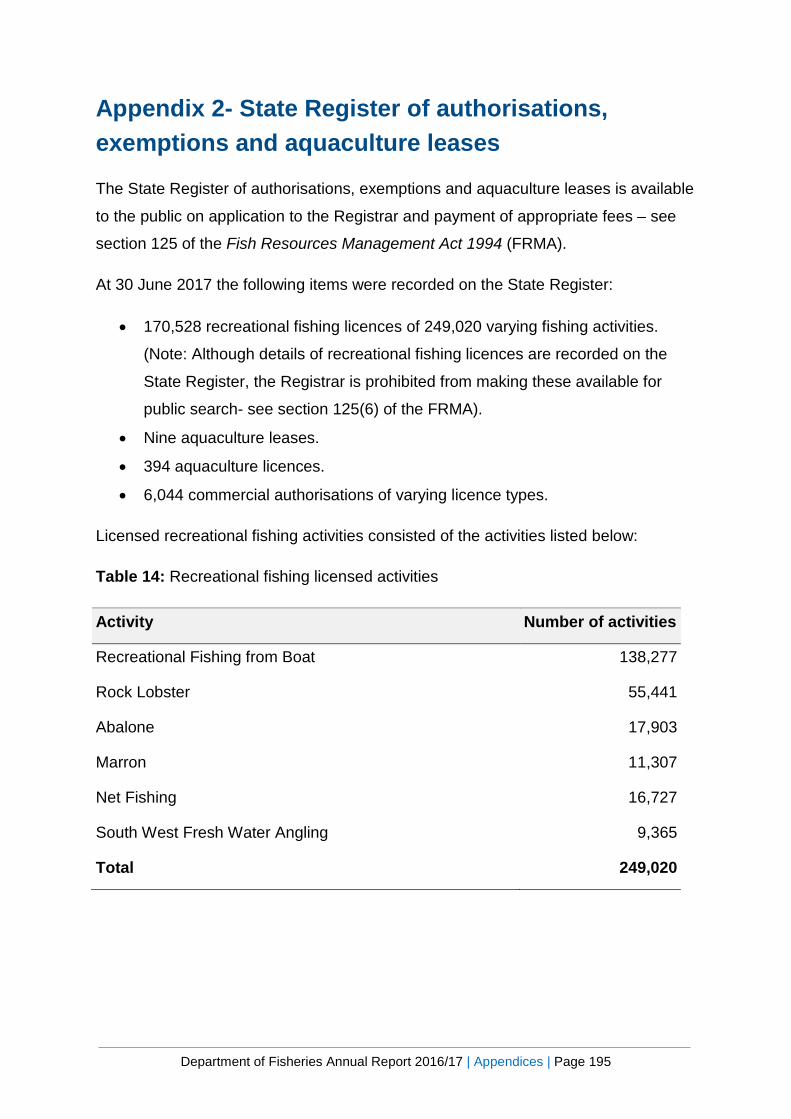
Department of Fisheries Annual Report 2016/17 | Appendices | Page 195
Appendix 2- State Register of authorisations, exemptions and aquaculture leases
The State Register of authorisations, exemptions and aquaculture leases is available
to the public on application to the Registrar and payment of appropriate fees – see
section 125 of the Fish Resources Management Act 1994 (FRMA).
At 30 June 2017 the following items were recorded on the State Register:
• 170,528 recreational fishing licences of 249,020 varying fishing activities.
(Note: Although details of recreational fishing licences are recorded on the
State Register, the Registrar is prohibited from making these available for
public search- see section 125(6) of the FRMA).
• Nine aquaculture leases.
• 394 aquaculture licences.
• 6,044 commercial authorisations of varying licence types.
Licensed recreational fishing activities consisted of the activities listed below:
Table 14: Recreational fishing licensed activities
Activity Number of activities
Recreational Fishing from Boat 138,277
Rock Lobster 55,441
Abalone 17,903
Marron 11,307
Net Fishing 16,727
South West Fresh Water Angling 9,365
Total 249,020
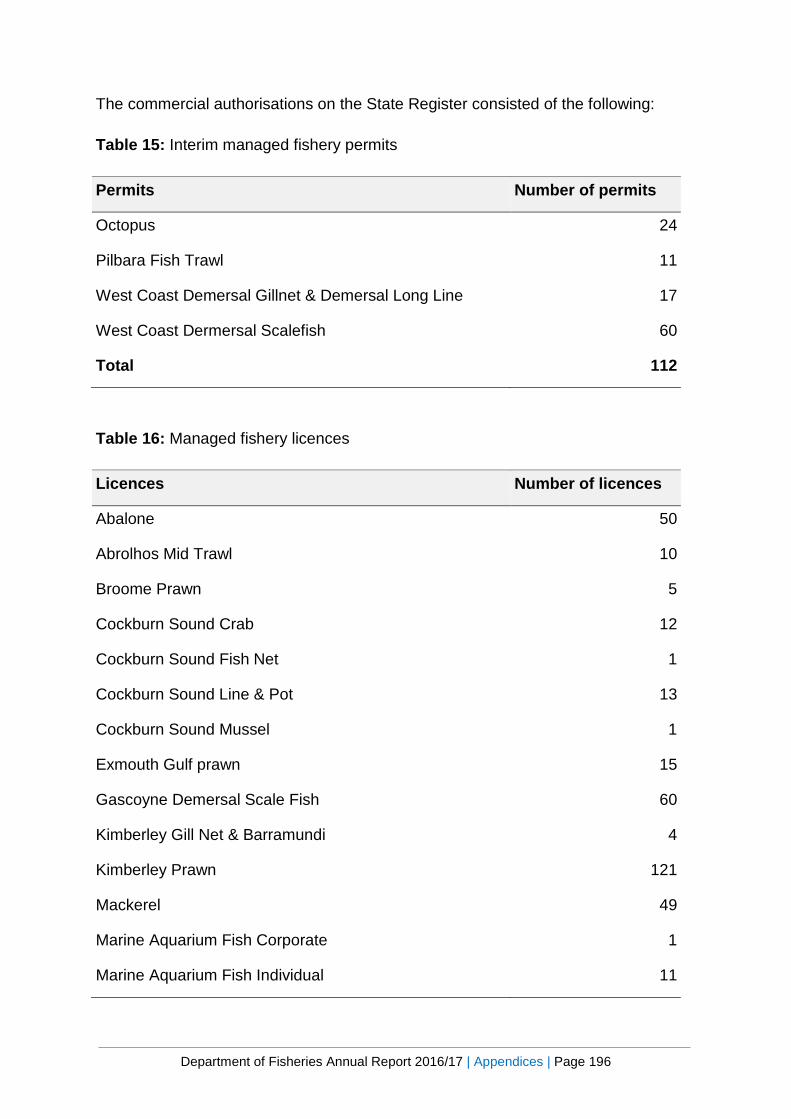
Department of Fisheries Annual Report 2016/17 | Appendices | Page 196
The commercial authorisations on the State Register consisted of the following:
Table 15: Interim managed fishery permits
Permits Number of permits
Octopus 24
Pilbara Fish Trawl 11
West Coast Demersal Gillnet & Demersal Long Line 17
West Coast Dermersal Scalefish 60
Total 112
Table 16: Managed fishery licences
Licences Number of licences
Abalone 50
Abrolhos Mid Trawl 10
Broome Prawn 5
Cockburn Sound Crab 12
Cockburn Sound Fish Net 1
Cockburn Sound Line & Pot 13
Cockburn Sound Mussel 1
Exmouth Gulf prawn 15
Gascoyne Demersal Scale Fish 60
Kimberley Gill Net & Barramundi 4
Kimberley Prawn 121
Mackerel 49
Marine Aquarium Fish Corporate 1
Marine Aquarium Fish Individual 11
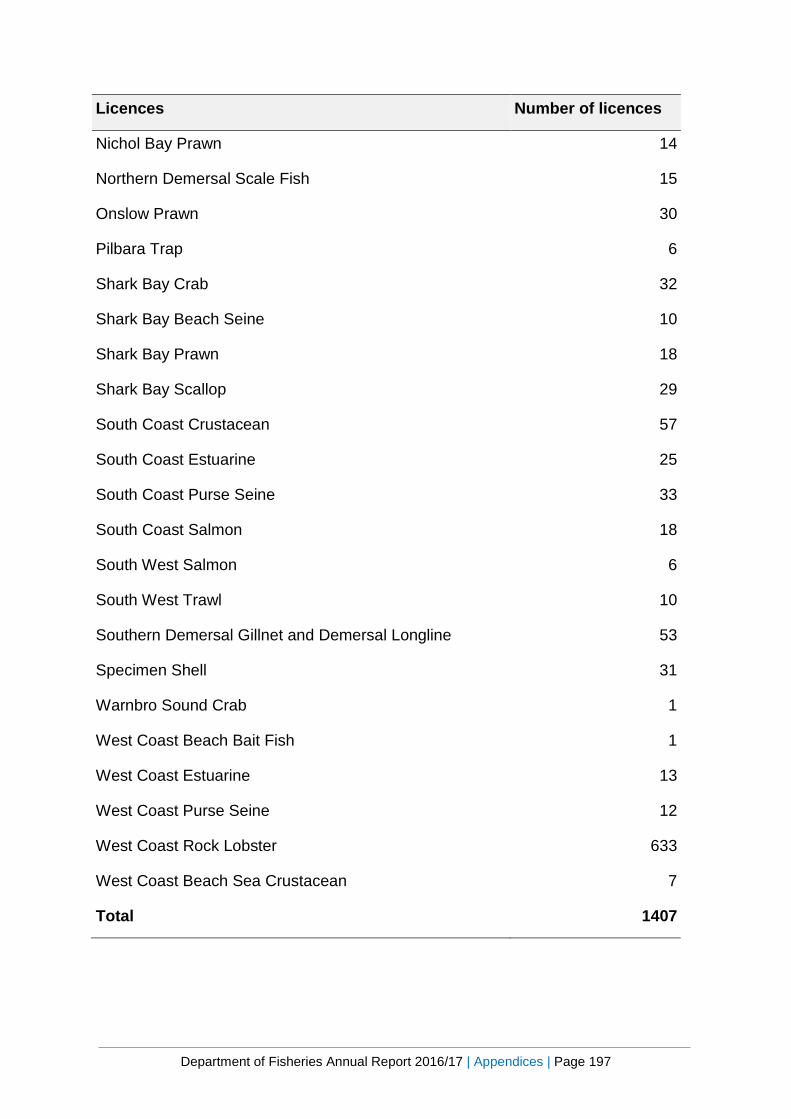
Department of Fisheries Annual Report 2016/17 | Appendices | Page 197
Licences Number of licences
Nichol Bay Prawn 14
Northern Demersal Scale Fish 15
Onslow Prawn 30
Pilbara Trap 6
Shark Bay Crab 32
Shark Bay Beach Seine 10
Shark Bay Prawn 18
Shark Bay Scallop 29
South Coast Crustacean 57
South Coast Estuarine 25
South Coast Purse Seine 33
South Coast Salmon 18
South West Salmon 6
South West Trawl 10
Southern Demersal Gillnet and Demersal Longline 53
Specimen Shell 31
Warnbro Sound Crab 1
West Coast Beach Bait Fish 1
West Coast Estuarine 13
West Coast Purse Seine 12
West Coast Rock Lobster 633
West Coast Beach Sea Crustacean 7
Total 1407
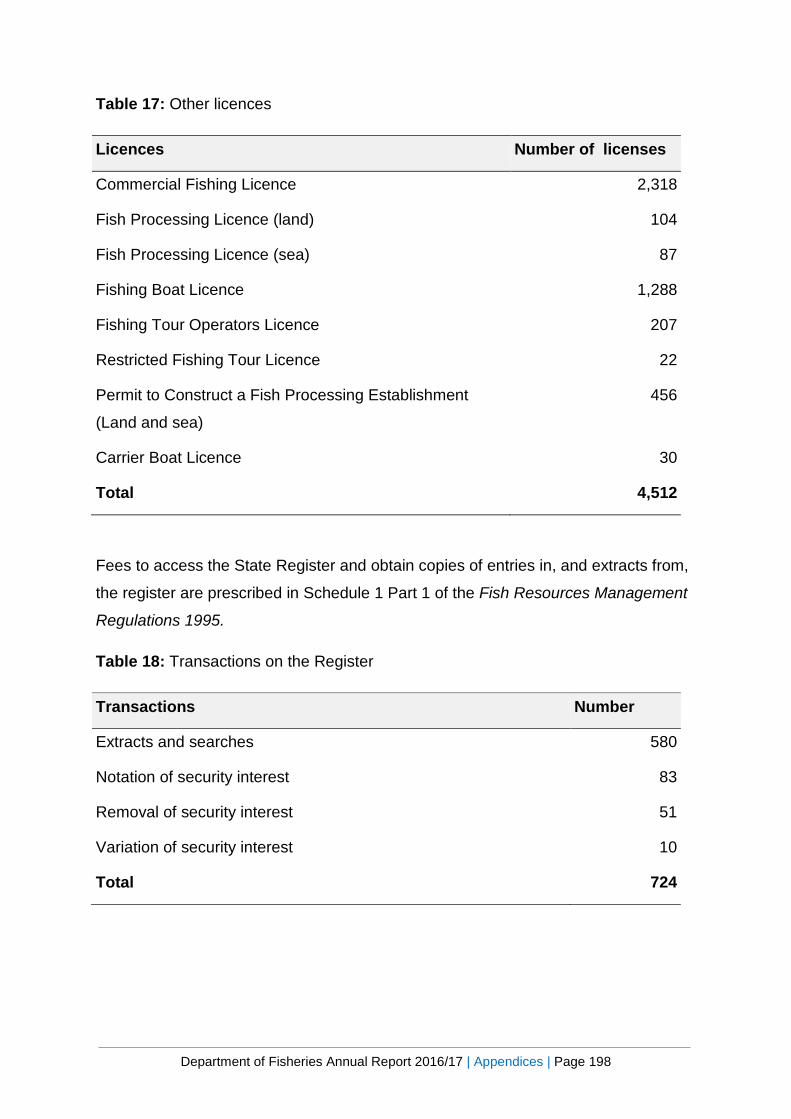
Department of Fisheries Annual Report 2016/17 | Appendices | Page 198
Table 17: Other licences
Licences Number of licenses
Commercial Fishing Licence 2,318
Fish Processing Licence (land) 104
Fish Processing Licence (sea) 87
Fishing Boat Licence 1,288
Fishing Tour Operators Licence 207
Restricted Fishing Tour Licence 22
Permit to Construct a Fish Processing Establishment
(Land and sea)
456
Carrier Boat Licence 30
Total 4,512
Fees to access the State Register and obtain copies of entries in, and extracts from,
the register are prescribed in Schedule 1 Part 1 of the Fish Resources Management
Regulations 1995.
Table 18: Transactions on the Register
Transactions Number
Extracts and searches 580
Notation of security interest 83
Removal of security interest 51
Variation of security interest 10
Total 724
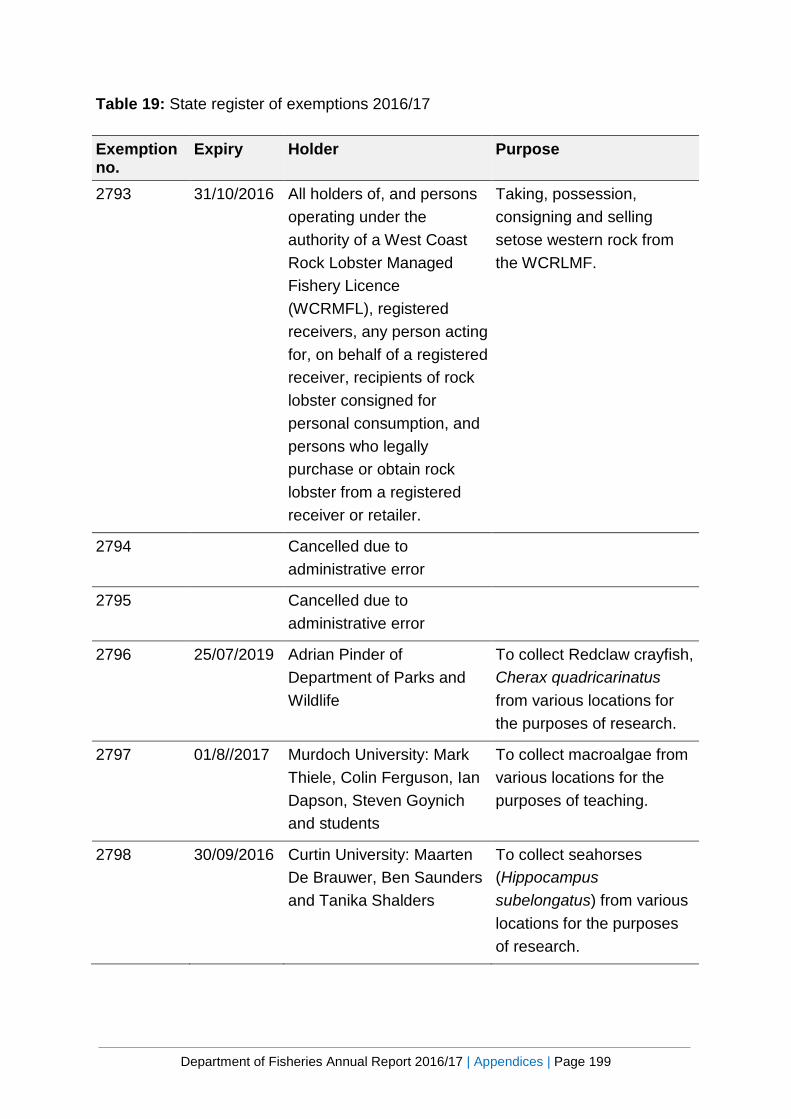
Department of Fisheries Annual Report 2016/17 | Appendices | Page 199
Table 19: State register of exemptions 2016/17
Exemption no.
Expiry Holder Purpose
2793 31/10/2016 All holders of, and persons operating under the authority of a West Coast Rock Lobster Managed Fishery Licence (WCRMFL), registered receivers, any person acting for, on behalf of a registered receiver, recipients of rock lobster consigned for personal consumption, and persons who legally purchase or obtain rock lobster from a registered receiver or retailer.
Taking, possession, consigning and selling setose western rock from the WCRLMF.
2794 Cancelled due to administrative error
2795 Cancelled due to administrative error
2796 25/07/2019 Adrian Pinder of Department of Parks and Wildlife
To collect Redclaw crayfish, Cherax quadricarinatus from various locations for the purposes of research.
2797 01/8//2017 Murdoch University: Mark Thiele, Colin Ferguson, Ian Dapson, Steven Goynich and students
To collect macroalgae from various locations for the purposes of teaching.
2798 30/09/2016 Curtin University: Maarten De Brauwer, Ben Saunders and Tanika Shalders
To collect seahorses (Hippocampus subelongatus) from various locations for the purposes of research.

Department of Fisheries Annual Report 2016/17 | Appendices | Page 200
Exemption no.
Expiry Holder Purpose
2799 31/12/2017 Indo-Pacific Environmental Pty Ltd (ACN 120 114 365)
To ascertain conservation values through aquatic fauna surveys in the Pilbara region of Western Australia.
2800 30/06/2021 Persons fishing with the use of a licenced fishing boat
To allow commercial fishing for blue sprat with the use of a lift net
2801 1/12/2017 Shanna Fulwood of Edith Cowan University, Aaron McArdle, Ashleigh Day, Casper Avenant and Chris Lehman
To collect invertebrates and fish from Claremont Foreshore, Alfred Cove, Crawley, Heacthcote and Applecross (Melville Beach Road) in the Lower-Swan Canning Estuary for the purposes of research.
2802 31/08/2017 Ocean Grown Abalone Pty Ltd (OGA) and 888 Abalone Pty Ltd (888).
To enable OGA and 888 to conduct scientific research.
2803 31/12/2018 Stephen McLeod To enable Stephen McLeod to collect aquaculture broodstock.
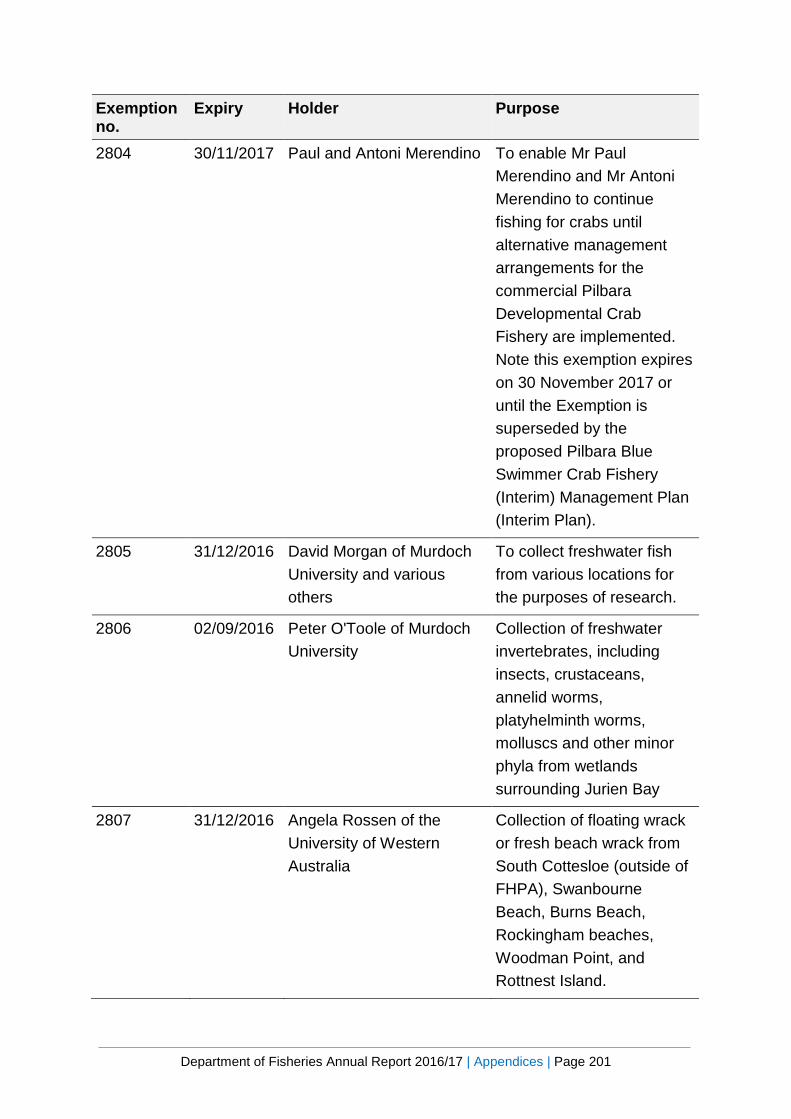
Department of Fisheries Annual Report 2016/17 | Appendices | Page 201
Exemption no.
Expiry Holder Purpose
2804 30/11/2017 Paul and Antoni Merendino To enable Mr Paul Merendino and Mr Antoni Merendino to continue fishing for crabs until alternative management arrangements for the commercial Pilbara Developmental Crab Fishery are implemented. Note this exemption expires on 30 November 2017 or until the Exemption is superseded by the proposed Pilbara Blue Swimmer Crab Fishery (Interim) Management Plan (Interim Plan).
2805 31/12/2016 David Morgan of Murdoch University and various others
To collect freshwater fish from various locations for the purposes of research.
2806 02/09/2016 Peter O'Toole of Murdoch University
Collection of freshwater invertebrates, including insects, crustaceans, annelid worms, platyhelminth worms, molluscs and other minor phyla from wetlands surrounding Jurien Bay
2807 31/12/2016 Angela Rossen of the University of Western Australia
Collection of floating wrack or fresh beach wrack from South Cottesloe (outside of FHPA), Swanbourne Beach, Burns Beach, Rockingham beaches, Woodman Point, and Rottnest Island.

Department of Fisheries Annual Report 2016/17 | Appendices | Page 202
Exemption no.
Expiry Holder Purpose
2808 01/12/16 Shanna Fulwood of Edith Cowan University
Collection of invertebrates and fish from Claremont Foreshore, Alfred Cove, Crawley, Heathcote and Applecross (Melville Beach Road) in the Lower Swan-Canning Estuary.
2809 30/06/2021 Mr P Glass To allow the exploration and development of a potential commercial coral crab fishery in Western Australia.
2810 30/06/2021 Mr J.L. Craike To allow the exploration and development of a potential commercial whelk fishery in Western Australia.
2811 31/07/2017 Australian Centre for Applied Aquaculture Research (ACAAR)
To enable ACAAR to collect aquaculture broodstock.
2812 28/07/2021 Eric Trantham and Alwyn Robins
For the commercial take of sand crabs (Ovalipes australiensis) using traps in inshore waters of the South Coast of Western Australia.
2813 30/04/2017 Mr Alan Fraser To enable Mr Alan Fraser to continue fishing for crabs until alternative management arrangements for commercial mud crab fishing are implemented.
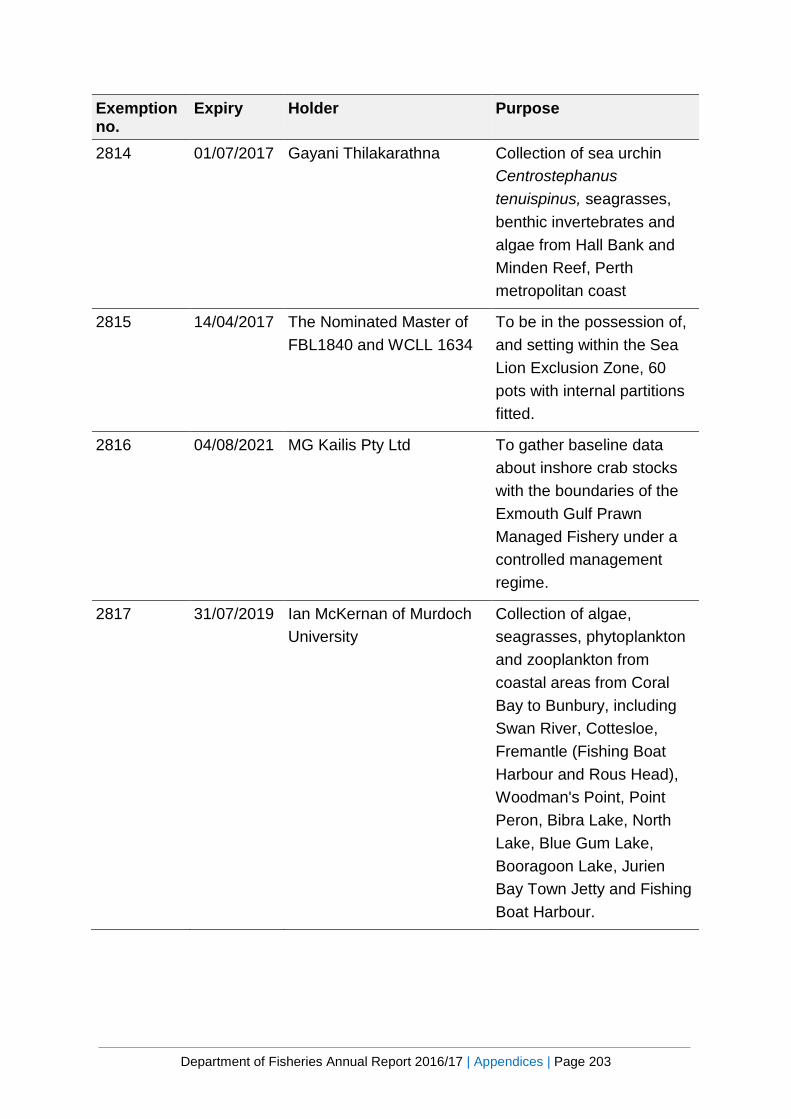
Department of Fisheries Annual Report 2016/17 | Appendices | Page 203
Exemption no.
Expiry Holder Purpose
2814 01/07/2017 Gayani Thilakarathna Collection of sea urchin Centrostephanus tenuispinus, seagrasses, benthic invertebrates and algae from Hall Bank and Minden Reef, Perth metropolitan coast
2815 14/04/2017 The Nominated Master of FBL1840 and WCLL 1634
To be in the possession of, and setting within the Sea Lion Exclusion Zone, 60 pots with internal partitions fitted.
2816 04/08/2021 MG Kailis Pty Ltd To gather baseline data about inshore crab stocks with the boundaries of the Exmouth Gulf Prawn Managed Fishery under a controlled management regime.
2817 31/07/2019 Ian McKernan of Murdoch University
Collection of algae, seagrasses, phytoplankton and zooplankton from coastal areas from Coral Bay to Bunbury, including Swan River, Cottesloe, Fremantle (Fishing Boat Harbour and Rous Head), Woodman's Point, Point Peron, Bibra Lake, North Lake, Blue Gum Lake, Booragoon Lake, Jurien Bay Town Jetty and Fishing Boat Harbour.
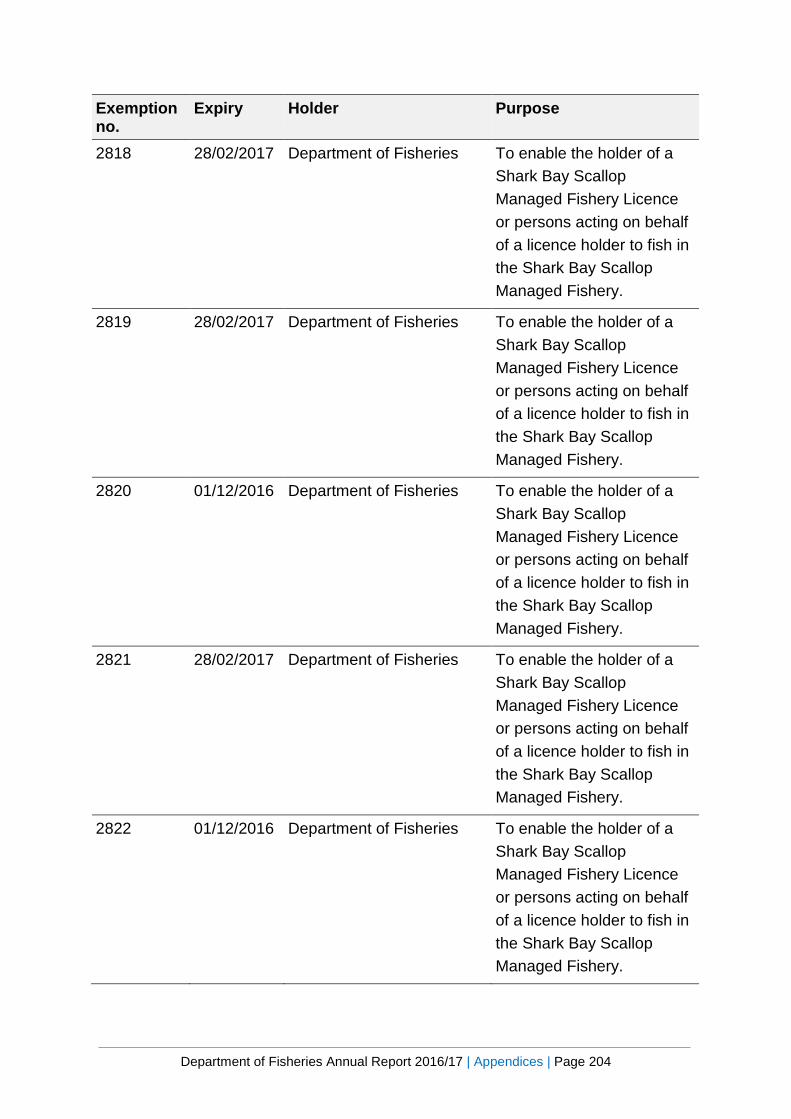
Department of Fisheries Annual Report 2016/17 | Appendices | Page 204
Exemption no.
Expiry Holder Purpose
2818 28/02/2017 Department of Fisheries To enable the holder of a Shark Bay Scallop Managed Fishery Licence or persons acting on behalf of a licence holder to fish in the Shark Bay Scallop Managed Fishery.
2819 28/02/2017 Department of Fisheries To enable the holder of a Shark Bay Scallop Managed Fishery Licence or persons acting on behalf of a licence holder to fish in the Shark Bay Scallop Managed Fishery.
2820 01/12/2016 Department of Fisheries To enable the holder of a Shark Bay Scallop Managed Fishery Licence or persons acting on behalf of a licence holder to fish in the Shark Bay Scallop Managed Fishery.
2821 28/02/2017 Department of Fisheries To enable the holder of a Shark Bay Scallop Managed Fishery Licence or persons acting on behalf of a licence holder to fish in the Shark Bay Scallop Managed Fishery.
2822 01/12/2016 Department of Fisheries To enable the holder of a Shark Bay Scallop Managed Fishery Licence or persons acting on behalf of a licence holder to fish in the Shark Bay Scallop Managed Fishery.
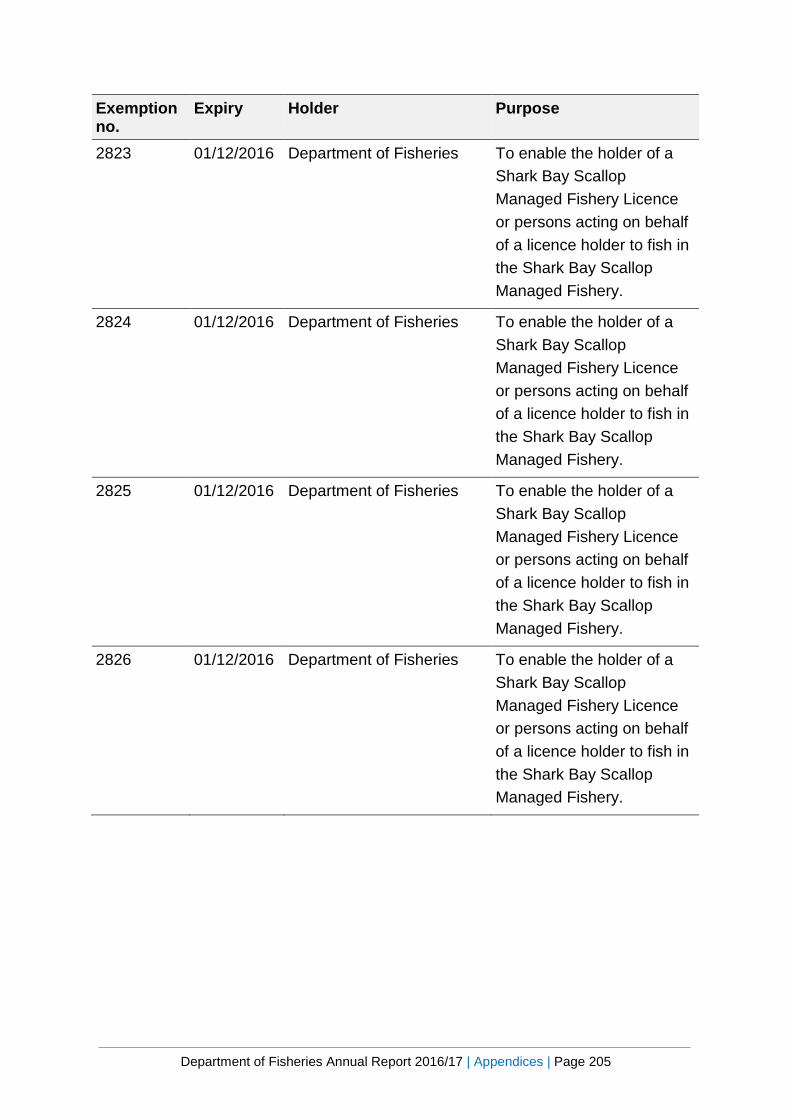
Department of Fisheries Annual Report 2016/17 | Appendices | Page 205
Exemption no.
Expiry Holder Purpose
2823 01/12/2016 Department of Fisheries To enable the holder of a Shark Bay Scallop Managed Fishery Licence or persons acting on behalf of a licence holder to fish in the Shark Bay Scallop Managed Fishery.
2824 01/12/2016 Department of Fisheries To enable the holder of a Shark Bay Scallop Managed Fishery Licence or persons acting on behalf of a licence holder to fish in the Shark Bay Scallop Managed Fishery.
2825 01/12/2016 Department of Fisheries To enable the holder of a Shark Bay Scallop Managed Fishery Licence or persons acting on behalf of a licence holder to fish in the Shark Bay Scallop Managed Fishery.
2826 01/12/2016 Department of Fisheries To enable the holder of a Shark Bay Scallop Managed Fishery Licence or persons acting on behalf of a licence holder to fish in the Shark Bay Scallop Managed Fishery.
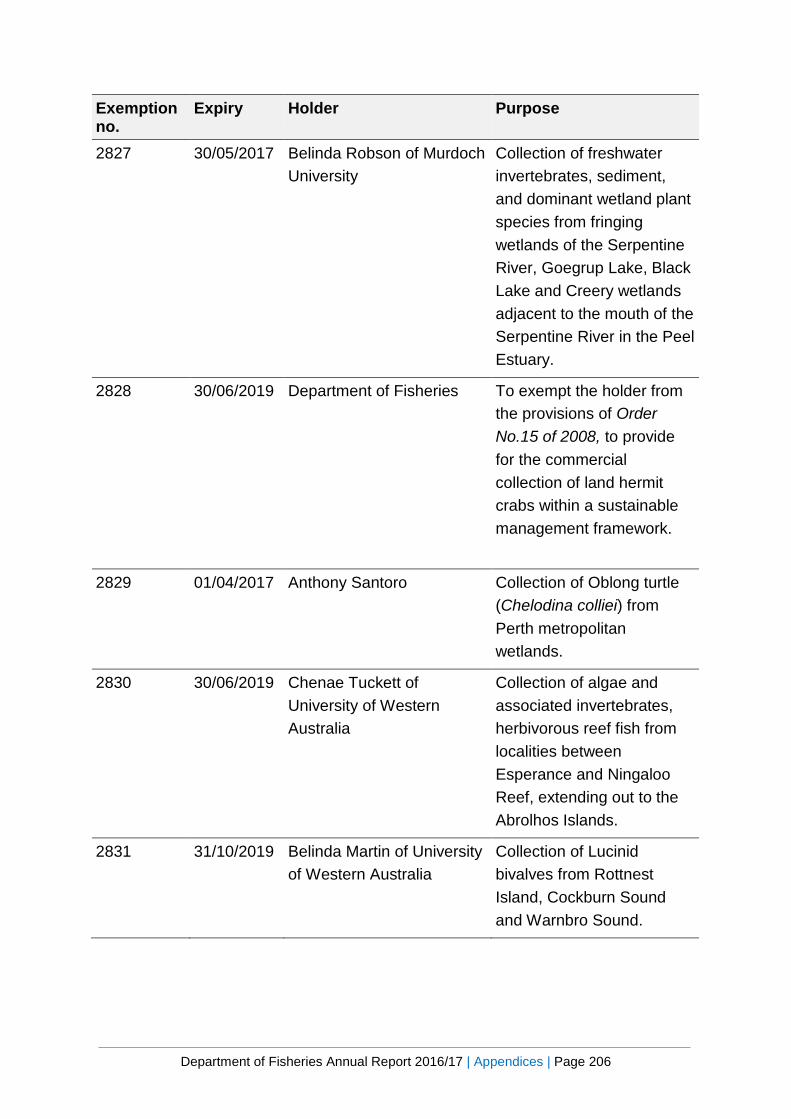
Department of Fisheries Annual Report 2016/17 | Appendices | Page 206
Exemption no.
Expiry Holder Purpose
2827 30/05/2017 Belinda Robson of Murdoch University
Collection of freshwater invertebrates, sediment, and dominant wetland plant species from fringing wetlands of the Serpentine River, Goegrup Lake, Black Lake and Creery wetlands adjacent to the mouth of the Serpentine River in the Peel Estuary.
2828 30/06/2019 Department of Fisheries
To exempt the holder from the provisions of Order No.15 of 2008, to provide for the commercial collection of land hermit crabs within a sustainable management framework.
2829 01/04/2017 Anthony Santoro Collection of Oblong turtle (Chelodina colliei) from Perth metropolitan wetlands.
2830 30/06/2019 Chenae Tuckett of University of Western Australia
Collection of algae and associated invertebrates, herbivorous reef fish from localities between Esperance and Ningaloo Reef, extending out to the Abrolhos Islands.
2831 31/10/2019 Belinda Martin of University of Western Australia
Collection of Lucinid bivalves from Rottnest Island, Cockburn Sound and Warnbro Sound.

Department of Fisheries Annual Report 2016/17 | Appendices | Page 207
Exemption no.
Expiry Holder Purpose
2832 19/12/2016 Lyndsey Cox Collection of smooth marron and hairy marron from various waterbodies within the Margaret River catchment.
2833 30/11/2016 Kennedy Opiyo of Curtin University
Collection of small rock oysters (Saccostrea mordax) from Kalbarri
2834 14/09/2016 Kim Brooks of Australian Institute of Marine Science
Collection of Lutjanus bohar, Lutjanus gibbus and Macolor sp. from Scott Reef and Rowley Shoals
2835 21/09/2016 Glenn Hyndes and students of Edith Cowan University
To collect macroinvertebrates from Lower Swan Canning Estuary, North Fremantle and East Fremantle (Leeuwin).
2836 31/12/2016 Christopher Rawson, Rowan Kleindienst, Damon Driessen and Jarrad Baker of Curtin University
To collect barramundi (Lates calcarifer) and rock oyster (Saccostrea mordax)
2837 30/12/2018 Nicole Carey, Scott Strachan, Edwin Chester Of Murdoch University
To collect freshwater invertebrates from intermittent and perennial streams in state forest and water catchment areas of the Wungong, North Dandalup and Waroona catchments.
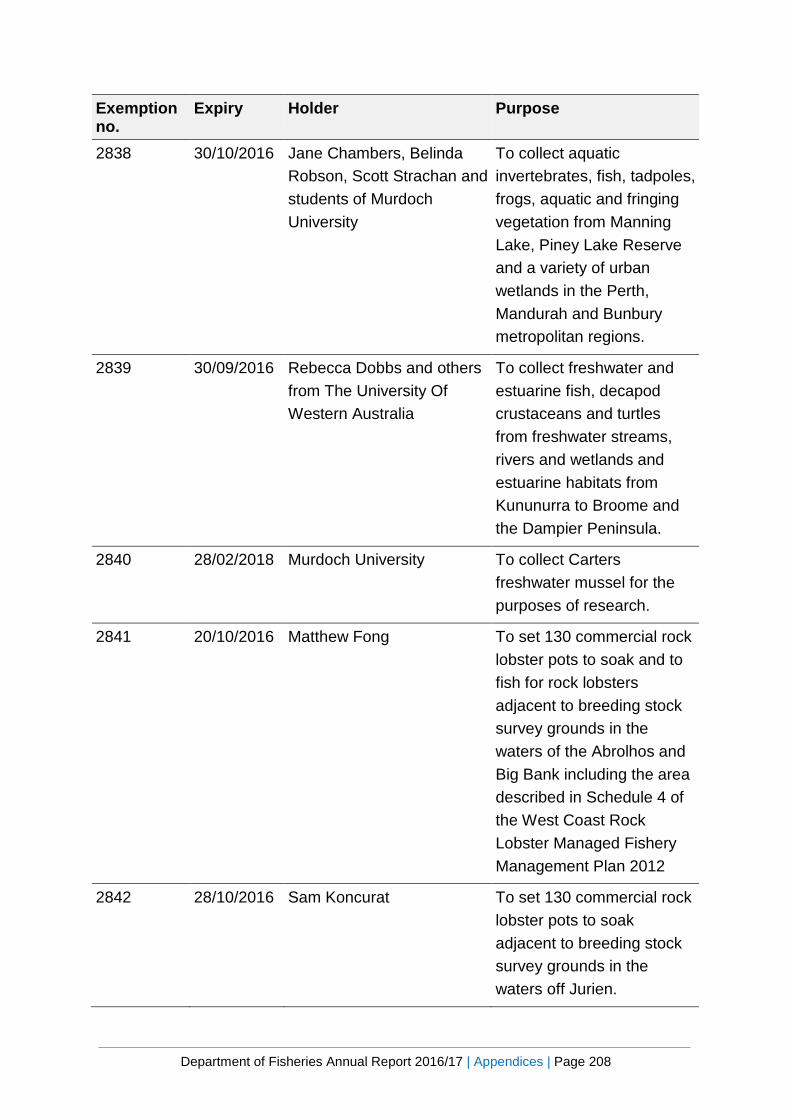
Department of Fisheries Annual Report 2016/17 | Appendices | Page 208
Exemption no.
Expiry Holder Purpose
2838 30/10/2016 Jane Chambers, Belinda Robson, Scott Strachan and students of Murdoch University
To collect aquatic invertebrates, fish, tadpoles, frogs, aquatic and fringing vegetation from Manning Lake, Piney Lake Reserve and a variety of urban wetlands in the Perth, Mandurah and Bunbury metropolitan regions.
2839 30/09/2016 Rebecca Dobbs and others from The University Of Western Australia
To collect freshwater and estuarine fish, decapod crustaceans and turtles from freshwater streams, rivers and wetlands and estuarine habitats from Kununurra to Broome and the Dampier Peninsula.
2840 28/02/2018 Murdoch University To collect Carters freshwater mussel for the purposes of research.
2841 20/10/2016 Matthew Fong To set 130 commercial rock lobster pots to soak and to fish for rock lobsters adjacent to breeding stock survey grounds in the waters of the Abrolhos and Big Bank including the area described in Schedule 4 of the West Coast Rock Lobster Managed Fishery Management Plan 2012
2842 28/10/2016 Sam Koncurat To set 130 commercial rock lobster pots to soak adjacent to breeding stock survey grounds in the waters off Jurien.
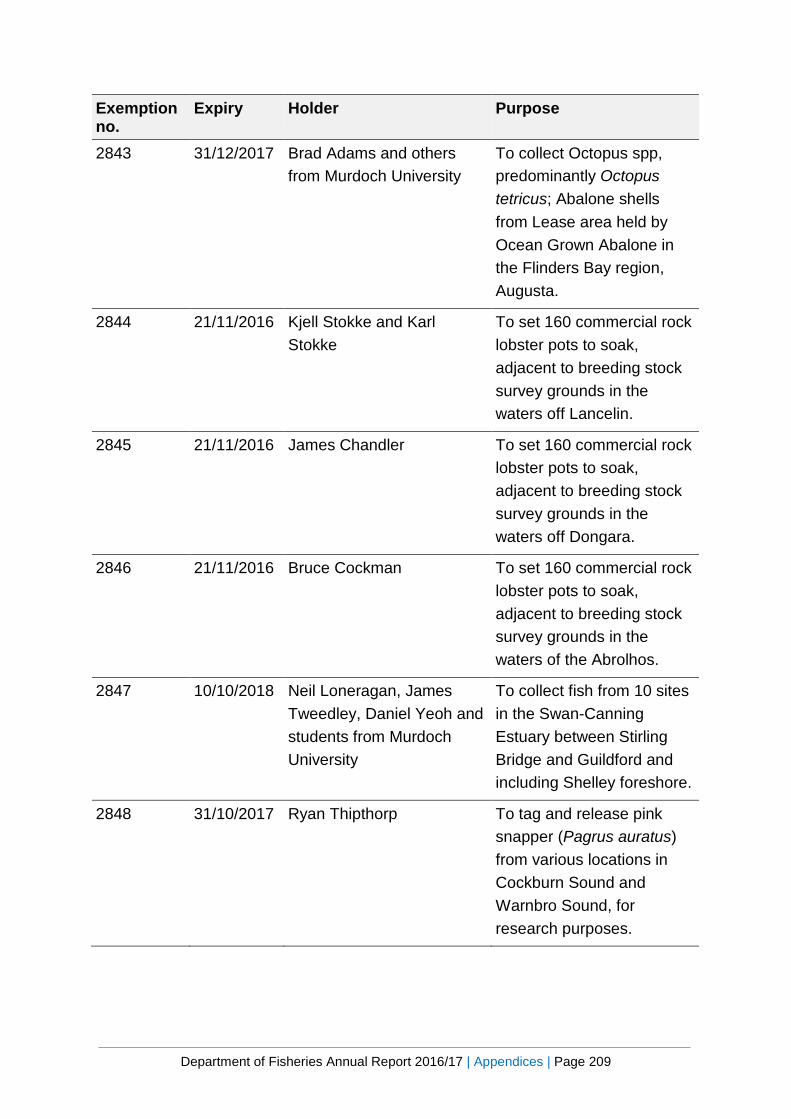
Department of Fisheries Annual Report 2016/17 | Appendices | Page 209
Exemption no.
Expiry Holder Purpose
2843 31/12/2017 Brad Adams and others from Murdoch University
To collect Octopus spp, predominantly Octopus tetricus; Abalone shells from Lease area held by Ocean Grown Abalone in the Flinders Bay region, Augusta.
2844 21/11/2016 Kjell Stokke and Karl Stokke
To set 160 commercial rock lobster pots to soak, adjacent to breeding stock survey grounds in the waters off Lancelin.
2845 21/11/2016 James Chandler To set 160 commercial rock lobster pots to soak, adjacent to breeding stock survey grounds in the waters off Dongara.
2846 21/11/2016 Bruce Cockman To set 160 commercial rock lobster pots to soak, adjacent to breeding stock survey grounds in the waters of the Abrolhos.
2847 10/10/2018 Neil Loneragan, James Tweedley, Daniel Yeoh and students from Murdoch University
To collect fish from 10 sites in the Swan-Canning Estuary between Stirling Bridge and Guildford and including Shelley foreshore.
2848 31/10/2017 Ryan Thipthorp To tag and release pink snapper (Pagrus auratus) from various locations in Cockburn Sound and Warnbro Sound, for research purposes.

Department of Fisheries Annual Report 2016/17 | Appendices | Page 210
Exemption no.
Expiry Holder Purpose
2849 31/01/2017 Danny Wimpress To tag and release pink snapper (Pagrus auratus) from various locations in Cockburn Sound and Warnbro Sound, for research purposes.
2850 04/10/2016 Brett Crisafulli of the Department Of Fisheries and others
To take, by hook and line, pink snapper (Chrysophrys auratus) from Freycinet Estuary, Shark Bay, for research purposes.
2851 16/10/2016 Persons fishing recreationally
To fish for demersal scalefish, be in possession of demersal scalefish on a boat, or bring onto land any demersal scalefish as part of ‘National Gone Fishing Day’ to promote heathy outdoor activity.
2852 16/10/2016 Persons fishing recreationally
To fish recreationally for rock lobster and all freshwater fish (other than crustaceans) and to fish by means of a fishing net and to fish from a boat without holding a recreational fishing licence or a Recreational (Boat) Fishing Licence that would otherwise be required to engage in these activities as part of ‘National Gone Fishing Day’ to promote heathy outdoor activity.
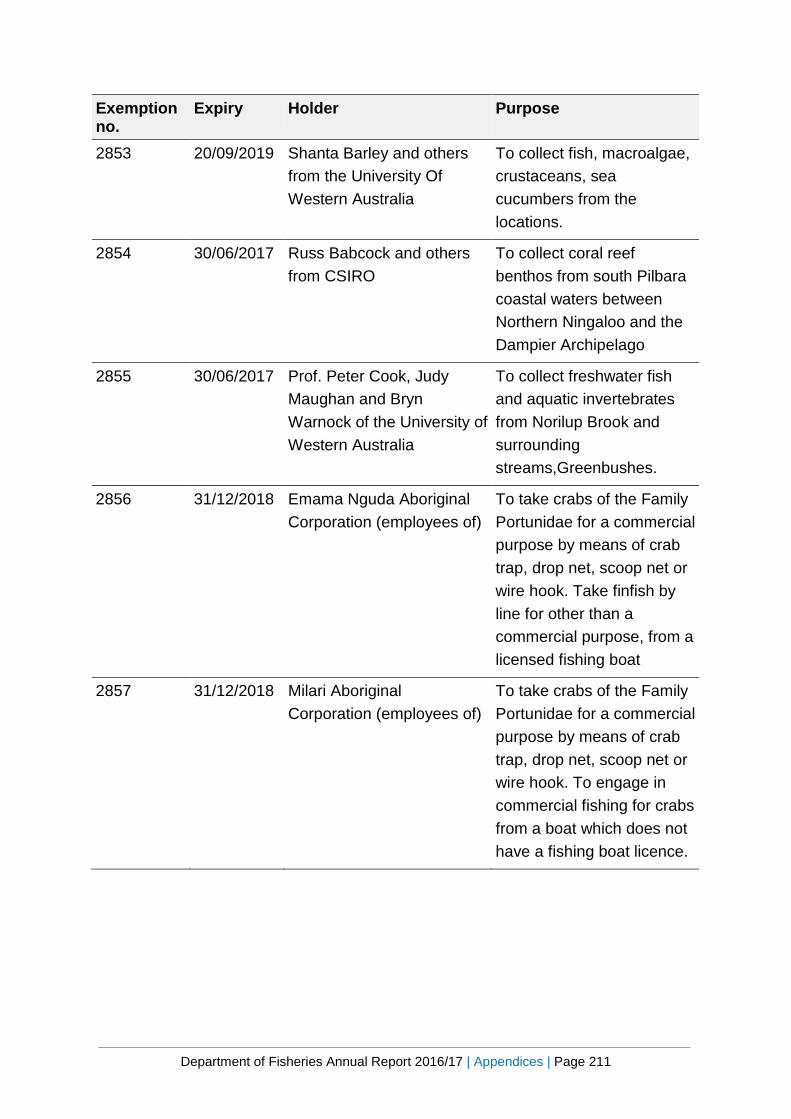
Department of Fisheries Annual Report 2016/17 | Appendices | Page 211
Exemption no.
Expiry Holder Purpose
2853 20/09/2019 Shanta Barley and others from the University Of Western Australia
To collect fish, macroalgae, crustaceans, sea cucumbers from the locations.
2854 30/06/2017 Russ Babcock and others from CSIRO
To collect coral reef benthos from south Pilbara coastal waters between Northern Ningaloo and the Dampier Archipelago
2855 30/06/2017 Prof. Peter Cook, Judy Maughan and Bryn Warnock of the University of Western Australia
To collect freshwater fish and aquatic invertebrates from Norilup Brook and surrounding streams,Greenbushes.
2856 31/12/2018 Emama Nguda Aboriginal Corporation (employees of)
To take crabs of the Family Portunidae for a commercial purpose by means of crab trap, drop net, scoop net or wire hook. Take finfish by line for other than a commercial purpose, from a licensed fishing boat
2857 31/12/2018 Milari Aboriginal Corporation (employees of)
To take crabs of the Family Portunidae for a commercial purpose by means of crab trap, drop net, scoop net or wire hook. To engage in commercial fishing for crabs from a boat which does not have a fishing boat licence.
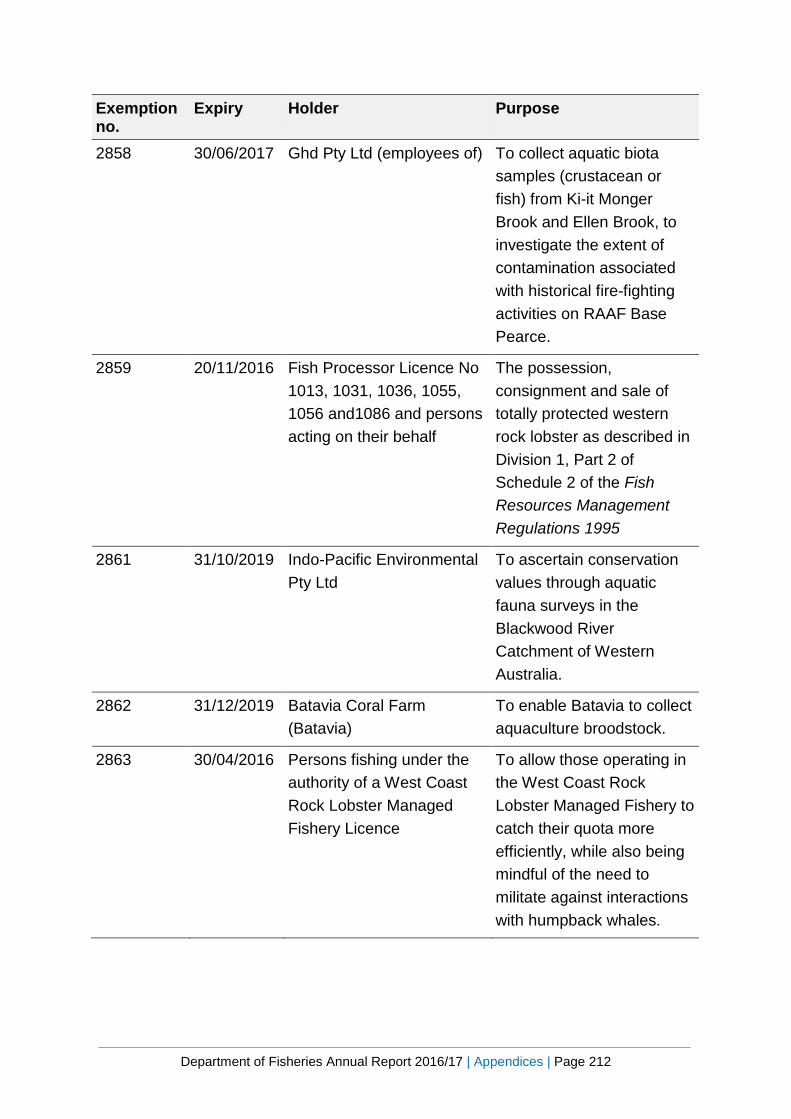
Department of Fisheries Annual Report 2016/17 | Appendices | Page 212
Exemption no.
Expiry Holder Purpose
2858 30/06/2017 Ghd Pty Ltd (employees of) To collect aquatic biota samples (crustacean or fish) from Ki-it Monger Brook and Ellen Brook, to investigate the extent of contamination associated with historical fire-fighting activities on RAAF Base Pearce.
2859 20/11/2016 Fish Processor Licence No 1013, 1031, 1036, 1055, 1056 and1086 and persons acting on their behalf
The possession, consignment and sale of totally protected western rock lobster as described in Division 1, Part 2 of Schedule 2 of the Fish Resources Management Regulations 1995
2861 31/10/2019 Indo-Pacific Environmental Pty Ltd
To ascertain conservation values through aquatic fauna surveys in the Blackwood River Catchment of Western Australia.
2862 31/12/2019 Batavia Coral Farm (Batavia)
To enable Batavia to collect aquaculture broodstock.
2863 30/04/2016 Persons fishing under the authority of a West Coast Rock Lobster Managed Fishery Licence
To allow those operating in the West Coast Rock Lobster Managed Fishery to catch their quota more efficiently, while also being mindful of the need to militate against interactions with humpback whales.
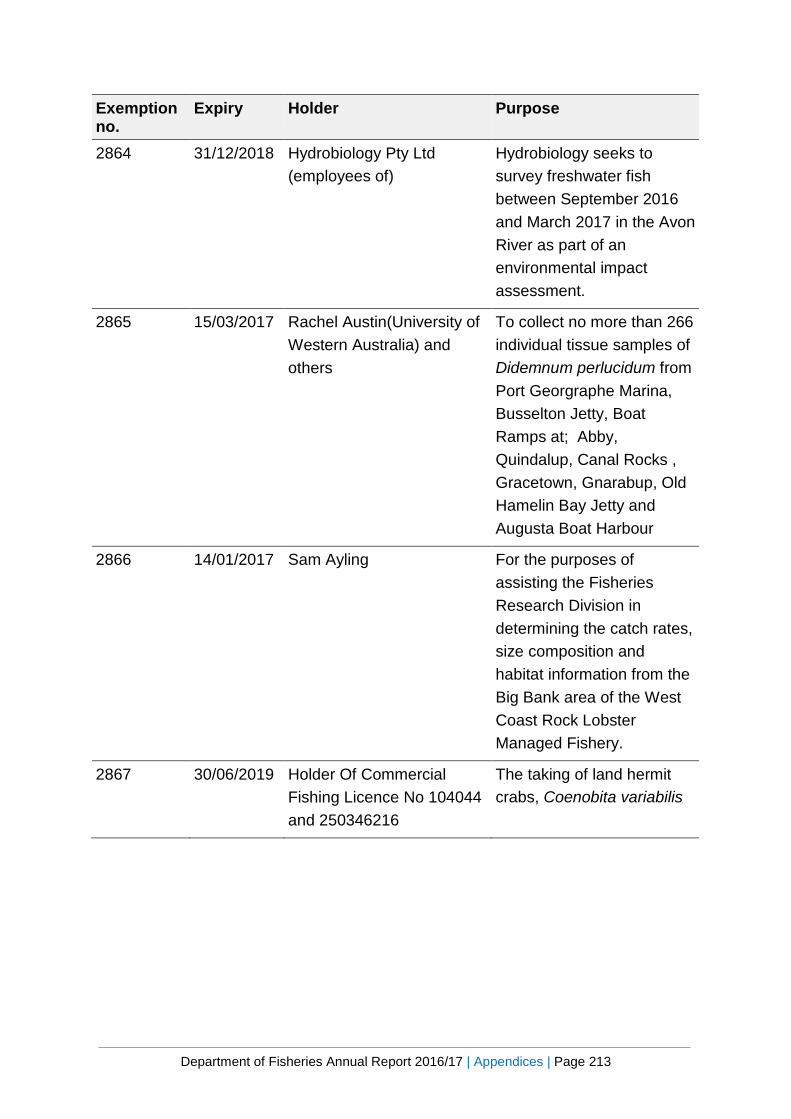
Department of Fisheries Annual Report 2016/17 | Appendices | Page 213
Exemption no.
Expiry Holder Purpose
2864 31/12/2018 Hydrobiology Pty Ltd (employees of)
Hydrobiology seeks to survey freshwater fish between September 2016 and March 2017 in the Avon River as part of an environmental impact assessment.
2865 15/03/2017 Rachel Austin(University of Western Australia) and others
To collect no more than 266 individual tissue samples of Didemnum perlucidum from Port Georgraphe Marina, Busselton Jetty, Boat Ramps at; Abby, Quindalup, Canal Rocks , Gracetown, Gnarabup, Old Hamelin Bay Jetty and Augusta Boat Harbour
2866 14/01/2017 Sam Ayling For the purposes of assisting the Fisheries Research Division in determining the catch rates, size composition and habitat information from the Big Bank area of the West Coast Rock Lobster Managed Fishery.
2867 30/06/2019 Holder Of Commercial Fishing Licence No 104044 and 250346216
The taking of land hermit crabs, Coenobita variabilis
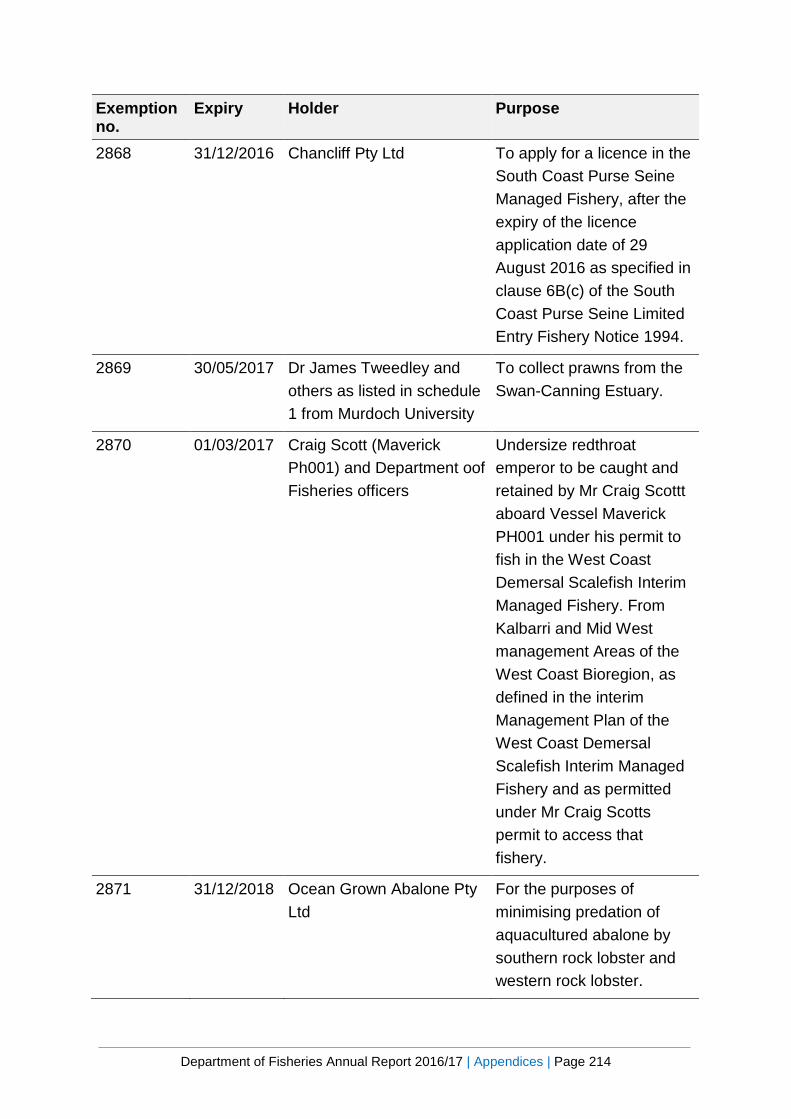
Department of Fisheries Annual Report 2016/17 | Appendices | Page 214
Exemption no.
Expiry Holder Purpose
2868 31/12/2016 Chancliff Pty Ltd To apply for a licence in the South Coast Purse Seine Managed Fishery, after the expiry of the licence application date of 29 August 2016 as specified in clause 6B(c) of the South Coast Purse Seine Limited Entry Fishery Notice 1994.
2869 30/05/2017 Dr James Tweedley and others as listed in schedule 1 from Murdoch University
To collect prawns from the Swan-Canning Estuary.
2870 01/03/2017 Craig Scott (Maverick Ph001) and Department oof Fisheries officers
Undersize redthroat emperor to be caught and retained by Mr Craig Scottt aboard Vessel Maverick PH001 under his permit to fish in the West Coast Demersal Scalefish Interim Managed Fishery. From Kalbarri and Mid West management Areas of the West Coast Bioregion, as defined in the interim Management Plan of the West Coast Demersal Scalefish Interim Managed Fishery and as permitted under Mr Craig Scotts permit to access that fishery.
2871 31/12/2018 Ocean Grown Abalone Pty Ltd
For the purposes of minimising predation of aquacultured abalone by southern rock lobster and western rock lobster.

Department of Fisheries Annual Report 2016/17 | Appendices | Page 215
Exemption no.
Expiry Holder Purpose
2872 30/06/2017 South Coast Crustacean Managed Fishery (Master of authorised boat)
To fish using rock lobster pots that are not fitted with a Sea Lion Exclusion Device.
2873 01/04/2017 Corey Wakefield of the Department of Fisheries and others
For the purposes of research.
2874 31/12/2016 Exmouth Freight and Logistics, Sealanes (1985) Pty Ltd and Foodbank WA (employees of)
To receive and possess fish in excess of the recreational possession limit, to consign and transport that fish unaccompanied to Perth, to process the fish at Sealanes (1985) PTY LTD and to store that fish at Foodbank WA
2875 31/12/2016 Christopher Rawson Of Curtin University and others
To collect Barramundi (Lates calcarifer) and rock oyster (Saccostrea mordax) from locations
2876 14/01/2019 Adrian Gleiss of Murdoch University and others
To collect black bream, mulloway and bull sharks from Swan and Canning river estuaries.
2877 31/12/2016 Matthew Badart, Craig Skepper, Grace Davis and others
For the purpose of undertaking aquatic scientific research in order to provide necessary age sampling data required to facilitate an integrated model stock assessment, and to contribute ongoing information on bycatch and detailed species composition information from trap catches.
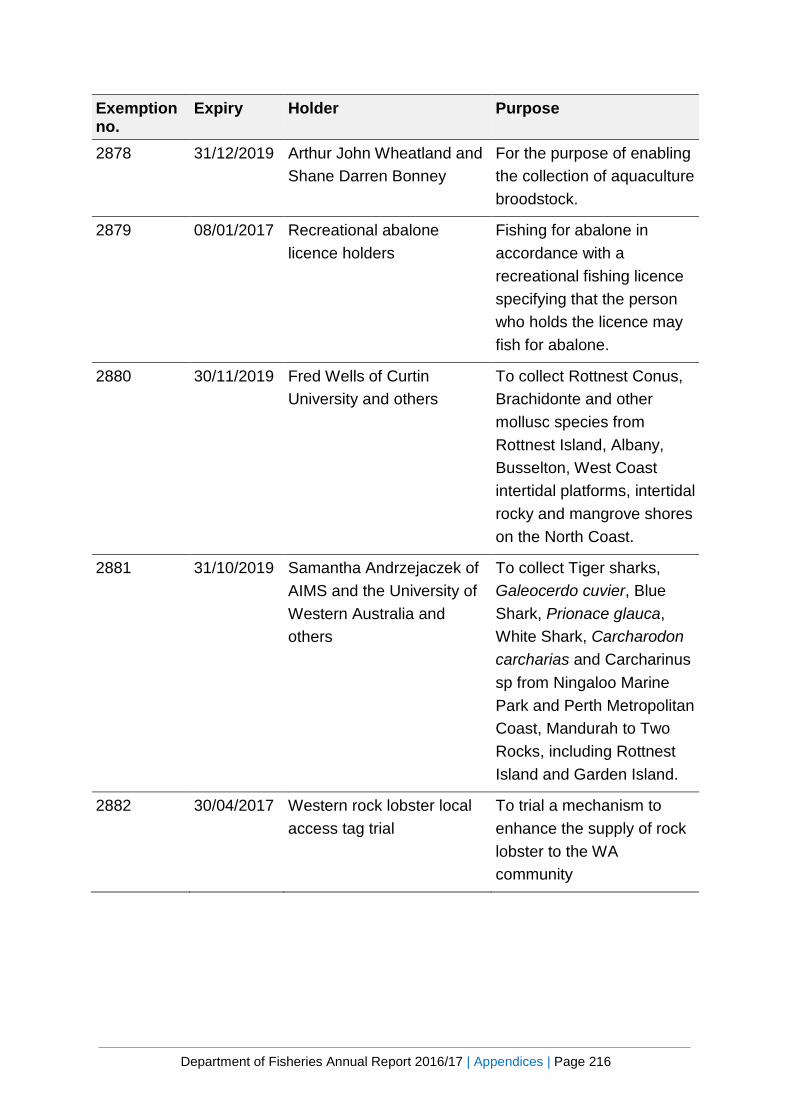
Department of Fisheries Annual Report 2016/17 | Appendices | Page 216
Exemption no.
Expiry Holder Purpose
2878 31/12/2019 Arthur John Wheatland and Shane Darren Bonney
For the purpose of enabling the collection of aquaculture broodstock.
2879 08/01/2017 Recreational abalone licence holders
Fishing for abalone in accordance with a recreational fishing licence specifying that the person who holds the licence may fish for abalone.
2880 30/11/2019 Fred Wells of Curtin University and others
To collect Rottnest Conus, Brachidonte and other mollusc species from Rottnest Island, Albany, Busselton, West Coast intertidal platforms, intertidal rocky and mangrove shores on the North Coast.
2881 31/10/2019 Samantha Andrzejaczek of AIMS and the University of Western Australia and others
To collect Tiger sharks, Galeocerdo cuvier, Blue Shark, Prionace glauca, White Shark, Carcharodon carcharias and Carcharinus sp from Ningaloo Marine Park and Perth Metropolitan Coast, Mandurah to Two Rocks, including Rottnest Island and Garden Island.
2882 30/04/2017 Western rock lobster local access tag trial
To trial a mechanism to enhance the supply of rock lobster to the WA community

Department of Fisheries Annual Report 2016/17 | Appendices | Page 217
Exemption no.
Expiry Holder Purpose
2883 31/12/2019 Indian Ocean Fresh Australia Pty Ltd
To construct broodstock holding tanks to hold yellowtail kingfish (Seriola Ialandi) at Fisherman's Wharf, a land-based facility in Geraldton. The fish may be spawned and the eggs transported to a licensed hatchery facility for rearing; or moved to other licensed facilities.
2884 27/11/2017 Dr Jane Chambers of Murdoch University and others
To collect submerged aquatic plants and macroalgae, benthic microalgae and phytoplankton from Vasse Lagoon and Wonnerup Lagoon only of the Vasse Wonnerup Wetlands.
2885 01/01/2019 Muhammad Azmi Abdul Wahab of AIMS and others
To collect Sponges, mostly demosponges from Ninglaloo Marine Park; areas around Gnaraloo, Point Cloates and Mandu Mandu.
2886 31/12/2019 Prof L.E Beckley of Murdoch University and others
To collect zooplankton and squid from Perth Canyon, Albany Canyons and Bremer Canyon.
2887 01/07/2017 Dr Jonathon Werry of Griffith University and others
To gather data on the movements, behaviour and characteristics of great white sharks to identify if the area is an adult pupping and neonate habitat area.
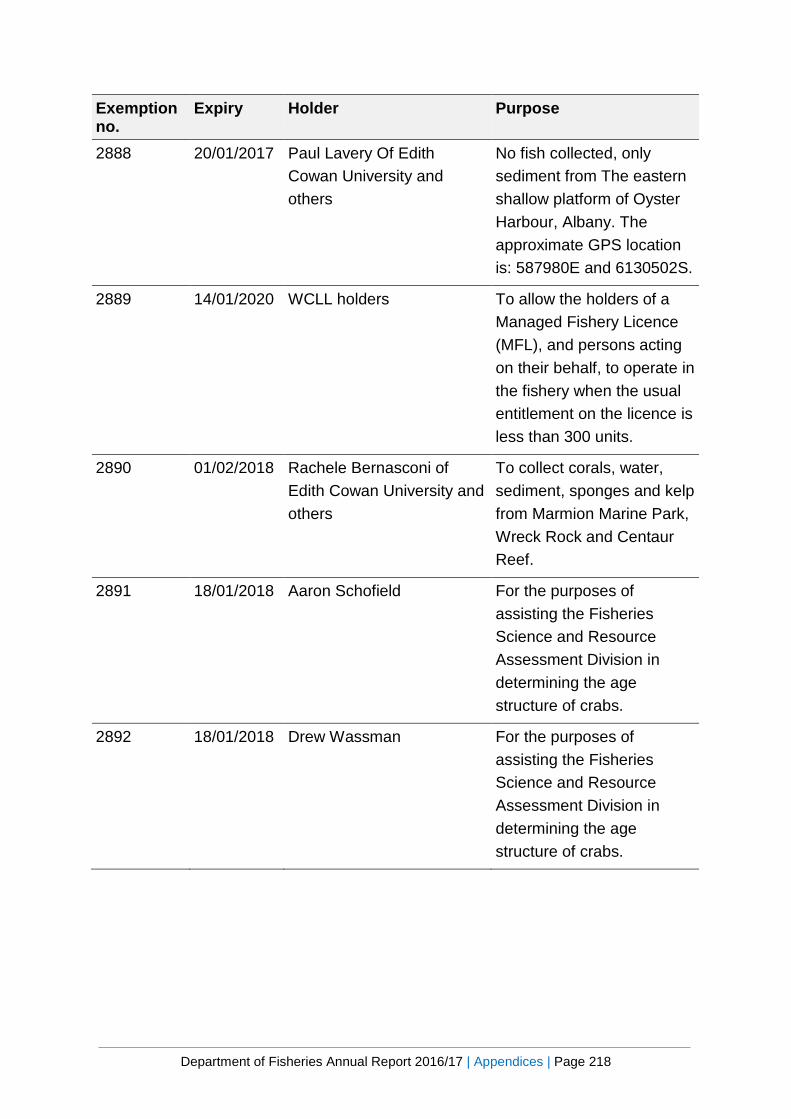
Department of Fisheries Annual Report 2016/17 | Appendices | Page 218
Exemption no.
Expiry Holder Purpose
2888 20/01/2017 Paul Lavery Of Edith Cowan University and others
No fish collected, only sediment from The eastern shallow platform of Oyster Harbour, Albany. The approximate GPS location is: 587980E and 6130502S.
2889 14/01/2020 WCLL holders To allow the holders of a Managed Fishery Licence (MFL), and persons acting on their behalf, to operate in the fishery when the usual entitlement on the licence is less than 300 units.
2890 01/02/2018 Rachele Bernasconi of Edith Cowan University and others
To collect corals, water, sediment, sponges and kelp from Marmion Marine Park, Wreck Rock and Centaur Reef.
2891 18/01/2018 Aaron Schofield For the purposes of assisting the Fisheries Science and Resource Assessment Division in determining the age structure of crabs.
2892 18/01/2018 Drew Wassman For the purposes of assisting the Fisheries Science and Resource Assessment Division in determining the age structure of crabs.
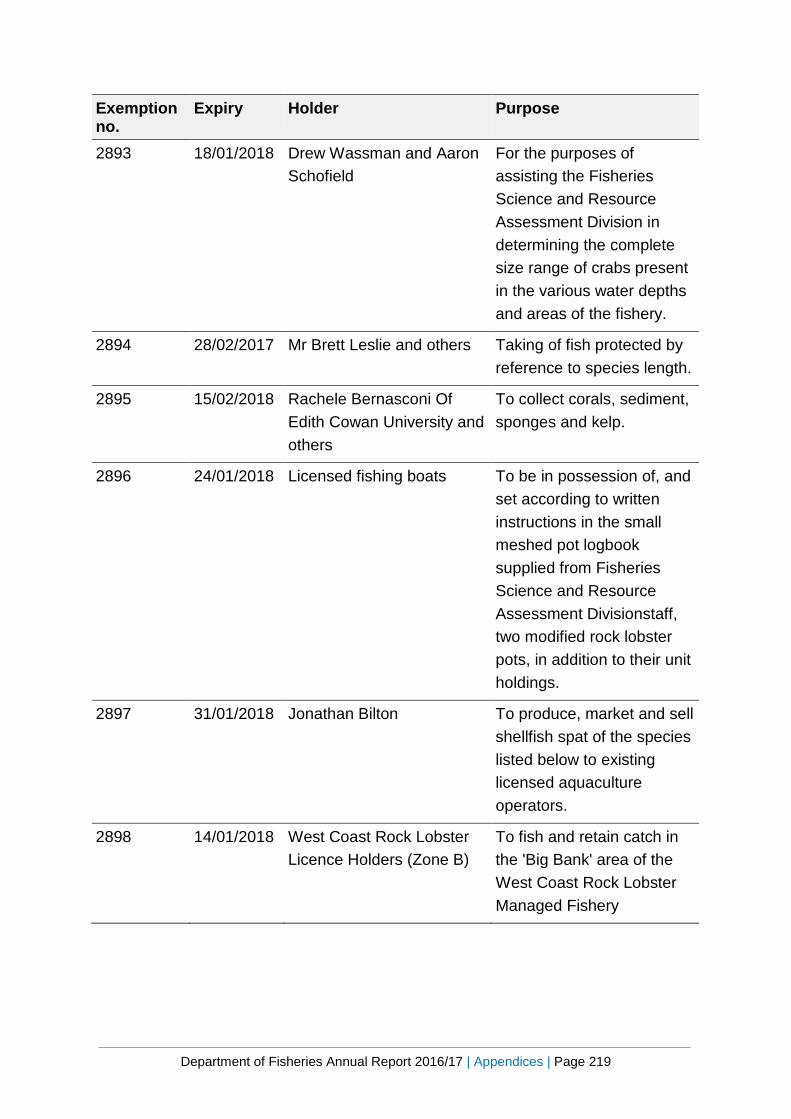
Department of Fisheries Annual Report 2016/17 | Appendices | Page 219
Exemption no.
Expiry Holder Purpose
2893 18/01/2018 Drew Wassman and Aaron Schofield
For the purposes of assisting the Fisheries Science and Resource Assessment Division in determining the complete size range of crabs present in the various water depths and areas of the fishery.
2894 28/02/2017 Mr Brett Leslie and others Taking of fish protected by reference to species length.
2895 15/02/2018 Rachele Bernasconi Of Edith Cowan University and others
To collect corals, sediment, sponges and kelp.
2896 24/01/2018 Licensed fishing boats To be in possession of, and set according to written instructions in the small meshed pot logbook supplied from Fisheries Science and Resource Assessment Divisionstaff, two modified rock lobster pots, in addition to their unit holdings.
2897 31/01/2018 Jonathan Bilton To produce, market and sell shellfish spat of the species listed below to existing licensed aquaculture operators.
2898 14/01/2018 West Coast Rock Lobster Licence Holders (Zone B)
To fish and retain catch in the 'Big Bank' area of the West Coast Rock Lobster Managed Fishery
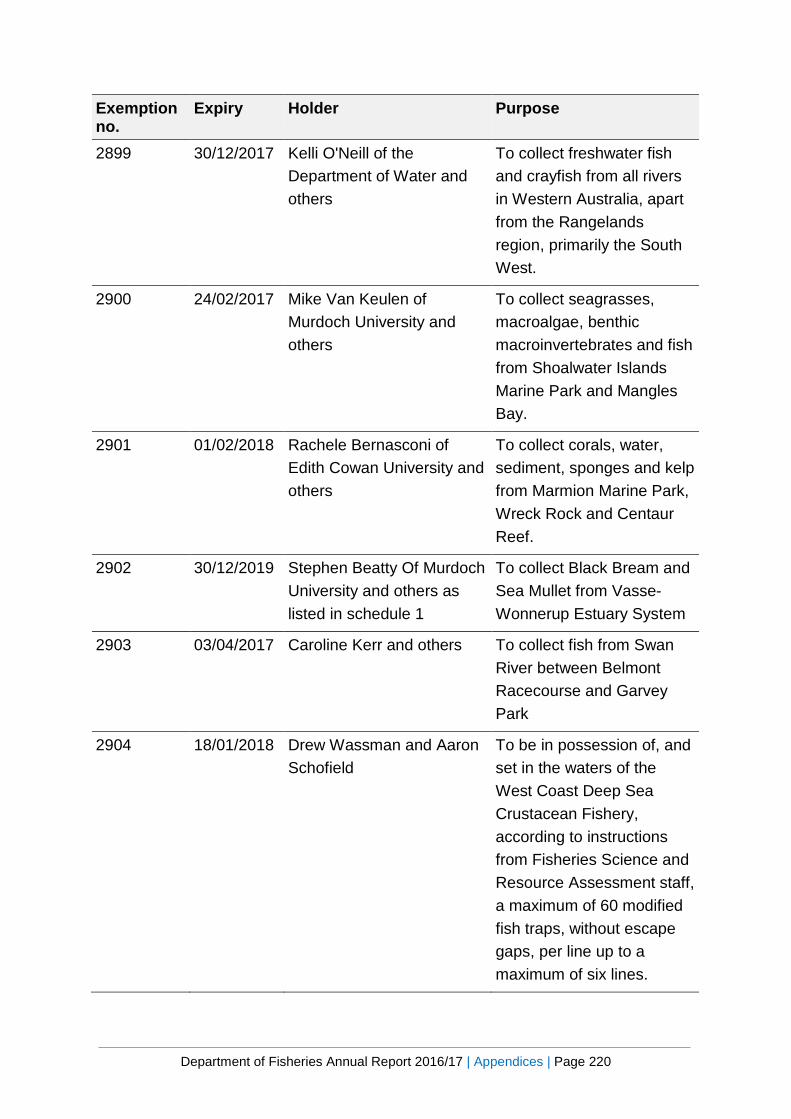
Department of Fisheries Annual Report 2016/17 | Appendices | Page 220
Exemption no.
Expiry Holder Purpose
2899 30/12/2017 Kelli O'Neill of the Department of Water and others
To collect freshwater fish and crayfish from all rivers in Western Australia, apart from the Rangelands region, primarily the South West.
2900 24/02/2017 Mike Van Keulen of Murdoch University and others
To collect seagrasses, macroalgae, benthic macroinvertebrates and fish from Shoalwater Islands Marine Park and Mangles Bay.
2901 01/02/2018 Rachele Bernasconi of Edith Cowan University and others
To collect corals, water, sediment, sponges and kelp from Marmion Marine Park, Wreck Rock and Centaur Reef.
2902 30/12/2019 Stephen Beatty Of Murdoch University and others as listed in schedule 1
To collect Black Bream and Sea Mullet from Vasse-Wonnerup Estuary System
2903 03/04/2017 Caroline Kerr and others To collect fish from Swan River between Belmont Racecourse and Garvey Park
2904 18/01/2018 Drew Wassman and Aaron Schofield
To be in possession of, and set in the waters of the West Coast Deep Sea Crustacean Fishery, according to instructions from Fisheries Science and Resource Assessment staff, a maximum of 60 modified fish traps, without escape gaps, per line up to a maximum of six lines.
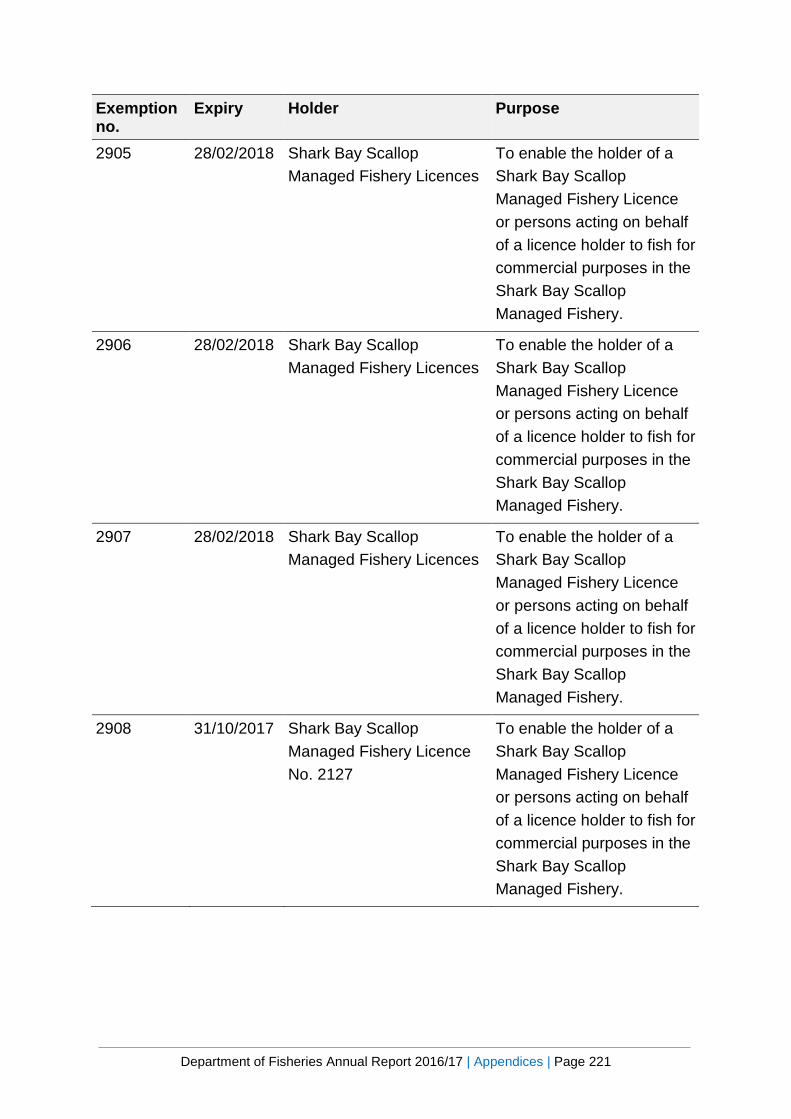
Department of Fisheries Annual Report 2016/17 | Appendices | Page 221
Exemption no.
Expiry Holder Purpose
2905 28/02/2018 Shark Bay Scallop Managed Fishery Licences
To enable the holder of a Shark Bay Scallop Managed Fishery Licence or persons acting on behalf of a licence holder to fish for commercial purposes in the Shark Bay Scallop Managed Fishery.
2906 28/02/2018 Shark Bay Scallop Managed Fishery Licences
To enable the holder of a Shark Bay Scallop Managed Fishery Licence or persons acting on behalf of a licence holder to fish for commercial purposes in the Shark Bay Scallop Managed Fishery.
2907 28/02/2018 Shark Bay Scallop Managed Fishery Licences
To enable the holder of a Shark Bay Scallop Managed Fishery Licence or persons acting on behalf of a licence holder to fish for commercial purposes in the Shark Bay Scallop Managed Fishery.
2908 31/10/2017 Shark Bay Scallop Managed Fishery Licence No. 2127
To enable the holder of a Shark Bay Scallop Managed Fishery Licence or persons acting on behalf of a licence holder to fish for commercial purposes in the Shark Bay Scallop Managed Fishery.
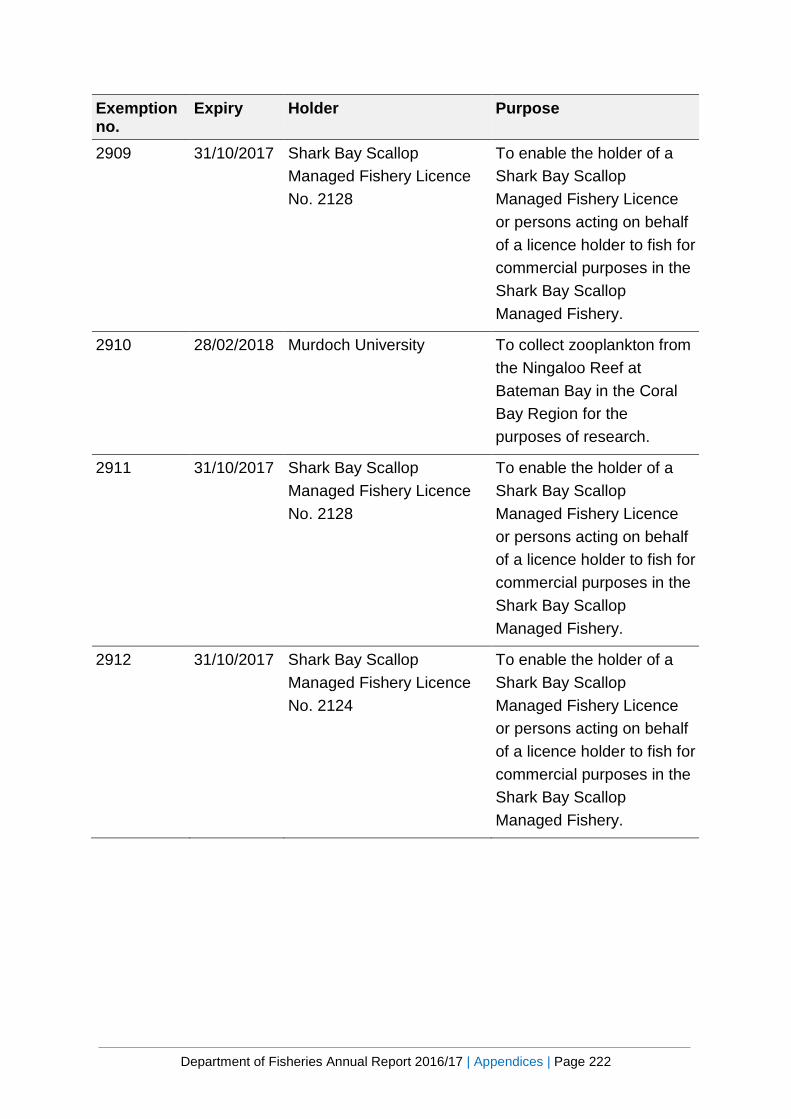
Department of Fisheries Annual Report 2016/17 | Appendices | Page 222
Exemption no.
Expiry Holder Purpose
2909 31/10/2017 Shark Bay Scallop Managed Fishery Licence No. 2128
To enable the holder of a Shark Bay Scallop Managed Fishery Licence or persons acting on behalf of a licence holder to fish for commercial purposes in the Shark Bay Scallop Managed Fishery.
2910 28/02/2018 Murdoch University To collect zooplankton from the Ningaloo Reef at Bateman Bay in the Coral Bay Region for the purposes of research.
2911 31/10/2017 Shark Bay Scallop Managed Fishery Licence No. 2128
To enable the holder of a Shark Bay Scallop Managed Fishery Licence or persons acting on behalf of a licence holder to fish for commercial purposes in the Shark Bay Scallop Managed Fishery.
2912 31/10/2017 Shark Bay Scallop Managed Fishery Licence No. 2124
To enable the holder of a Shark Bay Scallop Managed Fishery Licence or persons acting on behalf of a licence holder to fish for commercial purposes in the Shark Bay Scallop Managed Fishery.
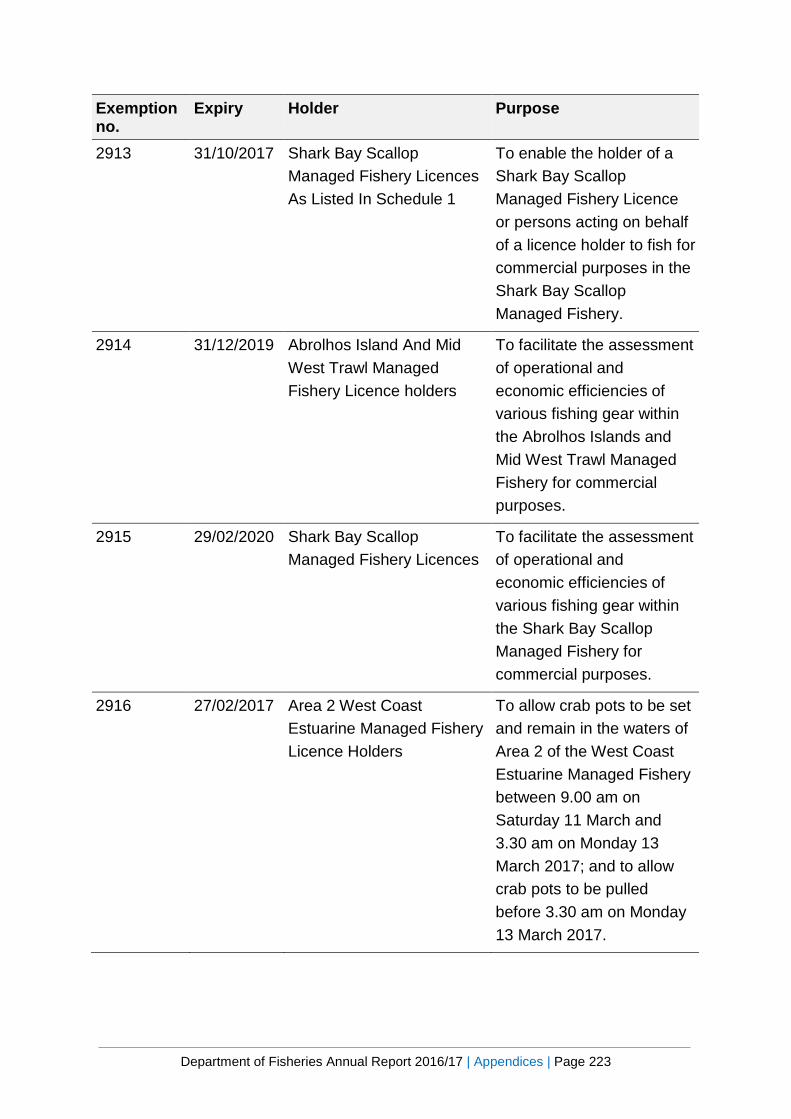
Department of Fisheries Annual Report 2016/17 | Appendices | Page 223
Exemption no.
Expiry Holder Purpose
2913 31/10/2017 Shark Bay Scallop Managed Fishery Licences As Listed In Schedule 1
To enable the holder of a Shark Bay Scallop Managed Fishery Licence or persons acting on behalf of a licence holder to fish for commercial purposes in the Shark Bay Scallop Managed Fishery.
2914 31/12/2019 Abrolhos Island And Mid West Trawl Managed Fishery Licence holders
To facilitate the assessment of operational and economic efficiencies of various fishing gear within the Abrolhos Islands and Mid West Trawl Managed Fishery for commercial purposes.
2915 29/02/2020 Shark Bay Scallop Managed Fishery Licences
To facilitate the assessment of operational and economic efficiencies of various fishing gear within the Shark Bay Scallop Managed Fishery for commercial purposes.
2916 27/02/2017 Area 2 West Coast Estuarine Managed Fishery Licence Holders
To allow crab pots to be set and remain in the waters of Area 2 of the West Coast Estuarine Managed Fishery between 9.00 am on Saturday 11 March and 3.30 am on Monday 13 March 2017; and to allow crab pots to be pulled before 3.30 am on Monday 13 March 2017.
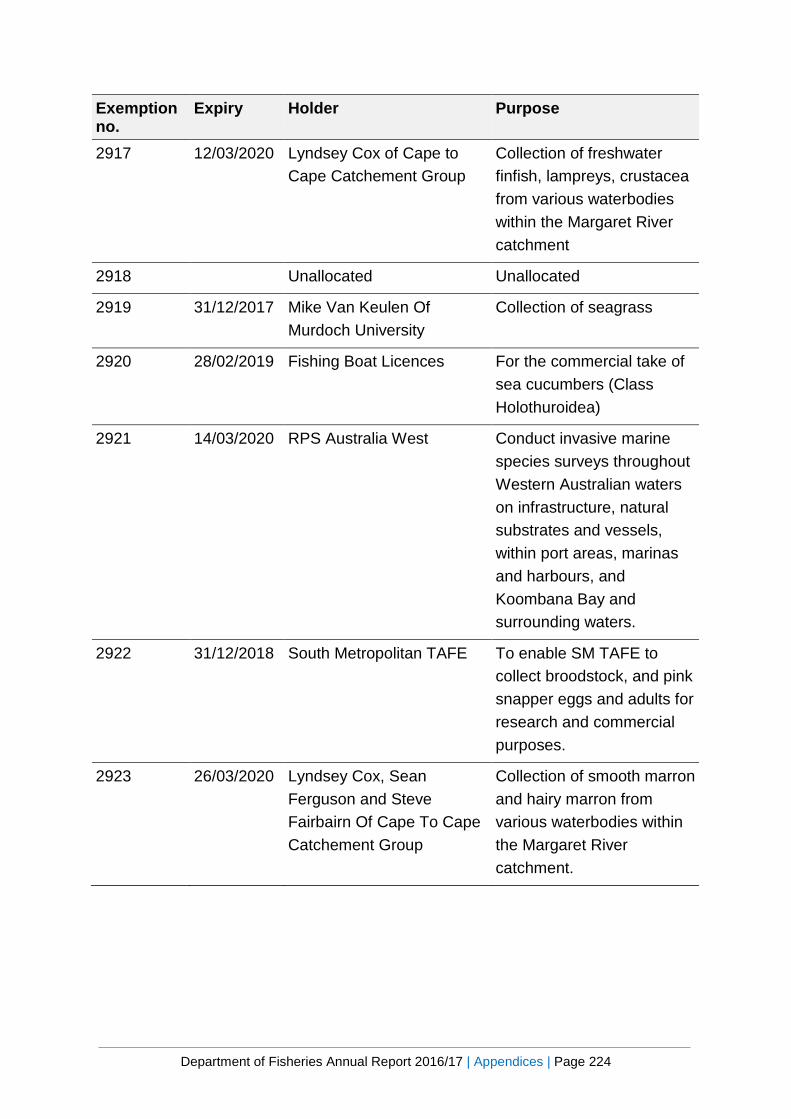
Department of Fisheries Annual Report 2016/17 | Appendices | Page 224
Exemption no.
Expiry Holder Purpose
2917 12/03/2020 Lyndsey Cox of Cape to Cape Catchement Group
Collection of freshwater finfish, lampreys, crustacea from various waterbodies within the Margaret River catchment
2918 Unallocated Unallocated
2919 31/12/2017 Mike Van Keulen Of Murdoch University
Collection of seagrass
2920 28/02/2019 Fishing Boat Licences For the commercial take of sea cucumbers (Class Holothuroidea)
2921 14/03/2020 RPS Australia West Conduct invasive marine species surveys throughout Western Australian waters on infrastructure, natural substrates and vessels, within port areas, marinas and harbours, and Koombana Bay and surrounding waters.
2922 31/12/2018 South Metropolitan TAFE To enable SM TAFE to collect broodstock, and pink snapper eggs and adults for research and commercial purposes.
2923 26/03/2020 Lyndsey Cox, Sean Ferguson and Steve Fairbairn Of Cape To Cape Catchement Group
Collection of smooth marron and hairy marron from various waterbodies within the Margaret River catchment.
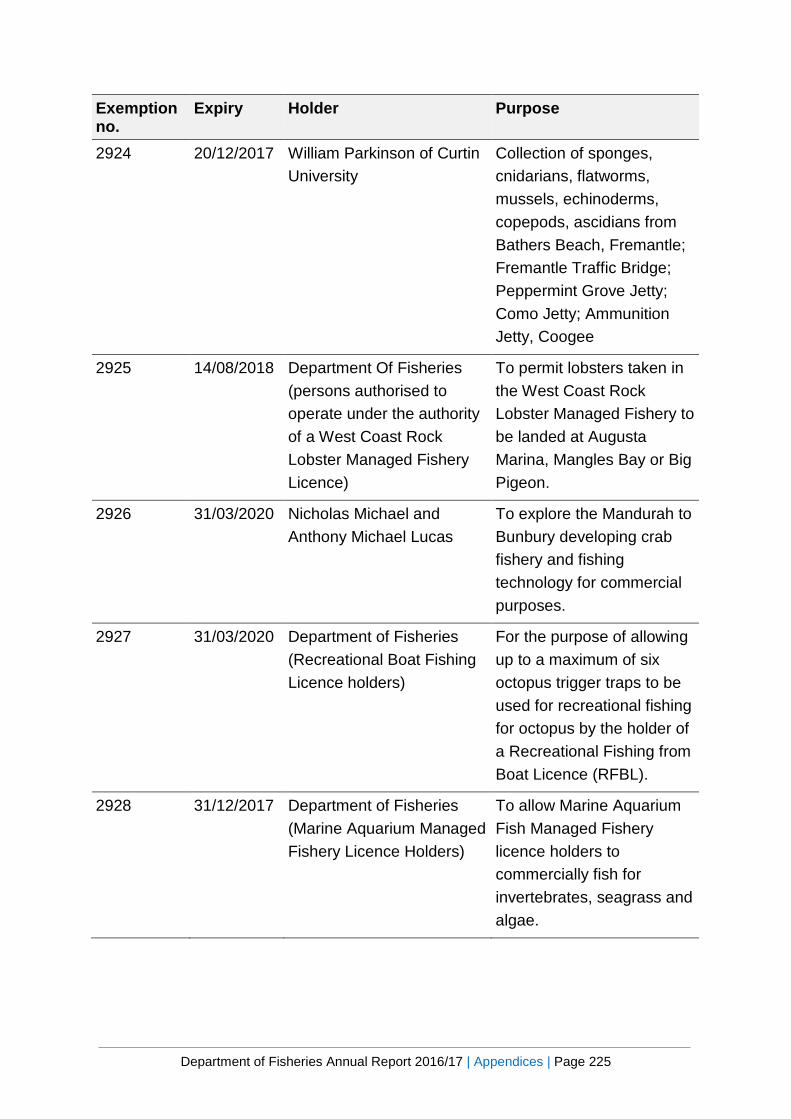
Department of Fisheries Annual Report 2016/17 | Appendices | Page 225
Exemption no.
Expiry Holder Purpose
2924 20/12/2017 William Parkinson of Curtin University
Collection of sponges, cnidarians, flatworms, mussels, echinoderms, copepods, ascidians from Bathers Beach, Fremantle; Fremantle Traffic Bridge; Peppermint Grove Jetty; Como Jetty; Ammunition Jetty, Coogee
2925 14/08/2018 Department Of Fisheries (persons authorised to operate under the authority of a West Coast Rock Lobster Managed Fishery Licence)
To permit lobsters taken in the West Coast Rock Lobster Managed Fishery to be landed at Augusta Marina, Mangles Bay or Big Pigeon.
2926 31/03/2020 Nicholas Michael and Anthony Michael Lucas
To explore the Mandurah to Bunbury developing crab fishery and fishing technology for commercial purposes.
2927 31/03/2020 Department of Fisheries (Recreational Boat Fishing Licence holders)
For the purpose of allowing up to a maximum of six octopus trigger traps to be used for recreational fishing for octopus by the holder of a Recreational Fishing from Boat Licence (RFBL).
2928 31/12/2017 Department of Fisheries (Marine Aquarium Managed Fishery Licence Holders)
To allow Marine Aquarium Fish Managed Fishery licence holders to commercially fish for invertebrates, seagrass and algae.
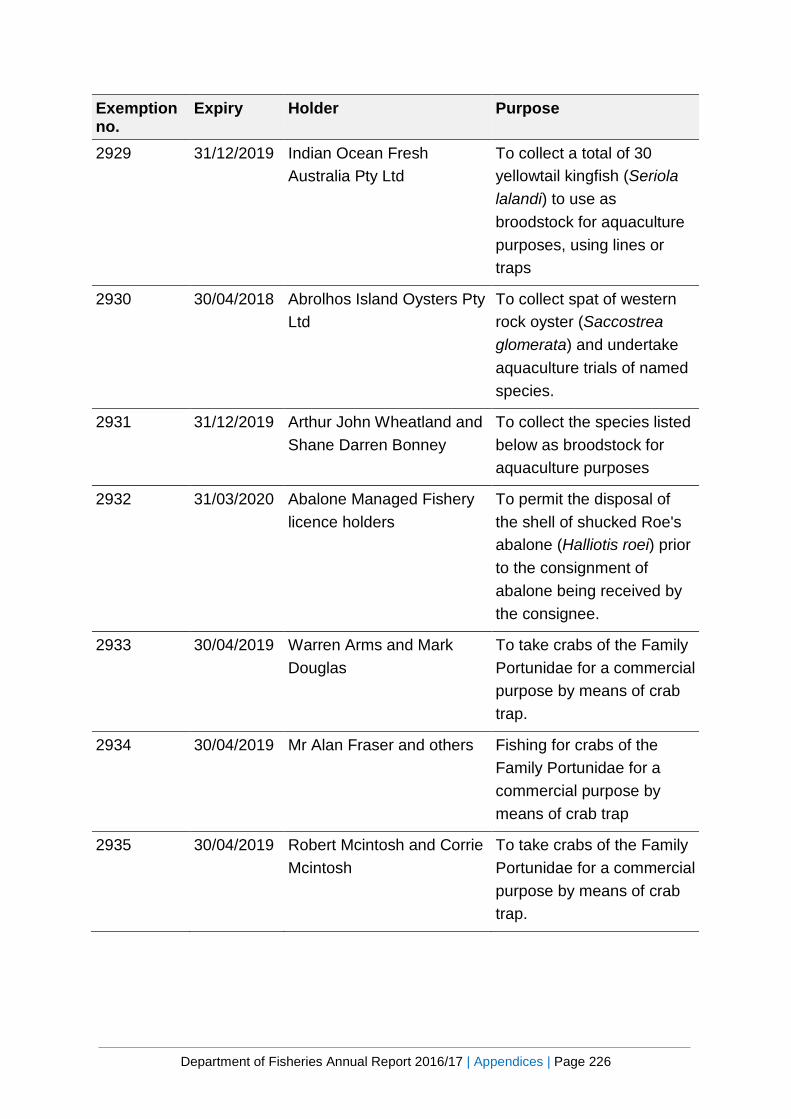
Department of Fisheries Annual Report 2016/17 | Appendices | Page 226
Exemption no.
Expiry Holder Purpose
2929 31/12/2019 Indian Ocean Fresh Australia Pty Ltd
To collect a total of 30 yellowtail kingfish (Seriola lalandi) to use as broodstock for aquaculture purposes, using lines or traps
2930 30/04/2018 Abrolhos Island Oysters Pty Ltd
To collect spat of western rock oyster (Saccostrea glomerata) and undertake aquaculture trials of named species.
2931 31/12/2019 Arthur John Wheatland and Shane Darren Bonney
To collect the species listed below as broodstock for aquaculture purposes
2932 31/03/2020 Abalone Managed Fishery licence holders
To permit the disposal of the shell of shucked Roe's abalone (Halliotis roei) prior to the consignment of abalone being received by the consignee.
2933 30/04/2019 Warren Arms and Mark Douglas
To take crabs of the Family Portunidae for a commercial purpose by means of crab trap.
2934 30/04/2019 Mr Alan Fraser and others Fishing for crabs of the Family Portunidae for a commercial purpose by means of crab trap
2935 30/04/2019 Robert Mcintosh and Corrie Mcintosh
To take crabs of the Family Portunidae for a commercial purpose by means of crab trap.

Department of Fisheries Annual Report 2016/17 | Appendices | Page 227
Exemption no.
Expiry Holder Purpose
2936 31/12/2019 Department of Fisheries (Exmouth Gulf Prawn Managed Fishery Licences)
To improve the overall operational efficiency of the Exmouth Gulf Prawn Managed Fishery fleet for commercial purposes through the development of fishing technology.
2937 30/07/2018 Casper Avenant of Edith Cowan University and others
To collect fish, seagrass and macroalgae from Marmion Marine Park and Cockburn Sound/Success Bank.
2938 07/05/2017 Professor Paul Lavery of Edith Cowan University and others
To collect fish from Walpole and Nornalup Inlets Marine Park
2939 31/10/2017 WCLL holders and others To provide further information on permitting the retention of setose western rock lobster in contributing to reducing whale entanglements in the West Coast Rock Lobster Managed Fishery, and to provide the industry with the opportunity to further market setose western rock lobster
2940 31/03/2019 Megan Huggett of Edith Cowan University and others
To collect corals, sponges and macroalgae.
2941 31/05/2021 Captain Stuart Davey, Harbour Master of Fremantle Ports
To use, or to engage a vessel to use, trawl nets to remove seawrack from the waters of the Success Bank shipping channel
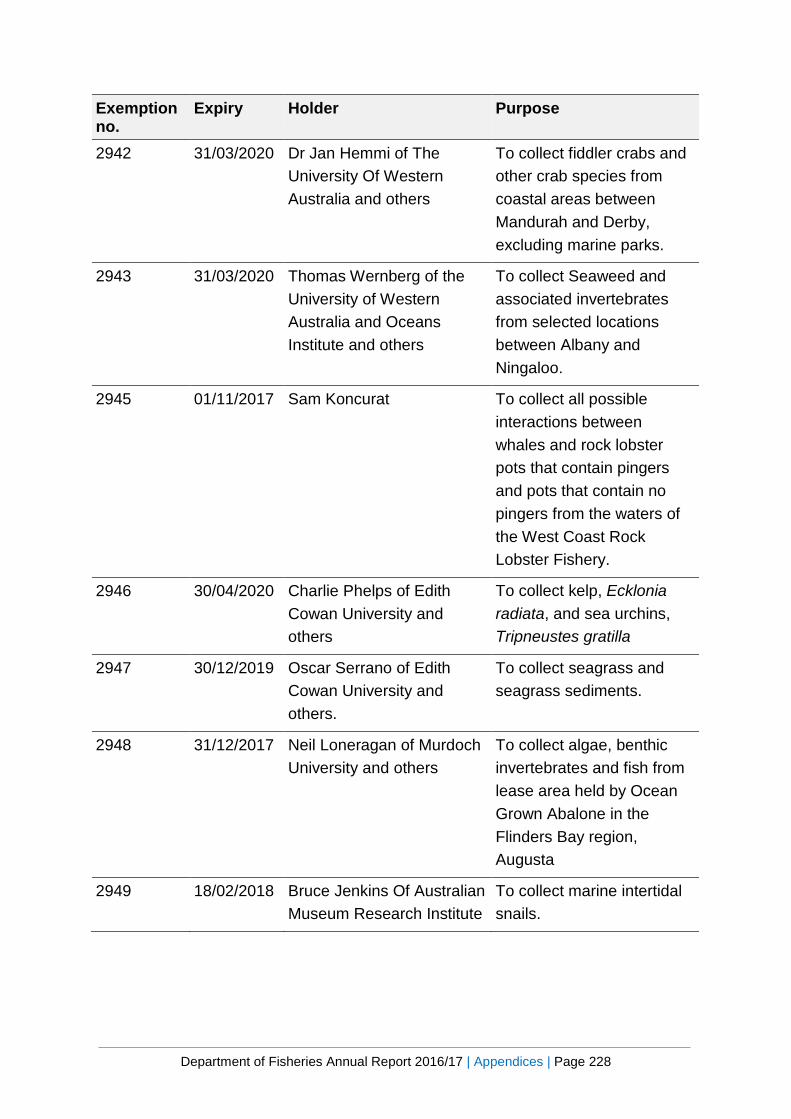
Department of Fisheries Annual Report 2016/17 | Appendices | Page 228
Exemption no.
Expiry Holder Purpose
2942 31/03/2020 Dr Jan Hemmi of The University Of Western Australia and others
To collect fiddler crabs and other crab species from coastal areas between Mandurah and Derby, excluding marine parks.
2943 31/03/2020 Thomas Wernberg of the University of Western Australia and Oceans Institute and others
To collect Seaweed and associated invertebrates from selected locations between Albany and Ningaloo.
2945 01/11/2017 Sam Koncurat To collect all possible interactions between whales and rock lobster pots that contain pingers and pots that contain no pingers from the waters of the West Coast Rock Lobster Fishery.
2946 30/04/2020 Charlie Phelps of Edith Cowan University and others
To collect kelp, Ecklonia radiata, and sea urchins, Tripneustes gratilla
2947 30/12/2019 Oscar Serrano of Edith Cowan University and others.
To collect seagrass and seagrass sediments.
2948 31/12/2017 Neil Loneragan of Murdoch University and others
To collect algae, benthic invertebrates and fish from lease area held by Ocean Grown Abalone in the Flinders Bay region, Augusta
2949 18/02/2018 Bruce Jenkins Of Australian Museum Research Institute
To collect marine intertidal snails.
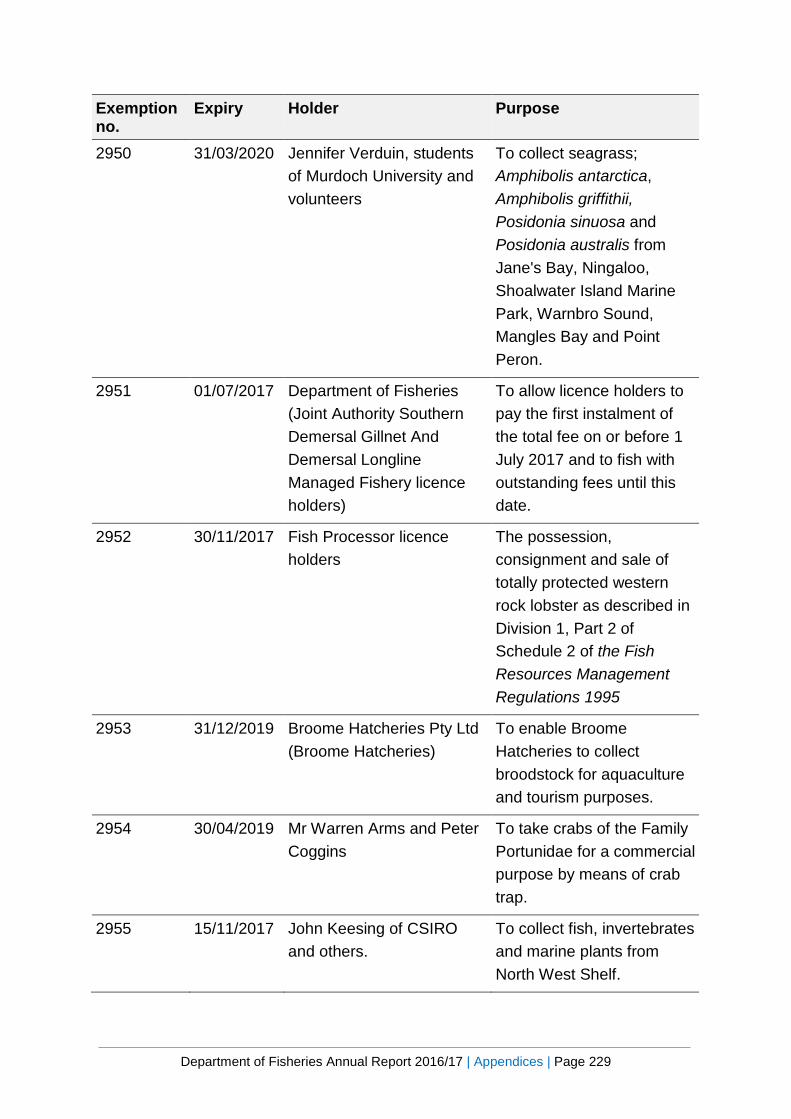
Department of Fisheries Annual Report 2016/17 | Appendices | Page 229
Exemption no.
Expiry Holder Purpose
2950 31/03/2020 Jennifer Verduin, students of Murdoch University and volunteers
To collect seagrass; Amphibolis antarctica, Amphibolis griffithii, Posidonia sinuosa and Posidonia australis from Jane's Bay, Ningaloo, Shoalwater Island Marine Park, Warnbro Sound, Mangles Bay and Point Peron.
2951 01/07/2017 Department of Fisheries (Joint Authority Southern Demersal Gillnet And Demersal Longline Managed Fishery licence holders)
To allow licence holders to pay the first instalment of the total fee on or before 1 July 2017 and to fish with outstanding fees until this date.
2952 30/11/2017 Fish Processor licence holders
The possession, consignment and sale of totally protected western rock lobster as described in Division 1, Part 2 of Schedule 2 of the Fish Resources Management Regulations 1995
2953 31/12/2019 Broome Hatcheries Pty Ltd (Broome Hatcheries)
To enable Broome Hatcheries to collect broodstock for aquaculture and tourism purposes.
2954 30/04/2019 Mr Warren Arms and Peter Coggins
To take crabs of the Family Portunidae for a commercial purpose by means of crab trap.
2955 15/11/2017 John Keesing of CSIRO and others.
To collect fish, invertebrates and marine plants from North West Shelf.
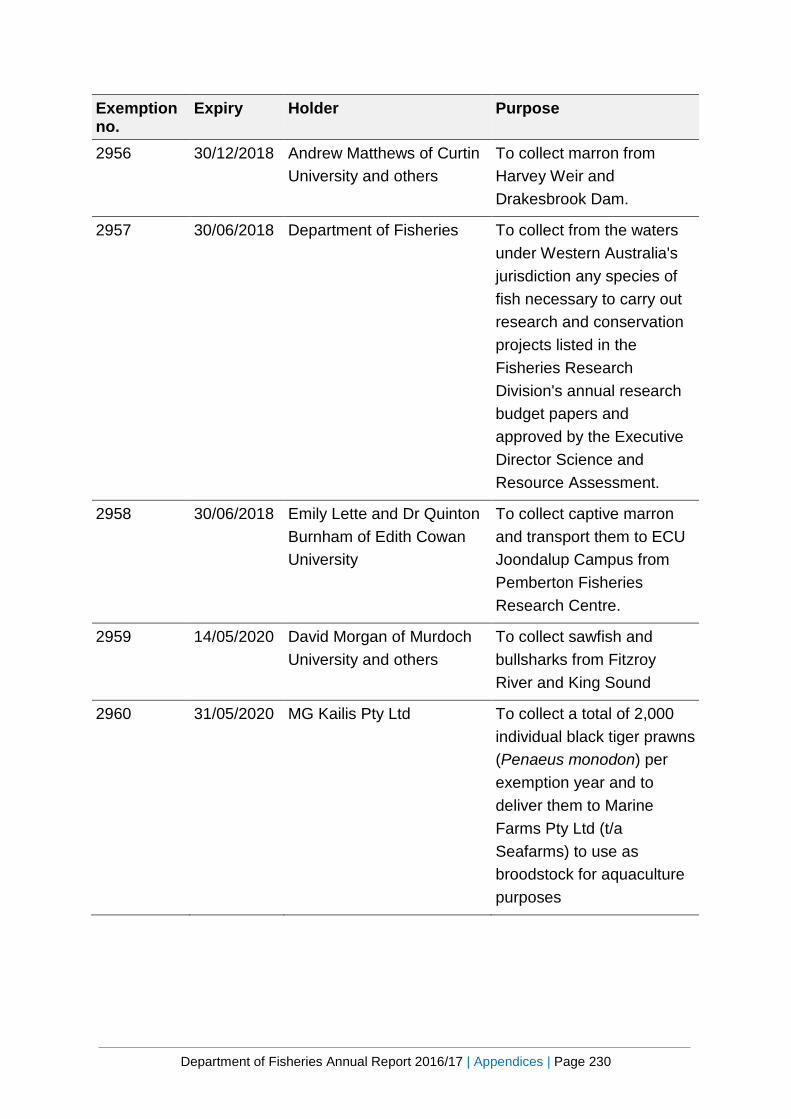
Department of Fisheries Annual Report 2016/17 | Appendices | Page 230
Exemption no.
Expiry Holder Purpose
2956 30/12/2018 Andrew Matthews of Curtin University and others
To collect marron from Harvey Weir and Drakesbrook Dam.
2957 30/06/2018 Department of Fisheries To collect from the waters under Western Australia's jurisdiction any species of fish necessary to carry out research and conservation projects listed in the Fisheries Research Division's annual research budget papers and approved by the Executive Director Science and Resource Assessment.
2958 30/06/2018 Emily Lette and Dr Quinton Burnham of Edith Cowan University
To collect captive marron and transport them to ECU Joondalup Campus from Pemberton Fisheries Research Centre.
2959 14/05/2020 David Morgan of Murdoch University and others
To collect sawfish and bullsharks from Fitzroy River and King Sound
2960 31/05/2020 MG Kailis Pty Ltd To collect a total of 2,000 individual black tiger prawns (Penaeus monodon) per exemption year and to deliver them to Marine Farms Pty Ltd (t/a Seafarms) to use as broodstock for aquaculture purposes

Department of Fisheries Annual Report 2016/17 | Appendices | Page 231
Exemption no.
Expiry Holder Purpose
2961 31/12/2018 South Metropolitan TAFE Educational programs for training South Metropolitan TAFE students in commercial fishing practices.
2962 10/07/2017 Mike Van Keulen, staff and students Of Murdoch University
To collect macroalgae and benthic invertebrates from Ningaloo Marine Park
2963 31/03/2018 Jane Prince, Matilda Murley and Madeleine Ince of the University of Western Australia.
To collect macro-invertebrates from Engidine, Cowrie Creek, Saddle Hill, Gourdon Bay (western end), Lighthouse, Redpoint and Corkbark
2964 30/06/2018 Department Of Fisheries (Department of Parks and Wildlife)
For the purposes of enabling the personnel of the Department of Parks and Wildlife to undertake research and monitoring projects to support adaptive management of the State’s marine parks and reserves and aquatic environment.


