HICL Infrastructure Company Limited (formerly HSBC Infrastructure Company Limited)
Annual Report & ConsolidatedFinancial Statements
for the year ended 31 March 2011

01 Information on HICL Infrastructure Company Limited
01 Company Summary
02 Highlights
03 Results on an Investment basis
03 Net Asset Values
03 Results on a Consolidated IFRS basis
04 Chairman’s Statement
08 The Group’s Investment Portfolio
09 Investment Policy
11 Investment Adviser’s Report
18 Financial Results
22 Unaudited Consolidated Proforma Financial Statements
25 Notes to the Unaudited Consolidated Proforma
Financial Statements
26 Analysis of the Group’s Portfolio
28 Ten Largest Investments
31 Risks and Risk Management
34 Board of Directors
35 Report of the Directors
38 Statement of Directors’ Responsibilities
39 Corporate Governance
44 Corporate Social Responsibility
46 Independent Auditors’ Report to the Members of
HICL Infrastructure Company Limited
47 Consolidated Financial Statements
51 Notes to the Consolidated Financial Statements
86 Company Financial Statements
90 Notes to the Company Financial Statements
92 Directors and Advisers
Contents

H I C L A N N U A L R E P O R T & A C C O U N T S 2 0 1 1 1
Information on HICL Infrastructure Company Limited
HICL Infrastructure Company Limited (“HICL” or the “Company” or, together with its 100% owned holding company subsidiaries, the “Group”)was the first investment company listed on the London Stock Exchange set up to invest in infrastructure projects. It was successfully launchedin March 2006 as HSBC Infrastructure Company Ltd, and raised £250m with which it purchased an initial portfolio (the “Initial Portfolio”) ofinterests in 15 PFI/PPP projects. It changed its name in March 2011.
In May 2008, December 2009, and December 2010 the Company raised further equity capital by way of C share issues which were converted intoordinary shares. As at 23 May 2011, it has a portfolio of 40 interests in infrastructure projects in the UK, the Netherlands and Canada.
Since launch, the Company has paid the following dividends:
first period to second year to third year to fourth year to fifth year to 31 March 2007 31 March 2008 31 March 2009 31 March 2010 31 March 2011
total of 6.1p total of 6.25p total of 6.4p total of 6.55p total of 6.7p1
1. Second interim to be paid end of June 2011
The Company is targeting a progressive distribution policy and growth of annual distributions to 7.0p per share by March 2013. The long-termtarget Internal Rate of Return (“IRR”) is around 7% (as stated in the 2010 C share prospectus based on the predicted C share conversion ratio).
At launch in March 2006, 250,000,000 Ordinary Shares were issued. With the conversion of the C Shares, together with shares issued as aresult of the block listing announcements made by the Company and scrip dividend issues, the total Ordinary Shares in issue at 31 March 2011were 595,139,454.
The Investment Adviser to the Company is InfraRed Capital Partners Limited, which is authorised and regulated by the Financial ServicesAuthority. The Investment Adviser was part of the HSBC Group until it was sold as part of a majority interest in the infrastructure and real estatefund management business to senior management in April 2011, with HSBC retaining a 19.9% stake. The InfraRed infrastructure team nowcomprises 35 staff in offices in London, Paris and New York. Nine are dedicated to advising the Group, and a further three allocate a part of theirtime to supporting the Group.
Company Summary
Investment Adviser (“IA”) and Operator InfraRed Capital Partners Ltd which is a wholly owned subsidiary of InfraRed Partners LLP,which is owned 80.1% by senior management and 19.9% by a subsidiary of HSBCHoldings plc
Company Secretary and Administrator Dexion Capital (Guernsey) Ltd
Shareholders’ funds £657.0m on an IFRS basis (£673.2m on an Investment basis) as at 31 March 2011
Market capitalisation £702m as at 31 March 2011
Investment Adviser and Operator Fees n 1.1%1 p.a. of the Adjusted Gross Asset Value2 of the investments up to £750m1.0% thereafter
n 1.0% of the value of new acquisitions3
n £0.1m p.a. investment advisory feen No performance feen All fees from underlying Project Companies paid to the Group (and not to the IA)
ISA, PEP and SIPP status The ordinary shares are eligible for inclusion in PEPs and ISAs (subject to applicablesubscription limits) provided that they have been acquired by purchase in the market andthey are permissible assets for SIPPs
Investment policy The Company’s investment policy is set out on pages 9 and 10 and can also be found onthe Company’s website
Website www.hicl.com
Notes:1. For assets in construction or ramp-up the rate is 1.5%2. Adjusted Gross Asset Value means fair market value, without deductions for borrowed money or other liabilities or accruals, and including outstanding
subscription obligations.3. Does not apply to acquisitions sourced from the InfraRed Capital Partner Group, or entities managed by it.

2 H I C L A N N U A L R E P O R T & A C C O U N T S 2 0 1 1
Highlights
for the year ended 31 March 2011 (on an Investment basis unless noted otherwise1)
Portfolio performance robust with good cash generation despite economic climate
Five new investments and four incremental stakes acquired, with a combinedinvestment of £151.0m
Significant pipeline of further investment opportunities under consideration
Successful raising of £159.0m (before expenses) through a C share capital raisingof £110.0m in December 2010 and utilising the block listing to place 41.7m sharesin the year
Net asset value (“NAV”) per share at 31 March 2011 of 110.4p (2010: 107.1p) ona consolidated IFRS basis and 113.1p (2010: 110.7p) on an Investment basis
NAV per share post distribution of 109.7p at 31 March 2011 compared to 107.4pat 31 March 2010, a 2.1% increase
Directors’ Valuation of the portfolio at 31 March 2011 of £673.1m, up from£509.6m at 31 March 2010, 32.1% growth
Profit before tax of £45.2m (2010: £25.0m)
Second interim distribution of 3.425p for the year to 31 March 2011 declared, witha scrip dividend alternative, giving total distributions of 6.7p for the year, anincrease of 2.3%
1. In order to provide shareholders with further information regarding the Group’s net asset value, coupled with greater transparency in the Company’s capacity forinvestment and ability to make distributions, as in previous periods, the results have been restated in proforma tables with all investments accounted for on anInvestment basis.

H I C L A N N U A L R E P O R T & A C C O U N T S 2 0 1 1 3
Results on an Investment Basis
for the year to 31 March 2011 31 March 2010
Profit before tax (Revenue) £24.3m £17.8m
Profit before tax (Capital) £20.9m £7.2m
Profit before tax £45.2m £25.0m
Earnings per share 8.9p 6.5p
Second interim dividend per share 3.425p 3.35p
Total dividend per share in year 6.7p 6.55p
Net Asset Values
ConsolidatedInvestment basis IFRS basis
Net Asset Value (NAV) per share at listing 98.4p 98.4p
Net Asset Value (NAV) per share at 31 March 2011 113.1p 110.4p
Second interim dividend per share (declared 19 May 2011) 3.425p 3.425p
NAV per share at 31 March 2011 after deducting the second interim dividend 109.7p 107.0p
NAV per share at 31 March 2010 after deducting the second interim dividend 107.4p 103.8p
Results on a Consolidated IFRS Basis
for the year to 31 March 2011 31 March 2010
Profit before tax (Revenue) £19.6m £25.3m
Profit/(loss) before tax (Capital) £18.7m £(17.6)m
Profit before tax £38.3m £7.7m
Earnings per share 9.0p 1.6p
Second interim dividend per share 3.425p 3.35p
Total dividend per share in year 6.7p 6.55p

4 H I C L A N N U A L R E P O R T & A C C O U N T S 2 0 1 1
Chairman’s Statement
Introduction
On behalf of the Board, I am pleased to report another successfulyear for the Company. The Company is now 5 years old and hasexceeded the objectives set out at launch in 2006. The last five yearshave seen great changes in economic and financial prospects forglobal economies and it is a testament to the infrastructure assetclass that the Company has been able to deliver a stable, growingyield for investors.
Financial Results and Performance
Financial ResultsAs in previous periods, the Company has prepared pro-formaaccounts on an Investment basis (treating all 38 holdings asinvestments). Profit before tax on an Investment basis was £45.2m(2010: £25.0m) and earnings per share on an Investment basis were8.9p (2010: 6.5p per share). This increase is driven by thecontributions from acquisitions supported by continued solidportfolio performance including an increase in the value of theKemble Water junior loan. Cash received from the portfolio by way ofdistributions, capital repayments and fees was £45.6m (2010:£39.2m). After Group costs, net cash of £34.9m adequately coversthe distributions paid in the year. Cash generation growth was in linewith our projections benefitting from acquisitions in the current andthe prior year.
On a consolidated IFRS basis, the profit before tax was £38.3m(2010: £7.7m).
Profit before tax has benefited strongly from positive fair valuemovements assisted by higher inflation and an uplift in the markto market value of the Kemble Water junior loan which has sincebeen repaid.
The Company has raised a total of £156.7m net of expenses throughthe issue and placing of new shares, of which £108.1m was raisedthrough the successful C share capital raising in December 2010which was oversubscribed.
Total fees accruing to InfraRed Capital Partners Limited (theInvestment Adviser) amounted to £8.1m in the year, relating to their1.1% p.a. management fee (1.5% p.a. assets in construction) and the1.0% fee on the acquisitions made, and £0.1m advisory fees. TheInvestment Adviser does not receive any fees from the investmentproject companies in the portfolio, and hence all fees from thesecompanies are for the benefit of the Group. In addition, the Groupcontracted with other parts of the HSBC Group on an arm’s lengthbasis for the provision of bank accounts, foreign exchange hedgesand insurance broking.
The total expense ratio for the Group on an Investment basis was1.20% (being the Group’s operational expenses excludingacquisition costs, divided by the Group’s net assets on an Investmentbasis). This compares with 1.45% for the year to 31 March 2010, thereduction in this ratio reflecting the benefit of capital raisings witheconomies of scale.
More details of the financial results are set out below.
Portfolio PerformanceThe Group’s portfolio continues to perform well, and as at 31 March2011 consisted of 37 PFI/PPP/P3 projects and an investment in thejunior loan in Kemble Water. The junior loan was repaid in full in April2011, ahead of its maturity.
The Group has two projects currently under construction. On theBradford BSF Schools project, construction work on the last schoolhas just been finished and the premises are being fitted out readyfor occupation. Construction work on the M80 DBFO Road inScotland and the North West Anthony Henday Road in Canadacontinues to plan.
The Investment Adviser’s asset management team has been engagedacross the whole portfolio and has been in dialogue with our publicsector clients and our partners seeking ways to increase efficienciesand find savings. This work has been pro-active throughout the year,and has included participation in a detailed review by the Ministry ofDefence (“MOD”) on one of our MOD projects.
ValuationAs in previous periods, the Investment Adviser has prepared a fairmarket valuation for each investment in the portfolio as at 31 March2011. For the PFI/PPP/P3 investments, this valuation is based on adiscounted cashflow analysis of the future expected equity and loannote cashflows accruing to the Group from each investment. Thisvaluation uses key assumptions which are derived from a review ofrecent comparable market transactions in order to arrive at a fairmarket value.
The Directors have satisfied themselves with the methodology used,the economic assumptions, and the discount rates applied. TheDirectors have again taken independent third party advice on thevaluation carried out by the Investment Adviser.
The Directors have approved the valuation of £673.1m for theportfolio of 38 investments as at 31 March 2011. On the M80Motorway DBFO, North-West Anthony Henday Road P3 and theHelicopter Training projects there are combined outstandinginvestment commitments of £47.0m.
The valuation of £673.1m compares with £509.6m as at 31 March2010 and £563.3m as at 30 September 2010. An analysis of thegrowth in the valuation is detailed in the Investment Adviser’s Report.
On an Investment basis the NAV per share is 113.1p at 31 March2011 (2010: 110.7p). The Investment basis NAV per share after thesecond interim distribution at 31 March 2011 was 109.7p; anincrease of 2.3p over the comparable figure at 31 March 2010 beingdue to a robust performance from the portfolio coupled withincremental earnings from new investments, as described in moredetail in the Investment Adviser’s Report.
The resulting NAV per share on an IFRS basis as at 31 March 2011 is110.4p (2010: 107.1p).

H I C L A N N U A L R E P O R T & A C C O U N T S 2 0 1 1 5
AcquisitionsThe Group has had a successful year and has made £112.3m of newinvestments and £38.7m of incremental acquisitions for a total of£151.0m including outstanding equity commitments. The Groupacquired its first P3 investments in Canada and increased the numberof projects under construction to three with Bradford schoolscompleting subsequent to year end. Since the period end the Grouphas acquired interests in 3 operational UK PFI schools (Norwich,Oldham and Sheffield) for £17.2m and the Kemble Water junior loanhas been repaid.
Distributions
The Board declared on 19 May 2011 a second interim distribution of3.425p per share for the year to 31 March 2011 (2010: 3.35p). Thisbrings the total distributions declared to 6.7p for the year to31 March 2011 representing a 2.3% growth on the prior year.
A circular will be sent to shareholders on 3 June to explain the scripdividend alternative. Shareholders need to decide by 17 June onwhether to take up the scrip dividend offer in part or in full. Thedistribution (or scrip dividend) will be paid to those shareholders onthe register as at 27 May, and will be settled at the end of June.
At the Annual General Meeting (“AGM”) in July 2010, shareholdersgave the Board the power to offer a scrip dividend alternative and thispower runs until the next AGM in 2011. Based on the take-up andcurrent feedback from shareholders, it is the Board’s current intentionto seek a renewal of this power at the forthcoming AGM in July.
Risks and Uncertainties
The 2010 Comprehensive Spending Review in the UK focusedpredominantly on the need to cut public spending, whilst highlightingthe need for further investment in UK infrastructure to promoteeconomic growth. HM Treasury issued a guidance note in January2011 to explain how PFI contracts should be managed, highlightingthe need to seek efficiency savings where possible.
On a number of our UK PFI projects, the Investment Adviser has beenworking with public sector clients and key contractors, to find waysof generating gains for our clients. Together with our partners, wehave suggested ideas to create savings for our clients, and thenworked to deliver them. The Romford PFI Hospital project waschosen by HM Treasury as a pilot scheme for a governmentsponsored review. We, together with our partners, have engaged
willingly and constructively in this endeavour. The review is due toreport shortly and we are not aware of any findings which may be ofconcern to investors. Clearly our working assumption is that theoutcome from the review will be measures to improve contractperformance and delivery within the legal framework that wasagreed at inception. We would not welcome, nor do we expect, anyunilateral redefinition of the terms of the contract given the verywide implications that would then arise.
For new UK infrastructure projects, PFI is still being used selectively.As previously reported, this change in emphasis in procurementdoes not affect the Group, as our investment focus remains onprojects already procured and, normally, operational.
Each of the PFI projects within the portfolio has long-term funding inplace. There is therefore no refinancing risk in this regard. Projectsdo have exposures to banks in the form of interest rate swaps anddeposit accounts. These exposures are monitored and managedwhere appropriate.
The projects in the portfolio rely on contracting partners to provideservices. There is a good spread of service partners with no materialperformance or credit issues to report. The Investment Advisermonitors project performance, and if issues arise, action is taken tominimise any impact on performance.
Corporate Governance
Board and Investment Adviser ChangesHenri Grisius retired from the Board on 1 June 2010, having been adirector since the launch of the Company. Chris Russell joined theCompany as a Director on 1 June 2010. Chris is a Guernsey residentwho has spent his career in the investment management industry inthe UK, USA and Asia.
Since launch in 2006, the Investment Adviser to the Company hasbeen HSBC Specialist Fund Management Ltd (“HSFML”). In June2010, we announced that the senior management team of HSBC’sinfrastructure and real estate arm, of which the Investment Adviser ispart, had agreed outline terms with the HSBC Group for a change ofownership which would lead to the management team owning themajority interest in the business and HSBC retaining a 19.9% stake.The transaction successfully completed in April 2011, and theInvestment Adviser changed its name to InfraRed Capital PartnersLimited, relocating to new offices in central London.
“The year has seen some useful
additions to our portfolio
of investments, offering both
international exposure and
solid growth in UK PFI assets”

6 H I C L A N N U A L R E P O R T & A C C O U N T S 2 0 1 1
Chairman’s Statement (continued)
The Board met the Investment Adviser on a number of occasionsduring the year to seek and gain reassurance that this change ofownership would have no impact on the ability of the InvestmentAdviser to deliver the required services to the appropriate standards.We agreed a small number of amendments to the InvestmentAdviser’s contract which were beneficial to the Company, and we aresatisfied that we will continue to receive high quality service andcommitment from the Investment Adviser.
The Board also took the opportunity to review the level of feesearned by the Investment Adviser. Whilst appropriate at launch, theGroup has now doubled in size and therefore a change to the feestructure was considered appropriate. For investments undermanagement with an incremental value in excess of £750m, theInvestment Adviser’s incremental fee is reduced to 1.0% p.a. (from1.1% p.a.) with effect from 1 January 2011, provided that the assetshave become operational.
As the Company’s Investment Adviser is no longer a subsidiary ofthe HSBC Group, the trademark licence was terminated. TheCompany therefore changed its name to HICL InfrastructureCompany Limited on 29 March 2011. The Board believes that thisnew name will, while dispensing with the HSBC brand, preserve theCompany’s identity and maintain recognition amongst investors andthe wider marketplace.
As part of this process, the Company has updated and relaunched itswebsite at www.hicl.com. We have taken the opportunity to givemore background information about PFI and how HICL is organisedand managed.
GovernanceIn May 2010, the Financial Reporting Council issued a new edition ofthe UK Corporate Governance Code, and in October 2010, theAssociation of Investment Companies (the “AIC”) published itsupdated AIC Code of Corporate Governance. This AIC code has beenendorsed by the Financial Reporting Council and the Company haschosen to report governance against the updated AIC Code.
Corporate Social Responsibility
Public ProcurementPFI/PPP projects were originally conceived in the UK in the earlynineties by the then Conservative Government as a means ofprocuring new social infrastructure. This procurement method washoned by the subsequent Labour government and its success led toother countries implementing similar programmes.
PFI/PPP has not been immune from negative comment in the media.In some cases, this was justified since where PFI/PPP was not themost appropriate procurement method. In the last 9 months, mediainterest has intensified, particularly where public sector clients areseeking to reduce their budget deficits. This commentary can bemisleading and inaccurate, often omitting to mention that the publicsector client procured the concession through a competitive biddingprocess, with agreement at both local and national level, withoutwhich essential infrastructure projects such as new schools andhospitals would not have been built. PFI has been the procurementmethod of choice, with public finance in scarce supply. It has allowednew infrastructure assets to be built on time and with cost certainty.
The Group has acquired its investments in good faith, based onlong-term legal contracts which provide serviced assets to publicsector clients. Whilst procurement models will change over time,the Board believes that private sector capital and expertise willcontinue to be required for the procurement and maintenance ofpublic infrastructure.
Corporate StructureIn setting up the Company in 2006, the Directors and the InvestmentAdviser wished to give investors access via traded stock to thisilliquid and developing asset class. Our choice of corporate structureand domicile was based on a proven investment company modelwhich is widely used and is designed to distribute efficiently all theunderlying investment returns, net of operating expenses, toshareholders. Today we have over 4,000 shareholders, with over90% of shares held by UK investors. Over 50% of our shares are heldby private individuals or small family offices.
“Looking ahead, we remain
confident that our investment
portfolio is of sufficient quality
to perform resiliently”

H I C L A N N U A L R E P O R T & A C C O U N T S 2 0 1 1 7
ESGAs reported last year, the Company with the help of the InvestmentAdviser has developed Environmental, Social and GovernancePolicies for the Group. An update of our performance against thesepolicies is set out in our Corporate Social Responsibility section.
Outlook
The Group continues to look for further acquisitions in the UKand overseas consistent with its publicly stated policy fornew investments.
There is a significant flow of opportunities to consider but wecontinue to apply our strict investment criteria and processes. TheInvestment Adviser has seen a number of PPP/PFI assets which wedeclined to pursue as being either too small, inappropriatelystructured or having too many operational issues.
The outlook for our business remains good. Public finances are thefocus of attention in many countries and we, together with theInvestment Adviser, have been careful when reviewing newinvestments overseas to take account of the associated sovereignrisk. In the UK, where the majority of our assets are located, werecognise the need to help our public sector clients find efficiencysavings but within established contractual structures.
Looking ahead, we remain confident that our investment portfolio isof sufficient quality to perform resiliently. Cash flows are generallypredictable and, whilst the valuation of the portfolio is in partcorrelated with the rates that apply to long dated government debt,we do not anticipate significant fluctuations as a consequence.
At present, the Group has adequate capacity through its establishedfunding lines to invest further. With a number of opportunitiescurrently under review, we are confident of achieving the growthaspirations to further enhance shareholder returns.
Whilst the primary market for new PFI projects has slowed, we areseeing a buoyant secondary market with an increase in the numberof vendors and buyers.
Against this background, the Board takes comfort from the portfoliowe have developed, the attractiveness of the risk-adjusted yield weoffer, and the continuing opportunities we have to grow the portfoliogoing forward.
Graham PickenChairman23 May 2011

8 H I C L A N N U A L R E P O R T & A C C O U N T S 2 0 1 1
The Group’s Investment Portfolio
as at 23 May 2011
Accommodation
Colchester GarrisonBradford SchoolsKent
SchoolsBarnet Hospital
D & C FirearmsTraining
Health & SafetyHQ
Conwy SchoolsNorth Tyneside
SchoolsBishop Auckland
HospitalExeter Crown
Court
Home OfficeDarlington
SchoolsNorwichSchools
Blackburn HospitalGMPA Police
Stations
Newcastle LibrariesDefence
6th Form CollegeOldhamSchools
Central MiddlesexHospital
MPA FirearmsTraining
Ealing SchoolsPinnacle Schools,
Fife
HaverstockSchool
RenfrewshireSchools
Health & SafetyLaboratories
SheffieldSchools
Helicopter TrainingWooldale
Centre
HighlandsSchools
Oxford JohnRadcliffe
Queen AlexandraHospital
Romford Hospital
Stoke MandevilleHospital
West MiddlesexHospital
MPA SELPolice Stations
Sussex Custodial
Education EducationHealth Law & Order
Dutch HighSpeed Rail
Kicking HorseCanyon P3
M80 MotorwayDBFO
NW AnthonyHenday P3
Transport
Kemble WaterJunior Loan
Utilities
Portfolio at 31 March 2010
Aquired in year to 31 March 2011
Key:
Additional stake acquired in year
Repaid in April 2011
Aquired in May 2011

H I C L A N N U A L R E P O R T & A C C O U N T S 2 0 1 1 9
Investment Objective
The Company seeks to provide investors with long-termdistributions, at levels that are sustainable, and to preserve thecapital value of its investment portfolio over the long-term withpotential for capital growth. The Company targets a progressivedistribution policy and growth of its annual distributions to 7pper Ordinary Share by March 2013. The Company is targeting anIRR of 7 to 8 per cent. on the original issue price of its OrdinaryShares in March 2006, to be achieved over the long-term viaactive management, including the acquisition by the Group (beingthe Company and its wholly-owned subsidiaries) of furtherinvestments to complement the Current Portfolio and by theprudent use of gearing.
Investment Criteria
The Group’s Investment Policy is to ensure a diversified portfoliowhich has a number of similarly sized investments and is notdominated by any single investment. The Group will seek to acquireInfrastructure Equity with similar risk/reward characteristics to theCurrent Portfolio, which may include (but is not limited to):
� public sector, government-backed or regulated revenues;
� concessions which are predominantly “availability” based (i.e.the payments from the concession do not generally depend onthe level of use of the project asset); and/or
� companies in the regulated utilities sector.
The Group will also seek to enhance returns for Shareholders byacquiring more diverse infrastructure investments. The Directorscurrently intend that the Group may invest in aggregate up to35 per cent. of its total assets (at the time the relevant investmentis made) in:
� Project Companies which have not yet completed theconstruction phases of their concessions but where prospectiveyield characteristics and associated risks are deemedappropriate to the investment objectives of the Company. Thismay include investment in companies which are in the process ofbidding for concessions, to the extent that such companies formpart of a more mature portfolio of investments which the Groupconsiders it appropriate to acquire; and/or
� Project Companies with “demand” based concessions where theInvestment Adviser considers that demand and stability ofrevenues are not yet established, and/or Project Companieswhich do not have public sector sponsored/awarded orgovernment-backed concessions
and to a lesser extent (but counting towards the same aggregate35 per cent., and again at the time the relevant investment ismade) in:
� other funds that make infrastructure investments and/or
� financial instruments and securities issued by companies thatmake infrastructure investments, or whose activities are similaror comparable to infrastructure investments.
Geographic Focus
The Directors believe that attractive opportunities for the Group toenhance returns for investors are likely to arise outside as well aswithin the UK (where the majority of the projects in the CurrentPortfolio are based). The Group may therefore make investments inthe European Union, Norway, Switzerland, the Americas and selectedterritories in Asia and Australasia. The Group may also makeinvestments in other markets should suitable opportunities arise.
The Group will seek to mitigate country risk by concentrating oninvestment opportunities in jurisdictions where it considers thatcontract structures and enforceability are reliable, where (to theextent applicable) public sector obligations carry a satisfactorycredit rating and where financial markets are relatively mature.
Single Investment Limit and Diversity of
Clients and Suppliers
When any new acquisition is made, the Company will ensure thatthe investment acquired does not have an acquisition value (or, if itis an additional stake in an existing investment, the combined valueof both the existing stake and the additional stake acquired)greater than 20 per cent. of the total gross assets of the Companyimmediately post acquisition.
The total gross assets will be calculated based on the last publishedgross investment valuation of the portfolio plus acquisitions madesince the date of such valuation at their cost of acquisition.
The purpose of this limit is to ensure the portfolio has a number ofinvestments and is not dominated by any single investment.
In selecting new investments to acquire, the Investment Adviser willseek to ensure that the portfolio of investments has a range of publicsector clients and supply chain contractors, in order to avoid over-reliance on either a single client or a single contractor.
Investment Policy

1 0 H I C L A N N U A L R E P O R T & A C C O U N T S 2 0 1 1
Other Investment Restrictions
The Company is subject to certain investment restrictions pursuantto the Listing Rules. These are as follows:
(a) The Company’s primary objective is investing and managing theassets with a view to spreading or otherwise managinginvestment risk. The Company must, at all times, invest andmanage its assets in a way which is in accordance with theInvestment Policy;
(b) The Company will not conduct a trading activity which issignificant in the context of the Group as a whole. The Companywill not cross-finance businesses forming part of the Group’sinvestment portfolio; and
(c) No more than 10 per cent., in aggregate, of the Company’s assetswill be invested in other listed closed-ended investment funds.
The Listing Rules may be amended or replaced over time. To theextent that the above investment restrictions are no longer imposedunder the Listing Rules those investment restrictions shall not applyto the Company.
Gearing
The Group intends to make prudent use of leverage to finance theacquisition of investments, to enhance returns to investors and tofinance outstanding subscription obligations.
Under the Articles, the Group’s outstanding borrowings, excludingintra-group borrowings and the debts of underlying investeecompanies but including any financial guarantees to supportsubscription obligations, are limited to 50 per cent. of the AdjustedGross Asset Value (meaning the fair market value, withoutdeductions for borrowed money or other liabilities or accruals, andincluding outstanding subscription obligations) of its investmentsand cash balances at any time.
The Group may borrow in currencies other than pounds sterling aspart of its currency hedging strategy.
Amendments
Any material amendments to the Investment Policy will require theapproval of Shareholders.
Investment Policy (continued)

H I C L A N N U A L R E P O R T & A C C O U N T S 2 0 1 1 1 1
Market Developments
The UK Government has materially slowed the flow of new PFI/PPPprojects for public procurement although a number of new projectsare still being procured via PFI. The Group does not generallyparticipate or invest in the public procurement phase of PFI/PPPprojects and therefore is not directly affected by the slowdown in theUK PFI/PPP primary market.
The secondary market for PFI/PPP/P3 assets is as active as it hasbeen since HICL’s launch in 2006. There has been a steady flow ofassets onto the market with both individual assets and portfoliosbeing marketed by contractors and financial institutions.
Attractive return levels in the secondary PFI/PPP/P3 market continueto draw new investors with the launch of new listed and unlistedfunds targeting this sector. Pricing during the year for these assetshas largely been unaffected as the increased demand has broadlybeen matched by growth in the supply of assets to the market.
The overseas PFI/PPP/P3 market continues to grow as an increasingnumber of countries are utilising PPP to procure publicinfrastructure, recognising the advantages of risk transfer to theprivate sector and the ability to match the payment for theinfrastructure over the life of the project as the benefits of theinfrastructure are realised.
We are now seeing more sale processes involving overseas assets,with the Group during the year acquiring two new assets in Canadaand an additional interest in the Dutch High Speed Rail Link. In thenear term though we do not expect a material change in theoverseas portion of the portfolio as the UK secondary market isproviding the large majority of suitable opportunities. During theyear we reviewed PFI/PPP/P3 investment opportunities in the UK,Europe, Canada and Australia.
The fiscal challenges in the Eurozone and uncertainty over the tariffregime for Spanish PV solar projects has diminished theattractiveness for the Group of a significant segment of therenewables sector. As a result we are considering utilities andrenewable investments on an opportunistic basis.
Current Investment Priorities
For new investments our main focus remains PFI/PPP/P3concessions, most likely to be operational although we will considerprojects still under construction.
Of possible secondary interest, but only selectively, are:
� Operational renewable energy projects such as wind farms, solarparks or hydro-electric schemes, where there are suitablecontractual structures in place which enable the Group to securelong-term income streams, comparable in nature to those inPFI/PPP/P3 projects.
� Regulated utilities, albeit most investment opportunities in thissector are too large for the Group.
� Debt funding of infrastructure projects, where attractively pricedand appropriately structured.
In addition to the UK, which remains our core market, we have beenseeking new assets in countries with a developed pipeline ofopportunities and a stable fiscal position. Canada, Australia andcountries in northern Europe broadly satisfy our requirements.
Portfolio Update
Current PerformanceThe Group’s strategy is to maximise value from the portfolio by activeasset management. Providing the operational services on each of ourprojects to contractual requirements is the foundation of ourbusiness. From successful service delivery we can build strongrelationships with our clients to work in partnership with our supplychain. We believe these relationships, fostered by our assetmanagement team assist all stakeholders in identifying anddeveloping cost efficiencies and savings, which is an area ofincreasing importance for our public clients, who have been taskedwith finding savings in their budgets.
The Group’s portfolio continues to perform as expected with goodcash generation. The difficult economic environment has notimpacted significantly on the projects other than a renewed emphasison working with our public sector clients to seek cost efficiencies.
Acquisitions in the year have increased the Group’s portfolio to38 infrastructure investments as at 31 March 2011. Since the yearend, the Kemble Water junior loan has been repaid at par and theGroup has acquired 3 PFI schools projects. Therefore the Groupcurrently has 40 PFI/PPP/P3 investments of which two are inconstruction, namely the M80 DBFO Road project and the NorthWest Anthony Henday Road.
The last of the four Bradford schools has recently been completed,with fit-out of the schools now taking place ready for occupation. TheM80 DBFO Road project and the North West Anthony Henday Roadremain on track to achieve their contractual completion dates forconstruction in Q4 2011.
On a number of projects our asset management team has initiatedcost saving and efficiency workshops with our clients and supplychain. These have proved fruitful in identifying various areas wheresubstantial savings can be made. Initiatives worked on to date covera broad range of opportunities, including revising service scope andstandards, increased outsourcing, improved energy management,space reconfiguration and third party revenue.
The Defence Sixth Form College is a good example of where savingscan be achieved. The project was selected by the client, the Ministryof Defence (“MOD”) as a pilot project to identify efficiencies. Theproject team worked in collaboration with the MOD, undertaking an indepth analysis of the service delivery and the MOD’s requirements.
In February, Romford Hospital was selected by HM Treasury for asimilar pilot project aimed at identifying cost savings. Here thereview is less advanced than on the Defence Sixth Form College witha report expected from HM Treasury in the summer. In November2010 the project team ran an externally facilitated cost saving andefficiency workshop with the NHS Trust and supply chain. Ideasgenerated at this workshop have been incorporated in the responseto the Treasury. The review remains work in progress, and is due toreport shortly.
Investment Adviser’s Report

1 2 H I C L A N N U A L R E P O R T & A C C O U N T S 2 0 1 1
Contract VariationsOur asset management team continues to seek value enhancementsacross the portfolio, an important component of which are projectvariations. Project variations are requests from the client to amendthe scope of services delivered, be it delivery of a capital project oran additional or amended service for which the project earnsincremental revenue. In the year we have worked on a number ofvariations, which have included:
� On the Dutch High Speed Rail Link project, four signal stationshave been added. This variation was funded by the Dutch State asa capital project.
� On Kicking Horse Canyon Road we are developing, at theclient’s request, a variation to take over the operation andmaintenance of 13km of additional lanes within the boundariesof the current project.
� On the Helicopter Training Facility – there are a number ofvariations on the simulators to ensure that they continue to meetthe MOD’s requirement, specifically by updating the synthetictraining equipment to the same standards as the live aircraft.These variations are being funded by the MOD.
AcquisitionsAs noted in the Chairman’s Statement, the Group made five newinvestments and four incremental acquisitions in the year for anaggregate consideration of £151.0m.
In June 2010, the Group acquired a 74.9% interest in the QueenAlexandra Hospital PFI project in Portsmouth for a consideration of£46.4m. The hospital has 1,026 inpatient beds, 34 neonatalintensive care cots, 3 endoscopy suites and 20 main operatingtheatres. It is fully operational and the concession contract runs untilDecember 2040. A subsidiary of Carillion plc operates the hospitalunder a long-term services agreement.
In September 2010, the Group acquired an incremental 7.55% equityinterest and 17.65% loan note interest in the Sussex CustodialCentre PFI project for £1.1m, taking its total equity interest in theproject to 89.9% and loan note interest to 100%.
In early October 2010, the Group announced the acquisition, subjectto third party consents, of two UK PFI projects and two Canadian P3projects from subsidiaries of Bilfinger Berger. The consideration was£65.9m, including deferred investment obligations of approximately£46.1m at October exchange rates. The four interests are:
� a 50% interest in the Kent Schools PFI project – for the ongoingoperation and maintenance of six secondary schools in Kent;
� a 41.6% indirect interest in the M80 motorway DBFO projectcurrently under construction in Scotland. Through the futureexercise of options rights over non-controlling interests, thisinterest will increase to 49.9%;
� a 50% interest in the North-West Anthony Henday ring road P3project – for a 21 kilometre stretch of a four and six lane ring roadsurrounding the city of Edmonton in Alberta, Canada, currently inconstruction; and
� a 50% interest in the Kicking Horse Canyon Transit P3 projectin British Columbia, Canada comprising the upgrading ofapproximately six kilometres of highway and the operation andmaintenance of a 26 kilometre stretch of highway, part of theTrans-Canada Highway.
In mid-October 2010, the Group acquired two incremental interests,firstly an incremental 15.0% equity interest and 25.1% loan noteinterest in the Queen Alexandra Hospital PFI project for £13.4m andsecondly an incremental 39.9% equity interest and 50% loan noteinterest in the Oxford John Radcliffe Hospital project for £13.9m.These acquisitions take the Group’s interest in each of these projectsto a 89.9% equity interest and a 100% loan note interest.
In March 2011, the Group acquired an additional 5.49% interest inthe equity and loan notes in the Dutch High Speed Rail projectfor �11.6m (£10.3m). This takes the Group’s interests in this projectto 42.99%.
Since 31 March 2011 the Group has announced a further acquisition:
On 23 May 2011, the Group announced the acquisition of three schoolPFI projects from subsidiaries of Kier Group plc and Dexia SA for aconsideration of £17.2m. The interests acquired are 75% of the equityand loan note interests in both Norwich and Oldham Schools and37.5% of the equity and loan note interests in Sheffield Schools. TheNorwich project involves the financing, design and construction andoperation of five primary schools and one secondary school. TheOldham Project involves two secondary schools and the SheffieldProject, two primary schools and two secondary schools. All theschools have been operational since either 2007 or 2008. The schoolsare managed and operated by Kier Facilities Services Limited.
RealisationsFollowing the year end, in April 2011, the £30.0m Kemble Waterjunior loan was repaid at par. The Company has announced it willseek to invest the proceeds of the repayment as and when suitableacquisition opportunities arise.
Valuation and Discount Rates
We are responsible for carrying out the fair market valuation of theGroup’s investments which is presented to the Directors for theirapproval and adoption. The valuation is carried out on a six monthlybasis as at 31 March and 30 September each year.
The Directors receive an independent third party report and opinionon these valuations.
For non-market traded investments, the valuation principles used arebased on a discounted cash flow methodology, and adjusted inaccordance with the European Venture Capital Associations’valuation guidelines where appropriate to comply with IAS 39, giventhe special nature of infrastructure investments. Where aninvestment is traded, such as the Kemble Water Junior Loan, a marketquote is used.
Investment Adviser’s Report (continued)

H I C L A N N U A L R E P O R T & A C C O U N T S 2 0 1 1 1 3
This is the same method used at the time of launch and each subsequent six month reporting period (further details can be found in theNovember 2010 C Share prospectus, available from the Company’s website).
The Directors’ Valuation of the portfolio as at 31 March 2011 is £673.1m (including £47.0m of future investment obligations). This portfoliovaluation compares to £509.6m as at 31 March 2010 (up 32%) and £250.4m at the time of launch (a reconciliation between the valuation at31 March 2011 and that shown in the financial statements is given in Note 1 to the unaudited consolidated proforma financial statements, theprincipal difference being the £47.0m of equity commitments on the Helicopter Training facility, M80 motorway DBFO and North-West AnthonyHenday P3).
£480m
£500m
£520m
£540m
£560m
£580m
£600m
£620m
£640m
£660m
£680m
31 Mar 11Valuation
ReturnForexMovement
EconomicAssumptions
Change inDiscount Rate
CashDistributions
Investments31 Mar 10Valuation
£509.6m
£151.0m
£45.6m
£1.3m £2.8m £0.4m
£60.0m
£673.1m
A breakdown in the growth in the Directors’ Valuation in the year is tabled below.
Valuation movement during the year to 31 March 2011 £’m
Valuation at 31 March 2010 509.6Investments 151.0Cash receipts (45.6)Change in DCF rate 1.3Economic assumptions (2.8)Forex movement on Dutch High Speed Rail Link (0.4)Return 60.0
Valuation at 31 March 2011 673.1
Netting out acquisitions in the period of £151.0m, and investment receipts of £45.6m, the growth over the rebased value of £615.0m was 9.4%.This increase is a product of the £60m Return from the portfolio which was driven by robust project performance supported by actual inflationabove the 2.75% valuation assumption, contributions from new investments and a positive mark to market movement on the Kemble Waterjunior loan.
Fair value for each investment is derived from the present value of the investment’s expected future cash flows, using reasonable assumptionsand forecasts, and an appropriate discount rate. We exercise our judgment in assessing the expected future cash flows from each investmentbased on the detailed concession life financial models produced by each Project Company.
Valuation Movement in year from 31 March 2010 to 31 March 2011
1 4 H I C L A N N U A L R E P O R T & A C C O U N T S 2 0 1 1
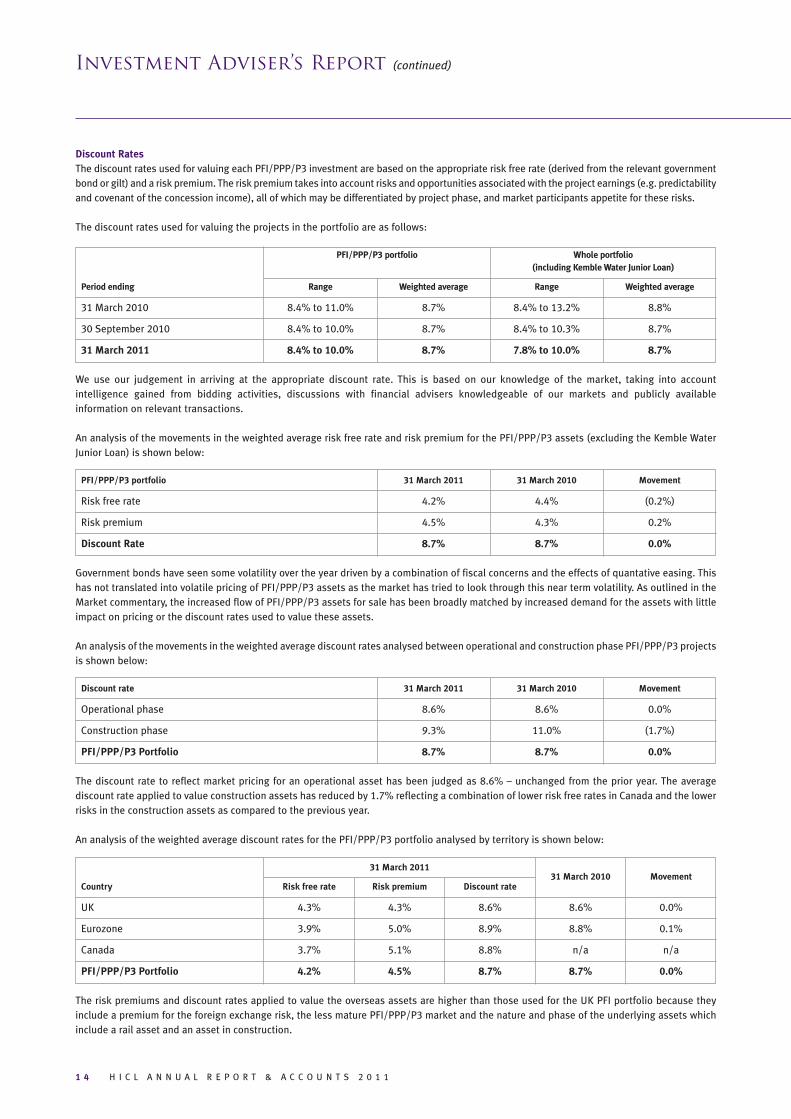
Discount RatesThe discount rates used for valuing each PFI/PPP/P3 investment are based on the appropriate risk free rate (derived from the relevant governmentbond or gilt) and a risk premium. The risk premium takes into account risks and opportunities associated with the project earnings (e.g. predictabilityand covenant of the concession income), all of which may be differentiated by project phase, and market participants appetite for these risks.
The discount rates used for valuing the projects in the portfolio are as follows:
PFI/PPP/P3 portfolio Whole portfolio(including Kemble Water Junior Loan)
Period ending Range Weighted average Range Weighted average
31 March 2010 8.4% to 11.0% 8.7% 8.4% to 13.2% 8.8%
30 September 2010 8.4% to 10.0% 8.7% 8.4% to 10.3% 8.7%
31 March 2011 8.4% to 10.0% 8.7% 7.8% to 10.0% 8.7%
We use our judgement in arriving at the appropriate discount rate. This is based on our knowledge of the market, taking into accountintelligence gained from bidding activities, discussions with financial advisers knowledgeable of our markets and publicly availableinformation on relevant transactions.
An analysis of the movements in the weighted average risk free rate and risk premium for the PFI/PPP/P3 assets (excluding the Kemble WaterJunior Loan) is shown below:
PFI/PPP/P3 portfolio 31 March 2011 31 March 2010 Movement
Risk free rate 4.2% 4.4% (0.2%)
Risk premium 4.5% 4.3% 0.2%
Discount Rate 8.7% 8.7% 0.0%
Government bonds have seen some volatility over the year driven by a combination of fiscal concerns and the effects of quantative easing. Thishas not translated into volatile pricing of PFI/PPP/P3 assets as the market has tried to look through this near term volatility. As outlined in theMarket commentary, the increased flow of PFI/PPP/P3 assets for sale has been broadly matched by increased demand for the assets with littleimpact on pricing or the discount rates used to value these assets.
An analysis of the movements in the weighted average discount rates analysed between operational and construction phase PFI/PPP/P3 projectsis shown below:
Discount rate 31 March 2011 31 March 2010 Movement
Operational phase 8.6% 8.6% 0.0%
Construction phase 9.3% 11.0% (1.7%)
PFI/PPP/P3 Portfolio 8.7% 8.7% 0.0%
The discount rate to reflect market pricing for an operational asset has been judged as 8.6% – unchanged from the prior year. The averagediscount rate applied to value construction assets has reduced by 1.7% reflecting a combination of lower risk free rates in Canada and the lowerrisks in the construction assets as compared to the previous year.
An analysis of the weighted average discount rates for the PFI/PPP/P3 portfolio analysed by territory is shown below:
31 March 2011
31 March 2010 MovementCountry Risk free rate Risk premium Discount rate
UK 4.3% 4.3% 8.6% 8.6% 0.0%
Eurozone 3.9% 5.0% 8.9% 8.8% 0.1%
Canada 3.7% 5.1% 8.8% n/a n/a
PFI/PPP/P3 Portfolio 4.2% 4.5% 8.7% 8.7% 0.0%
The risk premiums and discount rates applied to value the overseas assets are higher than those used for the UK PFI portfolio because theyinclude a premium for the foreign exchange risk, the less mature PFI/PPP/P3 market and the nature and phase of the underlying assets whichinclude a rail asset and an asset in construction.
Investment Adviser’s Report (continued)

H I C L A N N U A L R E P O R T & A C C O U N T S 2 0 1 1 1 5
Valuation Assumptions
Discount Rate Sensitivity
Inflation Rate SensitivityThe PFI projects in the portfolio have contractual income streamswith public sector clients, which are rebased every year for inflation.UK projects tend to use either RPI (Retail Price Index) or RPIx (RPIexcluding mortgage payments), and revenues are either partially ortotally indexed (depending on the contract and the nature of theproject’s financing). Facilities management sub-contracts havesimilar indexation arrangements.
The portfolio valuation assumes UK inflation of 2.75% p.a. for bothRPI and RPIx, the same assumption as for the prior year. The March2011 forecasts for RPI in December 2012 range from 2.3% to 4.4%from 25 independent and City institutions as compiled by HMTreasury, with an average forecast of 3.2%.
Deposit Rate SensitivityEach PFI project in the portfolio has cash held in bank deposits,which is a requirement of their senior debt financing. As at 31 March2011 cash deposits for the portfolio were earning interest at a rate of0.8% p.a. on average. There is a consensus that UK base rates willremain low for an extended period, with a current average forecastfor UK base rates in December 2011 of 1%.
The portfolio valuation assumes UK deposit interest rates are 1% toMarch 2013 and 4.0% thereafter. This is lower than applied in theMarch 2010 valuation which assumed 1% deposit interest rates toMarch 2012 and 4.5% thereafter. These changes have reduced theportfolio valuation by approximately £8.5m and are included withinthe £2.8m aggregate reduction in portfolio value attributable tochanges in Economic Assumptions.
Each of the project’s interest costs are at a fixed rate either throughfixed rate bonds or bank debt which is hedged with an interest rateswap. The project’s sensitivity to interest rates relates to the cashdeposits which the projects are required to maintain as part of theirfunding. For example most projects would have a debt service reserveaccount in which 6 months of debt service payments are held.
Tax Rates
The profits of each UK PFI project company are subject to UKcorporation tax. In the March Budget the Coalition Governmentannounced that corporation tax would reduce from 27% to 26% fromApril 2011 with an aspiration to reduce corporation tax further to23% in 1% annual increments.
The UK corporation tax assumption for the portfolio valuation is26%, which has reduced by 2% from 28% at March 2010, to reflectthe current rate of UK corporation tax. This change has increased theportfolio valuation by approximately £5.7m and is included withinthe £2.8m aggregate change in portfolio value attributable tochanges in Economic Assumptions.
£750m
£710m
£670m
£630m
£590m
£550m-1.0% -0.5%
£673.1m
Base(8.7%)
+0.5% +1.0%
Valu
atio
n
Discount Rate Movement
£750m
£710m
£670m
£630m
£590m
£550m-1.0%
Sensitivity changing assumption each and every year to maturity
Sensitivity changing assumption for next five years only – Base Case thereafter
-0.5%
£673.1m
Base (2.75%) +0.5% +1.0%
Valu
atio
n
£750m
£710m
£670m
£630m
£590m
£550m-1.0% -0.5%
£673.1m
Base(1% then 4.0%)
+0.5% +1.0%
Valu
atio
n

1 6 H I C L A N N U A L R E P O R T & A C C O U N T S 2 0 1 1
Future Cashflows
The chart set out below is the expected future cashflows to be received by the Group from the portfolio and how the portfolio valuation isexpected to evolve over time using current forecasts and assumptions, (this is not a profit forecast, and there can be no assurance that thesereceipts will be achieved).
Long term cashflows1
Source: Investment Adviser
1 The illustration represents a target only and is not a profit forecast. There can be no assurance that this target will be met.
2 Current Portfolio Value assumes a Euro to Sterling exchange rate of 0.89, a Canadian Dollar to Sterling Exchange rate of 0.64 and a weighted average discountrate of 8.7% per cent. p.a. These assumptions and the Current Portfolio Value may vary over time.
3 The valuation is of the portfolio of 38 investments as at 31 March 2011 and does not include other assets or liabilities of the Group, and assumes that during theperiod illustrated above, (i) no new investments are purchased, (ii) no existing investments are sold and (iii) the Group suffers no material liability to withholdingtaxes, or taxation on income or gains in excess of those expected.
4 The spike in 2012 is the repayment in April 2011 of principal on the Kemble Junior Holdco Loan.
The chart shows the steady long-term nature of the cashflows from the portfolio, coupled with a stable portfolio valuation to 2028. From 2029,based on current forecasts, the portfolio will move into a capital repayment phase whereby capital is repaid and the portfolio valuation reducesas projects reach the end of their concession term, assuming that the proceeds are not invested in new investments, until in 2042 when allcapital is repaid.
Investment Adviser’s Report (continued)
Long term income phase Capital repayment phase
(300)
(200)
(100)
0
100
200
300
400
500
600
700
-60
-40
-20
0
20
40
60
80
100
120
140
HICL year to March
Annu
al P
roje
ct d
istr
ibut
ions
(£m
)
Port
folio
val
ue (£
m)
Subdebt interest Subdebt principal Dividends Subdebt obligations NPV
2012
2013
2014
2015
2016
2017
2018
2019
2020
2021
2022
2023
2024
2025
2026
2027
2028
2029
2030
2031
2032
2033
2034
2035
2036
2037
2038
2039
2040
2041
2042
2043
The valuation2 of the portfolio at any time is a functionof the present value of the expected future cash flows3
Weighted AverageConcession Length
Weighted AverageDebt Tenor
26
24
22
20
18
16
14
12
10
8
6
4
2
0
Year
s
24.0 22.3
Financing
The Company successfully raised £154.6m (net of expenses) in theyear from the £110m C share issue in December 2010 and the issueof 41.7m shares by way of tap issues under the Company’s blocklisting. The net proceeds from the share issues were used to fundnew investments and to reduce the Group’s debt. As at 31 March2011, the Group had net cash of £54.7m and outstanding futureinvestment obligations on three projects totalling £47.0m.
The strategy is to use the Group’s £200m revolving debt facility,which is committed through to December 2012, to fund newacquisitions, to provide letters of credit for future investmentobligations, and to provide a prudent level of debt for the portfolio toimprove the operational gearing.
The Board’s policy is that the Company should not hold cashawaiting investment to any material extent above any outstandingequity commitments in respect of existing investments.
Weighted Averages (excluding Kemble)
The PFI/PPP/P3 projects in the portfolio all have long-term debt inplace which does not need refinancing to meet their business plan.The weighted average PFI/PPP/P3 project concession lengthremaining is 24.0 years at 31 March 2011 and the weighted averagedebt tenor is 22.3 years.
H I C L A N N U A L R E P O R T & A C C O U N T S 2 0 1 1 1 7
Counterparty Exposures
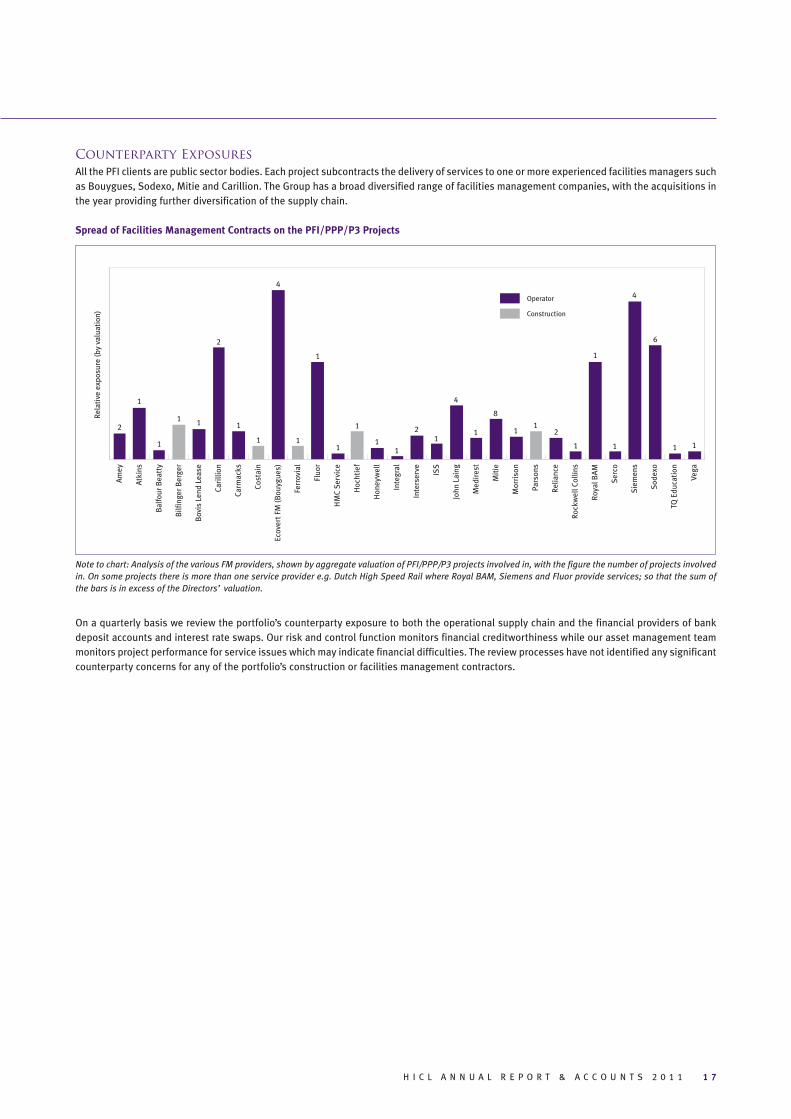
All the PFI clients are public sector bodies. Each project subcontracts the delivery of services to one or more experienced facilities managers suchas Bouygues, Sodexo, Mitie and Carillion. The Group has a broad diversified range of facilities management companies, with the acquisitions inthe year providing further diversification of the supply chain.
Spread of Facilities Management Contracts on the PFI/PPP/P3 Projects
Note to chart: Analysis of the various FM providers, shown by aggregate valuation of PFI/PPP/P3 projects involved in, with the figure the number of projects involvedin. On some projects there is more than one service provider e.g. Dutch High Speed Rail where Royal BAM, Siemens and Fluor provide services; so that the sum ofthe bars is in excess of the Directors’ valuation.
On a quarterly basis we review the portfolio’s counterparty exposure to both the operational supply chain and the financial providers of bankdeposit accounts and interest rate swaps. Our risk and control function monitors financial creditworthiness while our asset management teammonitors project performance for service issues which may indicate financial difficulties. The review processes have not identified any significantcounterparty concerns for any of the portfolio’s construction or facilities management contractors.
2
1
1
1 1 1
1
4
1
1
1
1
11
21
4
1
8
11
2
1
1
1
4
6
1 1
2
Operator
Construction
Rela
tive
exp
osur
e (b
y va
luat
ion)
Amey
Atki
ns
Bal
four
Bea
tty
Bilf
inge
r Ber
ger
Bov
is L
end
Leas
e
Cari
llion
Carm
acks
Cost
ain
Ecov
ert F
M (B
ouyg
ues)
Ferr
ovia
l
Fluo
r
HM
C Se
rvic
e
Hoc
htie
f
Hon
eyw
ell
Inte
gral
Inte
rser
ve ISS
John
Lai
ng
Med
ires
t
Mit
ie
Mor
riso
n
Pars
ons
Relia
nce
Rock
wel
l Col
lins
Roya
l BA
M
Serc
o
Siem
ens
Sode
xo
TQ E
duca
tion
Vega

1 8 H I C L A N N U A L R E P O R T & A C C O U N T S 2 0 1 1
Accounting
At 31 March 2011, the Group had eleven investments which it was deemed to control by virtue of having the power, directly or indirectly, togovern the financial and operating policies of the project entities. This is unchanged from 31 March 2010. Under International Financial ReportingStandards (“IFRS”), the results of these companies are required to be consolidated in the Group’s financial statements on a line-by-line basis.
However, these investments form part of a portfolio of similar investments which are held for investment purposes and managed as a whole andthere is no distinction made between those investments classified as subsidiaries and those which are not. Further, all debt owed by the Group’sinvestments is non-recourse and the Group does not participate in their day to day management.
As in previous periods, in order to provide shareholders with further information regarding the Group’s net asset value, coupled with greatertransparency in the Company’s capacity for investment and ability to make distributions, the results have been restated in proforma tables whichfollow the Financial Results. The proforma tables are prepared with all investments accounted for on an Investment basis. By deconsolidatingthe subsidiary investments, the performance of the business under consolidated IFRS basis may be compared with the results under theInvestment basis.
The proforma tables show all investments accounted for on an Investment basis, which are reconciled to the consolidated financial statementson a line by line basis.
Income and Costs
Summary income statement
Year to 31 March 2011 Year to 31 March 2010
Investment Consolidation IFRS Investment Consolidation IFRSbasis adjustments basis basis adjustments basis
£million £million £million £million £million £million
Total revenue income 37.4 150.5 187.9 31.2 128.5 159.7
Expenses & finance costs (13.1) (155.2) (168.3) (13.4) (121.0) (134.4)
Profit/(loss) before tax & valuation movements 24.3 (4.7) 19.6 17.8 7.5 25.3
Fair value movements 20.9 (2.2) 18.7 7.2 (24.8) (17.6)
Tax and non-controlling interests (0.1) 7.0 6.9 (0.2) (1.5) (1.7)
Earnings/(loss) 45.1 0.1 45.2 24.8 (18.8) 6.0
Earnings per share 8.9p 9.0p 6.5p 1.6p
On an Investment basis, Profit before tax and valuation movements was £24.3m (2010: £17.8m) and increased due to contributions fromacquisitions and reduced finance costs.
Fair value movements are a £20.9m profit (2010: £7.2m) which represents the increase in the portfolio valuation recognised in the incomestatement. The portfolio valuation benefited from a strong performance from the portfolio, supported by inflation above the valuationassumption and a mark to market uplift on the Kemble Water junior loan. Further detail on the valuation movement is given in the InvestmentAdviser’s Report.
Earnings on an Investment basis were £45.1m, an increase of over £20m compared to the prior year, with earnings per share of 8.9p up 2.4p or37% as compared to 2010. The uplift in earnings reflects the positive contribution from acquisitions coupled with a good performance from theportfolio without the adverse impact of changing valuation assumptions that affected prior year earnings.
On a consolidated IFRS basis, the earnings per share were 9.0p (2010: 1.6p). The results on a consolidated IFRS basis show a more significantimprovement than on an Investment basis due to factors arising in the prior year. In particular in the prior year the value of the subsidiariesrecognised under IFRS was impacted more by the increase in the risk free rate in that year than the market values of the subsidiaries thatunderpinned earnings on the Investment basis.
Total income on a consolidated IFRS basis increased to £187.9m (2010: £159.7m) driven by a full year contribution from 2010 acquisitions andincreased construction revenue on project variations. Profit before tax and valuation movements on a consolidated IFRS basis decreased despitethe increased revenues due to reduced finance costs in the prior year. The prior year benefited materially from lower finance costs arising fromthe effect of negative inflation on the index link bond financing on the Home Office and Exeter Courts projects.
Financial Results

H I C L A N N U A L R E P O R T & A C C O U N T S 2 0 1 1 1 9
Cost analysis
Year to Year to31 March 2011 31 March 2010
Investment basis Investment basis£million £million
Interest income 0.1 0.1
Interest expense (3.6) (5.5)
Investment Adviser (8.1) (6.0)
Auditor – KPMG – for the Group (0.2) (0.2)
Directors fees & expenses (0.1) (0.1)
Other expenses (1.2) (1.7)
Expenses & finance costs (13.1) (13.4)
Interest was a net cost of £3.5m in the year (2010: £5.4m) reduced from the prior year due to lower levels of borrowing during the year and theeffect of re-profiling the interest rate swaps in 2010 following the prior year C share capital raising.
Total fees accruing to InfraRed Capital Partners Limited (the Investment Adviser) totalled £8.1m (2010: £6.0m) in the year, comprising the1.1% p.a. management fee (1.5% for assets in construction), the 1.0% fee on the acquisitions made, and the £0.1m p.a. advisory fee. Theincrease is a combination of the 1.0% acquisition fee on a larger volume of acquisitions and the management fee on a growing portfolio value.
In addition, the Group contracted in the year with other parts of the HSBC Group on an arm’s length basis for the provision of bank accounts,foreign exchange hedges, and insurance broking.
Other expenses are down £0.5m from the prior year, reflecting a reduced level of unsuccessful bid costs.
Total Expense Ratio (‘TER’)
Year to Year to31 March 2011 31 March 2010
Investment basis Investment basis£million £million
Administrative expenses 9.6 8.0
Less operator acquisition investment fees (1.5) (0.7)
Total expenses 8.1 7.3
Net assets 673.2 502.9
TER 1.20% 1.45%
The TER for the Group has reduced 0.25% in the year to 1.20%. This improvement shows the benefit of scale economies as acquisitions and theconsequent capital raisings enable the Group’s expenses to be spread over an enlarged capital base.

2 0 H I C L A N N U A L R E P O R T & A C C O U N T S 2 0 1 1
Balance Sheet
Summary balance sheet
31 March 2011 31 March 2010
Investment Consolidation IFRS Investment Consolidation IFRSbasis adjustments basis basis adjustments basis
£million £million £million £million £million £million
Investments at fair value 626.1 (200.1) 426.0 501.3 (193.9) 307.4
Other non-current assets – 957.9 957.9 – 979.3 979.3
Working capital (5.3) 8.8 3.5 (4.8) 11.8 7.0
Net cash/(borrowings) 54.7 (587.5) (532.8) 11.0 (604.0) (593.0)
Other non-current liabilities (2.3) (185.4) (187.7) (4.6) (196.7) (201.3)
Non-controlling interests – (9.9) (9.9) – (12.8) (12.8)
Net Assets 1
673.2 (16.2) 657.0 502.9 (16.3) 486.6
NAV per share (before distribution) 113.1p 110.4p 110.7p 107.1p
1 This is net assets attributable to the Group net of non-controlling interests.
On an Investment basis, Investments at fair value were £626.1m (2010: £501.3m) net of £47.0m of future investment obligations on the M80motorway DBFO, North-West Anthony Henday P3 and Helicopter Training facility projects. This is an increase of £124.8m or 25%. Further detailon the movement in Investments at fair value is given in the Investment Adviser’s Report under Valuation.
Following the equity capital raisings in the year the Group has a net cash position on an Investment basis of £54.7m (2010: £11.0m). An analysisof the movements in net cash is shown in the cashflow analysis below.
Other financial liabilities of £2.3m (2010: £4.6m) are the mark to market valuation of the Group’s interest rate swaps and a foreign currencyhedging contract. In January 2011 following the C share capital raising the Group’s interest rate swaps were re-profiled resulting in a payment of£2.5m to partially settle the swaps.
On an Investment basis, NAV per share was 113.1p before the 3.425p distribution (2010: 110.7p).
On a consolidated IFRS basis, net assets have increased to £657.0m (2010: £502.9m) reflecting £156.7m from the issue of shares, earnings of£45.2m less distributions of £31.5m. NAV per share was 110.4p (2010: 107.1p).
Cashflow Analysis
Summary cash flow
Year to Year to31 March 2011 31 March 2010
Investment basis Investment basis£million £million
Net cash (debt) at start of period 11.0 (57.7)
Cash from investments 45.6 39.2
Operating + finance costs (10.7) (11.6)
Net cash inflow before acquisitions/financing 34.9 27.6
Cost of new investments (115.1) (60.1)
Share capital raised net of costs 154.6 126.3
Forex movement on borrowings/hedging (1.3) (3.2)
Dividend for operational assets (27.6) (21.4)
Dividend for construction assets (1.8) (0.5)
Dividends paid (29.4) (21.9)
Net cash at end of period 54.7 11.0
Financial Results (continued)

H I C L A N N U A L R E P O R T & A C C O U N T S 2 0 1 1 2 1
On an Investment basis the Group’s net cash at 31 March 2011 was£54.7m (31 March 2010: £11.0m).
Cash inflows from the portfolio were up 16% at £45.6m (2010:£39.2m). The growth in cash generation was driven by contributionsfrom acquisitions combined with active cash management across theportfolio.
Cost of investments of £115.1m (2010: £60.1m) represents the cashcost of the five new investments, four incremental acquisitions,£8.0m of loan note subscriptions (on Bradford Schools and theHelicopter Facility projects) coupled with associated acquisitioncosts of £2.0m.
The £1.3m (2010: £3.2m) movement in forex and hedging arises fromthe re-profiling of the interest rate swaps and the timing of theforward Euro and Canadian Dollar sales. The forward sales are tohedge the Group’s forex exposure on the Dutch High Speed Rail Linkand two Canadian assets.
The £110m C share capital raising in December 2010 and placing of41.7m shares under the block listing provided cash receipts in theyear of £154.6m (2010: £126.3m).
Dividends paid increased £7.5m to £29.4m (2010: £21.9m) for theyear (being the payment of 3.35p in June 2010 and the payment of3.275p per share in December 2010). The dividends declared for theyear to 31 March 2011 represents a total of 6.7p per share(2010: 6.55p).
Dividend cash cover was 1.26 times (2010: 1.26 times) whichcompares operational cash flow of £34.9m (2010: £27.6m) todividends from operational assets. The dividend attributable tooperational assets (93.9%) and construction assets (6.1%) wasbased on their respective share of the portfolio valuation duringthe year.
Gearing
The Group has a committed £200m five year revolving facility fromBank of Scotland plc (‘BoS’) expiring in December 2012. This facilityis used to fund acquisitions and is on a recourse basis to the Group.The Company’s Articles of Association limit the Group’s recoursedebt to 50% of Adjusted Gross Asset Value of its investments andcash balances. As at 31 March 2011, the Group’s only drawingsunder the facility were in respect £46.7m in letters of credit tosupport future investment commitments.
Following the successful C share equity raising in December, theGroup is ungeared with net cash on an Investment basis as at31 March 2011 of £54.7m (31 March 2010: £11.0m). This cash is tobe utilised on the £47.0m of future investment commitments and thepayment of £20.4m for the second interim dividend of 3.425p pershare in June.
To manage interest rate risk the Group has interest rate swaps topartially hedge the Group’s debt facility. Following the reduction ingearing of the Group in January 2011 the interest rate hedges werere-profiled to reflect the likely gearing of the Group over the next twoyears.
On a consolidated IFRS basis, the Group had net debt of £532.8m at31 March 2011 (31 March 2010: £593.0m). This decrease in net debtover the year reflects the proceeds from shares issued in the yearand scheduled debt repayments by the operating subsidiaries morethan offsetting the cost of new investments.
As previously reported, all the PFI projects have either long-term bankborrowings with interest rate hedges, or bonds with fixed or indexedcoupon payments. This ensures the Group’s investments haveminimal exposure to interest rate volatility or debt market appetite.
Foreign Exchange Risk
Foreign exchange risk from non-sterling assets has been managedon a balance sheet basis through the forward sale of Euros andCanadian Dollars and by debt drawings in Euros and CanadianDollars under the BoS debt facility. This is to minimise the volatilityin the Group’s NAV from foreign exchange movements.

2 2 H I C L A N N U A L R E P O R T & A C C O U N T S 2 0 1 1
Unaudited Consolidated Proforma Income Statements
for the year ended 31 March 2011
Year ended 31 March 2011
Investment basis Consolidation ConsolidatedRevenue Capital Total adjustments IFRS basis£million £million £million £million £million
Services revenue – – – 121.2 121.2Gains on finance receivables – – – 47.2 47.2Gains/(loss) on investments 37.4 18.8 56.2 (20.4) 35.8
Total income 37.4 18.8 56.2 148.0 204.2
Services costs – – – (105.8) (105.8)Administrative expenses (9.6) – (9.6) (2.2) (11.8)
Profit before net finance costs and tax 27.8 18.8 46.6 40.0 86.6
Finance costs (3.6) – (3.6) (47.5) (51.1)Finance income 0.1 2.1 2.2 0.6 2.8
Profit before tax 24.3 20.9 45.2 (6.9) 38.3
Income tax (expense)/credit (0.1) – (0.1) 8.4 8.3
Profit for the year 24.2 20.9 45.1 1.5 46.6
Attributable to:Equity holders of the parent 24.2 20.9 45.1 0.1 45.2Non-controlling interests – – – 1.4 1.4
24.2 20.9 45.1 1.5 46.6
Earnings per share – basic and diluted (pence) 4.8 4.1 8.9 0.1 9.0
Year ended 31 March 2010
Investment basis Consolidation ConsolidatedRevenue Capital Total adjustments IFRS basis£million £million £million £million £million
Services revenue – – – 102.6 102.6Gains on finance receivables – – – 16.2 16.2Gains/(loss) on investments 31.2 3.6 34.8 (15.5) 19.3
Total income 31.2 3.6 34.8 103.3 138.1
Services costs – – – (89.1) (89.1)Administrative expenses (8.0) – (8.0) (2.0) (10.0)
Profit before net finance costs and tax 23.2 3.6 26.8 12.2 39.0
Finance costs (5.5) – (5.5) (30.1) (35.6)Finance income 0.1 3.6 3.7 0.6 4.3
Profit/(loss) before tax 17.8 7.2 25.0 (17.3) 7.7
Income tax (expense)/credit (0.2) – (0.2) 3.4 3.2
Profit/(loss) for the year 17.6 7.2 24.8 (13.9) 10.9
Attributable to:Equity holders of the parent 17.6 7.2 24.8 (18.8) 6.0Non-controlling interests – – – 4.9 4.9
17.6 7.2 24.8 (13.9) 10.9
Earnings/(loss) per share – basic and diluted (pence) 4.6 1.9 6.5 (4.9) 1.6
See Note 2(a) of Notes to the consolidated financial statements for the definition of revenue and capital items.

H I C L A N N U A L R E P O R T & A C C O U N T S 2 0 1 1 2 3
Unaudited Consolidated Proforma Balance Sheet
as at 31 March 2011
31 March 2011 31 March 2010
Investment Consolidation Consolidated Investment Consolidation Consolidatedbasis adjustments IFRS basis basis adjustments IFRS basis
£million £million £million £million £million £million
Non-current assetsInvestments at fair value through profit or loss (Note 1) 596.4 (200.1) 396.3 501.3 (193.9) 307.4Finance receivables at fair value through profit or loss – 761.6 761.6 – 772.0 772.0Intangible assets – 162.0 162.0 – 170.6 170.6Deferred tax assets – 34.3 34.3 – 36.7 36.7
Total non-current assets 596.4 757.8 1,354.2 501.3 785.4 1,286.7
Current assetsInvestments at fair value through profit or loss (Note 1) 29.7 – 29.7 – – –Trade and other receivables 1.0 14.7 15.7 0.1 12.0 12.1Finance receivables at fair value through profit or loss – 17.5 17.5 – 16.6 16.6Cash and cash equivalents 54.7 60.2 114.9 12.8 54.3 67.1
Total current assets 85.4 92.4 177.8 12.9 82.9 95.8
Total assets 681.8 850.2 1,532.0 514.2 868.3 1,382.5
Current liabilitiesTrade and other payables (6.0) (22.9) (28.9) (4.7) (16.2) (20.9)Current tax payable (0.3) (0.5) (0.8) (0.2) (0.6) (0.8)Loans and borrowings – (31.4) (31.4) – (29.6) (29.6)
Total current liabilities (6.3) (54.8) (61.1) (4.9) (46.4) (51.3)
Non-current liabilitiesLoans and borrowings – (616.3) (616.3) (1.8) (628.7) (630.5)Other financial liabilities (fair value of derivatives) (2.3) (80.5) (82.8) (4.6) (80.3) (84.9)Deferred tax liabilities – (104.9) (104.9) – (116.4) (116.4)
Total non-current liabilities (2.3) (801.7) (804.0) (6.4) (825.4) (831.8)
Total liabilities (8.6) (856.5) (865.1) (11.3) (871.8) (883.1)
Net assets/(liabilities) 673.2 (6.3) 666.9 502.9 (3.5) 499.4
EquityShareholders’ equity 673.2 (16.2) 657.0 502.9 (16.3) 486.6Non-controlling interests – 9.9 9.9 – 12.8 12.8
Total equity 673.2 (6.3) 666.9 502.9 (3.5) 499.4
Net assets/(liabilities) per share (pence) 113.1 (2.7) 110.4 110.7 (3.6) 107.1

2 4 H I C L A N N U A L R E P O R T & A C C O U N T S 2 0 1 1
Unaudited Consolidated Proforma Cash Flow
for the year ended 31 March 2011
Year ended Year ended31 March 2011 31 March 2010
Investment Consolidation Consolidated Investment Consolidation Consolidatedbasis adjustments IFRS basis basis adjustments IFRS basis
£million £million £million £million £million £million
Cash flows from operating activitiesProfit/(loss) before tax 45.2 (6.9) 38.3 25.0 (17.3) 7.7Adjustments for:(Gains)/loss on investments (56.2) 22.2 (34.0) (34.8) 14.3 (20.5)Gains on finance receivables – (44.5) (44.5) – (4.4) (4.4)Interest payable and similar charges 3.6 41.4 45.0 5.5 26.4 31.9Changes in fair value of derivatives (2.1) 0.3 (1.8) (3.6) (0.4) (4.0)Operator acquisition investment fees 1.5 – 1.5 0.7 – 0.7Interest income (0.1) (0.3) (0.4) (0.1) (0.2) (0.3)Amortisation of intangible assets – 8.6 8.6 – 8.2 8.2
Operating cash flow before changes in working capital (8.1) 20.8 12.7 (7.3) 26.6 19.3
Changes in working capital:Increase in receivables (0.9) (13.5) (14.4) – (16.1) (16.1)(Decrease)/Increase in payables (0.4) 5.8 5.4 1.0 2.6 3.6
Cash flow (used in)/from operations (9.4) 13.1 3.7 (6.3) 13.1 6.8
Interest received on bank deposits and finance receivables 0.1 0.3 0.4 1.5 0.2 1.7Cash received from finance receivables – 58.8 58.8 – 41.4 41.4Interest paid (5.3) (28.0) (33.3) (9.9) (28.5) (38.4)Corporation tax paid – (0.9) (0.9) – (0.7) (0.7)Interest received on investments 30.5 (5.3) 25.2 27.8 (6.7) 21.1Dividends received 12.8 (2.7) 10.1 8.3 (1.7) 6.6Fees and other operating income 2.2 (0.7) 1.5 2.0 (0.7) 1.3Acquisition of subsidiaries net of cash acquired – – – – 7.0 7.0Loanstock and equity repayments received 0.1 – 0.1 1.1 – 1.1
Net cash from operating activities 31.0 34.6 65.6 24.5 23.4 47.9
Cash flows from investing activitiesPurchases of investments (115.1) – (115.1) (60.5) 8.0 (52.5)
Net cash (used in)/from investing activities (115.1) – (115.1) (60.5) 8.0 (52.5)
Cash flows from financing activitiesProceeds from issue of share capital 154.6 – 154.6 126.3 – 126.3Proceeds from issue of loans and borrowings 77.1 – 77.1 66.6 – 66.6Repayment of loans and borrowings (80.2) (24.3) (104.5) (132.2) (20.8) (153.0)Distributions paid to Company shareholders (29.4) – (29.4) (21.9) – (21.9)Distributions paid to non-controlling interests – (4.4) (4.4) – (1.4) (1.4)
Net cash from/(used in) financing activities 122.1 (28.7) 93.4 38.8 (22.2) 16.6
Net increase in cash and cash equivalents 38.0 5.9 43.9 2.8 9.2 12.0
Cash and cash equivalents at beginning of year 12.8 54.3 67.1 9.1 45.1 54.2Exchange gains on cash 3.9 – 3.9 0.9 – 0.9
Cash and cash equivalents at end of year 54.7 60.2 114.9 12.8 54.3 67.1

H I C L A N N U A L R E P O R T & A C C O U N T S 2 0 1 1 2 5
1. Investments
The valuation of the Group’s portfolio at 31 March 2011 reconciles to the consolidated balance sheet as follows:
31 March 2011 31 March 2010
£million £million
Portfolio valuation 673.1 509.6Less: undrawn investment commitments (47.0) (8.3)
Portfolio valuation on an investment basis 626.1 501.3Less: equity and loanstock investments in operating subsidiaries eliminated on consolidation (200.1) (193.9)
Investments per audited consolidated balance sheet on an IFRS basis 426.0 307.4
Portfolio valuation on an investment basis is represented by:Less than one year 29.7 –Greater than one year 596.4 501.3
Carrying amount at year end 626.1 501.3
Investments per audited consolidated balance sheet on an IFRS basis is represented by:Less than one year 29.7 –Greater than one year 396.3 307.4
Carrying amount at year end 426.0 307.4
Notes to the Unaudited Consolidated Proforma
Financial Statements
for the year ended 31 March 2011

2 6 H I C L A N N U A L R E P O R T & A C C O U N T S 2 0 1 1
Analysis of the Group’s Portfolio
As at 31 March 2011, the Group had 38 investments, details of which are set out in the table below.
Group HoldingsPROJECT Equity Subdebt Mezzanine debt
Ten largest investmentsColchester Garrison 42.0% 42.0%Dutch High Speed Rail Link 43.0% 43.0%Home Office 100.0% 100.0%Kemble Water Junior Loan – – 3.6%M80 DBFO Road 41.6% 41.6%North West Anthony Henday Road 50.0% 50.0%Oxford John Radcliffe Hospital 89.9% 100.0%Queen Alexandra Hospital 89.9% 100.0%Romford Hospital 50.0% 50.0%West Middlesex Hospital 100.0% 100.0%
Remaining investmentsBarnet Hospital 100.0% 100.0% 100.0%Bishop Auckland Hospital 36.0% 36.0% 100.0%Blackburn Hospital 50.0% 50.0%Bradford BSF Schools Phase II project 34.0% 34.0%Central Middlesex Hospital 100.0% 100.0%Conwy Schools 90.0% 90.0%Darlington Schools 50.0% 50.0%Defence Sixth Form College 45.0% 45.0%Durham and Cleveland Firearms Training Centre 72.9% 72.9%Ealing Schools 50.0% 50.0%Exeter Crown Courts 90.0% 90.0%GMPA Police Stations 72.9% 72.9%Haverstock Schools 50.0% 50.0%Health and Safety Laboratory 80.0% 90.0%Helicopter Training Facility – AssetCo 86.6% 8.6%
– ProjectCo 21.8% 59.0%Heath & Safety HQ 50.0% 50.0%Highland Schools 50.0% 50.0%Kent Schools 50.0% 50.0%Kicking Horse Canyon P3 Road 50.0% –MPA Specialist Training Centre 72.9% 72.9%MPA South East London Police Stations 50.0% 50.0%North Tyneside Schools 50.0% 50.0%Newcastle Libraries 50.0% 50.0%Pinnacle Schools, Fife 40.0% 40.0% 100.0%Renfrewshire Schools 30.0% 30.0%Stoke Mandeville Hospital 90.0% 90.0%Sussex Custodial Centre 89.9% 100.0%Wooldale Centre 50.0% 50.0%
Two projects are currently under construction: North West Anthony Henday Road, and the M80 DBFO Road project. All the remaining projects areoperational. The pie charts opposite show how the portfolio has developed in the last 12 months in terms of sector split, projects still inconstruction, geographic location, and concession lengths remaining.

H I C L A N N U A L R E P O R T & A C C O U N T S 2 0 1 1 2 7
Accommodation – 21%Education – 15%
Health – 30%
Utilities – 4%
Law & Order – 9%
Transport – 21%
As at 31 March 2011
Accommodation – 27% Education – 17.7%
Health – 26%
Utilities – 5%
Law & Order – 10%
Transport – 15%
As at 31 March 2010
Sector analysis
Fully Operational – 91%
Construction – 9%
Fully Operational – 98%
Construction – 2%
Investment status
UK – 84%
EU – 12%
Canada – 4%
UK – 85%
EU – 15%
Geographic
Less than 10 years – 5% Greater than 30 years – 1%
20-30 years – 85%
10-20 years – 9%
Less than 10 years – 6% Greater than 30 years – 2%
20-30 years – 85%
10-20 years – 7%
Concession length

2 8 H I C L A N N U A L R E P O R T & A C C O U N T S 2 0 1 1
Analysis of the Group’s Portfolio (continued)
Ten Largest Investments
Set out below are details of the ten largest investments in the portfolio and details of each project. As at 31 March 2011, the largest investment(the Home Office project) accounted for 12.9% of the portfolio.
Colchester Garrison
The project is a 35 year concession to provide a new facility for theSecretary of State for Defence in Colchester, Essex, UK. ColchesterGarrison provides accommodation for approximately 3,500 militaryand 750 civilian personnel. The project is located on the originalgarrison site and partly on an adjacent brown field site owned by theMinistry of Defence. Capital expenditure on the project wasapproximately £550m. Construction was completed in April 2008which was five months ahead of the original programme.
Catering, cleaning and transport services are provided by SodexoDefence Services Limited. WS Atkins Facilities Management Limitedis responsible for estate and grounds maintenance, contractmanagement and security, waste management and lifecycle.
Excellent relationships have been maintained at all levels of theproject during the year, and all outstanding construction issues havebeen resolved with operational performance settling down to a verysatisfactory routine with minimal deductions and complaints.
A significant achievement during the year was to work with the clientto progress the provision for a ‘Help for Heroes’ rehabilitation centre.Construction has now commenced and should be ready for openingat the end of this year.
Dutch High Speed Rail Link
The largest PPP project signed to date in the Netherlands, the Dutchhigh speed rail link provides a high-speed connection from SchipholAirport to the Belgian border. The HSL Zuid project, as it is knownlocally, was developed for the Dutch Ministry of Transport, PublicWorks and Waste Management and the Ministry of Finance under a25 year concession. The project involves capital expenditure of over
£625m and includes track, noise attenuation, signalling, powerdistributions and communications systems. Financial close was inOctober 2001.
Certificates of Availability have been issued for both the North andSouthern sections. Maintenance obligations are carried out by a jointventure comprising Siemens Nederland BV, Koninklijke BAM NBMNV and Fluor Infrastructure BV.
The last year has seen a gradual build-up of the train services by theState to a level where there is now a half hour service. Availabilityhas been very good with minimal deductions achieved. The focus forthe Project Company has been to clear the outstanding issuesbetween the parties, and progress has been made in this respect.The Project Company has established an improvement committee toreview all aspects of project performance to ensure best possiblepractice is being employed.
Home Office
The project is a 29 year concession commissioned by the UK HomeOffice to build, finance, operate and maintain a new headquartersbuilding to replace their existing office accommodation withpurpose-built serviced offices in Westminster, London. The projectinvolved capital expenditure of approximately £200m and thedemolition of the existing offices on a 4.3 acre site, followed by theconstruction of a building comprising three purpose-builtinterconnecting office blocks to accommodate up to 3,450 staff.Construction was completed in January 2005.
The services being provided include health and safety, cleaning,catering and energy management. Operations are managed byEcovert FM Limited a facilities management subsidiary of Bouygues.
Directors’ Valuation31 March 2011 31 March 2010
PROJECT Valuation as a Valuation as apercentage of percentage of
Directors’ portfolio Directors’ portfoliovaluation valuation
£million £million
Directors’ Valuation – £m 673.1 509.6
Colchester Garrison 6.3% 8.8%Dutch High Speed Rail Link 12.2% 14.7%Home Office 12.9% 16.2%Kemble Water 4.4% 4.8%M80 DBFO Road 4.3% –North West Anthony Henday Road 3.5% –Oxford John Radcliffe Hospital 4.6% –Queen Alexandra Hospital 9.4% –Romford Hospital 3.8% 4.9%West Middlesex Hospital 2.9% 3.4%
Total 64.3% 52.8%

H I C L A N N U A L R E P O R T & A C C O U N T S 2 0 1 1 2 9
The project team has been working with the Home Office PropertyGroup to enable annual reductions in the Home Office energyconsumption to be very near to the Government’s target for CentralGovernment department buildings of 10% for the year to end ofApril 2011.
As part of the contract requirements a benchmarking exercise wasmanaged by the project team. It involved the supply chain agreeingto revise their soft facilities management costs which providedsignificant financial savings to the client.
A customer satisfaction survey was carried out on members of the3,000 staff and users of the building. Of those staff that participatedover 76% agreed that the services provided to the project haveimproved over the last 12 months and generally satisfaction levelswere at “good” or “very good”.
Kemble Water
This is a participation of £30m in the junior term loan facility forKemble Water, the vehicle set up to acquire RWE Thames WaterHoldings (“Thames Water”). Kemble Water acquired the whole ofThames Water from RWE, including the regulated UK water businessand non-regulated businesses (this includes Thames Water’sproperty, commercial, and international businesses).
The junior term loan was repaid in full in early April 2011.
M80 DBFO Road
The M80 DBFO project, between Stepps and Haggs in Scotland,involves the upgrade of a ten kilometre stretch of the existing M80,as well as a new eight kilometre section of motorway, seven newjunctions and 60 additional structures. The project is currently 18months into a three year construction period, with works beingperformed under a Bilfinger Berger UK, Northstone (NI) Ltd and JohnGraham (Dromore) Ltd joint venture.
The project is on schedule to complete in Q4 2011 and will operateunder a 30 year concession contract thereafter. The motorway is tobe operated and maintained by BEAR Scotland Ltd under a long-termservices agreement.
The project team were pleased to allow the Emergency Servicesaccess to a 2.5km stretch of the new Moodiesburn Bypass prior toopening for Operation Roller, an emergency training exercise held inNovember 2010. A very successful training exercise involving stagedaccidents and casualties was carried out by all members of theEmergency Services, fire, police and ambulance with no disruption tothe construction programmes.
The Scottish Spina Bifida Association (SSBA) have been selected asthe nominated charity for the project which means the Project teampersonnel work to raise money through a number of initiativesincluding the Contractor’s site safety programme. By meeting andexceeding quarterly safety targets, money is released and donatedto SSBA. To date over £9,500 has been raised just though this oneHealth and Safety initiative.
North West Anthony Henday Road
The North-West Anthony Henday P3 in Alberta, Canada comprisesthe design, build, financing and ongoing operation of a 21km stretchof the four and six lane ring-road surrounding the city of Edmonton.The project is currently under construction, with operationsscheduled to begin in November 2011. Construction is being carriedout by a joint venture comprising Flatiron Constructors CanadaLimited, Parsons Overseas Company of Canada Ltd and GrahamInfrastructure, itself a JV between Graham Infrastructure LP andJardeg Construction Service LP.
The ongoing operations and maintenance will be carried out byCarmacks Maintenance Services Ltd, under a long-term servicesagreement. The concession contract lasts for 30 years from thebeginning of operations, expiring no later than November 2041.
The project team have developed an approach to working with thevarious stakeholders including the main highway client, AlbertaTransportation and a number of municipalities through which thenew road passes. This has resulted in the efficient resolution ofissues relating to the new road linking into local roads and themunicipalities own plans for their local roads improvements. Asimilar partnership approach has seen the utilities, gas water andelectricity committed to working as part of an integrated projectdelivery team.
Oxford John Radcliffe Hospital
The Oxford John Radcliffe PFI Hospital project involves the design,construction, management, financing, operation and maintenance ofa new wing adjacent to the former Radcliffe Infirmary in Oxford. Theconcession runs until 31 December 2036.
The new wing was constructed by Carillion Construction Ltd andreached operational completion in December 2006. The newfacilities built under the contract formed the ‘West Wing’ and the‘New Children’s Hospital’. A number of adult and children serviceswere relocated from the Radcliffe Infirmary and other sites withinthe Oxford Radcliffe Hospitals NHS trust to centralise them intoone facility.
Facilities management services are subcontracted to CarillionServices Ltd.
A lot has been achieved during the year with the resolution of manyoutstanding claims, assistance to the Trust to achieve significantbudgetary savings and benchmarking being concluded without theneed for Market Testing.
A cost saving workshop instigated by the project Company producednumerous ideas to reduce Trust costs and some of these wereincorporated into the benchmarking process providing around £1mof savings for the wider Trust budget. Close contact with the Trusthas been maintained during the year and support has been given tothe Service provider to improve areas of performance in estatesmanagement and portering.

3 0 H I C L A N N U A L R E P O R T & A C C O U N T S 2 0 1 1
Queen Alexandra Hospital
The completed hospital has 1,026 inpatient beds, 34 neonatalintensive care cots, 3 endoscopy suites and 20 main operatingtheatres. The concession contract runs until December 2040.
The new hospital buildings were developed and built by CarillionConstruction Ltd, a subsidiary of Carillion. The majority of the newfacilities have been operational since June 2009, with finalconstruction completed last month. A subsidiary of Carillion providesfacilities management services to the project under a long-termservices agreement.
Since acquiring the project last year, the Investment Adviser hastaken a fresh approach to reviewing the project and assisting theservice provider to generally raise standards, client satisfactionand lower payment deductions. The final construction phase wascompleted in June 2010 which leads to a final completion certificatefor construction in 2011. Another major change in the year hasbeen to replace the Project Company managers to generallyimprove overall performance, reduce the areas of conflict and bemore efficient.
Romford Hospital
This project involves the design, build and finance of a new hospital –the Queen’s Hospital – in Romford, Essex, followed by themaintenance of the hospital and the provision of non-clinicalservices and a Managed Equipment Service for a term of 36 yearsthat ends in 2040. The project involved capital expenditure ofapproximately £211m and its construction was completed in October2006 by Bovis Lend Lease Limited.
Soft and Hard Facilities management is the responsibility of SodexoLimited and the Medical Equipment Services are provided bySiemens plc.
The last year has provided the opportunity to familiarize ourselveswith the project, people and current issues. At the InvestmentAdviser’s instigation a relationship building/cost reduction workshopwas arranged last autumn with all key parties. HM Treasuryannounced in February a thorough review of this project to identifysavings and efficiencies within the project and lessons that can beapplied to other PFI projects. All parties cooperated and thepreviously held workshop was timely as it had identified ideas,savings, and opportunities.
West Middlesex Hospital
The project is a 35 year concession to design, construct, finance,operate and maintain a new 228 bed hospital in West Middlesex, UK.Financial close occurred in January 2001 and the project involvedcapital expenditure of approximately £60m. Construction wascompleted on time in June 2003.
Building management services comprise the repair and maintenanceof plumbing and security systems as well as health and safetyservices. Catering, laundry, cleaning, porterage and security servicesare also being provided. Operations are being managed by EcovertFM Limited, the facilities management subsidiary of BouyguesConstruction S.A.
The project enjoys good relationships between all parties and softservices continue to be delivered to acceptable standards. Theproject has received compliments for assisting the Trust in achievingan ‘excellent’ score in the overall ratings in the Patient EnvironmentAction Team assessment categories.
Service improvement initiatives have been made to a range ofservices including help desk operations, NEPT and portering. The FMcontractor has reviewed waste management service specifications toimprove recycling and reduce costs. The project has also supportedthe Trust in achieving savings in utilities costs by the installation ofenergy management equipment and LED lighting.
Analysis of the Group’s Portfolio (continued)

H I C L A N N U A L R E P O R T & A C C O U N T S 2 0 1 1 3 1
The Company has put in place a risk management frameworkcovering all aspects of the Company’s business. Due to the nature ofthe Company (being an Investment Company) and the outsourcingof key services to the Investment Adviser and other serviceproviders, reliance is placed on the Group’s service providers ownsystems and controls.
The identification, assessment and management of risk are integralelements of the Investment Adviser’s and the Operator’s work inboth management of the existing portfolio and in seeking newinvestment opportunities.
The Directors set out the material risks relating to the Group’sportfolio and investing in the Company as at November 2010 in theCompany’s C Share Prospectus, which is available from theCompany’s website.
The Investment Adviser and the Operator have established internalcontrols to manage these risks, and also review and consider theGroup’s key risks on a quarterly basis. The Board reviews the key risksaffecting the Company at each regular board meeting, by reference toa risk analysis matrix prepared by the Investment Adviser. If a new riskarises or the likelihood of a risk occurring increases, whereappropriate, a mitigation strategy is developed and implemented,together with enhanced monitoring by the Investment Adviser.
The Board’s Management Engagement Committee also reviews theperformance of the Investment Adviser (as well as all key serviceproviders) on at least an annual basis and this review includes aconsideration of the Investment Adviser’s internal controls and theireffectiveness. In addition, the Investment Adviser’s risk managementteam reviews compliance against the documented procedures andcontrols on an annual basis, and reports their finding to the Board.
Risks and Risk Management
External risks
The Group currently has a broad exposure to the PFI/PPP/P3 marketsin the UK, the EU (currently the Netherlands), and Canada. The Grouphas investments, business activities, registered companies andlimited partnerships in the UK, Luxemburg and Guernsey. Theseactivities and entities can be affected by changes in economic factors,local legislation, taxation and regulatory frameworks.
The performance of the portfolio of 38 investments (as at 31 March2011) is affected by a number of economic factors including inflationrates, interest rates, and foreign exchange rates. Most, if not all ofthe PFI/PPP/P3 projects mitigate to some extent against changes ininflation rates by seeking to match their indexation of contractualrevenues to their indexation of contractual costs. This is not always
achievable where costs are not indexed, an example being wherebank debt interest rate exposure has been swapped into a fixed rate.
Most PFI/PPP/P3 concessions provide some or total protection,through their contractual structures, in relation to changes inlegislation which affect either the project asset or the way theservices are provided.
Changes in tax legislation and accounting practices can affect boththe individual investments and can have an impact on the Group’scorporate subsidiaries and corporate structure. Where possible, thiswill be mitigated, but there will be instances where this may not bepossible and in these instances there could be an adverse impact onthe financial performance of the Group.
Risk Assessment
Risk groups Risk type
External � Economic factors
� Legal – new laws and legislation
� Tax and accounting – changes in practice and policies
� Political – changes in policy, both in relation to procurement and the management of existingPFI/PPP/P3 projects
� Regulatory – changes in polices and requirements
Strategic � Financial objectives – impacting on achieving targets
� Share price discount/premium to NAV
Management � Group’s reliance on service providers – underperformance, solvency and breach of regulations
Investment � Bidding – overpaying for assets
� Acquisition – due diligence fails to unearth risks which impact performance
� Equity risks associated with PFI/PPP/P3 projects
� Performance – under-performance by service providers
� Concentration – over-reliance on a client or service contractor
Financial & Treasury � Finance and liquidity – lack of financial resources
� Counterparties – reliance on financial institutions
� Currency – exchange rate exposure
� Interest rates – both on debt funding and deposit accounts

3 2 H I C L A N N U A L R E P O R T & A C C O U N T S 2 0 1 1
The UK government is currently reviewing alternative procurementmethods to PFI. It is not clear exactly what role the private sector willplay in the future. However, with other countries developing their ownPFI/PPP/P3 models and procuring new infrastructure, the number ofprojects globally continues to grow. The Group is not reliant on anyparticular procurement pipeline for its new investments.
There is a risk that an existing project might be voluntarilyterminated. This risk is not considered to be high due, in part, to therequirement for the public sector client to meet termination costs andcompensate fully the project participants for any resultant losses.
In the UK, the Government is seeking to find savings in publicprocurement and this remit extends to PFI projects alreadycontracted. In January 2011, HM Treasury issued draft guidance tothe public sector on how to manage PFI contracts to maximise valuefor money. In February, Romford Hospital, in which we invest, waschosen as a pilot scheme to examine more closely theopportunities for efficiency improvements. Both the Treasury andPublic Accounts Select Committees are currently reviewing the roleof PFI in public procurement.
Media attention around PFI has increased and, regrettably, thishas led to some negative publicity. As a Company, we shall alwaystry to correct misrepresentations and inaccuracies but it is notalways possible to have our views or those of the industryadequately reported.
Each PFI/PPP/P3 project is built from a legal contract with a publicsector client. There is a risk, albeit slight, that a political decisioncould be taken to seek to unilaterally change the terms of a contract.Although such a development would have wide ranging implications,if it were attempted and should succeed, the value of the Group’sinvestment portfolio and its ability to meet target distributionswould be affected.
Under Guernsey legislation, the Company is an Authorised Closed-Ended Investment Scheme and is supervised by the GuernseyFinancial Services Commission. The Investment Adviser is authorisedand regulated by the Financial Services Authority in the UK, inaccordance with the Financial Services and Markets Act 2000. Boththe Company and its advisers continually monitor any potential oractual changes to regulations to ensure both the Group and itsservice providers remain compliant.
Strategic Risks
The Company’s strategy is to deliver a progressive distributiongrowth with the aim of achieving 7.0p per share by March 2013. Atthe same time, the aim is to maintain or grow the net asset value(‘NAV’) of the Company. Since the current portfolio consists ofinvestments in concessions with finite lives, if no new acquisitionsare made, there will come a point in the Company’s evolution when itwill become necessary to start repaying capital. This is showndiagrammatically in the chart on page 16.
The ability both to deliver growth in distributions to shareholdersand to maintain and grow its NAV is dependent on a number ofeconomic factors outside the Company’s or the Investment Adviser’scontrol. Whilst reasonable assumptions have been factored intobusiness plans, significant external factors could materially affectthe Company and impede its ability to deliver its financial objectives.Examples of such events include a prolonged period of deflation, arise in corporation tax rates, and changes in tax legislation affectingthe Group and its investments.
The Company publishes a NAV per share twice a year. The method ofvaluing the Group’s investments is described in detail in theInvestment Adviser’s Report. To assist in managing the share pricepremium or discount to NAV, the Board has the powers to both buyback shares as well as issue additional shares under the BlockListing. There is no guarantee that these measures will keep thediscount or premium to NAV small.
The Investment Adviser meets existing and potential newshareholders throughout the year to explain the Company, itsinvestments, its performance, and the key risks. The Board believesthese on-going meetings and briefings help educate the market andinform both existing and new potential shareholders.
Management Risks
The Group is heavily reliant on the Investment Adviser for the day-to-day management of the Group and to achieve the Group’s objectives.The Investment Adviser is supported by other service providers tothe Group. Failure by the Investment Adviser or a service providercould have a material impact on the Group. Equally a loss of keypersonnel from a service provider may have an impact on theperformance of the Group.
The Management Engagement committee of the Board reviews theperformance of each service provider on an annual basis and seeksto ensure that each service provider has adequate systems andcontrols in place in relation to the services they provide to the Group.Any performance issues are monitored carefully, and if the Board isnot satisfied with the level of service delivery, the Board will seek tochange service providers.
In relation to the Investment Adviser, the Board takes comfort fromthe fact that the Investment Adviser has a track record in managinginfrastructure investments and has developed an appropriate anddetailed set of policies, procedures, compliance systems, and riskcontrols. The Investment Adviser is subject to routine review and theBoard is satisfied that there is sufficient depth of expertise within theInvestment Adviser’s infrastructure team that the Group is not relianton any single individual.
As part of the process leading to the change of ownership of theInvestment Adviser to senior management, the Board engaged on anumber of occasions in the process to gain satisfaction that thischange would not impact on the Investment Adviser’s ability toprovide services to the Group to the standards previously provided.Whilst the Board and the Investment Adviser believes this change ofownership will not affect the Company’s performance, the Boardcontinues to monitor and engage with the Investment Adviser toensure the new ownership of the Investment Adviser does not impacton the quality and level of services received to date.
Risks and Risk Management (continued)

H I C L A N N U A L R E P O R T & A C C O U N T S 2 0 1 1 3 3
Investment Risks
Acquiring a new investment in an infrastructure project via a tradesale involves a certain level of risk. These are mitigated wherepossible by a structured process of thorough due diligence, theagreement of suitable protections where possible in the sale andpurchase agreements with the vendor, and site visits to view andinspect the project’s assets. However due diligence may fail toidentify risks and the business plan assumptions in the acquisitionmodel may not subsequently be achieved.
The Investment Adviser and Operator have internal processes andcontrols, developed from its experience of managing funds andinvesting in infrastructure, to minimise these risks through regularpeer group review and internal approval processes. All investmentdecisions are made by an Investment Committee which has approvedterms of reference to ensure only those staff with appropriate skillsets have been appointed, any conflicts should they arise aresuitably managed, and an appropriate minimum quorum is achieved.Specialist advisers (such as lawyers, technical consultants, and taxadvisers) are retained to carry out specific due diligence on potentialacquisitions to minimise this risk.
Investments are normally acquired through competition and so it isimportant to analyse the investment and determine the appropriatevalue the Group is prepared to pay. The risk of over-paying is lessthan for infrastructure assets requiring revenue forecasts, since themajority of the revenue and cost streams in PFI/PPP/P3 projects andsimilar asset types are contractual and therefore fixed in real terms.
Whilst most construction and operational risks in a PFI/PPP/P3project are laid off to sub-contractors through a well-establishedcontractual framework, there are occasions when costs and/or risksare retained within the SPV. These include a number of routinerunning cost items and are also likely to include:
� Insurance premiums: If insurance premiums are not subject topass down to a service provider, any increases are for the accountof the project. To provide some protection against substantialincreases the majority of the projects have negotiated premiumrisk sharing agreements with the public sector authority wherewhen an agreed cap is met the increased premium is mostly orwholly taken by the authority.
� Life cycle (also called Asset Renewal or Major Maintenance):Lifecycle is the budget to replace parts of the project’s assetswhich are outside the routine maintenance contract. Examples ina building will include floor finishes (e.g. carpets), doors,windows, ceilings and mechanical and electrical equipment. Insome cases this risk and the budget for replacement are passeddown to the maintenance contractor, and in the remainingprojects, it sits with the project company. There is a risk that thebudget is inadequate or expenditure needs to be carried outearlier than forecast. For the current portfolio, the Group hasassessed the risk and considers that the lifecycle provisions arereasonable and adequate.
Once acquired, investments need to perform in line with theirbusiness plans. Underperformance can be caused by a number offactors, the most likely of which is the underperformance of a service
delivery partner. The Investment Adviser plays an active role in themanagement of the Group’s investments to ensure any trends inperformance are picked up and if necessary, corrected accordingly. Ina severe case, the project can terminate a sub-contractor who fails toperform and either self-manage the services or tender for a newservice provider. The cost of this action would, where possible, berecovered from the previous supplier.
A key risk within a PFI project is the various counterparty exposures:the client, the sub-contractors, and the providers of finance andfinancial services. The Group is careful to manage its concentrationexposures to any one party carefully. Whilst the Group is currentlypredominantly UK PFI/PPP investments, the Group has started todiversify sovereign risk by 2 Canadian investments in the year. Sub-contractor and financial counter-parties exposures are monitoredand the Group seeks a balanced portfolio with no over-reliance on asingle party.
Financial and Treasury
The Group’s investments and the Group itself require debt finance toachieve its business objectives. All of the Groups’ PFI/PPP/P3investments have long-term funding in place and do not needrefinancing to meet their financial plans. The Group has a 5 yearcommitted £200m revolving debt facility which expires in December2012. There is a risk that it will not be possible to renew this facilityon acceptable terms, and if this proves to be the case, the Group willneed to either have raised further equity or will need to dispose ofselected investments to enable it to meet its repayment obligations,to the extent, if at all, that the facility is drawn.
The group and its PFI/PPP/P3 investments have a number offinancial counterparties providing a range of facilities including debtfunding, hedges, monoline insurance wrapping, bank depositfacilities, and insurance. Failure of a financial party could have amaterial effect on the Group depending on the nature of the servicebeing provided. The greatest risk is with the deposit banks wherethe Group and its investments have cash on short and medium termdeposits. The Investment Adviser monitors this exposure acrossthe portfolio to make sure no over-reliance on any single institutionand that all counterparties have reasonable credit ratings.
The Group has limited foreign currency exposure at present, with oneinvestment in euros and two in Canadian dollars. This is likely tocontinue to change in the future as further non-UK investments areacquired. To date the Group has balance-sheet hedged the value ofits overseas investment and will, if deemed appropriate hedgeprospective income on a short-term basis.
The Group is exposed to interest rate fluctuations, both on itsborrowing and cash deposits. The PFI/PPP/P3 projects have hedgesin place on the majority of their borrowings to minimise interestvolatility. Similarly the Group’s corporate borrowings are partiallyhedged. It is possible to some extent to mitigate rate fluctuations onthe cash deposits by selecting the deposit period. However in thecurrent low interest rate economy, the PFI/PPP/P3 projects are notearning as much from their cash deposits as they were three yearsago. This has impacted the valuation of the portfolio, since it is aninherent risk where options to mitigate are limited.

3 4 H I C L A N N U A L R E P O R T & A C C O U N T S 2 0 1 1
The Directors, all of whom are non-executive and independent of theInvestment Adviser, are listed below.
Mr Graham Picken (62) – Chairman
Appointed to the Board 12 January 2006
Graham Picken is an experienced banker and financial practitioner andhas been Chairman of the Company since its launch. Formerly, a nonexecutive director of the Derbyshire Building Society, he wasappointed Chief Executive of the Derbyshire in February 2008 and ledthe society to a merger with Nationwide Building Society in December2008, standing down at the end of March 2009 to take on a short-termadvisory role with the Bank of England. Until 2003, Graham’s careerspanned over thirty years with Midland and HSBC Banks where, beforehe retired, he was General Manager of HSBC Bank plc responsible forcommercial and corporate banking (including specialised and equityfinance). Before that Graham was Chief Executive of Forward TrustGroup, an authorised bank, and Chairman of First Direct, a division ofHSBC Bank plc. Graham has also been a non-executive director ofHM Customs & Excise. He is a resident of the UK.
Graham has no other listed company directorships
Mrs Sarah Evans (56)
Appointed to the Board 9 June 2008
Sarah Evans is a Chartered Accountant and is a director of severalother listed investment funds, as well as an unlisted fund of hedgefunds. She is a member of the Institute of Directors.
Sarah spent over six years with the Barclays Bank PLC group from 1994to 2001. During that time she was a treasury director and from 1996 to1998 she was Finance Director of Barclays Mercantile, where she wasresponsible for all aspects of financial control and operational riskmanagement. Prior to joining Barclays Sarah ran her own consultancybusiness advising financial institutions on all aspects of securitisation.From 1982 to 1988 Sarah was with Kleinwort Benson, latterly as headof group finance. She is resident in Guernsey.
Other public company directorships (listed in London)*:Crystal Amber Fund Limited (listed on AIM)CQS Diversified Fund LimitedHarbourvest Senior Loans Europe LimitedJapanese Leisure Hotels Limited (listed on AIM)
Mr Henri Grisius (67)
Appointed to the Board 12 January 2006, Henri retired as a directorof the Company on 1 June 2010.
Henri lives in Luxembourg and is the founder and managing partnerof RSM Henri Grisius & Associés Sàrl, and is a director of a numberof international investment companies. He is a former partner ofErnst & Young and BDO in Luxembourg. Before that he set up theinvestment funds department of Banque de Luxembourg inLuxembourg. He started his career with the Luxembourg StockExchange in 1969.
Henri has no other public company directorships
Mr John Hallam (62)
Appointed to the Board 12 January 2006
John lives in Guernsey, is a Fellow of the Institute of CharteredAccountants in England and Wales and qualified as an accountant in1971. He is a former partner of PricewaterhouseCoopers havingretired in 1999 after 27 years with the firm both in Guernsey and inother countries. He is currently Chairman of Cazenove AbsoluteEquity Ltd, Dexion Absolute Ltd and Partners Group GlobalOpportunities Ltd as well as being a director of a number of otherfinancial services companies. He served for many years as a memberof the Guernsey Financial Services Commission from which he retiredin 2006, having been its Chairman for the previous three years.
Other public company directorships (listed in London unless noted otherwise)*:BH Global Limited (listed on London, Bermuda and Dubai)Cazenove Absolute Equity LimitedDexion Absolute LimitedNB Distressed Debt (listed on SFM London)NB Private Equity Partners Limited (listed on SFM London andAmsterdam)Partners Group Global Opportunities Limited (listed on Ireland)Vision Opportunity China Fund Limited (listed on AIM)
Mr Chris Russell (62)
Appointed to the Board on 1 June 2010
Chris is a Guernsey resident non-executive director of investmentand financial companies in the US, UK, Hong Kong and Guernsey. Heis also Deputy Chairman of the UK trade body, the Association ofInvestment Companies. Chris was formerly a director of GartmoreInvestment Management Plc, where he was Head of Gartmore’sbusinesses in the US and Japan and before that was a holding boarddirector of the Jardine Fleming Group in Asia. He is a Fellow of the UKSociety of Investment Professionals and a Fellow of the Institute ofChartered Accountants in England & Wales.
Other public company directorships (listed in London unless noted otherwise)*:JP Morgan Japan Smaller Companies Trust plcF&C Commercial Property Trust LtdKorea Fund Inc (listed in New York)
Board of Directors
Standing: John Hallam (left) and Chris Russell (right). Seated: Sarah Evans (left) and Graham Picken (right).
* Certain of the Directors maintain additional directorships thatare also listed but not actively traded on various exchanges.Details may be obtained from the Corporate Secretary.

H I C L A N N U A L R E P O R T & A C C O U N T S 2 0 1 1 3 5
The Directors present their report and accounts of the Group for theyear to 31 March 2011.
Principal Activity
The Company is an Authorised Closed-Ended Guernsey incorporatedinvestment company. Its shares have a premium listing on theOfficial List of the UK Listing Authority and are traded on the mainmarket of the London Stock Exchange.
A review of the business during the year is contained in theChairman’s Statement and the Investment Adviser’s Report.
Results and Distributions
The results for the year are set out in the attached accounts. TheCompany has declared two interim dividends, relating to the yearended 31 March 2011 as follows:
� 3.275p declared on 11 November 2010, to shareholders on theregister as at 19 November 2010, paid on 31 December 2010; and
� 3.425p declared on 19 May 2011, to shareholders on the registeras at 27 May 2011, to be paid at the end of June.
At the Annual General Meeting on 26 July 2010 shareholdersrenewed their approval to the Board, at its discretion, to offer a scripdividend alternative. This alternative was offered to shareholdersfor both of the interim dividends declared for the year ending31 March 2011.
Guernsey Regulatory Environment
The Company is an Authorised Closed-Ended Investment Schemeand is subject to certain ongoing obligations to the GuernseyFinancial Services Commission.
Share Issue
At 31 March 2010, there were 454,301,314 Ordinary Shares and2 Management Shares in issue. The Management Shares carry onevote each on a poll, do not carry any right to dividends and, inwinding-up, rank only for a return of the amount of the paid-upcapital on such shares after return of capital on Ordinary Shares andNominal Shares. The Management Shares are not redeemable andare accrued for and on behalf of a Guernsey charitable trust.
At 31 March 2010, the Company had 23,523,608 shares not yetissued under a block-listing application made on 23 September 2009.These shares were subsequently issued for cash:
Date New Ordinary Shares
21 June 2010 2,629,7342 July 2010 20,893,874
On 5 July 2010, the Company made a block listing application for30,000,000 Ordinary Shares.
Under this block-listing the Company issued the following newOrdinary Shares of 0.01p each in the Company for cash:
Date New Ordinary Shares
5 July 2010 6,526,33813 July 2010 3,000,0002 August 2010 4,000,00017 August 2010 4,616,000
As a result of the scrip dividend alternative announced on 20 May2010 the Company issued 354,717 new Ordinary Shares of 0.01peach in the Company in lieu of the 3.35p dividend to thoseshareholders who had elected to receive the same.
As a result of the scrip dividend alternative announced on11 November 2010 the Company issued 1,467,477 new OrdinaryShares of 0.01p each in the Company in lieu of the 3.275p dividendto those shareholders who had elected to receive the same.
On 15 December 2010, the Company issued 110,000,000 C Shares of0.01p as a result of the Company’s C Share capital raising.
On 17 January 2011, as a result of the conversion of the C Shares, theCompany issued 97,350,000 new Ordinary Shares of 0.01p inexchange for 110,000,000 C Shares.
At 31 March 2011, there were 595,139,454 Ordinary Shares and2 Management Shares in issue.
Directors
The Directors who held office during the year to 31 March 2011 were:
G PickenS EvansH GrisiusJ HallamC Russell
As previously announced Mr Grisius retired from the Board on 1 June2010, and Mr Russell was appointed as a director of the Companyfrom 1 June 2010.
Mr G Picken, Mrs S Evans and Mr H Grisius were during the yearDirectors of HICL Infrastructure 1 Sàrl and HICL Infrastructure 2 Sàrl,wholly owned subsidiary undertakings of the Company.
Biographical details of each of the Directors are shown on page 34.
Report of the Directors

3 6 H I C L A N N U A L R E P O R T & A C C O U N T S 2 0 1 1
During the year the Directors were paid the following emoluments inthe form of fees:
Director Total Fees
G Picken* £48,000S Evans* £34,500H Grisius £3,750J Hallam* £38,000C Russell* £30,750
*The fees above include an additional £10,000 per director in respect of theadditional work in relation to the C share issue in November 2010, and anadditional £10,000 in aggregate relating to the additional work associatedwith considering the change of ownership of the Investment Adviser.
Following a review by the Remuneration Committee who retained theservices of an independent fee consultant, Trust Associates, theBoard is proposing to increase the fees for directors for the year to31 March 2012 to £37,500 for the Chairman, £29,000 for Mr Hallam,and £25,000 each for Mrs Evans and Mr Russell. In addition, adirector (currently Mrs Evans) who is also a director of the twoLuxemburg subsidiaries, will be entitled to an additional £5,000 p.a.for work in connection with those companies. As in previous years,should the Company require directors to work on specific corporateactions such as a further C share raising, an additional appropriatefee will be determined. All fees paid to directors in the year need tofall within the fee cap, currently £200,000 p.a.
The Board has decided to seek approval for these increases indirectors’ proposed fees at the AGM in July 2011.
Investment Adviser and Operator
InfraRed Capital Partners Limited (the “Investment Adviser” or“IRCP”) is authorised and regulated by the Financial ServicesAuthority. IRCP acts as Investment Adviser to the Company and actsas Operator of the limited partnership which holds and manages theGroup’s investments. A summary of the contract between theCompany, its group companies, and IRCP in respect of servicesprovided is set out in Note 24 to the accounts.
IRCP was formerly called HSBC Specialist Fund Management Limitedand was an indirect subsidiary of HSBC Holdings plc until thecompletion in April 2011 of the management buy-out by seniormanagement. The HSBC Group retains a 19.9% indirect interest in IRCP.
It is the Directors’ opinion, based on performance in the year that thecontinuing appointment of IRCP on the agreed terms is in the bestinterests of the shareholders as a whole.
Brokers, Administrator &
Company Secretary
During the year, the joint brokers to the Company were CollinsStewart Europe Limited and Oriel Securities Limited.
The Company’s Administrator and Company Secretary during theyear was Dexion Capital (Guernsey) Limited.
Substantial Interests in Share Capital
As at 20 May 2011, the Company has received notification inaccordance with the FSA’s Disclosure and Transparency Rule 5 of thefollowing interests in 3% or more of the Company’s 595,139,454Ordinary Shares to which voting rights are attached.
Number of Ordinary Percentage Shares Held Held
Rensburg Sheppards InvestmentManagement Limited 53,713,210 9.03%Brewin Dolphin Limited 48,287,729 8.11%BT Pension Scheme TrusteesLimited 29,795,360 5.01%Schroders plc 24,368,554 4.09%Legal & General Group Plc 18,278,725 3.07%
Directors’ Interests
The Directors of the Company on 31 March 2011, and their interestsin the Ordinary Shares of the Company, are shown in the table below.
31 March 2011 31 March 2010
Graham Picken 69,673 44,910Sarah Evans* 223,230 134,730Henri Grisius n/a 44,910John Hallam 69,673 44,910Chris Russell** 47,091 n/a
* of which 178,320 were held by her spouse** of which 6,051 were held by his family
All of the holdings of the Directors and their families are beneficial.No changes to these holdings had been notified up to the date ofthis report.
Donations
The Company made no political or charitable donations duringthe year.
Payment of Suppliers
It is the policy of the Company to settle all investment transactions inaccordance with the terms and conditions of the relevant market inwhich it operates. Although no specific code or standard is followed,suppliers of goods and services are generally paid within 30 days ofthe date of any invoice. The Company has no trade creditors.
Going Concern
The Group’s business activities, together with the factors likely toaffect its future development, performance and position are set outin the Investment Adviser’s Report on pages 11 to 17. The financialposition of the Group, its cash flows, liquidity position and borrowingfacilities are described in the Financial Results on pages 18 to 21. Inaddition, notes 1 to 4 and 21 to 22 of the financial statementsinclude the Group’s objectives, policies and processes for managingits capital; its financial risk management objectives; details of itsfinancial instruments and hedging activities; and its exposures tocredit risk and liquidity risk.
Report of the Directors (continued)

H I C L A N N U A L R E P O R T & A C C O U N T S 2 0 1 1 3 7
The Group has considerable financial resources together with long-term contracts with various public sector customers and suppliersacross a range of infrastructure projects. As a consequence, theDirectors believe that the Group is well placed to manage its businessrisks successfully despite the current uncertain economic outlook.
The Directors have a reasonable expectation that the Group hasadequate resources to continue in operational existence for theforeseeable future. Thus they continue to adopt the going concernbasis of accounting in preparing the annual financial statements.
Share Repurchases
No shares have been bought back in the year. The latest authorityto purchase ordinary shares for cancellation was granted to theDirectors on 26 July 2010 and expires on the date of the nextAnnual General Meeting. The Directors are proposing that theirauthority to buy back shares be renewed at the forthcoming AnnualGeneral Meeting.
Treasury Shares
Section 315 of the Companies (Guernsey) Law, 2008 allowscompanies to hold shares acquired by market purchase as treasuryshares, rather than having to cancel them. Up to 10% of the issuedshares may be held in treasury and may be subsequently cancelledor sold for cash in the market. This would give the Company theability to reissue shares quickly and cost efficiently, therebyimproving liquidity and providing the Company with additionalflexibility in the management of its capital base.
The Board currently intends only to authorise the sale of shares fromtreasury at prices at or above the prevailing net asset value per share(plus costs of the relevant sale). This should result in a positiveoverall effect on shareholders if shares are bought back at a discountand then sold at price at or above the net asset value per share (pluscosts of the relevant sale).
In the interests of all shareholders, the Board will keep the matter oftreasury shares under review.

3 8 H I C L A N N U A L R E P O R T & A C C O U N T S 2 0 1 1
The Directors are responsible for preparing this report and the financialstatements in accordance with applicable law and regulations.
The Companies (Guernsey) Law, 2008 requires the Directors toprepare financial statements for each financial year. Under that lawthey have elected to prepare the financial statements in accordancewith International Financial Reporting Standards as adopted by EUand applicable law.
The financial statements are required by law to give a true and fairview of the state of affairs of the Company and of the profit or loss ofthe Company for that period.
In preparing these financial statements, the Directors are required to:
� Select suitable accounting policies and apply them consistently;
� Make judgments and estimates that are reasonable and prudent;
� State whether applicable accounting standards have beenfollowed, subject to any material departures disclosed andexplained in the financial statements; and
� Prepare the financial statements on the going concern basisunless it is inappropriate to presume that the Company willcontinue in business.
The Directors are responsible for keeping proper accounting recordswhich disclose with reasonable accuracy at any time the financialposition of the Company and to enable them to ensure that thefinancial statements comply with the Company (Guernsey) Law,2008. They have a general responsibility for taking such steps as arereasonably open to them to safeguard the assets of the Companyand to prevent and detect fraud and other irregularities.
Under applicable law and regulations, the Directors are alsoresponsible for preparing a Directors’ Report (including a BusinessReview) and Corporate Governance Statement that comply with thatlaw and those regulations.
Directors’ Responsibility Statement
We confirm that to the best of our knowledge:
� the financial statements, prepared in accordance with theapplicable set of accounting standards, give a true and fair viewof the assets, liabilities, financial position and profit or loss ofthe Company and Group included in the consolidation as awhole; and
� the Chairman’s Statement and Report of the Directors include afair review of the development and performance of the businessand the position of the Company and Group included in theconsolidation taken as a whole together with a description of theprincipal risks and uncertainties that it faces.
Disclosure of Information to
the Auditors
The Directors who held office at the date of approval of thisDirectors’ report confirm that, so far as they are each aware, there isno relevant audit information of which the Company’s auditors areunaware; and each Director has taken all the steps that he ought tohave taken as a Director to make himself aware of any relevant auditinformation and to establish that the Company’s auditors are awareof that information.
Auditors
KPMG Channel Islands Limited have expressed their willingnessto continue in office as auditors and a resolution proposing their re-appointment will be submitted at the Annual General Meeting.
By order of the BoardAuthorised signatoryDexion Capital (Guernsey) LtdCompany Secretary23 May 2011
Registered Office:1 Le TruchotGuernseySt Peter PortChannel Islands GY1 1WD
Statement of Directors’ Responsibilities

H I C L A N N U A L R E P O R T & A C C O U N T S 2 0 1 1 3 9
Introduction
The Board recognises the importance of a strong corporategovernance culture that meets the listing requirements. The Boardhas put in place a framework for corporate governance which itbelieves is appropriate for an investment company. All Directorscontribute to the Board discussions and debates. The Board believesin providing as much transparency for investors as is reasonablypossible. It should be noted that as an Investment Company, most ofthe Company’s day to day responsibilities are delegated to thirdparties, the Company has no employees and the Directors are non-executive.
AIC
The Company is a member of the Association of InvestmentCompanies (the “AIC”) and has carefully considered the principlesand recommendations of the AIC Code of Corporate Governance (the“AIC Code”) and has decided to follow the AIC’s CorporateGovernance Guide for Investment Companies (the “AIC Guide”). TheAIC Code and AIC Guide were updated in October 2010 to take intoaccount the newly issued UK Corporate Governance Code.
On 30 September 2010, the Financial Reporting Council provided theAIC with an updated endorsement letter to cover the fifth edition ofthe AIC Code. The endorsement confirms that the AIC Code fullymeets, for investment company boards, their obligations in relationto the UK Corporate Governance Code and paragraph LR9.8.6 of theListing Rules.
Guernsey Regulatory Environment
During 2009 there were a number of changes to the regulatory regimefor Guernsey funds. A number of provisions which were contained inthe Control of Borrowing (Bailiwick of Guernsey) Ordinance, 1959 to2003 (“COBO”) (which governed closed-ended funds) wereconsolidated into the Protection of Investors (Bailiwick of Guernsey)Law, 1987, as amended (the “POI Law”) (which governed open-endedfunds and licensees) so that the POI Law now governs both open-ended and closed-ended funds (as well as licensees).
Closed-ended funds are now Category 1 controlled investmentsunder the POI Law. The changes have also codified in the POI Lawa number of standard conditions and ongoing notificationrequirements imposed on the licensees of funds which were listedon the fund’s COBO consent, but were not explicitly set out in COBO.It is intended that the changes will simplify Guernsey’s investmentfund regime by categorising all funds (whether open-ended orclosed-ended) as either registered schemes or authorised schemes.
The Directors have determined that the Company will continue as anAuthorised Closed-Ended Investment Scheme.
The Board
Disclosure under Principle 5 of the AIC CodeThe Board currently consists of four non-executive Directors. Inaccordance with Principle 2 of the AIC Code all of the non-executivesare independent of the Investment Adviser.
The Chairman, Mr Picken, met the independence criteria of the AICCode Principle 1 upon appointment and has continued to meetthis condition throughout his term of service. Although not arequirement of the AIC Code, in accordance with guidance inPrinciple 1, the Board has a Senior Independent Director. Mr Hallamwas appointed as Senior Independent Director on 11 February 2010.Being non-executive Directors, no Director has a service contractwith the Company.
The Articles of Incorporation currently provide that at least one thirdof the Directors retire by rotation at each annual general meeting. Iftheir number is not three or a multiple of three, the number nearestto but not exceeding one third, shall retire from office. In accordancewith Principle 3 of the AIC Code, all four Directors intend to retire andoffer themselves up for re-election at the forthcoming AGM in Julyand in order to facilitate this, a small amendment to the Articleswill also be tabled.
The Board believes that long serving Directors should not beautomatically prevented from forming part of an independentmajority of the Board upon reaching nine years’ service. Inaccordance with Principle 4 of the Code, if a Director has served morethan nine years, the Board will consider the issue of independencecarefully on an annual basis as part of the Board self-evaluation andwill disclose its conclusions in the Directors’ Reports.
As the Company was formed in 2006 no Director has yet served fornine years or more. A Director who retires at an annual generalmeeting may, if willing to act, be reappointed. The Directors are notsubject to automatic re-appointment.
The Board believes that the balance of skills, experience,knowledge of the Group’s investments and mixed length of serviceon the Board provides for a solid base in which the interest ofinvestors will be served to a high standard. The Board recommendsthe re-election of each Director and supporting biographies,including length of service, are disclosed on page 34 of this annualreport, together with a list of other public company directorships foreach Director.
The Board meets at least four times a year and between these formalmeetings there is regular contact with the Investment Adviser, theSecretary and the Company’s Joint Brokers. The Directors are keptfully informed of investment and financial controls, and othermatters that are relevant to the business of the Company that shouldbe brought to the attention of the Directors. The Directors also haveaccess, where necessary in the furtherance of their duties, toindependent professional advice at the expense of the Company.
Corporate Governance

4 0 H I C L A N N U A L R E P O R T & A C C O U N T S 2 0 1 1
During the year a further 11 ad-hoc Board/Committee meetingswere held to deal with matters substantially of an administrativenature and these were attended by those directors available at thetime. These included meetings to discuss the proposed change ofownership of the Investment Adviser.
As previously mentioned, the Board has a breadth of experiencerelevant to the Company, and the Directors believe that any changesto the Board’s composition can be managed without unduedisruption. With any new Director appointment to the Board aninduction process is tailored to ensure that it would be appropriatefor the appointee. Upon any such appointment the new Directorwould be available to meet Shareholders upon request.
The Board considers agenda items laid out in the notice and agendaof meeting which are formally circulated to the Board in advance ofthe meeting as part of the Board papers. Directors may request anyagenda items to be added that they consider appropriate forBoard discussion. Additionally, each Director is required to informthe Board of any potential or actual conflicts of interest prior toBoard discussion.
The Board constantly considers the Company’s strategy with regardto market conditions and feedback from shareholders. Theinvestment strategy, which is set out in the Company’s latestprospectus, is reviewed regularly with the Investment Adviser.
The primary focus at Board meetings is a review of investmentperformance and associated matters such as marketing/investorrelations, risk management, gearing, general administration andcompliance, peer group information and industry issues.
Performance Evaluation
The Board evaluates its performance and considers the tenure andindependence of each Director on an annual basis, and believes thatthe mix of skills, experience and length of service are appropriate tothe requirements of the Company. The annual evaluation for the yearended 31 March 2011 has been completed and took the form ofquestionnaires followed by discussions to identify how theeffectiveness of its activities, including its Committees, policies orprocesses might be improved. The results of the evaluation processwere presented to and discussed by the Board and it was agreed thatthe current composition of the Board and its Committees reflected asuitable mix of skills and experience, and that the Board, as a whole,and its Committees were functioning effectively.
For the evaluation of the Chairman, the Senior Independent Directordiscussed the results of the questionnaire with the Chairman prior tofurther distribution to the remaining Directors.
For the year to 31 March 2012, the Directors are currently proposingengaging an independent third party to carry out this evaluation inaccordance with Principle 7 of the AIC Code.
Delegation of Responsibilities
The Board has delegated the following areas of responsibility.
The day-to-day administration of the Company has been delegatedto Dexion Capital (Guernsey) Ltd in its capacity as CompanySecretary and Administrator.
The Investment Adviser has two roles, Adviser to the Company andOperator of the Group’s limited partnership which owns the Group’sunderlying investments.
The role as Adviser includes preparing the semi annual valuations,the statutory accounts, the management accounts, business plans,presenting results and information to shareholders, coordinating allservice providers to the Group and giving the Board general adviceand feedback.
The role of Operator includes running the partnership and takingdirect responsibility for the decisions relating to the day to dayrunning of the Group’s investment portfolio, the Group’s debtfacilities, swap arrangements, and the sourcing of new investments.Members of the Investment Adviser’s asset management team areappointed as directors of the Group’s project companies and as partof their role in actively managing the portfolio, they attend boardmeetings and make appropriate decisions. Material decisions arereferred back to the Investment Adviser’s investment committee forconsideration and determination.
Corporate Governance (continued)
The attendance record of Directors for the year to 31 March 2011 is set out below:
Quarterly Managementboard Audit Engagement Remuneration Nomination
meetings Committee Committee Committee Committee
4 4 2 2 1
Meetings Attended:G Picken 4 n/a 2 2 1J Hallam 4 4 2 2 1H Grisius 1 1 n/a n/a n/aS Evans 4 4 2 2 1C Russell 2 2 1 1 1

H I C L A N N U A L R E P O R T & A C C O U N T S 2 0 1 1 4 1
Audit CommitteeThe Audit Committee has been in operation throughout the year. TheAudit Committee, chaired by Mr J Hallam, operates within clearlydefined terms of reference and comprises all the Directors except forMr G Picken. It met four times in the year to 31 March 2011.
The duties of the Audit Committee in discharging its responsibilitiesinclude reviewing the Annual and Interim Accounts, the system ofinternal controls, and the terms of appointment of the auditorstogether with their remuneration. It is also the formal forum throughwhich the auditors report to the Board of Directors and meets atleast twice yearly. The objectivity of the auditors is reviewed by theAudit Committee which also reviews the terms under which theexternal auditors are appointed to perform non-audit services andthe fees paid to them or their affiliated firms overseas.
The main duties of the Audit Committee are:
� considering and recommending to the Board for approval thecontents of the half yearly and annual financial statements andreviewing the external auditors’ report thereon;
� reviewing the scope, results, cost effectiveness, independenceand objectivity of the external auditors;
� reviewing and recommending to the Board for approval the auditand non-audit fees payable to the external auditors and the termsof their engagement;
� reviewing and approving the external auditors’ plan for thefollowing financial year;
� reviewing the appropriateness of the Company’s accountingpolicies; and
� ensuring the adequacy of the internal control systems andstandards.
The external auditors and the third party expert valuers are invited toattend the Audit Committee meetings at which the annual andinterim accounts are considered and at which they have theopportunity to meet with the Committee without representatives ofthe Investment Adviser being present.
The Committee reviews the scope and results of the audit, its costeffectiveness and the independence and objectivity of the auditors,with particular regard to non-audit fees. Total fees paid amounted to
£0.5m for the year ended 31 March 2011 of which £0.1m related tothe audit of the Group, £0.2m related to audit of the Group’s projectsubsidiaries and other audit related services, and £0.2m was inrespect of audit and tax advisory work for project companies in whichthe Group has an investment.
Notwithstanding such services the Audit Committee considers KPMGChannel Islands Limited to be independent of the Company and thatthe provision of such non-audit services is not a threat to theobjectivity and independence of the conduct of the audit.
Nomination CommitteeThe main terms of reference of the committee are:
� regularly review the structure, size and composition required ofthe Board and make recommendations to the Board with regardto any changes (including skills, knowledge and experience inaccordance with Principle 6 of the AIC Code);
� give full consideration to succession planning for directorstaking into account the challenges and opportunities facing theCompany; and
� be responsible for identifying and nominating for the approval of theBoard, candidates to fill Board vacancies as and when they arise.
The Nomination Committee has met once in the year to 31 March2011 and has recommended to the Board that the currentcomposition of the Board remains appropriate. The Committee hassuccession planning on its agenda and has commenced discussionsover the need, in due course, to recommend further appointmentswith succession planning in mind.
Remuneration CommitteeThe terms of reference of the Committee are to determine and agreethe Board policy for the remuneration of the directors of theCompany, including the approval of any ad-hoc payments in respectof additional corporate work required (e.g. for the work involved withthe C share issue).
Remuneration Policy The Remuneration Committee has received independent professionaladvice in respect of their roles, responsibilities and fees.
Committees of the Board
The committees of the Board are the Audit Committee, the Remuneration Committee, the Nomination Committee, and the ManagementEngagement Committee. Terms of reference for each committee have been approved by the Board.
The Chairman and members of each committee as at 31 March 2011 are as follows:
ManagementAudit Remuneration Nomination Engagement
Committee Committee Committee Committee
Chairman Mr J Hallam Mr C Russell Mr G Picken Mrs S Evans
Members Mrs S Evans Mr J Hallam Mrs S Evans Mr J HallamMr C Russell Mr G Picken Mr J Hallam Mr G Picken
Mrs S Evans Mr C Russell Mr C Russell
4 2 H I C L A N N U A L R E P O R T & A C C O U N T S 2 0 1 1
All Directors of the Company are non-executive and as such there are:
� No service contracts with the Company;
� No long-term incentive schemes; and
� No options or similar performance incentives.
The Directors’ remuneration shall:
� reflect the responsibility, experience, time commitment andposition on the Board;
� allow the Chairman and Chairman of the Audit Committee to beremunerated in excess of the remaining board members to reflecttheir increased roles of responsibility and accountability;
� be paid quarterly in arrears;
� include remuneration for additional, specific corporate workwhich shall be carefully considered and only become due andpayable on completion of that work; and
� will be reviewed by an independent professional consultant withexperience of Investment Companies and their fee structures, atleast every three years.
The Remuneration Committee met twice in the period to 31 March2011 and engaged independent fee consultants, Trust Associates, tocarry out a review of the workload and responsibilities of eachDirector and to benchmark these roles with other similarcomparatives and advise on what fee levels are appropriate.
This work concluded in April 2010 with a report from TrustAssociates, with fee recommendations for the years ending 31 March2011 and 31 March 2012. The Committee recommended the TrustAssociates proposals for the year to 31 March 2011 and this wasapproved by the Board, and adopted for the year to 31 March 2011.
The Committee has recommended that the fees are increased for thecoming year again in line with the Trust Associates recommendationand the Board has approved this increase in annual fees payable asset out in the Directors’ Report for the year to 31 March 2012. TheBoard has decided to seek shareholder approval on these fees at theAGM on 25 July 2011.
Management Engagement CommitteeThe terms of reference of this committee are to review therelationships between the Company and its main service providers,including their performance, compliance with their contracts, andlevels of fees paid. Recommendations from the Committee’s revieware given to the Board for consideration and action.
The Management Engagement Committee met twice in the period to31 March 2011, and reviewed the performance of the key serviceproviders to the Group and the Company. No material weaknesseswere identified, some recommendations were conveyed to certainproviders, and the recommendation to the Board was that thecurrent arrangements are appropriate and provide good qualityservices and advice to the Company and the Group.
At these meetings and in the subsequent Board meetings, the likelyimpacts arising from the change of ownership of the InvestmentAdviser were considered and advice sought. Reassurance wassought from the Investment Adviser that it had the appropriateprocedures, polices controls, and corporate governance in place, andwhere it had historically relied on services provided by the HSBCGroup, suitable alternatives would be provided.
As a result of these deliberations certain changes in favour of theCompany were agreed, the continuing appointment of the InvestmentAdviser was found to be in the best interests of the shareholders as awhole, and the Investment Adviser’s agreement was amended andsigned in March 2011.
All Terms of Reference for Committees are available from theCompany Secretary upon request.
Internal Controls
The Board is responsible for the Company’s system of internal controland for reviewing its effectiveness, and the Board has thereforeestablished an ongoing process designed to meet the particularneeds of the Company in managing the risks to which it is exposed.
The process is based on a risk-based approach to internal controlthrough a matrix which identifies the key functions carried out by theInvestment Adviser and other key service providers, the variousactivities undertaken within those functions, the risks associatedwith each activity and the controls employed to minimise those risks.A residual risk rating is then applied. The matrix is regularly updatedand the Board is provided with regular reports highlighting allmaterial changes to the risk ratings and the action which has been,or is being taken.
By their nature these procedures will provide a reasonable, but notabsolute, assurance against material misstatement or loss.
At each Board meeting the Board also monitors the Group’sinvestment performance in comparison to its stated objective and itreviews the Group’s activities since the last Board meeting to ensurethat the Investment Adviser and the Operator adhere to the agreedinvestment policy and approved investment guidelines.
Further, at each Board meeting, the Board receives reports from theCompany Secretary and Administrator in respect of compliancematters and duties performed by them on behalf of the Company.
The Board has reviewed the need for an internal audit function and ithas decided that the systems and procedures employed by theInvestment Adviser and the Secretary, including their own internalreview processes and the work carried out by the Group’s externalauditors, provide sufficient assurance that a sound system ofinternal control, which safeguards the Company’s assets, ismaintained. An internal audit function specific to the Group istherefore considered unnecessary.
Corporate Governance (continued)

H I C L A N N U A L R E P O R T & A C C O U N T S 2 0 1 1 4 3
The Board recognises that these control systems can only bedesigned to manage rather than eliminate the risk of failure toachieve business objectives, and to provide reasonable, but notabsolute, assurance against material misstatement or loss, andrelies on the operating controls established by both the CompanyAdministrator and the Investment Adviser.
The Investment Adviser prepares both management accounts andupdates business forecasts on a quarterly basis, which allow theBoard to assess the Company’s activities and review its performance.
The Board and the Investment Adviser have agreed clearly definedinvestment criteria, return targets, risk appetite, and exposure limits.Reports on these issues, including operating performance, cashprojections, and investment valuations, are submitted to the Boardat each quarterly meeting.
Relations with Shareholders –
AIC Code Principle 19
The Company welcomes the views of shareholders and places greatimportance on communication with its shareholders. The InvestmentAdviser produces a quarterly factsheet which is available on theCompany’s website. Senior members of the Investment Adviser makethemselves available at all reasonable times to meet with principalshareholders and key sector analysts.
Feedback from these meetings is provided to the Board on a regularbasis. The Board is also kept fully informed of all relevant marketcommentary on the Company by the Investment Adviser, theCompany’s Joint Brokers, and the Company’s Financial PR agency.
By way of assisting shareholders to understand our portfolio ofinvestments, we have held successful site visits to two of the Group’sinvestments. The presentations from these visits are available fromthe Company’s website www.hicl.com
In addition, members of the Board met some shareholders at anevening event held in London in September and a lunch in Edinburghin October, arranged by the Brokers. It is the Board’s intention tocontinue to meet with shareholders periodically to facilitate opentwo way communication on the development of the Company.
The Company reports formally to Shareholders twice a year and aproxy voting card for the AGM is sent to shareholders with the AnnualReport and accounts. Results of Extraordinary and Annual GeneralMeetings are announced by the Company on the day of the relevantmeeting. Additionally, the Interim Management Statements and thecurrent information provided to eligible Shareholders on an on-goingbasis through the Company’s website page and newsletter assist inkeeping Shareholders informed. The Secretary and Registrar monitorthe voting of the Shareholders and proxy voting is taken intoconsideration when votes are cast at the Annual General Meeting.
Shareholders may contact the Directors via the CompanySecretary, whose contact details are found on page 92 of thereport and accounts.

4 4 H I C L A N N U A L R E P O R T & A C C O U N T S 2 0 1 1
The business of the Company is to make investments ininfrastructure assets, to hold these investments and to manage theportfolio of investments to achieve an acceptable return forshareholders. In managing the Company and the Group, theDirectors have ensured that procedures and policies have been putin place by the Group and its service providers to manage the Groupeffectively and minimise risk.
As part of good practice and to mitigate risk, the Board has in placea set of Environmental, Social and Governance policies appropriatefor a company investing in infrastructure assets, which conform tocurrent good practice in relation to corporate responsibility.
The Company’s Environmental, Social and Governance (“ESG”)policies cover:
� how the Company interacts with stakeholders, includingshareholders;
� what ESG considerations need to be made before a newinvestment is acquired; and
� how the current portfolio is managed by the Investment Adviserto promote and achieve good ESG practices.
Annual Review
The Board has reviewed its performance and the performance of itsservice providers in the last 12 months and can confirm compliancewith its stated ESG policies, details of which are given below. TheDirectors have considered whether these ESG policies need updatingwhen compared to good industry practice as applicable to aninfrastructure Investment Company and believe them to be currentand appropriate.
Governance
The Board remains committed to the highest standards of corporategovernance and keeps the Company’s practices under review withrespect to current best practice. Further details of how the Companycomplies are set out in the Corporate Governance report.
The Board wishes to be at the forefront of disclosure and reportingof the Company’s performance and strategic intentions. TheBoard believe this is achieved by the detailed information providedas follows:
� Annual reports
� Interim statement and accounts
� Detailed presentations to accompany the results
� Two Interim Management Statements a year
� Announcements of all material acquisitions
� Lunches and meetings with shareholders, the Directors and theInvestment Adviser
The Company’s new website (www.hicl.com) has further backgrounddetail on each investment, copies of all publications, together withall prospectuses since launch.
Disclosure of key sensitivities and risks has been developed by theBoard working with the Investment Adviser and through dialoguewith shareholders, the level and type of disclosure is developed andrefined in order to assist in a full and fair analysis of the Companyand its investments.
Managing the Portfolio
Day-to-day management of the Group’s portfolio is undertaken bythe Investment Adviser in its capacity as Operator of the Partnership.
EnvironmentalAll of the Group’s investments are in project companies who provideservices to their clients and who subcontract the provision of theseservices to specialist facilities management companies.
On a routine basis, the Investment Adviser undertakes a review toensure that each key contractor (or their group) has appropriateenvironmental policies in place and that these are being adheredto in delivery of the services to the project and that further, therehave been no material breaches of their policies. During the yearthese reviews have found no issues of concern.
The Investment Adviser’s asset managers continue to take a pro-active approach to work with both clients and key stakeholders tointroduce new environmental initiatives in each project companywhere appropriate.
Social and EthicalThe approach to social and ethical practices is similar to that forenvironmental in that each key contractor’s policies will bereviewed and their ongoing compliance to their stated policiesreviewed on a regular basis. In addition, the Investment Adviser’steam will ensure that the project companies in which the Group hasinvestments are run appropriately in relation to the Group’s socialand ethical policies.
Health and Safety performance of each investment is monitored andduring the year a number of Health and Safety audits were carriedout by a Health and Safety consultant to ensure procedures andpolicies were in place and being adhered to. Information on Healthand Safety is reported to the Board on a quarterly basis.
GovernanceApart from the single investment in a debt instrument of a watercompany (repaid in April 2011), for all the other investments in theportfolio, the Group is entitled to appoint at least one directorand members of the Investment Adviser’s team have beenappointed. Board meetings are not quorate without the Group’snominated director being present and this is part of the InvestmentAdviser’s active management of the underlying investments. Alldirectors’ fees paid by the projects are for the benefit of the Group,and not the Investment Adviser.
All the project companies have detailed governance structuresincluding those matters which are reserved to shareholders todetermine, those items which directors determine and the routineday-to-day matters that are delegated to the project’s generalmanager and his or her team.
Corporate Social Responsibility

H I C L A N N U A L R E P O R T & A C C O U N T S 2 0 1 1 4 5
Making New Investments
The Investment Adviser has a detailed set of procedures and approvalprocesses in relation to the making of new investments. These includeappropriate ESG checks as part of the due diligence processes.
EnvironmentalAs part of the detailed due diligence carried out by the InvestmentAdviser and the advisers, the history of the investment in relation tothe Company’s environmental policies will be assessed. Keycontractors and service providers are analysed to check they haveappropriate policies in place and that there have been no breaches.
Where it is not possible to get comfortable with either a keycontractor’s environmental record or the project’s environmentalperformance to date, the investment will not be made. There were nocircumstances in the year where this was the case.
Social and EthicalThe approach to social and ethical practices is similar to that forenvironmental in that each key contractor’s policies will be reviewedas part of the due diligence process. The trading history of theinvestment will also be reviewed to ensure compliance with theGroup’s social and ethical policies.
All acquisitions made during the year were subject to these reviewsand checks and no material matters were identified.
GovernanceIn seeking new investments, the Investment Adviser normally seeksa minimum board representation on the underlying investmentcompany, with appropriate voting rights and reserved matters toensure it will be possible to manage the investment and achieve theprojected returns. It is unlikely that a new investment will be madewhere this level of control and influence is not achievable.

4 6 H I C L A N N U A L R E P O R T & A C C O U N T S 2 0 1 1
We have audited the Group and Company financial statements (the“financial statements”) of HICL Infrastructure Company Limited forthe year ended 31 March 2011 which comprise the Consolidated andCompany Income Statements, the Consolidated and CompanyBalance Sheets, the Consolidated and Company Statement ofChanges in Shareholders’ Equity, the Consolidated and CompanyCash Flow Statements and the related notes. The financial reportingframework that has been applied in their preparation is applicablelaw and International Financial Reporting Standards as adopted bythe EU.
This report is made solely to the Company’s members, as a body, inaccordance with section 262 of the Companies (Guernsey) Law,2008. Our audit work has been undertaken so that we might state tothe Company’s members those matters we are required to state tothem in an auditor’s report and for no other purpose. To the fullestextent permitted by law, we do not accept or assume responsibilityto anyone other than the Company and the Company’s members asa body, for our audit work, for this report, or for the opinions wehave formed.
Respective Responsibilities of Directors
and Auditor
As explained more fully in the Statement of Directors’Responsibilities set out on page 38, the directors are responsible forthe preparation of the financial statements and for being satisfiedthat they give a true and fair view. Our responsibility is to audit andexpress an opinion on the financial statements in accordance withapplicable law and International Standards on Auditing (UK andIreland). Those standards require us to comply with the AuditingPractices Board’s (APB’s) Ethical Standards for Auditors.
Scope of the Audit of the
Financial Statements
An audit involves obtaining evidence about the amounts anddisclosures in the financial statements sufficient to give reasonableassurance that the financial statements are free from materialmisstatement, whether caused by fraud or error. This includes anassessment of: whether the accounting policies are appropriate tothe Group’s and Company’s circumstances and have beenconsistently applied and adequately disclosed; the reasonablenessof significant accounting estimates made by the Board of Directors;and the overall presentation of the financial statements. In addition,we read all the financial and non-financial information in the AnnualReport to identify material inconsistencies with the audited financialstatements. If we become aware of any apparent materialmisstatements or inconsistencies we consider the implications forour report.
Opinion on Financial Statements
In our opinion the financial statements:
� give a true and fair view of the state of the Group’s andCompany’s affairs as at 31 March 2011 and of the Group’s andCompany’s profit for the year then ended;
� are in accordance with International Financial ReportingStandards as adopted by the EU; and
� comply with the Companies (Guernsey) Law, 2008.
Matters on Which we are Required to
Report by Exception
We have nothing to report in respect of the following matters wherethe Companies (Guernsey) Law 2008 requires us to report to youif, in our opinion:
� the Company has not kept proper accounting records, or
� the financial statements are not in agreement with theaccounting records; or
� we have not received all the information and explanations, whichto the best of our knowledge and belief are necessary for thepurpose of our audit.
We have nothing to report with respect to the following:
Under the Listing Rules we are required to review the part of theCorporate Governance Statement relating to the Company’scompliance with the nine provisions of the June 2008 CombinedCode specified for our review.
Steven D. StormonthFor and on behalf of KPMG Channel Islands LimitedChartered Accountants and Recognised Auditors20 New StreetSt Peter PortGuernseyGY1 4AN
23 May 2011
Independent Auditor’s Report to the Members of
HICL Infrastructure Company Limited

H I C L A N N U A L R E P O R T & A C C O U N T S 2 0 1 1 4 7
Consolidated Income Statement
for the year ended 31 March 2011
Year ended Year ended31 March 2011 31 March 2010
Revenue Capital Total Revenue Capital TotalNote £million £million £million £million £million £million
Services revenue 5 121.2 – 121.2 102.6 – 102.6Gains/(loss) on finance receivables 17 40.6 6.6 47.2 35.5 (19.3) 16.2Gains/(loss) on investments 6 26.1 9.7 35.8 21.6 (2.3) 19.3
Total income/(loss) 187.9 16.3 204.2 159.7 (21.6) 138.1
Services costs 7 (105.8) – (105.8) (89.1) – (89.1)Administrative expenses 8 (11.8) – (11.8) (10.0) – (10.0)
Profit/(loss) before net finance costs and tax 70.3 16.3 86.6 60.6 (21.6) 39.0
Finance costs 9 (51.1) – (51.1) (35.6) – (35.6)Finance income 9 0.4 2.4 2.8 0.3 4.0 4.3
Profit/(loss) before tax 19.6 18.7 38.3 25.3 (17.6) 7.7
Income tax credit/(expense) 10a 10.3 (2.0) 8.3 (1.1) 4.3 3.2
Profit/(loss) for the year 29.9 16.7 46.6 24.2 (13.3) 10.9
Attributable to:Equity holders of the parent 25.3 19.9 45.2 24.6 (18.6) 6.0Non-controlling interests 4.6 (3.2) 1.4 (0.4) 5.3 4.9
29.9 16.7 46.6 24.2 (13.3) 10.9
Earnings per share – basic and diluted (pence) 11 9.0 1.6
Supplementary information has been provided analysing the income statement between those items of a revenue nature and those of a capitalnature, in order to better reflect the Consolidated Group’s activities as an investment company. See Note 2 (a) to the consolidated financialstatements for the definition of revenue and capital items.
All results are derived from continuing operations. There is no other comprehensive income or expense apart from those disclosed above andconsequently a consolidated statement of comprehensive income has not been prepared.

4 8 H I C L A N N U A L R E P O R T & A C C O U N T S 2 0 1 1
Consolidated Balance Sheet
as at 31 March 2011
31 March 2011 31 March 2010
Note £million £million
Non-current assetsInvestments at fair value through profit or loss 15 396.3 307.4Finance receivables at fair value through profit or loss 17 761.6 772.0Intangible assets 14 162.0 170.6Deferred tax assets 10c 34.3 36.7
Total non-current assets 1,354.2 1,286.7
Current assetsInvestments at fair value through profit or loss 15 29.7 –Trade and other receivables 18 15.7 12.1Finance receivables at fair value through profit or loss 17 17.5 16.6Cash and cash equivalents 19 114.9 67.1
Total current assets 177.8 95.8
Total assets 1,532.0 1,382.5
Current liabilitiesTrade and other payables 20 (28.9) (20.9)Current tax payable (0.8) (0.8)Loans and borrowings 21 (31.4) (29.6)
Total current liabilities (61.1) (51.3)
Non-current liabilitiesLoans and borrowings 21 (616.3) (630.5)Other financial liabilities (fair value of derivatives) 22 (82.8) (84.9)Deferred tax liabilities 10c (104.9) (116.4)
Total non-current liabilities (804.0) (831.8)
Total liabilities (865.1) (883.1)
Net assets 666.9 499.4
EquityOrdinary share capital 23 – –Share premium 23 390.7 234.0Retained reserves 266.3 252.6
Total equity attributable to equity holders of the parent 657.0 486.6Non-controlling interests 9.9 12.8
Total equity 666.9 499.4
Net assets per share (pence) 13 110.4 107.1
The accompanying notes are an integral part of these financial statements.
The financial statements were approved and authorised for issue by the Board of Directors on 23 May 2011, and signed on its behalf by:
J Hallam G PickenDirector Director

H I C L A N N U A L R E P O R T & A C C O U N T S 2 0 1 1 4 9
Consolidated Statement of Changes in Shareholders’ Equity
for the year ended 31 March 2011
Year ended 31 March 2011
Attributable to equity Non-controlling Totalholders of the parent interests equity
Share capital Totaland share Retained shareholders’
premium reserves equity£million £million £million £million £million
Shareholders’ equity at beginning of year 234.0 252.6 486.6 12.8 499.4
Profit for the year – 45.2 45.2 1.4 46.6
Distributions paid to Company shareholders – (31.5) (31.5) – (31.5)Distributions paid to non-controlling interests – – – (4.3) (4.3)Ordinary shares issued 159.0 – 159.0 – 159.0Costs of share issue (2.3) – (2.3) – (2.3)
Shareholders’ equity at end of year 390.7 266.3 657.0 9.9 666.9
Year ended 31 March 2010
Attributable to equity Non-controlling Totalholders of the parent interests equity
Share capital Totaland share Retained shareholders’
premium reserves equity£million £million £million £million £million
Shareholders’ equity at beginning of year 106.5 269.6 376.1 4.1 380.2
Profit for the year – 6.0 6.0 4.9 10.9
Acquisition of non-controlling interests with a change in control – – – 5.2 5.2Distributions paid to Company shareholders – (23.0) (23.0) – (23.0)Distributions paid to non-controlling interests – – – (1.4) (1.4)Ordinary shares issued 129.3 – 129.3 – 129.3Costs of share issue (1.8) – (1.8) – (1.8)
Shareholders’ equity at end of year 234.0 252.6 486.6 12.8 499.4

5 0 H I C L A N N U A L R E P O R T & A C C O U N T S 2 0 1 1
Consolidated Cash Flow Statement
for the year ended 31 March 2011
Year ended Year ended31 March 2011 31 March 2010
£million £million
Cash flows from operating activitiesProfit before tax 38.3 7.7Adjustments for:Gains on investments (34.0) (20.5)Gains on finance receivables (44.5) (4.4)Interest payable and similar charges 45.6 31.9Changes in fair value of derivatives (2.4) (4.0)Operator acquisition investment fees 1.5 0.7Interest income (0.4) (0.3)Amortisation of intangible assets 8.6 8.2
Operating cash flow before changes in working capital 12.7 19.3
Changes in working capital:Increase in receivables (14.4) (16.1)Increase in payables 5.4 3.6
Cash flow from operations 3.7 6.8
Interest received on bank deposits and finance receivables 0.4 1.7Cash received from finance receivables 58.8 41.4Interest paid (33.3) (38.4)Corporation tax paid (0.9) (0.7)Interest received on investments 25.2 21.1Dividends received 10.1 6.6Fees and other operating income 1.5 1.3Acquisition of subsidiaries net of cash acquired (Note 16) – 7.0Loanstock and equity repayments received 0.1 1.1
Net cash from operating activities 65.6 47.9
Cash flows from investing activitiesPurchases of investments (115.1) (52.5)
Net cash used in investing activities (115.1) (52.5)
Cash flows from financing activitiesProceeds from issue of share capital 154.6 126.3Proceeds from issue of loans and borrowings 77.1 66.6Repayment of loans and borrowings (104.5) (153.0)Distributions paid to Company shareholders (29.4) (21.9)Distributions paid to non-controlling interests (4.4) (1.4)
Net cash from financing activities 93.4 16.6
Net increase in cash and cash equivalents 43.9 12.0
Cash and cash equivalents at beginning of year 67.1 54.2Exchange gains on cash 3.9 0.9
Cash and cash equivalents at end of year 114.9 67.1

H I C L A N N U A L R E P O R T & A C C O U N T S 2 0 1 1 5 1
1. Reporting Entity
HICL Infrastructure Company Limited (the “Company”) is a company domiciled in Guernsey, Channel Islands, whose shares are publiclytraded on the London Stock Exchange. The consolidated financial statements of the Company as at and for the year ended 31 March 2011comprise the Company and its subsidiaries (together referred to as the “Consolidated Group”). The Consolidated Group invests ininfrastructure projects in the UK, Canada and Europe. The parent company financial statements present information about the Companyas a separate entity and not about its Consolidated Group.
Of the Consolidated Group’s portfolio of 38 investments at 31 March 2011, 27 have been accounted for as investments (the “EntityInvestments”) in accordance with the accounting policies set out in parts (b) and (d) of note 2. The eleven remaining investments aredeemed to be subsidiaries of the Company (the “Operating Subsidiaries”), and are therefore treated as business combinations asdescribed in parts (b) and (c) of note 2. Certain items of the accounting policies apply only to the Operating Subsidiaries. Where applicable,this is noted in the relevant accounting policy note.
2. Key Accounting Policies
(a) Basis of preparationThe consolidated financial statements and the company financial statements were approved and authorised for issue by the Board ofDirectors on 23 May 2011.
The consolidated financial statements which give a true and fair view have been prepared in compliance with the Companies (Guernsey)Law 2008 and in accordance with International Financial Reporting Standards (“IFRS”) as adopted by the European Union (“EU”) using thehistorical cost basis, except that the following assets and liabilities are stated at their fair values: derivative financial instruments andfinancial instruments classified at fair value through profit or loss. The accounting policies have been applied consistently. Theconsolidated financial statements are presented in sterling, which is the Consolidated Group’s functional currency.
The preparation of financial statements in conformity with IFRS as adopted by the EU, requires the Directors and advisers to makejudgements, estimates and assumptions that affect the application of policies and the reported amounts of assets and liabilities, incomeand expense. The estimates and associated assumptions are based on historical experience and various other factors that are believed tobe reasonable under the circumstances, the results of which form the basis of making the judgements about carrying values of assets andliabilities that are not readily apparent from other sources. Actual results may differ from these estimates.
The Group’s business activities, together with the factors likely to affect its future development, performance and position are set out inthe Investment Adviser's Report on pages 11 to 17. The financial position of the Group, its cash flows, liquidity position and borrowingfacilities are described in the Financial Results on pages 18 to 21. In addition, notes 1 to 4 and 21 to 22 of the financial statementsinclude the Group’s objectives, policies and processes for managing its capital; its financial risk management objectives; details of itsfinancial instruments and hedging activities; and its exposures to credit risk and liquidity risk.
The Group has considerable financial resources together with long-term contracts with various public sector customers and suppliersacross a range of infrastructure projects. As a consequence, the directors believe that the Group is well placed to manage its business riskssuccessfully despite the current uncertain economic outlook.
The Directors have a reasonable expectation that the Group has adequate resources to continue in operational existence for theforeseeable future. Thus they continue to adopt the going concern basis of accounting in preparing the annual financial statements.
The estimates and underlying assumptions are reviewed on an ongoing basis. Revisions to accounting estimates are recognised in theperiod in which the estimate is revised if the revision affects only that year or in the period of the revision and future periods if the revisionaffects both current and future periods. Note 3 shows critical accounting judgements, estimates and assumptions.
Supplementary information has been provided analysing the income statement between those items of a revenue nature and those of acapital nature, in order to better reflect the Consolidated Group’s activities as an investment company. Those items of income andexpenditure which relate to the interest and dividend yield of investments and annual operating and interest expenditure are shown as“revenue”. Those items of income and expenditure which arise from changes in the fair value of investments, foreign exchange movements,finance receivables and derivative financial instruments are recognised as capital.
Standards adopted early by the Consolidated GroupDuring the year and the prior year no new standards were adopted early by the Consolidated Group.
Notes to the Consolidated Financial Statements
for the year ended 31 March 2011

5 2 H I C L A N N U A L R E P O R T & A C C O U N T S 2 0 1 1
2. Key Accounting Policies (continued)
New standards effective for the current yearThe following standards which have been applied in this year’s financial statements are:
� IFRIC 16 Hedges of a Net Investment in a Foreign Operation – this interpretation provides guidance on accounting for hedges of netinvestments in foreign operations in an entity’s consolidated financial statements.
� IFRS 3 Business Combinations – the revised standard continues to apply the acquisition method to business combinations, however,all payments to purchase a business are to be recorded at fair value at the acquisition date, some contingent payments aresubsequently re-measured at fair value through income, goodwill may be calculated based on the parent’s share of net assets or itmay include goodwill related to the non-controlling interest, and all transaction costs are expensed.
� IAS 27 Consolidated and Separate Financial Statements – the effects of all transactions with non-controlling interests to be recordedin equity if there is no change in control; any remaining interest in an investee is re-measured to fair value in determining the gain orloss recognised in profit or loss where control over the investee is lost.
� IFRIC 17 Distributions of Non-cash Assets to Owners – provides accounting guidance for non-reciprocal distributions of non-cashassets to owners (and those in which owners may elect to receive a cash alternative).
� Amendments to IAS 39 Financial Instruments: Recognition and Measurement – Eligible Hedged Items. Clarifies how the principlesunderlying hedge accounting should be applied in particular situations.
� Amendments to IAS 32 Financial Instruments: Presentation – Classification of Rights Issues. Requires rights issues denominated in acurrency other than the functional currency of the issuer to be classified as equity regardless of the currency in which the exercise priceis denominated.
� IFRIC 18 Transfer of Assets from Customers – which is applicable for annual periods commencing on or after 1 November 2009. Clarifiesthe requirements for IFRSs for agreements in which an entity receives from a customer an item of property, plant and equipment thatthe entity must then use either to connect the customer to a network or to provide the customer with ongoing access to a supply ofgoods or services.
� IFRS 2 Share Based Payment: Group Cash-settled Share-based Payment Transactions – amended to require an entity receiving goodsor services (receiving entity) in either an equity-settled or a cash-settled share-based payment transaction to account for thetransaction in its separate or individual financial statements. This principle applies if another group entity or shareholder settles thetransaction (settling entity) and the receiving entity has no obligation to settle the payment.
� Improvements to IFRSs 2009 – the IASB published amendments to various standards collectively referred to as Improvements to IFRSson 16 April 2009. The Improvements to IFRSs 2009 comprise 15 amendments to 12 standards and is the result of the IASB’s secondannual improvements project (AIP).
The adoption of these standards has led to the following change in the Consolidated Group’s accounting policies:
Accounting for business combinationsFrom 1 April 2010 the Consolidated Group has applied IFRS 3 Business Combinations (2008) in accounting for business combinations. Thechange in accounting policy has been applied prospectively and has had no material impact on earnings per share.
Business combinations are accounted for using the acquisition method as at the acquisition date, which is the date on which control istransferred to the Consolidated Group. Control is the power to govern the financial and operating policies of an entity so as to obtainbenefits from its activities. In assessing control, the Consolidated Group takes into consideration potential voting rights that currentlyare exercisable.
Acquisitions on or after 1 April 2010For acquisitions on or after 1 April 2010, the Consolidated Group measures goodwill at the acquisition date as:
� the fair value of the consideration transferred; plus
� the recognised amount of any non-controlling interests in the acquire; plus if the business combination is achieved in stages, the fairvalue of the existing equity interest in the acquiree; less
� the net recognised amount (generally fair value) of the identifiable assets acquired and liabilities assumed.
Notes to the Consolidated Financial Statements (continued)
for the year ended 31 March 2011

H I C L A N N U A L R E P O R T & A C C O U N T S 2 0 1 1 5 3
2. Key Accounting Policies (continued)
The consideration transferred does not include amounts related to the settlement of pre-existing relationships. Such amounts aregenerally recognised in the profit and loss.
Costs related to the acquisition, other than those associated with the issue of debt or equity securities, that the Consolidated Group incursin conjunction with a business combination are expensed as incurred.
Acquisitions prior to 1 April 2010All business combinations were accounted for using the purchase method. Goodwill represents the difference between the cost ofacquisition over the Consolidated Group’s share of the fair value of assets acquired and liabilities and contingent liabilities assumed(including intangible assets) of a subsidiary at the date of acquisition. Identifiable intangible are those which can be measured reliably,sold separately or which arise from legal rights regardless of whether those rights are separable.
Costs comprise the fair values of assets given and liabilities assumed, plus any direct costs of acquisition.
Standards not yet appliedAs at 31 March 2011 the following standards applicable to the Consolidated Group, which have not been applied in this financialinformation, were in issue and endorsed by the EU but not yet effective:
� Amendments to IFRS 2 Group Cash-settled Share-based Payment Transactions – clarifies accounting for group cash-settled share-based payment transactions.
� Revised IAS 24 Related Party Disclosures – the revised standard has simplified the definition of a related party and removed inconsistencies.
� IFRIC 19 Extinguishing Financial Liabilities with Equity Instruments – addresses the accounting by an entity when the terms of afinancial liability are renegotiated and result in the entity issuing equity instruments to a creditor to extinguish all or part of thefinancial liability.
� Improvements to IFRSs 2010 – the IASB published amendments to various standards with various effective dates on 6 May 2010. Theamendments are effective for annual periods beginning on or after 1 July 2010 or 1 January 2011. The 2010 improvements containseleven amendments to six standards and to one interpretation and is the result of the IASB’s third annual improvements project (AIP).
The Directors anticipate that the adoption of the above standards in future years will not have a material impact on the financial statementsof the Consolidated Group.
(b) Basis of consolidationThe consolidated financial statements of the Consolidated Group include the financial statements of the Company and its subsidiaries upto 31 March 2011. Subsidiaries are those entities controlled by the Company. Control exists when the Company has the power, directly orindirectly, to govern the financial and operating policies of an entity so as to obtain benefits from its activities as defined in IAS 27‘Consolidated and Separate Financial Statements’. The financial statements of subsidiaries are included in the consolidated financialstatements on a line by line basis from the date that control commences until the date control ceases. Nine of the eleven subsidiaries havea different statutory financial reporting date to the Company, being 31 December. Their results for the year to 31 March are included byreference to management accounts.
Associates are those entities over which the Company has significant influence as defined in IAS 28 ‘Investments in Associates’. By virtueof the Company’s status as an investment fund and the exemption provided by IAS 28.1, investments in such entities are designated uponinitial recognition to be accounted for at fair value through profit or loss.
Joint ventures are those entities over which the Company has joint control as defined by IAS 31 ‘Interests in Joint Ventures’. By virtue ofthe Company’s status as an investment fund and the exemption provided by IAS 31.1, investments in such entities are designated uponinitial recognition to be accounted for at fair value through profit or loss.
Intra-Group receivables, liabilities, revenue and expenses are eliminated in their entirety when preparing the consolidated financialstatements. Gains that arise from intra-group transactions and that are unrealised from the standpoint of the Consolidated Group on thebalance sheet date are eliminated in their entirety. Unrealised losses on intra-group transactions are also eliminated in the same way asunrealised gains, to the extent that the loss does not correspond to an impairment loss.
(c) Acquisition of subsidiariesThe Group has changed its accounting policy with respect to accounting for business combinations. See Note 2 (a) ‘Accounting for businesscombinations’ for further details.

5 4 H I C L A N N U A L R E P O R T & A C C O U N T S 2 0 1 1
2. Key Accounting Policies (continued)
(d) Financial instrumentsFinancial assets and liabilities are recognised on the Consolidated Group’s balance sheet when the group becomes a party to thecontractual provisions of the instrument. Financial assets are derecognised when the contractual rights to the cash flows from theinstrument expire or the asset is transferred and the transfer qualifies for derecognition in accordance with IAS 39 ‘Financial instruments:Recognition and Measurement’.
(i) Non-derivative financial instrumentsNon-derivative financial instruments comprise investments in equity and debt securities, finance receivables, trade and otherreceivables, cash and cash equivalents, loans and borrowings and trade and other payables.
Non-derivative financial instruments are recognised initially at fair value including directly attributable transaction costs, except forfinancial instruments measured at fair value through profit or loss. Subsequent to initial recognition, non-derivative financialinstruments are measured as described below.
Investments in equity and debt securitiesEntity Investments (investments in the equity and loanstock of entities engaged in infrastructure activities which are not classified assubsidiaries of the Consolidated Group) are designated at fair value through profit or loss since the Consolidated Group managesthese investments and makes purchase and sale decisions based on their fair value.
The initial difference between the transaction price and the fair value, derived from using the discounted cash flows methodology atthe date of acquisition, is recognised only when observable market data indicates there is a change in a factor that market participantswould consider in setting the price of that investment. After initial recognition, investments at fair value through profit or loss aremeasured at fair value with changes recognised in the income statement.
Finance receivablesFinance receivables are recognised initially at fair value. Subsequent to initial recognition, finance receivables are measured at fairvalue using the discounted cash flows methodology, with changes recognised in the income statement as gains/(loss) on financereceivables as a capital item.
Finance receivables are designated at fair value through profit or loss because it eliminates or significantly reduces the accountingmismatch that would result from fair value movements in interest rate swaps.
Loans and borrowingsBorrowings are recognised initially at fair value of the consideration received, less transaction costs. Subsequent to initial recognition,borrowings are stated at amortised cost with any difference between cost and redemption value being recognised in the incomestatement over the period of the borrowings on an effective interest basis.
OtherOther non-derivative financial instruments are measured at amortised cost using the effective interest method less any impairment losses.
(ii) Derivative financial instrumentsThe Operating Subsidiaries hold derivative financial instruments to mitigate their interest rate risk and inflation rate risk exposures.All derivatives are recognised initially at fair value with attributable transaction costs recognised in the income statement asincurred. Thereafter, derivatives are measured at fair value with changes recognised in the income statement as part of finance costs.Fair value is based on price quotations from financial institutions active in the relevant market. The Consolidated Group has not usedhedge accounting.
(iii) Fair valuesThe fair values are determined using the income approach, except for derivative financial instruments, which discounts the expectedcash flows attributable to each asset at an appropriate rate to arrive at fair values. In determining the appropriate discount rate, regardis had to risk free rates, the specific risks of each investment and the evidence of recent transactions.
(iv) Effective interestThe effective interest rate is that rate that exactly discounts estimated future cash payments or receipts through the expected life ofthe financial instrument to the relevant asset’s carrying amount.
Notes to the Consolidated Financial Statements (continued)
for the year ended 31 March 2011

H I C L A N N U A L R E P O R T & A C C O U N T S 2 0 1 1 5 5
2. Key Accounting Policies (continued)
(e) Intangible assetsIntangible assets are recognised as part of a business combination if they are reliably measurable and separable from the acquired entityor give rise to other contractual/legal rights. Only one category of intangible asset has been recognised as part of a business combinationto date, being the fair value of service concessions in Operating Subsidiaries as at the date of acquisition. These assets are beingamortised over the life of the concessions concerned on a straight-line basis.
The accounting policies for intangible assets arising under IFRIC 12 are disclosed in part (k) of this note.
(f ) Impairment(i) Financial assets
Financial assets, other than those at fair value through profit or loss, are assessed for indicators of impairment at each balance sheetdate. A financial asset is considered to be impaired if objective evidence indicates that one or more events have had a negative effecton the estimated future cash flows of that asset. An impairment loss in respect of a financial asset measured at amortised cost iscalculated as the difference between its carrying amount, and the present value of the estimated future cash flows discounted at theoriginal effective interest rate. Significant financial assets are tested for impairment on an individual basis. The remaining financialassets are assessed collectively in groups that share similar credit risk characteristics. All impairment losses are recognised in theincome statement. An impairment loss is reversed if the reversal can be related objectively to an event occurring after the impairmentloss was recognised. For financial assets measured at amortised cost the reversal is recognised in the income statement.
(ii) Non-financial assetsThe carrying amounts of the Consolidated Group’s non-financial assets are reviewed at each reporting date to determine whether thereis any evidence of impairment. If any such indication exists, the asset’s recoverable amount is estimated. An impairment loss isrecognised in the income statement whenever the carrying amount of an asset exceeds its recoverable amount.
The recoverable amount of an asset is the greater of its net selling price and its value in use. The value in use is determined as the netpresent value of the future cash flows expected to be derived from the asset, discounted using a pre-tax discount rate that reflectscurrent market assessments of the time value of money and the risks specific to the asset.
An impairment loss is reversed if there has been a change in the estimates used to determine the recoverable amount. An impairmentloss is reversed only to the extent that the asset’s carrying amount after the reversal does not exceed the amount that would, havebeen determined, net of applicable depreciation, if no impairment loss had been recognised.
(g) Share capital and share premiumOrdinary shares are classified as equity. Costs directly attributable to the issue of new shares or associated with the establishment of theCompany that would otherwise have been avoided are written-off against the balance of the share premium account.
(h) Cash and cash equivalentsCash and cash equivalents comprises cash balances, deposits held at call with banks and other short-term, highly liquid investments withoriginal maturities of three months or less. Bank overdrafts that are repayable on demand are included as a component of cash and cashequivalents for the purpose of the cash flow statement.
(i) Non-controlling interestsThe interest of non-controlling shareholders is stated at the non-controlling’s proportion of the fair values of the assets and liabilitiesrecognised. Subsequently, any losses applicable to the non-controlling interest in excess of the carrying value of the non-controllinginterest are allocated against the interest of the parent, except to the extent that the non-controlling has both a binding obligation and theability to make an additional investment to cover the losses.
(j) Revenue(i) Services revenue
Services revenue (in accordance with IFRIC 12), which relates solely to the Operating Subsidiaries, is comprised of thefollowing components:
– revenues from the provision of facilities management services to Private Finance Initiative or Public Private Partnerships(“PFI/PPP”) projects calculated as the fair value of services provided (see Note k(i));
– the fair value of the consideration receivable on construction and upgrade services;
– availability fees and usage fees on PFI/PPP projects where the principal asset is accounted for as an intangible asset (see Note k(ii));and
– third party revenues on PFI/PPP projects.

5 6 H I C L A N N U A L R E P O R T & A C C O U N T S 2 0 1 1
2. Key Accounting Policies (continued)
(ii) Gains on finance receivablesGains on finance receivables relate solely to the Operating Subsidiaries.
RevenueGains on finance receivables included in the “revenue” category includes interest, dividends and other operating income relating tofinance receivables designated at fair value through profit or loss.
Interest income arising on finance receivables at fair value through profit or loss is recognised in the income statement as it accrues,using the effective interest rate of the instrument concerned.
Dividends are recognised when the Consolidated Group’s rights to receive payment have been established. That part of the dividend whichhas already been recognised in the fair value of finance receivable is deducted from the carrying amount of the relevant finance receivable.
Fees and other operating income are recognised when the Consolidated Group’s rights to receive payment have been established.
CapitalGains on finance receivables included in the capital category arise from the movement in the fair value of the finance receivablesexcluding the movements shown as revenue above.
(iii) Gains on investmentsGains on investments relates solely to the Entity Investments.
RevenueGains on investments included in the “revenue” category includes interest, dividends and other operating income relating to theEntity Investments.
Interest income arising on Entity Investments is recognised in the income statement as it accrues, using the effective interest rate ofthe instrument concerned as calculated at the acquisition or origination date.
Dividends are recognised when the Consolidated Group’s rights to receive payment have been established. That part of the dividendwhich has already been recognised in the fair value of investments is deducted from the carrying amount of the relevant investment.
Fees and other operating income are recognised when the Consolidated Group’s rights to receive payment have been established.
CapitalGains on investments included in the capital category arise from the movement in the fair value of the Entity Investments excludingthe movements shown as revenue above.
(k) Service concessionsIn accordance with IFRIC 12 and the various provisions of IFRS, the Consolidated Group has determined the appropriate treatment of theprincipal assets of, and income streams from, PFI/PPP and similar contracts within the Operating Subsidiaries. Results of all serviceconcessions which fall within the scope of IFRIC 12 conform to the following policies depending on the rights to consideration under theservice concessions:
(i) Service concessions treated as financial assetsService concessions are determined to give rise to finance receivables where the Consolidated Group, as operator, has anunconditional contractual right to receive cash or another financial asset from or at the direction of the grantor.
Revenue is recognised by allocating a proportion of total cash receivable to construction income and service income. The considerationreceived will be allocated by reference to the relative fair value of the services delivered, when the amounts are separately identifiable.
During the construction phase, revenue is recognised at cost, plus attributable profit to the extent that this is reasonably certain, inaccordance with IAS 11. Costs for this purpose include valuation of all work done by subcontractors whether certified or not, and alloverheads other than those relating to the general administration of the relevant companies.
During the operational stage, cash received in respect of the service concessions is allocated to services revenue (see part j(i) of thisnote) based on its fair value, with the remainder being allocated between capital repayment and interest income using the effectiveinterest method (see part j(ii) of this note).
The finance receivables are designated as at fair value through profit or loss in accordance with part (d) of this note. The fair valuesof the finance receivables are determined in a similar manner to that described in part (d)(i), with changes recognised in theincome statement.
Notes to the Consolidated Financial Statements (continued)
for the year ended 31 March 2011
H I C L A N N U A L R E P O R T & A C C O U N T S 2 0 1 1 5 7
2. Key Accounting Policies (continued)
(ii) Service concessions treated as intangible assetsService concessions are determined to give rise to intangible assets to the extent the Consolidated Group, as operator, has acontractual right to charge users of the public services. The intangible asset represents the construction cost of assets which give riseto the contractual right to charge. The intangible asset is amortised to estimated residual value over the remaining life of the serviceconcession and tested each year for impairment.
Revenue arising in respect of these service concessions is recognised when the services are delivered.
(l) Borrowing costsBorrowing costs incurred for the construction of any qualifying assets are capitalised during the period of time that is required to completeand prepare the asset for its intended use. Other borrowing costs are expensed.
(m) Income taxUnder the current system of taxation in Guernsey, the Company itself is exempt from paying taxes on income, profits or capital gains.The Company’s Operating Subsidiaries are UK based and are therefore subject to UK tax legislation. Dividend and interest incomereceived by the Consolidated Group may be subject to withholding tax imposed in the country of origin of such income, but all such taxis currently recoverable.
Income tax on the profit for the year of the Operating Subsidiaries comprises current and deferred tax. Current tax is the tax payable onthe taxable income for the year. Deferred tax is provided in full using the balance sheet liability method on temporary differences betweenthe carrying amount of assets and liabilities for financial reporting purposes and the amounts used for taxation purposes, except fordifferences arising on:
– the initial recognition of goodwill;
– the initial recognition of an asset or liability in a transaction which is not a business combination and at the time of the transactionaffects neither accounting or taxable profit; and
– investments in subsidiaries and jointly controlled entities where the group is able to control the timing of the reversal of the differenceand it is probable that the difference will not reverse in the foreseeable future.
Deferred tax is measured at the tax rates that are expected to be applied to the temporary differences when they reverse, based on thelaws that have been enacted or substantively enacted at the reporting date. For the UK Operating Subsidiaries deferred tax is measuredat UK tax rates.
A deferred tax asset is recognised to the extent that it is probable that future taxable profits will be available against which temporarydifference can be utilised. Deferred tax assets are reviewed at each reporting date and are reduced to the extent that it is no longerprobable that the related tax benefit will be realised.
(n) Foreign exchange gains and lossesTransactions entered into by group entities in a currency other than their functional currency are recorded at the rates ruling when thetransactions occur. Foreign currency monetary assets and liabilities are translated at the rates ruling at the balance sheet date. Exchangedifferences arising on the retranslation of unsettled monetary assets and liabilities are recognised immediately in the consolidated incomestatement as capital amounts.
(o) Segmental reportingThe Chief Operating Decision Maker (the “CODM”) is of the opinion that the Group is engaged in a single segment of business, beinginvestment in infrastructure which is currently predominately in private finance initiatives and public private partnership companies in onegeographical area, the United Kingdom.
The financial information used by the CODM to allocate resources and manage the Group presents the business as a single segment isprepared on an Investment basis. The Investment basis deconsolidates the subsidiary investments. A reconciliation of the consolidatedfinancial statements to pro-forma statements on an Investment basis is shown within the Financial Results of the annual report.
(p) ExpensesAll expenses and the profit share of the General Partner are accounted for on an accruals basis. The Consolidated Group’s investmentmanagement and administration fees, finance costs (including interest on long-term borrowings) and all other expenses are chargedthrough the consolidated income statement.
(q) DividendsDividends are recognised when they become legally payable. In the case of interim dividends, this is when declared by the Directors. In thecase of final dividends, this is when approved by the shareholders at the AGM. For script dividends where the Company issues shares withan equal value to the cash dividend amount as an alternative to the cash dividend a credit to equity is recognised when the shares are issued.

5 8 H I C L A N N U A L R E P O R T & A C C O U N T S 2 0 1 1
2. Key Accounting Policies (continued)
(r) ProvisionsProvisions are recognised when the Consolidated Group has a present obligation as a result of a past event, and it is probable that theConsolidated Group will be required to settle that obligation. Provisions are measured at the Directors’ best estimate of the expenditurerequired to settle the obligation at the balance sheet date, and are discounted to present value where the effect is material.
(s) Statement of compliancePursuant to the Protection of Investors (Bailiwick of Guernsey) Law, 1987 the Company is an Authorised Closed-Ended Investment Scheme.As an authorised scheme, the Company is subject to certain ongoing obligations to the Guernsey Financial Services Commission.
(t) ComparativesCertain investment activities on the face of the consolidated cash flow statement have been reclassified as operating activities to betterreflect the nature of the business.
Certain other comparatives have been reclassified to conform to the current year’s presentation.
3. Critical Accounting Judgements, Estimates And Assumptions
The preparation of financial statements in accordance with IFRS requires management to make judgements, estimates and assumptionsin certain circumstances that affect reported amounts. The judgements, estimates and assumptions that have a significant risk of causinga material adjustment to the carrying amounts of assets and liabilities within the next financial year are outlined below.
(i) Investments at fair value through profit or lossThe Consolidated Group has a greater than 50% shareholding in certain entities (see Note 15), where in the opinion of the Directors it isunable to govern the financial and operating policies of the entities by virtue of agreements with the other shareholder(s). These entitiesare consequently not treated as subsidiaries, and instead they are accounted for as financial assets at fair value through profit or loss, asset out in Note 2(b).
By virtue of the Company’s status as an investment fund and the exemption provided by IAS 28.1 and IAS 31.1, investments in associatesand joint ventures are designated upon initial recognition to be accounted for at fair value through profit or loss.
Fair values for those investments for which a market quote is not available are determined using the income approach which discounts theexpected cash flows at the appropriate rate. In determining the discount rate, regard is had to risk free rates, specific risks and theevidence of recent transactions. The Directors have satisfied themselves that the PFI/PPP/P3 investments share the same investmentcharacteristics and as such constitute a single asset class for IFRS 7 disclosure purposes.
The carrying amount of the PFI/PPP/P3 investments would be an estimated £11.2 million higher or £10.8 million lower (2010: £7.5 millionhigher or £7.2 million lower) if the discount rate used in the discounted cash flow analysis were to differ by 25 basis points from that usedin the fair value calculation. The weighted average discount rate for the PFI/PPP/P3 portfolio as at 31 March 2011 was 8.7% (2010: 8.7%).
The carrying amount of the PFI/PPP/P3 investments would be an estimated £6.8 million higher or £6.5 million lower (2010: £6.0 millionhigher or £5.3 million lower) if the inflation rate used in the discounted cash flow analysis were to differ by 25 basis points from that usedin the fair value calculation. The UK inflation rate assumed for all future periods from 31 March 2011 is 2.75% (2010: 2.75%).
The carrying amount of the PFI/PPP/P3 investments would be an estimated £2.8 million higher or £2.7 million lower (2010: £1.9 millionhigher or £2.0 million lower) if the deposit rates used in the discounted cash flow analysis were to differ by 25 basis points from that usedin the fair value calculation. The UK deposit rates assumed for all future periods from 31 March 2011 were 1% to March 2013 and 4%thereafter (2010: 1% to March 2012 and 4.5% thereafter).
(ii) Finance receivables at fair value through profit or lossFair values are determined using the income approach which discounts the expected cash flows at the appropriate rate. In determining thediscount rate, regard is had to risk free rates, specific risks and the evidence of recent transactions.
The carrying amount of finance receivables would be an estimated £17.4 million higher or £16.8 million lower (2010: £14.4 million higheror £13.8 million lower) if the discount rate used in the discounted cash flow analysis were to differ by 25 basis points from that used in thefair value calculation. The discount rates at 31 March 2011 were between 5.2% and 6.6% (2010: between 5.4% and 6.8%).
Notes to the Consolidated Financial Statements (continued)
for the year ended 31 March 2011

H I C L A N N U A L R E P O R T & A C C O U N T S 2 0 1 1 5 9
3. Critical Accounting Judgements, Estimates And Assumptions (continued)
(iii) IFRIC 12
Service concessions fall within the scope of IFRIC 12 where the grantor controls or regulates what services the operator must provide withthe infrastructure, to whom it must provide them, and the price; and the grantor controls, through ownership, beneficial entitlement orotherwise, any significant residual interest in the infrastructure at the end of the service agreement. Each subsidiary has been assessedto determine whether they fall within the scope of IFRIC 12. Following this review it was determined that all eleven subsidiaries controlledat the year end, fall within this scope. Service concessions are determined to be finance receivables where the operator has a contractualright to receive cash or another financial asset from or at the direction of the grantor. Alternatively, service concessions are determined tobe intangible assets to the extent the operator has a contractual right to charge users of the public services.
(iv) Intangible assetsIntangible assets represent fair value of service concessions for operating subsidiary projects recognised on acquisition, which areprimarily attributable to the service portion of the project contracts, and intangible assets recognised under IFRIC 12. Fair values aredetermined using the income approach which discounts the expected cash flows attributable to the services portion of the serviceconcessions acquired at an appropriate rate to arrive at fair values. In determining the appropriate discount rate, regard is had to risk freerates and the specific risks of each project.
4. Financial Instruments
Financial risk managementFinancial risk is managed by the group on an Investment basis, so for the purposes of this note, the group comprises the Company, its twowholly-owned Luxembourg subsidiaries (HICL Infrastructure 1 SARL and HICL Infrastructure 2 SARL) and the English Limited Partnership(Infrastructure Investments Limited Partnership (‘IILP’)), and is referred to as the “Investment Group”. The objective of the InvestmentGroup’s financial risk management is to manage and control the risk exposures of its investment portfolio. The Board of Directors hasoverall responsibility for overseeing the management of financial risks, however the review and management of financial risks aredelegated to the Investment Adviser and the Operator of the Group which has documented procedures designed to identify, monitor andmanage the financial risks to which the Investment Group is exposed. This note presents information about the Group’s exposure tofinancial risks, its objectives, policies and processes for managing risk and the Group’s management of its financial resources.
The Investment Group owns a portfolio of investments predominantly in the subordinated loanstock and ordinary equity of project financecompanies. These companies are structured at the outset to minimise financial risks where possible, and the Investment Adviser andOperator primarily focus their risk management on the direct financial risks of acquiring and holding the portfolio, but continue to monitorthe indirect financial risks of the underlying projects through representation, where appropriate, on the Boards of the project companiesand the receipt of regular financial and operational performance reports.
Interest rate riskThe Investment Group invests in subordinated loanstock of project companies, usually with fixed interest rate coupons. Where floating ratedebt is owned the primary risk is that the Consolidated Group’s cash flows will be subject to variation depending upon changes to baseinterest rates. The portfolio’s cash flows are continually monitored and reforecasted both over the near future (five year time horizon) andthe long-term (over whole period of projects’ concessions) to analyse the cash flow returns from investments. The Investment Group hasmade limited use of borrowings to finance the acquisition of investments and the forecasts are used to monitor the impact of changes inborrowing rates against cash flow returns from investments as increases in borrowing rates will reduce net interest margins.
The Group’s policy is to ensure that interest rates are sufficiently hedged to protect the Group’s net interest margins from significantfluctuations when entering into material medium/long-term borrowings. This includes engaging in interest rate swaps or other interestrate derivative contracts.
The Investment Group has an indirect exposure to changes in interest rates through its investment in project companies, which arefinanced by senior debt. Senior debt financing of project companies is generally either through floating rate debt, fixed rate bonds or indexlinked bonds. Where senior debt is floating rate, the projects typically have concession length hedging arrangements in place, which aremonitored by the project companies’ managers, finance parties and boards of directors. Floating rate debt is hedged using fixed floatinginterest rate swaps.
The finance costs in the income statement would be an estimated £8.4 million higher or £8.4 million lower (2010: £9.7 million higher or£9.7 million lower) if the interest rates used in the fair value calculation of the interest rate swaps were to differ by 25 basis points.

6 0 H I C L A N N U A L R E P O R T & A C C O U N T S 2 0 1 1
4. Financial Instruments (continued)
Inflation riskThe Group’s project companies are generally structured so that contractual income and costs are either wholly or partially linked to specificinflation where possible to minimise the risks of mismatch between income and costs due to movements in inflation indexes. TheInvestment Group’s overall cashflows are estimated to partially vary with inflation and consequently the portfolio valuation will vary withinflation. The effects of these inflation changes do not always immediately flow through to the Investment Group’s cashflows, particularlywhere a project’s loanstock debt carries a fixed coupon and the inflation changes flow through by way of changes to dividends in futureperiods. The sensitivity of the portfolio valuation is shown in Note 3(i).
The finance costs in the income statement would be an estimated £6.4 million higher or £6.4 million lower (2010: £5.0 million higher or£5.0 million lower) if the RPI rates used in the fair value calculation of the inflation swaps were to differ by 25 basis points.
Market riskReturns from the Investment Group’s investments are affected by the price at which they are acquired. The value of these investments willbe a function of the discounted value of their expected future cash flows, and as such will vary with, inter alia, movements in interest rates,market prices and the competition for such assets.
Currency riskThe projects in which the Group invests all conduct their business and pay interest, dividends and principal in sterling other than itsinvestment in Dutch High Speed Rail project (comprising 13.1% of investments at fair value), which conducts its business and pays itsinterest, dividends and principal in Euros and its investments in North-West Anthony Henday P3 and Kicking Horse Canyon P3 projects(comprising 1.7% of investments at fair value), which conduct there business and pay interest, dividends and principal in Canadian dollars.The Group monitors its foreign exchange exposures using its near term and long-term cash flow forecasts. Its policy is to use foreignexchange hedging to provide protection to the level of sterling distributions that the Investment Group aims to pay over the medium term,where considered appropriate. This may involve the use of forward exchange and other currency hedging contracts, as well as the use ofEuro, Canadian and other currency denominated borrowings. The Investment Group at 31 March 2011 hedged its currency exposurethrough forward sale of Euros and Canadian dollars.
Credit riskCredit risk is the risk that a counterparty of the Group will be unable or unwilling to meet a commitment that it has entered into withthe Group.
The Group’s key direct counterparties are the project companies in which it makes investments. The Investment Group’s near term cashflow forecasts are used to monitor the timing of cash receipts from project counterparties. Underlying the cash flow forecast are projectcompany cash flow models, which are regularly updated by project companies and provided to the Operator, for the purposes ofdemonstrating the projects’ ability to pay interest and dividends based on a set of detailed assumptions. Many of the Investment Group’sinvestment and subsidiary entities generally receive revenue from government departments, and public sector or local authority clients.Therefore a significant portion of the Group’s investments’ revenue is with counterparties of good financial standing.
The Group is also reliant on the project’s subcontractors continuing to perform their service delivery obligations such that revenues toprojects are not disrupted. The Investment Adviser has a subcontractor counterparty monitoring procedure in place. The credit standing ofsubcontractors is reviewed, and the risk of default estimated for each significant counterparty position. Monitoring is ongoing, and periodend positions are reported to the Board on a quarterly basis. The Investment Group’s largest credit risk exposure to a project at 31 Marchwas to the Home Office project (14% of portfolio by value) and the largest subcontractor counterparty risk exposure was to subsidiariesof the Bouygues group which provided facilities management services in respect of 21% of the portfolio by value.
The Consolidated Group is subject to credit risk on its loans, receivables, cash and deposits. The Consolidated Group’s cash and depositsare held with a variety of well known banks. The credit quality of loans and receivables within the investment portfolio is based on thefinancial performance of the individual portfolio companies. For those assets that are not past due, it is believed that the risk of default issmall and capital repayments and interest payments will be made in accordance with the agreed terms and conditions of the investment.Fair value adjustments, or “loan impairments”, are made when the net present value of the future cash flows predicted to arise from theasset, discounted using the effective interest rate method, implies non-recovery of all or part of the Group’s loan investment. In these casesa loan impairment is recorded equal to the valuation shortfall.
As at 31 March 2011, the ageing of trade receivables past due but not impaired were as follows:
31 March 2011 31 March 2010
£million £million
3 to 6 months due – 0.2Over 6 months due 0.5 0.1
0.5 0.3
At 31 March 2011 there were no loans and other receivables considered past due or impaired (2010: £nil) for the Consolidated Group.
Notes to the Consolidated Financial Statements (continued)
for the year ended 31 March 2011

H I C L A N N U A L R E P O R T & A C C O U N T S 2 0 1 1 6 1
4. Financial Instruments (continued)
Credit risk (continued)
The Consolidated Group’s maximum exposure to credit risk over financial assets is the carrying value of those assets in the balance sheet.The Consolidated Group does not hold any collateral as security.
Liquidity riskLiquidity risk is the risk that the Group will not be able to meet its financial obligations as these fall due. The Group’s approach to managingliquidity is to ensure, as far as possible, that it will have sufficient financial resources and liquidity to meets its liabilities when due. TheGroup ensures it maintains adequate reserves, banking facilities and reserve borrowing facilities by continuously monitoring forecast andactual cash flows and matching the maturity profiles of financial assets and liabilities. The Investment Group’s investments arepredominantly funded by share capital and medium term debt funding.
The Investment Group’s investments are generally in private companies in which there is no listed market and therefore such investmentwould take time to realise and there is no assurance that the valuations placed on the investments would be achieved from any such saleprocess. One of the Investment Group’s investments is a loan to Kemble Water, which was repaid in full in April 2011.
The Investment Group’s investments have borrowings which rank senior to the Investment Group’s own investments into the companies.This senior debt is structured such that, under normal operating conditions, it will be repaid within the expected life of the projects. Debtraised by the investment companies from third parties is without recourse to the Investment Group.
The Investment Group’s investments may include obligations to make future investment amounts. These obligations will typically besupported by standby letters of credit, issued by the Investment Group’s bankers in favour of the senior lenders to the investmentcompanies. Such subscription obligations are met from the Investment Group’s cash resources when they fall due. Such obligationstotalled £47.0 million (2010: £8.3 million) at the year end.
The Investment Group currently has a committed £200 million five year revolving bank facility expiring in December 2012 and is secured overall assets of the Consolidated Group. The facility is of a sufficient size to meet the Investment Group’s foreseeable funding requirements, andto provide significant headroom available to support acquisitions, should suitable opportunities be identified and executed.
The table below analyses the Consolidated Group’s financial liabilities into relevant maturity groupings based on the remaining period atthe balance sheet date to the contractual maturity date. The amounts in the table are the contracted undiscounted cashflows (includingthe impact of netting agreements).
Less than Between Between More than31 March 2011 1 year 1 and 2 years 2 and 5 years 5 years
£million £million £million £million
Bank borrowings 17.7 17.4 45.4 289.1Trade and other payables 28.9 – – –Interest on bank borrowings 22.9 21.8 59.2 172.1Other loans and borrowings 11.8 10.7 35.1 220.6Interest on other loans and borrowings 13.6 13.4 38.7 132.1Other financial liabilities 16.7 13.2 18.5 66.6
Total 111.6 76.5 196.9 880.5
Less than Between Between More than31 March 2010 1 year 1 and 2 years 2 and 5 years 5 years
£million £million £million £million
Bank borrowings 16.6 17.8 93.2 304.9Trade and other payables 20.9 – – –Interest on bank borrowings 23.9 23.0 62.2 191.0Other loans and borrowings 11.3 11.7 32.5 224.6Interest on other loans and borrowings 13.5 13.4 38.8 143.3Other financial liabilities 17.8 13.9 20.7 68.4
Total 104.0 79.8 247.4 932.2

6 2 H I C L A N N U A L R E P O R T & A C C O U N T S 2 0 1 1
4. Financial Instruments (continued)
Capital managementThe Investment Group utilises a £200 million revolving acquisition facility of which £153.3 million is undrawn at year end to fundacquisitions. Further equity raisings are considered when debt drawings are at an appropriate level. The proceeds from the share issuesare used to repay debt or to fund future investment commitments.
The Investment Group makes prudent use of its leverage. Under the Articles the Investment Group’s outstanding borrowings, including anyfinancial guarantees to support outstanding subscription obligations but excluding internal Investment Group borrowings of theInvestment Group’s underlying investments, are limited to 50% of the Adjusted Gross Asset Value of its investments and cash balances atany time.
The ratio of the Investment Group’s debt to Adjusted Gross Asset Value at the end of the year was as follows:
31 March 2011 31 March 2010
£million £million
Outstanding drawingsBank borrowings – 3.1Letter of credit facility 46.7 7.2
46.7 10.3Adjusted Gross Asset ValuePortfolio valuation 673.1 509.6Cash and cash equivalents 54.7 12.8
727.8 522.4
Borrowing concentration 6.4% 2.0%
From time to time the Investment Group issues its own shares on the market; the timing of these purchases depends on market prices.
In order to assist in the narrowing of any discount to the Net Asset Value at which the Ordinary Shares may trade from time to time, theCompany may, at the sole discretion of the Directors:
� make market purchases of up to 14.99% p.a. of its issued Ordinary Shares; and
� make tender offers for the Ordinary Shares.
There were no changes in the Investment Group’s approach to capital management during the year.
Fair value estimationThe following summarises the significant methods and assumptions used in estimating the fair values of financial instruments:
Non-derivative financial instrumentsThe fair value of financial instruments traded in active markets is based on quoted market prices at the balance sheet date.
The fair value of financial instruments that are not traded in an active market is determined by using valuation techniques. TheConsolidated Group uses the income approach which discounts the expected cash flows attributable to each asset at an appropriate rateto arrive at fair values. In determining the discount rate, regard is had to risk free rates, the specific risks of each investment and theevidence of recent transactions.
Derivative financial instrumentsThe fair value of financial instruments traded in active markets is based on quoted market prices at the balance sheet date. The quotedmarket price used for financial assets held by the Consolidated Group is the current bid price. Note 2 discloses the methods used indetermining fair values on a specific asset/liability basis. Where applicable, further information about the assumptions used indetermining fair value is disclosed in the notes specific to that asset or liability.
Notes to the Consolidated Financial Statements (continued)
for the year ended 31 March 2011

H I C L A N N U A L R E P O R T & A C C O U N T S 2 0 1 1 6 3
4. Financial Instruments (continued)
Classification of financial instruments31 March 2011 31 March 2010
£million £million
Financial assetsDesignated at fair value through profit or loss
Investment in Entity Investments 426.0 307.4Operating Subsidiaries’ financial assets 779.1 788.6
Financial assets at fair value 1,205.1 1,096.0
Loans and receivablesTrade and other receivables 15.7 12.1Cash and cash equivalents 114.9 67.1
Financial assets at amortised cost 130.6 79.2
Financial liabilitiesDesignated at fair value through profit or loss
Other financial liabilities (fair value of derivatives) (82.8) (84.9)
Financial liabilities at fair value (82.8) (84.9)
At amortised costTrade and other payables (28.9) (20.9)Current tax payable (0.8) (0.8)Loans and borrowings (647.7) (660.1)
Financial liabilities at amortised cost (677.4) (681.8)
The Directors believe that the carrying values of all financial instruments, except the fixed rate and RPI-linked bonds, are not materiallydifferent to their fair values. See Note 21 for the comparison between fair values and the carrying values of the fixed rate and RPI-linked bonds.
Secured bank and bond borrowings totalling £623.6 million (2010: £642.3 million) are secured by fixed and/or floating charges over theConsolidated Group’s financial assets. The terms of these charges are generally of a form that are usual and customary to project financeborrowing and lending activities.
Fair value hierarchyThe fair value hierarchy is defined as follows:
� Level 1: quoted prices (unadjusted) in active markets for identical assets or liabilities
� Level 2: inputs other than quoted prices included within Level 1 that are observable for the asset or liability, either directly (i.e., asprices) or indirectly (i.e., derived from prices)
� Level 3: inputs for the asset or liability that are not based on observable market data (unobservable inputs).
As at 31 March 2011
Level 1 Level 2 Level 3 Total£million £million £million £million
Investments at fair value through profit or loss (Note 15) 29.7 – 396.3 426.0Finance receivables at fair value through profit or loss (Note 17) – – 779.1 779.1
29.7 – 1,175.4 1,205.1
Other financial liabilities (fair value of derivatives) (Note 22) – 82.8 – 82.8
– 82.8 – 82.8

6 4 H I C L A N N U A L R E P O R T & A C C O U N T S 2 0 1 1
4. Financial Instruments (continued)
Fair value hierarchy (continued)As at 31 March 2010
Level 1 Level 2 Level 3 Total£million £million £million £million
Investments at fair value through profit or loss (Note 15) 24.8 – 282.6 307.4Finance receivables at fair value through profit or loss (Note 17) – – 788.6 788.6
24.8 – 1,071.2 1,096.0
Other financial liabilities (fair value of derivatives) (Note 22) – 84.9 – 84.9
– 84.9 – 84.9
There were no transfers between Level 1 and 2 during the year.
Reconciliations of Level 3 assets from beginning balances to the ending balances, disclosing separately changes during the year aredisclosed in notes 15 and 17 respectively. Sensitivity analyses disclosing the effect of different economic assumptions on the fair value ofthe Level 3 assets are disclosed in Note 3.
5. Services Revenue
For year ended For year ended31 March 2011 31 March 2010
£million £million
Service revenue 89.2 81.3Construction revenue 31.2 19.8Other revenue 0.8 1.5
121.2 102.6
Revenue from 5 customers which each represent more than 10% of the Group’s total revenues provide approximately £101.2 million(2010: £90.2 million) of revenue. The Group has treated each Government entity and/or department as a separate customer.
All services revenue is derived from customers domiciled in the United Kingdom.
Construction revenue includes £27.7 million (2010: £16.3 million) of capital variations funded by the Ministry of Defence and shareholderson the Helicopter Training project.
6. Gains/(Loss) on Investments
For the year ended For the year ended31 March 2011 31 March 2010
Revenue Capital Total Revenue Capital Total£million £million £million £million £million £million
Interest from investments 18.8 – 18.8 14.8 – 14.8Dividend income from investments 5.8 – 5.8 5.5 – 5.5Fees and other operating income 1.5 – 1.5 1.3 – 1.3Gains/(loss) on valuation (Note 15) – 9.7 9.7 – (2.3) (2.3)
26.1 9.7 35.8 21.6 (2.3) 19.3
Included within the loss on valuation in 2010 is an unrealised exchange loss of £0.1 million on the Consolidated Group’s Euro borrowings.The Consolidated Group had no overseas borrowing at the year end. The following exchange rates were used at the year end:
31 March 2011 31 March 2010
Euro 0.89 0.89Canadian 0.64 n/a
Notes to the Consolidated Financial Statements (continued)
for the year ended 31 March 2011

H I C L A N N U A L R E P O R T & A C C O U N T S 2 0 1 1 6 5
7. Services Costs
For year ended For year ended31 March 2011 31 March 2010
£million £million
Service and construction costs 93.6 76.9Amortisation of intangibles (see Note 14) 8.6 8.3Other costs 3.6 3.9
105.8 89.1
8. Administrative Expenses
For year ended For year ended31 March 2011 31 March 2010
£million £million
Fees payable to the Consolidated Group’s auditors for the audit of the Consolidated Group accounts 0.1 0.1Fees payable to the Consolidated Group’s auditors and its associates for other services:
The audit of the Company’s Operating Subsidiaries and other audit related services 0.2 0.3Taxation advisory services 0.1 0.1
Management fees 1.1 1.1Operator fees (Note 24) 6.5 5.2Investment fees (Note 24) 1.6 0.8Directors’ fees (Note 24) 0.2 0.1Professional fees 0.6 0.5Project bid costs 0.3 0.8Other costs 1.1 1.0
11.8 10.0
In addition to the above an amount of £0.2 million (2010: £0.2 million) was paid to associates of the Consolidated Group’s auditors inrespect of audit and tax services provided to Entity Investments (and therefore not included within consolidated administrative expenses).The Consolidated Group had no employees during the year.
9. Net Finance Costs
For the year ended For the year ended31 March 2011 31 March 2010
Revenue Capital Total Revenue Capital Total£million £million £million £million £million £million
Interest expense:Interest on bank loans and overdrafts (26.8) – (26.8) (23.9) – (23.9)Interest and indexation on other loans (21.6) – (21.6) (9.4) – (9.4)Other finance costs (2.7) – (2.7) (2.3) – (2.3)
Total finance costs (51.1) – (51.1) (35.6) – (35.6)
Interest income:Interest on bank deposits 0.4 – 0.4 0.3 – 0.3Other finance income – 0.7 0.7 – 3.2 3.2Change in fair value of interest andinflation rate swaps – 1.7 1.7 – 0.8 0.8
Total finance income 0.4 2.4 2.8 0.3 4.0 4.3
Net finance (costs)/income (50.7) 2.4 (48.3) (35.3) 4.0 (31.3)

6 6 H I C L A N N U A L R E P O R T & A C C O U N T S 2 0 1 1
10. Income Tax
Under the current system of taxation in Guernsey, the Company itself is exempt from paying taxes on income, profits or capital gains.Therefore, income from investments is not subject to any further tax in Guernsey, although these investments will bear tax in the individualjurisdictions in which they operate.
The Company’s Operating Subsidiaries are UK based and as a consequence are bound by UK tax legislation. Operating Subsidiaries in theUK have provided for UK corporation tax at the rate of 28% for current tax liabilities (2010: 28%) and 26% for deferred tax assets andliabilities (2010: 28%).
Changes in overseas tax ratesFinance (no. 2) Act 2010 enacted the reduction in the UK corporation tax rate from 28% to 27% with effect from April 2011. In addition, theUK Government announced three further annual 1% cuts to reduce the rate to 24% from April 2014.
At the 2011 Budget on 23 March 2011 the UK Government announced that the corporation tax rate would instead reduce to 26% from April2011 with three further annual 1% cuts to 23% by April 2014.
Other than the enacted change to 26%, the effects of the announced changes are not reflected in the financial statements for the yearended 31 March 2011 as they have not yet been enacted however the impact would be a reduction in deferred tax assets and liabilities.
10a.Income Tax Expense
For year ended For year ended31 March 2011 31 March 2010
£million £million
Foreign current tax:Foreign corporation tax on profits for the year (0.8) (1.2)
Total current tax expense (0.8) (1.2)
Deferred tax:Origination and reversal of temporary differences (Note 10d) 9.1 4.4
Total income tax credit in the income statement (Note 10b) 8.3 3.2
The income tax credit in the year of £8.3 million (2010: £3.2 million) is due to movements in deferred tax. The main component of thedeferred tax movement arises from a reduction in the UK corporation tax rate of 26% which has led to a re-measurement of the ConsolidatedGroup’s deferred tax asset and liability. The effect has resulted in a reduction in the deferred tax asset and liability and a corresponding taxcredit. Further analysis of deferred tax movements recognised in the consolidated income statement is detailed in Note 10d.
10b.Reconciliation of Effective Tax Rate
For year ended For year ended31 March 2011 31 March 2010
£million £million
Profit before taxation 38.3 7.7
Expected tax on profit at 0% (2010: 0%) – –Different tax rates applied in overseas jurisdictions 7.5 2.0Tax losses recognised 0.8 1.2
Total income tax credit for the year 8.3 3.2
Notes to the Consolidated Financial Statements (continued)
for the year ended 31 March 2011

H I C L A N N U A L R E P O R T & A C C O U N T S 2 0 1 1 6 7
10c.Recognised Deferred Tax Assets and Liabilities
Deferred tax assets and liabilities are attributable to the following:
As at 31 March 2011 As at 31 March 2010
Assets Liabilities Net Assets Liabilities Net£million £million £million £million £million £million
Finance receivables at fair valuethrough profit or loss 0.5 (22.4) (21.9) 0.2 (21.3) (21.1)Intangible assets – (43.2) (43.2) – (49.0) (49.0)Subordinated debt 8.2 (0.6) 7.6 10.1 (1.5) 8.6Other financial liabilities(fair value of derivatives) 20.9 (12.6) 8.3 22.6 (15.3) 7.3Tax losses 4.6 – 4.6 3.8 – 3.8Carrying value of finance receivable on acquisition where there is noavailable tax deduction – (26.1) (26.1) – (29.5) (29.5)Other 0.1 – 0.1 – 0.2 0.2
Net assets/(liabilities) 34.3 (104.9) (70.6) 36.7 (116.4) (79.7)
10d.Deferred Tax Movements
For the year ended 31 March 2011
Acquired in RecognisedOpening business in profit Closingbalance combination or loss balance£million £million £million £million
Finance receivables at fair value through profit or loss (21.1) – (0.8) (21.9)Intangible assets (49.0) – 5.8 (43.2)Subordinated debt 8.6 – (1.0) 7.6Other financial liabilities (fair value of derivatives) 7.3 – 1.0 8.3Tax losses 3.8 – 0.8 4.6Carrying value of finance receivable on acquisitionwhere there is no available tax deduction (29.5) – 3.4 (26.1)Other 0.2 – (0.1) 0.1
(79.7) – 9.1 (70.6)
For the year ended 31 March 2010
Acquired in RecognisedOpening business in profit Closingbalance combination or loss balance£million £million £million £million
Finance receivables at fair value through profit or loss (14.9) (15.7) 9.5 (21.1)Intangible assets (48.5) (2.8) 2.3 (49.0)Subordinated debt 7.3 1.9 (0.6) 8.6Other financial liabilities (fair value of derivatives) 10.2 4.2 (7.1) 7.3Tax losses 5.0 – (1.2) 3.8Carrying value of finance receivable on acquisitionwhere there is no available tax deduction (27.6) (3.2) 1.3 (29.5)Other – – 0.2 0.2
(68.5) (15.6) 4.4 (79.7)

6 8 H I C L A N N U A L R E P O R T & A C C O U N T S 2 0 1 1
11. Earnings per Share and Diluted Earnings per Share
Basic and diluted earnings per share is calculated by dividing the profit attributable to equity shareholders of the Company by theweighted average number of ordinary shares in issue during the year.
2011 2010
Profit attributable to equity holders of the Company £45.2 million £6.0 million
Weighted average number of ordinary shares in issue 504.5 million 379.5 million
Basic and diluted earnings per share 9.0 pence 1.6 pence
The denominator for the purposes of calculating both basic and diluted earnings per share are the same as the Company had not issuedany share options or other instruments that would cause dilution.
2011 2010
Weighted average number of ordinary shares in issue
In millions of sharesIssued ordinary shares at 1 April 454.3 338.3Effect of shares issued as a script dividend alternative 0.6 0.3Effect of shares issued under the block listing 30.1 26.1Effect of shares issued under the Placing and Offer for Subscription of C shares 19.5 14.8
Weighted average number of ordinary shares at 31 March 504.5 379.5
Further details of shares issued in the year are set out in Note 23.
12. Dividends
For year ended For year ended31 March 2011 31 March 2010
£million £million
Amounts recognised as distributions to equity holders during the year:
Second interim dividend for the year ended 31 March 2010 of 3.35p (2009: 3.275p) per share 15.2 11.0Interim dividend for the year ended 31 March 2011 of 3.275p (2010: 3.2p) per share 16.3 12.0
31.5 23.0
Second interim dividend for the year ended 31 March 2011 of 3.425p (2010: 3.35p) per share 20.4 15.2
The second interim dividend was approved by the Board on 19 May 2011 and is payable by 30 June 2011 to shareholders on the registeras at 27 May 2011. The second interim dividend is payable to shareholders as a cash payment or alternatively as a scrip dividend. Thedividend has not been included as a liability at 31 March 2011.
The 2010 second interim distribution and the 2011 interim distribution are included in the statement of changes in shareholder equity.
For year ended For year ended For year ended For year ended For year ended31 March 2011 31 March 2010 31 March 2009 31 March 2008 31 March 2007
Interim dividend for the period ended September 3.275p 3.20p 3.125p 3.05p 2.875pInterim dividend for the period ended March 3.425p 3.35p 3.275p 3.20p 3.225p
6.7p 6.55p 6.4p 6.25p 6.1p
13. Net Assets
The calculation of net assets per share is based on shareholders’ equity of £657.0 million as at 31 March 2011 (2010: £486.6 million)and 595.1 million (2010: 454.3 million) ordinary shares in issue at that date.
Notes to the Consolidated Financial Statements (continued)
for the year ended 31 March 2011

H I C L A N N U A L R E P O R T & A C C O U N T S 2 0 1 1 6 9
14. Intangible Assets
31 March 2011 31 March 2010
£million £million
CostOpening balance 189.5 179.5Acquisition through business combinations – 10.0
Balance as at 31 March 189.5 189.5
AmortisationOpening balance (18.9) (10.6)Amortisation for the year (8.6) (8.3)
Balance as at 31 March (27.5) (18.9)
Carrying amountsAt 31 March 162.0 170.6
Intangible assets represent the fair value of customer contracts for operating subsidiary projects recognised on acquisition, which areprimarily attributable to the service portion of the project contracts, and intangible assets recognised under IFRIC 12. See Note 3(iv) forthe methods and assumptions used in determining the fair values. Intangibles are being amortised on a straight line basis over the forecastremaining life of the concessions concerned on acquisition of the subsidiaries (range from between 11.5 and 30.5 years). Amortisation of£8.6 million (2010: £8.3 million) is included within service cost expenses in the consolidated income statement.
15. Investments at Fair Value Through Profit or Loss
31 March 2011 31 March 2010
£million £million
Opening balance 307.4 280.1Investments in the year 106.3 60.1Accrued interest 2.3 (1.3)Repayments in the year (6.5) (3.5)Subscription obligations 8.0 1.0Gain/(loss) on valuation 10.9 (1.8)Investments consolidated during the year – (25.8)Other movements (2.4) (1.4)
Carrying amount at year end 426.0 307.4
This is represented by:Less than one year 29.7 –Greater than one year 396.3 307.4
Carrying amount at year end 426.0 307.4
(Gain)/loss on valuation as above 10.9 (1.8)Less: transaction costs incurred (1.2) (0.5)
(Gain)/loss on investments 9.7 (2.3)
The losses have been included in Gains/(loss) on investments presented in the consolidated income statement as capital items.
The Kemble Water junior loan, which is classified as Level 1 in the fair value hierarchy, had a gain in valuation of £4.9 million during theyear (2010: £6.4 million). The remaining investments were all classified as Level 3 in the fair value hierarchy.
The Investment Adviser has carried out fair market valuations of the investments as at 31 March 2011. The Directors have satisfiedthemselves as to the methodology used, the discount rates applied, and the valuation. The Directors have also obtained an independentopinion from a third party, with considerable expertise in valuing these type of investments, supporting the reasonableness of thevaluation. The Kemble Water junior loan was valued on a market quote basis and the other investments, which are all investments inPFI/PPP/P3 projects, are valued using a discounted cashflow methodology. The valuation techniques and methodologies have beenapplied consistently with the prior year. Discount rates applied range from 8.4% to 10.0% (weighed average of 8.7%) (2010: 8.4% to 11.0%(weighted average of 8.7%)).

7 0 H I C L A N N U A L R E P O R T & A C C O U N T S 2 0 1 1
15. Investments at Fair Value Through Profit or Loss (continued)
The following economic assumptions were used in the discounted cashflow valuations:
UK inflation rates 2.75%
UK deposit interest rates 1% for 2 years to March 2013 and 4% thereafter
Euro/Sterling exchange rate 0.89 for all future periods
Can$/Sterling exchange rate 0.64 for all future periods
The economic assumptions for the year ended 31 March 2010 were as follows:
UK inflation rates 2.75%
UK deposit interest rates 1% for 2 years to March 2012 and 4.5% thereafter
Euro/Sterling exchange rate 0.89 for all future periods
Investments are generally restricted on their ability to transfer funds to the Group under the terms of their senior funding arrangement forthat investment. Significant restrictions include:
– Historic and projected debt service and loan life cover ratios exceed a given threshold;
– Required cash reserve account levels are met;
– Senior lenders have agreed the current financial model that forecasts the economic performance of the project company;
– Project company is in compliance with the terms of its senior funding arrangements; and
– Senior lenders have approved the annual budget for the company.
Details of investments recognised at fair value through profit or loss were as follows:
Percentage Holding31 March 2011 31 March 2010
Subordinated Mezzanine Subordinated MezzanineInvestments (project name) Equity loanstock debt Equity loanstock debt
Bishop Auckland Hospital 36.0% 36.0% 100.0% 36.0% 36.0% 100.0%Blackburn Hospital 50.0% 50.0% – 50.0% 50.0% –Bradford Schools 1 34.0% 34.0% – 34.0% 34.0% –Colchester Garrison 42.0% 42.0% – 42.0% 42.0% –Darlington Schools 50.0% 50.0% – 50.0% 50.0% –Defence Sixth Form College 45.0% 45.0% – 45.0% 45.0% –Durham and ClevelandFirearms Training Centre – – – – – –Dutch High Speed Rail Link 2 43.0% 43.0% – 37.5% 37.5% –Ealing Schools 50.0% 50.0% – 50.0% 50.0% –GMPA Police Stations – – – – – –Haverstock School 50.0% 50.0% – 50.0% 50.0% –Health & Safety Laboratory 80.0% 90.0% – 80.0% 90.0% –Health & Safety HQ 50.0% 50.0% – 50.0% 50.0% –Helicopter Training Facility 1/3 21.8% 59.0% – 21.8% 59.0% –Highland Schools 50.0% 50.0% – 50.0% 50.0% –Kemble Water Junior Loan – – 3.6% – – 3.6%Kent Schools 50.0% 50.0% – – – –
Notes to the Consolidated Financial Statements (continued)
for the year ended 31 March 2011

H I C L A N N U A L R E P O R T & A C C O U N T S 2 0 1 1 7 1
15. Investments at Fair Value Through Profit or Loss (continued)
Percentage Holding31 March 2011 31 March 2010
Subordinated Mezzanine Subordinated MezzanineInvestments (project name) Equity loanstock debt Equity loanstock debt
Kicking Horse Canyon P3 4 50.0% – – – – –M80 Motorway DBFO 1 41.6% 5 41.6% 5/6 – – – –MPA South East London Police Stations 50.0% 50.0% – 50.0% 50.0% –MPA Specialist Training Centre – – – – – –Newcastle Libraries 50.0% 50.0% – 50.0% 50.0% –North Tyneside Schools 50.0% 50.0% – 50.0% 50.0% –North-West Anthony Henday P3 1/4 50.0% 50.0% 6 – – – –Oxford John Radcliffe Hospital 89.9% 100.0% – 50.0% 50.0% –Pinnacle Schools, Fife 40.0% 40.0% 100.0% 40.0% 40.0% 100.0%Queen Alexandra Hospital 89.9% 100.0% – – – –Renfrewshire Schools 30.0% 30.0% – 30.0% 30.0% –Romford Hospital 50.0% 50.0% – 50.0% 50.0% –Sussex Custodial Centre 89.9% 100.0% – 82.3% 82.3% –Wooldale Centre 50.0% 50.0% – 50.0% 50.0% –
1 The Consolidated Group has future investment obligations totalling £47.0 million and its share of the projects capital commitmentsis £38.0 million.
2 The investment company is incorporated in the Netherlands.
3 The Consolidated Group’s economic interest in the Helicopter Training project includes the above investment in CAE Aircrew TrainingServices Plc (Op Co) and the controlling interest in CVS Leasing Limited (Asset Co) (see note 28).
4 The investment company is incorporated in Canada.
5 The Consolidated Group has put and call options to increase these interests to 49.9%.
6 Subordinated loanstock subscription commitments.
There are no other future loanstock or capital commitments on other investments at fair value through the profit or loss.
16a.Acquisition of Subsidiaries
Year ended 31 March 2011There were no acquisitions of subsidiaries during the year ended 31 March 2011.
Year ended 31 March 2010During the prior year the Group acquired additional interests in the equity and loan stock of Durham and Cleveland Firearms TrainingCentre, GMPA Police Stations and MPA Specialist Training Centre. The acquisitions took the group’s economic interest in these fourprojects to 72.9% in each. The total consideration paid in cash for the interests in these projects was £8.0 million. The transaction cost forthe three acquisitions was de minimus.
Intangible assets represent the fair value of customer contracts for operating subsidiary projects recognised on acquisition, which areprimarily attributable to the service portion of the project contracts, and intangible assets recognised under IFRIC 12. Intangibles areamortised on a straight line basis over the remaining life of the concessions concerned.

7 2 H I C L A N N U A L R E P O R T & A C C O U N T S 2 0 1 1
16a.Acquisition of Subsidiaries (continued)
Durham and Cleveland Firearms Training CentreIn November 2009 the Group acquired 22.9% of the equity and loan stock in the project bringing the total equity and loan stock intereststo 72.9%. The aggregate consideration paid for the interests in the project before the November acquisition was £1.3 million.
This project is a concession to design, construct, finance, operate and maintain a new firearms training facility for the Cleveland PoliceAuthority, which became operational in 2001.
Book value Fair value Fair valueat acquisition adjustments acquired
£million £million £million
Finance receivables at fair value through profit or loss* 6.7 2.2 8.9Deferred tax assets – 0.5 0.5Cash and cash equivalents 1.5 – 1.5Current liabilities (0.3) – (0.3)Deferred tax liabilities (1.8) (0.5) (2.3)Other non-current liabilities (5.9) (1.8) (7.7)Non-controlling interests – (0.2) (0.2)
Net assets acquired 0.2 0.2 0.4
Goodwill –
Fair value of consideration for equity 0.4Fair value of consideration for loan stock 1.4
1.8Less: Carrying amount of investment previously held as fair value through profit or loss (1.2)
Consideration paid for the remaining interests 0.6Cash acquired (1.5)
Net cash inflow (0.9)
*The finance receivable in the book value at acquisition under IFRS is valued at amortised cost rather than at fair value through profit or loss, and thereforethere is a fair value adjustment to reflect the fair value acquired.
Notes to the Consolidated Financial Statements (continued)
for the year ended 31 March 2011

H I C L A N N U A L R E P O R T & A C C O U N T S 2 0 1 1 7 3
16a.Acquisition of Subsidiaries (continued)
GMPA Police StationsIn November 2009 the Group acquired 22.9% of the equity and loan stock in the project bringing the total equity and loan stock intereststo 72.9%. The aggregate consideration paid for the interests in the project before the November acquisition was £14.1 million.
This project is a concession to design, construct, finance, operate and maintain a new traffic headquarters and 16 new police stations.
Book value Fair value Fair valueat acquisition adjustments acquired
£million £million £million
Intangible assets – 4.4 4.4Finance receivables at fair value through profit or loss* 89.6 25.8 115.4Deferred tax assets – 4.0 4.0Cash and cash equivalents 8.3 – 8.3Other current assets 0.1 – 0.1Current liabilities (3.8) – (3.8)Deferred tax liabilities – (8.5) (8.5)Other non-current liabilities (93.7) (14.3) (108.0)Non-controlling interests – (3.2) (3.2)
Net assets acquired 0.5 8.2 8.7
Goodwill –
Fair value of consideration for equity 8.7Fair value of consideration for loan stock 8.7
17.4Less: Carrying amount of investment previously held as fair value through profit or loss (12.1)
Consideration paid for the remaining interests 5.3Cash acquired (8.3)
Net cash inflow (3.0)
*The finance receivable in the book value at acquisition under IFRS is valued at amortised cost rather than at fair value through profit or loss, and thereforethere is a fair value adjustment to reflect the fair value acquired.

7 4 H I C L A N N U A L R E P O R T & A C C O U N T S 2 0 1 1
16a.Acquisition of Subsidiaries (continued)
Metropolitan Police Specialist Training CentreIn November 2009 the Group acquired 22.9% of the equity and loan stock in the project bringing the total equity and loan stock intereststo 72.9%. The aggregate consideration paid for the interests in the project before the November acquisition was £5.3 million.
This project involved a complete remodelling and refurbishment of the Metropolitan Police’s existing training school, which was completedin 2003.
Book value Fair value Fair valueat acquisition adjustments acquired
£million £million £million
Intangible assets – 5.5 5.5Finance receivables at fair value through profit or loss* 37.8 8.7 46.5Deferred tax assets – 1.6 1.6Cash and cash equivalents 5.2 – 5.2Other current assets 1.5 – 1.5Current liabilities (2.3) – (2.3)Deferred tax liabilities (6.7) (4.0) (10.7)Other non-current liabilities (35.0) (5.7) (40.7)Non-controlling interests – (1.8) (1.8)
Net assets acquired 0.5 4.3 4.8
Goodwill –
Fair value of consideration for equity 4.8Fair value of consideration for loan stock 2.2
7.0Less: Carrying amount of investment previously held as fair value through profit or loss (4.9)
Consideration paid for the remaining interests 2.1Cash acquired (5.2)
Net cash inflow (3.1)
*The finance receivable in the book value at acquisition under IFRS is valued at amortised cost rather than at fair value through profit or loss, and thereforethere is a fair value adjustment to reflect the fair value acquired.
If all the acquisitions had occurred on 1 April 2009, the estimated consolidated total income would have been £151.3 million andconsolidated profit for the year would have been £11.6 million. The aggregate loss in respect of the acquired subsidiaries was £2.1 millionduring the year.
16b.Acquisition of Other Investments
Year ended 31 March 2011The Consolidated Group has acquired a greater than 50% shareholding in certain entities (see Note 15), where in the opinion of theDirectors it is unable to govern the financial and operating policies of the entities by virtue of agreements with the other shareholder(s).These entities are consequently not treated as subsidiaries, and instead they are accounted for as financial assets at fair value throughprofit or loss, as set out in Note 2(b).
In June 2010, the Group acquired a 74.9% interest in the equity and loanstock of The Hospital Company (QAH) Limited through theacquisition of a 74.9% interest in the investment holding company, The Hospital Company (QAH) Holdings Limited. The total considerationpaid in cash for the interest in this project was £46.4 million.
In September 2010, the Group acquired a further 7.55% equity interest and 17.65% loan note interest in the Sussex Custodial ServicesLimited, taking its total equity interest in the project to 89.9% and loan note interest to 100%. The total consideration paid in cash for theseinterests was £1.1 million.
In November and December 2010, the Group acquired interests in two UK PFI and two Canadian P3 projects. The consideration was£65.9 million, including deferred investment obligations of approximately £46.1 million at October 2010 exchange rates.
Notes to the Consolidated Financial Statements (continued)
for the year ended 31 March 2011

H I C L A N N U A L R E P O R T & A C C O U N T S 2 0 1 1 7 5
16b.Acquisition of Other Investments (continued)
The four interests are:
� a 50.0% interest in the equity and loanstock of Kent Education Partnership Limited through the acquisition of a 50.0% interest in theinvestment holding company, Kent Education Partnership Holdings Limited;
� a 41.6% indirect interest in the equity and loanstock of Highway Management (Scotland) Limited, currently under construction inScotland, through the acquisition of a 41.6% interest in the investment holding company, Highway Management M80 InvestmentManagement Limited. Through the future exercise of options rights over the holdings of the other shareholders, this interest willincrease to 49.9%;
� a 50.0% interest in the North-West Connect General Partnership, currently in construction in Alberta, Canada, through the acquisitionof a 50.0% interest in the investment holding company, North-West Connect Holdings Inc; and
� a 50.0% interest in the Transpark Highway General Partnership in British Columbia, Canada, part of the Trans-Canada Highway throughthe acquisition of a 50.0% interest in the investment holding company, Transpark Highway Holding Inc.
In October 2010, the Group acquired a further 15.0% equity interest and 25.1% loan note interest in The Hospital Company (QAH) Limited,taking its total equity interest in the project to 89.9% and loan note interest to 100%. The total consideration paid in cash for theincremental interest in this project was £13.4 million.
In October 2010, the Group acquired a further 39.9% equity interest and 50% loan note interest in The Hospital Company (Oxford JohnRadcliffe) Limited, taking its total equity interest in the project to 89.9% and loan note interest to 100%. The total consideration paid incash for the incremental interest in this project was £13.9 million.
In March 2011, the Group acquired a further 5.49% equity and loan note interest in Infraspeed BV, the Dutch High Speed Rail PPP project,taking its total equity and loan note interests in the project to 42.99%. The total consideration paid in cash for the incremental interest inthis project was �11.6 million (£10.3 million).
Year ended 31 March 2010In June 2009, the Group acquired a 30% interest in the equity and loanstock of The Renfrewshire Schools Partnerships Limited through theacquisition of a 30% interest in the investment holding company, RSP (Holdings) Limited. The total consideration paid in cash for theinterest in this project was £6.8 million.
In July 2009, the Group acquired a 50% interest in the equity and loanstock of Alpha Schools Highland Limited through the acquisition ofa 50% interest in the investment holding company, Alpha Schools Highland (Holdings) Limited. The total consideration paid in cash for theinterest in this project was £16.8 million.
In September 2009, the Group acquired a 34% interest in the equity and loanstock of Integrated Bradford SPV Two Limited through theacquisition of a 34% interest in the investment holding company, Integrated Bradford Hold Co Two Limited. The total consideration for theinterest in this project was £7.4 million, the majority of which is a loanstock subscription obligation payable at the end of constructionin 2011.
In December 2009, the Group acquired a 50% interest in the equity and loanstock of Catalyst Healthcare (Romford) Limited through theacquisition of a 50% interest in the investment holding company, Catalyst Healthcare (Romford) Holdings Limited. The total considerationpaid in cash for the interest in this project was £23.9 million.
In March 2010, the Group acquired a 50% interest in the equity and loanstock of Kajima Newcastle Library Limited through the acquisitionof a 50% interest in the investment holding company, Kajima Newcastle Library Holdings Limited. The total consideration paid in cash forthe interest in this project was £3.0 million.

7 6 H I C L A N N U A L R E P O R T & A C C O U N T S 2 0 1 1
17. Finance Receivables at Fair Value Through Profit or Loss
31 March 2011 31 March 2010
£million £million
Opening balance 788.6 646.6Acquisition of subsidiaries – 170.8Gain/(loss) on valuation 6.6 (19.3)Repayments in the year (17.4) (13.6)Other movements 1.3 4.1
Carrying amount at year end 779.1 788.6
This is represented by:Less than one year 17.5 16.6Greater than one year 761.6 772.0
Carrying amount at year end 779.1 788.6
The operating subsidiaries’ concession contracts with public sector bodies are considered as financial assets. Gain in fair values offinancial assets of £6.6 million for the year ended 31 March 2011 (2010: £19.3 million loss), are separately disclosed in the consolidatedincome statement as a capital amount. See Note 3 (ii) for the methods and assumptions used in determining the fair values. The maximumexposure to credit risk at the reporting date is the fair value of the financial assets in the balance sheet.
Interest income in relation to finance receivables of £40.6 million has been recognised in the consolidated income statement for the yearended 31 March 2011 as a revenue amount (2010: £35.5 million).
18. Trade and Other Receivables
31 March 2011 31 March 2010
£million £million
Trade receivables 9.8 5.1Other debtors 1.0 0.5Prepayments and accrued income 4.9 6.5
15.7 12.1
19. Cash and Cash Equivalents
31 March 2011 31 March 2010
£million £million
Bank balances 34.5 39.5Call deposits 80.4 27.6
Cash and cash equivalents 114.9 67.1
The effective interest rate on call deposits was between 0.3% and 1.0% (2010: between 0.3% and 0.9%). The deposits had a maturity ofbetween 7 and 338 days (2010: between 30 and 183 days).
20. Trade and Other Payables
31 March 2011 31 March 2010
£million £million
Trade payables 7.6 4.4Accruals 15.7 11.5Other payables 5.6 5.0
28.9 20.9
Notes to the Consolidated Financial Statements (continued)
for the year ended 31 March 2011

H I C L A N N U A L R E P O R T & A C C O U N T S 2 0 1 1 7 7
21. Loans and Borrowings
31 March 2011 31 March 2010
£million £million
Non-current liabilitiesBank borrowings 350.1 369.5Subordinated debt 23.4 16.8RPI-linked bonds 157.6 159.7Fixed rate bond 85.2 84.5
616.3 630.5
Current liabilitiesBank borrowings 19.4 18.6Subordinated debt 0.7 1.0RPI-linked bonds 11.3 10.0
31.4 29.6
Total loans and borrowings 647.7 660.1
Terms and debt repayment scheduleThe terms and conditions of outstanding loans are as follows:
Weighted averageeffective Average year
interest rate of maturity Carrying amount2011 2010
£million £million
Secured bank borrowings – Operating Subsidiaries 5.9% 2025 369.5 386.3Secured bank borrowings – Partnership 5.8% 2012 – 1.8Subordinated debt 12.9% 2021 24.1 17.8RPI-linked bonds 6.0% 2030 168.9 169.7Fixed rate bond 5.7% 2031 85.2 84.5
647.7 660.1
The interest rate profile for secured bank borrowings is floating. This debt is hedged using fixed floating interest rate swaps. The bondshave either fixed interest coupons or are RPI-linked bonds where the interest coupon varies with inflation.
The bonds are guaranteed by FSA (UK) Limited and Ambac Assurance UK Limited and are secured by a fixed and floating charge over theassets of the respective subsidiary companies. The index-linked bonds are indexed annually and semi-annually using published RPIfigures. The index ratio uses a base index figure ranging from 173.3 to 174.5 and a numerator index figure that is published by the Officefor National Statistics.
The fair value of all borrowings is deemed to reflect their carrying value, except fixed rate and RPI-linked bonds. An analysis of fair valuesand carrying values of bonds is detailed below:
31 March 2011 31 March 2010
Carrying Fair Carrying Fairamount value amount value
£million £million £million £million
RPI-linked bonds 168.9 190.8 169.7 204.5Fixed rate bond 85.2 94.1 84.5 91.4
254.1 284.9 254.2 295.9
The fair value of fixed rate and RPI-linked bonds has been determined on a market quote basis.

7 8 H I C L A N N U A L R E P O R T & A C C O U N T S 2 0 1 1
21. Loans and Borrowings (continued)
The currency profile of the Consolidated Group’s loans and borrowings is as follows:
2011 2010
£million £million
Pound Sterling 647.7 657.0Euro – 3.1
647.7 660.1
The exchange rate used as at 31 March 2010 to convert the Euro loan was 0.89.
The Consolidated Group has the following undrawn borrowing facilities at 31 March:
2011 2010
Floating rate £million £million
Secured– expiring within one year – –– expiring between 1 and 2 years 153.3 –– expiring between 2 and 5 years – 189.7– expiring after 5 years 8.0 8.0
161.3 197.7
Unsecured– expiring within one year – –
161.3 197.7
The Operating Subsidiaries are required to meet certain bank covenants on its debt, the most significant of which are maintaining debtservice cover ratios (cash flows available for debt service as a ratio of debt servicing amounts) above 1.05 and Loan Life Cover Ratio above1.05. There were no material events of non-compliance in the Operating Subsidiaries in the year.
The Company is also required to meet certain bank covenants on its debt, the most significant of which are maintaining a Forward andHistoric Interest Cover Ratio above 1.15 and Gearing Ratio not greater than 1:1.
22. Other Financial Liabilities (Fair Value of Derivatives)
31 March 2011 31 March 2010
£million £million
Non-current liabilitiesInterest rate swaps 56.4 63.5Inflation swap 26.1 22.6Forward foreign exchange contract 0.3 (1.2)
82.8 84.9
Financial liabilities have been fair valued in accordance with Note 2(d). The gain in fair value of interest and inflation rate swaps of£1.7 million for the year ended 31 March 2011 (2010: gain £0.8 million) is disclosed within finance income in the consolidated incomestatement as a capital amount (see Note 9).
In order to manage exposure to movements in interest rates, project companies financed by floating rate debt swap their floating rateexposure for fixed rates using interest rate swaps. The notional amounts of the outstanding interest rate swap contracts at 31 March 2011were £444.7 million (2010: £438.4 million). As at 31 March 2011, the fixed interest rates on the swaps range from 4.53% to 6.51%(2010: 4.53% to 6.51%) and maturities range from 2012 to 2036 (2010: 2012 to 2036). The notional amount of the outstanding inflationrate swap contracts at 31 March 2011 was £1.4 million (2010: £1.4 million). As at 31 March 2011, the fixed inflation rates on the swapsrange from 2.12% to 2.77% (2010: 2.12% to 2.77%) and maturities range from 2034 to 2036 (2010: 2034 to 2036).
Notes to the Consolidated Financial Statements (continued)
for the year ended 31 March 2011

H I C L A N N U A L R E P O R T & A C C O U N T S 2 0 1 1 7 9
23. Capital and Reserves
Ordinary shares Management shares31 March 2011 31 March 2010 31 March 2011 31 March 2010
million million million million
On issue at 1 April 454.3 338.3 – –Issued for cash 139.0 115.0 – –Issued as a script dividend alternative 1.8 1.0 – –
On issue at 31 March – fully paid 595.1 454.3 – –
The holders of the 595,139,454 ordinary shares are entitled to receive dividends as declared from time to time and are entitled to onevote per share at meetings of the Company (2010: 454,301,314).
The 2 Management Shares of 0.01p each carry one vote each on a poll, do not carry any right to dividends and, in winding-up, rank onlyfor a return of the amount of the paid-up capital on such shares after return of capital on Ordinary Shares and Nominal Shares. TheManagement Shares are not redeemable and are accrued for and on behalf of a Guernsey charitable trust.
Share capital and share premium31 March 2011 31 March 2010
£million £million
Opening balance 234.0 106.5Premium arising on issue of equity shares 159.0 129.3Expenses of issue of equity shares (2.3) (1.8)
Balance at 31 March 390.7 234.0
Share capital is £59.5 thousand (2010: £45.4 thousand).
For the year ended 31 March 2011On 30 June 2010 0.3 million new ordinary shares of 0.01p each fully paid in the Company were issued as a scrip dividend alternative inlieu of cash for the second interim dividend in respect of the year ending 31 March 2010.
On 31 December 2010 1.5 million new ordinary shares of 0.01p each fully paid in the Company were issued as a scrip dividend alternativein lieu of cash for the interim dividend in respect of the year ending 31 March 2011.
On 13 December 2010 the Company announced the results of its Placing and Offer for Subscription of C shares. The Company raised£110.0m (before expenses) through the issue of 110,000,000 C shares at a price of £1.00 per C share, of which 56,739,235 C Shares wereissued pursuant to the Open Offer, 2,769,811 C Shares were issued pursuant to the Offer for Subscription and 50,490,954 C Shares wereissued by way of the Placing. The C shares were converted to 97,350,000 ordinary shares and admitted to trading on the London StockExchange on 17 January 2011.
In the year ending 31 March 2011 41.7 million new ordinary shares were issued to various institutional investors at an issue price pershare (before expenses) ranging between 112.5p and 115.0p.
For the year ended 31 March 2010On 30 June 2009 0.1 million new ordinary shares of 0.01p each fully paid in the Company were issued as a scrip dividend alternative inlieu of cash for the second interim dividend in respect of the year ending 31 March 2009.
On 31 December 2009 0.9 million new ordinary shares of 0.01p each fully paid in the Company were issued as a scrip dividend alternativein lieu of cash for the interim dividend in respect of the year ending 31 March 2010.
On 11 December 2009 the Company announced the results of its Placing and Offer for Subscription of C shares. The Company raised£80.0m (before expenses) through the issue of 80,000,000 C shares at a price of £1.00 per C share, of which 19,838,594 C shares wereissued pursuant to the offer for subscription and 60,161,406 C shares were issued by way of the placing. The C shares were converted to71,856,000 ordinary shares and admitted to trading on the London Stock Exchange on 15 January 2010.
In the year ending 31 March 2010 43.1 million new ordinary shares were issued to various institutional investors at an issue price pershare (before expenses) ranging between 109.9p and 115.75p.
Retained reservesRetained reserves comprise retained earnings and the balance of the share premium account, as detailed in the consolidated statementsof changes in shareholders’ equity.

8 0 H I C L A N N U A L R E P O R T & A C C O U N T S 2 0 1 1
24. Related Party Transactions
The Investment Adviser to the Company and the Operator of a limited partnership through which the group holds its investments isInfraRed Capital Partners Limited (“IRCP”). At 31 March 2011 IRCP was a wholly owned subsidiary of HSBC Group. Since year end IRCP’sownership changed as outlined in Note 26.
IRCP’s appointment as Investment Adviser is governed by an Investment Advisory Agreement which may be terminated after an initial fouryear term, starting in February 2006, by either party giving one year’s written notice. The appointment may also be terminated if IRCP’sappointment as Operator is terminated. The Investment Adviser is entitled to a fee of £0.1 million p.a. (disclosed within investment feesin Note 8) (2010: £0.1 million), payable half-yearly in arrears and which is subject to review, from time to time, by the Company.
IRCP has been appointed as the Operator of Infrastructure Investments Limited Partnership by the General Partner of the Partnership,Infrastructure Investments General Partner Limited, a sister subsidiary of IRCP. The Operator and the General Partner may each terminatethe appointment of the Operator by either party giving one year’s written notice. Either the Operator or the General Partner may terminatethe appointment of the Operator by written notice if the Investment Advisory Agreement is terminated in accordance with its terms. TheGeneral Partner’s appointment does not have a fixed term, however if IRCP ceases to be the Operator, the Company has the option to buythe entire share capital of the General Partner and IRCP Group has the option to sell the entire share capital of the General Partner to theCompany, in both cases for nominal consideration. The Directors consider the value of the option to be insignificant.
In aggregate IRCP and the General Partner are entitled to fees and/or profit share equal to: i) 1.1 per cent p.a. of the adjusted gross assetvalue of all investments of the group that are not in either their construction or ramp-up phases up to £750 million and 1.0 per cent p.a.for the incremental value in excess of £750 million; ii) 1.5 per cent p.a. of investments of the group that are in either their construction orramp-up phases, excluding investments acquired with the acquisition of the initial portfolio (the ramp-up phase of an investment meansthe period following completion of a project’s construction phase during which it is building up to be fully operational with full serviceprovision); and iii) 1.0 per cent of the value of new portfolio investments, that are not sourced from entities, funds or holdings managedby the IRCP Group.
The total Operator fees charged to the Income Statement was £6.5 million (2010: £5.2 million) of which £3.6 million remained payable atyear end (2010: £2.7 million). The total charge for new portfolio investments (disclosed within investment fees in Note 8) was £1.5 million(2010: £0.7 million) of which £1.0 million remained payable at year end (2010: £0.3 million).
Transactions during the yearThe following summarises the transactions between the Consolidated Group and its associates in the year:
Transactions BalanceYear ended Year ended
31 March 2011 31 March 2010 31 March 2011 31 March 2010
£million £million £million £million
Loanstock investments 66.1 29.1 285.2 199.9Loanstock repayments (2.5) (2.1) – –Equity investments 47.0 21.6 152.9 84.1Equity repayments (4.0) (1.3) – –Outstanding subscription obligations – – – –Loanstock interest 18.8 14.8 10.8 10.9Dividends received 5.8 5.4 – –Fees and other income 1.5 1.3 – –
At 31 March 2011 the Consolidated Group had total cash holdings with HSBC Bank plc of £81.4 million (2010: £34.5 million). Total interestincome earned from cash holdings held with HSBC Bank plc for the year was £0.1 million (2010: £0.2 million).
The Consolidated Group paid £nil (2010: £0.1 million) to HSBC Insurance Brokers Limited in the year for premiums in respect of Directorsand Officers liability insurance.
The Consolidated Group entered into Euro and Canadian dollar to Sterling sale and forward sale agreements with HSBC Bank plc duringthe year. Net payments received in respect of these agreements were £1.4 million (2010: £1.5 million paid), and as at 31 March 2011 themark to market of the outstanding Euro and Canadian sale agreements was a £0.3 million liability (2010: £1.2 million asset).
The Directors of the Consolidated Group, who are considered to be key management, received fees for their services. Further details areprovided in the Report of the Directors on page 36.
Total fees for the year were £155,000 (2010: £129,000). Directors expenses of £10,634 (2010: £3,982) were also paid in the year.
All of the above transactions were undertaken on an arm’s length basis.
Notes to the Consolidated Financial Statements (continued)
for the year ended 31 March 2011

H I C L A N N U A L R E P O R T & A C C O U N T S 2 0 1 1 8 1
25. Guarantees and Other Commitments
As at 31 March 2011 the Consolidated Group had £47.0 million in commitments for future project investments (2010: £8.3 million) and£20.3 million in capital commitments (2010: £12.3 million).
26. Events after Balance Sheet Date
On 11 April 2011, the Group received £30 million from its investment in the Kemble Water junior loan which was fully repaid at par. The£30 million proceeds received compares with the valuation of the investment in the Group’s portfolio as at 31 March 2011 of £29.7 million.The Company will seek to invest the proceeds of the repayment as and when suitable acquisition opportunities arise.
On 30 April 2011, HSBC Group successfully completed the majority sale of its infrastructure and real estate fund management business,of which the Investment Adviser is part, to the businesses’ senior management. HSBC Group retained a 19.9% stake. The Company’sInvestment Advisor changed its name to InfraRed Capital Partners Limited (formerly HSBC Specialist Fund Management Limited).
On 23 May 2011 the Group completed the acquisition of three school PFI projects from subsidiaries of Kier Group plc and Dexia SA for aconsideration of £17.2 million. The interests acquired are 75% of the equity and loan note interests in both Norwich and Oldham Schoolsand 37.5% of the equity and loan note interests in Sheffield Schools.
There were no other events after the balance sheet date, which are required to be disclosed.
27. Disclosure – Service Concession Arrangements
The Group holds investments in 37 service concession arrangements in the Accommodation, Education, Health, Transport and Law andOrder sectors. The concessions vary on the required obligations but typically require the financing and operation of an asset during theconcession period. As at 31 March 2011 34 of the service concessions were fully operational.
The rights of both the concession provider and concession operator are stated within the specific project agreement. The standard rightsof the provider to terminate the project include poor performance and in the event of force majeure. The operator’s rights to terminateinclude the failure of the provider to make payment under the agreement, a material breach of contract and relevant changes of law whichwould render it impossible for the service company to fulfil its requirements.

8 2 H I C L A N N U A L R E P O R T & A C C O U N T S 2 0 1 1
27. Disclosure – Service Concession Arrangements (continued)
Project Short description of Number Project Keyconcession arrangements Start date End date of years Capex subcontractors
Barnet Hospital Design, construct, operate and maintain 1999 2032 33 £65m Ecovert South Ltdthe re-building of Barnet General Hospital Compass Contractin North London for the Wellhouse Services (UK) LtdNational Health Service Trust.
Bishop Auckland Design, construct, finance, service and 1999 2062 60 (with £66m ISS Mediclean LtdHospital maintain a redevelopment of Bishop break
Auckland General Hospital, County clauseDurham for South Durham Health option byCare NHS Trust. Grantor at
Year 30,40 & 50)
Blackburn Design, construct, finance and maintain 2003 2041 38 £100m Haden BuildingHospital new facilities at the Queens Park Hospital Management
in Blackburn for the East LancashireHospitals NHS Trust.
Bradford Schools Design, construct, finance and maintain 2009 2036 27 £175m Amey Communitiesfour secondary schools for BradfordMetropolitan District Council.
Central Middlesex Design, construct, finance and maintain 2003 2036 33 £75m Ecovert FM LtdHospital new hospital facilities, and to refurbish some
existing facilities, for the Brent EmergencyCare and Diagnostic Centre on the CentralMiddlesex Hospital site in North West London.
Colchester Design, construct, finance and maintain a 2004 2039 35 £550m Sodexo DefenceGarrison new garrison facility at Colchester, Essex for Services Ltd
The Secretary of State for Defence. WS Watkins FacilitiesManagement Ltd
Conwy Schools Design, build, operate and maintain three 2003 2030 27 £40m Sodexo Educationschools for Conwy County Borough Council Services Ltdin North Wales.
Cleveland and Construction of a state of the art firearms and 2000 2026 26 £6m John Laing IntegratedDurham Police tactical training centre at Urlay Nook in the Services LtdTactical Training North of England. Construction completedCentre successfully in March 2002.
Darlington Darlington Schools is a four-school education 2004 2031 27 £31m Mitie PFI LtdSchools PFM project consisting of an Education Village
(which brought together three existing schools)and one primary school. The facilities became available on a phased basis in 2005 and 2006
Defence 6th Form Design, build, operate, finance and maintaining 2003 2033 30 £40m TQ Education andCollege a new residential sixth form college for the Training Ltd
Secretary of State for Defence. Interserve Defence Ltd
Dutch High Design, construct, finance, operate and 2001 2031 30 £625m Siemens Nederland BySpeed Rail maintain one of the largest high speed Koninklijke BAM NBM NV
railway projects in Europe to date. Fluor Infrastructure BV
Ealing Schools Ealing Schools is a four-school education 2004 2031 27 £31m Mitie PFI LtdPFI project consisting of one secondary school and three primary schools in the London Borough of Ealing. The schoolsbecame operational in 2004.
Notes to the Consolidated Financial Statements (continued)
for the year ended 31 March 2011

H I C L A N N U A L R E P O R T & A C C O U N T S 2 0 1 1 8 3
27. Disclosure – Service Concession Arrangements (continued)
Project Short description of Number Project Keyconcession arrangements Start date End date of years Capex subcontractors
Exeter Crown Build and service a new crown and county 2002 2034 32 £20m Sodexo LtdCourt court building in Exeter.
Fife Schools The facility involved the construction of 3 new 2001 2028 27 £40m Sodexo Ltdschools and a sports hall, all of which havebeen constructed successfully and are nowfully operational.
GMPA Police Construction of 17 police stations on 16 sites 2002 2030 28 £82m John Laing IntegratedStations around Greater Manchester. Construction of all Services Ltd
stations were complete by September 2006.
Haverstock School Haverstock is a single school education PFI 2003 2030 27 £21m Mitie PFI Ltdproject consisting of a new secondary schoolon an existing school site on Haverstock Hill,Camden. Phase 1 of the new school becameoperational in 2004 with subsequent phaseshanded over one year later.
Health & Safety HSE Merseyside HQ is an accommodation PFI 2002 2035 30 £62m HoneywellMerseyside HQ project. It is a four-storey office building that Control Systems
serves as the HSE’s operational headquarters Reliance Integratedand houses 1,500 employees. The building Services Ltdbecame operational in 2005.
Health & Safety Building of new workshops and offices in Buxton 2002 2035 33 £60m Interserve (FacilitiesLaboratory and the disposal of old facilities at Sheffield. Management) Ltd
Helicopter Design, construction, management, operation 1997 2037 40 (with £100m Serco LtdTraining Facility and financing of a simulator based training break Vega Software
facility for RAF helicopter pilots. clause by Engineering LtdGrantor at
Year 20)
Highland Schools Design, construction and operate eleven 2006 2037 30 £143m Morrison Facilitiesurban and rural schools. Services
Home Office HQ Build, finance, operate and maintain a new 2002 2032 29 £200m Ecovert FM ltdheadquarters building to replace the HomeOffice’s existing London office accommodationwith purpose-built serviced offices.
Kicking Horse Upgrade, operate and maintain a section of 2008 2030 22 CAD$ HMC Services IncCanyon highway in British Columbia. Full availability 127m
was completed in August 2007.
Kent Schools Design, build, funding and partial operation of 2007 2035 26 £95m Mitie PFI Ltdsix schools in Kent under the UK Government’sPFI programme. Construction was completedin June 2007.
M80 Motorway Design, build, finance and operate a section 2011 2041 30 £275m Bear (Scotland) Ltdof the M80 motorway in Scotland. Final completion is scheduled for December 2011.
MPA Specialist Construction of a firearms and public order 2001 2028 27 £40m John Laing IntegratedTraining Centre training facility in Gravesend, Kent for the Services Ltd
Metropolitan Police Authority. Constructionwas completed in February 2003.

8 4 H I C L A N N U A L R E P O R T & A C C O U N T S 2 0 1 1
27. Disclosure – Service Concession Arrangements (continued)
Project Short description of Number Project Keyconcession arrangements Start date End date of years Capex subcontractors
MPA SEL Police Construction of 4 police stations in South East 2001 2029 28 £80m John Laing IntegratedStations London for the Metropolitan Police Authority. Services Ltd
Construction was completed in February 2004.
Newcastle Finance, develop, construct and operate a new 2007 2034 27 £30m Integral UK LimitedLibraries city centre library in Newcastle and an additional
satellite library in High Heaton, both in the NorthEast of the UK. Construction was completed inMarch 2009.
North Tyneside North Tyneside Schools is a four-school education 2002 2034 32 £30m Mitie PFI LtdSchools PFI project consisting of one secondary school
(Burnside) and three primary schools (Western,Marine, Coquet) in North Tyneside. The schoolsbecame operational in 2003/2004.
North West Financing, building, maintaining and 2011 2041 30 CAD$ Carmacks MaintenanceAnthony Henday rehabilitating the northwest leg of the Anthony 995m Services Ltd
Henday Drive ring road in the City of Edmonton, Alberta. Traffic availability is expected on or before November 2011.
Oxford John Design, construction, management, financing, 2003 2036 33 £161m Carillion Services LtdRadcliffe Hospital operation and maintenance of a new wing
adjacent to the former Radcliffe Infirmary.Construction was completed ahead of schedulein March 2001.
Portsmouth Design and construction of a new hospital 2005 2040 35 £255m Carillion Services LtdHospital and retained estates work in Portsmouth.
Construction was completed in June 2010.
Renfrewshire Design, construction, management, financing, 2005 2037 32 £100m Amey BPO Services LtdSchools operation and maintenance of six primary and
four secondary schools in Renfrewshire, Scotland.
Romford Hospital Design, construction, management, financing, 2004 2040 36 £211m Sodexo Healthcareoperation and maintenance of a new hospital Services Ltdin Romford. Sodexo Services Ltd
Bovis Lend Lease Ltd
Stoke Mandeville Design, finance, construct, refurbish, operate 2004 2036 30 £40m Sodexo HealthcareHospital and maintain a new hospital facility for the Services Ltd
Buckingham Hospitals NHS Trust.
Sussex Custodial Build and service three custody centres in 2001 2031 30 £20m Reliance TaskCentre Sussex for Sussex Police Authority. The centres Management Ltd
are at Worthing, Chichester and Brighton. A fourth centre at Eastbourne was subsequently contracted for as a variation.
West Middlesex Design, construct, finance, operate and maintain 2001 2036 35 £60m Ecovert FM LtdHospital a new 228 bed hospital for West Middlesex
University Hospital NHS Trust.
Wooldale Centre Wooldale Centre for Learning is an education PFI 2003 2029 26 £24m Mitie PFI Ltdfor Learning project consisting of a Centre for Learning (CfL)
comprising a secondary school with sixth form,public library, primary school and nursery on alarge site in Northamptonshire. The first phase ofthe CfL (the primary school, library and part of thesecondary school) became operational in 2004.
Notes to the Consolidated Financial Statements (continued)
for the year ended 31 March 2011

H I C L A N N U A L R E P O R T & A C C O U N T S 2 0 1 1 8 5
28. Principal Subsidiaries
OwnershipName Country interest
HICL Infrastructure 1 SARL Luxembourg 100.0%HICL Infrastructure 2 SARL Luxembourg 100.0%HICL Infrastructure 3 SARL Luxembourg 100.0%HICL Infrastructure (Canada) Inc Canada 100.0%Infrastructure Investments Limited Partnership United Kingdom 100.0%Infrastructure Investments Holdings Limited United Kingdom 100.0%Infrastructure Investments (Portsmouth) Limited United Kingdom 100.0%AGP Holdings (1) Limited* United Kingdom 100.0%AGP (2) Limited* United Kingdom 100.0%Annes Gate Property PLC* United Kingdom 100.0%ByCentral Holdings Limited* United Kingdom 100.0%ByCentral Limited* United Kingdom 100.0%ByWest Holdings Limited* United Kingdom 100.0%ByWest Limited* United Kingdom 100.0%CVS Leasing Limited United Kingdom 80.4%Enterprise Civic Buildings (Holdings) Limited* United Kingdom 90.0%Enterprise Civic Buildings Limited* United Kingdom 90.0%Enterprise Education Conwy (Holdings) Limited* United Kingdom 90.0%Enterprise Education Conwy Limited* United Kingdom 90.0%Enterprise Healthcare (Holdings) Limited* United Kingdom 90.0%Enterprise Healthcare Limited* United Kingdom 90.0%Metier Healthcare Limited United Kingdom 100.0%Metier Holdings Limited United Kingdom 100.0%Services Support (Cleveland) Holdings Limited* United Kingdom 72.9%Services Support (Cleveland) Limited* United Kingdom 72.9%Services Support (Gravesend) Holdings Limited* United Kingdom 72.9%Services Support (Gravesend) Limited* United Kingdom 72.9%Services Support (Manchester) Holdings Limited* United Kingdom 72.9%Services Support (Manchester) Limited* United Kingdom 72.9%
* = Reporting date 31 December
All the consolidated revenues and the material net assets of the subsidiaries above are derived from the United Kingdom.

8 6 H I C L A N N U A L R E P O R T & A C C O U N T S 2 0 1 1
Year ended Year ended31 March 2011 31 March 2010
Note £million £million
Gain on financial assets A 46.3 25.7
Total income 46.3 25.7
Administrative expenses (1.2) (1.0)
Profit before net finance costs and tax 45.1 24.7
Finance income – –
Profit before tax 45.1 24.7
Income tax expense – –
Profit for the year 45.1 24.7
All results are derived from continuing operations. There is no other comprehensive income or expense apart from those disclosed above andconsequently a consolidated statement of comprehensive income has not been prepared.
The accompanying notes are an integral part of these financial statements.
Company Income Statement
for the year ended 31 March 2011

H I C L A N N U A L R E P O R T & A C C O U N T S 2 0 1 1 8 7
31 March 2011 31 March 2010
Note £million £million
Non-current assetsInvestments in subsidiaries B 0.1 0.1Financial assets at fair value through profit or loss C 673.3 502.9
Total non-current assets 673.4 503.0
Current assetsTrade and other receivables D – 0.1Cash and cash equivalents 0.1 0.1
Total current assets 0.1 0.2
Total assets 673.5 503.2
Current liabilitiesTrade and other payables (0.3) (0.3)
Total current liabilities (0.3) (0.3)
Net assets 673.2 502.9
EquityOrdinary share capital 23 – –Share premium 23 390.7 234.0Retained reserves 282.5 268.9
Total equity attributable to equity holders of the parent 673.2 502.9
The accompanying notes are an integral part of these financial statements.
The financial statements were approved and authorised for issue by the Board of Directors on 23 May 2011, and signed on its behalf by:
J Hallam G PickenDirector Director
Company Balance Sheet
as at 31 March 2011

8 8 H I C L A N N U A L R E P O R T & A C C O U N T S 2 0 1 1
For the year ended 31 March 2011
Share capitaland share Retained
premium reserves Total£million £million £million
Shareholders’ equity at beginning of year 234.0 268.9 502.9
Profit for the year – 45.1 45.1
Distributions paid – (31.5) (31.5)Ordinary shares issued 159.0 – 159.0Costs of shares issued (2.3) – (2.3)
Shareholders’ equity at end of year 390.7 282.5 673.2
For the year ended 31 March 2010
Share capitaland share Retained
premium reserves Total£million £million £million
Shareholders’ equity at beginning of year 106.5 267.2 373.7
Profit for the year – 24.7 24.7
Distributions paid – (23.0) (23.0)Ordinary shares issued 129.3 – 129.3Costs of shares issued (1.8) – (1.8)
Shareholders’ equity at end of year 234.0 268.9 502.9
Company Statement of Changes in Shareholders’ Equity
for the year ended 31 March 2011

H I C L A N N U A L R E P O R T & A C C O U N T S 2 0 1 1 8 9
Company Cash Flow Statement
for the year ended 31 March 2011
Year ended Year ended31 March 2011 31 March 2010
£million £million
Cash flows from operating activitiesProfit before tax 45.1 24.7Adjustments for:Gain on financial assets (46.3) (25.7)Interest income – –
Operating cash flow before changes in working capital (1.2) (1.0)
Changes in working capital:Decrease in receivables 0.1 –
Cash flow from operations (1.1) (1.0)
Net cash used in operating activities (1.1) (1.0)
Cash flows from investing activitiesInterest received on financial assets 26.1 23.5Financial assets – loans given (159.1) (131.4)Financial assets – repayments received 8.9 4.6
Net cash generated used in investing activities (124.1) (103.3)
Cash flows from financing activitiesProceeds from issue of share capital 154.6 126.3Dividends paid to Company shareholders (29.4) (21.9)
Net cash from financing activities 125.2 104.4
Net decrease in cash and cash equivalents – 0.1Cash and cash equivalents at beginning of year 0.1 –
Cash and cash equivalents at end of year 0.1 0.1

9 0 H I C L A N N U A L R E P O R T & A C C O U N T S 2 0 1 1
Notes to the Company Financial Statements
for the year ended 31 March 2011
Key accounting policiesThe accounting policies relevant to the Company are the same as those set out in the accounting policies of the Consolidated Group inNote 2, except as set out below:
InvestmentsInvestments in equity shares of subsidiaries are carried at cost less impairment.
Financial instrumentsFinancial assets and liabilities are recognised on the Company’s balance sheet when the Company becomes a party to the contractualprovisions of the instrument. Financial assets are derecognised when the contractual rights to the cash flows from the instrumentexpire or the asset is transferred and the transfer qualifies for derecognition in accordance with IAS 39 ‘Financial instruments:Recognition and Measurement’.
Financial assets at fair value through profit or lossFinancial assets at fair value through profit or loss comprise certain securities held with the Company’s wholly owned subsidiary. Thesefinancial assets are designated at fair value through profit or loss since the Company manages these as a portfolio of assets and takesinvestment decisions based on their fair values. After initial recognition, financial assets at fair value through profit or loss are measuredat fair value with changes recognised in the income statement. Fair values are determined by discounting the expected future principal,interest and dividend cash flows associated with these assets at an appropriate rate to arrive at fair values. The rate applied at 31 March2011 was the weighted average rate used in determining the fair value of the Group’s investments.
Interest incomeInterest income arising on financial assets at fair value through profit or loss is recognised in the income statement as it accrues, usingthe effective interest rate of the instrument concerned as calculated at the origination date. The effective interest rate is that rate thatexactly discounts estimated cash payments or receipts through the expected life of the financial instrument to the relevant asset’scarrying amount.
Financial risk managementThe relevant risks to the Company are managed as described in Note 4 to the consolidated accounts.
A. Gains on Financial Assets
For the For the year ended year ended
31 March 2011 31 March 2010
£million £million
Interest from financial assets 26.1 23.5Gain/(loss) on financial assets (see Note C) 20.2 2.2
46.3 25.7
B. Investments in Subsidiary Undertakings
31 March 2011 31 March 2010
£million £million
Investments in subsidiary undertakings 0.1 0.1
The Company owns 100% of the share capital of HICL Infrastructure 1 SARL, a company incorporated in Luxembourg.
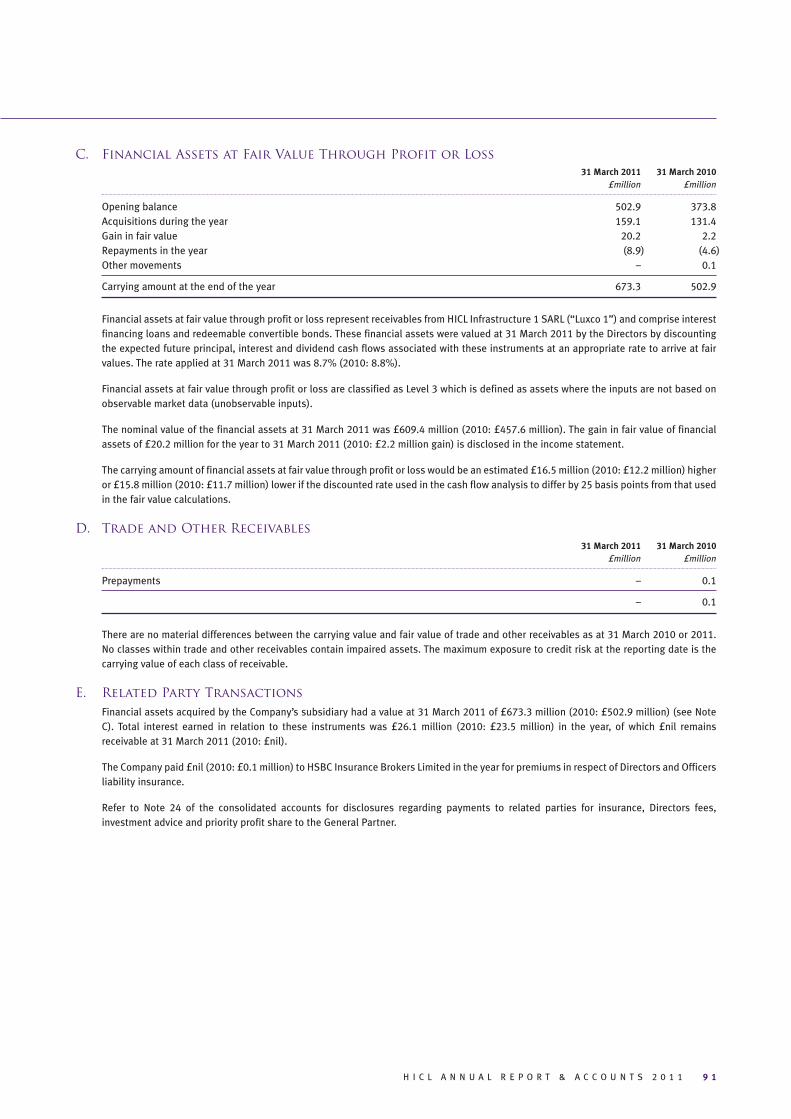
H I C L A N N U A L R E P O R T & A C C O U N T S 2 0 1 1 9 1
C. Financial Assets at Fair Value Through Profit or Loss
31 March 2011 31 March 2010
£million £million
Opening balance 502.9 373.8Acquisitions during the year 159.1 131.4Gain in fair value 20.2 2.2Repayments in the year (8.9) (4.6)Other movements – 0.1
Carrying amount at the end of the year 673.3 502.9
Financial assets at fair value through profit or loss represent receivables from HICL Infrastructure 1 SARL (“Luxco 1”) and comprise interestfinancing loans and redeemable convertible bonds. These financial assets were valued at 31 March 2011 by the Directors by discountingthe expected future principal, interest and dividend cash flows associated with these instruments at an appropriate rate to arrive at fairvalues. The rate applied at 31 March 2011 was 8.7% (2010: 8.8%).
Financial assets at fair value through profit or loss are classified as Level 3 which is defined as assets where the inputs are not based onobservable market data (unobservable inputs).
The nominal value of the financial assets at 31 March 2011 was £609.4 million (2010: £457.6 million). The gain in fair value of financialassets of £20.2 million for the year to 31 March 2011 (2010: £2.2 million gain) is disclosed in the income statement.
The carrying amount of financial assets at fair value through profit or loss would be an estimated £16.5 million (2010: £12.2 million) higheror £15.8 million (2010: £11.7 million) lower if the discounted rate used in the cash flow analysis to differ by 25 basis points from that usedin the fair value calculations.
D. Trade and Other Receivables
31 March 2011 31 March 2010
£million £million
Prepayments – 0.1
– 0.1
There are no material differences between the carrying value and fair value of trade and other receivables as at 31 March 2010 or 2011.No classes within trade and other receivables contain impaired assets. The maximum exposure to credit risk at the reporting date is thecarrying value of each class of receivable.
E. Related Party Transactions
Financial assets acquired by the Company’s subsidiary had a value at 31 March 2011 of £673.3 million (2010: £502.9 million) (see NoteC). Total interest earned in relation to these instruments was £26.1 million (2010: £23.5 million) in the year, of which £nil remainsreceivable at 31 March 2011 (2010: £nil).
The Company paid £nil (2010: £0.1 million) to HSBC Insurance Brokers Limited in the year for premiums in respect of Directors and Officersliability insurance.
Refer to Note 24 of the consolidated accounts for disclosures regarding payments to related parties for insurance, Directors fees,investment advice and priority profit share to the General Partner.

9 2 H I C L A N N U A L R E P O R T & A C C O U N T S 2 0 1 1
Directors and Advisers
Directors
Graham Picken (chairman)Sarah EvansJohn HallamChris Russell
REGISTRAR
Capita Registrars (Guernsey) LimitedLongue Hougue HouseSt. SampsonGuernsey GY2 4JN
Administrator to Company, Company
Secretary And Registered Office
Dexion Capital (Guernsey) Limited1, Le TruchotSt Peter PortGuernsey GY1 1WD
Investment Adviser and Operator
Infrared Capital Partners Limited12 Charles II StreetLondon SW1Y 4QU
Financial PR
M: Communications34th Floor1 Ropemaker StreetLondon EC2Y 9HT
UK Transfer Agent
Capita RegistrarsThe Registry34 Beckenham RoadBeckenhamKent BR3 4TUHelpline: 0871 664 0300
Auditors
KPMG Channel Islands Limited20 New StreetSt Peter PortGuernsey GY1 4AN
Joint Brokers
Collins Stewart Europe Limited Oriel Securities Limited9th Floor 150 Cheapside8 Wood Street London EC2V 6ETLondon EC2V 7QR

1879. Designed and produced by

1 Le TruchotSt Peter PortGY1 3SZGuernsey
t +44 (0)1481 743 940 e [email protected] w www.hicl.com
Registered Office: 1 Le Truchot St Peter Port Guernsey.
This report has been produced using recycled paper.


