
Equipment Rental since 1954
ANNUAL REPORT ANDACCOUNTS 2016
www.vpplc.com


Strategic ReportGovernance
Financial Statements
Shareholder Information
01
In This Report
Strategic Report
02 About Us
03 Our Business Model and Strategy
04 Over 60 Years in Business
06 Group Businesses
08 Financial Highlights
09 Chairman’s Statement
10 Business Review
18 Financial Review
21 Viability Statement
21 Risk Management
22 Principal Risks and Uncertainties
24 Corporate and Social Responsibility
Governance
29 The Board
30 Governance
34 Audit Committee Report
36 Remuneration Report
49 Directors’ Report
52 Statement of Directors’ Responsibilities
53 Independent Auditors’ Report
Financial Statements
57 Consolidated Income Statement
58 Statements of Comprehensive Income
59 Statements of Changes in Equity
60 Consolidated Balance Sheet
61 Parent Company Balance Sheet
62 Consolidated Statement of Cash Flows
63 Parent Company Statement of Cash Flows
64 Notes
Shareholder Information
91 Five Year Summary
92 Directors and Advisors
Vp plc Annual Report and Accounts 2016 www.vpplc.com

Vp plc Annual Report and Accounts 2016 www.vpplc.com02
About Us
UK AND OVERSEAS
TEXT TO BESUPPLIED
TEXT TO BESUPPLIED
TEXT TO BESUPPLIED
TEXT TO BESUPPLIED
TEXT TO BESUPPLIED
Vp is a specialist rental business.
Our objective is to deliver sustainable, quality
returns on behalf of our shareholders by providing
products and services to a diverse range of end
markets including infrastructure, construction,
housebuilding and oil and gas, both in the UK and
overseas.

Vp plc Annual Report and Accounts 2016 www.vpplc.com03
Our Business Model and Strategy
Serving diverse markets in the UK and overseas including infrastructure,construction, housebuilding, oil and gas.
Our aim is to generate sustainable value creation for shareholders and other stakeholders through our expertise in assetmanagement, by exceeding customer expectations, maintaining and utilising our financial strength and retaining andattracting the best people.
HOW WE MEASURE SUCCESS (KEY PERFORMANCE INDICATORS)
OBJECTIVESpecialism andmarket leading
positions
Value added servicesand operational
excellenceInnovation Asset management
financial strengthPeople and safety
MEASURE PBTA, revenue growth, margins
• ROACE• EBITDA gearing• Net debt• Fleet spend
• Annualisedemployee turnover*
• Reportableaccidents*
▲ ▲▲ ▲
*shown in CSR report
WE AIM TOCREATE VALUE
THROUGH SPECIALISTEQUIPMENT RENTAL IN NICHESECTORS WHERE WE HAVE
MARKET LEADING POSITIONS
Use our strong balancesheet and positive cash
generation to grow throughfleet investment and
acquisitions
Aim to provide'value added' services -people, training,
design
Buy quality productsat competitive
prices, maintain ourassets through theirrental life cycle
Deliver product servicereliability and operational
excellence:- centralised hire desk- sector leading IT systems
Embrace changeand look for
innovation yet takelong term view
Retaining and attracting the best people and
working safely are key to ouraims of exceeding customer
expectations and enhancing shareholder
value
Strategic ReportGovernance
Financial Statements
Shareholder Information
Vp plc Annual Report and Accounts 2016 www.vpplc.com04
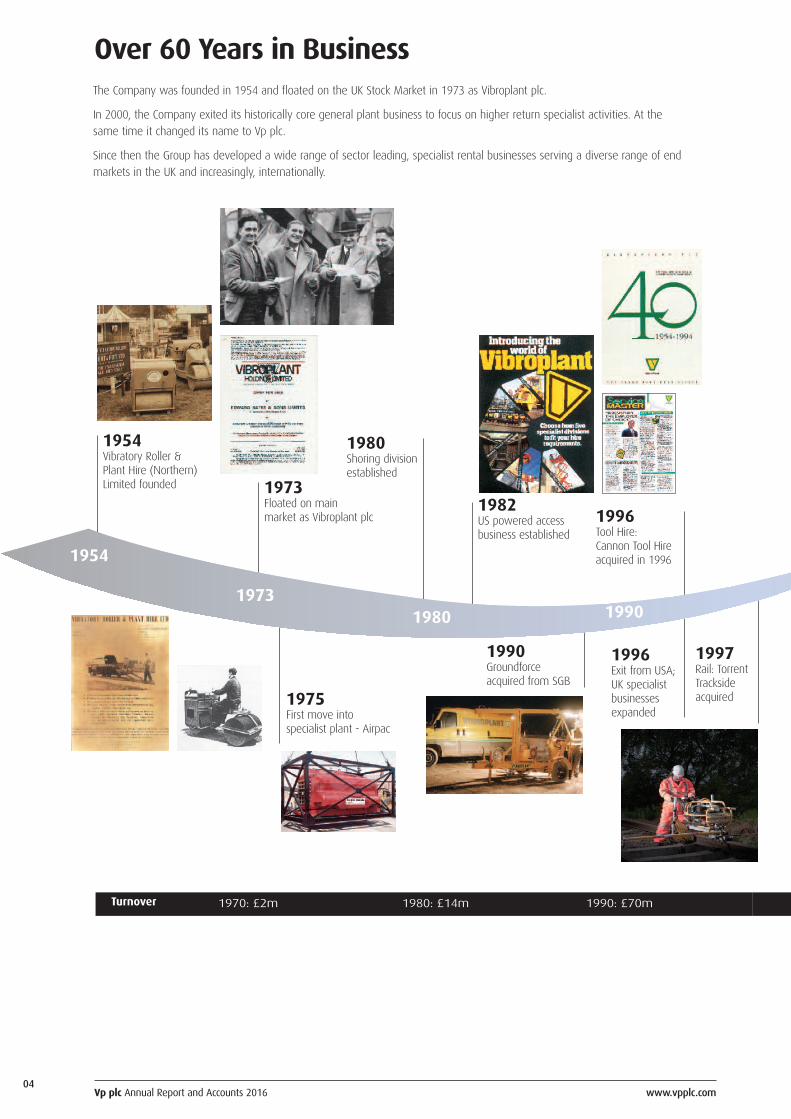
1954Vibratory Roller &Plant Hire (Northern)Limited founded 1973
Floated on mainmarket as Vibroplant plc
1982US powered accessbusiness established
1975First move intospecialist plant - Airpac
1980Shoring divisionestablished
1990Groundforceacquired from SGB
1996Exit from USA;UK specialistbusinessesexpanded
1997Rail: TorrentTracksideacquired
1996Tool Hire: Cannon Tool Hireacquired in 1996
Turnover 1970: £2m 1980: £14m 1990: £70m
Over 60 Years in BusinessThe Company was founded in 1954 and floated on the UK Stock Market in 1973 as Vibroplant plc.
In 2000, the Company exited its historically core general plant business to focus on higher return specialist activities. At thesame time it changed its name to Vp plc.
Since then the Group has developed a wide range of sector leading, specialist rental businesses serving a diverse range of endmarkets in the UK and increasingly, internationally.
1954
19731980 1990

Vp plc Annual Report and Accounts 2016 www.vpplc.com
Strategic ReportGovernance
Financial Statements
Shareholder Information
05
2005TPA and ESSacquired
2000UK Forksdivision created
2001Hire Station formedthrough merger offive regional toolbusinesses
2002-2004Shoring expansion throughacquisition of Mechplant,Trenchshore & Eve Shorco
2006Acquisition of Bukom Oilfield Services(Airpac Bukom formed)
2011Mainland Europe -Groundforce
2010Geographical expansion:Global (Airpac Bukom),Eire (Groundforce),Germany (TPA)
2014Vp plc celebrated its 60th Anniversary
2007-2009Continuing growth inspecialist areas viaacquisitions of MEPand UMole
2001Renamed Vp plc
2000: £55m 2010: £129m 2015: £209m
2013Acquisition of“Mr Cropper”
2015-16Acquisitions of Test& Measurementand Higher Access
2016
2006
2013

Vp plc Annual Report and Accounts 2016 www.vpplc.com06
Group Businesses
Hire Station is a major national provider ofsmall tools, climate, lifting, safety, survey andpressfitting equipment to industry, constructionand homeowners throughout the UK.
Specialist suppliers of rail infrastructure portableplant and related trackside services to NetworkRail, London Underground and their appointedtrack renewal and project contractors.
Groundforce is the market leading rental provider ofexcavation support systems and specialist products forthe water, civil engineering and construction industriesin the UK, the Republic of Ireland and mainland Europe.

Vp plc Annual Report and Accounts 2016 www.vpplc.com07
Group Businesses
UK Forks has established itself as the UK’s leading specialisthirer of telescopic handlers and tracked access platformsworking closely with our customers to improve safety andproductivity on building sites.
Airpac Bukom Oilfield Services holds a market leading positionin the provision of specialist compressed air and steamgeneration services. The business supports industry segmentsas diverse as well testing, offshore fabric maintenance, producttransfer, cuttings transportation and LNG fabrication. Ourequipment spreads are mobilised from an unrivalled networkof service facilities located in the UK, Singapore, Australia, U.A.E.and Latin America.
TPA Portable Roadways is one of Europe’s largest suppliersof temporary access solutions. Operating from bases in theUK and Germany, TPA provides equipment rental andinstallation of portable roadways, walkways and stairways,to customers in the transmission, construction, rail andoutdoor events markets.
Strategic ReportGovernance
Financial Statements
Shareholder Information

08
Financial Highlights
GROUP REVENUE
2012
183.1
205.6208.7
2013 2014 2015 2016
£208.7m+1.5%
PROFIT BEFORE TAX AND AMORTISATION
2012
20.1
26.829.8
2013 2014 2015 2016
£29.8m+11.4%
BASIC EARNINGS PER SHARE (PRE AMORTISATION)
2012
54.5
62.2
2013 2014 2015 2016
62.2p+14.3%
DIVIDENDS PER SHARE
2012
12.25
14.00
16.50
18.85
2013 2014 2015 2016
18.85p+14.2%
RETURN ON AVERAGE CAPITAL EMPLOYED
2012
13.5
16.2 16.3
2013 2014 2015 2016
16.3%+0.6%
NET DEBT
2012
45.3
53.0
66.8
86.1
2013 2014 2015 2016
£86.1m+28.9%
16.0
30.8
11.35
40.4
13.0
Vp plc Annual Report and Accounts 2016 www.vpplc.com
167.0161.5
35.5
17.4
13.3
42.0

Vp plc Annual Report and Accounts 2016 www.vpplc.com
Strategic ReportGovernance
Financial Statements
Shareholder Information
09
Chairman’s Statement
We have delivered an 11% increase in pre-tax profits at £29.8 million (2015: £26.8 million), beating last year’s record
breaking result. Revenues improved 2% to £208.7 million (2015: £205.6 million). Earnings per share increased 14% to
62.2 pence per share (2015: 54.5 pence per share) and both margins and return on capital employed also moved ahead.
Net debt at the year-end increased to £86.1 million (2015: £66.8 million) after capital expenditure on the rental fleet of
£45.9 million (2015: £49.3 million) and including the £8.1 million outlay on the two acquisitions made during the year.
In view of this excellent set of results, the Board is recommending a final dividend of 13.5 pence per share making a total for
the year of 18.85 pence per share, an increase of 14%. Subject to shareholders’ approval at our Annual General Meeting on
26 July 2016, it is proposed to pay the final dividend on 2 August 2016 to members registered as at 8 July 2016.
It has been a busy period for acquisitions, with two concluded during the year and a third which completed just post the year
end in April.
In November, we acquired Test & Measurement, a long established leader in the hire and sale of electrical instrumentation and
environment monitoring equipment. Test & Measurement has two branches in the UK and now operates as part of our ESS
Safeforce business.
In March, we acquired Higher Access Limited, a market leading hirer of tracked aerial work platforms. These products offer
significant performance advantages over traditional access products and will also complement the service offerings provided by
other businesses within the Group. Higher Access will continue to operate as a standalone business, working alongside our UK
Forks activities.
For some time now, we have been seeking to grow our non-UK revenues, subject to identifying the right quality opportunities.
We were therefore very pleased, in April, to acquire TR Pty Ltd, a market leading specialist provider of test and measurement
equipment, rental and calibration services with 13 branches in Australia, New Zealand and Malaysia. We look forward to
working with the TR team to grow this already excellent business.
It is my great pleasure, as always, to thank everyone for their hard work and loyalty which has made these excellent results
possible but especially this year to extend a very warm welcome to all the new members who have joined the Group.
Jeremy Pilkington
Chairman
7 June 2016
I am delighted to report to shareholderson another year of strong progress forthe Group, both financially and also interms of three exciting acquisitions, oneof which, completed just after the yearend, delivers part of our long termobjective to expand the Group’soverseas presence. Chairman: Jeremy Pilkington

Vp plc Annual Report and Accounts 2016 www.vpplc.com10
Business Review
The Group has made further significant progress in the current year, reporting an 11% increase in operating profits.
Operating profits were £31.9 million which compares with £28.8 million in the prior year. Operating margins again advancedstrongly to 15.3%, and our key measure of profit quality, return on average capital employed, improved to 16.3% (2015: 16.2%)in the current year.
Market behaviours have been mixed, but generally favourable. Across our four core sectors, we have seen good support ininfrastructure, housebuilding and construction markets, partially mitigated by a challenged oil and gas sector, where demandhas fallen sharply as investment has been cut in response to a period of historically low oil prices.
Critically, the Group continues to deliver strong cash generation which is highlighted by the advance in EBITDA, which grew to£59.3 million (2015: £53.8 million), an increase of 10%.
Investment in rental fleet was robust at £45.9 million (2015: £49.3 million). Fleet disposals continue to be a key element ofthe capital investment process and proceeds increased to £17.2 million (2015: £12.0 million) generating profit on disposal of£6.2 million (2015: £3.3 million).
In addition to organic investment in the fleet, the Group made two acquisitions in the period, acquiring Test & MeasurementGroup Limited for £3.95 million in November 2015 and Higher Access Limited for £4.1 million in March 2016.
We have for some time been alert to opportunities to further expand our trading footprint overseas and we were delighted toannounce, shortly after the end of the financial year, the acquisition of TR Pty Ltd (TR) on 21 April 2016 for a cash considerationof AUD $17.4 million (Australian dollars) and assumed net debt of AUD $6.6 million. TR adds significantly to the Group’sexisting Asia Pacific trading locations in Perth and Singapore, adding eight branches in Australia, three in New Zealand and twoin Malaysia.
In the coming year, we anticipate that the UK infrastructure market will continue to remain supportive. The current AssetManagement Programme (AMP6) in the water industry is in its second year and we anticipate that we will see activity in thissector start to pick up later in our financial year.
The non-residential construction market remains mixed, though overall we expect the sector to be positive for the Group.Equally, housebuilding is expected to remain supportive. The final key market area is oil and gas which represented c.9% ofGroup revenues in the year under review. This sector is still challenged by the collapse of the oil price and we expect therecovery will be over the medium rather than the short term.
The specialist nature of our services continues to provide an attractive, long term support to our customer base and the resultsfor 2015/16 endorse the quality of our business offer.
OverviewVp plc is a specialist rental businessproviding products and services to adiverse range of end markets includinginfrastructure, construction, housebuildingand oil and gas, both in the UK andoverseas.
Chief Executive: Neil Stothard
Year ended31 March 2016
Revenue
Operating profit before amortisation
Operating margin
Investment in rental fleet
ROACE
£205.6 million
£28.8 million
14.0%
£49.3 million
16.2%
£208.7 million
£31.9 million
15.3%
£45.9 million
16.3%
Year ended31 March 2015

Vp plc Annual Report and Accounts 2016 www.vpplc.com11
Business Review
Rough terrain material handlingequipment and tracked accessplatforms for the housebuilding,general construction and industrialmarkets.
UK Forks enjoyed another year of strong progress delivering a 30% increase in profits to £5.2 million (2015: £4.0 million).
Revenues grew by 10% from £18.2 million to £20.0 million.
The business experienced similar levels of demand to prior year from both the housebuilding and construction sectors, a point
reinforced by maintained levels of investment in the rental fleet of £11.1 million (2015: £11.2 million). Our diverse customer
base continues to recognise and value the importance of our commitment to delivering outstanding service and backup.
On 1 March 2016 the business acquired Higher Access Limited, specialists in the rental of tracked access platforms to a wide
range of markets including construction, transmission and utilities. Higher Access will work alongside the UK Forks telehandler
activity and we look forward to helping their highly experienced team to continue the development of the business.
In the new financial year, we anticipate that housebuild and construction will remain supportive which, added to further
development of the Higher Access business, points to another year of progress for the division.
Year ended31 March 2016
Revenue
Operating profit before amortisation
Investment in rental fleet
£18.2 million
£4.0 million
£11.2 million
£20.0 million
£5.2 million
£11.1 million
Year ended31 March 2015
Strategic ReportGovernance
Financial Statements
Shareholder Information

Vp plc Annual Report and Accounts 2016 www.vpplc.com12
Business Review
Excavation support systems andspecialist products for the water, civilengineering and constructionindustries in the UK, the Republic ofIreland and mainland Europe.
Groundforce delivered another good result, with profits improving to £9.6 million (2015: £8.9 million), a 9% increase
year on year, from revenues of £45.0 million, which were marginally ahead of the prior year.
The shoring division made progress, with good contributions from UK major projects, construction and housebuilding. As anticipated,
demand from the Water Industry (AMP6) was at its cyclical low. Initiatives on new transport and operating structures, instigated
in the prior year, also started to deliver important efficiencies to the business. Within the piling business the overall trading
levels were flat and, like shoring, regional demand was mixed, with Scotland and Ireland more subdued. A review of fleet saw
the successful divestment of the under-utilised vacuum excavator fleet, through trade sales, generating in excess of £1.25 million
of proceeds.
A number of basement propping schemes throughout Europe went live and were completed in the year, the most notable
being in Norway. The on-going Qatar metro contract, for a European based consortium, continued through the year, though our
operations in Germany faced trading headwinds as construction demand softened.
Capital investment into the rental fleet was £6.5 million (2015: £5.7 million). This both augmented the product portfolio and
maintained the quality of the existing fleet.
It is anticipated that next year most markets will be stable but the timing of the release of AMP6 related work will be an
important factor, the current view being that this will begin towards the end of calendar year 2016.
Year ended31 March 2016
Revenue
Operating profit before amortisation
Investment in rental fleet
£44.4 million
£8.9 million
£5.7 million
£45.0 million
£9.6 million
£6.5 million
Year ended31 March 2015

Vp plc Annual Report and Accounts 2016 www.vpplc.com
Strategic ReportGovernance
Financial Statements
Shareholder Information
13
Business Review
Portable roadway access solutions tothe transmission, outdoor events,construction and utility sectors in theUK and mainland Europe.
TPA experienced a 7% drop in revenue to £13.6 million (2015: £14.6 million) primarily driven by softer levels of
demand in Germany. Despite the reduction in revenue, overall margins improved and operating profits of £1.0 million
were in line with the prior year.
The UK business traded satisfactorily despite a slower than expected transmission sector, a situation that has prevailed since the
break-up of the National Grid Alliances. As a consequence, there was an oversupply of product in the UK market, resulting in
price pressure. This was mitigated, in part, by a planned and progressive re-alignment of the business mix, including the
introduction of new products and services, which has created fresh revenue streams for the UK business.
Germany, like the UK, experienced a shortfall in demand from the key renewables and transmission markets, which were
heavily impacted by delays in project starts, mainly caused by caution surrounding government subsidies and planning
approvals.
Capital expenditure on the rental fleet totalled £4.3 million (2015: £2.3 million), including new products, and in support of
contracts for the new financial year.
We expect improved prospects in the new financial year, with early signs of recovery in transmission activity in the UK, and a
gradual recovery in the German market.
Year ended31 March 2016
Revenue
Operating profit before amortisation
Investment in rental fleet
£14.6 million
£1.0 million
£2.3 million
£13.6 million
£1.0 million
£4.3 million
Year ended31 March 2015

Business Review
Tools and specialist products forindustry, construction and homeowners.
Hire Station had an excellent trading year, reporting a profit increase of 32% to £11.5 million (2015: £8.7 million) on
revenues 7% ahead, at £82.5 million (2015: £77.0 million).
Healthy capital investment of £17.4 million, focussed mainly on high demand assets, means that we continue to build one of
the youngest hire fleets in the market. The focus on availability, quality and compliance remains the key to offering operational
excellence to our customers, and this we believe gives us a true competitive advantage. As usual safety has remained at the
top of the agenda and Hire Station was recently named “Safehire Company of the Year” at the prestigious Hire Awards of
Excellence 2016 awards.
The tools business made significant progress during the year, with new locations opened in London, South Wales, Glasgow and
Birmingham. The National Call centre in Manchester has been expanded and during the year we improved our lifting
equipment offer and further enhanced our on-line presence.
ESS Safeforce had another impressive trading year delivering growth in all of its key revenue streams. We successfully
negotiated a five year contract to supply the Valero Milford Haven Oil refinery and the business broadened its product offer
further with the acquisition in November 2015 of Test and Measurement Ltd.
The MEP business supplies specialist press fitting and electro fusion equipment and low level access equipment to the mechanical
and electrical sector. Revenues and profits moved ahead strongly in the year, supported by new locations in London and
enhancement of existing locations.
The Hire Station division has entered the new financial year in excellent shape and the end markets that it serves are all
expected to be supportive.
Year ended31 March 2016
Revenue
Operating profit before amortisation
Investment in rental fleet
£77.0 million
£8.7 million
£20.1 million
£82.5 million
£11.5 million
£17.4 million
Year ended31 March 2015
Vp plc Annual Report and Accounts 2016 www.vpplc.com14

Vp plc Annual Report and Accounts 2016 www.vpplc.com
Strategic ReportGovernance
Financial Statements
Shareholder Information
15
Business Review
Infrastructure equipment andservices for the railway renewalsand maintenance industry.
Torrent Trackside delivered profits of £3.4 million (2015: £3.4 million) in the year from revenues up 9% on the prior
year, at £32.5 million.
During the year the contractual relationship with Network Rail has continued to work well. The business experienced good
demand on both plain line track renewals, as well as switches and crossings work, and had a busy year on the London
Underground infrastructure programme, servicing Track Partnership, a joint venture between Balfour Beatty and TFL. Torrent
secured new work on the Crossrail project with Carillion and excelled during the Christmas programme, one of the largest it
has ever undertaken.
The Government is committed to investing in a programme of electrification to upgrade the UK railway network, and in Control
Period 5 there are numerous high profile projects notably Great Western, Midland Mainline and the North West Liverpool to
Manchester scheme. We have invested to create a large and modern fleet of portable overhead line products for use on these
projects. Total fleet capex was £5.2 million (2015: £4.7 million).
During the year there were two long awaited reports issued about the future shape of the industry. The Hendy and Shaw
reports address, respectively, the rail enhancement programme, and railway funding and devolution, and both were viewed
positively by Torrent. Equally, in Network Rail, we have excellent relationships both centrally and at route level and feel well
placed to support any structural changes that may occur in the future.
The current year has started well and opportunities remain in what is always a changing and demanding market place. Torrent
Trackside has an exemplary reputation for safety, service and delivery and remains well positioned to capitalise on those
opportunities.
Year ended31 March 2016
Revenue
Operating profit before amortisation
Investment in rental fleet
£29.9 million
£3.4 million
£4.7 million
£32.5 million
£3.4 million
£5.2 million
Year ended31 March 2015

Vp plc Annual Report and Accounts 2016 www.vpplc.com16
Business Review
Equipment and service providers tothe international oil and gasexploration and developmentmarkets.
Further deterioration in global oil prices meant that trading conditions remained difficult across most of our service
offerings. As oil companies curtailed capital expenditure on exploration and production projects, well testing activity
continued the downward trend first experienced in the second half of the prior year and this has impacted activities
across most of our regions. Whilst revenues and profits reduced as a consequence of the prevailing market conditions,
the business remained profitable. Operating profits were £1.2 million (2015: £2.8 million) generated from revenues of
£15.2 million (2015: £21.5 million).
We did see resilience in our trading in the Americas and the scope of our presence in Australia saw that region perform ahead
of expectation. Liquid Natural Gas (LNG) infrastructure projects again provided the major source of revenue in Australia. On the
LNG contracts at Curtis Island in Queensland, testing work was completed on the QCLNG site and APLNG wound down towards
the end of the year. New awards were secured on the Wheatstone and Ichthys facilities in Western Australia and the Northern
Territory respectively.
Investment in fleet was £1.4 million, well down on the prior year spend of £5.3 million. Whilst management has further
aligned costs and structure to meet what will remain a challenging trading environment over the next 12 months, we continue
to be engaged in discussions on new added-value opportunities, and at the end of the year, secured a major geothermal
project in Scandinavia.
The short term trading background remains challenging but the Airpac Bukom team are focused on maximising returns from a
quiet market place, with the prospect of some recovery in the medium term as oil and gas prices return to levels more viable
for exploration and production investment.
Year ended31 March 2016
Revenue
Operating profit before amortisation
Investment in rental fleet
£21.5 million
£2.8 million
£5.3 million
£15.2 million
£1.2 million
£1.4 million
Year ended31 March 2015

Vp plc Annual Report and Accounts 2016 www.vpplc.com
Strategic ReportGovernance
Financial Statements
Shareholder Information
17
ProspectsWe enter the new financial year in good shape, with most end markets offering supportive trading environments and
with the prospect of fresh contributions from the three newly acquired businesses.
In particular, the acquisition of TR Group Pty underlines our determination to expand our trading horizons both in terms of
product and geography. We believe that opportunity exists to further leverage Vp’s key skill sets in equipment rental both in
the UK and in overseas markets.
Reflecting this, and catalysed by the TR acquisition, we have, in the new financial year, started to report the Group’s performance
in two distinct segments. These are UK and International: International being defined as the consolidated performance of
Airpac Bukom and TR, with the UK containing the consolidated performance of all other businesses within the Group.
Vp has, in the year under review, reported good progress, with further improvement in profit margins and returns, delivered
from a relatively modest growth in revenues. This trend is expected to continue as the varying demands of supportive
infrastructure, housebuilding and construction markets play against a challenged oil and gas sector.
The new financial year has started well and we look forward to another year of progression for Vp and our shareholders.
Neil Stothard
Chief Executive
7 June 2016
Business Review

Vp plc Annual Report and Accounts 2016 www.vpplc.com18
Financial Review
Group revenues increased by 1.5% to £208.7
million (2015: £205.6 million). Profit before
tax and amortisation rose by 11.4% to £29.8
million (2015: £26.8 million) with PBTA
margins increasing to 14% (2015: 13%). The
return on average capital employed improved
on prior year to 16.3% (2015: 16.2%).Group Finance Director: Allison Bainbridge
EARNINGS PER SHARE, DIVIDEND AND SHARESBasic earnings per share before the amortisation of intangibles increased from 54.45 pence to 62.21 pence, an increase of 14%.
Basic earnings per share after the amortisation of intangibles was 57.49 pence (2015: 51.03 pence).
It is proposed to increase the final dividend to 13.5 pence per share. If approved, the full year dividend would be increased by
2.35 pence (14%) to 18.85 pence with a dividend cover of 3.3 times (2015: 3.3 times) based on earnings per share before
amortisation. The final dividend will be paid on 2 August 2016 to all shareholders on the register on 8 July 2016. At March 2016,
40.2 million shares were in issue of which 1.1 million shares were held by the Employee Trust. The average number of shares in
issue during the year was 38.9 million (2015: 38.9 million) after adjusting for shares held by the Employee Trust.
BALANCE SHEETNet assets increased by £9.6 million to £121.4 million representing net assets per share of 302 pence (2015: 278 pence).
The Group’s balance sheet is summarised below:
Property, plant and equipment increased by
£19.4 million to £167.2 million. The movement
in the year mainly comprised; £52.0 million
(2015: £56.3 million) total capital expenditure
and £5.1 million from acquisitions, offset by
£27.4 million total depreciation and £10.9
million net book value of disposals. Rental
equipment at £147.2 million (2015: £131.6
million) accounts for 88% of property, plant
and equipment net book value. Expenditure on
equipment for hire was £45.9 million (2015:
£49.3 million) and depreciation of rental
equipment £24.7 million (2015: £22.4 million).
The Group carried forward £7.1 million (2015: £7.5 million) of intangible assets and £39.3 million (2015: £35.9 million) of
goodwill at 31 March 2016. The movement in the year reflects £5.3 million additions in respect of the acquisitions of Test &
Measurement Group Limited and Higher Access Limited, less amortisation and impairment of intangibles and goodwill of £2.3
million. Taking into account current and budgeted financial performance the Board remains satisfied with the carrying value of
these assets.
Debtor days reduced to 56 days compared to 58 days in the previous year. Gross trade debtors were £42.2 million at 31 March
2016 (2015: £41.2 million). Bad debt and credit note provisions totalled £3.8 million (2015: £5.0 million) equivalent to 9%
(2015: 12%) of gross debtors. The bad debt write off for the year ended 31 March 2016 as a percentage of total turnover was
0.4% (2015: 0.3%).
The Group’s defined benefit pension plan has a surplus of £1.5 million which is recorded as an asset on the balance sheet.
As at As at31 March 2016 31 March 2015
£'million £'million
Property, plant and equipment 167.2 147.8
Intangible assets / goodwill 46.4 43.4
Working capital (2.3) (9.3)
Pension asset 1.5 1.1
Deferred tax liability (5.3) (4.4)
Net debt (86.1) (66.8)
Net assets 121.4 111.8

Vp plc Annual Report and Accounts 2016 www.vpplc.com19
Strategic ReportGovernance
Financial Statements
Shareholder Information
Financial Review
CAPITAL STRUCTURE AND TREASURYThe Group finances its operations through a combination of shareholders’ funds, bank borrowings, finance leases and operating
leases. The capital structure is monitored using the gearing ratio quoted above. The Group’s funding requirements are largely
driven by capital expenditure and acquisition activity. As at 31 March 2016 the Group had £95 million (2015: £85 million) of
committed revolving credit facilities comprising: a £45 million three year facility expiring May 2020, a £30 million four and a
half year facility expiring in October 2017 and a £20 million facility also expiring in October 2017. On 11 April 2016 the Group
took out an additional facility of £20 million which expires May 2020 by making use of the step up facility. The Group therefore
now has committed facilities of £115 million, an uncommitted step up facility of £5 million and an overdraft facility of £5
million (2015: £5 million). These facilities are with Lloyds Bank plc and HSBC Bank plc. Borrowings under the Group’s bank
facilities are priced on the basis of LIBOR plus a margin, the interest rate margin is linked to the net debt to EBITDA leverage of
the Group.
The Group has exposure to movements in interest rates on its borrowings, which is managed by maintaining a mix of fixed
and floating interest rates. The Group has eight interest rate swaps held to hedge the risk of exposure to changes in interest
rates, these swaps have fixed interest rates net of bank margin at between 0.98% and 1.40% and are detailed in note 15 on
page 78 of the accounts. In the year ended 31 March 2016, the fixed element of borrowings was £33.0 million or 41% of
average net debt for the year.
After adjusting for movements in capital
creditors of £1.8 million, cash flows in respect
of capital expenditure were £50.2 million
(2015: £52.9 million).
Proceeds from disposal of assets amounted to
£17.2 million (2015: £12.0 million), producing
a profit on disposal of £6.2 million (2015: £3.3
million). This level of profit on disposal is
higher than the historical experience due to a
combination of asset management and one off
items. The margin on profit on sale from
disposals of fleet assets at 36% (2015: 27%)
reflects prudent depreciation policies and
strong asset management.
Net interest expense for the year totalled £2.1
million (2015: £2.0 million). Interest cover before
amortisation was 15.2 times (2015: 14.2 times)
and Net Debt/EBITDA was 1.45 (2015: 1.24), both comfortably within our banking covenants of greater than 3 times and lower
than 2.5 times respectively. Gearing calculated as net debt divided by total equity was 71% (2015: 60%).
In November 2015 the Group acquired the entire share capital of Test and Measurement Group Limited for consideration of £4.0
million and in February 2016 we also acquired the entire share capital of Higher Access Limited for £4.1 million. The cash cost of
these acquisitions was £7.1 million after adjusting for cash acquired with the businesses. The acquisition of Higher Access Limited
included the assumption of finance lease liabilities which have increased net debt.
Dividend payments to shareholders totalled £6.6 million (2015: £6.0 million), and cash investment in own shares on behalf of
the Employee Benefit Trust (EBT) during the year was £10.6 million (2015: £11.1 million).
2016 2015£'million £'million
EBITDA 59.3 53.8
Cash generated from operations 47.9 54.5
Capital expenditure (50.2) (52.9)
Proceeds from disposals 17.2 12.0
Interest and tax (6.9) (4.9)
Dividends (6.6) (6.0)
Acquisitions (7.1) (5.4)
Other (EBT shares) (10.5) (11.1)
Cash movement (16.2) (13.8)
Finance leases acquired (3.1) -
Change in net debt (19.3) (13.8)
CASH FLOWS AND NET DEBTThe Group continues to generate strong cash flows and EBITDA totalled £59.3 million (2015: £53.8 million). After funding
significant capital expenditure and acquisitions, net debt increased by £19.3 million from £66.8 million at 31 March 2015 to
£86.1 million at 31 March 2016. The Group’s cash flow is summarised below:

Vp plc Annual Report and Accounts 2016 www.vpplc.com20
Financial Review
The Group is exposed to movements in exchange rates for both foreign currency transactions and the translation of net assets
and income statements of foreign subsidiaries. The Group regards its interests in overseas subsidiary companies as long term
investments and manages its translational exposures through the currency matching of assets and liabilities where possible.
The matching is reviewed regularly with appropriate risk mitigation performed, where necessary. The Group has exposure to a
number of foreign currencies. During the year the Group had twelve foreign exchange hedges to reduce the risk of rate
fluctuations between US dollars and Sterling in the year ended 31 March 2016. It also has a further nine foreign exchange
hedges between US dollars and Sterling covering the period from 1 April 2016 to 30 June 2017. In addition to the US dollar
hedges the Group also had Australian dollar and Singapore dollar hedges in the year.
TAXATION The overall tax charge on profit before tax was £5.1 million (2015: £5.2 million), an effective rate of 18.6% (2015: 20.8%).
The current year tax charge was increased by £15,000 (2015: £36,000 increase) in respect of adjustments relating to prior
years. The underlying tax rate was 18.5% (2015: 20.7%) before prior year adjustments. The effective tax rate was also reduced
by 1.3% (£0.3 million) as a result of a reduction in the deferred tax liability due to the reduction in the future standard tax rate
in the UK to 19%. This reflects the reduction in the rate to 19% for the year ended 31 March 2018, but does not reflect the
expected further reduction to 17% in the year ended 31 March 2021 as it is deemed that a significant proportion of the
deferred tax balance as at 31 March 2016 will reverse before 31 March 2020. A more detailed reconciliation of factors affecting
the tax charge is shown in note 7 to the Financial Statements.
SHARE PRICEDuring the year the Company’s share price increased by 0.15% from 659 pence to 660 pence, compared to a 3% increase in
the FTSE small cap index excluding investment trusts. The Company’s shares ranged in price from 640 pence to 816 pence and
averaged 720 pence during the year.
Allison Bainbridge
Group Finance Director
7 June 2016
Vp plc Annual Report and Accounts 2016 www.vpplc.com21
Strategic ReportGovernance
Financial Statements
Shareholder Information
Viability Statement
The Directors have assessed the viability of the Group up to 31 March 2018.
The directors have assessed the prospects of the Group in accordance with provision C.2.2 of the UK Corporate Governance
Code 2014 with reference to the Group’s current position, its strategy, risk appetite, and the potential impact of the principal
risks and how these are managed. During the financial year the Group has developed regular reporting of the lead indicators
relating to the principal risks.
The assessment of the Group’s prospects by the Directors covers the two years to 31 March 2018 and is underpinned by
management’s 2016 - 2018 business plan which includes projections of the Group’s profit performance, cash flow, investment
plans and returns to shareholders.
The forecasts have been subject to sensitivity analysis, involving the flexing of key assumptions reflecting severe but plausible
scenarios. A range of scenarios have been modelled to reflect changing circumstances with respect to the principal risks facing
the Group together with the likely effectiveness of mitigating actions that would be executed by the Directors. These scenarios
include consideration of the impact of a downturn in economic activity, the loss of market share and the crystallisation of a
financial risk.
Based on this assessment, the Directors have a reasonable expectation that the Group will be able to continue in operation
and meet its liabilities as they fall due over the two year assessment period.
The Board is responsible for determining the level and nature of risks it is appropriate totake in delivering the Group’s objectives, and for creating the Group’s risk managementframework. The Board recognises that good risk management aids effective decision makingand helps ensure that risks taken on by the Group are adequately assessed and challenged.
RISK ASSESSMENT
During the year the Board continued to develop the Group’s risk management framework. Our approach identifies risks arising
in all parts of the Group, using both a top down and a bottom up approach. Once identified, the impact and probability of risks
are determined and scored on both a gross (before mitigation) and net (after mitigation) basis. These risk scores are
documented in risk registers which are maintained at a divisional and group level. The risk registers change as new risks
emerge and others diminish. Risk registers are subject to ongoing review based upon business activity.
The risk profile for each division is used to determine the programme of work carried out by Internal Audit. The risk
assessments are captured in consistent reporting formats, enabling Internal Audit to consolidate the risk information and
summarise the key risk in the form of a group risk profile. Mitigation action plans against each risk continue to be monitored
on a regular basis. Further information is provided on pages 22 and 23 in our principal risks and uncertainties section along
side the mitigating activities to address them.
Risk Management

Vp plc Annual Report and Accounts 2016 www.vpplc.com22
Risk Management
Our risk reporting framework is set out below:
Internal Auditl Risk based programme of internal audit project workl Compliance testing and assurancel Production of KPI data on the Group’s key risksl Maintenance of Group Risk Registerl High level risk review (strategic, reputational, fraud
and loss)
▲
▲ Divisional Boardsl Determine appropriate control procedures are in placel Review performance against budget and forecastsl Identify, mitigate, monitor and review risks
Audit Committeel Monitors the integrity of the Group’s financial reporting
processl Approves the annual audit programmel Reviews the work of Internal Auditl Reviews the effectiveness of internal controlsl Monitors the statutory audit
▲
Principal Risks and Uncertainties
RISK DESCRIPTION
Market riskA downturn in economic recoverycould result in worse than expectedperformance of the business, due tolower activity levels or prices.
Vp provides products and services to a diverse range ofmarkets with increasing geographic spread. The Groupregularly monitors economic conditions and ourinvestment in fleet can be flexed with market demand.
MITIGATION CHANGE FROM 2015
➜
CompetitionThe equipment rental market isalready competitive and couldbecome more so, impacting marketshare, revenues and margins.
Vp aims to provide a first class service to its customersand maintains significant market presence in a range ofspecialist niche sectors. The Group monitors marketshare, market conditions and competitor performanceand has the financial strength to maximiseopportunities.
➜
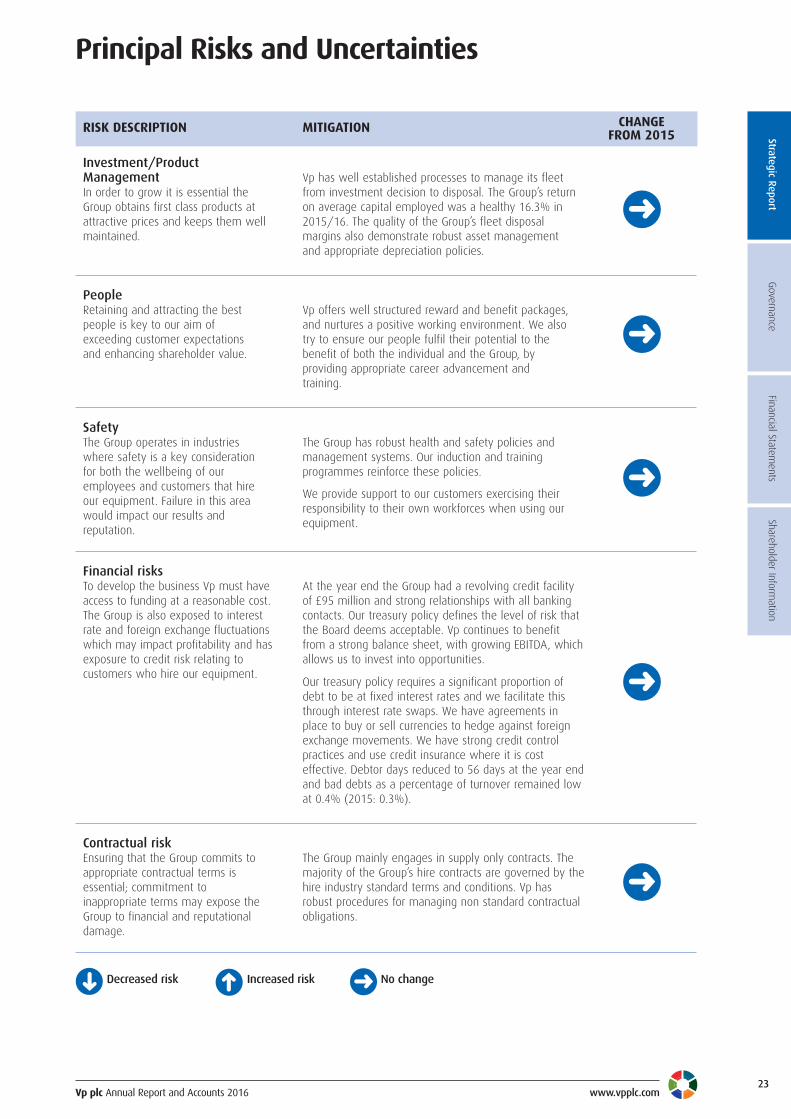
The Directors carry out a robust assessment of the principal risks facing the Group and haveimplemented lead indicator reporting on these risks. The principal risks in the current riskregister are:
Boardl Sets the Group strategyl Establishes risk appetite and the policy to reduce riskl Ensures appropriate financial and operational controls
are in placel Regularly monitors Group risks using lead indicators
Vp plc Annual Report and Accounts 2016 www.vpplc.com
Strategic ReportGovernance
Financial Statements
Shareholder Information
23
Principal Risks and Uncertainties
RISK DESCRIPTION MITIGATION CHANGE FROM 2015
➜
Investment/ProductManagementIn order to grow it is essential theGroup obtains first class products atattractive prices and keeps them wellmaintained.
Vp has well established processes to manage its fleetfrom investment decision to disposal. The Group’s returnon average capital employed was a healthy 16.3% in2015/16. The quality of the Group’s fleet disposalmargins also demonstrate robust asset managementand appropriate depreciation policies.
➜
PeopleRetaining and attracting the bestpeople is key to our aim ofexceeding customer expectationsand enhancing shareholder value.
Vp offers well structured reward and benefit packages,and nurtures a positive working environment. We alsotry to ensure our people fulfil their potential to thebenefit of both the individual and the Group, byproviding appropriate career advancement andtraining.
➜
SafetyThe Group operates in industrieswhere safety is a key considerationfor both the wellbeing of ouremployees and customers that hireour equipment. Failure in this areawould impact our results andreputation.
The Group has robust health and safety policies andmanagement systems. Our induction and trainingprogrammes reinforce these policies.
We provide support to our customers exercising theirresponsibility to their own workforces when using ourequipment.
➜
Financial risksTo develop the business Vp must haveaccess to funding at a reasonable cost.The Group is also exposed to interestrate and foreign exchange fluctuationswhich may impact profitability and hasexposure to credit risk relating tocustomers who hire our equipment.
At the year end the Group had a revolving credit facilityof £95 million and strong relationships with all bankingcontacts. Our treasury policy defines the level of risk thatthe Board deems acceptable. Vp continues to benefitfrom a strong balance sheet, with growing EBITDA, whichallows us to invest into opportunities.
Our treasury policy requires a significant proportion ofdebt to be at fixed interest rates and we facilitate thisthrough interest rate swaps. We have agreements inplace to buy or sell currencies to hedge against foreignexchange movements. We have strong credit controlpractices and use credit insurance where it is costeffective. Debtor days reduced to 56 days at the year endand bad debts as a percentage of turnover remained lowat 0.4% (2015: 0.3%).
➜
➜
Decreased risk ➜ Increased risk ➜ No change
Contractual riskEnsuring that the Group commits toappropriate contractual terms isessential; commitment toinappropriate terms may expose theGroup to financial and reputationaldamage.
The Group mainly engages in supply only contracts. Themajority of the Group’s hire contracts are governed by thehire industry standard terms and conditions. Vp hasrobust procedures for managing non standard contractualobligations.

Vp plc Annual Report and Accounts 2016 www.vpplc.com24
Corporate and Social Responsibility
OVERVIEWThe Group has always conducted its business responsibly and ethically. Corporate and social responsibility forms an integral partof our business strategy and is focussed on our people, health and safety, the environment and our communities.
OUR PEOPLE
Recruitment
Our continued business success is reliant upon the skills, talent and commitment of our global workforce. Retaining and attractingthe best people supports our aims of exceeding our customers’ expectations and enhancing shareholder value. We continue toattract new talent to the Group as well as nurturing and promoting talent from within the business.
Vp recognises the need to train the engineers of the futureand has successfully operated apprentice schemes for manyyears. We work closely with the Construction Industry TrainingBoard to recruit and support our apprentices in a two-yearLevel 2 Apprenticeship in Plant Maintenance. They thenprogress onto a Level 3 Advanced Apprenticeship which takesa further year.
We currently have 39 apprentices across the UK, 16 arecompleting their first year, 13 are completing their secondyear and 10 will complete their apprenticeships this year.We are recruiting a further 16 apprentices to start inSeptember 2016.
Katie Long (pictured) from our UK Forks business won BestApprentice under 25 at the 2015 Women in Constructionawards. The awards are now in their tenth year of providing ashowcase for the brightest and the best female achievers inthe construction industry. Katie has almost completed herLevel 2 NVQ in Plant Maintenance and will start theAdvanced Level 3 in September 2016.
Our People– recruitment
– retention
– opportunity
Our Communities– investments
– people initiatives
– energy andresource efficiency
Health & Safety– initiatives
– monitoring
– training– mandatory greenhousegas reporting
Environment

Vp plc Annual Report and Accounts 2016 www.vpplc.com
Strategic ReportGovernance
Financial Statements
Shareholder Information
25
Corporate and Social Responsibility
Workforce by gender Male Female Female %
Board of directors 4 1 20
Senior management 37 8 18
All employees 1,599 306 16
One of our businesses, Groundforce, runs an engineering undergraduate placement programme in partnership with localuniversities. This initiative has become a pivotal factor in attracting the highest calibre graduates. The programme is anexcellent way of blending education with professional experience, as well as helping to forge closer links with localuniversities. One of our placement students, Steven Taylor, was awarded “Outstanding Performance on Placement 2014/15”.He has now been offered a position with us and we will continue to support him in his final two years of his engineeringdegree.
The Group is an equal opportunity employer committed to providing the same level of opportunity to all, regardless of creed,colour, age, sex, disability or sexual orientation. We recognise that a diverse workforce promotes innovation and businesssuccess. The rental industry traditionally has more men than women employees; however women are represented at all levelsof our organisation, including the board.
Retention
Retaining talented people is vital to our continued success.
We aim to make the Group an employer of choice who maintains a good relationship with its employees. We take our duty ofcare to our employees seriously; we encourage them to achieve an appropriate work life balance and we provide access toconfidential advice and support on personal issues such as health and financial problems.
Employee share ownership is encouraged and where practical the Group offers the opportunity to participate in share schemes.At 31 March 2016, approximately 48% (2015: 41%) of our UK employees were participating in the Save As You Earn Scheme.
A major contributory factor in our success in delivering operational excellence and outstanding customer service is thecontinuity provided by long service which is recognised and celebrated by the business. As a group, over 46% of ouremployees have in excess of five years’ service and a further 21% have more than ten years’ service. We aim to keepemployee turnover as low as possible. In general the rental industry suffers from fairly high staff turnover within certain roles,particularly within the first year. Our employee turnover was 19% in the year (2015: 18%).
We operate extensive training programmes which commence with a detailed induction programme and then progress to coverall technical skills that our employees require to carry out their roles. Management development programmes are run for allindividuals new to management roles and we actively encourage and sponsor individuals to develop themselves throughfurther education programmes.
Human Rights
At Vp, we believe in the rights of individuals and take our responsibilities seriously with regard to all our employees, as well asthose who may be affected by our activities. We have policies in place, such as our whistle blowing procedure which protectsour employees. These policies are embedded in our day to day operations and therefore whilst we do not manage humanrights matters separately we continue to assess potential risks in this area and we rate the risk in our business as low.
Modern Slavery Act 2015
Vp fully supports the Modern Slavery Act 2015. Vp plc is a specialist rental business with the majority of our activity takingplace in the UK. The Group does not tolerate any slavery or human trafficking within its business operations and we expect allthose in our supply chain to comply with our values. Our procurement activities are aligned to our company values and to thelaws of the countries in which we operate. We take a risk based approach regarding our supply chain; where possible we buildlongstanding relationships with our suppliers and make clear our expectations of behaviour and we have systems in place toencourage the reporting of concerns. In the small number of instances where we assess the risk to be relatively high we carryout checks to ensure compliance with stated policies and procedures.

Vp plc Annual Report and Accounts 2016 www.vpplc.com26
Corporate and Social Responsibility
Our continued focus on promoting and developing asafe place to work has ensured Health & Safety isgenuinely embedded into our culture. Hire Station wasrecently recognised as the “SafeHire Company of theyear 2016” at the Hire Association Europe Awards. Theaward recognised that innovation and compliance areat the core of everything we do. Key initiatives in thepast twelve months included the opening of LiftingCentres of Excellence at locations countrywide. Thesecentres focus on specialist lifting and materialhandling equipment and have been set up with thenecessary testing equipment to ensure compliancewith the Lifting Operations and Lifting EquipmentRegulations 1998 legislation.
We ended the year with an Accident Frequency Rateof 0.12, an improvement on our 2015 rate of 0.26.The AFR is calculated by multiplying the number ofRIDDOR reportable accidents by 100,000 (the averagenumber of hours worked in a lifetime), divided by theoverall number of hours worked by all members ofstaff. Reportable accidents under the Reporting ofInjuries Disease and Dangerous Occurrences regulations 1995 fell to 4 in the year (2015: 9).
In 2015/16 in the excavation support
s
Several of the g
Hire Station was recently
r The award
r Key initiatives in the past
t These centres focus on specialist lifting and
m In addition to significant i
The Lifting Centres of Excellence
l
2016 2015 2014
Accident frequency rate 0.12 0.26 0.48
HEALTH & SAFETYA good reputation for health and safety is fundamental and a major selling point for our business. It is essential that weprovide equipment that is safe to use and that we ensure that accidents and dangerous occurrences are avoided.
General health and safety training is provided as part of the induction process for all new employees. In addition, roleappropriate health and safety training is also provided. Our policies and procedures are designed to ensure that the health andsafety of all our employees, customers and anyone else affected by our activities is appropriately safeguarded.
We are committed to improving and raising standards of health and safety within all our businesses and with our customers.In 2015/16 we were delighted when the General Manager of Groundforce Training Services, was awarded Chartered Member(CMIOSH) within The Institute of Occupational Safety and Health (IOSH), an internationally recognised and highly valued healthand safety qualification underlining our commitment to helping to ensure both our own and our customers’ workplace is safe,healthy and sustainable.
We also work to ensure that our transport operations are safe. Several of the Group’s divisions have been awarded FORS (FleetOperator Recognition Scheme) Bronze accreditation. The FORS standard represents a quality and performance benchmark basedon legal compliance, safety, environmental protection and operational efficiency and is further recognition that the Groupoperates to standards regarded as some of the highest in the industry. Hire Station is the only major hirer to hold thisaccreditation nationwide.

Vp plc Annual Report and Accounts 2016 www.vpplc.com
Strategic ReportGovernance
Financial Statements
Shareholder Information
27
Corporate and Social Responsibility
COMMUNITYWe aim to have a positive impact on the communities in which we operate.We actively encourage our teams to support their communities by providing theirtime and enthusiasm to raise money for local and national charities. In mostcases the monies raised by employees are matched by the Group.
During the year we donated over £41,000 (2015: £28,000) to charities. Thisincluded donations in support of employees participating in fund raising activities.
Alongside Group led events, our employees proactively support charities on anindividualised basis through participation in a host of demanding physicalchallenges, raising funds for the likes of Myeloma Cancer Research, Heart UK,Cancer Research UK, Marie Curie and many other local charities.
ESS Safeforce also teamed up with Gregg’s bakery charity group, The GreggsFoundation, to sponsor the launch of a new breakfast club at the OlympicAcademy Primary School in Wellingborough.
UK Forks provided the use of a 10m telehandler via their customer ISG, whichwas featured in the BBC 1 programme “DIY SOS: The Big Build Veterans’ Special”.The machine was used as part of a project to help transform 62 homes acrosstwo Manchester streets for military veterans and their families.
We have also i
The AFR is calculated by multiplying the number of RIDDOR
r
Reportable accidents under the Reporting of Injuries Disease and D (
(
(
We actively e
In most cases the monies r
This i
K
Throughout 2015 she took part in The Yorkshire Warrior, Y
The
(
(
(
(
(
(
(
(
(
(
(
(
Vp plc Annual Report and Accounts 2016 www.vpplc.com28
Corporate and Social Responsibility
ENVIRONMENT
We are aware of the impact our operations have on the environment and it is our policy to ensure that we minimise any
adverse impacts from our operations.
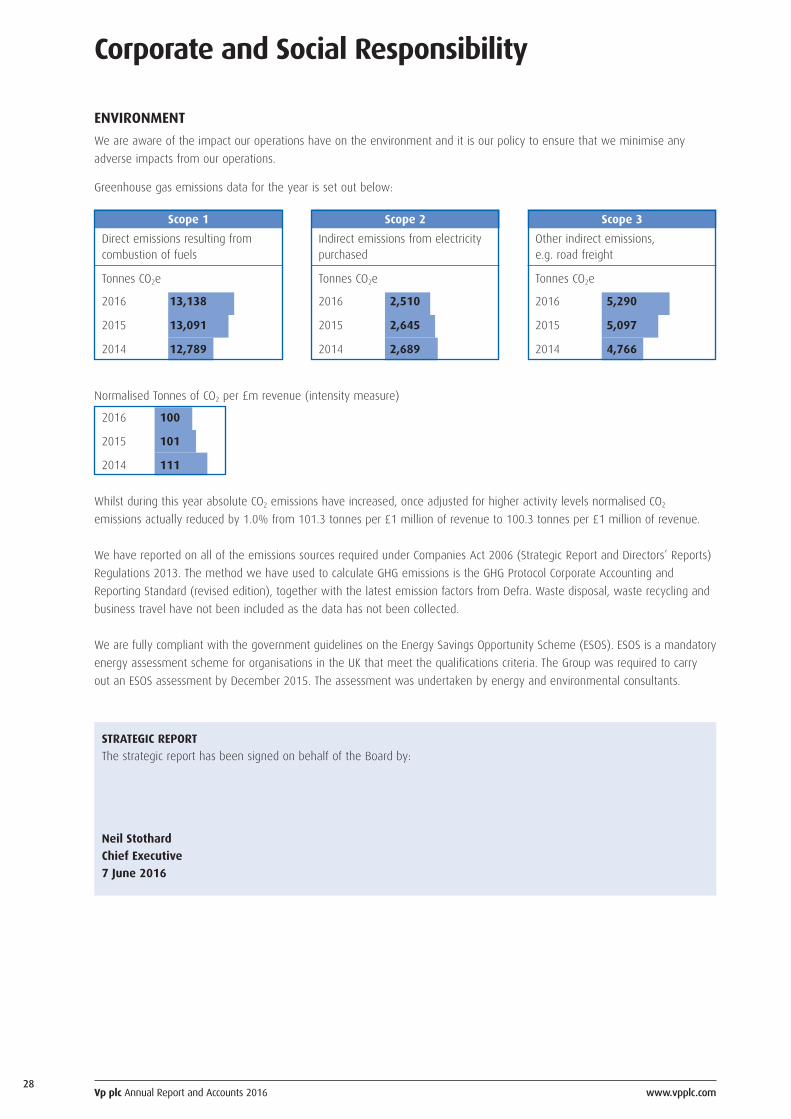
Greenhouse gas emissions data for the year is set out below:
STRATEGIC REPORT
The strategic report has been signed on behalf of the Board by:
Neil Stothard
Chief Executive
7 June 2016
Whilst during this year absolute CO2 emissions have increased, once adjusted for higher activity levels normalised CO2
emissions actually reduced by 1.0% from 101.3 tonnes per £1 million of revenue to 100.3 tonnes per £1 million of revenue.
We have reported on all of the emissions sources required under Companies Act 2006 (Strategic Report and Directors’ Reports)
Regulations 2013. The method we have used to calculate GHG emissions is the GHG Protocol Corporate Accounting and
Reporting Standard (revised edition), together with the latest emission factors from Defra. Waste disposal, waste recycling and
business travel have not been included as the data has not been collected.
We are fully compliant with the government guidelines on the Energy Savings Opportunity Scheme (ESOS). ESOS is a mandatory
energy assessment scheme for organisations in the UK that meet the qualifications criteria. The Group was required to carry
out an ESOS assessment by December 2015. The assessment was undertaken by energy and environmental consultants.
Scope 1
Direct emissions resulting fromcombustion of fuels
Tonnes CO2e
2016 13,138
2015 13,091
2014 12,789
Scope 2
Indirect emissions from electricitypurchased
Tonnes CO2e
2016 2,510
2015 2,645
2014 2,689
Scope 3
Other indirect emissions,e.g. road freight
Tonnes CO2e
2016 5,290
2015 5,097
2014 4,766
Normalised Tonnes of CO2 per £m revenue (intensity measure)
2016 100
2015 101
2014 111

Strategic ReportGovernance
Financial Statements
Shareholder Information
Vp plc Annual Report and Accounts 2016 www.vpplc.com29
The Board
Jeremy Pilkington BA (Hons)
Chairman
AppointmentAppointed to the board in 1979 andbecame Chairman in 1981.
ExperienceJeremy was Chairman and ChiefExecutive between 1981 and 2004.
Committee membershipChairman of the NominationCommittee.
Allison Bainbridge MA, FCA
Group Finance Director
AppointmentAppointed to the board as FinanceDirector in March 2011.
ExperienceAllison was previously Group FinanceDirector of Kelda Group Limited, theholding company of Yorkshire Waterand also Finance Director of YorkshireWater.
Committee membershipNone
Steve Rogers BSc, FCA, JPNon-executive Director
AppointmentAppointed to the board in October2008.
ExperienceSteve retired as a senior partner ofPricewaterhouseCoopers in 2007. He isa non-executive director of Arran IsleGroup (formerly Heywood WilliamsPlc). He is a trustee and treasurer ofthe Leeds Community Foundation.
Committee membershipChairman of the Audit Committee anda member of the Remuneration andNomination Committees.
Phil White BCom, FCA, CBE
Non-executive Director
AppointmentAppointed to the board in April 2013.
ExperiencePhil is a chartered accountant and hasextensive experience within bothlisted and private companies. He isChairman of Kier Group Plc, LookersPlc and Unite Group Plc as well as anon-executive director of StagecoachGroup Plc.
Committee membershipChairman of the RemunerationCommittee and member of the Auditand Nomination Committees.
Neil Stothard MA, FCA
Chief Executive
AppointmentAppointed to the board as FinanceDirector in 1997 and became GroupManaging Director in 2004 andsubsequently Chief Executive.
ExperienceNeil previously held Finance Directorroles in the business travel manage-ment and logistics sectors. He is a nonexecutive director of Wykeland GroupLimited and was previously a nonexecutive director of ScarboroughBuilding Society.
Committee membershipNone

Vp plc Annual Report and Accounts 2016 www.vpplc.com30
Governance
INTRODUCTION FROM THE CHAIRMAN
As a Board, we believe that good governance rests upon principles of fairness, integrity and respect for others. We believe
these principles underpin the long term success of the Company, helping us to deliver our strategic and growth objectives.
The Corporate Governance Report is set out on pages 30 to 33. This section of the annual report sets out how we manage the
Group and how we comply with the provisions of the UK Corporate Governance Code. Vp continues to maintain and review its
systems, processes and policies to support its governance practices.
I am pleased to report that we have complied with the provisions of the code. Our Statement of Compliance is set out below.
We are mindful of the ethical foundation of good governance and as a Board we are committed to acting responsibly and with
integrity towards all our stakeholders.
Jeremy Pilkington
Chairman
7 June 2016
CORPORATE GOVERNANCE
A review has been performed of the Company’s compliance with the code published by the Financial Reporting Council (’FRC’) in
September 2014 and which was effective for the year ends beginning on or after October 2014. We have also had regard to the FRC
guidance on Board Effectiveness (March 2011) and FRC guidance on Audit Committees (September 2012). The Board confirms that
throughout the year ended 31 March 2016 the Company has been in compliance with all of the provisions of the Codes. The following
paragraphs explain how the Company has applied good governance and the relevant principles of the Codes.
LEADERSHIP
The role of the Board is to provide entrepreneurial leadership of the Company, whilst maintaining good corporate governance,
highest standards of behaviour and managing risk. The Board reviews its progress against this objective on a regular basis. The
Board exercises control over the performance of each operating company within the Group, principally by monitoring performance
against agreed budgetary targets. The names and biographic details of the members of the board are set out on page 29.
Length of service of director
31 March 2016
One to two years -
Two to three years 1
Four to six years 1
More than six years 3
Balance of directors
31 March 2016
Gender
Male 4
Female 1
Balance of directors
31 March 2016
Role
Executive Chairman 1
Executives 2
Non executives 2

Strategic ReportGovernance
Financial Statements
Shareholder Information
Vp plc Annual Report and Accounts 2016 www.vpplc.com31
Governance
The Board has a clearly documented schedule of matters reserved for its approval, including strategy, annual budgets, major
capital expenditure, significant investments or disposals and treasury policy. In certain areas, specific responsibility is delegated
to committees of the Board within defined terms of reference.
The roles of the Chairman and Chief Executive are separate and clearly defined. The Chairman, Jeremy Pilkington, is responsible
for the effective working of the Board and leading the development of the strategic agenda for the Group. The Chairman is also
responsible for promoting a culture of openness and debate, in addition to ensuring constructive and productive relations
between executive and non-executive directors. Chief Executive, Neil Stothard, has operational responsibility for the
management of the Group’s business and for implementation of the strategy as agreed by the Board.
Our senior independent director, Steve Rogers, is available to shareholders if they request a meeting or have concerns which
contact through normal channels has failed to resolve. No such requests were received during the year.
EFFECTIVENESS
Committees
The board has established three principal Board committees to which it has delegated certain responsibilities. They are the
Audit Committee, Remuneration Committee and Nominations Committee. The roles, membership and activities of these
committees are described in more detail below.
Meetings
In the year ended 31 March 2016, the Board met seven times. In addition, the Board also met on an ad hoc basis to deal with
urgent business including the consideration and approval of major transactions. The table below lists the directors’ attendance
at the Board meetings and Committee meetings during the year ended 31 March 2016.
Whilst Jeremy Pilkington, Neil Stothard and Allison Bainbridge are not members of the Audit Committee, they did attend all
meetings; they also attended, in part, certain of the Remuneration Committee meetings. There were no nomination committee
meetings.
The non-executive directors provide a strong and independent monitor on the performance of both the Group and its executive
management.
The Board is satisfied that the Chairman and each of the non-executive directors committed sufficient time during the year to
enable them to fulfil their duties as directors of the company.
Board Audit Remuneration
Number of meetings held 7 3 2
Executive directors
Jeremy Pilkington 7 - -
Neil Stothard 7 - -
Allison Bainbridge 7 - -
Non-executive directors
Steve Rogers 7 3 2
Phil White 7 3 2

Vp plc Annual Report and Accounts 2016 www.vpplc.com32
Governance
Independence
The Board considers the non-executive directors to be independent under the provisions of the Codes on the basis that they are not
members of management and are free of any business or other relationships that could materially interfere with, or reasonably be
perceived to materially interfere with, the independent exercise of their judgement.
Appointments to the Board
The Nominations Committee is chaired by the Company’s Chairman, Jeremy Pilkington, with the two non-executive directors also on
the committee. The Nomination Committee meets as required to ensure that appointments to Board roles within the Group are made
after due consideration of the relevant and necessary skills, knowledge and experience of the potential candidates. In addition it
considers succession planning in order to ensure the continued ability of the Group to compete effectively in the market place. The
Group’s policy on diversity is set out on page 25 in the Strategic Report.
The Nominations Committee has written terms of reference, which are available on the Company’s website at www.vpplc.com
Induction, development and support
All new directors receive a full, formal and tailored induction on joining the Board, including meetings with senior
management and advisers and visits to the Group’s operational locations. The Board calendar is planned to ensure that
directors are briefed on a wide range of topics throughout the year and are given the opportunity to visit sites and discuss
aspects of the business with employees. The Board recognises the importance of continued training for the individual directors
and they are encouraged to attend external seminars and briefings appropriate to their role on the Board.
To enable the Board to function effectively and assist directors to discharge their responsibilities, full and timely access is given
to all relevant information. In the case of Board meetings, this consists of a comprehensive set of papers, including latest
available management accounts, regular business progress reports and discussion documents regarding specific matters. In
addition, senior managers are regularly invited to Board meetings and make business presentations to the Board. During Board
meetings, the non-executives routinely interrogate the performance of the business and seek further information as necessary
on specific topics.
Whilst the Board generally meets at the Group head office in Harrogate, some meetings are held at other Group locations
giving the directors the opportunity to review the operations and to meet local management. During the year two of the seven
board meetings was held at another Group location.
There is an agreed procedure for directors to take independent professional advice at the Company’s expense if deemed
necessary for the correct performance of their duties. The Company Secretary, Allison Bainbridge, who is also the Group Finance
Director, is available to all directors to provide advice and she is responsible for ensuring that Board procedures are followed
and that all applicable rules and regulations are complied with. The Board continues to keep the Company Secretary role under
review, but feels that the combination of the roles continues to work well for the business as a whole.
Performance evaluation
The evaluation of the Chairman, the Board and its committees in 2016 was conducted by way of a review completed by all of
the directors, the results of which were considered by the entire Board. Based upon this evaluation, the Board concluded that
performance in the past year had been good. The outcome of the evaluation will be used to make further improvements
where appropriate, to ensure the performance of the Board continues to be optimised.

Strategic ReportGovernance
Financial Statements
Shareholder Information
Vp plc Annual Report and Accounts 2016 www.vpplc.com33
Governance
Re-election
From 2015 all directors have retired at each Annual General Meeting (‘AGM’) and offer themselves for re-election by
shareholders. Accordingly, all the directors will retire at the AGM in July 2016 and their details are provided on page 29.
Accountability
The directors and auditor set out their respective responsibilities for preparing and reviewing the financial statements in the
statement of directors’ responsibilities on page 52 and the independent auditor’s report on pages 53 to 56.
RELATIONS WITH SHAREHOLDERS
The Board encourages engagement with major institutional shareholders and other stakeholders. The executive directors present
the Group’s interim and full year results to brokers and analysts and also meet fund managers, brokers, analysts and the media
on a regular basis to discuss business strategy, results and other issues. Presentation material used in these briefings is published
on the Company’s website www.vpplc.com
While the non-executive directors do not ordinarily attend these meetings, they are available if required by shareholders. Feedback
from these meetings, collated by N+1 Singer and Buchanan Communications, is reviewed by the Board as a whole.
The Board encourages all shareholders to attend and ask questions at the Annual General Meeting which is attended by all
directors. The Board also actively encourages communication with employees and details of this are noted in the Directors’
Report.

Vp plc Annual Report and Accounts 2016 www.vpplc.com34
Audit Committee Report
STATEMENT FROM STEVE ROGERS, CHAIRMAN OF THEAUDIT COMMITTEE
I am pleased to present our Audit Committee report for the year ended
31 March 2016. The Committee assists the Board in discharging its
responsibility for oversight and monitoring of financial reporting, risk
management and internal control.
In line with the Corporate Governance Code the Committee has
reviewed the Group’s financial reports and has advised the Board that it
considers the report to be fair, balanced and understandable, and
provides the information necessary for shareholders to assess the Company’s position, performance, business model and strategy.
As a Fellow of the Institute of Chartered Accountants in England and Wales, and a retired senior partner of
PricewaterhouseCoopers, I am considered to have relevant financial experience of sufficient depth to be able to perform my
role as Committee Chairman.
There were three committee meetings during the year which were all attended by the Committee members, and by invitation
the Chairman, Chief Executive, Group Finance Director and Head of Internal Audit. The Group Financial Controller and the
external auditor were invited to and attended two of these meetings.
RESPONSIBILITIES
The Audit Committee assists the Board in its oversight and monitoring of financial reporting, risk management and internal
controls.
The principal responsibilities are:
l review the financial statements (half yearly and annual reports) and announcements relating to the financial performance of
the Group;
l oversee the relationship with the external auditor, including the external audit process, audit and non audit fees and
independence and make recommendations to the Board on the appointment of the external auditor;
l review the Group’s internal financial controls and risk management systems and assess the effectiveness of those systems;
l monitor and review the effectiveness of the internal audit function;
l oversee the Group’s policies and procedures for handling allegations from whistle blowers.
FINANCIAL REPORTING
We reviewed the integrity of the half yearly and annual financial statements of the Group. This included discussions with
management and took account of the views of the external auditor. The key area reviewed was the existence and carrying
value of the rental fleet. Management carry out at least bi-annual stock checks on the existence of the rental fleet and review
the appropriateness of the useful lives and residual lives assigned to rental equipment. We are satisfied with the existence of
assets in the fleet and that the judgements taken are appropriate and consistent with prior years.
EXTERNAL AUDIT
The Committee oversees the Group’s relationship with the external auditor and formally reviews the relationship, policies and
procedures to ensure their independence. PwC were appointed as external auditors on 15 October 2014. The Committee
assessed the effectiveness of the external audit process during the year, based upon the Committee’s interactions with the
external auditor and through feedback from the Group Finance Team and Internal Audit. As a result the Committee has satisfied
itself that PwC continue to provide an effective audit service to the Company and its subsidiaries and the Committee has made
a recommendation to the Board that a resolution for the re-appointment of PwC be proposed at the AGM.
Steve Rogers

Strategic ReportGovernance
Financial Statements
Shareholder Information
Vp plc Annual Report and Accounts 2016 www.vpplc.com35
Audit Committee Report
The Group has policies and procedures in place to ensure that independence and objectivity of the external auditor is not
impaired. These include restrictions on the types of services that they can provide, in line with APB Ethical Standards on
Auditing. PwC also provides confirmation to the Committee on the arrangements and safeguards it has in place to maintain its
independence and objectivity. The Committee continues to be satisfied with their independence.
The total fees payable to PwC for the year ended 31 March 2016 (together with a comparison for the year ended 31 March
2015) can be found in note 3 to the consolidated financial statements. The non-audit services related to the half year review
and overseas accountants reports.
RISK MANAGEMENT AND INTERNAL CONTROLS
The Audit Committee has responsibility for reviewing risk management systems and the effectiveness of these systems. The
responsibilities and processes in respect of risk management are described in detail on pages 21 and 22.
There is in place an ongoing process for identifying, evaluating and managing significant risks faced by the Group. This process
is regularly reviewed by the Board. Risk Management Reports, prepared by the operating divisions supported by Internal
Audit, were submitted to the Committee at its meeting in July 2015. The Reports identified the significant risks to the Group,
highlighted controls that mitigate the risks and the resultant post-mitigation risk. The Committee also considered the tolerance
levels (risk appetite) that the Group is prepared to accept.
During the year the Committee monitored and reviewed the effectiveness of the Group’s internal control systems, accounting
policies and practices, risk management procedures and compliance controls.
The Group’s internal control systems are designed to manage rather than eliminate business risk. They provide reasonable but
not absolute assurance against material mis-statement or loss. Such systems are necessary to safeguard shareholders’
investment and the Group’s assets and depend on regular evaluation of the extent of the risks to which the Group is exposed.
Management is responsible for establishing and maintaining adequate internal control over financial reporting to the Group.
The Committee is of the view that the Group continues to operate a well-designed system of internal control.
INTERNAL AUDIT
The Group’s internal audit function comprises a team of three qualified auditors. The purpose of the department is to support
the business in its achievement of objectives and facilitate and aid effective risk management. Internal audit provides
assurance that the Group’s process for managing internal control is effective and appropriate to the level of risk facing the
Group.
During the year the Chairman of the Committee met privately with the Head of Internal Audit on two occasions. In addition
the Head of Internal Audit attended each Committee meeting, where his reports were reviewed and discussed in detail.
The Committee considered the results of the internal audits and the adequacy of management’s response to matters raised in
them, including the time taken to resolve any such matters. The Committee were satisfied with both the reports and the
responses.
WHISTLE BLOWING
The Group has a formal whistle blowing process, whereby any employee may contact nominated members of senior
management to raise concerns they may have in complete anonymity. These concerns will then be investigated
independently and the results shared with the whistle blower for further discussion if necessary. This process is communicated
to all employees and details are available on the Group intranet. The Committee monitors the Group’s whistle blowing policy.
At the 2016 AGM, I shall be available to respond to any questions shareholders may raise on this report or on any of the
Audit Committee’s activities.
Steve RogersChairman of the Audit Committee7 June 2016

Vp plc Annual Report and Accounts 2016 www.vpplc.com36
Remuneration ReportAnnual Statement
DEAR SHAREHOLDER
On behalf of the Board, I am pleased to present our Directors’
Remuneration Report for the year ended 31 March 2016. This has been
prepared in accordance with the requirements of the Companies Act 2006
and the Large and Medium-sized Companies and Groups (Accounts and
Reports) (Amendment) Regulations 2013.
REMUNERATION POLICY AND IMPLEMENTATION 2015/16
As set out in the annual report on remuneration, the Group has continued to perform well against our key simple and
transparent measures of growth in profit before tax and amortisation and earnings per share (EPS), whilst continuing to exceed
our minimum return on average capital employed (ROACE) target of 12%. 2015/16 ROACE was a very satisfactory 16.3%. Our
bonus and long-term incentive structures are based on challenging targets, which we believe are in line with market best
practice. The Committee believes that the current year pay outcomes reflect the current year’s performance.
In 2015/16 profit before taxation and amortisation at £29.8 million grew by 11% on the previous year. Consequently,
executive directors will qualify for bonuses of 27% of base salary, out of a maximum of 100%, in line with the profit growth
achieved by the Group against the challenging targets we set as a business.
Our 2012 LTIP award which was based upon EPS growth, vested in July 2015 at 100% of the total award reflecting the
excellent financial performance of the Group in the challenging market conditions of 2012 to 2015. Our 2013 LTIP award is due
to vest at 100% in July 2016, again as a result of strong compound annual growth performance in EPS of 20% per annum
between 2013 and 2016 (calculated using fixed assumptions on tax rate and number of shares in issue).
REMUNERATION POLICY FOR 2016/17
The Committee is not proposing to make any changes to the Remuneration Policy for the year ending 31 March 2017.
The Remuneration Policy is set out overleaf. A review of Executive Directors base salaries was carried out during the year.
The increases effective from 1 April 2016 are set out on page 45. The annual bonus scheme for 2016/17 will operate in a
similar manner to prior years, with financial targets linked to profitability. The maximum bonus opportunity is 100% of salary.
The performance conditions for the 2016/17 LTIP awards will be consistent with 2015/16 policy and will be based upon
achievement of target growth in EPS over a three year period and the achievement of a minimum ROACE. The policy allows for
awards equating to 100% of base salary to be granted to Executive Directors in July 2016.
ALIGNMENT WITH SHAREHOLDERS
We continue to be mindful of our shareholders’ interests. Our share ownership guidelines and claw back provisions for the
annual bonus and long term incentive scheme support an on-going commitment to the business from our executives and
continued alignment of shareholder and executive objectives.
We are proud of the support we have received in the past from our shareholders, with 98.3% approval for our Remuneration
Policy in 2014 and 99.5% approval for our Remuneration Report last year. The Directors’ Remuneration Policy is not subject to a
shareholder vote this year but has been reproduced on the following pages for ease of reference. However, a resolution to
approve the Annual Report on Remuneration will be proposed at the forthcoming AGM on 26 July 2016. We hope that we will
continue to receive your support.
This report has been approved by the Board and is signed on its behalf by:
Phil White
Chairman Remuneration Committee
7 June 2016
Phil White

Strategic ReportGovernance
Financial Statements
Shareholder Information
Vp plc Annual Report and Accounts 2016 www.vpplc.com37
Directors’ Remuneration Policy (unaudited)
ELEMENT
Base salary None.To attract, retain and motivateindividuals with skills andexperience required to deliverthe strategy. To provide acompetitive fixed reward.
PURPOSE AND LINKTO THE STRATEGY
PERFORMANCEMETRICS
Base salaries are reviewedannually, and any changes areeffective from 1 April in thefinancial year.
OPERATION
There is no prescribed maximumannual increase. The Committeealso considers average increasesacross the Group. Current salarylevels are set out on page 45.
Pension None.To provide retirement benefits. All executives are eithermembers of a definedcontribution scheme or receivea cash allowance in lieu ofpension contribution.
The executive chairman receivesa cash equivalent pensioncontribution of 25% of salary,benefits and bonus.
Other executive directors receivea pension contribution rangingbetween 15% and 17.5% ofbase salary or an equivalentcash allowance.
OPPORTUNITY
Taxable Benefits
None.To provide market consistentbenefits.
Cost of providing benefits paidmonthly or as required for oneoff events.
Car allowance, health insuranceand other benefits paid fromtime to time.
Consistent with current legislation, the directors’ Remuneration Policy Report, which has operated from 1 April 2014,
was put to a binding shareholder vote and was approved and became formally effective at the 2014 AGM.
POLICY OVERVIEW
The Group aims to balance the need to attract, retain and motivate executive directors of an appropriate calibre with the need to
be cost effective, whilst at the same time rewarding exceptional performance. The Committee has designed a remuneration policy
that balances those factors, taking account of prevailing best practice, investor expectations and the level of remuneration and pay
awards made generally to employees of the Group.
In addition to the above, the remuneration policy for the executive directors is based on the following key principles:
l A significant proportion of remuneration should be tied to the achievement of specific and stretching performance conditions
that align remuneration with the creation of shareholder value and the delivery of the Group’s strategic plan.
l There should be a focus on sustained long term performance measured over clearly specified timescales, encouraging
executives to take action in line with the Group’s strategic plan.
l Individuals should be rewarded for success but steps should be taken, within contractual obligations, to prevent rewards for
failure.
SUMMARY REMUNERATION POLICY
The table below summarises the directors’ Remuneration Policy for 2014 onwards:

Vp plc Annual Report and Accounts 2016 www.vpplc.com38
Directors’ Remuneration Policy (unaudited)
Notes to the policy tableThe performance targets are determined annually by the Committee and are set at a challenging level. The Committee is of theopinion that the performance targets for the annual bonus and the long term incentive are commercially sensitive and that itwould be detrimental to the interests of the Group to disclose them before the start of the financial year. The targets will bediscussed after the end of the relevant financial year in that year’s remuneration report.
ELEMENT
Annual Bonus Growth in profitbefore tax andamortisation.
To incentivise achievement ofdemanding performance targets.
PURPOSE AND LINKTO THE STRATEGY
PERFORMANCEMETRICS
Annual bonuses are generally paidthree months after the end of thefinancial year to which they relate.
Clawback provisions apply in theevent of a material misstatementof the results.
OPERATION
Up to 100% of base salary.
OPPORTUNITY
Long TermIncentive Plan
Subject to a vestingperiod of three yearsand the achievementof target growth inEPS over a three yearperiod.
Minimum ROACErequirement, currentlyset at 12%.
To drive sustained long termperformance that supports thecreation of shareholder value.
Annual grant of nil cost optionswhich normally vest after 3 yearsbased on the achievement ofprofit targets, a minimum ROACErequirement and continual service.
Clawback provisions apply in theevent of a material misstatementof the results.
Normal grant limit of 100%of base salary.
ShareMatchingScheme
Achievement oftarget growth in EPSover a three yearperiod and aminimum ROACE,currently set at 12%.
To encourage share ownershipand alignment withshareholders.
Annual grant of nil cost options inproportion to the number ofshares purchased by an executivedirector from their own funds.
Clawback provisions apply in theevent of a material misstatementof the results.
Maximum award of sharesto the value of 10% ofsalary.
Save As You Earn
None.To encourage share participationin the entire workforce.
HMRC approved plan under whichregular monthly savings are madeover a 3 year period and can beused to fund the exercise of anoption whereby the exercise priceis discounted by up to 20%.
Maximum permitted savingsof £300 per month across allongoing share save contractsin line with currentlegislation.
ShareOwnershipGuidelines
None.To increase alignment betweenexecutives and shareholders.
Shareholding to be built up over 5years.
100% of salary for executivedirectors.
Non-ExecutiveDirector Fees
None.Reflects time commitments andresponsibilities and fees paid bysimilar sized companies.
Cash fees paid, reviewed on anannual basis.
No prescribed maximumannual increase.

Strategic ReportGovernance
Financial Statements
Shareholder Information
Vp plc Annual Report and Accounts 2016 www.vpplc.com39
Directors’ Remuneration Policy (unaudited)
CHANGES TO REMUNERATION POLICY
There have been no changes to the remuneration policy from that operating in 2014/15.
ILLUSTRATION OF APPLICATION OF REMUNERATION POLICY
The chart below illustrates the total remuneration for each executive director that could result from the proposed remuneration
policy in 2016/17 under three different performance scenarios.
Jeremy Pilkington
Minimum
On plan
Maximum
100%
60%
44%
Total £644
20%
28%
Total £1,174
28% Total £1,704
20%
Percentages/Amounts (£’000)
Basic salary, benefits and pension
Annual bonus
LTIP
Neil Stothard
Minimum
On plan
Maximum
100%
54%
37%
Total £429
22%
30%
Total £789
33% Total £1,148
24%
Percentages/Amounts (£’000)
Basic salary, benefits and pension
Annual bonus
LTIP and share matching
Allison Bainbridge
Minimum
On plan
Maximum
100%
54%
37%
Total £309
22%
30%
Total £577
33% Total £845
24%
Percentages/Amounts (£’000)
Basic salary, benefits and pension
Annual bonus
LTIP and share matching
The value of base salary for 2016/17 is set out in the Base Salary table on page 45.
The value of taxable benefits in 2016/17 is taken to be the value of taxable benefits received in 2015/16 as shown in the
single total figure of remuneration table set out on page 42. On plan performance assumes bonus payout of 50% of salary and
LTIP and share matching scheme vesting at 50% of maximum award. Maximum performance assumes 100% payout of all
incentives. Share price appreciation has not been included in the calculation.

Vp plc Annual Report and Accounts 2016 www.vpplc.com40
Directors’ Remuneration Policy (unaudited)
CONSIDERATION OF EMPLOYMENT CONDITIONS ELSEWHERE IN THE GROUP
Our approach to annual salary reviews is consistent across the Group, with consideration given to the level of experience,
responsibility, individual performance and salary levels in comparable companies.
Most employees are eligible to participate in an annual bonus scheme. The maximum opportunities available are based upon
the seniority and responsibility of the role with business area specific metrics incorporated where appropriate.
Senior managers can qualify to participate in the LTIP and share matching schemes. Performance conditions are consistent for
all participants, while award sizes vary by organisational level.
Employees can qualify to participate in approved and unapproved share option schemes whereby they are granted rights to
acquire shares at a predetermined price, which cannot be less than the midmarket price on the dealing day immediately
before the date of the award. Awards under these schemes are not granted to executive directors.
All UK employees are eligible to participate in the Company’s SAYE scheme on the same terms.
APPROACH TO RECRUITMENT
The Group operates in a highly competitive market. The Committee’s approach to remuneration on recruitment is to pay
sufficient to attract appropriate candidates to the role.
The package of a new executive director is likely to include the same elements, and be subject to similar constraints as those
of existing executive directors.
The Committee may make an award in respect of a new appointment to ‘buy out’ incentive arrangements forfeited on leaving
a previous employer on a like-for-like basis. In doing so, the Committee will consider relevant factors including time to vesting,
any performance conditions attached to these awards and the likelihood of those conditions being met. Any such ‘buy-out’
awards will typically be made under existing annual bonus and LTIP schemes, although in exceptional circumstances the
Committee may exercise discretion under Listing Rule 9.4.2R to make awards using a different structure. Any ‘buy-out’ awards
would have a fair value no higher than the awards forfeited.

Strategic ReportGovernance
Financial Statements
Shareholder Information
Vp plc Annual Report and Accounts 2016 www.vpplc.com41
Directors’ Remuneration Policy (unaudited)
DATE OF DIRECTORS’ SERVICE CONTRACTS OR LETTER OF APPOINTMENT
The service agreements of the executive directors are terminable by either the Company or the director on twelve months’
notice. The contracts contain no specific provision for compensation for loss of office, other than an obligation to pay salary and
benefits for any notice period waived by the company. Non-executive directors are appointed under letters of appointment that
may be terminated on six months notice. There were no other significant contracts with directors.
The terms and conditions of appointment of non-executive directors are available for inspection by any person at the
Company’s registered office during normal business hours and at the AGM.
APPROACH TO LEAVERS
The Company’s policy is to limit severance payments on termination to pre-established contractual arrangements. Such
contracts contain no specific provision for compensation for loss of office, other than an obligation to pay for any notice period
waived by the Company, where pay is defined as salary plus benefits only.
In the event an executive leaves for any reason, non vested LTIP and share matching awards will normally lapse.
The Committee retains discretion to alter these provisions on a case-by-case basis following a review of circumstances and to
ensure fairness for both shareholders and participants.
CONSIDERATION OF SHAREHOLDER VIEWS
The Committee considers shareholder feedback received at the AGM each year. This feedback, plus any feedback received
during other meetings, is then considered as part of the Group’s annual review of remuneration policy.
In addition, the Committee will seek to engage directly with major shareholders and their respective bodies should any
material changes be made to the remuneration policy.
Details of votes cast for and against the resolution to approve last year’s remuneration report are set out on page 48 of the
annual report on remuneration.
Director Date of service contract/letter of appointment
Jeremy Pilkington 10 June 2002
Neil Stothard 10 June 2002
Allison Bainbridge 15 February 2011
Steve Rogers 10 September 2008
Phil White 15 April 2013

Vp plc Annual Report and Accounts 2016 www.vpplc.com42
Annual Report on Remuneration
SINGLE TOTAL FIGURE OF REMUNERATION (audited)
The following table shows a single total figure of remuneration for the year ended 31 March 2016 together with the comparative
figures for 2015.
Salaries Taxable Pensions Annual LTIP Share Totaland fees benefits bonus matching
£000 £000 £000 £000 £000 £000 £000
Executive directors
Jeremy Pilkington2016 471 44 161 127 810 - 1,613
2015 464 44 243 464 1,044 - 2,259
Neil Stothard2016 336 26 59 91 578 59 1,149
2015 331 26 58 331 749 75 1,570
Allison Bainbridge2016 244 16 37 66 391 38 792
2015 240 16 36 240 503 50 1,085
Non-executive directors
Steve Rogers2016 38 - - - - - 38 2015 38 - - - - - 38
Phil White2016 38 - - - - - 38 2015 38 - - - - - 38
Maximum Growth in Growth in Actual Actual % Actual bonus(% of salary) PBTA required PBTA required growth of salary £000
for threshold for maximum in PBTA bonus bonus
Jeremy Pilkington 100 5 25 11 27 127
Neil Stothard 100 5 25 11 27 91
Allison Bainbridge 100 5 25 11 27 66
TAXABLE BENEFITS
Taxable benefits consist primarily of company car or car allowance and private health care insurance.
PENSION BENEFITS
Neil Stothard received 17.5% of base salary and Allison Bainbridge received 15% of base salary in lieu of pension contributions. Jeremy
Pilkington received 25% of salary, bonus and benefits in lieu of pension contributions.
ANNUAL BONUS PAYMENTS
The annual bonus outturn presented in the table was based on performance against growth in Group profit before tax and
amortisation targets as measured over the 2016 financial year.
No changes have been made to the maximum opportunity available under the 2016/17 bonus scheme.
% % % % % £000
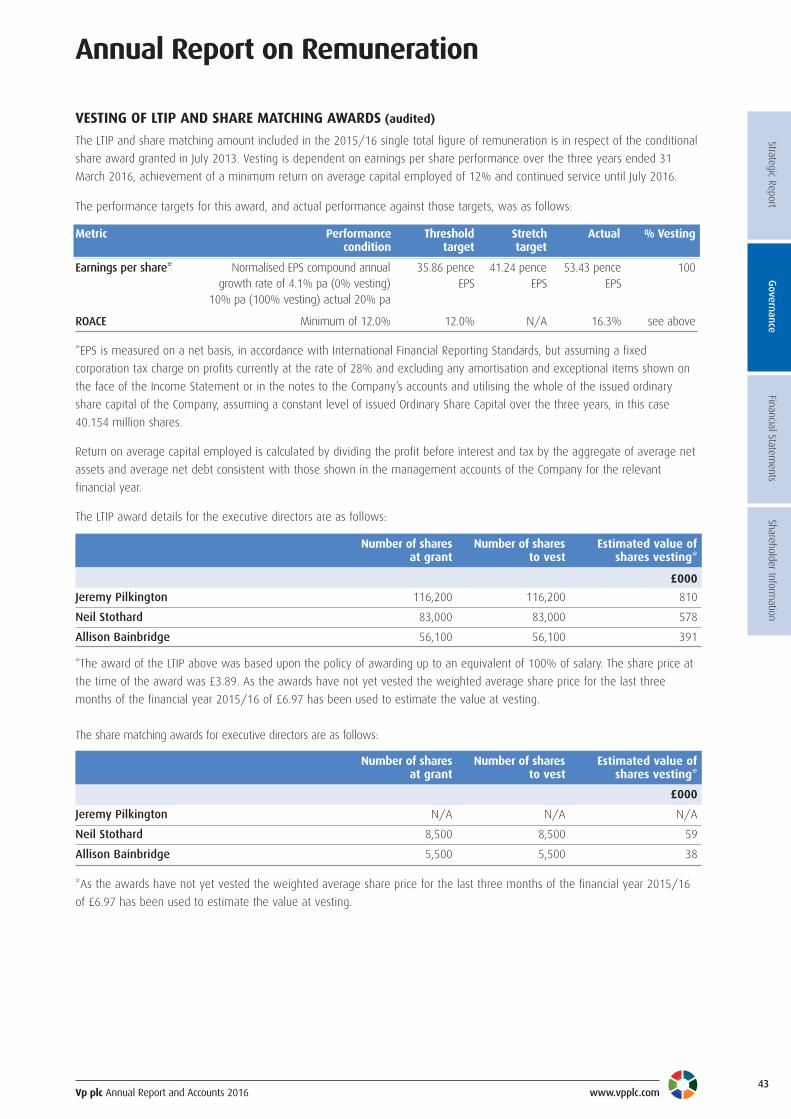
Strategic ReportGovernance
Financial Statements
Shareholder Information
Vp plc Annual Report and Accounts 2016 www.vpplc.com43
Annual Report on Remuneration
VESTING OF LTIP AND SHARE MATCHING AWARDS (audited)
The LTIP and share matching amount included in the 2015/16 single total figure of remuneration is in respect of the conditional
share award granted in July 2013. Vesting is dependent on earnings per share performance over the three years ended 31
March 2016, achievement of a minimum return on average capital employed of 12% and continued service until July 2016.
The performance targets for this award, and actual performance against those targets, was as follows:
Metric Performance Threshold Stretch Actual % Vestingcondition target target
Earnings per share* Normalised EPS compound annual 35.86 pence 41.24 pence 53.43 pence 100growth rate of 4.1% pa (0% vesting) EPS EPS EPS
10% pa (100% vesting) actual 20% pa
ROACE Minimum of 12.0% 12.0% N/A 16.3% see above
*EPS is measured on a net basis, in accordance with International Financial Reporting Standards, but assuming a fixed
corporation tax charge on profits currently at the rate of 28% and excluding any amortisation and exceptional items shown on
the face of the Income Statement or in the notes to the Company’s accounts and utilising the whole of the issued ordinary
share capital of the Company, assuming a constant level of issued Ordinary Share Capital over the three years, in this case
40.154 million shares.
Return on average capital employed is calculated by dividing the profit before interest and tax by the aggregate of average net
assets and average net debt consistent with those shown in the management accounts of the Company for the relevant
financial year.
The LTIP award details for the executive directors are as follows:
Number of shares Number of shares Estimated value ofat grant to vest shares vesting*
£000
Jeremy Pilkington 116,200 116,200 810
Neil Stothard 83,000 83,000 578
Allison Bainbridge 56,100 56,100 391
The share matching awards for executive directors are as follows:
Number of shares Number of shares Estimated value ofat grant to vest shares vesting*
£000
Jeremy Pilkington N/A N/A N/A
Neil Stothard 8,500 8,500 59
Allison Bainbridge 5,500 5,500 38
*The award of the LTIP above was based upon the policy of awarding up to an equivalent of 100% of salary. The share price at
the time of the award was £3.89. As the awards have not yet vested the weighted average share price for the last three
months of the financial year 2015/16 of £6.97 has been used to estimate the value at vesting.
*As the awards have not yet vested the weighted average share price for the last three months of the financial year 2015/16
of £6.97 has been used to estimate the value at vesting.

Vp plc Annual Report and Accounts 2016 www.vpplc.com44
Annual Report on Remuneration
SHARE SCHEME INTERESTS AWARDED DURING THE FINANCIAL YEAR (audited)
The following awards were granted to executive directors:
The share price at the date of grant has been used to calculate the face value of the awards granted.
PAYMENTS TO PAST DIRECTORS AND FOR LOSS OF OFFICENo payments were made to past directors or for loss of office in the year ended 31 March 2016.
OUTSTANDING SHARE AWARDS (audited)
The table below sets out details of outstanding share awards held by executive directors. Details of vested awards are shown in
the statement of directors’ shareholdings and share interests on page 45.
Executive Scheme Grant Exercise No. of Granted Vested Lapsed No. of Exercise End ofdate price shares at during during during shares at period performance
£ 31 Mar 2015 the year the year the year 31 Mar 2016 period
Jeremy Pilkington
Total LTIP Various Nil 524,400 61,100 166,000 - 311,500 July 2015 31 Mar 2015to July 2025 to 31 Mar 2018
Neil Stothard
Total LTIP Various Nil 250,700 43,600 119,000 - 175,300 July 2015 31 Mar 2015to July 2025 to 31 Mar 2018
Total Share Matching Various Nil 25,500 4,400 12,000 - 17,900 July 2015 31 Mar 2015to July 2025 to 31 Mar 2018
SAYE 2012 1.97 1,827 - 1,827 - - N/A
SAYE 2013 2.82 638 - - - 638 October 2016 N/Ato March 2017
SAYE 2014 5.30 679 - - - 679 October 2017 N/Ato March 2018
SAYE 2015 6.20 - 580 - - 580 October 2018 N/Ato March 2019
Total SAYE 3,144 580 1,827 - 1,897
Allison Bainbridge
Total LTIP Various Nil 171,400 31,600 80,000 - 123,000 July 2015 31 Mar 2015to July 2025 to 31 Mar 2018
Total Share Matching Various Nil 17,000 3,200 8,000 - 12,200 July 2015 31 Mar 2015to July 2025 to 31 Mar 2018
SAYE 2013 2.82 1,276 - - - 1,276 October 2016 N/Ato March 2017
SAYE 2014 5.30 679 - - - 679 October 2017 N/Ato March 2018
SAYE 2015 6.20 - 580 - - 580 October 2018 N/Ato March 2019
Total SAYE 1,955 580 - - 2,535
Executive Scheme Basis of award Date of Share price at Number of Face value Performancegranted grant date of grant £ shares £000 Period end date
Jeremy Pilkington
LTIP 100% of salary 9 July 2015 7.70 61,100 470 31 March 2018
Neil Stothard
LTIP 100% of salary 9 July 2015 7.70 43,600 336 31 March 2018Share matching 10% of salary 5 Aug 2015 7.70 4,400 34 31 March 2018
SAYE N/A 8 July 2015 7.70 580 4 N/A
Allison Bainbridge
LTIP 100% of salary 9 July 2015 7.70 31,600 243 31 March 2018Share matching 10% of salary 5 Aug 2015 7.70 3,200 25 31 March 2018
SAYE N/A 8 July 2015 7.70 580 4 N/A

Strategic ReportGovernance
Financial Statements
Shareholder Information
Vp plc Annual Report and Accounts 2016 www.vpplc.com45
Annual Report on Remuneration
STATEMENT OF DIRECTORS’ SHAREHOLDINGS AND SHARE INTERESTS (audited)
The share price used to calculate the value of shares beneficially owned for the purposes of establishing shareholding as a
percentage of salary is the share price as at 31 March 2016: £6.60.
*During the year Jeremy Pilkington was interested in shares owned by Ackers P Investment Company Limited. This company is
ultimately controlled by a number of trusts of which, for the purposes of Sections 252 to 255 of the Companies Act 2006,
Jeremy Pilkington is deemed to be a connected person. As at 31 March 2016 Ackers P Investment Company Limited owned
20,181,411 shares (2015: 20,181,411 shares).
The LTIP awards outstanding in respect of Jeremy Pilkington are notional shares which would be settled by a cash payment.
The executive directors are each in compliance with the company’s requirements to hold shares equivalent to at least 100% of
salary.
There were no changes in the interests of the directors between 31 March 2016 and 7 June 2016.
IMPLEMENTATION OF THE REMUNERATION POLICY FOR THE YEAR ENDING 31 MARCH 2017 (unaudited)
A summary of how the directors’ remuneration policy will be applied during the year ended 31 March 2017 is set out below.
BASE SALARY
The Committee approved a 1.5% increase in base salary for Jeremy Pilkington, Neil Stothard and Allison Bainbridge from 1 April
2015 and the following base salary increases with effect from 1 April 2016:
A salary increase averaging 2% across the Group was awarded at the annual pay review, effective from 1 April 2016.
During the year Neil Stothard served as a non-executive director of Wykeland Group and received a fee of £17,000 for his services.
2017 2016£000 £000 % increase
Jeremy Pilkington 471 471) 0.0%
Neil Stothard 343 336) 2.0%
Allison Bainbridge 255 244) 4.5%
Steve Rogers 38 38) 0.0%
Phil White 38 38) 0.0%
Executive Shareholding as Shares Shares Options Options Outstanding Outstanding Outstanding% of salary at beneficially beneficially vested vested LTIP share SAYE31 Mar 2016 owned at owned at but not yet but not yet awards1 matching awards
31 Mar 2016 31 Mar 2015 exercised exercised awards1
31 Mar 2016 31 Mar 2015
Jeremy Pilkington * 29,220 29,220 66,000 174,000 311,500 - -
Neil Stothard 1585% 806,921 794,921 - - 175,300 17,900 1,897
Allison Bainbridge 111% 41,000 33,000 - - 123,000 12,200 2,535
Steve Rogers - - - - - - - -
Phil White - - - - - - - -1 Unvested LTIP and share matching awards are subject to performance conditions

Vp plc Annual Report and Accounts 2016 www.vpplc.com46
Annual Report on Remuneration
PENSION ARRANGEMENTS
There are no proposed changes to pension arrangements for the executive directors.
ANNUAL BONUS
The maximum bonus potential for the year ending 31 March 2017 will remain at 100% of salary for all executive directors.
Awards will be based upon the achievement of a challenging growth target in profit before tax and amortisation.
The Committee is of the opinion that the performance targets for the annual bonus and long term incentive are commercially
sensitive and that it would be detrimental to the interests of the Group to disclose them before the start of the financial year.
The targets will be disclosed after the end of the relevant financial year in that year’s remuneration report.
LONG TERM INCENTIVES
Consistent with past awards the extent to which any LTIP awards granted in 2016 will vest will be dependent upon the
achievement of a challenging target growth in the Group’s earnings per share.
Clawback provisions in the event of significant misstatement of the results will apply to both the annual bonus and the long
term incentive.
IMPLEMENTATION OF THE REMUNERATION POLICY FOR THE YEAR ENDING 31 MARCH 2017(unaudited) – continued
PERFORMANCE GRAPH AND TABLE (unaudited)
The following graph charts the Total Shareholder Return of the Group and the FTSE Small Cap Index over the seven year period
from 31 March 2009 to 31 March 2016.
The FTSE Small Cap index excluding investment trusts is regarded as an appropriate bench mark for the Group’s shareholders.
Total shareholder return is defined as the total return a shareholder would receive over the period inclusive of both share price
growth and dividends.
Pric
e (R
ebas
ed to
100
)
600.00
500.00
400.00
300.00
200.00
100.00
000.0031-Mar-09 31-Mar-10 31-Mar-11 31-Mar-12 31-Mar-13 31-Mar-14 31-Mar-15 31-Mar-16
VP plc FTSE Small Cap (excl. Inv. Trusts)

Strategic ReportGovernance
Financial Statements
Shareholder Information
Vp plc Annual Report and Accounts 2016 www.vpplc.com47
Annual Report on Remuneration
PERCENTAGE CHANGE IN EXECUTIVE CHAIRMAN’S REMUNERATION (unaudited)
The table below shows the percentage change in the Executive Chairman’s salary, benefits and annual bonus between the
financial year ended 31 March 2015 and 31 March 2016 compared to the percentage change for UK employees of the Group
for each of these elements of pay.
RELATIVE IMPORTANCE OF SPEND ON PAY (unaudited)
The following table shows the Group’s actual spend on pay (for all employees) relative to dividends.
2015 2016 % change
Staff costs £m 69.5 71.3 3
Dividends £m 6.4 7.4 15
Dividend figures relate to amounts payable in respect of the relevant financial year and includes proposed final dividend of
13.5 pence.
Jeremy Pilkington UK employees2015 2016 % change % change
Salary 464 471 01.5% 04.6%
Taxable Benefits 044 044 00.0% 11.0%
Annual Bonus* 235 464 97.4% 49.8%
The percentage change for UK employees is based upon a consistent set of employees and is calculated using P60 and P11D
data.
*To be comparable to the data for the UK employees the annual bonus for Jeremy Pilkington disclosed above is the bonus paid
in the relevant tax year.
£000 £000
The total remuneration and award rates of the Executive Chairman across the same period were as follows:
2010 2011 2012 2013 2014 2015 2016
Single figure (£000) 614 1,080 1,919 1,795 2,042 2,259 1,613
Annual bonus % of maximum 20% 100% 100% 84% 52% 100% 27%
LTIP vesting % of maximum 0% 44.6% 82% 95.1% 100% 100% 100%
PERFORMANCE GRAPH AND TABLE (unaudited) – continued
The maximum annual bonus as a percentage of salary was increased from 50% to 100% in 2013/14.

Vp plc Annual Report and Accounts 2016 www.vpplc.com48
Annual Report on Remuneration
REMUNERATION COMMITTEE (unaudited)
The Group’s approach to executive directors’ remuneration is determined by the Board on the advice of the Remuneration
Committee.
The primary role of the Committee is to:
l Review, recommend and monitor the level and structure of remuneration for executive directors;
l Approve the remuneration packages for executive directors;
l Determine the balance between base pay and performance related elements of the package so as to align directors’ interests
to those of shareholders.
The Committee’s terms of reference are set out on the Company’s website.
The members of the Remuneration Committee, all independent non-executive directors, during the year under review were as
follows:
l Phil White
l Steve Rogers
Biographical information on Committee members and details of attendance at the Committee meetings during the year are set
out on pages 29 and 31. The Remuneration Committee has access to independent advice where it considers appropriate. No
advice has been sought during 2015/16.
STATEMENT OF VOTING AT GENERAL MEETING
At the last AGM held on 21 July 2015 the voting results in respect of the Remuneration Report Annual Statement were as
follows:
Votes cast in favour 31,797,331 99.5%
Votes cast against 155,707 0.5%
Total votes cast 31,953,038 100%
Abstentions 490,256
Remuneration Report
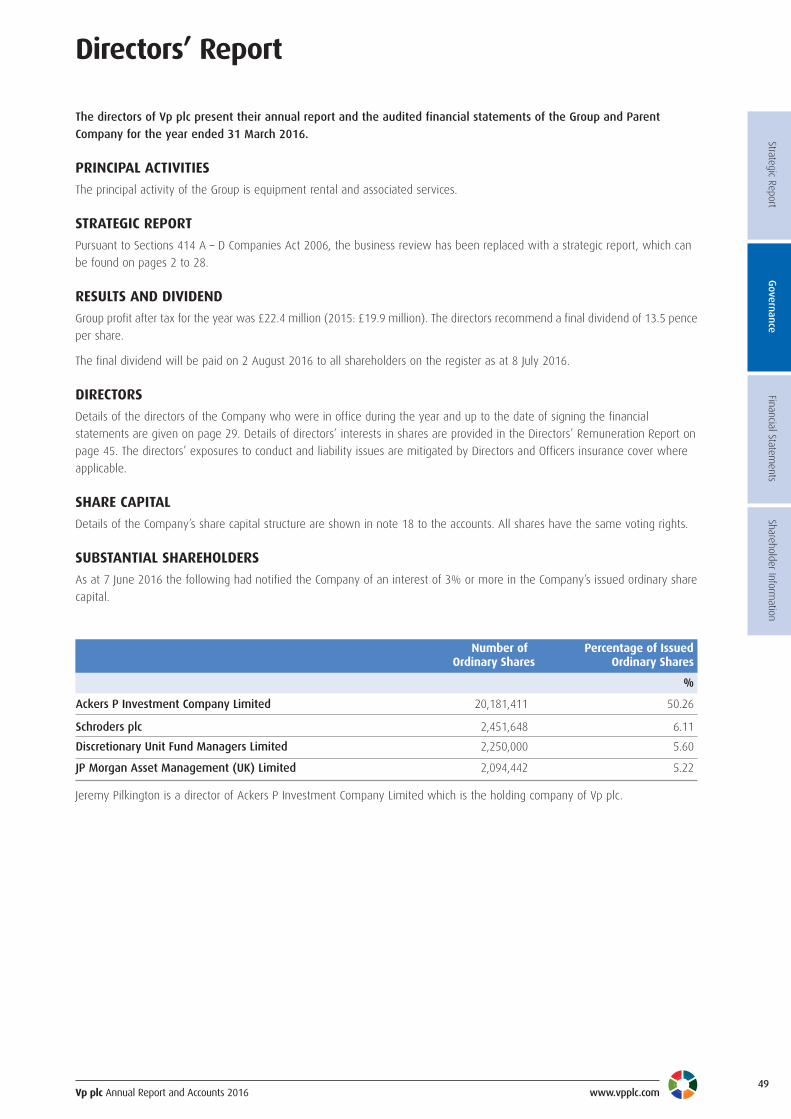
Strategic ReportGovernance
Financial Statements
Shareholder Information
Vp plc Annual Report and Accounts 2016 www.vpplc.com49
Directors’ Report
The directors of Vp plc present their annual report and the audited financial statements of the Group and Parent
Company for the year ended 31 March 2016.
PRINCIPAL ACTIVITIES
The principal activity of the Group is equipment rental and associated services.
STRATEGIC REPORT
Pursuant to Sections 414 A – D Companies Act 2006, the business review has been replaced with a strategic report, which can
be found on pages 2 to 28.
RESULTS AND DIVIDEND
Group profit after tax for the year was £22.4 million (2015: £19.9 million). The directors recommend a final dividend of 13.5 pence
per share.
The final dividend will be paid on 2 August 2016 to all shareholders on the register as at 8 July 2016.
DIRECTORS
Details of the directors of the Company who were in office during the year and up to the date of signing the financial
statements are given on page 29. Details of directors’ interests in shares are provided in the Directors’ Remuneration Report on
page 45. The directors’ exposures to conduct and liability issues are mitigated by Directors and Officers insurance cover where
applicable.
SHARE CAPITAL
Details of the Company’s share capital structure are shown in note 18 to the accounts. All shares have the same voting rights.
SUBSTANTIAL SHAREHOLDERS
As at 7 June 2016 the following had notified the Company of an interest of 3% or more in the Company’s issued ordinary share
capital.
Number of Percentage of Issued Ordinary Shares Ordinary Shares
%
Ackers P Investment Company Limited 20,181,411 50.26
Schroders plc 2,451,648 6.11
Discretionary Unit Fund Managers Limited 2,250,000 5.60
JP Morgan Asset Management (UK) Limited 2,094,442 5.22
Jeremy Pilkington is a director of Ackers P Investment Company Limited which is the holding company of Vp plc.

Vp plc Annual Report and Accounts 2016 www.vpplc.com50
Directors’ Report
DISCLOSURE OF INFORMATION UNDER LISTING RULE 9.8.4.The directors confirm that the company has entered into a relationship agreement with Ackers P Investment Company Limited
(a controlling shareholder) and has complied with the independence provisions of the agreement. As far as the directors are
aware, the controlling shareholder and its associates have also complied with the independence provision.
EMPLOYEESThe directors are committed to maintaining effective communication with employees on matters which affect their occupations
and future prospects while at the same time increasing their awareness of the Group’s overall activities and performance.
This communication takes the form of comprehensive team briefings to all employees together with regular Group and
divisional newsletters.
It is the policy of the Group to employ and train disabled people whenever their skills and qualifications allow and suitable
vacancies are available. If existing employees become disabled, every effort is made to find them appropriate work and
training is provided if necessary.
POLITICAL AND CHARITABLE CONTRIBUTIONSThe Group made no political contributions during the year. Donations to charities amounted to £41,000 (2015: £28,000).
The donations made in the year principally relate to sponsorship of employee driven fund raising activities on behalf of local
and national charities.
SUPPLIER PAYMENT POLICYIt is the Company’s policy to make payment to suppliers on agreed terms. The Company seeks to abide by these payment
terms whenever it is satisfied that the supplier has provided the goods or services in accordance with the agreed terms and
conditions. The number of days purchases outstanding at 31 March 2016 was 25 days (2015: 32 days). This figure fluctuates
dependent on the creditor position for fleet purchases at the year end compared to the average purchases during the year.
TAXATION PRINCIPLESWe operate in accordance with our Tax Principles, which can be found at www.vpplc.com. In 2015/16 Vp plc paid £4.8 million
in corporate taxes. We are a responsible corporate tax payer and conduct our affairs to ensure compliance with all laws and
relevant regulations in the countries in which we operate.
CONTRACTSThere are no disclosures required under S417 of the Companies Act in relation to contractual or other arrangements with
customers or suppliers.
PURCHASE OF OWN SHARESA resolution is to be proposed to authorise the Company to purchase its own shares, subject to certain specific limits. This
resolution is in accordance with the current guidelines issued by the Investment Committees of the Association of British
Insurers and the National Association of Pension Funds and will be proposed as a special resolution. The maximum and
minimum prices that may be paid for an Ordinary Share in exercise of such powers is set out in Resolution 11(b) and 11(c) of
the Notice of Meeting. The directors undertake to shareholders that they will not exercise the ability to purchase the
Company’s own shares unless to do so would result in an increase in earnings per share and would be in the best interest of
shareholders generally.
The Company would consider holding any of its own shares that it purchases pursuant to the authority conferred by this
resolution as treasury shares provided that the number so held did not at any time exceed 10% of the Company’s issued share
capital. This would give the Company the ability to re-issue treasury shares quickly and cost-effectively and would provide the
Company with additional flexibility in the management of its capital base. During the year ended 31 March 2016 the Company
did not acquire any shares under the authority of the resolution passed at the Annual General Meeting.

Strategic ReportGovernance
Financial Statements
Shareholder Information
Vp plc Annual Report and Accounts 2016 www.vpplc.com51
Directors’ Report
GOING CONCERNThe Business Review on pages 10 to 17 sets out the Group’s business activities, markets and outlook for the forthcoming year
and beyond. This is supported by the Financial Review on pages 18 to 20 which sets out the Group’s current financial position,
including its cashflows, net debt and borrowing facilities and also outlines the Group’s treasury management objectives, policies
and processes. It is also supported by the Viability Statement on page 21.
Notes 14 and 15 (‘Interest Bearing Loans and Borrowings’ and ‘Financial Instruments’) to the financial statements give further
information on the Group’s borrowings, financial instruments and liquidity risk.
The Group is in a healthy financial position. At the year end the Group had total banking facilities of £100 million, which are
subject to bank covenant testing, together with a step up facility of £25 million.
The Board has evaluated the facilities and covenants on the basis of the budget for 2016/17 which has been prepared taking
into account the current economic climate, together with appropriate sensitivity analysis. On the basis of this testing and taking
into account the increase in the facilities in April 2016, as set out in the Financial Review, the directors have a reasonable
expectation that the Group has adequate resources to continue in operation for the foreseeable future. For this reason the
going concern basis has been adopted in the preparation of the financial statements.
CORPORATE GOVERNANCEThe Corporate Governance Statement on pages 30 to 33 forms part of the Directors’ Report.
INDEPENDENT AUDITORThe directors who held office at the date of approval of this Directors’ Report confirm that, so far as they are each aware, there
is no relevant audit information of which the Company’s auditors are unaware; and all directors have taken all the steps that
they ought to have taken as a director to make themselves aware of any relevant audit information and to establish that the
Company’s auditors are aware of that information.
In accordance with Section 489 of the Companies Act 2006, a resolution for the re-appointment of PricewaterhouseCoopers LLP
as auditors of the Company is to be proposed at the forthcoming Annual General Meeting.
By Order of the Board
Allison Bainbridge
Group Finance Director
7 June 2016

Vp plc Annual Report and Accounts 2016 www.vpplc.com52
Statement of Directors’ Responsibilities
IN RESPECT OF THE ANNUAL REPORT AND THE FINANCIAL STATEMENTS
The directors are responsible for preparing the Annual Report, the Directors’ Remuneration Report and the financial statements
in accordance with applicable law and regulations.
Company law requires the directors to prepare financial statements for each financial year. Under that law the directors have
prepared the Group and Parent Company financial statements in accordance with International Financial Reporting Standards
(IFRSs) as adopted by the European Union. Under company law the directors must not approve the financial statements unless
they are satisfied that they give a true and fair view of the state of affairs of the Group and the Company and of the profit or
loss of the Group for that period. In preparing these financial statements, the directors are required to:
l select suitable accounting policies and then apply them consistently;
l make judgements and accounting estimates that are reasonable and prudent;
l state whether applicable IFRSs as adopted by the European Union have been followed, subject to any material departures
disclosed and explained in the financial statements;
The directors are responsible for keeping adequate accounting records that are sufficient to show and explain the Company’s
transactions and disclose with reasonable accuracy at any time the financial position of the Company and the Group and
enable them to ensure that the financial statements and the Directors’ Remuneration Report comply with the Companies Act
2006 and, as regards the group financial statements, Article 4 of the IAS Regulation. They are also responsible for safeguarding
the assets of the Company and the Group and hence for taking reasonable steps for the prevention and detection of fraud and
other irregularities.
The directors are responsible for the maintenance and integrity of the company’s website. Legislation in the United Kingdom
governing the preparation and dissemination of financial statements may differ from legislation in other jurisdictions.
The directors whose names appear on page 29 confirm that to the best of their knowledge:
l The financial statements, prepared in accordance with the applicable set of accounting standards, give a true and fair view of the
assets, liabilities, financial position and profit or loss of the Company and the undertakings included in the consolidation taken as a
whole: and
l The Business Review and Financial Review which form part of the Directors’ Report include a fair review of the development and
performance of the business and the position of the Company and the undertakings included in the consolidation taken as a
whole, together with the description of the principal risks and uncertainties that they face.

Vp plc Annual Report and Accounts 2016 www.vpplc.com
Strategic ReportGovernance
Financial Statements
Shareholder Information
53
Independent Auditors’ Report
INDEPENDENT AUDITORS’ REPORT TO THE MEMBERS OF Vp plcReport on the financial statements
Our opinionIn our opinion:
l Vp plc’s Group financial statements and Parent Company financial statements (the “financial statements”) give a true and fair view of the state
of the Group's and of the Parent Company's affairs as at 31 March 2016 and of the Group's profit and the Group’s and the Parent Company’s
cash flows for the year then ended;
l the Group financial statements have been properly prepared in accordance with International Financial Reporting Standards (“IFRSs”) as adopted
by the European Union;
l the Parent Company financial statements have been properly prepared in accordance with IFRSs as adopted by the European Union and as applied
in accordance with the provisions of the Companies Act 2006; and
l the financial statements have been prepared in accordance with the requirements of the Companies Act 2006 and, as regards the Group financial
statements, Article 4 of the IAS Regulation.
What we have auditedThe Financial Statements included within the Annual Report and Accounts (the “Annual Report”) comprise:
l the Consolidated and Parent Company Balance Sheets as at 31 March 2016;
l the Consolidated Income Statement and Statements of Comprehensive Income for the year then ended;
l the Consolidated and Parent Company Statements of Cash Flows for the year then ended;
l the Statements of Changes in Equity for the year then ended; and
l the notes to the financial statements, which include a summary of significant accounting policies and other explanatory information.
Certain required disclosures have been presented elsewhere in the Annual Report, rather than in the notes to the financial statements. These are cross-
referenced from the financial statements and are identified as audited. The financial reporting framework that has been applied in the preparation of
the financial statements is IFRSs as adopted by the European Union, and applicable law and, as regards the Parent Company financial statements, as
applied in accordance with the provisions of the Companies Act 2006.
Our audit approachOverview
The scope of our audit and our areas of focus
We conducted our audit in accordance with International Standards on Auditing (UK and Ireland) (“ISAs (UK & Ireland)”).
We designed our audit by determining materiality and assessing the risks of material misstatement in the financial statements. In particular, we looked
at where the directors made subjective judgements, for example in respect of significant accounting estimates that involved making assumptions and
considering future events that are inherently uncertain. As in all of our audits we also addressed the risk of management override of internal controls,
including evaluating whether there was evidence of bias by the directors that represented a risk of material misstatement due to fraud.
The risks of material misstatement that had the greatest effect on our audit, including the allocation of our resources and effort, are identified as “areas
of focus” in the table below. We have also set out how we tailored our audit to address these specific areas in order to provide an opinion on the
financial statements as a whole, and any comments we make on the results of our procedures should be read in this context. This is not a complete
list of all risks identified by our audit.
l Overall group materiality: £1.4 million which represents 5% of profit before tax.
lThe Group audit team performed an audit of the complete financial information of the four financially significantreporting units with the Group.
lAs a result of this scoping we obtained coverage over 97% of the Group’s external revenues and 98% of the Group’sprofit before tax.
l Existence of rental equipment.
l Valuation of rental equipment.
Areas offocus
Audit scope
Materiality

Vp plc Annual Report and Accounts 2016 www.vpplc.com54
Independent Auditors’ Report
We agreed with the Audit Committee that we would report to them misstatements identified during our audit above £70,000 (2015: £100,000) aswell as misstatements below that amount that, in our view, warranted reporting for qualitative reasons.
Overall group materiality £1.4 million (2015: £1.3 million).
How we determined it 5% of profit before tax.
Rationale for benchmark applied We applied this benchmark because, in our view, this is the most relevant metric against which theperformance of the Group is measured.
How we tailored the audit scopeWe tailored the scope of our audit to ensure that we performed enough work to be able to give an opinion on the financial statements as a whole,taking into account the geographic structure of the Group, the accounting processes and controls operated by the Group, and the industry in which theGroup operates.
The Group’s accounting process is structured around a Group finance function at its head office in Harrogate. Within the head office, a supporting financefunction exists in the form of a shared service centre utilised for five of the Group’s six divisions which operate in the UK and overseas. The Group alsomaintains local finance teams for each of its six divisions, which are based at the operational locations of each division.
The Group’s reporting units vary significantly in size and we identified 14 reporting units, 4 of which, in our view, required an audit of their completefinancial information, due to their size or risk characteristics.
In establishing the overall approach to the Group audit, we determined that all work could be performed by us, the Group audit team. Together, thereporting units subject to audit procedures generated 97% of Group revenues and 98% of Group profit before tax.
We performed specific audit procedures over central functions and areas of significant judgement, including taxation, goodwill, pension obligations andshare based payments.
MaterialityThe scope of our audit was influenced by our application of materiality. We set certain quantitative thresholds for materiality. These, together withqualitative considerations, helped us to determine the scope of our audit and the nature, timing and extent of our audit procedures on individualfinancial statement line items and disclosures and in evaluating the effect of misstatements, both individually and on the financial statements as awhole.
Based on our professional judgement, we determined materiality for the financial statements as a whole as follows:
Our audit work in respect of the existence of rental equipment included understanding and evaluatingmanagement’s key controls in this area, checking the correct recording of rental asset movements onthe fixed asset register, and substantively testing the existence of a sample of assets.
We tested the operating effectiveness of controls in place over the accurate recording of rentalequipment purchases and disposals. For a sample of rental equipment purchases in the year weagreed to invoice and capitalisation onto the fixed asset register, checking the value and the usefuleconomic life applied. For a sample of rental equipment disposed of in the year, we agreed todisposal documentation, sales invoices and cash receipts where appropriate and removal from thefixed asset register.
We agreed a sample of rental equipment out on hire to signed delivery notes. We did not identifyany material exceptions from this work.
We attended a sample of year end rental equipment counts and:
l considered the design and effectiveness of count controls by understanding and observing thecount procedures; and
l counted a sample of assets and reconciled these to both management’s count and the fixedasset register.
Our testing did not identify rental equipment that was on the fixed asset register, but not either onhire to customers or in the Group’s possession at the year end.
Our audit work in respect of the valuation of rental equipment comprised an assessment of theaccuracy of estimates made by management in previous years, an analysis of utilisation statistics,integrity checks over the underlying fixed asset data and performing an impairment review usingmanagement’s budgeted trading performance. We tested the appropriateness of useful economiclives and estimated residual values applied by management through consideration of anyprofits/losses on disposal of rental equipment and the level of fully written down assets stillgenerating revenue, noting no evidence of systematic under or over depreciation of the assets.
We tested the integrity of the data held within the fixed asset registers, given the reliance uponthis information for our impairment analysis. This comprised scanning the entire population ofassets for inappropriate entries (such as assets with negative cost), indications of incorrectapplication of the Group’s accounting policies (such as assets with a useful economic lifeinconsistent with the type of asset) or evidence that the useful economic life assigned is not beingapplied correctly in the fixed asset register. We did not identify any material exceptions from thiswork.
Area of focus How our audit addressed the area of focus
Existence of rental equipmentRefer to page 34, page 64 (accountingpolicy) and page 73 (financialdisclosures)
We focused on this area because theGroup holds a significant quantum ofrental equipment in the normal courseof its business.
The net book value of rental equipmentis £147.2 million (2015: £131.6 million).Given the number of assets and thefrequency of movement (throughpurchases, hires and sales) there is thepotential for assets to go missing ortheir movements to be mis-recorded.This results in complexity in maintainingan accurate fixed asset register.
Valuation of rental equipmentRefer to page 34, page 64 (accountingpolicy) and page 73 (financialdisclosures)
We focused on this area because thereis significant management judgementinvolved in estimating the usefuleconomic lives, estimated residualvalues and impairment of the rentalassets.
The utilisation of rental equipment iskey to supporting their valuation so adownturn in the trading performance ina particular market or reporting unitpresents an inherent impairment risk.

Vp plc Annual Report and Accounts 2016 www.vpplc.com
Independent Auditors’ ReportStrategic Report
Governance
Financial Statements
Shareholder Information
55
Companies Act 2006 opinionsIn our opinion:l The information given in the Strategic Report and the Directors’ Report for the financial year for which the financial statements are
prepared are consistent with the financial statements; andl The information given in the Corporate Governance Statement set out on pages 30 to 33 with respect to internal control and risk
management systems and about share capital structures is consistent with the financial statements.
ISAs (UK & Ireland) reportingUnder ISAs (UK & Ireland) we are required to report to you if, in our opinion:
l Information in the Annual Report is:− Materially inconsistent with the information in the audited financial statements; or− Apparently materially incorrect based on, or materially inconsistent with, our knowledge of the
Group and Parent Company acquired in the course of performing our audit; or− Otherwise misleading.
Other required reportingConsistency of other information
We have no exceptionsto report.
l The statement given by the directors on page 34, in accordance with provision C.1.1 of the UK CorporateGovernance Code (the “Code”), that they consider the Annual Report taken as a whole to be fair,balanced and understandable and provides the information necessary for members to assess the Group’sand Parent Company’s performance, business model and strategy is materially inconsistent with ourknowledge of the Group and Parent Company acquired in the course of performing our audit.
l The section of the Annual Report on page 34, as required by provision C.3.8 of the Code, describingthe work of the Audit Committee does not appropriately address matters communicated by us to theAudit Committee.
We have no exceptionsto report.
We have no exceptionsto report.
Under ISAs (UK & Ireland) we are required to report to you if we have anything material to add or to draw attention to in relation to:
The Directors’ assessment of the prospects of the Group and of the principal risks that would threaten the solvencyor liquidity of the Group
l the Directors’ confirmation on page 21 of the Annual Report, in accordance with provision C.2.1 ofthe Code, that they have carried out a robust assessment of the principal risks facing the Group,including those that would threaten its business model, future performance, solvency or liquidity.
l the disclosures in the Annual Report that describe those risks and explain how they are beingmanaged or mitigated.
l the Directors’ explanation on page 21 of the Annual Report, in accordance with provision C.2.2 of the Code, asto how they have assessed the prospects of the Group, over what period they have done so and why theyconsider that period to be appropriate, and their statement as to whether they have a reasonable expectationthat the Group will be able to continue in operation and meet its liabilities as they fall due over the period oftheir assessment, including any related disclosures drawing attention to any necessary qualifications orassumptions.
We have nothingmaterial to add or todraw attention to.
We have nothingmaterial to add or todraw attention to.
We have nothingmaterial to add or todraw attention to.
Under the Listing Rules we are required to review the Directors’ statement that they have carried out a robust assessment of the principalrisks facing the Group and the Directors’ statement in relation to the longer-term viability of the Group. Our review was substantially less inscope than an audit and only consisted of making inquiries and considering the Directors’ process supporting their statements; checkingthat the statements are in alignment with the relevant provisions of the Code; and considering whether the statements are consistent withthe knowledge acquired by us in the course of performing our audit. We have nothing to report having performed our review.
Going concernUnder the Listing Rules we are required to review the directors’ statement, set out on page 51, in relation to going concern. We have nothing toreport having performed our review.
Under ISAs (UK & Ireland) we are required to report to you if we have anything material to add or to draw attention to in relation to theDirectors’ statement about whether they considered it appropriate to adopt the going concern basis in preparing the financial statements.We have nothing material to add or to draw attention to.
As noted in the directors’ statement, the directors have concluded that it is appropriate to adopt the going concern basis in preparing the financialstatements. The going concern basis presumes that the Group and Parent Company have adequate resources to remain in operation, and that thedirectors intend them to do so, for at least one year from the date the financial statements were signed. As part of our audit we have concludedthat the directors’ use of the going concern basis is appropriate. However, because not all future events or conditions can be predicted, thesestatements are not a guarantee as to the Group’s and Parent Company’s ability to continue as a going concern.

Vp plc Annual Report and Accounts 2016 www.vpplc.com56
Independent Auditors’ Report
Directors’ remuneration
Directors’ remuneration report - Companies Act 2006 opinionIn our opinion, the part of the Directors’ Remuneration Report to be audited has been properly prepared in accordance with the Companies Act 2006.
Other Companies Act 2006 reportingUnder the Companies Act 2006 we are required to report to you if, in our opinion, certain disclosures of directors’ remuneration specified by law arenot made. We have no exceptions to report arising from this responsibility.
Corporate governance statementUnder the Companies Act 2006 we are required to report to you if, in our opinion, a corporate governance statement has not been prepared by theParent Company. We have no exceptions to report arising from this responsibility.
Under the Listing Rules we are required to review the part of the Corporate Governance Statement relating to ten further provisions of the Code.We have nothing to report having performed our review.
Responsibilities for the financial statements and the audit
Our responsibilities and those of the directorsAs explained more fully in the Statement of Directors' Responsibilities, the directors are responsible for the preparation of the financial statementsand for being satisfied that they give a true and fair view.
Our responsibility is to audit and express an opinion on the financial statements in accordance with applicable law and ISAs (UK & Ireland). Thosestandards require us to comply with the Auditing Practices Board’s Ethical Standards for Auditors.
This report, including the opinions, has been prepared for and only for the Parent Company’s members as a body in accordance with Chapter 3 ofPart 16 of the Companies Act 2006 and for no other purpose. We do not, in giving these opinions, accept or assume responsibility for any otherpurpose or to any other person to whom this report is shown or into whose hands it may come save where expressly agreed by our prior consentin writing.
What an audit of financial statements involves
An audit involves obtaining evidence about the amounts and disclosures in the financial statements sufficient to give reasonable assurance that thefinancial statements are free from material misstatement, whether caused by fraud or error. This includes an assessment of:
l whether the accounting policies are appropriate to the Group’s and the Parent Company’s circumstances and have been consistently applied andadequately disclosed;
l the reasonableness of significant accounting estimates made by the directors; and
l the overall presentation of the financial statements.
We primarily focus our work in these areas by assessing the directors’ judgements against available evidence, forming our own judgements, andevaluating the disclosures in the financial statements.
We test and examine information, using sampling and other auditing techniques, to the extent we consider necessary to provide a reasonable basisfor us to draw conclusions. We obtain audit evidence through testing the effectiveness of controls, substantive procedures or a combination of both.
In addition, we read all the financial and non-financial information in the Annual Report to identify material inconsistencies with the audited financialstatements and to identify any information that is apparently materially incorrect based on, or materially inconsistent with, the knowledge acquiredby us in the course of performing the audit. If we become aware of any apparent material misstatements or inconsistencies we consider theimplications for our report.
Steve Denison (Senior Statutory Auditor)for and on behalf of PricewaterhouseCoopers LLPChartered Accountants and Statutory AuditorsLeeds7 June 2016
Adequacy of accounting records and information and explanations receivedUnder the Companies Act 2006 we are required to report to you if, in our opinion:l we have not received all the information and explanations we require for our audit; orl adequate accounting records have not been kept by the Parent Company, or returns adequate for our audit have not been received from branches
not visited by us; orl the Parent Company financial statements and the part of the Directors’ Remuneration Report to be audited are not in agreement with the
accounting records and returns.
We have no exceptions to report arising from this responsibility.

Vp plc Annual Report and Accounts 2016 www.vpplc.com
Strategic ReportGovernance
Financial Statements
Shareholder Information
57
Consolidated Income Statementfor the Year Ended 31 March 2016
2016) 2015)
Note £000) £000)
Revenue 2 208,746) 205,602)
Cost of sales (149,758) (148,773)
Gross profit 58,988) 56,829)
Administrative expenses (29,395) (29,733)
Operating profit before amortisation 2 31,891) 28,780)
Amortisation 9 (2,298) (1,684)
Operating profit 3 29,593) 27,096)
Financial income 6 4) 1)
Financial expenses 6 (2,097) (2,024)
Profit before taxation and amortisation 29,798) 26,757)
Amortisation 9 (2,298) (1,684)
Profit before taxation 27,500) 25,073)
Income tax expense 7 (5,112) (5,202)
Profit attributable to owners of the parent 22,388) 19,871)
Basic earnings per 5p ordinary share 20 57.49p 51.03p
Diluted earnings per 5p ordinary share 20 54.51p 47.01p
Dividend per 5p ordinary share interim paid
and final proposed 19 18.85p 16.50p

Vp plc Annual Report and Accounts 2016 www.vpplc.com58
Statements of Comprehensive Income
Consolidated Statement of Comprehensive Income
for the Year Ended 31 March 2016
2016) 2015)
Note £000) £000)
Profit for the year 22,388) 19,871)
Other comprehensive income/(expense):)
Items that will not be reclassified to profit or loss
Remeasurements of defined benefit pension scheme 24 122) (55)
Tax on items taken to other comprehensive income 7 (23) 12)
Impact of tax rate change 7 (39) -)
Foreign exchange translation difference 693) (1,028)
Items that may be subsequently reclassified to profit or loss
Effective portion of changes in fair value of cash flow hedges 581) (1,011)
Total other comprehensive income/(expense) 1,334) (2,082)
Total comprehensive income for the year attributable to owners of the parent 23,722) 17,789)
Parent Company Statement of Comprehensive Income
for the Year Ended 31 March 2016
2016) 2015)
Note £000) £000)
Profit for the year 10,397) 13,576)
Other comprehensive income/(expense):)
Items that will not be reclassified to profit or loss
Remeasurements of defined benefit pension scheme 24 122) (55)
Tax on items taken to other comprehensive income 7 (23) 12)
Impact of tax rate change 7 (39) -)
Items that may be subsequently reclassified to profit or loss
Effective portion of changes in fair value of cash flow hedges 581) (1,011)
Total other comprehensive income/(expense) 641) (1,054)
Total comprehensive income for the year 11,038) 12,522)

Vp plc Annual Report and Accounts 2016 www.vpplc.com
Strategic ReportGovernance
Financial Statements
Shareholder Information
59
Statements of Changes in Equity
Parent Company Statement of Changes in Equity
for the Year Ended 31 March 2016
) )Capital) ) ) Non-) )Share) Redemption) Share) Hedging) Retained) cont rolling) Total)
Capital) Reserve) Premium) Reserve) Earnings) Interest) Equity)
Note £000) £000) £000) £000) £000) £000) £000)
Equity at 1 April 2014 2,008) 301) 16,192) (90) 89,546) 27) 107,984)
Total comprehensive income for the year -) -) -) (1,011) 18,800) -) 17,789)
Tax movements to equity 7 -) -) -) -) 1,145) -) 1,145)
Share option charge in the year -) -) -) -) 1,894) -) 1,894)
Net movement relating to -) -) -) -) (11,059) -) (11,059)shares held by Vp Employee Trust
Dividend to shareholders 19 -) -) -) -) (5,986) -) (5,986)
Total change in equity during the year -) -) -) (1,011) 4,794) -) 3,783)
Equity at 31 March 2015 2,008) 301) 16,192) (1,101) 94,340) 27) 111,767)
Total comprehensive income for the year -) -) -) 581 23,141) -) 23,722)
Tax movements to equity 7 -) -) -) -) 1,123) -) 1,123)
Impact of tax rate change 7 -) -) -) -) (31) -) (31)
Share option charge in the year -) -) -) -) 1,904) -) 1,904)
Net movement relating to -) -) -) -) (10,567) -) (10,567)
shares held by Vp Employee Trust
Dividend to shareholders 19 -) )-) -) -) (6,568) -) (6,568)
Total change in equity during the year -) -) -) 581) 9,002) -) 9,583)
Equity as at 31 March 2016 2,008) 301) 16,192) (520) 103,342) 27) 121,350)
) Capital) ) ) )Share) Redemption) Share) Hedging) Retained) Total)
Capital) Reserve) Premium) Reserve) Earnings) Equity)
Note £000) £000) £000) £000) £000) £000)
Equity at 1 April 2014 2,008 )301) 16,192) (90) 35,852) 54,263)
Total comprehensive income for the year -) -) -) (1,011) 13,533) 12,522)
Tax movements to equity 7 -) -) -) -) 1,145) 1,145)
Share option charge in the year -) -) -) -) 1,894) 1,894)
Net movement relating to -) -) -) -) (11,059) (11,059)shares held Vp Employee Trust
Dividend to shareholders 19 -) -) -) -) (5,986) (5,986)
Total change in equity during the year -) -) -) (1,011) (473) (1,484)
Equity at 31 March 2015 2,008) 301) 16,192) (1,101) 35,379) 52,779)
Total comprehensive income for the year -) -) -) 581 10,457) 11,038)
Tax movements to equity 7 -) -) -) -) 1,123) 1,123)
Impact of tax rate change 7 -) -) -) -) (31) (31)
Share option charge in the year -) -) -) -) 1,904) 1,904)
Net movement relating to -) -) -) -) (10,567) (10,567)
shares held by Vp Employee Trust
Dividend to shareholders 19 -) -) -) -) (6,568) (6,568)
Total change in equity during the year -) -) -) 581) (3,682) (3,101)
Equity at 31 March 2016 2,008) 301) 16,192) (520) 31,697) 49,678)
Consolidated Statement of Changes in Equity
for the Year Ended 31 March 2016
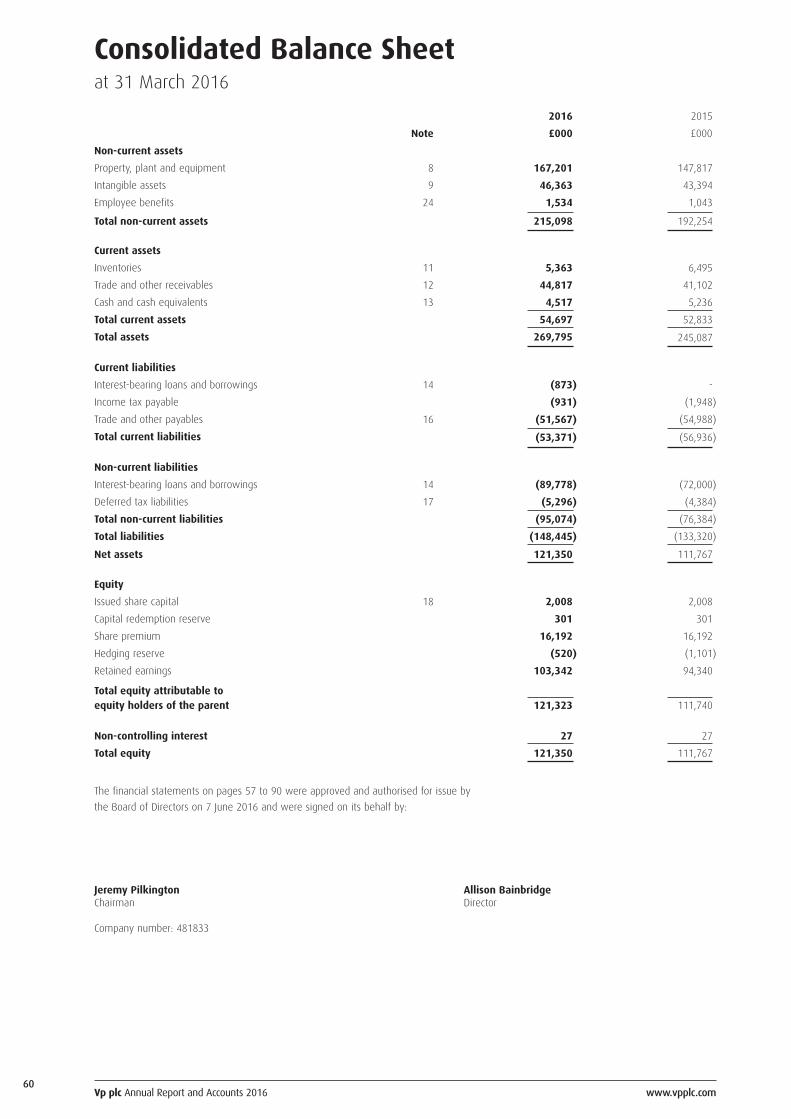
Vp plc Annual Report and Accounts 2016 www.vpplc.com60
Consolidated Balance Sheetat 31 March 2016
2016) 2015)
Note £000) £000)
Non-current assets
Property, plant and equipment 8 167,201) 147,817)
Intangible assets 9 46,363) 43,394)
Employee benefits 24 1,534) 1,043)
Total non-current assets 215,098) 192,254)
Current assets
Inventories 11 5,363) 6,495)
Trade and other receivables 12 44,817) 41,102)
Cash and cash equivalents 13 4,517) 5,236)
Total current assets 54,697) 52,833)
Total assets 269,795) 245,087)
Current liabilities
Interest-bearing loans and borrowings 14 (873) -)
Income tax payable (931) (1,948)
Trade and other payables 16 (51,567) (54,988)
Total current liabilities (53,371) (56,936)
Non-current liabilities
Interest-bearing loans and borrowings 14 (89,778) (72,000)
Deferred tax liabilities 17 (5,296) (4,384)
Total non-current liabilities (95,074) (76,384)
Total liabilities (148,445) (133,320)
Net assets 121,350) 111,767)
Equity
Issued share capital 18 2,008) 2,008)
Capital redemption reserve 301) 301)
Share premium 16,192) 16,192)
Hedging reserve (520) (1,101)
Retained earnings 103,342) 94,340)
Total equity attributable toequity holders of the parent 121,323) 111,740)
Non-controlling interest 27) 27)
Total equity 121,350) 111,767)
The financial statements on pages 57 to 90 were approved and authorised for issue by
the Board of Directors on 7 June 2016 and were signed on its behalf by:
Jeremy Pilkington Allison BainbridgeChairman Director
Company number: 481833

Vp plc Annual Report and Accounts 2016 www.vpplc.com
Strategic ReportGovernance
Financial Statements
Shareholder Information
61
Parent Company Balance Sheetat 31 March 2016
2016) 2015)
Note £000) £000)
Non-current assets
Property, plant and equipment 8 89,294) 78,679)
Intangible assets 9 18,678) 17,150)
Investments in subsidiaries 10 27,930) 25,830)
Employee benefits 24 1,534) 1,043)
Total non-current assets 137,436) 122,702)
Current assets
Inventories 11 1,416) 1,951)
Trade and other receivables 12 54,750) 51,155)
Income tax receivable 490) -)
Cash and cash equivalents 13 657) 1,555)
Total current assets 57,313) 54,661)
Total assets 194,749) 177,363)
Current liabilities
Interest-bearing loans and borrowings 14 (6,485) (4,263)
Income tax payable -) (672)
Trade and other payables 16 (45,387) (44,992)
Total current liabilities (51,872) (49,927)
Non-current liabilities
Interest-bearing loans and borrowings 14 (89,748) (72,000)
Deferred tax liabilities 17 (3,451) (2,657)
Total non-current liabilities (93,199) (74,657)
Total liabilities (145,071) (124,584)
Net assets 49,678) 52,779)
Equity
Issued share capital 18 2,008) 2,008)
Capital redemption reserve 301) 301)
Share premium 16,192) 16,192)
Hedging reserve (520) (1,101)
Retained earnings 31,697) 35,379)
Total equity 49,678) 52,779)
The financial statements on pages 57 to 90 were approved and authorised for issue by
the Board of Directors on 7 June 2016 and were signed on its behalf by:
Jeremy Pilkington Allison BainbridgeChairman Director
Company number: 481833

Vp plc Annual Report and Accounts 2016 www.vpplc.com62
Consolidated Statement of Cash Flowsfor the Year Ended 31 March 2016
2016) 2015)
Note £000) £000)
Cash flows from operating activities
Profit before taxation 27,500) 25,073)
Adjustments for:
Pension fund contributions in excess of (369) (409)expense recognised in Income Statement
Share based payment charges 1,904) 1,894)
Depreciation 8 27,375) 25,023)
Amortisation and impairment 9 2,298) 1,684)
Financial expense 2,097) 2,024)
Financial income (4) (1)
Profit on sale of property, plant and equipment (6,246) (3,277)
Operating cash flow before changes in 54,555) 52,011)
working capital and provisions)
Decrease/(increase) in inventories 1,132) (854)
Increase in trade and other receivables (2,101) (2,746)
(Decrease)/increase in trade and other payables (5,729) 6,114)
Cash generated from operations 47,857) 54,525)
Interest paid (2,097) (2,016)
Interest element of finance lease rental payments (4) (2)
Interest received 4) 1)
Income taxes paid (4,840) (2,873)
Net cash generated from operating activities 40,920) 49,635)
Investing activities
Proceeds from sale of property, plant and equipment 17,179) 11,982)
Purchase of property, plant and equipment (50,237) (52,887)
Acquisition of businesses and subsidiaries (net of cash acquired) 25 (7,068) (5,405)
Net cash used in investing activities (40,126) (46,310)
Cash flows from financing activities
Purchase of own shares by Employee Trust (10,566) (11,059)
Repayment of borrowings -) (10,000)
New loans 16,000) 20,000)
Payment of finance lease liabilities (497) (17)
Dividend paid 19 (6,568) (5,986)
Net cash used in financing activities (1,631) (7,062)
Net decrease in cash and cash equivalents (837) (3,737)
Effect of exchange rate fluctuations on cash held 118) (5)
Cash and cash equivalents as at the beginning of the year 5,236) 8,978)
Cash and cash equivalents as at the end of the year 4,517) 5,236)

Vp plc Annual Report and Accounts 2016 www.vpplc.com
Strategic ReportGovernance
Financial Statements
Shareholder Information
63
Parent Company Statement of Cash Flowsfor the Year Ended 31 March 2016
2016) 2015)
Note £000) £000)
Cash flows from operating activities
Profit before taxation 12,767) 16,209)
Adjustments for:
Pension fund contributions in excess of (369) (409)expense recognised in Income Statement
Share based payment charges 1,904) 1,894)
Depreciation 8 11,866) 11,585)
Amortisation 9 472) 570)
Financial expense 2,091) 2,034)
Financial income (4) (1)
Profit on sale of property, plant and equipment (4,047) (2,259)
Operating cash flow before changes in 24,680) 29,623)
working capital and provisions)
Decrease/(increase) in inventories 535) (487)
(Increase)/decrease in trade and other receivables (2,558) 3,031)
Decrease in trade and other payables (1,803) (7,519)
Cash generated from operations 20,854) 24,648)
Interest paid (2,097) (2,015)
Interest element of finance lease rental payments (3) (2)
Interest received 4) 1)
Income taxes paid (1,823) (835)
Net cash generated from operating activities 16,935) 21,797)
Investing activities
Proceeds from sale of property, plant and equipment 10,246) 7,300)
Purchase of property, plant and equipment (24,153) (26,216)
Acquisition of businesses and subsidiaries (net of cash acquired) 25 (3,718) -)
Net cash used in investing activities (17,625) (18,916)
Cash flow from financing activities
Purchase of own shares by Employee Trust (10,566) (11,059)
Repayment of borrowings -) (10,000)
New loans 16,000) 20,000)
Payment of finance lease liabilities (473) (17)
Dividend paid 19 (6,568) (5,986)
Net cash used in financing activities (1,607) (7,062)
Net decrease in cash and cash equivalents (2,297) (4,181)
Cash and cash equivalents as at the beginning of the year (2,708) 1,473)
Cash and cash equivalents net of overdraft as (5,005) (2,708)
at the end of the year

Vp plc Annual Report and Accounts 2016 www.vpplc.com64
Notes(forming part of the financial statements)
1. SIGNIFICANT ACCOUNTING POLICIES
Statement of compliance
Vp plc is a public limited company which is listed on the London Stock Exchange and incorporated and domiciled in Great Britain. These consolidated
Financial Statements of Vp plc for the year ended 31 March 2016, consolidate those of the Company and its subsidiaries (together referred to as
the “Group”). The Parent Company’s Financial Statements present information about the Company as a separate entity and not about the Group.
Basis of preparation
Both the Parent Company Financial Statements and the Group Financial Statements have been prepared and approved by the directors in
accordance with International Financial Reporting Standards (IFRSs) and IFRS Interpretations Committee (IFRSIC) interpretations as adopted by the
EU and the Companies Act 2006 applicable to company reporting under IFRS. In publishing the Parent Company Financial Statements here together
with the Group Financial Statements, the Company has taken advantage of the exemptions in s408 of the Companies Act 2006 not to present its
individual income statement and related notes that form part of these approved Financial Statements.
The Financial Statements are presented in sterling, rounded to the nearest thousand. They are prepared on a going concern basis (further details
are provided in the Directors’ Report) and historic cost basis except that derivative financial instruments and cash settled share options are stated
at fair value.
Accounting policies and restatements
The Group’s accounting policies are set out below and have been applied consistently to all periods presented in these consolidated Financial
Statements. There were no changes to IFRSs or IFRSIC interpretations that have had a material impact on the Group for the year ended 31 March 2016.
Future standards
At the date of approval of these financial statements the following standards and interpretations were in issue but not yet effective:
l IFRS 9 ‘Financial instruments’ (effective for accounting periods commencing on or after 1 January 2018).
l IFRS15 ‘Revenue from contracts with customers’ (effective for accounting periods commencing on or after 1 January 2017).
The adoption of these Standards and Interpretations is not expected to have a material impact on the financial statements of the Group or Parent
Company. Both of these standards are still subject to EU endorsement.
In addition the following standard is expected to have a significant impact on the Group and Company, however the Group is still considering the
impact.l IFRS 16 ‘Leases’ (effective for accounting periods commencing on or after 1 January 2019). This standard is still subject to EU endorsement.
Basis of consolidation
Subsidiaries are those entities controlled by the Company. Control exists when the Company has the power, directly or indirectly, to govern the
financial and operating policies of an entity so as to obtain benefits from its activities. In assessing control, potential voting rights that presently
are exercisable or convertible are taken into account. The Financial Statements of subsidiaries are included in the consolidated Financial
Statements from the date that control commences until the date that control ceases.
Property, plant and equipment
Property, plant and equipment are stated at cost or deemed cost less accumulated depreciation and impairment losses.
Certain items of property, plant and equipment that had been revalued to fair value on or prior to 1 April 2004, the date of transition to adopted IFRSs,
are measured on the basis of deemed cost, being the revalued amount at the date of that revaluation, as permitted by the exemption in IFRS 1.
Leases under which the Group assumes substantially all the risks and rewards of ownership are classified as finance leases. Plant and equipment
acquired by way of finance leases is stated at an amount equal to the lower of its fair value and the present value of the minimum lease payments
at the inception of the lease, less accumulated depreciation and impairment losses. Operating lease payments are accounted for as described in
the accounting policy on operating leases.
Where the information is available assets acquired via acquisitions are recorded in the accounting records on a gross cost and accumulated
depreciation basis.
Depreciation is provided by the Group to write off the cost or deemed cost less estimated residual value of tangible fixed assets using the
following annual rates:
Land and Buildings - Freehold buildings – 2% straight line
Land and Buildings - Leasehold improvements – Term of lease
Rental equipment – 7% - 33% straight line depending on asset type
Motor vehicles – 25% straight line
Other - Computers – 33% straight line
Other - Fixtures, fittings and other equipment – 10% - 20% straight line
Estimates of residual values are reviewed at least annually and adjustments made as appropriate. Any profit generated on disposal is credited to
cost of sales. No depreciation is provided on freehold land.

Vp plc Annual Report and Accounts 2016 www.vpplc.com
Strategic ReportGovernance
Financial Statements
Shareholder Information
65
Notes
Business combinations and goodwill
For acquisitions on or after 1 April 2010, the Group measures goodwill at the acquisition date as:
l the fair value of the consideration transferred; plus
l the recognised amount of any non-controlling interests in the acquiree; plus
l the fair value of the existing equity interest in the acquiree; less
l the net recognised amount (generally fair value) of the identifiable assets acquired and liabilities assumed.
Costs related to the acquisition are expensed to the income statement as incurred.
In respect of acquisitions between 1 April 2004 and 1 April 2010, goodwill represents the difference between the cost of the acquisitions and the
fair value of identifiable net assets and contingent liabilities acquired. Costs related to the acquisition were capitalised as part of the cost of the
acquisition.
Goodwill is stated at cost less any accumulated impairment losses and is included on the balance sheet as an intangible asset. It is allocated to
cash generating units and is not amortised, but tested annually for impairment against expected future cash flows from the cash generating unit
to which it is allocated.
The Group has chosen not to restate business combinations prior to 1 April 2004 on an IFRS basis as permitted by IFRS 1. Goodwill is included on
the basis of deemed cost for the transactions which represent its carrying value at the date of transition to adopted IFRSs.
Other intangible assets
Intangible assets other than goodwill that are acquired by the Group are stated at cost less accumulated amortisation and impairment losses.
Amortisation is included within cost of sales within the Income Statement. The rate of amortisation attempts to write-off the cost of the intangible
asset over its estimated useful life using the following rates:
Customer related intangibles – up to 10 years
Supply agreement – the initial term of the agreement
Trade names – over the estimated initial period of usage, normally 10 years
No amortisation is provided where trade names are expected to have an indefinite life.
Impairment
The carrying amounts of non financial assets are reviewed at each balance sheet date to determine whether there is any indication of impairment.
If any such indication exists, the asset’s recoverable amount is estimated. An impairment loss is recognised whenever the carrying amount of an
asset or its cash-generating unit exceeds its recoverable amount. Impairment losses are recognised through the Income Statement. For goodwill
and assets that have an indefinite useful life the recoverable amount is tested at each balance sheet date.
Investments
In the Company’s Financial Statements, investments in subsidiary undertakings are stated at cost less impairment.
Dividends received and receivable are credited to the Company’s Income Statement to the extent that the Company has the right to receive payment.
Inventories
Inventories are stated at the lower of cost and net realisable value. Net realisable value is the estimated selling price in the ordinary course of
business, less the estimated costs of completion and selling expenses.
Raw materials and consumables stock is held primarily for the repair and maintenance of fleet assets. Goods for resale relate to stock held for sale.
The basis of expensing stock is either on a first-in first-out basis or weighted average basis depending on the system used within each division.
Trade and other receivables
Trade and other receivables are stated at their due amounts less impairment losses.
1. SIGNIFICANT ACCOUNTING POLICIES (continued)

Vp plc Annual Report and Accounts 2016 www.vpplc.com66
Notes
Cash and cash equivalents
Cash and cash equivalents comprise cash balances and call deposits. Bank overdrafts that are repayable on demand and form an integral part of
the Group’s cash management are included as a component of cash and cash equivalents for the purposes of the Statement of Cash Flows.
Interest bearing loans and borrowings
Financial assets and liabilities are recognised on the balance sheet when the Group becomes party to the contractual provision of the instrument.
Interest bearing borrowings are recognised initially at fair value less directly attributable transaction costs. Subsequent to initial recognition,
interest bearing borrowings are stated at amortised cost with any difference between cost and redemption value being recognised in the Income
Statement over the periods of the borrowings on an effective interest basis.
Taxation
The charge for taxation is based on the results for the year and takes into account full provision for deferred taxation due to temporary differences.
Deferred tax is provided using the balance sheet liability method to provide for temporary differences between the carrying amounts of assets
and liabilities for financial reporting purposes and the amounts used for taxation purposes. The amount of deferred tax provided is based on the
expected manner of realisation or settlement of the carrying amount of assets and liabilities, using tax rates enacted or substantively enacted at
the balance sheet date.
A deferred tax asset is recognised only to the extent that it is probable that future taxable profits will be available against which the asset can
be utilised. Deferred tax assets are reduced to the extent that it is no longer probable that the related tax benefit will be realised. Deferred tax
assets and liabilities are not discounted and are offset where amounts will be settled on a net basis as a result of a legally enforceable right.
Current tax is the expected tax payable on the taxable income for the year, using rates enacted at the balance sheet date, and any adjustment
to tax payable in respect of prior years.
Trade and other payables
Trade payables are recognised initially at fair value and subsequently measured at amortised cost.
Employee benefits – pensions
Obligations for contributions to defined contribution pension plans are recognised as an expense in the income statement as incurred.
The Group’s net obligation in respect of its defined benefit pension plan is calculated by estimating the amount of future benefit that employees
have earned in return for their service in the current and prior periods; that benefit is discounted to determine its present value, and the fair value
of any plan assets is deducted. The liability discount rate is the yield at the balance sheet date on AA credit rated bonds that have maturity dates
approximating to the terms of the Group’s obligations. The calculation is performed by a qualified actuary using the projected unit credit method.
The Group’s net obligation is recorded as a balance sheet asset or liability and the actuarial gains and losses associated with this balance sheet
item are recognised in the Statement of Comprehensive Income as they arise. Actuarial gains and losses occur when actuarial assumptions differ
from those previously envisaged by the actuary or when asset returns differ from the liability discount rate. An asset for the surplus has been
recognised on the basis that it is recoverable prior to wind up of the scheme, however the balance sheet position is sensitive to small fluctuations
in the assumptions made.
When the benefits of the plan are improved, the proportion of the increased benefit relating to past service by employees is recognised as an
expense in the Income Statement on a straight-line basis over the average period until the benefits become vested. To the extent that the benefits
vest immediately, the expense is recognised immediately in the Income Statement.
The full service cost of the pension scheme is charged to operating profit.
1. SIGNIFICANT ACCOUNTING POLICIES (continued)

Vp plc Annual Report and Accounts 2016 www.vpplc.com
Strategic ReportGovernance
Financial Statements
Shareholder Information
67
Notes
Dividend
Dividends are recognised as a liability in the period in which they are approved, however interim dividends are recognised on a paid basis.
Share Capital
Ordinary shares are classified as equity.
Employee trust shares
The Group has an employee trust (the Vp Employee Trust) for the warehousing of shares in support of awards granted by the Company under its
various share option schemes. The Group accounts include the assets and related liabilities of the Vp Employee Trust. In both the Group and Parent
Company accounts the shares in the Group held by the employee trust are treated as treasury shares, are held at cost, and presented in the
balance sheet as a deduction from retained earnings. The shares are ignored for the purpose of calculating the Group’s earnings per share.
Treasury shares
When share capital recognised as equity is repurchased and classified as treasury shares the amount of the consideration paid is recognised as a
deduction from equity. When treasury shares are sold or reissued subsequently, the amount received is recognised as an increase in equity, and
the resulting surplus or deficit on the transaction is transferred to/from retained earnings.
Derivative financial instruments
Interest rate and exchange rate swaps are accounted for in the balance sheet at fair value and any movement in fair value is taken to the Income
Statement, unless the swap is designated as an effective hedge of the variability in cash flows, an “effective cash flow hedge”.
Where a derivative financial instrument is designated as an effective cash flow hedge, the effective part of any gain or loss on the derivative
financial instrument is recognised directly in equity. If a hedge of a forecasted transaction subsequently results in the recognition of a financial
asset or a financial liability, the associated gains and losses that were recognised directly in equity are reclassified into profit or loss in the same
period or periods during which the asset acquired or liability assumed affects profit or loss (i.e. when interest income or expense is recognised).
For cash flow hedges, other than those covered by the preceding policy statement, the associated cumulative gain or loss is removed from equity
and recognised in the Income Statement in the same period or periods during which the hedged item affects profit or loss.
When a hedging instrument expires or is sold, terminated or exercised, or the entity revokes designation of the hedge relationship but the hedged
forecast transaction is still expected to occur, the cumulative gain or loss at that point remains in equity and is recognised in accordance with the
above policy when the transaction occurs. If the hedged transaction is no longer expected to take place, the cumulative unrealised gain or loss
recognised in equity is recognised immediately in the Income Statement.
The fair value of interest rate swaps is the estimated amount the Group would receive or pay to terminate the swap at the balance sheet date,
taking into account current and future interest rates and the current creditworthiness of the swap counterparties. The fair value of the exchange
rate swap is the estimated amount the Group would receive or pay to terminate the swap at the balance sheet date taking account of current
and future exchange rates. The carrying value of hedge instruments is presented within other payables.
Financial guarantee contracts
Where the Company enters into financial guarantee contracts to guarantee the indebtedness of other companies within its group, the Company
considers these to be insurance arrangements, and accounts for them as such. In this respect, the Company treats the guarantee contract as a
contingent liability until such time as it becomes probable that the Company will be required to make a payment under the guarantee.
Revenue
Revenue represents the amounts (excluding Value Added Tax) derived from the hire of equipment and the provision of goods and services to
third party customers during the year. Revenue from equipment hire, which is the vast majority of Group revenues, is recognised from the start
of hire through to the end of the agreed hire period predominately on a time apportioned basis. Revenue from the sale of goods is recognised
when the significant risks and rewards of ownership have been transferred to the buyer and revenue from services rendered is recognised in the
Income Statement in proportion to the stage of completion of the transaction at the balance sheet date. As the Group does not in the course of
its ordinary activities routinely dispose of equipment held for hire any sales proceeds are shown as a reduction in cost of sales.
1. SIGNIFICANT ACCOUNTING POLICIES (continued)

Vp plc Annual Report and Accounts 2016 www.vpplc.com68
Notes
Share based payments
The fair value of share options is charged to the Income Statement based upon their fair value at the date of grant with a corresponding increase
in equity. The charge is recognised evenly over the vesting period of the options. The liabilities for cash settled share based payment arrangements
are measured at fair value.
The fair values are calculated using an appropriate option pricing model. The Group’s Approved, Unapproved and Save As You Earn (SAYE) schemes
have been valued using the Black-Scholes model and the Income Statement charge is adjusted to reflect the expected number of options that will
vest, based on expected levels of performance against non-market based conditions and the expected number of employees leaving the Group.
The fair values of the Group’s Long Term Incentive Plan (LTIP) and Share Matching scheme are calculated using a discounted grant price model,
again adjusted for expected performance against non-market based conditions and employees leaving the Group. Amendments to IFRS 2, “Share
Based Payments”, clarified the treatment of cancelled options, whereby if a grant of equity instruments is cancelled the Group shall account for the
cancellation as an acceleration of vesting and shall recognise immediately the amount that would have been recognised over the remainder of the
vesting period.
Any cash settled options are valued at their fair value as calculated at each period end, taking account of performance criteria and expected
numbers of employees leaving the Group and the liability is reflected in the balance sheet within accruals.
The parent company recharges the subsidiary entities with the fair value of the share options relating to the employees associated with that entity.
Foreign currencies
Transactions in foreign currencies are recorded using the rate of exchange ruling at the date of the transaction. Monetary assets and liabilities
denominated in foreign currencies are translated using the rate of exchange ruling at the balance sheet date and the gains or losses on translation
are included in the Income Statement. Non-monetary assets and liabilities that are stated at fair value are translated to sterling at the foreign
exchange rates ruling at the date the values were determined.
The assets and liabilities of foreign operations are translated at foreign exchange rates ruling at the balance sheet date. The revenues and
expenses of foreign operations are translated at rates approximating to the foreign exchange rates ruling at the date of the transactions. Foreign
exchange differences arising on retranslation are recognised directly in equity.
Operating leases - leasor
The Group’s rental fleet is hired to customers under simple operating leases with no contingent rent, purchase clauses or escalation clauses.
Operating leases - leasee
Payments made under operating leases are recognised in the Income Statement on a straight line basis over the term of the lease. In general
the Group is party to leases for property, vehicles, office equipment and rehired rental fleet. These leases are primarily simple operating leases
with no contingent rent, purchase clauses or escalation clauses.
Accounting estimates and judgements
The key accounting policies, estimates and judgements used in preparing the Group’s Annual Report and Accounts for the year ended 31 March
2016 have been reviewed and approved by the Audit Committee. The areas of principal accounting uncertainty are estimated useful lives of rental
assets, including residual values and assumptions relating to pension costs. In addition the testing for impairment of goodwill and other intangibles
requires significant estimates and judgements relating to cash flows.
The Group continually reviews depreciation rates and using its judgement adopts a cautious policy in assessing estimated useful economic lives
of fleet assets (see page 64). The rate of technological and legislative change is factored into the estimates, together with the diminution in value
through use and time. The Group also takes account of the profit or loss it makes on the disposal of fixed assets in determining whether
depreciation policies are appropriate.
The key assumptions and sensitivities applied to pensions are disclosed in note 24. The pension scheme position is derived using actuarial
assumptions for inflation, future salary increases, discount rates and mortality rates which are inherently uncertain. Due to the relative size of the
scheme, small changes to these assumptions can give rise to a significant impact on the pension scheme position reported in the Balance Sheet.
1. SIGNIFICANT ACCOUNTING POLICIES (continued)

Vp plc Annual Report and Accounts 2016 www.vpplc.com
Strategic ReportGovernance
Financial Statements
Shareholder Information
69
Notes
Goodwill and other intangibles are tested for impairment by reference to the expected estimated cash generated by the business unit. This isdeemed to be the best approximation of value, but is subject to the same uncertainties as the cash flow forecast being used. Further details areprovided in note 9.
In addition the Group’s results are subject to fluctuations caused by the cash settled share options and national insurance costs on unapprovedshare options as these are required to be re-measured at each reporting date based on the Company share price. Changes in the Company’s shareprice during the reporting period therefore impact the charge to the Income Statement for cash settled options and national insurance, includingvested but not exercised options, as well as unvested options. The impact of a 10 pence increase in share price would increase the charge to theIncome Statement by £43,000 (2015: £77,000).
2. SEGMENT REPORTING
Segment reporting is presented in respect of the Group’s business and geographical segments. The Group’s current reportable segments are thesix business units as described on pages 6 and 7. Total external revenue in 2016 was £208,746,000 (2015: £205,602,000). Inter-segment pricingis determined on an arm’s length basis. Included within revenue is £16.2 million (2015: £16.0 million) of revenue relating to the sale of goods,the rest of the revenue is service related including primarily hire revenue. Segment results, assets and liabilities include items directly attributableto a segment as well as those that can be allocated on a reasonable basis.
Geographical segments
Revenue is generated mainly within the United Kingdom with no single overseas geographical area accounting for more than 10% of the Grouprevenue. Total overseas revenue was £25.7 million (2015: £30.1 million). In addition, all material assets and liabilities of the Group are accountedfor by UK based companies. The Group has one operating branch of a UK registered company operating in another country within the EU, namelya branch of Hire Station Limited operating in Holland.
1. SIGNIFICANT ACCOUNTING POLICIES (continued)
Business segments
Operatingprofit before
Revenue amortisation2016 2015 2016) 2015
External) Internal) Total) External) Internal) Total)Revenue) Revenue) Revenue) Revenue) Revenue) Revenue)
£000) £000) £000) £000) £000) £000) £000) £000)
UK Forks 19,984) 493) 20,477) 18,247) 528) 18,775) 5,226) 4,025)
Groundforce 45,008) 186) 45,194) 44,350) 205) 44,555) 9,584) 8,833)
Airpac Bukom 15,191) -) 15,191) 21,460) -) 21,460) 1,232) 2,753)
Hire Station 82,486) 1,747) 84,233) 77,031) 1,209) 78,240) 11,491) 8,731)
Torrent Trackside 32,489) 29) 32,518) 29,929) 344) 30,273) 3,369) 3,429)
TPA 13,588) 574) 14,162) 14,585) 289) 14,874) 989) 1,009)
208,746) 3,029) 211,775) 205,602) 2,575) 208,177) 31,891) 28,780)
A reconciliation of operating profit before amortisation to profit before tax is provided in the Income Statement.
Operatingprofit before
Revenue amortisation2016 2015 2016) 2015
External) Internal) Total) External) Internal) Total)Revenue) Revenue) Revenue) Revenue) Revenue) Revenue)
£000) £000) £000) £000) £000) £000) £000) £000)
UK 193,555) 3,029) 196,584) 184,142) 2,575) 186,717) 30,659) 26,027)
International 15,191) -) 15,191) 21,460) -) 21,460) 1,232) 2,753)
208,746) 3,029) 211,775) 205,602) 2,575) 208,177) 31,891) 28,780)
In next year’s financial statements we will also report all the other segmental disclosures on this basis.
The segmental split above is provided on the basis of the Group reporting structure in 2015/16. Following the acquisition of TR Group Pty Limitedin April 2016 it has been decided to realign the Group reporting in 2016/17 to reflect the greater influence of international activities on the Group’sresults. As a result, from next year’s financial statements, we will be reporting two segments, namely UK and International. To aid the transitionbetween the old and new segmental reporting, set out below is the revenue and operating profit before amortisation as it would be reported ifthe new segments were already in place for 2015/16.

Vp plc Annual Report and Accounts 2016 www.vpplc.com70
Notes
2. SEGMENT REPORTING (continued)
Acquired Capital Depreciation andAssets Expenditure Amortisation
2016) 2015) 2016) 2015) 2016) 2015)
£000) £000) £000) £000) £000) £000)
UK Forks 6,518) -) 11,282) 11,542) 3,549) 3,487)
Groundforce -) -) 7,884) 6,663) 5,244) 5,010)
Airpac Bukom -) -) 1,290) 5,528) 3,661) 3,769)
Hire Station 3,838) -) 18,988) 21,466) 12,078) 10,222)
Torrent Trackside -) 5,116) 5,466) 5,040) 3,915) 2,820)
TPA -) -) 4,602) 2,449) 783) 1,015)
Group/unallocated -) -) 2,524) 3,649) 443) 384)
10,356) 5,116) 52,036) 56,337) 29,673) 26,707)
3. OPERATING PROFIT2016) 2015)
£000) £000)Operating profit is stated after charging/(crediting):
Amortisation of intangible assets 2,298) 1,684)
Depreciation of property, plant and equipment – owned 27,332) 24,994)
Depreciation of property, plant and equipment – leased 43) 29)
Operating leases - Rent of land and buildings 4,599) 4,315)
Operating leases - Hire of other assets 13,969) 13,558)
Profit on disposal of plant and equipment (6,246) (3,277)
Amounts paid to auditors:
Audit fees – parent company annual accounts 62) 62)
Audit fees – other group companies 69) 69)
Audit fees – total group 131) 131)
)
Audit related assurance services 16) 16)
Acquired assets relate primarily to tangible and intangible assets acquired as a result of acquisitions. Capital expenditure relates to tangible fixed
assets acquired in the normal course of business.
Included within segmental assets above is goodwill and indefinite life intangibles in relation to the following cash generating units:
Groundforce £10.4 million (2015: £10.4 million), Airpac Bukom £4.8 million (2015: £4.8 million), UK Forks £2.0 million (2015: £nil), TPA £9.3
million (2015: £9.3 million) and Hire Station £14.2 million (2015: £12.8 million).
Amounts paid to the Company’s auditors in respect of services to the Company, other than audit of the Company’s Financial Statements, have not
been disclosed as the information is only required to be disclosed on a consolidated basis.
The level of profit on disposal is higher than historical experience due to a combination of asset management and one off items.
Business segments Assets Liabilities Net Assets
2016) 2015) 2016) 2015) 2016) 2015)
£000) £000) £000) £000) £000) £000)
UK Forks 43,435) 31,605) 8,066) 4,643) 35,369) 26,962)
Groundforce 49,583) 50,139) 7,886) 9,981) 41,697) 40,158)
Airpac Bukom 26,998) 31,162) 4,563) 6,717) 22,435) 24,445)
Hire Station 88,528) 75,921) 20,237) 18,740) 68,291) 57,181)
Torrent Trackside 20,744) 20,378) 6,804) 7,733) 13,940) 12,645)
TPA 34,017) 30,082) 6,844) 5,731) 27,173) 24,351)
Group/unallocated 6,490) 5,800) 94,045) 79,775) (87,555) (73,975)
269,795) 245,087) 148,445) 133,320) 121,350) 111,767)

Vp plc Annual Report and Accounts 2016 www.vpplc.com
Strategic ReportGovernance
Financial Statements
Shareholder Information
71
Notes
4. EMPLOYMENT COSTS
Group
The average monthly number of persons employed by the Group (including directors) during the year, analysed by category, was as follows:
Number of employees
2016) 2015)
Operations 1,358) 1,259)
Sales 225) 208)
Administration 260) 259)
1,843) 1,726)
The aggregate payroll costs of these persons were as follows:
2016) 2015)
£000) £000)
Wages and salaries 60,831) 58,792)
Social security costs 5,658) 5,605)
Defined benefit pension costs (18) (27)
Other pension related costs 1,455) 1,474)
Share option costs including associated social security costs - equity settled 2,471) 2,548)
Share option costs including associated social security costs - cash settled 909) 1,110)
71,306) 69,502)
5. REMUNERATION OF DIRECTORS
The Group’s key management are the executive and non-executive directors. The aggregate remuneration paid to or accrued for the directors for
services in all capacities during the year is as follows:
2016) 2015)
£000) £000)
Basic remuneration including bonus and benefits 1,497) 2,232)
Cash allowances/pension contributions 257) 337)
Share options 1,876) 2,421)
3,630) 4,990)
Further details of directors’ remuneration, pensions and share options, including the highest paid director, are given in the Remuneration Report
on pages 36 to 48.
6. FINANCIAL INCOME AND EXPENSES2016) 2015)
£000) £000)Financial income:Bank and other interest receivable 4) 1)
Financial expenses:Bank loans, overdrafts and other interest (2,093) (2,022)Finance charges payable in respect of finance leases and hire purchase contracts (4) (2)
(2,097) (2,024)

Vp plc Annual Report and Accounts 2016 www.vpplc.com72
Notes
2016) 2016) 2015) 2015)%) £000) %) £000)
Profit before tax 27,500) 25,073)
Profit multiplied by standardrate of corporation tax 20.0) 5,500) 21.0) 5,265)
Effects of:Impact of tax rate changes (1.3) (349) 0.0) 3)Expenses not deductible for tax purposes 0.9) 250) 0.4) 93)Non-qualifying depreciation and amortisation 0.7) 192) 0.4) 101)Gains covered by exemption/losses (1.8) (499) (0.9) (237)Overseas tax rate 0.1) 19) 0.2) 46)Adjustments in respect of prior years 0.1) 15) 0.1) 36)Other (0.1) (16) (0.4) (105)
Total tax charge for the year 18.6) 5,112) 20.8) 5,202)
7. INCOME TAX EXPENSE2016) 2015)£000) £000)
Current tax expense)UK Corporation tax charge at 20% (2015: 21%) 5,502) 5,164)Overseas tax 479) 294)Adjustments in respect of prior years (135) 99)Total current tax 5,846) 5,557)
Deferred tax expenseCurrent year deferred tax (535) (295)Impact of tax rate change (349) 3)Adjustments to deferred tax in respect of prior years 150) (63)
Total deferred tax (734) (355)
Total tax expense in income statement 5,112) 5,202)
Tax recognised in reserves2016) 2015)
£000) £000)Other comprehensive income:Tax relating to actuarial gains on defined benefit pension scheme 24) (11)Tax relating to historic asset revaluations (1) (1)Impact of tax rate change 39) -)
62) (12)Direct to equity:Deferred tax relating to share based payments 974) 223)Current tax relating to share based payments (2,097) (1,368)Impact of tax rate change 31) -)
(1,092) (1,145)
Total (1,030) (1,157)
The corporation tax rate for the year ended 31 March 2016 was 20% (2015: 21%). The tax rate for the year ending 31 March 2017 will also be 20%.
The rate will reduce to 19% in the year ended 31 March 2018 and this reduction is reflected in the deferred tax balance. The rate of tax is expected
to further reduce to 17% in the year ended 31 March 2021, but this is not reflected in the deferred tax balance as it is expected that a substantial
proportion of the balance as at 31 March 2016 will reverse before 31 March 2020.
Reconciliation of effective tax rate
The tax on the Group’s profit before tax differs from the theoretical amount that would arise using the weighted average tax rate applicable toprofits of the consolidated entities as follows:

Vp plc Annual Report and Accounts 2016 www.vpplc.com
Strategic ReportGovernance
Financial Statements
Shareholder Information
73
Notes8. PROPERTY, PLANT AND EQUIPMENT
GROUP Land and) Rental) Motor) Other) Total)Buildings) Equipment) Vehicles) Assets)
Cost or deemed cost £000) £000) £000) £000) £000)At 1 April 2014 14,479) 206,896) 2,370) 12,682) 236,427)Additions 4,961) 49,266) 180) 1,930) 56,337)Acquisitions 17) 1,304) -) 68) 1,389)Disposals (537) (21,450) (591) (3,036) (25,614)Exchange rate differences (15) (1,155) (23) (33) (1,226)Transfer between categories (22) 58) (2) (34) -)
At 31 March 2015 18,883) 234,919) 1,934) 11,577) 267,313)
Additions 3,855) 45,904) 171) 2,106) 52,036)Acquisitions 119) 8,775) 762) 83) 9,739)Disposals (5) (28,847) ((113) (689) (29,654)Exchange rate differences 13) 873) 20) 31) 937)Transfer between categories -) (1) -) 1) -)
At 31 March 2016 22,865) 261,623) 2,774) 13,109) 300,371)
Depreciation and impairment lossesAt 1 April 2014 6,725) 93,959) 1,728) 9,181) 111,593)Charge for year 779) 22,372) 276) 1,596) 25,023)On disposals (477) (12,881) (556) (2,995) (16,909)Exchange rate differences (10) (166) (12) (23) (211)Transfer between categories (10) 5) -) 5) -)
At 31 March 2015 7,007) 103,289) 1,436) 7,764) 119,496)
Charge for year 971) 24,653) 209) 1,542) 27,375)On disposals (5) (17,977) (110) (629) (18,721)Acquisitions 70) 4,098) 452) 30) 4,650)Exchange rate differences 11) 316) 17) 26) 370)
At 31 March 2016 8,054) 114,379) 2,004) 8,733) 133,170)
Net book value
At 31 March 2016 14,811) 147,244) 770) 4,376) 167,201)
At 31 March 2015 11,876) 131,630) 498) 3,813) 147,817)
At 31 March 2014 7,754) 112,937) 642) 3,501) 124,834)
COMPANY Land and) Rental) Motor) Other) Total)Buildings) Equipment) Vehicles) Assets)
Cost or deemed cost £000) £000) £000) £000) £000)At 1 April 2014 8,530) 114,043) 770) 4,970) 128,313)Additions 4,055) 21,338) 147) 1,013) 26,553)Group transfers -) (1,185) -) -) (1,185)Disposals -) (9,171) (223) (48) (9,442)Transfer between categories -) -) (2) 2) -)
At 31 March 2015 12,585) 125,025) 692) 5,937) 144,239)
Additions 2,721) 18,792) 17) 1,266) 22,796)Group transfers -) 337) -) (14) 323)Disposals -) (12,909) (24) (38) (12,971)Transfer from acquisition 78) 6,727) 754) 50) 7,609)
At 31 March 2016 15,384) 137,972) 1,439) 7,201) 161,996)
Depreciation and impairment lossesAt 1 April 2014 3,585) 53,393) 461) 3,356) 60,795)Charge for year 293) 10,484) 97) 711) 11,585)Group transfers -) (641) -) -) (641)On disposals -) (5,967) (188) (24) (6,179)
At 31 March 2015 3,878) 57,269) 370) 4,043) 65,560)
Charge for year 396) 10,670) 97) 703) 11,866)Group transfers -) 59) -) (6) 53)On disposals -) (7,820) (21) (27) (7,868)Transfer from acquisition 70) 2,539) 452) 30) 3,091)
At 31 March 2016 4,344) 62,717) 898) 4,743) 72,702)
Net book valueAt 31 March 2016 11,040) 75,255) 541) 2,458) 89,294)
At 31 March 2015 8,707) 67,756) 322) 1,894) 78,679)
At 31 March 2014 4,945) 60,650) 309) 1,614) 67,518)

Vp plc Annual Report and Accounts 2016 www.vpplc.com74
Notes
8. PROPERTY, PLANT AND EQUIPMENT (continued)
The cost or deemed cost of land and buildings for the Group and the Company includes £3,204,000 (2015: £2,704,000) of freehold land not subject
to depreciation.
Included in the total net book value of fixed assets of the Group is £3,230,000 (2015: £nil) in respect of assets held under finance leases and
similar hire purchase contracts, Company £3,122,000 (2015: £nil). Depreciation for the year on these Group assets was £43,000 (2015: £29,000)
and £30,000 (2015: £29,000) for the Company. In addition the banks have a fixed and floating charge over the assets of the Group as set out in
note 14.
Goodwill and indefinite life intangible assets considered significant in comparison to the Group’s total carrying amount of such assets have been
allocated to cash generating units (CGUs) or groups of cash generating units as follows:
Goodwill Indefinite lifeintangible assets
2016 2015 2016 2015)
£000 £000 £000 £000)
Groundforce 10,397 10,397 - -)
Airpac Bukom 4,762 4,762 - -)
UK Forks 2,000 - - -)
Hire Station 14,227 12,766 - -)
TPA 7,921 7,921 1,400 1,400)
39,307 35,846 1,400 1,400)
9. INTANGIBLE ASSETS
GROUP Trade) Customer) Supply) Goodwill) Total)Names) Relationships) Agreements)
£000) £000) £000) £000) £000)
Cost or deemed cost
At 1 April 2014 2,385) 6,681) 1,262) 36,126) 46,454)
Acquired through business combinations -) -) 3,727) -) 3,727)
At 31 March 2015 2,385) 6,681) 4,989) 36,126) 50,181)
Acquired through business combinations -) 1,210) -) 4,057) 5,267)
At 31 March 2016 2,385) 7,891) 4,989) 40,183) 55,448)
Accumulated amortisation and impairment
At 1 April 2014 493) 3,595) 735) 280) 5,103)
Amortisation 98) 668) 918) -) 1,684)
At 31 March 2015 591) 4,263) 1,653) 280) 6,787)
Amortisation and impairment 105) 746) 851) 596) 2,298)
At 31 March 2016 696) 5,009) 2,504) 876) 9,085)
Carrying amount
At 31 March 2016 1,689) 2,882) 2,485) 39,307) 46,363)
At 31 March 2015 1,794) 2,418) 3,336) 35,846) 43,394)
At 31 March 2014 1,892) 3,086) 527) 35,846) 41,351)
An intangible asset of £1,400,000 (2015: £1,400,000) with an indefinite life is included within trade names and relates to the TPA name on the
basis that it is expected to be maintained indefinitely and continue to deliver future value to the Group. The impairment test of this has been
performed using the same assumptions as for the other intangibles.
Goodwill arising on business combinations has been allocated to the CGU’s that are expected to benefit from those business combinations.
As explained in note 2 the Group has identified 6 reportable segments (2015: 6 segments) five of which align with the CGUs to which goodwill
is allocated.

Vp plc Annual Report and Accounts 2016 www.vpplc.com
Strategic ReportGovernance
Financial Statements
Shareholder Information
75
Notes
9. INTANGIBLE ASSETS (continued)
The directors have reviewed the carrying amount of the Company’s goodwill on the same basis as the Group‘s goodwill and concluded that noimpairment charge is required.
COMPANY Trade ) Customer) Supply)Names Relationships Agreements) )
Goodwill) Total)
Cost or deemed cost £000 £000) £000) £000) £000)
At 1 April 2014 643 3,750) 394) )15,031) 19,818)
Acquired through business combinations - -) -) )-) -)
At 31 March 2015 643 3,750) 394) 15,031) 19,818)
Acquired through business combinations - -) -) 2,000) 2,000)
At 31 March 2016 643 3,750) 394) 17,031) 21,818)
Accumulated amortisation
At 1 April 2014 242 1,627) 229) )-) 2,098)
Amortisation charge 64 375) 131) -) 570)
At 31 March 2015 306 2,002) 360) -) 2,668)
Amortisation charge 64 374) 34) -) 472)
At 31 March 2016 370 2,376) 394) -) 3,140)
Carrying amount
At 31 March 2016 273 1,374) -) 17,031) 18,678)
At 31 March 2015 337 1,748) 34) 15,031) 17,150)
At 31 March 2014 401 2,123) 165) 15,031) 17,720)
COMPANY
Cost £000)
At 1 April 2014 and 31 March 2015 27,517)
Acquisition 4,100)
Transfer to goodwill (2,000)
At 31 March 2016 29,617)
Impairment
At 1 April 2014, 31 March 2015 and 31 March 2016 1,687)
Carrying amount
At 31 March 2016 27,930)
At 31 March 2015 25,830)
At 31 March 2014 25,830)
10. INVESTMENTS IN SUBSIDIARIES
The carrying value of intangibles and goodwill has been assessed for impairment by reference to its value in use. Values have been estimatedusing cash flow projections over a period of 5 years derived from the approved budget for the coming year. The key assumptions within the cashflow projections are those regarding revenue, margin and level of capital spend required to support the business. These assumptions have beenvalidated based on past experience, market conditions and the size of the fleet. The Group tests goodwill annually for impairment or morefrequently if there are any indications that goodwill might be impaired. Following this assessment some small impairments were booked relatingto tidying up some very old balances.
The pre tax discount rate applied to all CGU’s was 8% (2015: 8%), an estimate based on the group’s weighted cost of capital. A growth rate factorwas not applied to the projections as value in use exceeded the carrying value before such an assumption was applied. Based on this testing thedirectors do not consider any of the goodwill or intangible assets carried forward at the year end to be impaired even allowing for a reasonabledegree of sensitivity to the underlying assumptions, including the discount rate. The compound annual growth rate in PBTA experienced by theGroup was 16.7% over the last 5 years and therefore could have been justifiably in the projections.
See note 30 for details of subsidiary undertakings.

Vp plc Annual Report and Accounts 2016 www.vpplc.com76
Notes
The maximum exposure to credit risk at the reporting date is the carrying value of each class of receivables as shown above. The Group does nothold any collateral as security. Receivables acquired as part of the acquisitions in the year were £1,614,000 (2015: £nil).
During the year there was a decrease in the provisions for impairment of trade receivables of £1,212,000 (2015: £1,374,000 increase). The Grouphas a reasonable spread of credit risk with the top 25 customers accounting for significantly less than 50% of gross trade debtors. The ageing ofthe Group’s trade receivables (net of impairment provision) at the end of the year was as follows:
13. CASH AND CASH EQUIVALENTSGroup Company
2016 2015 2016) 2015)£000 £000 £000) £000)
Bank balances 4,517 5,236 657) 1,555)
12. TRADE AND OTHER RECEIVABLESGroup Company
2016) 2015) 2016) 2015)
£000) £000) £000) £000)
Gross trade receivables 42,174) 41,225) 17,024) 16,873)
Trade receivables provisions (3,810) (5,022) (1,831) (2,590)
Amounts owed by subsidiary undertakings -) -) 36,888) 33,967)
Other receivables 87) 178) -) -)
Prepayments and accrued income 6,366) 4,721) 2,669) 2,905)
44,817) 41,102) 54,750) 51,155)
On this basis there are £13.2 million of trade receivables that are overdue at the balance sheet date that have not been provided against. Thereis no indication as at 31 March 2016 that debtors will not meet their payment obligations in respect of trade receivables recognised in the balancesheet that are overdue and unprovided. On this basis there is no material difference between the fair value and the carrying value.
14. INTEREST-BEARING LOANS AND BORROWINGS
Group Company
2016 2015 2016 2015)
£000 £000 £000 £000)
Current liabilities
Bank overdraft - - 5,662 4,263)
Obligations under finance leases and hire purchase contracts 873 - 823 -)
873 - 6,485 4,263)
Non-current liabilities )
Secured bank loans 88,000 72,000 88,000 72,000)
Obligations under finance leases and hire purchase contracts 1,778 - 1,748 -)
89,778 72,000 89,748 72,000)
11. INVENTORIESGroup Company
2016 2015) 2016 2015)
£000 £000) £000 £000)
Raw materials and consumables 3,166 3,084) 1,238 883)
Goods for resale 2,197 3,411) 178 1,068)
5,363 6,495) 1,416 1,951)
During the year, as a result of the year end assessment of inventory, there was a £275,000 increase in the provision for impairment of inventories(2015: £237,000 increase). The cost of goods for resale expensed during the year was £11.4 million (2015: 11.7 million). Due to the nature ofthe spares expenditure and the approach to accounting for spares, including acquiring spares on a needs basis, it is not possible to provide thevalue of spares inventory expensed.
2016) 2015)
£000) £000)
Not overdue 25,139) 24,171)
0 - 30 days overdue 9,596) 8,184)
31 - 90 days overdue 1,952) 2,268)
More than 90 days overdue 1,677) 1,580)
38,364) 36,203)

Vp plc Annual Report and Accounts 2016 www.vpplc.com
Strategic ReportGovernance
Financial Statements
Shareholder Information
77
Notes
14. INTEREST-BEARING LOANS AND BORROWINGS (continued)
The Group’s bank accounts are subject to set off arrangements covered by cross guarantees and, where appropriate, are presented accordingly.
In particular at Group level the overdraft in Vp plc of £6.9 million with HSBC is offset against other HSBC sterling cash balances in the Group.
Similarly in the Parent Company accounts the net overdraft reported of £5.7 million is after set off of sterling cash balances within the Company
of £1.2 million. The bank loans and overdraft are secured by a fixed and floating charge over the assets of the Group and are at variable interest
rates linked to LIBOR. The unutilised bank facilities available to the Group as at 31 March 2016 were £12.0 million.
There is no material difference between the carrying value and fair value of the Group’s borrowings. Further details relating to the Group’s funding
strategy (including the maturity details of the bank loans) and its credit, interest rate and currency risk policies are provided in the Financial Review
on pages 18 to 20 and the Risk Management Report on pages 21 and 22. The loans are subject to covenants and these have been fulfilled at all
times during the year.
Liquidity Risk
The following are cash flows relating to the Group’s financial liabilities, including estimated interest payments, but excluding the impact of netting
agreements, based on the assumption that the loans are repaid at the end of the committed period and interest rates reflect future dated swap
agreements.
GROUP Carrying) Contractual) Less than) 1-2) 2-5)amount) cash flows) 1 year) years) years)
31 March 2016 £000) £000) £000) £000) £000)
Secured bank loans 88,000) 93,825) 1,834) 44,912) 47,079)
Finance lease liabilities 2,651) 3,122) 1,035) 853) 1,234)
Trade and other payables 46,628) 46,628) 46,628) -) -)
137,279) 143,575) 49,497) 45,765) 48,313)
31 March 2015
Secured bank loans 72,000) 75,730) 1,615) 36,668) 37,447)
Trade and other payables 50,221) 50,221) 50,221) -) -)
122,221) 125,951)
51,836) 36,668) 37,447)
The repayment schedule of the carrying amount of the non-current liabilities as at 31 March 2016 is:
Group Company
Due in more than one year but not
more than two years: 2016 2015 2016 2015)
£000 £000 £000 £000)
Secured bank loans 43,000 35,000 43,000 35,000)
Obligations under finance leases and hire purchase contracts 724 - 694 -)
43,724 35,000 43,694 35,000)
Due in more than two years but not
more than five years:
Secured bank loans 45,000 37,000 45,000 37,000)
Obligations under finance leases and hire purchase contracts 1,054 - 1,054 -)
Total 46,054 37,000 46,054 37,000)
2016) 2015)
£000) £000)
Total borrowing 90,651) 72,000)
Cash or cash equivalents (4,517) (5,236)
Net debt 86,134) 66,764)
Net debt defined as total borrowings less cash and cash equivalents was:

Vp plc Annual Report and Accounts 2016 www.vpplc.com78
Notes
14. INTEREST-BEARING LOANS AND BORROWINGS (continued)
COMPANY Carrying Contractual) Less than) 1-2) 2-5)amount cash flows) 1 year) years) years)
31 March 2016 £000 £000) £000) £000) £000)
Secured bank loans 88,000 93,825) 1,834) 44,912) 47,079)
Bank overdraft 5,662 5,662) 5,662) -) -)
Finance lease liabilities 2,571 3,039) 983) 822) 1,234)
Trade and other payables 43,133 43,133) 43,133) -) -)
139,366 145,659) 51,612) 45,734) 48,313)
31 March 2015
Secured bank loans 72,000 75,730) 1,615) 36,668) 37,447)
Bank overdraft 4,263 4,263) 4,263) -) -)
Trade and other payables 44,114 44,114) 44,114) -) -)
120,377 124,107) 49,992) 36,668) 37,447)
Hire purchase and finance lease liabilities
GROUP Payment) Interest) Principal) Payment) Interest) Principal)
2016) 2016) 2016) 2015) 2015) 2015)
£000) £000) £000) £000) £000) £000)
Less than one year 1,035) 162) 873) -) -) -)
One to two years 853) 129) 724) -) -) -)
Two to five years 1,234) 180) 1,054) -) -) -)
3,122) 471) 2,651) -) -) -)
15. FINANCIAL INSTRUMENTS
During the year the Group had eight interest rate swaps to fix interest rates on a proportion of the revolving credit facility. Details are as follows:
Start date Finish date Notional Debt value Fixed marginAugust 2013 August 2016 7,500,000 1.323%October 2013 October 2016 2,500,000 0.980%
November 2013 October 2016 2,500,000 0.980%April 2014 April 2017 1,500,000 1.400%April 2014 April 2017 1,500,000 1.390%
1 June 2015 1 June 2018 5,000,000 1.045%1 September 2015 1 September 2018 5,000,000 1.120%1 December 2015 1 December 2018 7,500,000 1.200%
All of the swaps are effective cash flow hedges and the movements in fair values have been taken to equity. Fair values of these derivatives havebeen determined by the respective counterparties based on quoted prices in active markets for identical assets and liabilities.
The Group had twelve foreign exchange hedges to reduce the risk of foreign exchange fluctuations between US Dollars and Sterling in the yearended 31 March 2016. It also has a further nine foreign exchange hedges between US Dollars and Sterling covering the period from 1 April 2016to 30 June 2017. In addition to the US Dollar hedges the group also had Australian Dollar and Singapore Dollar hedges in the year. All the exchangerate hedges are effective cash flow hedges and movements in fair value have been taken to equity.
An analysis of fair values by hierarchy level is provided below:
Liabilities measured at fair value:31 March 2016 31 March 2015)
Total) Level 1 Level 2) Level 3) Total)£000) £000) £000) £000) £000)
Financial liabilities at fair value:Interest rate swaps 309) -) 309) -) 278)Forward exchange rate agreements 459) -) 459) -) 1,066)
768) -) 768) -) 1,344)
The values are based on the amount the Group would pay/receive from the bank in order to settle the instruments at the year end.
COMPANY Payment) Interest) Principal) Payment) Interest) Principal)
2016) 2016) 2016) 2015) 2015) 2015)
£000) £000) £000) £000) £000) £000)
Less than one year 983) 160) 823) -) -) -)
One to two years 822) 128) 694) -) -) -)
Two to five years 1,234) 180) 1,054) -) -) -)
3,039) 468) 2,571) -) -) -)
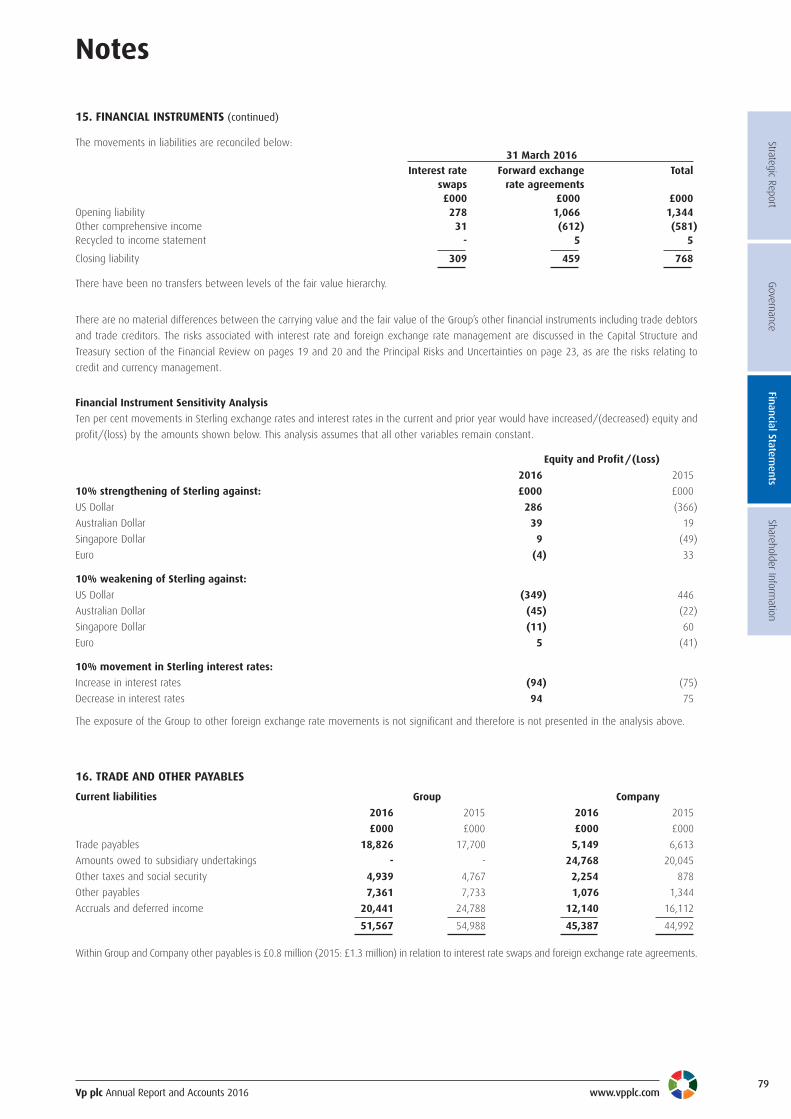
Vp plc Annual Report and Accounts 2016 www.vpplc.com
Notes
15. FINANCIAL INSTRUMENTS (continued)
Financial Instrument Sensitivity Analysis
Ten per cent movements in Sterling exchange rates and interest rates in the current and prior year would have increased/(decreased) equity and
profit/(loss) by the amounts shown below. This analysis assumes that all other variables remain constant.
The exposure of the Group to other foreign exchange rate movements is not significant and therefore is not presented in the analysis above.
There are no material differences between the carrying value and the fair value of the Group’s other financial instruments including trade debtors
and trade creditors. The risks associated with interest rate and foreign exchange rate management are discussed in the Capital Structure and
Treasury section of the Financial Review on pages 19 and 20 and the Principal Risks and Uncertainties on page 23, as are the risks relating to
credit and currency management.
Equity and Profit/(Loss)
2016) 2015)
10% strengthening of Sterling against: £000) £000)
US Dollar 286) (366)
Australian Dollar 39) 19)
Singapore Dollar 9) (49)
Euro (4) 33)
10% weakening of Sterling against:
US Dollar (349) 446)
Australian Dollar (45) (22)
Singapore Dollar (11) 60)
Euro 5) (41)
10% movement in Sterling interest rates:
Increase in interest rates (94) (75)
Decrease in interest rates 94) 75)
16. TRADE AND OTHER PAYABLES
Current liabilities Group Company
2016 2015) 2016) 2015)
£000 £000) £000) £000)
Trade payables 18,826 17,700) 5,149) 6,613)
Amounts owed to subsidiary undertakings - -) 24,768) 20,045)
Other taxes and social security 4,939 4,767) 2,254) 878)
Other payables 7,361 7,733) 1,076) 1,344)
Accruals and deferred income 20,441 24,788) 12,140) 16,112)
51,567 54,988) 45,387) 44,992)
The movements in liabilities are reconciled below:31 March 2016
Interest rate) Forward exchange Total)swaps) rate agreements£000) £000) £000)
Opening liability 278) 1,066) 1,344)Other comprehensive income 31) (612) (581)Recycled to income statement -) 5) 5)
Closing liability 309) 459) 768)
There have been no transfers between levels of the fair value hierarchy.)
Strategic ReportGovernance
Financial Statements
Shareholder Information
79
Within Group and Company other payables is £0.8 million (2015: £1.3 million) in relation to interest rate swaps and foreign exchange rate agreements.

Vp plc Annual Report and Accounts 2016 www.vpplc.com80
Notes
17. DEFERRED TAX ASSETS AND LIABILITIES
Deferred tax assets and liabilities are attributable to the following:
Deferred tax assets have been recognised on employee benefits and other items on the basis that there will be future taxable profits against
which these assets can be utilised. Deferred tax assets and liabilities are only offset where there is a legally enforceable right of offset and there
is an intention to settle the net balance.
GROUP Property, plant) Intangible) Employee) Other)and equipment) assets) benefits) items) Total)
Note £000) £000) £000) £000) £000)
1 April 2014 5,967) 1,420) (2,619) (237) 4,531)
Recognised in income statement 231) (94) (174) (318) (355)
Recognised in equity 7 (1) -) 212) -) 211)
Foreign exchange (3) -) -) -) (3)
At 31 March 2015 6,194) 1,326) (2,581) (555) 4,384)
Recognised on acquisition 333) 242) -) -) 575)
Recognised in income statement (1,059) (185) 295) 215) (734)
Recognised in equity 7 (4) -) 1,071) -) 1,067)
Foreign exchange 4) -) -) -) 4)
At 31 March 2016 5,468) 1,383) (1,215) (340) 5,296)
COMPANY Property, plant) Intangible) Employee) Other)and equipment) assets) benefits) items) Total)
Note £000) £000) £000) £000) £000)
1 April 2014 4,517) 663) (2,619) (109) 2,452)
Recognised in income statement 350) (68) (174) (114) (6)
Recognised in equity 7 (1) -) 212) -) 211)
At 31 March 2015 4,866) 595) (2,581) (223) 2,657)
Recognised on acquisition 280) -) -) -) 280)
Recognised in income statement (825) (97) 295) 74) (553)
Recognised in equity 7 (4) -) 1,071) -) 1,067)
At 31 March 2016 4,317) 498) (1,215) (149) 3,451)
2016) 2015)
Ordinary share capital £000) £000))
Allotted, called up and fully paid
40,154,253 Ordinary shares of 5 pence each 2,008) 2,008)
(2015: 40,154,253)
18. CAPITAL AND RESERVES
All shares have the same voting rights.
Reserves
Full details of reserves are provided in the consolidated and parent company statements of changes in equity on page 59.
Own shares held
Deducted from retained earnings (Group and Company) is £8,064,000 (2015: £8,203,000) in respect of own shares held by the Vp Employee
Trust. The Trust acts as a repository of issued Company shares and held 1,082,000 shares (2015: 1,315,000) with a market value at 31 March
2016 of £7,144,000 (2015: £8,665,000).

Vp plc Annual Report and Accounts 2016 www.vpplc.com
Strategic ReportGovernance
Financial Statements
Shareholder Information
81
Notes
The dividend paid in the year is after dividends were waived to the value of £198,000 (2015: £198,000) in relation to shares held by the Vp
Employee Trust. These dividends will continue to be waived in the future.
In addition the directors are proposing a final dividend in respect of the current year of 13.5p per share which will absorb an estimated £5,281,000
of shareholders’ funds. The proposed dividend is subject to approval by shareholders at the Annual General Meeting and has not been included
as a liability in these financial statements.
19. DIVIDENDS2016) 2015)
£000) £000)
Amounts recognised as distributions to equity holders of the Parent in the year:
Ordinary shares:
Final paid 11.50p (2015: 10.40p) per share 4,482) 4,039)
Interim paid 15.35p (2015: 5.00p) per share 2,086) 1,947)
6,568) 5,986)
20. EARNINGS PER SHARE
Basic earnings per share
The calculation of basic earnings per share of 57.49 pence (2015: 51.03 pence) was based on the profit attributable to equity holders of the Parent
of £22,388,000 (2015: £19,871,000) and a weighted average number of ordinary shares outstanding during the year ended 31 March 2016 of
38,942,000 (2015: 38,940,000), calculated as follows:
Basic earnings per share before the amortisation of intangibles was 62.21 pence (2015: 54.45 pence) and is based on an after tax add back of
£1,838,000 (2015: £1,330,000) in respect of the amortisation of intangibles.
Diluted earnings per share
The calculation of diluted earnings per share of 54.51 pence (2015: 47.01 pence) was based on profit attributable to equity holders of the Parent
of £22,388,000 (2015: £19,871,000) and a weighted average number of ordinary shares outstanding during the year ended 31 March 2016 of
41,069,000 (2015: 42,273,000), calculated as follows:
2016) 2015)
Shares) Shares)
000s) 000s)
Issued ordinary shares 40,154) 40,154)
Effect of own shares held (1,212) (1,214)
Weighted average number of ordinary shares 38,942) 38,940)
Diluted earnings per share before the amortisation of intangibles was 58.99 pence (2015: 50.15 pence).
2016 2015)
Shares Shares)
000s 000s)
Weighted average number of ordinary shares 38,942 38,940)
Effect of share options 2,127 3,333)
Weighted average number of ordinary shares (diluted) 41,069 42,273)

Vp plc Annual Report and Accounts 2016 www.vpplc.com82
Notes
21. SHARE OPTION SCHEMES
SAYE SchemeDuring the year options over a further 333,575 shares were granted under the SAYE scheme at a price of 620 pence. The outstanding options atthe year end were:
Date of Grant Price per share Number of shares
July 2012 197p 1,827
June 2013 282p 353,294
July 2014 530p 251,223
July 2015 620p 304,488
910,832
All the options are exercisable between 3 and 3.5 years. At 31 March 2016 there were 841 employees saving an average £138 per month inrespect of options under the SAYE scheme. The only SAYE scheme condition is continuous employment over the term of the option.
Approved Share Option SchemeOptions over a further 174,000 shares were granted during the year at a price of 770 pence. The options outstanding at the year end were:
Date of Grant Price per share Number of shares
July 2008 213.0p 7,136
July 2009 154.0p 2,460
July 2011 249.5p 18,050
July 2012 266.5p 51,900
July 2013 389.0p 242,775
July 2014 680.0p 136,625
July 2015 770.0p 170,600
629,546
These options are exercisable between the third and tenth anniversary of the grant. The awards for 2013 to 2015 are subject to achievement ofperformance targets over a three year period. The awards for 2012 and prior are vested, but not yet exercised.
Unapproved Share Option Scheme
Options over 302,250 shares were granted during the year at a price of 770 pence. The options outstanding at the year end were:
Date of Grant Price per share Number of shares
July 2006 293.0p 23,000
July 2008 213.0p 7,805
July 2009 154.0p 11,480
July 2010 165.0p 59,913
July 2011 249.5p 76,500
July 2012 266.5p 228,650
July 2013 389.0p 609,225
July 2014 680.0p 354,575
July 2015 770.0p 294,400
1,665,548
These options are exercisable between the third and tenth anniversary of the grant. The awards for 2013 to 2015 are subject to achievement ofperformance targets over a three year period. The awards for 2012 and prior are vested, but not yet exercised

Vp plc Annual Report and Accounts 2016 www.vpplc.com
Strategic ReportGovernance
Financial Statements
Shareholder Information
83
Notes
21. SHARE OPTION SCHEMES (continued)
Long-Term Incentive PlanAwards were made during the year in relation to a further 241,300 shares. Shares outstanding at the year end were:
Date of Grant Number of shares
July 2012 66,000
July 2013 443,900
July 2014 260,700
July 2015 241,300
1,011,900
These options are exercisable between the third and tenth anniversary of the grant. The awards for 2013 to 2015 are subject to achievement of
performance targets over a three year period as shown in the Remuneration Report on page 38. The awards for 2012 are vested, but not yet
exercised.
Share Matching
Awards were made during the year in relation to a further 19,300 shares. Shares outstanding at the year end were:
Date of Grant Number of shares
August 2006 750
August 2008 446
August 2009 7,657
August 2010 5,231
August 2011 4,000
July 2012 8,500
August 2013 35,250
July 2014 22,000
August 2015 19,300
103,134
These options are exercisable between the third and tenth anniversary of the grant. The awards for 2013 to 2015 are subject to achievement ofperformance targets over a three year period as shown in the Remuneration Report on page 38. The awards for 2012 and prior are vested, butnot yet exercised.
Awards under the above schemes will be generally made utilising shares owned by the Vp Employee Trust.
The market value of the ordinary shares at 31 March 2016 was 660 pence (2015: 659 pence), the highest market value in the year to 31 March2016 was 816 pence and the lowest 640 pence. The average share price during the year was 720 pence.
The number and weighted average exercise price of share options is as follows:
2016 2015Weighted) Number of) Weighted) Number of)
average) options) average) options)exercise price) 000s) exercise price) 000s)
Outstanding at beginning of the year 251p) 5,857) 191p) 6,625)
Lapsed during the year 462p) (222) 351p) (210)
Exercised during the year 156p) (2,384) 152p) (1,702)
Granted during the year 536p) 1,070) 261p) 1,144)
Outstanding at the end of the year 362p) 4,321) 251p) 5,857)
Exercisable at the year end 208p) 581) 165p) 888)
The options outstanding at 31 March 2016 have an exercise price in the range of 0.0p to 770p and have a weighted average life of 2.1 years.

Vp plc Annual Report and Accounts 2016 www.vpplc.com84
Notes
21. SHARE OPTION SCHEMES (continued)
For options granted, the fair value of services received in return for share options granted are measured by reference to the fair value of those
share options. The fair value for the approved, unapproved and SAYE options are measured using the Black-Scholes model and the LTIP and share
matching schemes are valued using a discounted grant price method. Cash settled options are valued at their fair value at each year end. The
assumptions used to value the models are in the following ranges:
The expected volatility is based on historic volatility which is based on the latest three years’ share price data.
The cost of share options charged to the Income Statement is shown in note 4.
The total carrying amount of cash settled transaction liabilities including associated national insurance at the year end was £1,631,000
(2015: £3,136,000). £496,000 of this liability had vested at the year end (2015: £1,305,000).
2016 2015Weighted average fair value per share 256.8p 315.0pShare price at date of grant 770.0p to 775.0p 640.0p to 680.0pExercise price (details provided above) 0p to 770.0p 0p to 680.0pExpected volatility 26.9% to 28.3% 39.2% to 40.3%Option life 3 to 10 years 3 to 10 yearsExpected divided yield 2.4% to 2.4% 2.3% to 2.4%Risk free rate 0.50% 0.50%
22. OPERATING LEASES
The total remaining cost of non-cancellable operating leases is payable as follows:
2016 2015Land and Other Land and Other)buildings buildings
£000 £000 £000 £000)GROUPOperating leases which expire:
Within one year 3,554 5,052 3,631 4,192)In the second to fifth years inclusive 7,767 5,965 5,675 5,534)Over five years 857 134 852 235)
12,178 11,151 10,158 9,961)COMPANYOperating leases which expire:
Within one year 685 3,632 796 3,070)In the second to fifth years inclusive 1,896 3,085 1,222 3,303)Over five years 222 - 180 -)
2,803 6,717 2,198 6,373)
23. CAPITAL COMMITMENTS
Capital commitments for property, plant and equipment at the end of the financial year for which no provision has been made are as follows:
Group Company2016 2015 2016 2015)£000 £000 £000 £000)
Contracted 6,525 7,630 4,292 3,674)
24. EMPLOYEE BENEFITS
Defined benefit scheme
The details in this section of the note relate solely to the defined benefit arrangement and exclude any allowance for contributions in respect of
death in service insurance premiums and expenses which are also borne by the Company.
The Company operates a UK registered trust based pension scheme that provides defined benefits. Pension benefits are linked to the members’
final pensionable salaries and service at their retirement (or date of leaving if earlier). The Trustee is responsible for running the Scheme in
accordance with the Scheme’s Trust Deed and Rules. The Trustee of the Scheme is required to act in the best interests of the beneficiaries of the
Scheme.

Vp plc Annual Report and Accounts 2016 www.vpplc.com
Strategic ReportGovernance
Financial Statements
Shareholder Information
85
Notes
24. EMPLOYEE BENEFITS (continued)
There are three categories of pension scheme member:
l Active members: currently employed by the Company and accruing benefits
l Deferred members: former employees of the Company or current employees no longer accruing benefits
l Pension members: in receipt of pension.
The defined benefit obligation is valued by projecting the best estimate of future benefit outgoings (allowing for future salary increases for active
members, revaluation to retirement for deferred members and annual pension increases for all members) and then discounting to the balance
sheet date. The majority of benefits are subject to increases linked to inflation (subject to a cap of no more than 5% pa). The valuation method
used is known as the Projected Unit Method. The approximate duration of the Scheme’s defined obligation as at 31 March 2016 was 14 years.
The Trustee is required to carry out an actuarial valuation every 3 years. The last actuarial valuation of the Schemes performed by the Scheme
Actuary for the Trustee as at 31 March 2015, is currently being finalised. The Company agreed to pay annual contributions of 24.1% of members’
pensionable salaries to 31 March 2016 and 37.9% per annum of members’ pensionable salaries from 1 April 2016. The Company therefore
expects to pay £21,000 to the Scheme during the accounting year beginning 1 April 2016.
Through the Scheme, the Company is exposed to a number of risks:
l Asset volatility: the Scheme’s defined benefit obligation is calculated using a discount rate set with reference to corporate bond yields,
however the Scheme invests significantly in diversified growth assets. These assets are expected to outperform corporate bonds in the
long term, but provide volatility and risk in the short term.
l Changes in bond yields: a decrease in corporate bond yields would increase the Scheme’s defined benefit obligation.
l Inflation risk: a significant proportion of the Scheme’s defined benefit obligation is linked to inflation. Therefore higher inflation will result
in a higher defined benefit obligation.
l Life expectancy: if Scheme members live longer than expected, the Scheme’s benefits will need to be paid for longer, increasing the
Scheme’s defined benefit obligation.
The Trustee and Company manage risks in the Scheme through the following strategies:
l Diversification: investments are well diversified, such that the failure of any single investment would not have a material impact on the
overall level of assets.
l Investment strategy: the Trustee is required to review its investment strategy on a regular basis.
l LDI: the scheme invests in Liability Driven Investments (LDI) funds in order to control interest rate and inflation risks.
All actuarial gains and losses are recognised in the year in which they occur in the Statement of Comprehensive Income. From 1 April 2013 the
Group and the Company have adopted IAS 19 revised as set out in the accounting policies in note 1.
Present value of net surplus Group and Company2016) 2015)£000) £000)
Present value of defined benefit obligation (9,058) (9,345)Fair value of scheme assets 10,592) 10,388)
Present value of net surplus 1,534) 1,043)

Vp plc Annual Report and Accounts 2016 www.vpplc.com86
Notes
Expense recognised in the Income Statement Group and Company2016) 2015)£000) £000)
Current service costs 19) 11)
Net interest (37) (38)
(((18) (27)
24. EMPLOYEE BENEFITS (continued)
2016) 2015)£000) £000)
Cost of sales 19) 11)Administrative expenses (37) (38)
(18) (27)
These expenses are recognised in the following line items in the Income Statement: Group and Company
Cumulative actuarial net losses reported in the statement of comprehensive income since 1 April 2004, the transition to adopted IFRSs, for theGroup and Company are £2,075,000 (2015: £2,197,000).
The fair value of the scheme assets and the return on those assets were as follows:Group and Company
2016) 2015)Fair value of assets £000) £000)Diversified growth funds 8,008) 5,910)Bonds and cash 168) 4,478)Liability driven investments 2,416) -)
10,592) 10,388)
Returns
Actual return on scheme assets 317) 1,457)
Scheme assets and returns
None of the fair values of the assets shown above include any of the Company’s own financial instruments or any property occupied by or otherassets used by the Company. All assets listed above have a quoted market price in an active market.
Amount recognised in other comprehensive income Group and Company2016) 2015)£000) £000)
Actuarial gains/(losses) on defined benefit obligation 125) (1,126)Actual return on assets less interest (3) 1,071)
Amount recognised in other comprehensive income 122) (55)
2016) 2015)Present) Fair) Total) Present) Fair) Total)value of) value of) value of) value of)
obligation) assets) obligation) assets)£000) £000) £000) £000) £000) £000)
At beginning of year (9,345) 10,388) 1,043) (8,318) 9,007) 689)
Current service cost (19) -) (19) (11) -) (11)
Interest (cost)/income (283) 320) 37) (348) 386) 38)
Re-measurements
Actuarial gains/(losses): change in demographic assumptions 90) -) 90) (11) -) (11)
Actuarial gains/(losses): change in financial assumptions 234) -) 234) (1,115) -) (1,115)
Actuarial losses: experience differingfrom that assumed (199) -) (199) -) - -)
Actuarial (losses)/gains: actual return on assets -) (3) (3) -) 1,071 1,071)
Contributions: employer -) 351) 351) -) 382) 382)
Contributions: employees (3) 3) -) (3) 3) -)
Benefits paid 467) (467) -) 461) (461) -)
(9,058) 10,592) 1,534) (9,345) 10,388) 1,043)
The movement in the defined benefit surplus is as follows:
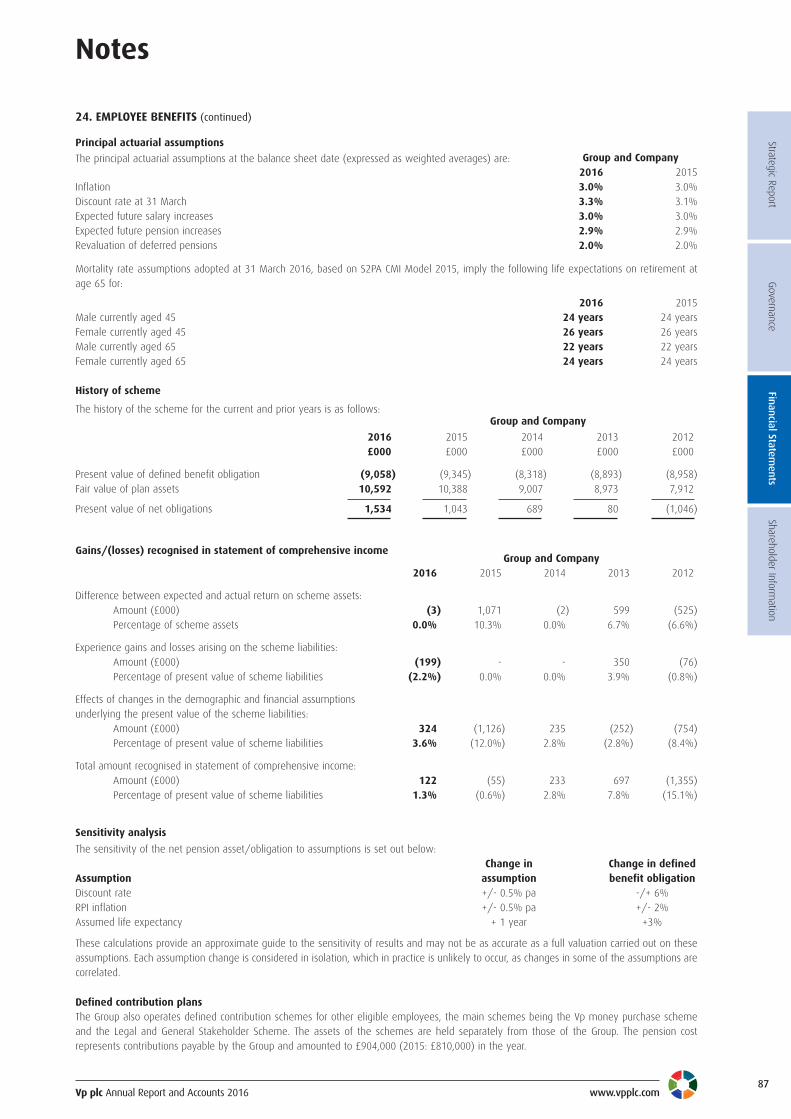
Vp plc Annual Report and Accounts 2016 www.vpplc.com
Strategic ReportGovernance
Financial Statements
Shareholder Information
87
Notes
24. EMPLOYEE BENEFITS (continued)
Group and Company2016 2015
Inflation 3.0% 3.0%Discount rate at 31 March 3.3% 3.1%Expected future salary increases 3.0% 3.0%Expected future pension increases 2.9% 2.9%Revaluation of deferred pensions 2.0% 2.0%
2016 2015Male currently aged 45 24 years 24 yearsFemale currently aged 45 26 years 26 yearsMale currently aged 65 22 years 22 yearsFemale currently aged 65 24 years 24 years
History of scheme
The history of the scheme for the current and prior years is as follows:Group and Company
2016) 2015) 2014) 2013) 2012)£000) £000) £000) £000) £000)
Present value of defined benefit obligation (9,058) (9,345) (8,318) (8,893) (8,958)Fair value of plan assets 10,592) 10,388) 9,007) 8,973) 7,912)
Present value of net obligations 1,534) 1,043) 689) 80) (1,046)
Mortality rate assumptions adopted at 31 March 2016, based on S2PA CMI Model 2015, imply the following life expectations on retirement atage 65 for:
Principal actuarial assumptions
The principal actuarial assumptions at the balance sheet date (expressed as weighted averages) are:
Gains/(losses) recognised in statement of comprehensive incomeGroup and Company
2016) 2015) 2014) 2013) 2012)
Difference between expected and actual return on scheme assets:Amount (£000) (3) 1,071) (2) 599) (525)Percentage of scheme assets 0.0%) 10.3%) 0.0%) 6.7%) (6.6%)
Experience gains and losses arising on the scheme liabilities:Amount (£000) (199) -) -) 350) (76)Percentage of present value of scheme liabilities (2.2%) 0.0%) 0.0%) 3.9%) (0.8%)
Effects of changes in the demographic and financial assumptionsunderlying the present value of the scheme liabilities:
Amount (£000) 324) (1,126) 235) (252) (754)Percentage of present value of scheme liabilities 3.6%) (12.0%) 2.8%) (2.8%) (8.4%)
Total amount recognised in statement of comprehensive income:Amount (£000) 122) (55) 233) 697) (1,355)Percentage of present value of scheme liabilities 1.3%) (0.6%) 2.8%) 7.8%) (15.1%)
Defined contribution plansThe Group also operates defined contribution schemes for other eligible employees, the main schemes being the Vp money purchase schemeand the Legal and General Stakeholder Scheme. The assets of the schemes are held separately from those of the Group. The pension costrepresents contributions payable by the Group and amounted to £904,000 (2015: £810,000) in the year.
These calculations provide an approximate guide to the sensitivity of results and may not be as accurate as a full valuation carried out on theseassumptions. Each assumption change is considered in isolation, which in practice is unlikely to occur, as changes in some of the assumptions arecorrelated.
Sensitivity analysis
The sensitivity of the net pension asset/obligation to assumptions is set out below:Change in Change in defined
Assumption assumption benefit obligationDiscount rate +/- 0.5% pa -/+ 6%RPI inflation +/- 0.5% pa +/- 2%Assumed life expectancy + 1 year +3%

Vp plc Annual Report and Accounts 2016 www.vpplc.com88
Notes
25. BUSINESS COMBINATIONS
The Group acquired the following businesses from 1 April 2014 to 31 March 2016:
Name of acquisition Date of acquisition Type of acquisition Acquired by
Higher Access Ltd 29 February 2016 Share purchase Vp plc(100% equity)
Test & Measurement 4 November 2015 Share purchase Hire Station LimitedGroup Limited (100% equity)
Trackside plant and equipment 28 July 2014 Business and assets Torrent Trackside Limitedrental business of Balfour BeattyRail Limited
Details of the acquisitions are provided below:
Group Company
2016) 2015) 2016) 2015)
£000) £000) £000) £000)
Property, plant and equipment 5,089) 1,389) 4,518) -)
Current assets 1,614) 289) 1,037) -)
Net debt (2,166) -) (2,662) -)
Tax, trade and other payables (1,512) -) (793) -)
Book value of assets acquired 3,025) 1,678) 2,100) -)
Fair value adjustments
Intangibles on acquisition 1,210) 3,727) -) -)
Deferred tax on intangibles (242) -) -) -))
Fair value of assets acquired 3,993) 5,405) 2,100) -)
Goodwill on acquisition 4,057) -) 2,000) -)
Cost of acquisitions 8,050) 5,405) 4,100) -)
Satisfied by
Cash consideration 8,050) 5,405) 4,100) -)
Analysis of cash flow
for acquisitions
Cash consideration 8,050) 5,405) 4,100) -)
Net cash included in acquisitions (982) -) (382) -)
7,068) 5,405) 3,718) -)
The acquisitions were made to grow market share and expand the product range. Intangibles were identified in relation to the acquisitions year
ended 31 March 2016 in relation to customer lists. In the year ended 31 March 2015 the intangibles related to a supply agreement. The
amortisation periods for these intangibles are set out in note 1. The acquisition costs expensed in the year ended 31 March 2016 in relation to
these acquisitions were £104,000.
As the acquisitions were not material to the trading performance of the Group they have not been disclosed separately in the Income Statement.
For the same reason, disclosure of the revenue or profit for the combined entity, if the business combination had occurred on 1 April 2015, has
not been provided.
26. POST BALANCE SHEET EVENT
On the 21 April 2016 the Group acquired TR Pty Limited, a group based in Australia, for cash consideration of A$17.4 million (Australian Dollars).
Vp plc Annual Report and Accounts 2016 www.vpplc.com
Strategic ReportGovernance
Financial Statements
Shareholder Information
89
Notes
27. RELATED PARTIES
Material transactions with key management (being the directors of the Group) mainly constitute remuneration including share based payments,
details of which are included in the Remuneration Report on pages 36 to 48 and in note 5 to the Financial Statements. In addition two directors
have sold some Vp plc shares they acquired, as a result of exercising their options, to the Vp Employee Trust at market value, being the previous
days closing mid market share price, namely 119,000 shares at a market value of £916,300 and 80,000 shares at a market value of £616,000.
Furthermore, a company van was sold to a Director for £3,750 based on an independent valuation of the vehicle.
Trading transactions with subsidiaries – Group
Transactions between the Company and the Group’s subsidiaries, which are related parties, have been eliminated on consolidation and are
therefore not disclosed.
Trading transactions with subsidiaries – Parent Company
The Company enters into transactions with its subsidiary undertakings in respect of the following:
l Internal funding loans
l Provision of Group services (including Senior Management, IT, Group Finance, Group HR, Group Properties and Shared Service Centre)
l Rehire of equipment on commercial terms
Recharges are made for Group services based on the utilisation of those services, however the Group does not charge interest on internal funding.
In addition to these services the Company acts as a buying agent for certain Group purchases such as insurance and IT services. These are
recharged based on utilisation by the subsidiary undertaking.
The amount outstanding from subsidiary undertakings to the Company at 31 March 2016 totalled £36,888,000 (2015: £33,967,000). Amounts
owed to subsidiary undertakings by the Company at 31 March 2016 totalled £24,768,000 (2015: £20,045,000).
The Company and certain subsidiary undertakings have entered into cross guarantees of bank loans and overdrafts to the Company. The total value
of such borrowings at 31 March 2016 was £88.0 million (2015: £72.0 million).
28. CONTINGENT LIABILITIES
There are no contingent liabilities (2015: nil) in respect of the Group or Company.
29. ULTIMATE PARENT COMPANY
The Company is a subsidiary undertaking of Ackers P Investment Company Limited which is the ultimate parent Company incorporated in Great
Britain. Consolidated accounts are prepared for this Company. Ackers P Investment Company Limited is ultimately controlled by a number of Trusts
of which, for the purposes of Sections 252 to 255 of the Companies Act 2006, Jeremy Pilkington is deemed to be a connected person.
30. SUBSIDIARY UNDERTAKINGS
The investments in trading subsidiary undertakings as at 31 March 2016 are:
Country of Principal Country of Class andRegistration or Activity Principal Percentage ofIncorporation Operation Shares Held
Torrent Trackside Limited England Rail equipment hire UK Ordinary shares 100%
Hire Station Limited England Tool hire UK Ordinary shares 100%
TPA Portable Roadways Limited England Hire of portable roadways UK Ordinary shares 100%
Airpac Bukom OilfieldServices Pte Limited
Singapore Oilfield services Singapore Ordinary shares 100%
Airpac Bukom OilfieldServices (Curacao) NVA
Curacao Oilfield services Curacao Ordinary shares 100%
Airpac Bukom OilfieldServices Middle East FZE
Sharjah Oilfield services Sharjah Ordinary shares 100%
Airpac Bukom OilfieldServices (Australia) Pty Limited
Australia Oilfield services Australia Ordinary shares 100%
Vp GmbH Germany Equipment hire Germany Ordinary shares 100%
Vp Equipment Rental(Ireland) Limited
Ireland Equipment hire Ireland Ordinary shares 100%

Vp plc Annual Report and Accounts 2016 www.vpplc.com90
Notes
30. SUBSIDIARY UNDERTAKINGS (continued)
The full list of the dormant subsidiary undertakings as at 31 March 2016 is:
Country of Principal Country of Class andRegistration or Activity Principal Percentage ofIncorporation Operation Shares Held
Stoppers Specialists Limited England Dormant n/a Ordinary shares 100%
Trench Shore Limited England Dormant n/a Ordinary shares 100%
UK Training Limited England Dormant n/a Ordinary shares 100%
Vibroplant Investments Limited England Dormant n/a Ordinary shares 100%
Bukom General OilfieldServices Limited
England Dormant n/a Ordinary shares 100%
Redding Hire Limited England Dormant n/a Ordinary shares 100%
Climate Hire & Sales Limited England Dormant n/a Ordinary shares 100%
Fred Pilkington & Son Limited England Dormant n/a Ordinary shares 100%
Vacuum Excavation Limited England Dormant n/a Ordinary shares 100%
Domindo Tool Hire Limited England Dormant n/a Ordinary shares 100%
Instant Tool Hire Limited England Dormant n/a Ordinary shares 100%
The Handi Hire Group Limited England Dormant n/a Ordinary shares 100%
Halls Hire Centres Limited England Dormant n/a Ordinary shares 100%
L&P 52 Limited England Dormant n/a Ordinary shares 100%
Northern Site Supplies Limited England Dormant n/a Ordinary shares 100%
Power Tool Supplies Limited England Dormant n/a Ordinary shares 100%
Hire & Sales (Canterbury) Limited England Dormant n/a Ordinary shares 100%
Handy Tool Hire (Derby) Limited England Dormant n/a Ordinary shares 100%
Handy Tool Hire(Nottingham) Limited
England Dormant n/a Ordinary shares 100%
Handy Tool Hire(Loughborough) Limited
England Dormant n/a Ordinary shares 100%
Cool Customers Limited England Dormant n/a Ordinary shares 100%
Arcotherm (GB) Limited England Dormant n/a Ordinary shares 100%
Vibroplant Trustees Limited England Dormant n/a Ordinary shares 100%
Vibrobet Limited England Dormant n/a Ordinary shares 90%
UM (Holdings) Limited England Dormant n/a Ordinary shares 100%
Harbray (Plant Hire) Limited England Dormant n/a Ordinary shares 100%
Power Rental Services Limited England Dormant n/a Ordinary shares 100%
Rapid Response Barriers Limited England Dormant n/a Ordinary shares 100%
U Mole Limited England Dormant n/a Ordinary shares 100%
727 Plant Limited England Dormant n/a Ordinary shares 100%
Cannon Tool Hire Limited England Dormant n/a Ordinary shares 100%
Thanet (Hire) Plant Limited England Dormant n/a Ordinary shares 100%
The Hire Brigade Limited England Dormant n/a Ordinary shares 100%
MEP Hire Limited Scotland Dormant n/a Ordinary shares 100%
Able Safety (Yorkshire) Limited England Dormant n/a Ordinary shares 100%
Arcotherm (UK) Limited England Dormant n/a Ordinary shares 100%
Saville Hire Limited England Dormant n/a Ordinary shares 100%
Vibroplant Limited England Dormant n/a Ordinary shares 100%
Mechanical ElectricalPress Fittings Limited
Scotland Dormant n/a Ordinary shares 100%
Arco’therm Limited England Dormant n/a Ordinary shares 100%
Mr Cropper Limited England Dormant n/a Ordinary shares 100%
Airpac Bukom Oilfield Nigeria Dormant n/a Ordinary shares 100%Services (Nigeria) Limited
Direct Instrument Hire Limited England Dormant n/a Ordinary shares 100%
Test & Measurement HireGroup Limited England Dormant n/a Ordinary shares 100%
Test & Measurement Hire Limited England Dormant n/a Ordinary shares 100%
Higher Access Limited England Dormant n/a Ordinary shares 100%

Vp plc Annual Report and Accounts 2016 www.vpplc.com
Strategic ReportGovernance
Financial Statements
Shareholder Information
91
Five Year Summary
2012) 2013) 2014) 2015) 2016)
£000) £000) £000) £000) £000)
Revenue 161,514) 167,034) 183,064) 205,602) 208,746)
Operating profit before amortisation 18,500) 19,815) 21,831) 28,780) 31,891)
Profit before amortisation and taxation 15,961) 17,351) 20,053) 26,757) 29,798)
Profit before taxation 15,328) 16,402) 18,933) 25,073) 27,500)
Taxation (3,101) (3,353) (3,238) (5,202) (5,112)
Profit after taxation 12,227) 13,049) 15,695) 19,871) 22,388)
Dividends✶ (4,457) (4,437) (4,962) (5,986) (6,568)
Share capital 2,309) 2,008) 2,008) 2,008) 2,008)
Capital redemption reserve -) 301) 301) 301) 301)
Reserves 88,725) 98,586) 105,648) 109,431) 119,014)
Total equity before non-controlling interest 91,034) 100,895) 107,957) 111,740) 121,323)
Share Statistics
Asset value 197p) 251p) 269p) 278p) 302p)
Earnings (pre amortisation) 30.76p) 35.47p) 41.97p) 54.45p) 62.21p)
Dividend✶✶ 11.35p) 12.25p) 14.00p) 16.50p) 18.85p)
Times covered (pre amortisation) 2.71p) 2.90p) 3.00p) 3.30p) 3.30p)
✶✶ Dividends under IFRS relate only to dividends declared in that year.
✶✶ Dividends per share statistics are the dividends related to that year whether paid or proposed.
Vp plc Annual Report and Accounts 2016 www.vpplc.com92
Executive DirectorsJeremy F G Pilkington, B.A. Hons. (Chairman)
Neil A Stothard, M.A., F.C.A.
Allison M Bainbridge, M.A., F.C.A.
Non-Executive DirectorsStephen Rogers B.Sc., F.C.A., J.P.
Philip M White B.Com, F.C.A., CBE
SecretaryAllison M Bainbridge
Registered OfficeCentral House, Beckwith Knowle,
Otley Road, Harrogate, North Yorkshire, HG3 1UD
Registered in England and Wales: No 481833
Telephone: 01423 533400
Independent AuditorPricewaterhouseCoopers LLP
Benson House, 33 Wellington Street, Leeds, LS1 4JP
SolicitorsSquire Patton Boggs (UK) LLP,
6, Wellington Place, Leeds LS1 4AP
Registrars and Transfer OfficeCapita Asset Services, The Registry, 34 Beckenham Road,
Beckenham, Kent, BR3 4TU
BankersHSBC Bank plc
Lloyds Bank plc
Merchant BankersN M Rothschild & Sons Limited
StockbrokersN+1 Singer
Public RelationsBuchanan Communication
Directors and Advisors


