www.cihi.caAt the heart of data
Emergency treatment Canadian allergists’ recommendations include the following if you suspect an anaphylactic reaction:2
• Give epinephrine auto-injector.• Call 9-1-1.• Go to the nearest hospital.
AcknowledgementsCIHI would like to acknowledge AllerGen NCE and Food Allergy Canada (formerly Anaphylaxis Canada) for their collaboration on this project.
Contact [email protected]
References1. Pawankar R, et al. Introduction and
executive summary: allergic disease as a global public health issue. In: Pawankar R, et al., eds. World Allergy Organization (WAO) White Book on Allergy, 2011–2012. 2011.
2. Canadian Society of Allergy and Clinical Immunology. Anaphylaxis in Schools and Other Settings. 2014.
Up to 30% of people are affected by some kind of allergy.1 Anaphylaxis is a serious allergic reaction that is rapid in onset and may cause death.2 Anaphylaxis symptoms can range from mild to severe and typically involve at least 2 body systems (e.g., respiratory, cardiovascular). This information is intended to build awareness and support policy development around anaphylaxis and severe allergy.
Each year, 1% of all emergency department (ED) visits are for an allergic reaction (including anaphylaxis). 8% of these visits are for anaphylaxis specifically.
Figure 1: Number of visits to the ED for allergic reaction (including anaphylaxis), by age, 2006–2007 to 2013–2014
NoteIncludes Ontario and Alberta.SourcesNational Ambulatory Care Reporting System, 2006–2007 to 2013–2014, Canadian Institute for Health Information; Alberta Ambulatory Care Reporting System, 2006–2007 to 2009–2010, Alberta Health Services.
Anaphylaxis and Allergy in the Emergency Department
21,636 22,154 22,572 23,265 23,519 25,686 25,359 27,121
41,803 42,091 39,179 42,879 41,825 43,291 47,428 49,547
6,717 6,992 6,4327,457 7,058 7,527
8,4768,750
70,156 71,237 68,18373,601 72,402
76,504 81,26385,418
0
10,000
20,000
30,000
40,000
50,000
60,000
70,000
80,000
90,000
Numb
er of
ED
visits
<18 years 65+ years
2006–2007 2007–2008 2008–2009 2009–2010 2010–2011 2011–2012 2012–2013 2013–2014
18–64 years
• In Ontario and Alberta alone, there were more than 85,400 ED visits for an allergic reaction (including anaphylaxis) in 2013–2014.
•Extrapolating to all of Canada means there would have been more than 171,000 visits to the ED for allergy that year.
•Children younger than 18 made up 1 in 3 patients coming to the ED for allergic reactions, compared with 1 in 5 for all other reasons.
•Mostallergicreactionswereclassifiedas“Unspecified”(69%).Insect/snakebitesaccountedfor15%of visits; 11% of visits were food related and 5% were drug related.
People more often go to the ED for allergic reactions in the summer; visits for food-related reactions are also common in December.
Table 1: Percentage of visits to the ED for allergic reaction (including anaphylaxis), by category and month, 2013–2014
Jan. Feb. Mar. Apr. May Jun. Jul. Aug. Sep. Oct. Nov. Dec.Unspecified*Insect/snake biteFoodDrugAll other ED visits
6.9 6.3 7.3 8.0 9.6 9.7 10.3 10.2 9.3 8.3 7.2 7.10.1 0.1 0.2 0.5 2.9 5.1 23.7 29.9 29.5 7.4 0.4 0.2
7.7 7.2 8.2 7.3 8.7 8.5 8.8 9.3 8.5 8.5 8.1 9.28.2 8.6 8.7 8.7 8.3 7.9 8.7 7.6 7.8 8.6 8.5 8.4
8.3 7.6 8.5 8.1 8.7 8.4 8.8 8.6 8.3 8.4 7.9 8.4
Notes*Includeshives,edemaandotherunspecifiedreactions.Orange boxes indicate a greater percentage of visits.Includes Prince Edward Island, Nova Scotia, Ontario, Manitoba, Saskatchewan, Alberta and Yukon. Source National Ambulatory Care Reporting System, 2014, Canadian Institute for Health Information.
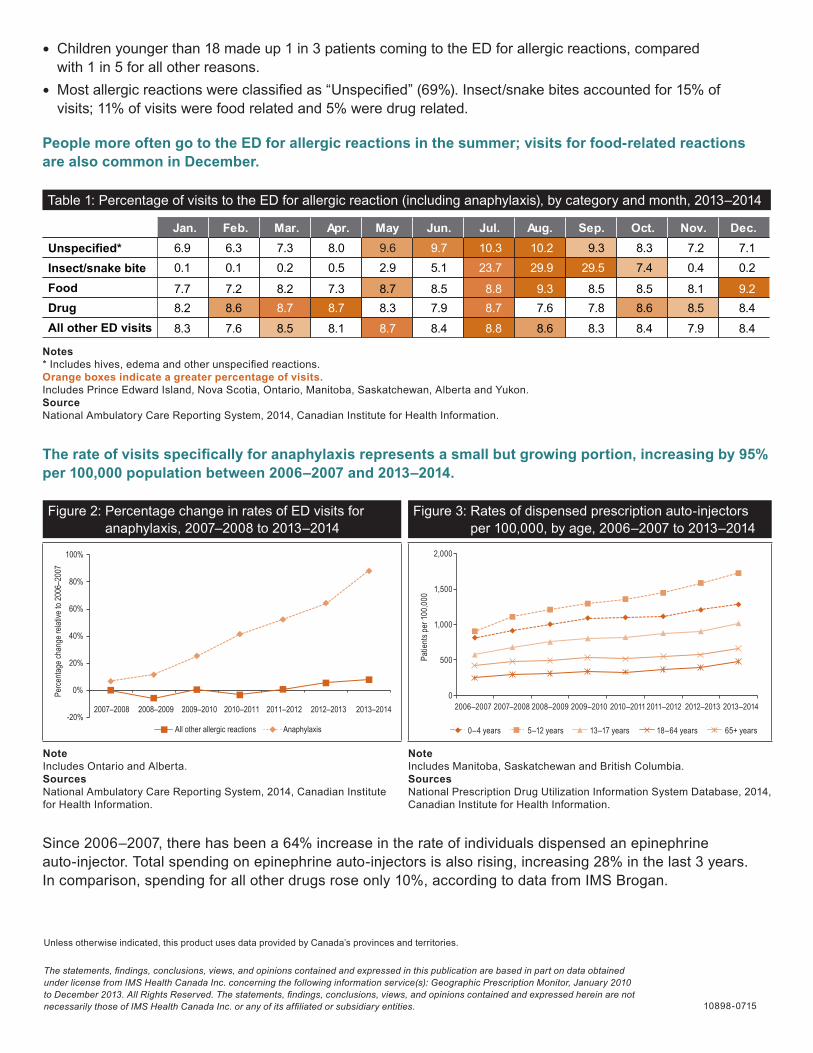
The rate of visits specifically for anaphylaxis represents a small but growing portion, increasing by 95% per 100,000 population between 2006–2007 and 2013–2014.
Figure 2: Percentage change in rates of ED visits for anaphylaxis, 2007–2008 to 2013–2014
NoteIncludes Ontario and Alberta.SourcesNational Ambulatory Care Reporting System, 2014, Canadian Institute for Health Information.
Figure 3: Rates of dispensed prescription auto-injectors per 100,000, by age, 2006–2007 to 2013–2014
NoteIncludes Manitoba, Saskatchewan and British Columbia.SourcesNational Prescription Drug Utilization Information System Database, 2014, Canadian Institute for Health Information.
-20%
0%
20%
40%
60%
80%
100%
All other allergic reactions Anaphylaxis
2007–2008 2008–2009 2009–2010 2010–2011 2011–2012 2012–2013 2013–2014
Perce
ntage
chan
ge re
lative
to 20
06–2
007
0
500
1,000
1,500
2,000
Patie
nts p
er 10
0,00
0
2007–20082006–2007 2008–2009 2009–2010 2010–2011 2011–2012 2012–2013 2013–2014
0–4 years 5–12 years 13–17 years 18–64 years 65+ years
Since 2006–2007, there has been a 64% increase in the rate of individuals dispensed an epinephrine auto-injector. Total spending on epinephrine auto-injectors is also rising, increasing 28% in the last 3 years. In comparison, spending for all other drugs rose only 10%, according to data from IMS Brogan.
Unless otherwise indicated, this product uses data provided by Canada’s provinces and territories.
The statements, findings, conclusions, views, and opinions contained and expressed in this publication are based in part on data obtained under license from IMS Health Canada Inc. concerning the following information service(s): Geographic Prescription Monitor, January 2010 to December 2013. All Rights Reserved. The statements, findings, conclusions, views, and opinions contained and expressed herein are not necessarily those of IMS Health Canada Inc. or any of its affiliated or subsidiary entities. 10898-0715


