Jessica A. Gover
Civic Analytics Network, Ash Center for Democratic Governance and
Innovation, Harvard Kennedy School
July 2018
Analytics in City GovernmentHow the Civic Analytics Network Cities Are Using Data to Support Public Safety, Housing, Public Health, and Transportation

Jessica A. Gover
Civic Analytics Network, Ash Center for Democratic Governance and
Innovation, Harvard Kennedy School
July 2018
Analytics in City GovernmentHow the Civic Analytics Network Cities Are Using Data to Support Public Safety, Housing, Public Health, and Transportation

analytics in city government: How the Civic Analytics Network Cities Are Using Data
to Support Public Safety, Housing, Public Health, and Transportation
iii
acknowledgements
The Civic Analytics Network project, including this paper, is generously funded by the
Laura and John Arnold Foundation. This report is an independent work product and the
views expressed are those of the author and do not necessarily represent those of the
funder.
The Civic Analytics Network is led by Professor Stephen Goldsmith, director of the
Innovations in American Government Program at the Ash Center. Professor Goldsmith
provided crucial insights for the development of the policy recommendations in this
report. A sincere thank you to the following Ash Center staff members and Civic Ana-
lytics Network partners for their feedback and contributions to this report: Katherine
Hillenbrand, project manager, Data-Smart City Solutions, Ash Center at the Harvard
Kennedy School; Lauren Haynes, associate director, Center for Data Science and Public
Policy at the University of Chicago; Sean Thornton, Civic Analytics Network program
advisor, Ash Center at the Harvard Kennedy School; and Joseph Walsh, data scientist,
Center for Data Science and Public Policy at the University of Chicago.
analytics in city government: How the Civic Analytics Network Cities Are Using Data
to Support Public Safety, Housing, Public Health, and Transportation
iv
about the author
Jessica A. Gover is a research assistant and writer at the Harvard Ash Center supporting
the Civic Analytics Network. Prior to joining the Ash Center, she conducted research
on new approaches to data- and tech-enabled policy in the U.S. federal government,
innovative public-private partnerships in New Zealand, and civic participation in the
American jury system. She holds a Master’s degree from the University of Chicago and
received her B.A. at Trinity College.
about the civic analytics network
Based at the Ash Center for Democratic Governance and Innovation at the Harvard Ken-
nedy School and funded by the Laura and John Arnold Foundation, the Civic Analytics
Network is an affiliation of chief data officers from the largest and most innovative
municipalities in United States. They are open data stewards, internal consultants,
and performance managers. The network seeks to advance the use of data and ana-
lytics in municipal governance through facilitation of in-person meetings among mem-
bers and production of research and documented best practices. For more on the Civic
Analytics Network, please visit civicanalyticsnetwork.org.
about the ash center
The Roy and Lila Ash Center for Democratic Governance and Innovation advances
excellence and innovation in governance and public policy through research, educa-
tion, and public discussion. The Ford Foundation is a founding donor of the Center.
Three major programs support the Center’s mission: The Program on Democratic Gov-
ernance, the Innovations in Government Program, and the Rajawali Foundation Insti-
tute for Asia.

analytics in city government: How the Civic Analytics Network Cities Are Using Data
to Support Public Safety, Housing, Public Health, and Transportation
v
contents
Introduction 1
How to Approach Analytics Project Development 3
Analytics Project Examples 12
Public Safety 13
1. Smoke Detectors and Fire Risk New Orleans 13
2. Police Early Intervention Systems The University of Chicago 14
Housing 17
3. Housing Inspections San José 17
4. Landlord Discrimination New York City 18
5. Blight Remediation New Orleans 19
Public Health 21
6. West Nile Virus Chicago 21
7. Zika Virus New Orleans 22
8. Restaurant Inspections Chicago 23
9. Pest Control Chicago & Washington, D.C. 24
Transportation 26
10. Traffic Collisions: Vision Zero New York City 26
Policy Recommendations for Implementing Analytics 28
Appendix A: The University of Chicago’s Data Maturity Framework 34
Appendix B: The University of Chicago’s Project Scoping Worksheet 38
Appendix C: City of Chicago’s Research Question Evaluation Criteria 43

analytics in city government: How the Civic Analytics Network Cities Are Using Data
to Support Public Safety, Housing, Public Health, and Transportation
1
introduction
From remediating blight to optimizing restaurant inspections and pest control, cities
across the country are using analytics to help improve municipal policy and perfor-
mance. The continued adoption of analytics in city governments shows no sign of
slowing, and as even more sophisticated tools such as machine learning and artificial
intelligence are deployed, there is a critical need for research on how these practices
are reshaping urban policy. By examining and capturing lessons learned from city-level
analytics projects, practitioners and theorists alike can better understand how data-
and tech-enabled innovations are affecting municipal governance. This report seeks to
contribute to that developing field.
Members of the Civic Analytics Network, a peer group of leading urban chief data
officers convened by the Harvard Ash Center, are using data-smart policymaking prac-
tices to develop, iterate, and replicate municipal analytics projects. The Civic Analytics
Network was established as a community of practice in 2016 to support the growth
and replication of analytics capacities in cities across the United States. Civic Ana-
lytics Network members represent many early leaders in urban analytics, and their
cities’ analytics projects, policies, and approaches are at the forefront of this space.
To help other cities learn how to use analytics to better serve their communities, this
report profiles a selection of Civic Analytics Network city initiatives in areas ranging
from municipal public safety and public health to housing and transportation.
A key component in creating, launching, and implementing an analytics project
is adopting a systemic approach to project development. Whether a city has an estab-
lished chief data officer position, an analytics team, or is a newcomer to public-sector
data analytics altogether, there are various approaches and processes that can help
initiate, scope, and implement a successful analytics project.
While many urban analytics projects have been largely successful in fulfilling
their initial objectives and supporting better governance, most underwent multiple
iterations. Furthermore, the continued expansion of data use in city government raises
complex ethical questions that go to the core of American democracy. While more and
more sophisticated technologies are being deployed to help improve government’s
ability to serve the public, those new tools may be operating on assumptions or biases
analytics in city government: How the Civic Analytics Network Cities Are Using Data
to Support Public Safety, Housing, Public Health, and Transportation
2
that will exacerbate, not ameliorate the challenges facing our most vulnerable popula-
tions. To successfully navigate this dynamic and rapidly evolving intersection of public
policy and technology, government, at all levels, desperately needs better information
on the state and implications of these new practices to help practitioners and academ-
ics alike find sustainable, equitable solutions.
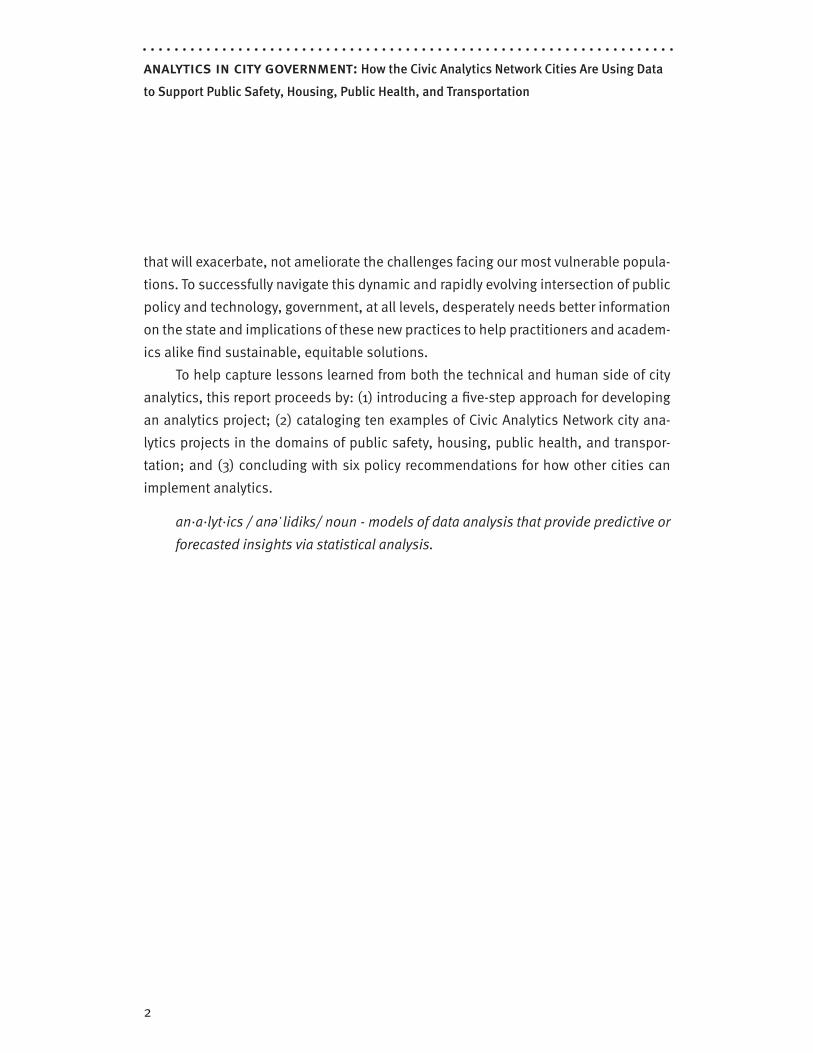
To help capture lessons learned from both the technical and human side of city
analytics, this report proceeds by: (1) introducing a five-step approach for developing
an analytics project; (2) cataloging ten examples of Civic Analytics Network city ana-
lytics projects in the domains of public safety, housing, public health, and transpor-
tation; and (3) concluding with six policy recommendations for how other cities can
implement analytics.
an·a·lyt·ics / an ΄lidiks/ noun - models of data analysis that provide predictive or
forecasted insights via statistical analysis.
analytics in city government: How the Civic Analytics Network Cities Are Using Data
to Support Public Safety, Housing, Public Health, and Transportation
3
how to approach analytics project development
If a department, agency, or city is considering using analytics, there are a few ways to
get started. While some organizations follow general standards of practice to provide
a step-by-step guide on the key phases of project development, others follow a tech-
nical framework to identify the degree to which organizational and/or data resources
will support a given project. Drawing on the various approaches, process guides, and
methodologies developed by Civic Analytics Network cities and partners, this report
highlights five key steps that cities can replicate to develop their own analytics proj-
ects: (1) identify the problem; (2) assess data readiness; (3) scope the project; (4) pilot
the project; and (5) implement and scale the model.
The first step the Civic Analytics Network recommends—before considering what
data an organization has available—is establishing a clear understanding of the prob-
lem to be addressed by a given analytics project. Determining data readiness or matu-
rity is critical, but before an analytics project can even be scoped, it is important to
ensure that the project’s objective is core to the performance or needs of the imple-
menting organization; data-driven policymaking is not data use for the sake of data
use. After working with departments to identify a mission-critical problem, analytics
experts or data scientists can proceed with identifying data readiness, scoping and
piloting the project, and so on.
From forecasting future needs to overcoming staffing or resource shortages, to
condensing vast and disparate information into actionable insights, analytics can be
a powerful tool in improving city governance, but it is most effective when used to
enhance and support the efforts and priorities of city personnel. There is no better
way to ensure that than by positioning data scientists within government to work with
departments on tackling key issues collaboratively. It is important to note that many
analytics teams are small, nascent offices with restrictive funding resources for data
experts to introduce the value of data analytics to their cities’ bureaucracy; many new
analytics teams or hires are established thanks to the support of the bully pulpit, and
the mayor can play an important role in prioritizing data use to address policy needs
in local communities.

analytics in city government: How the Civic Analytics Network Cities Are Using Data
to Support Public Safety, Housing, Public Health, and Transportation
4
1. Identify the ProblemIdentifying a critical problem that can be supported or alleviated by analytics is chal-
lenging, but it is an important first step in structuring a successful analytics project.
While data may abound, matching an area of need with the right data resources within
an organization is vital. Developing an analytics project typically places data scientists
in an internal consultant role; by working with a department or agency to identify their
key issues or problems, data scientists can support mission-critical needs. For exam-
ple, the City of Chicago’s Applied Analytics Guide prioritizes working in partnership with
departments and agencies across government as part of its ten-step process to develop
advanced predictive analytics projects. Chicago was an early leader in city-level data-
driven policy as one of the first cities to create a chief data officer (CDO) position, which
is housed within the city’s Department of Innovation and Technology (DoIT).
In Chicago, direct engagement with departments across city government helped
DoIT build relationships that created an environment in which department leaders see
the DoIT team as a resource to help them explore new solutions to key problems. DoIT
does not prescribe data solutions, but rather supports the priorities of department
leaders to optimize performance and/or service delivery in areas that the leaders iden-
tify as areas of need. Sometimes, however, public exposure of an underperforming
service area can spur an analytics “intervention.” For example, following media cover-
age on restaurant inspections, DoIT helped craft an analytics model to help optimize
restaurant inspections (see “Public Health” on page 21 for further detail).
Other cities similarly prioritize this problem identification phase as a way of
developing meaningful partnerships with government agencies. Many Civic Analytics
Network analytics teams are situated in their respective city governments as discrete
groups tasked with supporting and collaborating with other departments or agencies
by bringing data-driven insights and expertise to bear on key issues or areas of need.
• See “CAN Webinar: Predictive Analytics: A Ten-Step Guide” (Ash Center) https://datasmart.ash.harvard.edu/news/article/webinar-recording-predictive -analytics-a-ten-step-guide-1220.
• See “Mayor’s Office of Data Analytics (MODA) Project Process” (New York City) http://www1.nyc.gov/assets/analytics/downloads/pdf/MODA-project-process .pdf.
analytics in city government: How the Civic Analytics Network Cities Are Using Data
to Support Public Safety, Housing, Public Health, and Transportation
5
• See “A Starter Kit for Data-Smart Cities” (Ash Center) https://datasmart.ash .harvard.edu/news/article/a-starter-kit-for-data-smart-cities-1004.
• See “Case Study: Boston’s Citywide Analytics Team” (Ash Center) https://datasmart.ash.harvard.edu/news/article/case-study-bostons-citywide -analytics-team-1043.
2. Assess Data ReadinessDetermining data readiness is a key facet of Civic Analytics Network cities’ approaches
to analytics and a critical precondition to scoping any project. The success of an ana-
lytics project depends not only upon whether there is a need for data analytics, but
also, and more importantly, on having the right personnel, data collection and storage
practices, and stakeholder buy-in within and outside of the department or agency.
The University of Chicago’s Center for Data Science and Public Policy (DSaPP), a
Civic Analytics Network partner, created a “Data Maturity Framework” to help prepare
prospective project leaders for the development process. The framework provides an
effective structure to help determine data readiness for an organization considering
a new analytics project. Drawing on its team’s experience sourcing project propos-
als, DSaPP observed a trend: most prospective project managers referred to a desire
to make use of tons of unused data. While having ready-made or already assembled
data is a good start for any analytics project, DSaPP needed to help project manag-
ers understand that successful analytics projects begin with the identification not of
unused data, but of critical issues in need of data-driven solutions. Once that issue
area or policy need was identified, then data scientists could help project managers
assess data readiness and begin structuring and scoping an analytics model.
DSaPP’s Data Maturity Framework consists of a questionnaire and scorecards
to identify the technology, data, and organizational readiness within a department.
The framework consists of a questionnaire and survey to assess readiness and three
scorecard matrices on: (1) problem definition, (2) data and technology readiness, and
(3) organizational readiness. Each scorecard helps organizations identify where they
fall on a spectrum of four categories ranging from leading to lagging in terms of data
readiness. Scorecard categories include: how data is stored; what is collected; privacy
and documentation practices; personnel; data use policy; and buy-in from staff, data

analytics in city government: How the Civic Analytics Network Cities Are Using Data
to Support Public Safety, Housing, Public Health, and Transportation
6
collectors, leadership, intervener, and funder. (See Appendix A, “The University of Chi-
cago’s Data Maturity Framework”)
Image 1: DSaPP’s Data and Technology Readiness Scorecard (Appx. A, pg. 36).
Category Area Lagging Basic Advanced Leading
Accessibility Only accessible within the applicationwhere it is collected
Can be accessible outside the applicationbut proprietary format, requiringspecialized analysis software
All machine readable in standard openformat (CSV, JSON, XML, database)
All machine readable instandard open format andavailable through an API
Storage Paper PDFs or Images Text Files Databases
Integration Data sits in the source systems Data is exported occasionally andintegrated in ad hoc manner
Central data warehouse - realtimeaggregation and linking (Automatic) External data also integrated
Relevance and Sufficiency
The data you are collecting on subjectsof interest is irrelevant to the problemyou want to solve: ie you want to dopredict which students need extrasupport to graduate on-time but don'thave data on graduation outcomes
Some of the data you have is relevant,but it is insufficient because key fields aremissing, ie no data on academic behavioror attendance history, etc.
You have data that is helpful and relevantfor solving the problem but not sufficient tosolve it well. ie you have yearly academicand demographic information but aremissing extra-curricular activities, orinterventions they were targeted with
You have all the relevant dataabout all the entities beinganalyzed and it's sufficient tosolve the problem you aretackling
Quality Missing rows (people/address levelentities missing in the data) Missing columns (variables missing) No missing data but errors in data
collection such as typosNo missing data and no errorsin data collection
Collection Frequency Once and never again yearly frequently realtime
Granularity City level aggregates Zipcode/Block level aggregates Individual level (person or address) leveldata Incident/Event level data
History No History Kept - old data is deleted Historical data is stored but updatesoverwrite existing data
Historical data is stored and new data getsappended with timestamp, preserving oldvalues
All history is kept and new dataschema gets mapped to oldschema so older data can beused
Privacy No privacy policy in place no PII can be used for anythingad-hoc approval process in place thatallows selected PII data to be used forselected/approved projects
Software defined/controlledprivacy protection that allowsanalytics to be done whilepreserving privacy based onpredefined policies
Documentationno digital documentation or metadata:data exists but field descriptions orcoded variables are not documented
data dictionary exists (variables andcategories defined)
data dictionary plus full metadata available(including conditions under which the datawere captured)
data dictionary plus fullmetadata available includingcollection assumptions, what'snot collected, and potentialbiases
Data Maturity FrameworkData and Tech Readiness Scorecard
How is Data Stored
What is Collected?
Other
Assessing data maturity can also be approached from the macro level—for a
mayor or chief data officer to assess the enterprise-wide maturity of municipal data, it
is important to consider broad-scale questions such as how a government consumes
data and how leadership uses data to make policy decisions. Determining the data
maturity of city-wide practices is challenging, but cities across the Civic Analytics Net-
work are leading by example through data-driven governance.
• See “Data Maturity Framework” (Center for Data Science and Public Policy) http://dsapp.uchicago.edu/resources/datamaturity/.
• See “Data Maturity Framework Questionnaire” (Center for Data Science and Public Policy) http://dsapp.uchicago.edu/wp-content/uploads/2016/04/Data _Maturity_Framework_4.28.16.pdf.

analytics in city government: How the Civic Analytics Network Cities Are Using Data
to Support Public Safety, Housing, Public Health, and Transportation
7
• See “Introducing Analytics: A Guide for Departments” (City of New Orleans) https://datadriven.nola.gov/datadriven/media/Assets/Docs/NOLAlytics -department-resource-presentation.pdf.
• See “Analytics Excellence Roadmap: A Four-Stage Maturity Model for Data-Driven Government” (Ash Center) http://datasmart.ash.harvard.edu/news /article/analytics-excellence-roadmap-866.
• See “How Data-Driven is Your City?” (Ash Center) https://datasmart.ash .harvard.edu/news/article/how-data-driven-your-city.
3. Scope the ProjectOnce a department’s data readiness is assessed, it is time to scope the project. There
is no one “right” approach to project scoping: in New Orleans, the city’s performance
and data expertise team developed a project criteria framework to help scope proj-
ects; in the City of Chicago DoIT prioritizes prospective projects by using a framework
of research question evaluation criteria. DSaPP’s Data Science Project Scoping Guide
has been a particularly successful model for approaching project development and
was featured as a pre-conference workshop at the Ash Center’s Inaugural Summit on
Data-Smart Government in November, 2017.
DSaPP’s Data Science Project Scoping Guide was developed for prospective “Data
for Social Good” fellowship projects (a program that supports aspiring data scientists
by connecting them with real-world problems) in order to facilitate a continuous pool of
well-developed projects that could be successfully deployed within DSaPP’s program
cycle. Because each project needs to be scoped thoroughly enough for a data-use
agreement, the project scoping steps help expedite project development by provid-
ing a concise framework for prospective projects. This project scoping approach helps
managers focus on understanding what data is available, who the key stakeholders
are for providing and using that data, and how that data is being considered to provide
insights into a city governance problem. DSaPP’s four steps for project scoping are:
Step 1: Goals – Define the goal(s) of the project.
Step 2: Actions – What actions/interventions do you have that this project will inform?

analytics in city government: How the Civic Analytics Network Cities Are Using Data
to Support Public Safety, Housing, Public Health, and Transportation
8
Step 3: Data – What data do you have access to internally? What data do you
need? What can you augment from external and/or public sources?
Step 4: Analysis – What analysis needs to be done? Does it involve description,
detection, prediction, or behavior change? How will the analysis be validated?
(See Appendix B, “The University of Chicago’s Data Science Project Scoping Worksheet”)
Chicago uses the Research Question Evaluation Criteria for scoping its predictive
analytics projects and determining which projects are best suited for development.
Similar to DSaPP’s project scoping steps, Chicago’s evaluation criteria guides project
managers through key issues to better situate a prospective analytics project for suc-
cess. (See Appendix C, “City of Chicago’s Research Question Evaluation Criteria”)
• See “What makes a good DSSG project?” (Data Science for Social Good) https://dssg.uchicago.edu/2015/11/04/what-makes-a-good-dssg-project.
• See “Project Scoping Guide” (Center for Data Science and Public Policy) http://dsapp.uchicago.edu/resources/data-science-project-scoping-guide/.
• See “Data Science Project Scoping Worksheet” (Data Science for Social Good) https://dssg.uchicago.edu/wp-content/uploads/2016/10/Project-Scop-ing-Worksheet-Blank.pdf.
• See “Technical Requirements” (Center for Data Science and Public Policy) http://dsapp.uchicago.edu/resources/technical-requirements/.
• See “Nolalytics New Project Framework August 2016” (City of New Orleans) https://datadriven.nola.gov/datadriven/media/Assets/Docs/NOLAlytics -New-Project-Criteria-Checklist.pdf.

analytics in city government: How the Civic Analytics Network Cities Are Using Data
to Support Public Safety, Housing, Public Health, and Transportation
9
Image 2: City of Chicago’s Research Question Evaluation Criteria (See Appx. C for complete criteria).
Research Question Evaluation Criteria: Predictive Analytics Projects chicago.github.io w dev.cityofchicago.org w @ChicagoCDO w @ThorSean
Criteria Question Response
1. DataReadiness
Is data associated with this RQ available and/or ready to be analyzed?
• Available• Partly available• Not available
2. PolicyAlignment
Does this RQ align with City policy goals—from both the Mayor’s Office and applicable departments?
• Yes• No
3. OperationalImpact
As a pilot, what level of opportunity would this RQ provide for positive operational outcomes—i.e., a reduction in time/cost when compared to current operations?
• High• Medium• Low
4. ResidentImpact
As a pilot, what level of opportunity would this RQ directly provide benefit to the residents of Chicago?
• High• Medium• Low
5. Level of Use If this pilot were to become a fully operational tool in your department, what level of use would it receive?
• Weekly• Monthly• Quarterly• Annually
6. Potential forReplication
Would implementing this RQ as a pilot provide a model that can be reused for other operational areas of your department, or elsewhere in the city?
• Yes• Unsure• No
7. OperationalChange
If this pilot were to become a fully operational tool in your department, how drastically would it alter current operations?
• (Open-endedresponse)
APPENDIX C

analytics in city government: How the Civic Analytics Network Cities Are Using Data
to Support Public Safety, Housing, Public Health, and Transportation
10
4. Pilot the ProjectPiloting an analytics project is “the stuff of innovation.” This is where the trial and
error of testing a new project happens. No matter how well prepared an analytics team
is, sometimes—whether the problem lies in a key variable, an assumption built into
the algorithm, or the project’s general approach—the pilot just does not perform as
expected. While information on how best to pilot a municipal analytics project is lim-
ited, the frameworks, criteria, and guidelines developed by Civic Analytics Network
cities and partners can serve as helpful resources and provide useful examples of how
to approach and, ultimately, scale an analytics project.
Piloting an analytics projects, like any effort to innovate in the public sector, is
somewhat at odds with the bureaucratic preference for consistency and risk avoid-
ance, but it is a critical phase that can yield important insights for improving perfor-
mance when it is time for implementation on a larger scale. Moreover, starting with
small-scale pilots can help limit risk and demonstrate clear results.
In an assessment of its pilot practices, the UK Government notes that “Once
embarked upon, a pilot must be allowed to run its course. Notwithstanding the famil-
iar pressures of government timetables, the full benefits of a policy pilot will not be
realized if the policy is rolled out before the results of the pilot have been absorbed
and acted upon.” The report goes on to argue that “pilots should be regarded less as
ad hoc evaluations than as early stages in a continuing process of accumulating policy
-relevant evidence.”1
Piloting also allows for much needed course corrections to help better transition
efforts in project-scoping to implementation; adjusting project parameters during the
pilot phase can increase the likelihood of success at implementation and beyond.
• See “From Algorithm to Action: How Chicago Operationalized its Predictive Analytics for Food Inspections” (Ash Center) https://datasmart.ash.harvard .edu/news/article/from-algorithm-to-action-759.
1 “Trying It Out: The Role of ‘Pilots’ in Policy-Making – Report of a Review of Government Pilots” (UK Cabinet Office,
Dec. 2003) Pg. 7 https://assets.publishing.service.gov.uk/government/uploads/system/uploads/attachment
_data/file/498256/Trying_it_out_the_role_of_pilots_in_policy.pdf.

analytics in city government: How the Civic Analytics Network Cities Are Using Data
to Support Public Safety, Housing, Public Health, and Transportation
11
• See “Overcoming Barriers to Adoption for Innovations in Policy: Reflections from the Innovation Toolkit” (Innovations: Technology, Governance, and Global-ization) https://www.mitpressjournals.org/doi/pdf/10.1162/inov_a_00257.
• See “Piloting the London Office of Data Analytics” (Nesta) https://londondatastore -upload.s3.amazonaws.com/LODA%20pilot%20report.pdf.
• See “Smart City Pilot Projects: Exploring the Dimensions and Conditions of Scaling Up” (Journal of Urban Technology) https://www.tandfonline.com/doi /full/10.1080/10630732.2017.1348884?scroll=top&needAccess=true.
• See “Trying it Out: The Role of ‘Pilots’ in Policy-Making” (UK Cabinet, Govern-ment Chief Social Researcher’s Office) https://assets.publishing.service.gov .uk/government/uploads/system/uploads/attachment_data/file/498256 /Trying_it_out_the_role_of_pilots_in_policy.pdf.
5. Implement and Scale the ModelResearch and literature on implementing and scaling analytics projects remain lim-
ited, and given the variability of structures, budgets, and objectives for analytics proj-
ects, identifying generalizable practices for scaling these projects is challenging. The
Ash Center’s Data-Smart City Solutions and the Civic Analytics Network have begun
to capture early lessons from city-level analytics projects, and as more data-driven
decision-making projects mature and are replicated, insights into how to improve and
scale these leading projects will grow.
Currently, Civic Analytics Network cities are working to replicate models imple-
mented by other member cities, and while some of those leading examples are high-
lighted in this report, further research and use cases on those replicated projects are
forthcoming.
• See “A Catalog of Civic Data Use Cases: How Can Data and Analytics Be Used to Enhance City Operations?” (Ash Center) https://datasmart.ash.harvard .edu/news/article/how-can-data-and-analytics-be-used-to-enhance-city -operations-723.

analytics in city government: How the Civic Analytics Network Cities Are Using Data
to Support Public Safety, Housing, Public Health, and Transportation
12
analytics project examples public safety, housing, public health, and transportation

analytics in city government: How the Civic Analytics Network Cities Are Using Data
to Support Public Safety, Housing, Public Health, and Transportation
13
Public SafetyA city’s public safety capabilities encompass a wide variety of departments and agencies
working to maintain the security and welfare of residents. Public safety means more than
just having a police department; it is a cross-cutting issue in government, comprising
a wide range of services that help prevent and manage crime, coordinate emergency
preparedness, secure public transportation systems, and beyond. While the typical res-
ident will likely only engage with their city’s public safety resources, such as the police
or fire department, during an emergency, preventative practices, improved internal man-
agement, and tech-enabled policies implemented within and by the many departments
that comprise a city’s public safety capacities can make the difference between life and
death during those times of crisis. In the two examples below, data-driven efforts to
strategically distribute smoke detectors and bolster early intervention systems that help
supervisors in police departments identify officers in need of training or other mediation
offer insights into how Civic Analytics Network cities and partners use analytics to sup-
port and improve the efforts of first responders across the country.
1. Smoke Detectors and Fire Risk
New Orleans’ Analytics Model Supports Smoke Detector Distribution and
National Replication
According to the U.S. Fire Administration, three out of five home fire deaths happen in
homes without smoke alarms, and the risk of death from fire in a home is cut in half
when a home has smoke alarms. The New Orleans Fire Department (NOFD) provides
citizens with free smoke alarms to help bring these life-saving devices to homes in
need across the city, but NOFD Superintendent Tim McConnell wanted his department
to be more proactive in improving the safety of New Orleans.
NOFD partnered with the Office of Performance and Accountability (OPA), the
city’s data team, to use a predictive analytics model to determine which houses in the
city are least likely to have a smoke alarm and at the highest risk of fire fatalities. New
Orleans did not have historical data on smoke alarm locations, and culling permitting
records yielded limited results. The project had a breakthrough when an OPA team
member turned to the U.S. Census Bureau’s American Housing Survey, which includes
a question about smoke alarms. When OPA coupled this data with American Commu-
nity Survey data, the team was able to identify key variables to help predict if a home is

analytics in city government: How the Civic Analytics Network Cities Are Using Data
to Support Public Safety, Housing, Public Health, and Transportation
14
missing a smoke alarm and is at high risk for a fire-related fatality. The analytics model
developed by OPA has helped NOFD identify on a block-by-block level where to target
free smoke detector outreach and distribution efforts. From the project’s start in 2014
to 2016, NOFD was able to distribute and install 8,000 smoke detectors.
New Orleans worked with Enigma, a data analytics startup, to develop the method-
ology. Since the New Orleans model is based primarily on federal data, Enigma was able
to partner with the American Red Cross and DataKind to replicate it across the nation.
• See “Predicting Fire Risk: From New Orleans to a Nationwide Tool” (Ash Cen-ter) https://datasmart.ash.harvard.edu/news/article/predicting-fire-risk-from -new-orleans-to-a-nationwide-tool-846.
• See “New Orleans Profile” in “Lessons from Leading CDOs” (Ash Center), 32–33 https://datasmart.ash.harvard.edu/sites/default/files/2018-01/leasons _from_leading_cdos.pdf.
2. Police Early Intervention Systems
New Early Intervention Systems Help Police Departments Better Manage
Officer Performance
The University of Chicago’s Center for Data Science and Public Policy (DSaPP) has part-
nered with Civic Analytics Network cities and others to build and deploy the first data-
driven early intervention systems (EISs) for police officers. EISs enable departments to
provide training, counseling, and other interventions for officers who are identified as
likely to have an adverse incident. Adverse incidents include complaints from a citizen
or colleague, use of force or other tactics, or accident or injury. Early EISs only tracked
a handful of simple indicators, such as the number of times an officer used force, and
omitted context. For instance, the officer’s assigned beat was typically not logged in
the system, meaning there was no way to see in the EIS if an adverse incident such as
use of force occurred within or beyond the officer’s beat.
DSaPP’s system uses analytics to find predictors of adverse incidents in the
department’s data by, for example, tracking which officers respond to the highest num-
ber of suicide calls. This allows administrators to assess whether additional training or
counselling is needed. DSaPP’s EIS model adapts over time and automatically learns
from how supervisors interact with, use, or deprioritize the system’s findings. DSaPP
has deployed the system in Charlotte-Mecklenburg and Metropolitan Nashville and, as
of spring 2018, is working with two Civic Analytics Network cities to build prototypes.
analytics in city government: How the Civic Analytics Network Cities Are Using Data
to Support Public Safety, Housing, Public Health, and Transportation
15
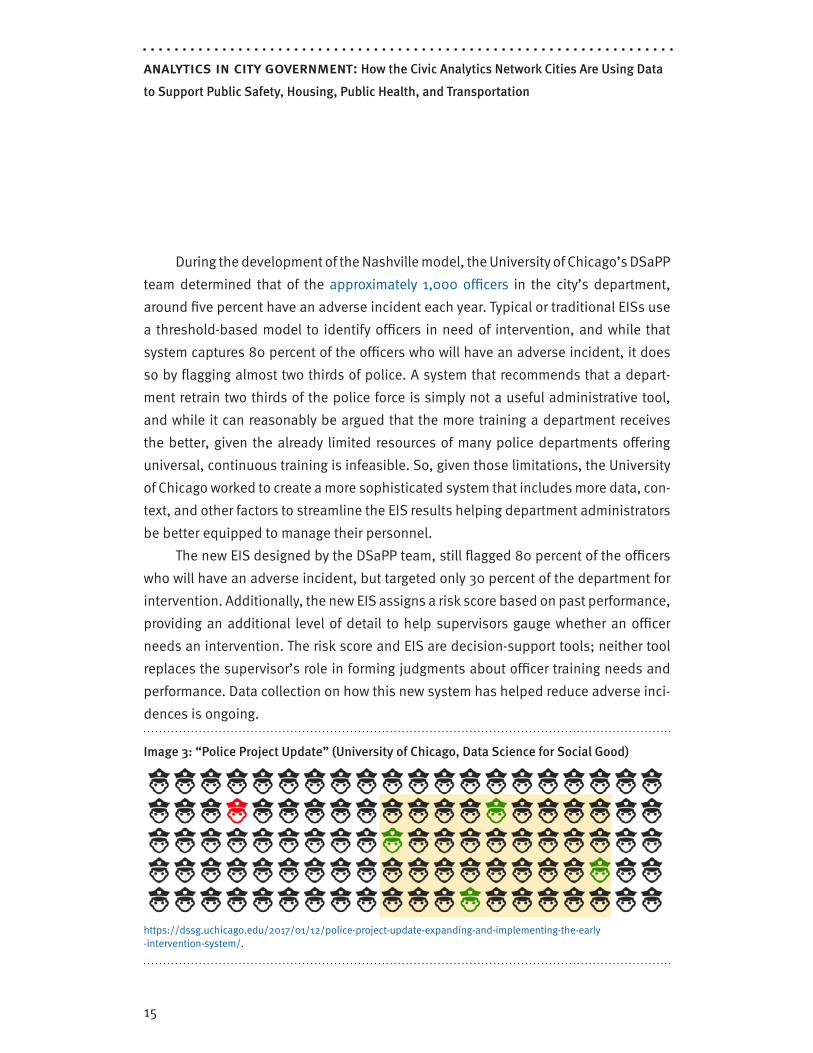
During the development of the Nashville model, the University of Chicago’s DSaPP
team determined that of the approximately 1,000 officers in the city’s department,
around five percent have an adverse incident each year. Typical or traditional EISs use
a threshold-based model to identify officers in need of intervention, and while that
system captures 80 percent of the officers who will have an adverse incident, it does
so by flagging almost two thirds of police. A system that recommends that a depart-
ment retrain two thirds of the police force is simply not a useful administrative tool,
and while it can reasonably be argued that the more training a department receives
the better, given the already limited resources of many police departments offering
universal, continuous training is infeasible. So, given those limitations, the University
of Chicago worked to create a more sophisticated system that includes more data, con-
text, and other factors to streamline the EIS results helping department administrators
be better equipped to manage their personnel.
The new EIS designed by the DSaPP team, still flagged 80 percent of the officers
who will have an adverse incident, but targeted only 30 percent of the department for
intervention. Additionally, the new EIS assigns a risk score based on past performance,
providing an additional level of detail to help supervisors gauge whether an officer
needs an intervention. The risk score and EIS are decision-support tools; neither tool
replaces the supervisor’s role in forming judgments about officer training needs and
performance. Data collection on how this new system has helped reduce adverse inci-
dences is ongoing.
Image 3: “Police Project Update” (University of Chicago, Data Science for Social Good)
https://dssg.uchicago.edu/2017/01/12/police-project-update-expanding-and-implementing-the-early -intervention-system/.

analytics in city government: How the Civic Analytics Network Cities Are Using Data
to Support Public Safety, Housing, Public Health, and Transportation
16
Based on learning over the course of this project, DSaPP has published a few
rules of thumb for EISs: (1) provide the department with a system that does not create
an unmanageable administrative burden; (2) help the department assign a technical
lead within the department to be responsible for the EIS; (3) make the system easy to
use; (4) value police supervisors’ expertise and input in the EIS design; and (5) clearly
communicate the objective and scope of the EIS project.
• See “Human Lessons Learned Implementing Early Intervention Systems in Charlotte and Nashville” (Center for Data Science and Public Policy) https://dssg.uchicago.edu/2018/03/29/human-lessons-learned-implementing -early-intervention-systems-in-charlotte-and-nashville/.
• See “Police Project Update: Expanding and Implementing the Early Interven-tion System” (Center for Data Science and Public Policy) https://dssg.uchicago .edu/2017/01/12/police-project-update-expanding-and-implementing-the -early -intervention-system/.
• See “Early Warning/Intervention Systems for Police Departments” (Center for Data Science and Public Policy) http://dsapp.uchicago.edu/2016/02/21 /early-warningintervention-systems-for-police-departments/.
• See “Building Data-Driven Early Intervention Systems for Police Officers” (Cen-ter for Data Science and Public Policy) http://dsapp.uchicago.edu/projects/public -safety/police-eis/.
• See “UChicago’s Rayid Ghani on Police Incidents, Data Science and Local Government” (YouTube: The University of Chicago) https://www.youtube.com /watch?v=_p9Cz8MJ0Mw.
• See “Identifying Police Officers at Risk of Adverse Events” (KDD) http://www .kdd.org/kdd2016/papers/files/adf0832-cartonAemb.pdf.
analytics in city government: How the Civic Analytics Network Cities Are Using Data
to Support Public Safety, Housing, Public Health, and Transportation
17
HousingCities face an increasing need for housing as more and more of the U.S. population moves
into urban areas. Providing safe, secure, affordable, and equitably available housing is
key to the future stability and success of cities. To this end, Civic Analytics Network cit-
ies are using data-driven insights to improve housing conditions in their communities
with projects focused on improving housing inspection performance, minimizing over-
looked health and safety risks, remediating blight outbreaks, identifying and eliminating
income-based discrimination against prospective tenants, and beyond.
3. Housing Inspections
San José Uses Analytics to Help Housing Inspectors Keep Residents Safe
San José’s Multiple Housing team in the city’s Code Enforcement Office is tasked
with monitoring all properties with three or more units, which totals more than 4,500
properties in the city. It is impossible for the Multiple Housing team to inspect every
property each year, so the city partnered with the DSaPP through the Civic Analytics
Network to help the inspectors identify properties that are at the highest risk for vio-
lations. DSaPP developed a predictive model to provide a view of property violations
over time, drawing upon construction permit records and other indicators to develop a
model that identifies possible higher-risk properties in the community. The model was
developed in close collaboration with the inspectors in San José; DSaPP worked with
inspectors, interviewed them, and joined them on inspections to observe how they
prioritize and gather information during a site visit. The analytics model DSaPP devel-
oped prioritizes violations that pose greater health and safety risks, such as exposed
wiring or fire hazards. DSaPP identified four factors that were particularly predictive
of higher-risk conditions: (1) amount of time since last inspection; (2) previous health
and safety violations; (3) lack of recent building permits; and (4) violation rates of
nearby properties. Field tests for this model concluded in late 2017.
• See “Data-Driven Inspections for Safer Housing in San José, California” (Data Science for Social Good) https://dssg.uchicago.edu/2017/07/14/data -driven-inspections-for-safer-housing-in-san-jose-california/.

analytics in city government: How the Civic Analytics Network Cities Are Using Data
to Support Public Safety, Housing, Public Health, and Transportation
18
4. Landlord Discrimination
Analytics Model Focuses on Eliminating Income Discrimination for Prospective
Tenants in New York City
In New York City, Title 8 of the Administrative Code of the City of New York prohibits
discrimination based on a number of factors, including race, gender, and religion. The
law also includes provisions to protect individuals who receive public assistance from
being discriminated against based on their source of income. Despite this, however,
income-based discrimination is among the top housing-related complaints in the city.
To curb discrimination against prospective tenants, including tenant harassment,
source-of-income discrimination, and illegal conversions of apartments, the Commis-
sion on Human Rights partnered with the New York City Mayor’s Office of Data Analyt-
ics (MODA) to build a model to help prioritize investigative resources. MODA wanted
to identify areas in which landlords were most likely to turn away prospective tenants
with housing vouchers—not only to prosecute proven violators, but also to send a clear
message that violations of this nature would not go unnoticed and to discourage land-
lords across the city from discriminating in the first place.
With this in mind, MODA set out to identify the landlords engaging in discrim-
inatory behavior focusing particularly on identifying and punishing larger property
management firms. By focusing on identifying the largest landlords making these vio-
lations, the city hoped that as a consequence smaller potential offenders would reme-
diate their behavior. MODA’s model has helped the city better identify illegal housing
practices, and while the Commission investigates all allegations of income discrimina-
tion, MODA’s efforts have helped the Commission better manage their inquiries and,
ultimately, improved the city’s ability to curb future incidents of discrimination.
• See “New York City Profile” in “Lessons from Leading CDOs” (Ash Center) Pgs. 34–35 https://datasmart.ash.harvard.edu/sites/default/files/2018-01/leasons _from_leading_cdos.pdf.
• See “The NYC Commission on Human Rights partnered with MODA to assist in identifying sites of potential income discrimination” (MODA NYC GitHub) https://moda-nyc.github.io/Project-Library/projects/source-of-income -discrimination/.
• See “How New York is Protecting Affordable Apartments with Analytics” (Ash Center) https://datasmart.ash.harvard.edu/news/article/how-new-york-protecting -affordable-apartments-analytics.

analytics in city government: How the Civic Analytics Network Cities Are Using Data
to Support Public Safety, Housing, Public Health, and Transportation
19
5. Blight Remediation
New Orleans Uses Data-Driven Insights to Reduce Blight
After Hurricane Katrina in 2005, rebuilding New Orleans was a daunting, arduous
endeavor, and many areas that were damaged by the wind and flooding were left
untouched in that state for years. As a result, rampant blight took hold in and around
those damaged properties across the city. When Mayor Mitch Landrieu took office
in 2010, blight remediation was a top priority, and the Office of Performance and
Accountability (OPA), the analytics hub of New Orleans’ city government, was tasked
with developing analytics and performance management tools to help tackle this dan-
gerous housing issue.
OPA developed BlightSTAT as a performance management tool to improve services
and results through the use of data. OPA also created a Blight Scorecard to address a
backlog of more than 1,500 properties awaiting a decision by the Department of Code
Enforcement. The Blight Scorecard allows mid-level supervisors to score a property on
several dimensions and then receive a weighted recommendation between 0 and 100,
0 meaning the property should be demolished and 100 meaning it should be sold.
Those mid-level supervisors and their superiors can use the tool to evaluate proper-
ties, vastly increasing the speed and consistency of the process at various levels in the
department. Like Chicago Police’s EIS, the scorecard is a decision-support tool and
does not replace human judgment—it provides a recommendation, and the director
reviews the available information and decides whether to approve each demolition.
This new tool has improved the workflow of the city’s Code Enforcement Depart-
ment by directing negative judgments to supervisors for review prior to escalating
them to the attention of the director. Moreover, the new process adds efficiency by
removing all paper components. Use of this tool effectively eliminated the backlog of
blighted properties in the city. Other cities are also tackling blight remediation with
analytics; for example, Cincinnati partnered with the University of Chicago’s DSaPP via
the Civic Analytics Network to develop an early detection model.
• See “New Orleans Brings Data-Driven Tools to Blight Remediation” (Ash Cen-ter) https://datasmart.ash.harvard.edu/news/article/new-orleans-brings-data -driven-tools-to-blight-remediation-915.

analytics in city government: How the Civic Analytics Network Cities Are Using Data
to Support Public Safety, Housing, Public Health, and Transportation
20
• See “Code Enforcement Abatement Tool” (City of New Orleans) https://www.nola.gov/performance-and-accountability/reports/nolalytics-reports /nolalytics-blight-abatement-tool-brief/.
• See “Blight Prevention: Building Strong and Healthy Neighborhoods in Cin-cinnati” (Center for Data Science and Public Policy) https://dssg.uchicago .edu/2015/08/20/blight-prevention-building-strong-and-healthy-neighborhoods -in-cincinnati/.
• See “Proactive Blight Reduction and Neighborhood Revitalization: City of Cin-cinnati” (Data Science for Social Good) https://dssg.uchicago.edu/project /proactive-blight-reduction-and-neighborhood-revitalization/.
• See “Early detection of properties at risk of blight using spatiotemporal data” (Data Science for Social Good) https://dssg.uchicago.edu/wp-content /uploads/2016/10/34_blancas.pdf.

analytics in city government: How the Civic Analytics Network Cities Are Using Data
to Support Public Safety, Housing, Public Health, and Transportation
21
Public HealthFrom the risk of foodborne illness to viral outbreaks, mitigating public health concerns
is a matter of good, forward-looking governance. The global health risk posed by mos-
quito-borne viruses like Zika and West Nile is immense, and as the impact of climate
change becomes more overt the risk of such viral outbreaks will only grow. Forecasted
population and environmental changes pose unprecedented challenges for local gov-
ernments, but analytics can provide critical insights to help cities prepare for and curb
the impact of future outbreaks.
Monitoring food quality and safety in a city are similarly challenging tasks, due to
the complexity of regulations for food preparation, storage, service, and so on. Cities
across the Civic Analytics Network have developed analytics models to help city offi-
cials deploy their limited resources more effectively to monitor and manage restaurant
inspections and pest control. By forecasting areas at risk for mosquito-borne disease,
rodent infestation, and poor food quality, cities are able to better manage their limited
resources and provide their communities with a safer, healthier quality of life.
6. West Nile Virus
Chicago Uses Analytics to Prepare for Forecasted Spike in West Nile Virus
By the end of this century, Chicago’s climate is projected to become so warm that
it will mirror the conditions seen in present-day Alabama. As warmer climates shift
northward and expand mosquito-friendly environmental conditions, the risk of mos-
quito-borne viruses will increase considerably. The forecasted spike in mosquito pop-
ulation in the Chicago area helped prompt Chicago’s Department of Innovation and
Technology (DoIT) to partner with the Chicago Department of Public Health (CDPH) to
use data to find new solutions for this projected public health issue. The city built a
predictive model to determine one week in advance whether or not a particular area
will have West Nile virus-carrying mosquitoes. With such a model, Chicago can direct
mosquito-spraying efforts towards areas that pose the greatest risk, mitigating the
potential of a viral outbreak.
The concept for Chicago’s West Nile virus analytics project came via Kaggle, an
online platform for analytics and predictive modeling competitions. In early 2015,
CDPH, in partnership with DoIT, launched a Kaggle competition of its own by posting
analytics in city government: How the Civic Analytics Network Cities Are Using Data
to Support Public Safety, Housing, Public Health, and Transportation
22
some West Nile virus visualizations and starter code in R (a program language and soft-
ware for running statistical analyses) and Python (a high-level programming language
for general computer program and analyses) on Kaggle Scripts. In 2017, following a
successful pilot program, Chicago operationalized its West Nile virus analytics model.
Chicago’s efforts to combat West Nile virus can potentially be replicated to help cities
manage public health risks associated with other mosquito-borne illnesses, including
the Zika virus. Chicago’s model along with instructions for running it are available on
the city’s GitHub page.
• See “Predictive Analytics Guides West Nile Virus Control Efforts in Chicago” (Ash Center) https://datasmart.ash.harvard.edu/news/article/predictive-analytics -guides-west-nile-virus-control-efforts-in-chicago-1152.
7. Zika Virus
Zika Outbreak Triggers Coordinated Analytics Response from Cities across the U.S.
The Zika virus burst onto the international stage in 2016 as a global health emergency.
While Zika is not a new virus, the unprecedented outbreak in 2016 brought this dis-
ease to the fore of public health debates around the globe. While travel-related Zika
cases in the United States remain limited, local health officials and urban policymak-
ers alike must grapple with the risk that Zika-infected mosquitoes pose to their com-
munities. Zika is transmitted by the Aedes aegypti mosquito, which thrives in warm,
wet climates. So, like West Nile virus, the risk of Zika in cities across the country will
likely only grow in the years to come as climates become warmer around the globe.
Unlike Chicago’s forecasted West Nile virus risk, New Orleans is already home to
abundant Aedes aegypti populations. New Orleans, like most cities, has well-estab-
lished mosquito monitoring systems in place, but following the 2016 Zika outbreak
additional methodologies and resources for controlling, monitoring, and predicting
population spikes were needed. For example, New Orleans is using ArcGIS (a geo-
graphic information system, GIS, software system) to create risk maps based on ana-
lytics to help identify baseline larval habitats and to streamline sampling after the city
intervenes with a population.
National analytics strategies for addressing the risk of the Zika virus are still being
structured, but a key first step for successfully deploying analytics in this area is to
analytics in city government: How the Civic Analytics Network Cities Are Using Data
to Support Public Safety, Housing, Public Health, and Transportation
23
identify risk factors that could potentially exacerbate climate-based and warm season
outbreaks. For example, in his Data-Smart City Solutions article, Jonathan Jay argues
that analytics that correlate mosquito populations with vacant property areas can help
cities pinpoint areas at high risk for an outbreak. Integrating or replicating existing
analytics models is a likely next step. For instance, New Orleans is already using ana-
lytics to tackle blight, and linking this housing-specific effort to public health data
could provide invaluable insights into mosquito-borne disease outbreaks and how to
curb them.
• See “How U.S. Cities Can Target Zika Risk” (Ash Center) http://datasmart.ash .harvard.edu/news/article/how-u.s.-cities-can-target-zika-risk-960.
• See “Condensed Zika Virus Plan” (City of New Orleans) https://www.nola.gov/getattachment/Health/Emergency-Preparedness/Zika/Condensed-Zika-Plan -8-3-16.pdf/.
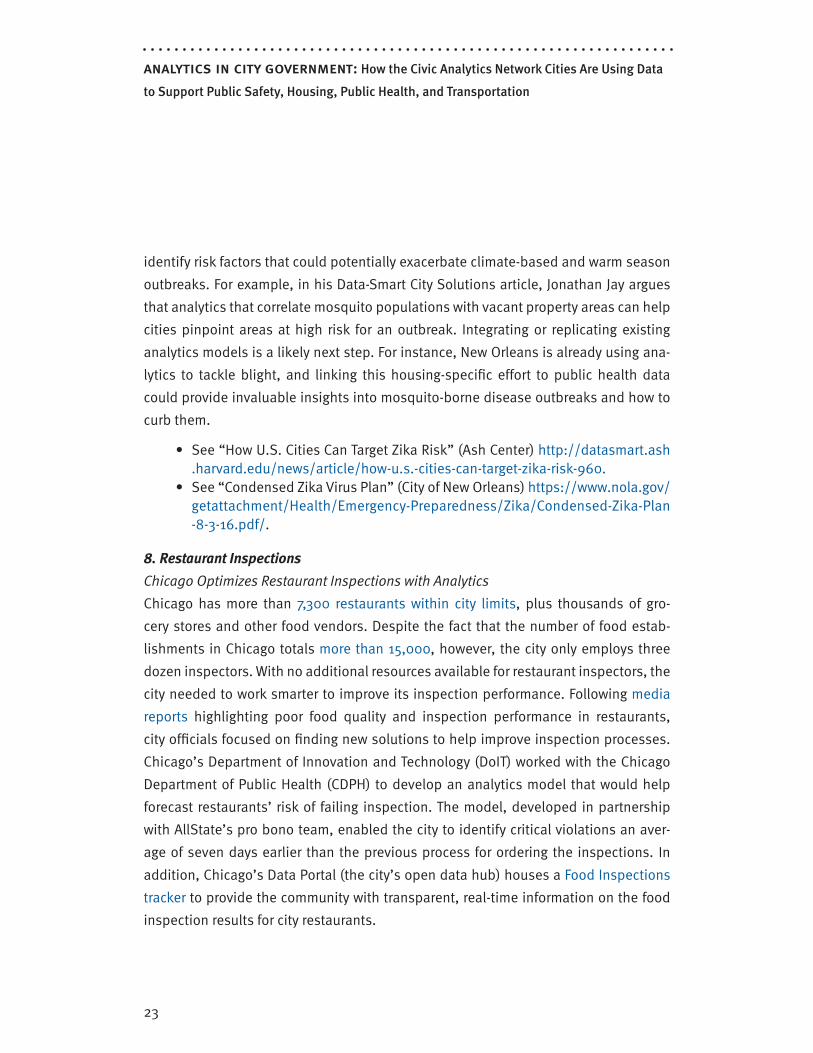
8. Restaurant Inspections
Chicago Optimizes Restaurant Inspections with Analytics
Chicago has more than 7,300 restaurants within city limits, plus thousands of gro-
cery stores and other food vendors. Despite the fact that the number of food estab-
lishments in Chicago totals more than 15,000, however, the city only employs three
dozen inspectors. With no additional resources available for restaurant inspectors, the
city needed to work smarter to improve its inspection performance. Following media
reports highlighting poor food quality and inspection performance in restaurants,
city officials focused on finding new solutions to help improve inspection processes.
Chicago’s Department of Innovation and Technology (DoIT) worked with the Chicago
Department of Public Health (CDPH) to develop an analytics model that would help
forecast restaurants’ risk of failing inspection. The model, developed in partnership
with AllState’s pro bono team, enabled the city to identify critical violations an aver-
age of seven days earlier than the previous process for ordering the inspections. In
addition, Chicago’s Data Portal (the city’s open data hub) houses a Food Inspections
tracker to provide the community with transparent, real-time information on the food
inspection results for city restaurants.

analytics in city government: How the Civic Analytics Network Cities Are Using Data
to Support Public Safety, Housing, Public Health, and Transportation
24
• See “Delivering Faster Results with Food Inspection Forecasting” (Ash Center) https://datasmart.ash.harvard.edu/news/article/delivering-faster-results -with-food-inspection-forecasting-631.
• See “Food Inspections” (Chicago Data Portal) https://data.cityofchicago.org /Health-Human-Services/Food-Inspections/4ijn-s7e5/data.
• See “Lessons from Leading CDOs” (Ash Center) Pg. 29, https://datasmart.ash .harvard.edu/sites/default/files/2018-01/leasons_from_leading_cdos.pdf.
9. Pest Control
Chicago’s DoIT Team Fills Information Gap with 311 Data to Curb Rodent Infestations
The City of Chicago’s Department of Innovation and Technology (DoIT), in partnership
with Carnegie Mellon University’s Event and Pattern Detection Laboratory, developed
predictive analytics tools to support efforts to combat rodent infestations in Chicago
and to help the city develop more effective rodent baiting programs. Because the city
had limited formal information documenting rodent populations, geography, and
other factors critical to helping city officials tackle infestations, DoIT utilized 311 data
in its analytics model to fill the information gap.
311 call data is the foundation of the city’s rodent infestation analytics model
and helps the city determine where rodent infestations could exist and predict where
those populations could spike. Geospatial representations of this information support
the Department of Streets and Sanitation’s rodent baiting program. Sean Thornton,
a program advisor for the Civic Analytics Network based in Chicago, notes, “In July
2013, Mayor Rahm Emanuel announced that as a result of the City’s increase in preven-
tive rodent baiting efforts in 2012, resident requests for rodent control services have
dropped 15% in 2013.”2
• See “Using Predictive Analytics to Combat Rodents in Chicago” (Ash Center) https://datasmart.ash.harvard.edu/news/article/using-predictive-analytics -to-combat-rodents-in-chicago-271.
• See “Chicago Profile” in “Lessons from Leading CDOs” (Ash Center) Pgs. 29–30, https://datasmart.ash.harvard.edu/sites/default/files/2018-01/leasons _from_leading_cdos.pdf.
2 “Using Predictive Analytics to Combat Rodents in Chicago” (Ash Center) https://datasmart.ash.harvard.edu
/news/article/using-predictive-analytics-to-combat-rodents-in-chicago-271.

analytics in city government: How the Civic Analytics Network Cities Are Using Data
to Support Public Safety, Housing, Public Health, and Transportation
25
Washington, D.C., Uses 311 Data and Analytics to Support Rat Abatement
Following a surge in 311 calls related to rodent sightings in 2016, the District of Colum-
bia’s city government decided to use analytics to help combat the city’s rat problem.
The Lab @ DC, situated in the Office of the City Administrator, and the Office of the
Chief Technology Officer (OCTO) work together on various city priorities and projects
to develop data-driven solutions to help city government better serve the District. As
part of this broader effort, the Lab @ DC and OCTO data scientists partnered with the
rodent control team at the Department of Public Health to develop an analytics model
to identify environmental variables that help predict where a rat infestation is likely to
develop. To build an analytics model, the city is using 311 data, and, similar to rodent
infestation management efforts in Chicago, D.C. is working to identify leading indica-
tors within 311 data to support that model. The city’s efforts to develop an analytics
model to support rat abatement are ongoing.
• See “To squash rat outbreak, D.C. turns to technology” (StateScoop) http://statescoop.com/to-squelch-rat-outbreak-d-c-turns-to-technology.
• See “Rat problems? In D.C., data could help” (GCN) https://gcn.com/Articles /2017/08/01/Lab-DC-Leonard.aspx.
• “Mayor Bowser Highlights Citywide Efforts to Reduce Rodents” (DC.Gov) https://mayor.dc.gov/release/mayor-bowser-highlights-citywide-efforts -reduce-rodents.

analytics in city government: How the Civic Analytics Network Cities Are Using Data
to Support Public Safety, Housing, Public Health, and Transportation
26
TransportationRising urban populations and new technologies such as automated vehicles are push-
ing cities to rethink their transportation systems and regulations to ensure driver and
pedestrian safety. New mobile applications, technologies, and modes of transit are
revolutionizing how residents traverse their home cities, and it is increasingly appar-
ent that existing city resources and regulations are insufficient to deal with these new
practices. Outdated public transit and transportation infrastructure is a common issue
in cities across the U.S., and while a cross-cutting strategy with immense funding sup-
port is required to address this issue, data analytics can offer a cost-effective way for-
ward for cities. Transportation and data analytics go hand and hand, and the wealth of
data available in transportation is a critical and in many cases low-cost resource that
can help city officials assess and improve transportation systems. Cities need to be
equipped with the right personnel and tools to use analytics to understand and help
regulate existing and new transportation modes and patterns.
In parallel to city efforts to understand the implications of new technologies and
services in transportation, a global movement called Vision Zero is focused on elimi-
nating traffic fatalities. As part of this movement, which originated in Sweden in 1997,
cities across the Civic Analytics Network, from Boston to Los Angeles, are developing
analytics models and visualization platforms to make progress toward this goal. How
cities will grapple with the implications and challenges of automated vehicles along
with the complexity of multi-modal, shared roads remains to be seen, but municipal
analytics models that are being developed can help prepare cities for the changes
brought by these and other new technologies.
10. Traffic Collisions: Vision Zero
New York City’s Analytics Team Aims for Zero Traffic Fatalities with Exposure Map
As part of the Vision Zero movement, New York City began developing an analytics
model in 2015 with DataKind to enable city officials to assess whether a new transpor-
tation project is high risk (i.e., likely to result in injury or unsafe traffic circumstances)
and to estimate the likelihood of various outcomes. For example, if the Department
of Transportation (DOT) is developing a new intersection or traffic lane design, the
analytics model assesses the risk of injury in that intersection or lane design, allowing

analytics in city government: How the Civic Analytics Network Cities Are Using Data
to Support Public Safety, Housing, Public Health, and Transportation
27
project managers to adjust the design and recalculate to get the safest results while
still accounting for need to improve traffic patterns and minimize delays.
While limited data rendered this initial project design unsuccessful, the model’s
ability to calculate the number of cars on a road produced a useful exposure model
that is being used by the city’s DOT to more accurately determine the effectiveness
of different street designs. The exposure map allows the DOT to forecast the number
of cars on the road to help better manage traffic patterns and improve road safety for
pedestrians and drivers alike.
• See “Can Better Data Make Zero Traffic Deaths a Reality?” (Ash Center) https://datasmart.ash.harvard.edu/news/article/can-better-data-make-zero -traffic-deaths-a-reality-1138.

analytics in city government: How the Civic Analytics Network Cities Are Using Data
to Support Public Safety, Housing, Public Health, and Transportation
28
policy recommendations for implementing analytics
From improving public health outcomes to supporting safer transportation systems,
analytics can offer new insights and improvements to city governance across core
issue areas. While the structure, application, and processes used to develop, iterate,
and implement the ten examples of Civic Analytics Network projects detailed in this
report vary significantly, there are common policies adopted and operating within
each that other cities can replicate. There is a need for more research and literature
on city-level analytics to help practitioners and theorists alike understand how data-
driven decision-making practices are operating within municipal governments. This
report concludes with six policy recommendations derived from the Civic Analytics
Network’s work in public health, transportation, housing, and public safety to help
spur and guide the effective development of analytics projects in other cities across
the U.S.
1. Produce an Open Data Policy Roadmap – Adopting an open data policy can be a
boon to rapidly, transparently, and collaboratively developing comprehensive ana-
lytics projects. Open data policies and portals enable city governments to operate
with greater transparency to the public and to connect them directly to external
researchers, algorithms, and/or datasets that can support more effective analytics
project development. If advanced data use is a few steps down the road for a city,
crafting an open data roadmap can help city government become more data-savvy
to build towards future open data policy conversations. In early 2017, the Civic Ana-
lytics Network published an open letter to the open data community offering guide-
lines to help advance government capabilities for data portal development and to
help deliver on the promise of transparent governance.3 In June 2018, Civic Analytics
Network members reaffirmed their commitment to those eight guidelines, publish-
ing a one-year later letter to the open data community.
3 See “An Open Letter to the Open Data Community” (Ash Center) https://datasmart.ash.harvard.edu/news
/article/an-open-letter-to-the-open-data-community-988.

analytics in city government: How the Civic Analytics Network Cities Are Using Data
to Support Public Safety, Housing, Public Health, and Transportation
29
2. Create Programs and Job Descriptions that Promote Broad Data Literacy – By creat-
ing job descriptions and new frameworks for programs to appeal to data scientists
considering positions outside of government, cities can attract dynamic, data-lit-
erate personnel to embed and distribute data skills at various levels within city
government. Whether it is creating a CDO position, establishing an analytics team,
or simply embedding a data scientist within a department, establishing a role for
data expertise with the support of senior leadership can enable city officials to
develop the analytics projects that they need most. In addition to bringing in data
champions and expertise, cities can also improve internal capacities by designing
training programs to provide critical professional development opportunities to city
hall personnel. San Francisco’s SF Data Academy, which provides a pathway for city
employees to receive continuous professional development focused on data skills
and analytics from within government, is a leading example in city-level analytics
training programs.4
3. Incentivize and Enable Cross-Departmental Collaboration to Connect Personnel
and Data Resources from across City Government – Developing an analytics project
places data scientists in an internal consultant role, as they are typically situated
outside of the department where that project will be implemented. It is important
to establish pathways for data scientists to collaborate and receive input from the
relevant department or agency, and, simultaneously, pathways to incentivize city
personnel to engage with those new data science experts need to be established
by supervisors or even from the bully pulpit. Government personnel operate in a
bureaucracy and it is important for their supervisors to establish space in their day-
to-day responsibilities to help them “make the time” to engage on data-focused
projects. By incentivizing department or agency personnel to connect with data sci-
entists within city hall, supervisors or even the bully pulpit can open up space within
city staff’s day-to-day schedule and performance requirements to enable them to
pursue analytics solutions to core issues. Beyond connecting departmental person-
nel to data scientists via substantive pathways for collaboration, cross-departmental
4 See “San Francisco’s Data Academy Develops a Data-Savvy Workforce” (Ash Center) https://datasmart.ash
.harvard.edu/news/article/san-franciscos-data-academy-develops-a-data-savvy-workforce-973.

analytics in city government: How the Civic Analytics Network Cities Are Using Data
to Support Public Safety, Housing, Public Health, and Transportation
30
engagement is also key. While many city departments maintain useful data reposi-
tories, that data is often siloed or incompatibly structured, rendering analyses with
data maintained by various departments infeasible. Establishing resources, tools,
or policies to help streamline data standardization and warehousing can enable
cross-departmental data sharing and is a critical facet of becoming a data-smart
city. In Los Angeles, GeoHub, the city’s open data platform, offers unprecedented
access to the city’s highly integrated data resources. GeoHub is a publicly avail-
able platform designed to allow the public to explore, visualize, and download loca-
tion-based open data. It also allows departments across the city to share, access,
and collaboratively utilize other departments’ data.5 Other Civic Analytics Network
members are working to replicate this platform in their cities.
4. Adopt Enterprise-Wide Procedures that Facilitate Data-Driven Insights – Whatever
methods a city uses to encourage data analytics, adopting an effective project man-
agement process means establishing a policy framework that enables data science
experts to design analytics projects with the support of the city’s legal, adminis-
trative, and oversight capacities. “Human-centered design” is a commonly used
method among Civic Analytics Network cities and offers methods that help craft
analytics projects that are responsive, equitable, transparent, and designed with
community members in mind. To develop useful analytics projects, cities need
enterprise-wide procedures, such as data usage practices, security protocols, or
standardized legal and data sharing agreements. For example, in New York City,
the Mayor’s Office of Data Analytics (MODA) created the MODA Process Map to
help departments develop data use practices and internal awareness.6 While these
procedures can help streamline, stabilize, and embed data use practices across
government, project managers must be mindful of potential blind spots, such as
algorithmic biases, that may be unwittingly built into their models. Allegheny County,
Pennsylvania, a county-level member of the Civic Analytics Network and home to the
5 See “The Power of Data Visualization in Cities: Los Angeles’ GeoHub” (Ash Center) https://datasmart.ash
.harvard.edu/news/article/webinar-the-power-of-data-visualization-in-cities-1077.
6 See “Mayor’s Office of Data Analytics (MODA) Project Process” (New York City) http://www1.nyc.gov/assets
/analytics/downloads/pdf/MODA-project-process.pdf.

analytics in city government: How the Civic Analytics Network Cities Are Using Data
to Support Public Safety, Housing, Public Health, and Transportation
31
City of Pittsburgh, a network member, has developed a Data Warehouse to create a
more efficient and data-driven environment for the delivery of human services. The
Data Warehouse has enabled county administrators to learn more about individual
clients and address gaps in coverage.7 Many Civic Analytics Network cities are now
pursuing their first data warehouses, and this network-wide trend represents an
important shift in practice from project-based data-use efforts to organization-wide
strategic data practices and policies.
5. Link Civic Engagement with City Analytics – Chief data officers may work within
the walls of city hall, but they are members of a broader community and data eco-
system. The best analytics insights come when city government data use and civic
engagement converge—after all, the public is the constituency for city analytics.
Whether an organization is analyzing datasets available on an open data portal,
developing a data visualization, or scoping a predictive analytics project, the results
any of these efforts yield are better crafted when co-created with the public. By pro-
ducing analytics models informed by direct input from city residents or developed
in partnership with a civic tech group, cities will garner better service improvements
and data-driven insights.8 Kansas City, MO, for example, uses a quarterly feedback
mechanism called the Citizen Survey through which residents can both respond to
prompt questions provided by the city and communicate their top priorities for the
city.9 Citizen Survey is a leading example of a municipal citizen survey tool and has
established a continuous feedback loop to link citizen perspectives to Kansas City’s
performance and services.
6. Produce Guardrails to Protect Equity and Fairness Issues – Analytics is a practical
tool for overcoming resource shortages and for distilling vast and disparate data,
but it can also lead to the reproduction of biases and inequities under the banner
7 See “Allegheny County, Pennsylvania: Department of Human Services? Data Warehouse” (Ash Center) https://
datasmart.ash.harvard.edu/news/article/allegheny-county-pennsylvania-department-of-human-services
-data-warehouse-4.
8 See “Customer-Driven Government” (Ash Center) https://datasmart.ash.harvard.edu/news/article
/customer-driven-government-721.
9 See “How Citizens See It: Kansas City’s Citizen Survey Adds Citizens’ Perceptions to the Equation” (Ash Center)
https://datasmart.ash.harvard.edu/news/article/how-citizens-see-it-677.

analytics in city government: How the Civic Analytics Network Cities Are Using Data
to Support Public Safety, Housing, Public Health, and Transportation
32
of data science. Establishing standards of practice and mechanisms that ensure
clear and continuous engagement with the public are critical components for cities
to maintain transparent, equitable governance, and for incorporating inclusive ana-
lytics practices into city government. Under the leadership of San Francisco’s chief
data officer and the new chair of the Civic Analytics Network, Joy Bonaguro, the net-
work is developing a toolkit to help cities assess the risks and biases of algorithms.
This toolkit focuses on algorithms developed both within city hall and by third-party
vendors, and aims to help safeguard city analytics so that future data-driven efforts
are able to produce fair and equitable solutions for the benefit of all community
members.10
10 Also See “Potholes, Rats, and Criminals: A Framework for AI Ethical Risk” (Ash Center) https://datasmart.ash
.harvard.edu/news/article/potholes-rats-and-criminals.

33
appendices

34
analytics in city government: How the Civic Analytics Network Cities Are Using Data
to Support Public Safety, Housing, Public Health, and Transportation
appendix a the university of chicago’s data maturity framework

35
Data Maturity Framework QuestionnaireScorecard Category Question
Problem Definition
Problem DefinitionWhat is the problem you are trying to solve? What does success look like/howmuch does the needle need to move?
Interventions What interventions do you have available to solve the problem?
ImpactIf this is successful, what impact will this project have? Will it encourage futureprojects/goodwill?
Available Data What data sets do you have access to relevant to the problem?
Data Fields What fields are in each of the data sources? (See Data Sources Worksheet)
Size How many people/addresses/facilities/entities does the data contain?
Target PopulationFor this problem, what % of entities are at risk or have resources to beintervened?
Data Governance
Ownership
For the data sets that you have access to - do you own the data? Do you havepermission to use the data? If you do not own the data, do you have therelationships with the data owner?
Physical Accessibility Is the data accessible outside the department/agency? Is there a VPN?
Security PolicyWhat security policies and considerations need to be in place for each of thedata sources? (HIPPA, FERPA)
Technical Implementation Do you have people in house who can implement/deploy the solution?
Data Infrastructure
Do you have the internal tech and data infrstructure to provide a continuous datafeed from all the systems, and integrate the results/recommendations back in tothe agency systems?
Maintenance Can you update, maintain, and support the implemented solution?
Data ReadinessLagging Basic Advanced Leading
Accessibility How accessible is the data that's required?
Storage How is the data stored?
Integration How intergrated are the different data sources?
Relevance and Sufficiency Do you have data that is both relevant and sufficient to solve the problem?
Quality How is the data quality?
Collection Frequency How often is the data collected?
Granularity What is the level of granularity for the data sources?
History How much history is stored and how are updates handled?
Privacy What data privacy policies do you have in place?
Documentation How well documented are the data?
Lagging Basic Advanced Leading
Staff Buy InHow bought in are staff throughout the organization? What percentage of thestaff are involved in data collection? Data analysis?
Data Collector Buy In
How bought in are the people on the ground doing the data collection? Do theyunderstand the importance and nuance of data collection? Do they get directbenefit from collection data?
Leadership Buy InHow does leadership value data? Do they require data to be presented in orderto make decisions?
People Resources Do the people who will act on the results buy in?
Data Use PolicyAre there policies in place around who can use data, how they can use data,which parts can they use, and for what purposes?
Intervenor Buy In Do the people who will act on the results buy in?
Funder Buy InHow do your funders consider data? What kind of data do they require? Whatsupport for technology and personnel do they give you?
Implementation and Maintenance
ORGANIZATIONAL READINESS
APPENDIX A
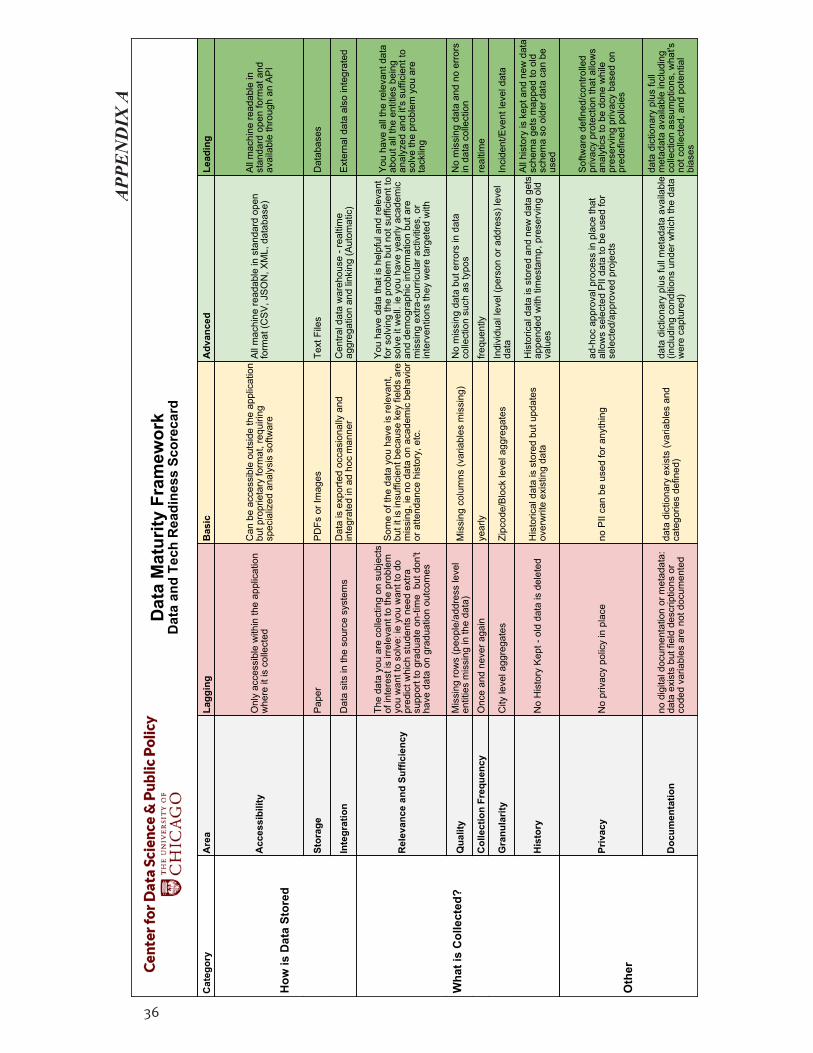
36
Cat
egor
yA
rea
Lagg
ing
Bas
icA
dvan
ced
Lead
ing
Acc
essi
bilit
yO
nly
acce
ssib
le w
ithin
the
appl
icat
ion
whe
re it
is c
olle
cted
Can
be
acce
ssib
le o
utsi
de th
e ap
plic
atio
nbu
t pro
prie
tary
form
at, r
equi
ring
spec
ializ
ed a
naly
sis
softw
are
All
mac
hine
read
able
in s
tand
ard
open
form
at (C
SV
, JS
ON
, XM
L, d
atab
ase)
All
mac
hine
read
able
inst
anda
rd o
pen
form
at a
ndav
aila
ble
thro
ugh
an A
PI
Stor
age
Pap
erP
DFs
or I
mag
esTe
xt F
iles
Dat
abas
es
Inte
grat
ion
Dat
a si
ts in
the
sour
ce s
yste
ms
Dat
a is
exp
orte
d oc
casi
onal
ly a
ndin
tegr
ated
in a
d ho
c m
anne
rC
entra
l dat
a w
areh
ouse
- re
altim
eag
greg
atio
n an
d lin
king
(Aut
omat
ic)
Ext
erna
l dat
a al
so in
tegr
ated
Rel
evan
ce a
nd S
uffic
ienc
y
The
data
you
are
col
lect
ing
on s
ubje
cts
of in
tere
st is
irre
leva
nt to
the
prob
lem
you
wan
t to
solv
e: ie
you
wan
t to
dopr
edic
t whi
ch s
tude
nts
need
ext
rasu
ppor
t to
grad
uate
on-
time
but
don
'tha
ve d
ata
on g
radu
atio
n ou
tcom
es
Som
e of
the
data
you
hav
e is
rele
vant
,bu
t it i
s in
suffi
cien
t bec
ause
key
fiel
ds a
rem
issi
ng, i
e no
dat
a on
aca
dem
ic b
ehav
ior
or a
ttend
ance
his
tory
, etc
.
You
hav
e da
ta th
at is
hel
pful
and
rele
vant
for s
olvi
ng th
e pr
oble
m b
ut n
ot s
uffic
ient
toso
lve
it w
ell.
ie y
ou h
ave
year
ly a
cade
mic
and
dem
ogra
phic
info
rmat
ion
but a
rem
issi
ng e
xtra
-cur
ricul
ar a
ctiv
ities
, or
inte
rven
tions
they
wer
e ta
rget
ed w
ith
You
hav
e al
l the
rele
vant
dat
aab
out a
ll th
e en
titie
s be
ing
anal
yzed
and
it's
suf
ficie
nt to
solv
e th
e pr
oble
m y
ou a
reta
cklin
g
Qua
lity
Mis
sing
row
s (p
eopl
e/ad
dres
s le
vel
entit
ies
mis
sing
in th
e da
ta)
Mis
sing
col
umns
(var
iabl
es m
issi
ng)
No
mis
sing
dat
a bu
t err
ors
in d
ata
colle
ctio
n su
ch a
s ty
pos
No
mis
sing
dat
a an
d no
err
ors
in d
ata
colle
ctio
nC
olle
ctio
n Fr
eque
ncy
Onc
e an
d ne
ver a
gain
year
lyfre
quen
tlyre
altim
e
Gra
nula
rity
City
leve
l agg
rega
tes
Zipc
ode/
Blo
ck le
vel a
ggre
gate
sIn
divi
dual
leve
l (pe
rson
or a
ddre
ss) l
evel
data
Inci
dent
/Eve
nt le
vel d
ata
His
tory
No
His
tory
Kep
t - o
ld d
ata
is d
elet
edH
isto
rical
dat
a is
sto
red
but u
pdat
esov
erw
rite
exis
ting
data
His
toric
al d
ata
is s
tore
d an
d ne
w d
ata
gets
appe
nded
with
tim
esta
mp,
pre
serv
ing
old
valu
es
All
hist
ory
is k
ept a
nd n
ew d
ata
sche
ma
gets
map
ped
to o
ldsc
hem
a so
old
er d
ata
can
beus
ed
Priv
acy
No
priv
acy
polic
y in
pla
ceno
PII
can
be u
sed
for a
nyth
ing
ad-h
oc a
ppro
val p
roce
ss in
pla
ce th
atal
low
s se
lect
ed P
II da
ta to
be
used
for
sele
cted
/app
rove
d pr
ojec
ts
Sof
twar
e de
fined
/con
trolle
dpr
ivac
y pr
otec
tion
that
allo
ws
anal
ytic
s to
be
done
whi
lepr
eser
ving
priv
acy
base
d on
pred
efin
ed p
olic
ies
Doc
umen
tatio
nno
dig
ital d
ocum
enta
tion
or m
etad
ata:
data
exi
sts
but f
ield
des
crip
tions
or
code
d va
riabl
es a
re n
ot d
ocum
ente
dda
ta d
ictio
nary
exi
sts
(var
iabl
es a
ndca
tego
ries
defin
ed)
data
dic
tiona
ry p
lus
full
met
adat
a av
aila
ble
(incl
udin
g co
nditi
ons
unde
r whi
ch th
e da
taw
ere
capt
ured
)
data
dic
tiona
ry p
lus
full
met
adat
a av
aila
ble
incl
udin
gco
llect
ion
assu
mpt
ions
, wha
t'sno
t col
lect
ed, a
nd p
oten
tial
bias
es
Dat
a M
atur
ity F
ram
ewor
kD
ata
and
Tech
Rea
dine
ss S
core
card
How
is D
ata
Stor
ed
Wha
t is
Col
lect
ed?
Oth
er
APP
EN
DIX
A
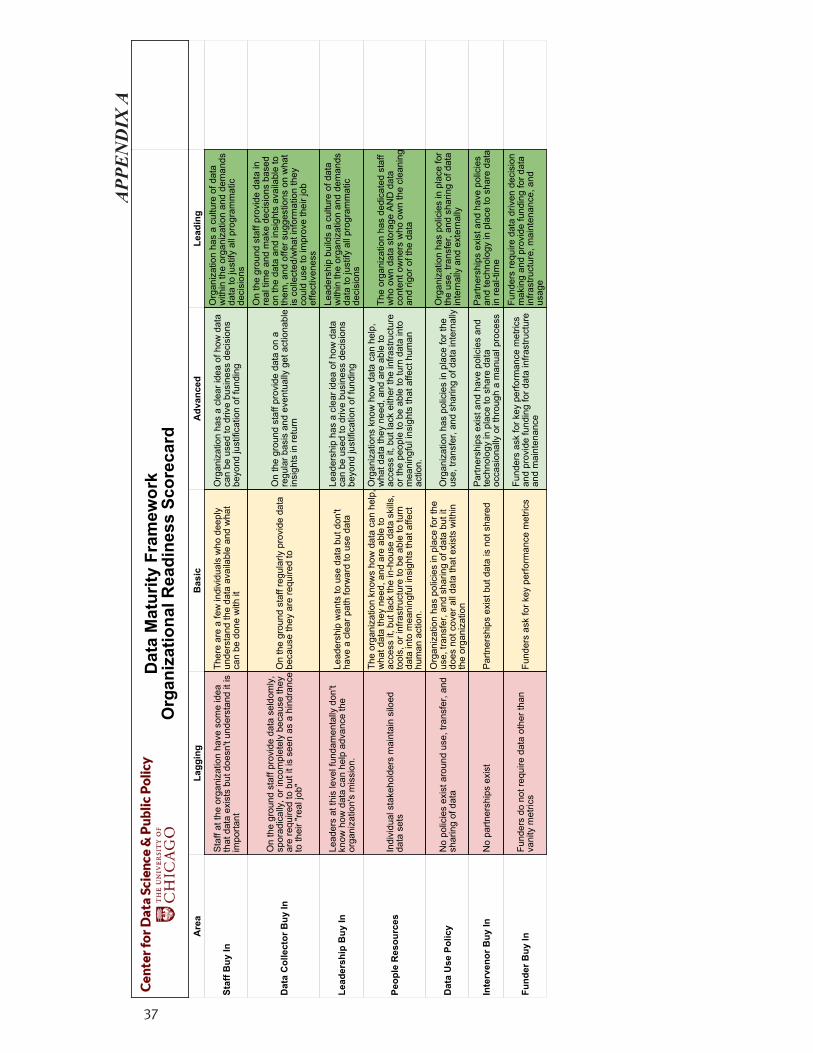
37
Are
aLa
ggin
gB
asic
Adv
ance
dLe
adin
g
Staf
f Buy
InS
taff
at th
e or
gani
zatio
n ha
ve s
ome
idea
that
dat
a ex
ists
but
doe
sn't
unde
rsta
nd it
isim
porta
nt
Ther
e ar
e a
few
indi
vidu
als
who
dee
ply
unde
rsta
nd th
e da
ta a
vaila
ble
and
wha
tca
n be
don
e w
ith it
Org
aniz
atio
n ha
s a
clea
r ide
a of
how
dat
aca
n be
use
d to
driv
e bu
sine
ss d
ecis
ions
beyo
nd ju
stifi
catio
n of
fund
ing
Org
aniz
atio
n ha
s a
cultu
re o
f dat
aw
ithin
the
orga
niza
tion
and
dem
ands
data
to ju
stify
all
prog
ram
mat
icde
cisi
ons
Dat
a C
olle
ctor
Buy
InO
n th
e gr
ound
sta
ff pr
ovid
e da
ta s
eldo
mly
,sp
orad
ical
ly, o
r inc
ompl
etel
y be
caus
e th
eyar
e re
quire
d to
but
it is
see
n as
a h
indr
ance
to th
eir "
real
job"
On
the
grou
nd s
taff
regu
larly
pro
vide
dat
abe
caus
e th
ey a
re re
quire
d to
On
the
grou
nd s
taff
prov
ide
data
on
are
gula
r bas
is a
nd e
vent
ually
get
act
iona
ble
insi
ghts
in re
turn
On
the
grou
nd s
taff
prov
ide
data
inre
al ti
me
and
mak
e de
cisi
ons
base
don
the
data
and
insi
ghts
ava
ilabl
e to
them
, and
offe
r sug
gest
ions
on
wha
tis
col
lect
ed/w
hat i
nfor
mat
ion
they
coul
d us
e to
impr
ove
thei
r job
effe
ctiv
enes
s
Lead
ersh
ip B
uy In
Lead
ers
at th
is le
vel f
unda
men
tally
don
'tkn
ow h
ow d
ata
can
help
adv
ance
the
orga
niza
tion'
s m
issi
on.
Lead
ersh
ip w
ants
to u
se d
ata
but d
on't
have
a c
lear
pat
h fo
rwar
d to
use
dat
aLe
ader
ship
has
a c
lear
idea
of h
ow d
ata
can
be u
sed
to d
rive
busi
ness
dec
isio
nsbe
yond
just
ifica
tion
of fu
ndin
g
Lead
ersh
ip b
uild
s a
cultu
re o
f dat
aw
ithin
the
orga
niza
tion
and
dem
ands
data
to ju
stify
all
prog
ram
mat
icde
cisi
ons
Peop
le R
esou
rces
Indi
vidu
al s
take
hold
ers
mai
ntai
n si
loed
data
set
s
The
orga
niza
tion
know
s ho
w d
ata
can
help
,w
hat d
ata
they
nee
d, a
nd a
re a
ble
toac
cess
it, b
ut la
ck th
e in
-hou
se d
ata
skill
s,to
ols,
or i
nfra
stru
ctur
e to
be
able
to tu
rnda
ta in
to m
eani
ngfu
l ins
ight
s th
at a
ffect
hum
an a
ctio
n.
Org
aniz
atio
ns k
now
how
dat
a ca
n he
lp,
wha
t dat
a th
ey n
eed,
and
are
abl
e to
acce
ss it
, but
lack
eith
er th
e in
frast
ruct
ure
or th
e pe
ople
to b
e ab
le to
turn
dat
a in
tom
eani
ngfu
l ins
ight
s th
at a
ffect
hum
anac
tion.
The
orga
niza
tion
has
dedi
cate
d st
aff
who
ow
n da
ta s
tora
ge A
ND
dat
aco
nten
t ow
ners
who
ow
n th
e cl
eani
ngan
d rig
or o
f the
dat
a
Dat
a U
se P
olic
yN
o po
licie
s ex
ist a
roun
d us
e, tr
ansf
er, a
ndsh
arin
g of
dat
a
Org
aniz
atio
n ha
s po
licie
s in
pla
ce fo
r the
use,
tran
sfer
, and
sha
ring
of d
ata
but i
tdo
es n
ot c
over
all
data
that
exi
sts
with
inth
e or
gani
zatio
n
Org
aniz
atio
n ha
s po
licie
s in
pla
ce fo
r the
use,
tran
sfer
, and
sha
ring
of d
ata
inte
rnal
lyO
rgan
izat
ion
has
polic
ies
in p
lace
for
the
use,
tran
sfer
, and
sha
ring
of d
ata
inte
rnal
ly a
nd e
xter
nally
Inte
rven
or B
uy In
No
partn
ersh
ips
exis
tP
artn
ersh
ips
exis
t but
dat
a is
not
sha
red
Par
tner
ship
s ex
ist a
nd h
ave
polic
ies
and
tech
nolo
gy in
pla
ce to
sha
re d
ata
occa
sion
ally
or t
hrou
gh a
man
ual p
roce
ss
Par
tner
ship
s ex
ist a
nd h
ave
polic
ies
and
tech
nolo
gy in
pla
ce to
sha
re d
ata
in re
al-ti
me
Fund
er B
uy In
Fund
ers
do n
ot re
quire
dat
a ot
her t
han
vani
ty m
etric
sFu
nder
s as
k fo
r key
per
form
ance
met
rics
Fund
ers
ask
for k
ey p
erfo
rman
ce m
etric
san
d pr
ovid
e fu
ndin
g fo
r dat
a in
frast
ruct
ure
and
mai
nten
ance
Fund
ers
requ
ire d
ata
driv
en d
ecis
ion
mak
ing
and
prov
ide
fund
ing
for d
ata
infra
stru
ctur
e, m
aint
enan
ce, a
ndus
age
Dat
a M
atur
ity F
ram
ewor
kO
rgan
izat
iona
l Rea
dine
ss S
core
card
APP
EN
DIX
A

38
analytics in city government: How the Civic Analytics Network Cities Are Using Data
to Support Public Safety, Housing, Public Health, and Transportation
appendix b the university of chicago’s project scoping worksheet

39
CenterforDataScienceandPublicPolicyUniversityofChicago dsapp.uchicgo.edu
DataScienceProjectScopingWorksheet
1. ProjectName:
2. OrganizationName:
3. ProjectDescription:
4. Whoaretheagencies/departmentsthatwillneedtobeinvolved?
5. Whoaretheindividualsintheseorganizationsthatarestakeholders?Whataretheirrole?
6. Goals(inorderofpriority)
Whatareyoumaximizingorminimizing?Arethereanyconstraints(budget,resources,etc.)?
Goal1: Goal2: Goal3:
Constraint: Constraint: Constraint:
APPENDIX B
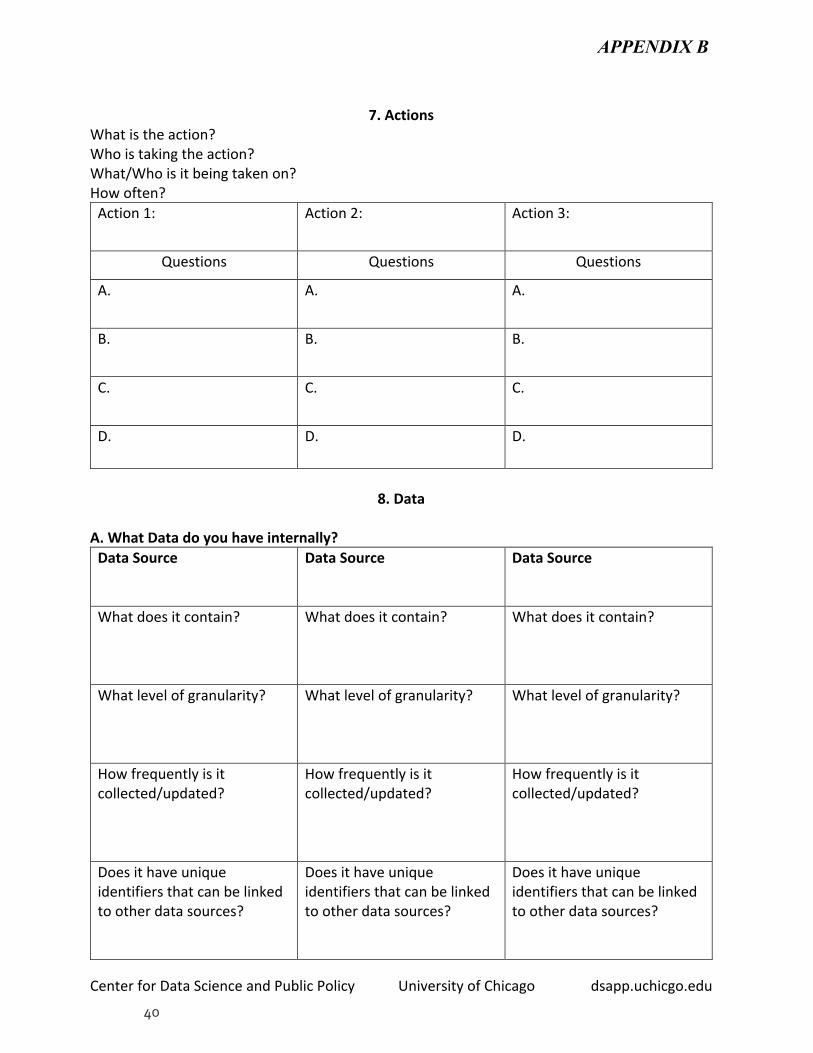
40
CenterforDataScienceandPublicPolicyUniversityofChicago dsapp.uchicgo.edu
7. ActionsWhatistheaction?Whoistakingtheaction?What/Whoisitbeingtakenon?Howoften?Action1: Action2: Action3:
Questions Questions Questions
A. A. A.
B. B. B.
C. C. C.
D. D. D.
8. Data
A. WhatDatadoyouhaveinternally?DataSource DataSource DataSource
Whatdoesitcontain? Whatdoesitcontain? Whatdoesitcontain?
Whatlevelofgranularity? Whatlevelofgranularity? Whatlevelofgranularity?
Howfrequentlyisitcollected/updated?
Howfrequentlyisitcollected/updated?
Howfrequentlyisitcollected/updated?
Doesithaveuniqueidentifiersthatcanbelinkedtootherdatasources?
Doesithaveuniqueidentifiersthatcanbelinkedtootherdatasources?
Doesithaveuniqueidentifiersthatcanbelinkedtootherdatasources?
APPENDIX B

41
CenterforDataScienceandPublicPolicyUniversityofChicago dsapp.uchicgo.edu
Other
Other
Other
B.Whatdatacanyougetexternallyand/orfrompublicsources?DataSource
DataSource
DataSource
Whatdoesitcontain?
Whatdoesitcontain?
Whatdoesitcontain?
Whatlevelofgranularity?
Whatlevelofgranularity?
Whatlevelofgranularity?
Howfrequentlyisitcollected/updated?
Howfrequentlyisitcollected/updated?
Howfrequentlyisitcollected/updated?
Doesithaveuniqueidentifiersthatcanbelinkedtootherdatasources?
Doesithaveuniqueidentifiersthatcanbelinkedtootherdatasources?
Doesithaveuniqueidentifiersthatcanbelinkedtootherdatasources?
Other
Other
Other
C.Whatdatawouldyouneedinadditiontotheonesabove?DataSource:DataSource:
APPENDIX B

42
CenterforDataScienceandPublicPolicyUniversityofChicago dsapp.uchicgo.edu
DataSource:
9.Analysis
Whatanalysisneedstobedone?Howwillyouvalidatetheanalysis?Analysis1:
Analysis2: Analysis3:
Analysistype:
Analysistype: Analysistype:
Whichactionwillthisanalysisinform?
Whichactionwillthisanalysisinform?
Whichactionwillthisanalysisinform?
Howwillyouvalidatethisanalysis?
Howwillyouvalidatethisanalysis?
Howwillyouvalidatethisanalysis?
APPENDIX B

analytics in city government: How the Civic Analytics Network Cities Are Using Data
to Support Public Safety, Housing, Public Health, and Transportation
43
appendix c city of chicago’s research question evaluation criteria

44
Research Question Evaluation Criteria: Predictive Analytics Projects chicago.github.io w dev.cityofchicago.org w @ChicagoCDO w @ThorSean
Criteria Question Response
1. DataReadiness
Is data associated with this RQ available and/or ready to be analyzed?
• Available• Partly available• Not available
2. PolicyAlignment
Does this RQ align with City policy goals—from both the Mayor’s Office and applicable departments?
• Yes• No
3. OperationalImpact
As a pilot, what level of opportunity would this RQ provide for positive operational outcomes—i.e., a reduction in time/cost when compared to current operations?
• High• Medium• Low
4. ResidentImpact
As a pilot, what level of opportunity would this RQ directly provide benefit to the residents of Chicago?
• High• Medium• Low
5. Level of Use If this pilot were to become a fully operational tool in your department, what level of use would it receive?
• Weekly• Monthly• Quarterly• Annually
6. Potential forReplication
Would implementing this RQ as a pilot provide a model that can be reused for other operational areas of your department, or elsewhere in the city?
• Yes• Unsure• No
7. OperationalChange
If this pilot were to become a fully operational tool in your department, how drastically would it alter current operations?
• (Open-endedresponse)
APPENDIX C

A publication of the
Ash Center for Democratic Governance and Innovation
Harvard Kennedy School
79 John F. Kennedy Street
Cambridge, ma 02138
616-495-0557
www.ash.harvard.edu


