research papers
256 doi:10.1107/S1399004714025188 Acta Cryst. (2015). D71, 256–265
Acta Crystallographica Section D
BiologicalCrystallography
ISSN 1399-0047
Analysis of the HindIII-catalyzed reaction bytime-resolved crystallography
Takashi Kawamura,a Tomoki
Kobayashib and Nobuhisa
Watanabea,b*
aSynchrotron Radiation Research Center,
Nagoya University, Chikusa-ku,
Nagoya 464-8603, Japan, and bGraduate
School of Engineering, Nagoya University,
Chikusa-ku, Nagoya 464-8603, Japan
Correspondence e-mail: [email protected]
In order to investigate the mechanism of the reaction
catalyzed by HindIII, structures of HindIII–DNA complexes
with varying durations of soaking time in cryoprotectant
buffer containing manganese ions were determined by the
freeze-trap method. In the crystal structures of the complexes
obtained after soaking for a longer duration, two manganese
ions, indicated by relatively higher electron density, are clearly
observed at the two metal ion-binding sites in the active site of
HindIII. The increase in the electron density of the two metal-
ion peaks followed distinct pathways with increasing soaking
times, suggesting variation in the binding rate constant for the
two metal sites. DNA cleavage is observed when the second
manganese ion appears, suggesting that HindIII uses the two-
metal-ion mechanism, or alternatively that its reactivity is
enhanced by the binding of the second metal ion. In addition,
conformational change in a loop near the active site
accompanies the catalytic reaction.
Received 8 September 2014
Accepted 17 November 2014
PDB references: HindIII–
DNA complex, 3wvg; 3wvh;
3wvi; 3wvk; 3wvp
1. Introduction
The restriction endonuclease (REase) family of enzymes has
several members. In particular, type IIP REases have been
widely investigated (Pingoud et al., 2014) because of their
potential in biomolecular engineering. For example, the
REBASE database catalogues information about REases
(Robert et al., 2010). Structural features of REases contri-
buting to their restrictive sequence specificity are particularly
intriguing, and many REases have been studied using X-ray
crystallography. Investigations into the mechanism of the
reaction catalyzed by REases, the molecular mechanism of the
hydrolysis of the phosphodiester bond, have been reported
more recently. Previous studies have indicated that divalent
metals ions are cofactors in the reaction mechanism; however,
elucidation of their exact roles is challenging since mutating
amino-acid residues at the binding site can impact other
aspects of the reaction. Several co-crystal structures of REases
with bound DNA and divalent metal ions, where the reaction
has either been suspended (in the presence of calcium ions)
or progressed further along the reaction coordinates (cleaved
phosphodiester bonds), have been reported (Viadiu &
Aggarwal, 1998; Lukacs et al., 2000; Horton & Cheng, 2000;
Horton & Perona, 2004). The number of metal ions retained at
the active site in these structures varies; therefore, mechan-
isms with one metal ion, two metal ions and even three metal
ions have independently been proposed (Pingoud et al., 2005).
While kinetic analysis with computer simulations suggests
that one metal ion is sufficient for the reaction to progress
(Pingoud et al., 2009; Xie et al., 2008), it is still unclear whether

the divalent metal ions in these multiple
sites observed in the crystal structure
are critical for the catalytic reaction of
REases (Prasannan et al., 2010; Pingoud
et al., 2014).
We previously reported a crystal
structure of a HindIII–DNA complex
(Watanabe et al., 2009). In this study,
crystals were dialyzed against a magne-
sium ion-containing buffer for a week.
In the resolved structure, the bound
DNA was already cleaved and two
divalent-metal ions (manganese and
magnesium ions at sites A and B,
respectively) were observed at the
active site. The existence of the two
metal ions may suggest a two-metal-ion-
based mechanism for the reaction cata-
lyzed by HindIII. However, it is unclear
whether two metal ions are necessary
for the reaction. For example, it can be
argued that one of the ions is introduced
after the scission reaction.
Time-resolved techniques are typi-
cally used to study catalytic mechanisms, and several methods
have been developed. Freeze trapping is one such technique.
Usually, the reaction is triggered by introducing a small
compound into the crystals of the enzyme by soaking. After an
appropriate soaking time, the protein crystals are instantly
cooled to trap the reaction intermediate. The solved struc-
tures, in which the intermediates are trapped along the reac-
tion coordinate, are a source of information that can facilitate
discussions with regard to the catalytic mechanism. Mechan-
istic insights into enzyme-catalyzed reactions gained by freeze
trapping have recently been reported (Nakamura et al., 2012;
Hare et al., 2012). However, in some cases it is not easy to
rationalize the solved structures.
In order to investigate the catalytic mechanism of HindIII,
time-resolved crystal structure analysis by freeze trapping was
performed. Manganese ion (1 mM) was used to trigger the
reaction catalyzed by HindIII. For this, crystals of a HindIII–
DNA complex were introduced into manganese-containing
buffer and flash-cooled after soaking times of appropriate
lengths. Some type IIP REases are fully activated by a tenfold
lower concentration of manganese ion compared with
magnesium ion (Pingoud et al., 2009). Furthermore, manga-
nese ion is expected to be favoured at site A in HindIII
(Watanabe et al., 2009). For these reasons, we can use
manganese ion at a lower concentration than magnesium ion.
With this low concentration, it is expected that site A of
HindIII is initially occupied by manganese ion. This may
facilitate investigation into the catalytic role of the two metal
ion-binding sites in HindIII. In addition, manganese ions have
more electrons than magnesium ions, and it is easy to distin-
guish manganese ions from sodium ions in difference Fourier
maps (see below). On soaking, electron densities of manga-
nese ions appear as peaks at the two metal ion-binding sites in
the active site. The observed results and the insights into the
catalytic reaction mechanism of HindIII are discussed.
2. Materials and methods
2.1. Protein crystallization
All reagents used in this study were analytical grade, and
unless otherwise noted they were purchased from Wako Pure
Chemical Industries, Osaka, Japan. HindIII was prepared as
previously reported (Watanabe et al., 2009), with the following
modification to the purification method: the protein was
fractionated using ammonium sulfate before further purifica-
tion by Ni-affinity chromatography. Concentrated HindIII was
stored in 10 mM Tris–HCl pH 7.5 buffer containing 200 mM
NaCl and 10%(v/v) glycerol. The HPLC-purified oligo DNA
50-GCCAAGCTTGGC-30 (the cognate HindIII recognition
sequence is underlined), purchased from Integrated DNA
Technologies (IDT; Coralville, Iowa, USA), was dissolved in
sterilized water (2 mM) and incubated at 343 K for 10 min
to prepare 12-mer double-stranded DNA (dsDNA; 1 mM).
HindIII and the dsDNA were mixed so that the concentration
of HindIII was 6 g l�1 and the HindIII dimer:dsDNA molar
ratio was 2:3. The HindIII–DNA mixture was used in crys-
tallization by the hanging-drop vapour-diffusion method. A
crystal identical to that reported in the previous study could
not be obtained for reasons that remain unknown. The mother
liquor used in the crystallization experiments was 100 mM
Tris–HCl pH 7.5 buffer containing 10–15%(w/v) PEG 3350,
300 mM sodium thiocyanate and 10%(v/v) glycerol. Blade-
like crystals (approximately 200 � 50 � 20 mm) were gener-
ated within a week.
research papers
Acta Cryst. (2015). D71, 256–265 Kawamura et al. � HindIII-catalyzed reaction 257
Table 1Data collection and processing.
Values in parentheses are for the outer shell.
Soaking time (s) 0 25 40 60 230
PDB code 3wvg 3wvh 3wvi 3wvp 3wvkDiffraction source BL-5A NE-3A NE-3A BL-5A BL-5AWavelength (A) 1.000Temperature (K) 95Space group P21
Unit-cell parametersa (A) 80.25 80.78 80.61 80.50 80.25b (A) 141.16 143.29 143.24 140.70 141.16c (A) 96.58 94.32 94.36 96.47 96.58� (�) 112.0 113.5 113.4 112.1 112.0
Resolution range (A) 50.0–2.25(2.29–2.25)
50.0–2.54(2.59–2.54)
50.0–2.55(2.59–2.55)
50.0–2.30(2.34–2.30)
50.0–2.00(2.03–2.00)
Total No. of reflections 346596 225118 243043 258376 483264No. of unique reflections 93316 63629 64086 87848 133005Completeness (%) 99.7 (97.7) 98.4 (93.8) 99.7 (97.1) 99.9 (100.0) 99.9 (99.8)Multiplicity 3.7 (3.7) 3.5 (2.9) 3.8 (3.2) 3.8 (3.8) 3.6 (3.4)hI/�(I)i 16.5 (2.2) 12.4 (2.9) 14.2 (2.5) 17.0 (2.0) 21.2 (2.1)Rmerge† 0.128 (0.892) 0.136 (0.591) 0.133 (0.590) 0.154 (0.914) 0.104 (0.804)Overall B factor from
Wilson plot (A2)31.4 28.9 29.8 34.4 20.0
† Rmerge =P
hkl
Pi jIiðhklÞ � hIðhklÞij=
Phkl
Pi IiðhklÞ.

2.2. Data collection and processing
For the time-resolved study, a cryoprotectant buffer, i.e.
100 mM Tris–HCl pH 7.5 containing 10–15%(w/v) PEG 3350,
300 mM sodium thiocyanate, 22.5%(v/v) glycerol and 1 mM
MnCl2, was prepared. HindIII crystals were dipped into the
buffer and after 25, 40, 60 and 230 s were picked up using a
nylon loop and flash-cooled at 95 K with N2 gas. Since there is
no method such as optical absorption spectroscopy that can be
used to monitor the progress of the reaction, the time intervals
were determined using poor crystals with a trial-and-error
process mainly monitoring the peak height, or the occupancy,
of the metal sites and the structure of the bound dsDNA.
Manganese ion-free cryoprotectant was used to represent the
0 s structure. X-ray diffraction data were collected on beam-
lines BL5A and AR-NE3A at the Photon Factory, Tsukuba,
Japan. The data were indexed, integrated and scaled with
HKL-2000 (Otwinowski & Minor, 1997). Diffraction data
statistics are summarized in Table 1.
2.3. Structure determination
The scaled intensity data were converted to structure
factors with CTRUNCATE (French & Wilson, 1978) from the
CCP4 suite (Winn et al., 2011). Initial phases were determined
by the molecular-replacement method with Phaser (McCoy et
al., 2007). The HindIII protomer, bound DNA and unbound
DNA reported in the previous study (PDB entries 2e52 and
3a4k) were used as search models. The initial models were
refined with REFMAC5 (Murshudov et al., 2011) from the
CCP4 suite and Coot (Emsley et al., 2010). The occupancies of
manganese ions in the 25, 40 and 60 s structures were deter-
mined by iterative refinement cycles of occupancies, coordi-
nates and temperature factors with phenix.refine from the
PHENIX software suite (Adams et al., 2010). The convergence
of these refined occupancies was affirmed using 0.01 or 0.99 as
the initial values.
2.4. Validations and analyses
The determined structures were validated with MolProbity
(Chen et al., 2010). Model quality statistics are summarized in
Table 2. Electron density maps with mFo � DFc amplitudes
were prepared after simulated annealing with phenix.refine
and were displayed with PyMOL (v.1.6.0.0; Schrodinger).
3. Results
3.1. Structure description
Crystal structures of the HindIII–DNA complex freeze-
trapped 0, 25, 40, 60 and 230 s after dipping into the manga-
nese ion-containing buffer were determined with resolutions
of 2.25, 2.54, 2.55, 2.30 and 2.00 A, respectively. Each crystal
structure of HindIII observed in this study has four HindIII
polypeptides and eight DNA 12-mer chains; two HindIII
dimers are complexed with dsDNA in the asymmetric unit
(Figs. 1a and 1b). The two HindIII dimers interact with each
research papers
258 Kawamura et al. � HindIII-catalyzed reaction Acta Cryst. (2015). D71, 256–265
Table 2Structure solution and refinement.
Values in parentheses are for the outer shell.
Soaking time (s) 0 25 40 60 230
Resolution range (A) 39.7–2.25 (2.31–2.25) 32.9–2.54 (2.61–2.54) 32.2–2.55 (2.61–2.55) 39.7–2.30 (2.36–2.30) 39.8–2.00 (2.06–2.00)Completeness (%) 99.6 (97.0) 98.4 (92.1) 99.7 (96.2) 99.7 (97.4) 99.7 (97.1)No. of reflections, working set 88601 60401 60836 83386 126277No. of reflections, test set 4714 3227 3249 4430 6688Final Rcryst 0.180 (0.273) 0.179 (0.284) 0.176 (0.267) 0.184 (0.287) 0.181 (0.275)Final Rfree 0.226 (0.314) 0.241 (0.345) 0.234 (0.349) 0.231 (0.329) 0.226 (0.318)Cruickshank DPI 0.225 0.463 0.448 0.281 0.145No. of non-H atoms
Protein 9808 9808 9808 9808 9808Na+ 8 0 0 0 0Mn2+ 0 8 8 8 8Ligand 18 24 24 24 24Nucleic acid 1944 1944 1944 1946 1948Water 429 343 378 338 451Total 12207 12127 12162 12124 12239
R.m.s. deviationsBonds (A) 0.0159 0.0129 0.0131 0.0139 0.0183Angles (�) 1.7826 1.6111 1.6228 1.6394 1.8840
Average B factors (A2)Overall 38.4 30.6 31.4 40.9 36.8Protein 38.66 30.72 31.94 41.89 36.72Na+ 35.86 — — — —Mn2+ — 22.98 28.29 33.80 26.64Bound dsDNA 24.72 18.40 20.00 29.02 24.52Extra dsDNA 50.39 43.73 37.66 56.47 51.24Water 33.73 22.35 24.68 34.18 32.28
Ramachandran plotMost favoured (%) 97 96 96 95 97Allowed (%) 3 3 3 4 3

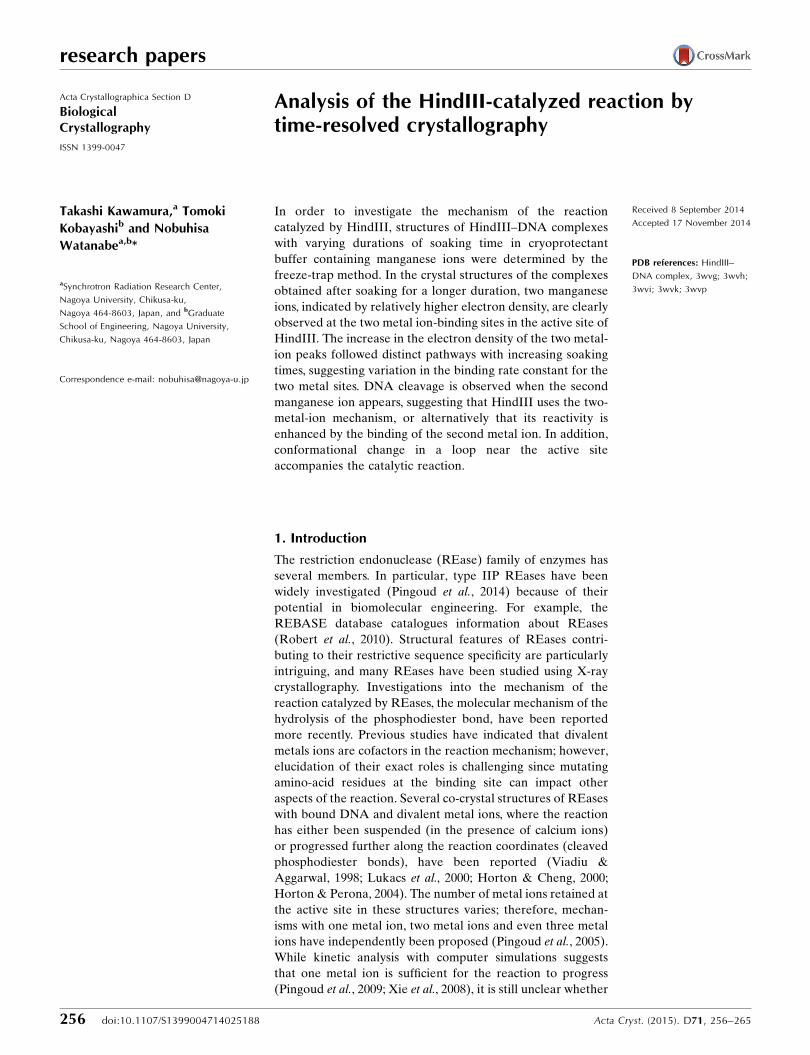
other, appearing as a dimer of dimers (one dimer is shown as
green and cyan ribbons and the other is shown as grey ribbons
in Figs. 1a and 1b). The observed crystal packing is distinct
from that reported previously. Two additional dsDNAs are
bound to the dsDNAs, rather than to HindIII, in the HindIII–
DNA complexes (orange tubes in Figs. 1a and 1b). With these
extra dsDNAs, the molar ratio of HindIII dimer:dsDNA in the
crystal is 1:2.
The two metal ion-binding sites in the active site of HindIII
are shown as purple spheres in Fig. 1(c). In the 0 s structures
these sites are occupied by sodium ions. When the crystals are
soaked with the manganese ion-containing buffer (25–230 s),
growing electron-density peaks, regarded as manganese ions
(see below), are observed. Consistent with the catalytic
reaction, cleaved products, i.e. 4-mer (GCCA) and 8-mer
(AGCTTGGC) oligos, are observed in the structure obtained
after an immersion time of 230 s. In the 60 s structure both
cleaved and uncleaved DNA oligos seem to exist, and models
were constructed with half occupancy and superimposed over
each other.
Thr117 in all of the solved HindIII structures in this study
does not conform to the Ramachandran rules, likely owing
to distortions caused by its interactions with the DNA at the
major groove. Other validation scores are listed in Table 2.
3.2. Soaking time-dependent structural changes in the activesite
In order to investigate the changes in the structure of the
active site depending on the duration of the soaking time
(0, 25, 40, 60 and 230 s), mFo � DFc maps omitting ions at
the metal-binding sites were calculated. With increases in the
duration of soaking time in the cryoprotectant, the increasing
presence of manganese ions at the active site of HindIII is
indicated by two increasing electron-density peaks (shown as
mesh in Fig. 2). The diffusion time of ions and small molecules
research papers
Acta Cryst. (2015). D71, 256–265 Kawamura et al. � HindIII-catalyzed reaction 259
Figure 1Overall structure of HindIII solved in this study. The HindIII–dsDNAcomplex and additional dsDNAs in the asymmetric unit are shown in (a)and (b) (90� rotation). One dimer consisting of two monomers is colouredgreen and cyan, whereas the other dimer is coloured grey. Each dimerindependently binds dsDNA (coloured orange). The biologically relevantcomplex of the HindIII dimer with dsDNA is shown in (c) from aperspective that is rotated 90� around the axis horizontal to the paperfrom (a). Spheres indicate the metal ion-binding sites at the active site.

into protein crystals varies from seconds to hours (Geremia
et al., 2006). However, the diffusion speed of manganese ions
into the crystal of HindIII can be considered to be quick
enough for this time-resolved experiment, since the peak
height of site A shows that the occupancy of the manganese
ion is already 0.98 at 25 s. The relatively small electron-density
peaks observed in the 0 s structure are attributed to sodium
ions, because the mother liquor used for crystallization and the
cryoprotectant contain a high concentration of sodium ions
(>300 mM).
The observed increases in the electron density at the two
sites followed different trends. At site A an increase in elec-
tron density is observed in the 25 s and subsequent structures,
whereas at site B this starts from the 40 s structure. The
delayed incrementation of the electron-density peak at site B
continues until 60 s. However, in the 230 s structure the
heights of the two peaks are nearly equal. Similar changes in
the electron density, with minor variations in the peak heights,
are observed in each active site of the four HindIII enzymes in
the asymmetric unit. We attribute the electron-density peaks
research papers
260 Kawamura et al. � HindIII-catalyzed reaction Acta Cryst. (2015). D71, 256–265
Figure 2OMIT maps for detecting electron-density peaks of metal ions at metal-binding sites A and B in the (a) 0 s, (b) 25 s, (c) 40 s, (d) 60 s and (e) 230 sstructures. Only the two metal ions are omitted for calculations. HindIIIand the DNA molecules are shown as stick models. Water molecules areshown as small cyan-coloured balls. Electron-density contours are shownat 6� (cyan), 9� (deep blue) and 12� (purple).

in the active site at 230 s as depicting complete occupancy by
manganese ions, because the temperature factors of the ions
are comparable with the values for the surrounding atoms and
the electron-density peaks are sufficiently high (>20�).
3.3. Phosphodiester bond cleavage
The scissile phosphodiester bond of the DNA backbone
in the HindIII cognate sequence A/AGCTT was scrutinized
using OMIT maps (Fig. 3). The DNA structure of DA4 and
DA5 was omitted from the map calculations. The phospho-
diester bond is cleaved at 230 s (Fig. 3e). At 60 s, however, the
electron-density map indicates the presence of a significant
amount of uncleaved dsDNA (Fig. 3d). In structures of the
complex prior to 40 s there are no significant conformational
changes in the structure of dsDNA. In the 230 s structure,
conformational changes directly related to cleavage of the
phosphodiester bond between DA4 and DA5 in the DNA are
observed.
The reaction catalyzed by REases is a nucleophilic substi-
tution reaction with a water molecule as the nucleophile. In
research papers
Acta Cryst. (2015). D71, 256–265 Kawamura et al. � HindIII-catalyzed reaction 261
Figure 3OMIT maps for detecting the cleavage of the phosphodiester bond in the(a) 0 s, (b) 25 s, (c) 40 s, (d) 60 s and (e) 230 s structures. HindIII and theDNA molecules are shown as stick models. Water molecules are shown assmall cyan-coloured balls. Sodium ions in the 0 s structure and manganeseions in structures of the crystals cooled at the other time points are shownas large balls. Electron-density contours are the same as in Fig. 2. Part ofthe DNA structure of DA4–DA5 is omitted for the calculations.

the crystal structure of HindIII, a water
molecule coordinated to the manganese
ion at site A is observed as mFo � DFc
peaks in a position poised for attack on
the P atom of the DNA backbone (Fig.
4). Relatively weak electron density
representing a water molecule at the
equivalent position is observed in the
0 s structure (Fig. 4a). The electron
density at this position increases with
duration of immersion time (as in the 25
and 40 s structures; Figs. 4b and 4c,
respectively). The distorted electron-
density peaks observed in the 60 s
structure (Fig. 4d) indicate the forma-
tion of the reaction products. In the
230 s structure, electron densities show
that the nucleophilic water has become
part of the 50-terminal phosphate
moiety of the cleaved DNA (Fig. 4e).
3.4. Loop flipping
In the series of structures, a loop near
the active site is flipped with the
progress of the reaction. This loop,
Glu86–Asn90, is located near site B and
is distant from the nucleophilic water
and the scissile phosphodiester bond.
When compared with the loop-omitting
maps for the 0, 25 and 40 s structures
(Figs. 5a, 5b and 5c), the 230 s structure
(Fig. 5e) clearly depicts the flipping of
the loop, whereas the loop is only
partially flipped in the 60 s structure
(Fig. 5d), resulting in a partially disor-
dered electron-density map. The flip-
ping of the loop results in the
rearrangement of two interactions. One
of them, the side chain of Arg88, is inserted into the minor
groove of the dsDNA and indirectly interacts with the base
moiety via two water molecules. On flipping, the side chain of
Arg88 is expelled from the minor groove and the indirect base
interaction is broken. The other interaction involves the side
chain of Gln87, which is disordered in the structures of
enzyme–DNA complexes with shorter soaking times and is
flipped into the active site, coordinating to the manganese ion
at site B, in the crystal structure with longer soaking time
(Fig. 5e).
4. Discussion
In this study, we have determined time-resolved crystal
structures of a HindIII–DNA complex using the freeze-trap
method. The reaction was triggered by soaking the crystals
with a cryoprotectant containing manganese ion, and the
reaction was monitored by varying the soaking time before
flash-cooling. Soaking time-dependent variations in the elec-
tron-density peaks at the metal ion-binding sites are observed.
Phosphodiester bond cleavage in the crystal is also observed.
4.1. Metal ion-binding sites
In this time-resolved study, electron-density peaks at site A
increase at a faster rate than at site B. At 25 s, the refined
occupancies of manganese ion at site A have already become
almost 1.00; the average for the four subunits is 0.98. Mean-
while, the averaged occupancies of site B in the asymmetric
unit are 0.47, 0.58, 0.74 and 0.96 at 25, 40, 60 and 230 s,
respectively, if the sites were refined as manganese ions.
However, the behaviour of these metal sites should be
reflected by the increase in manganese ion and the decrease in
sodium ion over the soaking time. Since simultaneous refine-
ment of the occupancies and B factors of the superimposed
ions did not converge, the occupancies of the two metal ions
were estimated when refined as manganese. If the sites are
research papers
262 Kawamura et al. � HindIII-catalyzed reaction Acta Cryst. (2015). D71, 256–265
Figure 4OMIT maps for detecting the electron-density peaks of the nucleophilic water moleculecoordinated to the metal ion at site A in the structures at (a) 0 s, (b) 25 s, (c) 40 s and (d) 60 s.The maps of the 0–60 s structures were prepared with the model of an intact DNA, whereas the230 s structure was prepared with the cleaved DNA model for phase calculation. The map of the230 s structure shows that the water molecule has become part of the phosphate group, whileremaining coordinated to the manganese ion at site A. Electron-density contours are shown at 3�(green) and 6� (cyan).

occupied by decreasing sodium and increasing manganese
ions, the estimated occupancies of manganese ion are 0.06,
0.26, 0.54 and 0.93, while those of sodium ion are 0.94, 0.74,
0.46 and 0.07 at 25, 40, 60 and 230 s, respectively. As shown in
Fig. 6, manganese ion replaces sodium ion and interacts with
surrounding side chains at site A without inducing significant
conformational changes. The coordinations of the metal ion-
binding sites are conserved during the catalytic reaction. This
suggests that the difference in the rate of occupation by
manganese at both sites can be considered as the difference in
the intrinsic association and dissociation rate constants of
manganese ions and sodium ion between sites A and B, rather
than a sequential binding of manganese ion, such as binding at
site A inducing the binding of the second ion at site B. A
possible reason for the difference in the rate constants may
result from the difference in the coordination properties at the
two sites. At 0 s, the mean distance between the metal and
either of the O atoms in the main-chain carbonyl of Ala109 or
research papers
Acta Cryst. (2015). D71, 256–265 Kawamura et al. � HindIII-catalyzed reaction 263
Figure 5OMIT maps and the interpreted models for the (a) 0 s, (b) 25 s, (c) 40 s,(d) 60 s and (e) 230 s structures. HindIII and the DNA molecules areshown as stick models. For the loop Gln87–Asn90 in the 60 s structure,alternative conformations were modelled in reference to the 0–40 s(green) and 230 s (magenta) structures. The contour level of these maps isthe same as in Fig. 4.

the phosphate moiety of DA5 is approximately 2.2 A for the
structures in the asymmetric unit (Fig. 6a). These coordination
distances are more suitable for manganese ion (2.15–2.10 A)
than for sodium ion (2.35–2.45 A) (the typical distances
reported are from Hsin et al., 2008). In the 230 s structure, the
manganese ion is clearly coordinated to the two ligands,
Ala109 and DA5, with distances similar to those in the 0 s
structure, whereas the other coordinate bond lengths are
shortened (Fig. 6c). Furthermore, the two ligands, i.e. O atoms
from the protein main chain and the DNA backbone, consti-
tute the diagonal of the octahedral coordination at site A.
Therefore, it is likely that the faster increase in manganese ion
at site A is derived from the favourable coordination distances
to manganese ion than to sodium ion compared with that in
site B.
4.2. Phosphodiester bond cleavage
The manganese ion adequately occupied site A at 25 s, but
the averaged occupancy of the manganese ion in site B only
increased to 0.06. Cleavage of the phosphodiester bond is not
yet observed in the electron-density maps. Based on the
electron-density maps, the cleavage of the phosphodiester
bond is first observed at 60 s, where the occupancy of site B
becomes 0.54. Therefore, the presence of the manganese ion in
site B might be a significant factor influencing catalysis by
HindIII. For some members of the REase family, a two-metal-
ion mechanism has been proposed on the basis of analyses of
X-ray crystal structures (Lambert et al., 2008; Deibert et al.,
2000). Recently, an improved mechanism was proposed in
which the ion at site A is implicated to be sufficient for cata-
lysis, while the presence of the second ion greatly accelerates
the reaction (Xie et al., 2008). The results of our studies are
consistent with this mechanism. Even if the presence of
manganese ion at site A is sufficient for progress of the
reaction catalyzed by HindIII, the cleavage of the phospho-
diester bond in DNA with the metal ion only at site A is
not detected by this freeze-trap approach. The reaction is
enhanced by the binding of metal ion at site B. A suppressive
role of the second ion, as suggested by Pingoud et al. (2009), is
not in agreement with the observations made in the case of
HindIII. This study reports the experimentally verified role of
the two metal ions for the first time.
4.3. Conformational shift of the loop at the active site
We observed a conformational shift of the loop at the active
site, a phenomenon that has not previously been observed.
However, flexibility of this loop had been predicted from the
observed unclear electron density (Watanabe et al., 2009). The
role of this flipping is not obvious; the reason for the trigger of
the conformational change, manganese ion binding at site B or
the phosphodiester bond cleavage, is unclear. However, the
interactions that are generated or broken as a result of this
flipping are indicative of its roles.
In the course of the conformational change, the side chain
of Gln87 is reoriented so as to coordinate with the manganese
ion at site B. This coordination induces a structural change in
research papers
264 Kawamura et al. � HindIII-catalyzed reaction Acta Cryst. (2015). D71, 256–265
Figure 6Coordination at the metal ion-binding sites in the (a) 0 s, (b) 60 s and (c)230 s structures. The coordinate bonds are shown as dashed lines withaveraged distances (A) of the four HindIII molecules in the asymmetricunit. The coordinate bonds from the main-chain O atom of Ala109 andfrom the phosphate-moiety O atom of DA5 to the Na+ ion at site A areindicated by bold lines.

the loop, causing the Arg88 residue to flip out from the minor
groove of the dsDNA, thereby breaking the interactions
between the amino acid and the phosphate backbone of the
dsDNA. This loss of hydrophilic and electrostatic interactions
between Arg88 and DNA appears to be necessary for the
dissociation of HindIII from the cleaved DNA. The two
residues Glu/Gln and Arg/Lys are partially conserved in Pfam
family RE_HindIII (ID PF09518). Furthermore, previously
reported results from activity studies with the E86K mutant,
which increases the activity of HindIII (Tang et al., 2000),
suggest the critical nature of the conformational change in the
loop for catalysis by HindIII.
We thank the beamline staff at the Photon Factory for their
assistance in the synchrotron experiments. This study was
supported by JSPS KAKENHI Grant No. 22370036.
References
Adams, P. D. et al. (2010). Acta Cryst. D66, 213–221.Chen, V. B., Arendall, W. B., Headd, J. J., Keedy, D. A., Immormino,
R. M., Kapral, G. J., Murray, L. W., Richardson, J. S. & Richardson,D. C. (2010). Acta Cryst. D66, 12–21.
Deibert, M., Siksnys, V., Grazulis, S., Sasnauskas, G. & Huber, R.(2000). Nature Struct. Biol. 7, 792–799.
Emsley, P., Lohkamp, B., Scott, W. G. & Cowtan, K. (2010). ActaCryst. D66, 486–501.
French, S. & Wilson, K. (1978). Acta Cryst. A34, 517–525.Geremia, S., Campagnolo, M., Demitri, N. & Johnson, L. N. (2006).
Structure, 14, 393–400.Hare, S., Maertens, G. N. & Cherepanov, P. (2012). EMBO J. 31, 3020–
3028.Horton, J. R. & Cheng, X. (2000). J. Mol. Biol. 300, 1049–1056.Horton, N. C. & Perona, J. J. (2004). Biochemistry, 43, 6841–6857.
Hsin, K., Sheng, Y., Harding, M. M., Taylor, P. & Walkinshaw, M. D.(2008). J. Appl. Cryst. 41, 963–968.
Lambert, A. R., Sussman, D., Shen, B., Maunus, R., Nix, J.,Samuelson, J., Xu, S.-Y. & Stoddard, B. L. (2008). Structure, 16,558–569.
Lukacs, C. M., Kucara, R., Schildkraut, I. & Aggarwal, A. K. (2000).Nature Struct. Biol. 7, 134–140.
McCoy, A. J., Grosse-Kunstleve, R. W., Adams, P. D., Winn, M. D.,Storoni, L. C. & Read, R. J. (2007). J. Appl. Cryst. 40, 658–674.
Murshudov, G. N., Skubak, P., Lebedev, A. A., Pannu, N. S., Steiner,R. A., Nicholls, R. A., Winn, M. D., Long, F. & Vagin, A. A. (2011).Acta Cryst. D67, 355–367.
Nakamura, T., Zhao, Y., Yamagata, Y., Hua, Y.-J. & Yang, W. (2012).Nature (London), 487, 196–201.
Otwinowski, Z. & Minor, W. (1997). Methods Enzymol. 276, 307–326.
Pingoud, A., Fuxreiter, M., Pingoud, V. & Wende, W. (2005). Cell.Mol. Life Sci. 62, 685–707.
Pingoud, V., Wende, W., Friedhoff, P., Reuter, M., Alves, J., Jeltsch, A.,Mones, L., Fuxreiter, M. & Pingoud, A. (2009). J. Mol. Biol. 393,140–160.
Pingoud, A., Wilson, G. G. & Wende, W. (2014). Nucleic Acids Res. 42,7489–7527.
Prasannan, C. B., Xie, F. & Dupureur, C. M. (2010). J. Biol. Inorg.Chem. 15, 533–545.
Robert, R. J., Vincze, T., Posfai, J. & Macelis, D. (2010). Nucleic AcidsRes. 38, D234–D236.
Tang, D., Ando, S., Takasaki, Y. & Tadano, J. (2000). Protein Eng. Des.Sel. 13, 283–289.
Viadiu, H. & Aggarwal, A. K. (1998). Nature Struct. Mol. Biol. 5,910–916.
Watanabe, N., Takasaki, Y., Sato, C., Ando, S. & Tanaka, I. (2009).Acta Cryst. D65, 1326–1333.
Winn, M. D. et al. (2011). Acta Cryst. D67, 235–242.Xie, F., Qureshi, S. H., Papadakos, G. A. & Dupureur, C. M. (2008).
Biochemistry, 47, 12540–12550.
research papers
Acta Cryst. (2015). D71, 256–265 Kawamura et al. � HindIII-catalyzed reaction 265


