Download - Anaerobic Digestion of Solid Wastes Needs Research to Face an Increasing Industrial Success

INTERNATIONAL JOURNAL OF CHEMICAL
REACTOR ENGINEERING
Volume 6 2008 Article A94
Anaerobic Digestion of Solid Wastes NeedsResearch to Face an Increasing Industrial
Success
Pierre Buffiere∗ Liliana Delgadillo Mirquez† Jean Philippe Steyer‡
Nicolas Bernet∗∗ Jean Philippe Delgenes††
∗Institut national des sciences appliquees de Lyon, [email protected]†Universidad de Ibague, liliana del [email protected]‡Institut national de la recherche agronomique, [email protected]∗∗Institut national de la recherche agronomique, [email protected]††Institut national de la recherche agronomique, [email protected]
ISSN 1542-6580
Brought to you by | National Chung-Hsing UniversityAuthenticated | 140.120.135.222
Download Date | 3/20/14 11:59 PM

Anaerobic Digestion of Solid Wastes Needs Researchto Face an Increasing Industrial Success∗
Pierre Buffiere, Liliana Delgadillo Mirquez, Jean Philippe Steyer, NicolasBernet, and Jean Philippe Delgenes
Abstract
Anaerobic digestion of solid wastes is an emerging solution for both wastemanagement and energy production. The high complexity of the process is mostlyattributed to the absence of descriptors for the design and the prediction of sucha process. This paper presents an approach for the description of organic mat-ter based on several biochemical parameters, established on 22 different organicwastes. The lignocellulosic content is the most important parameter for the pre-diction of anaerobic biodegradability and methane production; in addition, theknowledge of the carbohydrate, lipid and protein contents is also crucial andmakes possible a prediction of the intrinsic kinetics of the reaction.
KEYWORDS: anaerobic digestion, solid waste, biodegradability, biochemicalcomposition, kinetics, modelling
∗The authors would like to thank the French Agency for Environment and Energy (ADEME)for funding this work, and the EU ALFA LaBioProc project for permitting Liliana Delgadilloto complete her MSc thesis at INRA-LBE. The authors are also most thankful to D. Batstone(Univ. of Queensland, Australia) for his valuable comments and to Dr. C. Rosen and U. Jeppsson(Department of Industrial Electrical Engineering and Automation, Lund University, Sweden) forproviding their Matlab implementation of ADM1.
Brought to you by | National Chung-Hsing UniversityAuthenticated | 140.120.135.222
Download Date | 3/20/14 11:59 PM

1. INTRODUCTION
In Europe, anaerobic digestion is emerging spectacularly. Indeed, this process is a real alternate solution to landfilling or incineration. The amount of waste treated has continuously increased at a 25% annual growth rate over the last ten years. Nevertheless, increasing needs in terms of research are required to face this emerging industrial success. Anaerobic digestion of solid wastes is a process for which the scientific community still requires tools for an accurate evaluation of performance: process design is generally done by rule-of-thumb, according to criteria that cannot be extrapolated. For instance, the reaction yield is not clearly defined yet for anaerobic digestion of solids. Consequently, the operation of existing plants is particularly difficult due to the lack of accurate indicators. This could have a serious impact on the unit performance, and, to a greater extent, on the credibility of this treatment solution (De Baere, 2006).
The main reason for that is the extreme complexity of the process: on the one hand, anaerobic digestion is a combination of many biological reactions; on the other hand, solid wastes are very heterogeneous in composition, size, shape, which makes the development of appropriate descriptors difficult. In addition, reactors for solid waste digestion are very large units (usually more than 1000 m3) working under a very high solid loading (the term “dry digestion” is used for some of the reactors for which the reaction medium does not flow) and under uncontrolled mixing conditions.
The most common indicator of digester performance is the amount of methane produced per mass unit of solid or volatile solid VS (Rintala and Järvinen, 1996). The methane potential of various types of wastes is expressed with this criterion (Owens and Chynoweth, 1993; Chynoweth et al., 1993; Gunaseelan, 2004; Jokela et al., 2005). This description is often sufficient to compare the digestibility of waste having the same nature, or different reactor designs with a given waste (Marique et al., 1989). Nevertheless, the description of organic matter degradation by the VS content alone is limited. As pointed out by Mata-Alvarez et al. (2000), there is a need for a better understanding of the degradation kinetics in relation to the biochemical composition. In addition, methane productivity not only depends on the amount of degraded volatile solids, but also on the nature of the solid: carbohydrates, proteins or fats have different methane potential. Consequently, the biochemical composition of the input is very important for anaerobic digestion (Christ et al., 2000; Sanders, 2001). Moreover, the chemical nature of individual components matters: considering the degradation of carbohydrates, it is well known that cellulose is much more difficult to degrade than sugar monomers (Noike et al., 1985, Scherer et al., 1990, Scherer et al., 2000). The fibre content is thus a relevant parameter for solid waste degradation. The reference work by Chandler et al. (1980) showed that the overall
1Buffiere et al.: Anaerobic Digestion of Solid Waste
Brought to you by | National Chung-Hsing UniversityAuthenticated | 140.120.135.222
Download Date | 3/20/14 11:59 PM
anaerobic biodegradability was directly proportional to the fibre content. The degradation of organic matter exhibits a negative relation to the lignin amount during aerobic composting (Komilis and Ham, 2003) or anaerobic treatment (Pareek et al., 1998; Hartmann et al., 2000), even in landfill conditions (Eleazer et al., 1997). Nevertheless, Tong et al. (1990) could not derive any relationship between the sole lignin content and the methane productivity of herbaceous and woody biomass. Therefore, the biochemical composition, both in terms of protein, carbohydrate and fat content, and in terms of soluble/fibre content could be seen as the appropriate option for anaerobic digestion (Peres et al., 1992). Attempts for establishing a unified typology of solids with regards to their properties are reported by Hansen et al. (2003) and more recently by Gunaseelan (2007); several relations based on multilinear regression have been proposed, but none could cover the whole range of solids tested.
The present paper summarises 3 years of experimental investigations over a wide range of mixed municipal, industrial and kitchen wastes, including systematic composition measurements and anaerobic batch degradation tests. We propose a typology of the solid wastes based composition criteria. We will see how this description can be used to establish a correlation between the composition and the ultimate methane potential of (almost) any kind of organic wastes. This approach is also used to define an actual reaction yield in order to characterise the performance of a given reactor (Buffière et al., 2006). We propose a dynamic modelling of the anaerobic degradation of the solid waste: we will see if the typology used remains relevant for the prediction of the reaction kinetics by means of generic or specific simulation tools, such as the IWA anaerobic digestion model N°1 (Batstone et al., 2002).
2. MATERIALS AND METHODS
The samples tested are food and kitchen wastes that have been collected, grouped by category and stored at –20°C: fruit (apple, banana, citrus), and vegetable (potatoes, carrots, lettuce) peelings; grass, cooked rice and pasta, bread, fish, meat, coffee waste, office paper and cardboard. Industrial (rabbit slaughterhouse) and municipal wastes (5 prior and 1 after digestion) were also tested. A total of 22 samples were thus characterised.
2.1 Organic matter characterisation and anaerobic biodegradability assessment
The samples were characterised according to the following parameters: total (TS) and volatile solids (VS), fibre content, total chemical oxygen demand (COD), total nitrogen (TKN), proteins, lipids and total carbohydrates. Total and volatile
2 International Journal of Chemical Reactor Engineering Vol. 6 [2008], Article A94
Brought to you by | National Chung-Hsing UniversityAuthenticated | 140.120.135.222
Download Date | 3/20/14 11:59 PM

solids measurements were performed on fresh products. The other parameters were measured on freeze-dried samples milled and sieved with a 1 mm grid. The fibre content was determined according to Van Soest and Wine (1967). Proteins were measured according to the Lowry method (Lowry et al., 1961), and total sugars are measured with the anthrone reduction method (Clegg, 1956). Lipids are extracted with the conventional Soxhlet method with petroleum ether (40-60°C). The biochemical methane potential (BMP) assays are derived from Owens and Chynoweth (1993) and from Angelidaki and Sanders (2004). We use 7 thermophilic (55°C) reactors with an active volume of 3.5 litres each, filled with synthetic growth medium containing nutrients and trace elements, and inoculated with anaerobic thermophilic sludge coming from a stock reactor. Biomass concentration in the tests is comprised between 2 and 4 gVS/L, and the substrate to inoculum ratio is 0.5 on VS basis. The gas production is measured with an electronic volumetric gas counter (based on water displacement) and periodically analysed for composition by gas chromatography. A blank (biomass alone) and a positive standard (biomass + cellulose) were done for each run to correct for endogenous methane production. The only difference with commonly used BMP assays is that waste addition is repeated three times in the same reactor (instead of 3 triplicates in parallel) to account for the adaptation of the sludge to the organic waste. In some of the experiments (last substrate addition), liquid samples were taken and analysed for soluble degradation products (COD, volatile fatty acids). Sludge adaptation has a slight influence on the total methane produced, but has a strong influence on the response curve and on the dynamics, which is important for kinetic data assessment. Indeed, we found that two reactors running in parallel with cellulose gave BMP values of 346.6±6 and 344.3±10 mLCH4/gcellulose respectively on 3 successive substrate addition. The BMP, is expressed as mlCH4(STP)/gVS. Knowing the COD/VS ratio, it is possible to estimate the overall biodegradability, since the methane/COD yield is constant (350 mlCH4(STP)/gCOD). The biodegradability BD is thus defined as the ratio between the methane produced and the maximal amount that would have been obtained if all the COD were converted to methane (equation 1).
)/(350
)/(mlCH STP4,
gVSgCODxCOD
gVSBMPBD
waste= (1)
3Buffiere et al.: Anaerobic Digestion of Solid Waste
Brought to you by | National Chung-Hsing UniversityAuthenticated | 140.120.135.222
Download Date | 3/20/14 11:59 PM

Figure 1: Conversion process in anaerobic digestion as used in the model ADM1 (from Batstone et al., 2002).
2.2 ADM1 modelling
Mathematical modelling of anaerobic digestion processes has been extensively investigated and developed during the last 3 decades. One of the most sophisticated, advanced but also complex model is the IWA Anaerobic Digestion Model No. 1 (ADM1) published by the IWA Task Group for Mathematical Modelling of Anaerobic Digestion Processes in 2002 (Batstone et al., 2002). ADM1 is a structured model with disintegration and hydrolysis, acidogenesis, acetogenesis, and methanogenesis steps. An overview of the model structure is shown in Figure 1. Extracellular solubilisation steps are divided into disintegration and hydrolysis, of which the first converts composite particulate substrate to inert matter, particulate carbohydrates, proteins and lipids. The second is enzymatic hydrolysis converting particulate carbohydrates, proteins and lipids to monosaccharides, amino acids and long chain fatty acids (LCFA) respectively. Disintegration is mainly included to describe degradation of composite particulate material with lumped characteristics, while the hydrolysis steps were introduced to describe well defined, relatively pure substrates (such as cellulose, starch and protein feeds). All disintegration and hydrolysis processes are represented by first order kinetics. Two separate groups of acidogens degrade monosaccharides and amino acids to mixed organic acids, hydrogen and carbon dioxide. The organic
4 International Journal of Chemical Reactor Engineering Vol. 6 [2008], Article A94
Brought to you by | National Chung-Hsing UniversityAuthenticated | 140.120.135.222
Download Date | 3/20/14 11:59 PM

acids are subsequently converted to acetate, hydrogen and carbon dioxide by acetogenic groups that utilise LCFA, butyrate and valerate (one group for the two substrates), and propionate. The hydrogen produced by these organisms is consumed by a hydrogenotrophic methanogenic group, and the acetate by an acetotrophic methanogenic group. Substrate uptake Monod-type kinetics are used for all biochemical reactions. Death of biomass is represented by first order kinetics, and dead biomass is maintained in the system as composite particulate material. Inhibition functions include pH (all groups), hydrogen (acetogenic groups) and free ammonia (acetotrophic methanogens). pH inhibition is implemented as empirical equations, while hydrogen and free ammonia inhibition are represented by non-competitive functions. Mechanisms included to describe physicochemical processes are acid-base reactions (to calculate hydrogen ion, free ammonia, and carbon-dioxide concentrations), and liquid-gas transfer. As a differential and algebraic equation (DAE) set, there are 26 dynamic state variables, 19 biochemical kinetic processes, 3 gas-liquid transfer kinetic processes and 8 implicit algebraic variables. As a differential equation (DE) set, there are 32 dynamic state concentration variables and additional 6 acid-base kinetic processes.
3. RESULTS AND DISCUSSION
3.1 Waste composition
The most important composition parameters that we analysed are listed in Table 1. The first interesting issue is the relatively wide variation of the COD/VS ratio (between 1.19 for rice and 1.53 for fish). This is mostly due to the difference in composition, since carbohydrates, proteins and lipids have different energetic values. As can be seen from the data, it is quite difficult to get an accurate distribution of organic matter between the compartments. Only the fibre content (gravimetric method) leads to 100% closure. In the table, we give the hemicellulose (HEMI) and ADF (cellulose + lignin) fractions, the rest (1-HEMI-ADF) being the neutral detergent soluble part, which regroups water soluble matter and some of the organic content of the cells. The “lignin” fraction is the part of organic matter that is not solubilised by a strong acid (H2SO4 72%); one should note that for composite waste, this fraction also includes recalcitrant organics such as plastics. The neutral detergent soluble fraction (NDF) cannot be analysed since the extraction protocol is destructive. This is the reason why direct measurements of proteins, fats and sugars were done. Nevertheless, the total carbohydrate content can’t be measured by the method used (see for instance the unexpected low values for rice and pasta), and the data presented for the distribution have to be considered carefully. Our present objective is to refine the
5Buffiere et al.: Anaerobic Digestion of Solid Waste
Brought to you by | National Chung-Hsing UniversityAuthenticated | 140.120.135.222
Download Date | 3/20/14 11:59 PM
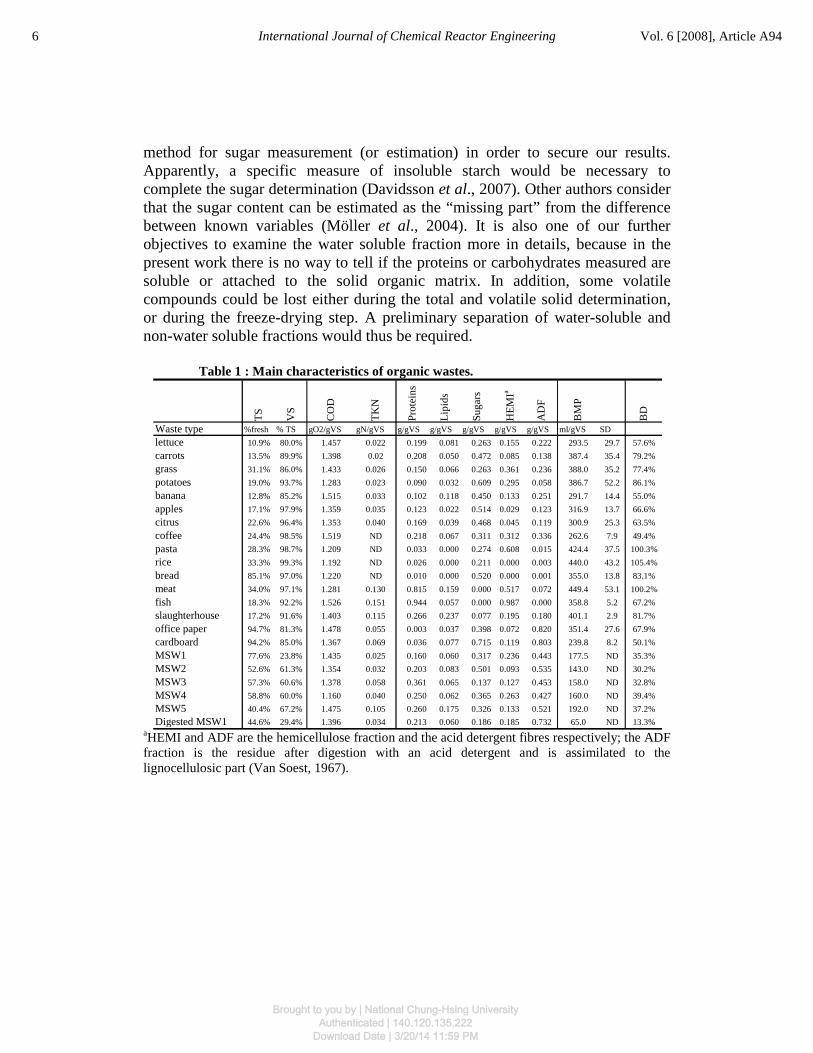
method for sugar measurement (or estimation) in order to secure our results. Apparently, a specific measure of insoluble starch would be necessary to complete the sugar determination (Davidsson et al., 2007). Other authors consider that the sugar content can be estimated as the “missing part” from the difference between known variables (Möller et al., 2004). It is also one of our further objectives to examine the water soluble fraction more in details, because in the present work there is no way to tell if the proteins or carbohydrates measured are soluble or attached to the solid organic matrix. In addition, some volatile compounds could be lost either during the total and volatile solid determination, or during the freeze-drying step. A preliminary separation of water-soluble and non-water soluble fractions would thus be required.
Table 1 : Main characteristics of organic wastes.
aHEMI and ADF are the hemicellulose fraction and the acid detergent fibres respectively; the ADF fraction is the residue after digestion with an acid detergent and is assimilated to the lignocellulosic part (Van Soest, 1967).
TS
VS
CO
D
TK
N
Pro
tein
s
Lip
ids
Su
gar
s
HE
MIa
AD
F
BM
P
BD
Waste type %fresh % TS gO2/gVS gN/gVS g/gVS g/gVS g/gVS g/gVS g/gVS ml/gVS SD
lettuce 10.9% 80.0% 1.457 0.022 0.199 0.081 0.263 0.155 0.222 293.5 29.7 57.6%
carrots 13.5% 89.9% 1.398 0.02 0.208 0.050 0.472 0.085 0.138 387.4 35.4 79.2%
grass 31.1% 86.0% 1.433 0.026 0.150 0.066 0.263 0.361 0.236 388.0 35.2 77.4%
potatoes 19.0% 93.7% 1.283 0.023 0.090 0.032 0.609 0.295 0.058 386.7 52.2 86.1%
banana 12.8% 85.2% 1.515 0.033 0.102 0.118 0.450 0.133 0.251 291.7 14.4 55.0%
apples 17.1% 97.9% 1.359 0.035 0.123 0.022 0.514 0.029 0.123 316.9 13.7 66.6%
citrus 22.6% 96.4% 1.353 0.040 0.169 0.039 0.468 0.045 0.119 300.9 25.3 63.5%
coffee 24.4% 98.5% 1.519 ND 0.218 0.067 0.311 0.312 0.336 262.6 7.9 49.4%
pasta 28.3% 98.7% 1.209 ND 0.033 0.000 0.274 0.608 0.015 424.4 37.5 100.3%
rice 33.3% 99.3% 1.192 ND 0.026 0.000 0.211 0.000 0.003 440.0 43.2 105.4%
bread 85.1% 97.0% 1.220 ND 0.010 0.000 0.520 0.000 0.001 355.0 13.8 83.1%
meat 34.0% 97.1% 1.281 0.130 0.815 0.159 0.000 0.517 0.072 449.4 53.1 100.2%
fish 18.3% 92.2% 1.526 0.151 0.944 0.057 0.000 0.987 0.000 358.8 5.2 67.2%
slaughterhouse 17.2% 91.6% 1.403 0.115 0.266 0.237 0.077 0.195 0.180 401.1 2.9 81.7%
office paper 94.7% 81.3% 1.478 0.055 0.003 0.037 0.398 0.072 0.820 351.4 27.6 67.9%
cardboard 94.2% 85.0% 1.367 0.069 0.036 0.077 0.715 0.119 0.803 239.8 8.2 50.1%
MSW1 77.6% 23.8% 1.435 0.025 0.160 0.060 0.317 0.236 0.443 177.5 ND 35.3%
MSW2 52.6% 61.3% 1.354 0.032 0.203 0.083 0.501 0.093 0.535 143.0 ND 30.2%
MSW3 57.3% 60.6% 1.378 0.058 0.361 0.065 0.137 0.127 0.453 158.0 ND 32.8%
MSW4 58.8% 60.0% 1.160 0.040 0.250 0.062 0.365 0.263 0.427 160.0 ND 39.4%
MSW5 40.4% 67.2% 1.475 0.105 0.260 0.175 0.326 0.133 0.521 192.0 ND 37.2%
Digested MSW1 44.6% 29.4% 1.396 0.034 0.213 0.060 0.186 0.185 0.732 65.0 ND 13.3%
6 International Journal of Chemical Reactor Engineering Vol. 6 [2008], Article A94
Brought to you by | National Chung-Hsing UniversityAuthenticated | 140.120.135.222
Download Date | 3/20/14 11:59 PM

Figure 2: Influence of ADF (Cellulose + Lignin) fraction on anaerobic biodegradability BD.
3.2 Composition and anaerobic biodegradability
The prediction of anaerobic biodegradability is a big issue when dealing with anaerobic digestion of organic wastes. At this stage, our results indicate a strong influence of the ADF content, as can be seen in Figure 2. The linear regression (in dashed line) gives the following estimation for biodegradability:
BD=0.87-1.06ADF (2)
The relationship for this regression is quite poor (r2 = 0.66). Still, it is interesting to note the relatively good fit of this model with data obtained by other workers on other kind of wastes (pig manure for Möller et al., 2004, sisal pulp for Mshandete et al., 2005). The model of Chandler et al. (1980) only considers the lignin fraction L to predict biodegradability (BD=0.83 – 2.82L), and could not be of any help for our data at lignin amounts higher than 12% due to a systematic underestimation of BD. In addition, the experimental method for measuring BDused by Chandler was questionable compared to BMP standard protocols now in use. The recent work by Gunasseelan (2007) could not be compared to the present one: though this author has compiled more than 20 kinds of fruits and vegetable waste, including their biochemical composition and BMP, the COD equivalence is missing, making it impossible to calculate the biodegradability of the waste tested. This is probably one of the reasons why these authors could not derive a unified predictive model, because depending on the nature of the waste, the COD/VS ratio varies and, as a consequence, the same amount of VS converted does not give the same amount of methane. At this point, it is clear that the
0%
25%
50%
75%
100%
0% 25% 50% 75% 100%
ADF (% VS)
Ana
erob
ic b
iode
grad
abili
tyOrganic waste
MSW
MSW (digested)
Moller et al., 2004
Mshandete et al., 2005
linear regression
7Buffiere et al.: Anaerobic Digestion of Solid Waste
Brought to you by | National Chung-Hsing UniversityAuthenticated | 140.120.135.222
Download Date | 3/20/14 11:59 PM

elaboration of a consistent model is necessary, that would take into account not only the ADF fraction, but also other components. The limitation of this approach, as already mentioned, is the lack of information concerning the soluble part of the organic matter, and more particularly the soluble non-biodegradable organic matter (such as humic acids). More generally, the outcome of this approach is that today, we are about to propose a unified representation of organic matter composition in a way that could, i), be used as a predicting tool for methane production from almost any kind of organic waste, and ii) be compatible with a generalised dynamic model such as ADM1.
Table 2: Disintegration yields of complex particulate. ƒƒƒproduct, substrate (kgCOD products/kg COD substrate)
Parameters Cellulose Potato Coffee Pasta Rice ADM1std
ƒƒƒXi, Xc Particulate inert from composites 0.05 0.10 0.10 0.05 0.05 0.25 ƒƒƒSi, Xc Soluble inert from composites 0.05 0.10 0.09 0.05 0.05 0.10 ƒƒƒch, Xc Carbohydrates from composites 0.90 0.67 0.38 0.70 0.70 0.20 ƒƒƒpr, Xc Proteins from composites 0.00 0.10 0.25 0.15 0.15 0.20 ƒƒƒli, Xc Lipids from composites 0.00 0.03 0.18 0.05 0.05 0.25
3.3 Modelling
The data obtained on batch experiments for 5 different wastes (cellulose, potato, coffee, paste and rice) were used to tune the ADM1 model with special emphasis on the disintegration and hydrolysis steps. Indeed, in ADM1, the complex composite (Xc) is broken during the extracellular disintegration step into carbohydrates (ƒch, Xc), lipids (ƒli, Xc) and proteins (ƒpr, Xc). This division is represented by stoichiometric coefficients (see figure 3). We decided to estimate these coefficients (Table 2) from the biochemical composition of each waste that was experimentally determined and previously presented in Table 1, though some adjustments were required. For the other biochemical steps of ADM1, the parameters were slightly modified by trial and error from the standard value recommended in the ADM1 model (see Table 3). Comparison between experimental results and simulation of ADM1 is presented in Figure 4 for individual volatile fatty acids (VFA) and CH4 content in the gas phase. One can notice that the model is remarkably able to reproduce the experimental data. Further study is presently done to investigate other wastes and to use the model for designing optimal configuration and operation of solid waste processes.
8 International Journal of Chemical Reactor Engineering Vol. 6 [2008], Article A94
Brought to you by | National Chung-Hsing UniversityAuthenticated | 140.120.135.222
Download Date | 3/20/14 11:59 PM

Figure 3: Disintegration fraction from composite in ADM1.
Table 3: Kinetic parameters used in the ADM1 model for different wastes Cellulose Potato Coffee Pasta Rice AMD1std
Ysu 0.19 0.10 0.10 0.10 0.10 0.10 Yaa 0.08 0.08 0.08 0.08 0.08 0.08 Yfa 0.06 0.06 0.06 0.06 0.06 0.06 Yac 0.01 0.01 0.08 0.2 0.01 0.05 Ypro 1 1 0.1 0.8 0.05 0.05 Yc4 0.0001 0.06 0.5 0.1 0.06 0.06 Yh2 0.06 0.06 0.06 0.06 0.06 0.06 km su 70 70 70 70 20 70 km aa 70 70 70 70 70 70 km fa 10 10 10 10 10 10 km ac 25 20 16 1 21 16 km pro 20 11 15 1 11 20 km c4 30 30 30 1 30 30 km h2 35 35 35 35 35 35 Ks su 3.9 3 2.8 0.5 1.0 1 Ks aa 0.3 0.3 0.3 0.3 0.3 0.3 Ks fa 0.4 0.4 0.4 0.4 0.4 0.4 Ks ac 1 1.2 4.6 0.6 2.6 0.3 Ks pro 2 1 1.8 0.05 0.8 0.3 Ks c4 2 0.4 1 0.4 0.4 0.4 Ks h2 5x10⁻⁵ 5x10⁻⁵ 5x10⁻⁵ 5x10⁻⁵ 5x10⁻⁵ 5x10⁻⁵
Ysubstrate : yield biomass on substrate (kg CODbiomass/ kg CODsubstrate); km process : Monod maximum specific uptake rate (µmax/Y) (kg CODsubstrate/ kg CODbiomas . d); Ks process : Half saturation half (kg CODsubstrate/ m
3).
Lipids
9Buffiere et al.: Anaerobic Digestion of Solid Waste
Brought to you by | National Chung-Hsing UniversityAuthenticated | 140.120.135.222
Download Date | 3/20/14 11:59 PM

Figure 4: Experimental vs. ADM1 modelling different wastes. Figure 4: Experimental vs. ADM1 modelling of time course of VFA and methane for of time course of VFA and methane for
10 International Journal of Chemical Reactor Engineering Vol. 6 [2008], Article A94
Brought to you by | National Chung-Hsing UniversityAuthenticated | 140.120.135.222
Download Date | 3/20/14 11:59 PM

4. CONCLUSION
Within the main objective of better understanding the anaerobic digestion of solid waste, the specific issue of this work is to promote the importance of an adequate description of complex organic matter that could be used for reactor design, operation and control. The typology proposed for organic matter characterisation is based on fibre determination, coupled with other biochemical data (such as fats, proteins and sugars). The first results obtained indicate that this approach is necessary for the prediction of methane production, and the assessment of a unified model seems close now. In addition, this description of the organic matter seems compatible with the ADM1 model. With respect to the large number of questions on anaerobic digestion of solid wastes, this work has made possible to describe and to predict the intrinsic kinetics of the reaction. Nevertheless, it is only a first step in the understanding of the whole process. The research perspectives associated to this work will be focused on a better description of the solids in terms of size and shape, and on the reaction medium in terms of mixing and mass transfer conditions.
5. REFERENCES
Angelidaki, I. and Sanders, W. Assessment of the anaerobic biodegradability of macropollutants. Reviews in Environmental Science and Biotechnology, (2004), 3, 117-129.
Batstone, D.J., Keller, J., Angelidaki, I., Kalyuzhnyi, S., Pavlostathis, S.G., Rozzi, A., Sanders, W., Siegriest, H. and Vavilin, V.A. Anaerobic Digestion Model No. 1 (ADM1), IWA Task Group for Mathematical Modelling of Anaerobic Digestion Processes, (2002), IWA Publishing, London.
Buffière, P., Loisel, D., Bernet, N. and Delgenes, J.P. Towards new indicators for the prediction of solid waste anaerobic digestion properties. Water Science and Technology. (2006), 53 (8), 233-241.
Chandler, J.A., Jewell, W.J., Gossett, J.M., Van Soest, P.J. and Robertson, J.B. Predicting methane fermentation biodegradability. Biotechnology and Bioengineering Symposium Series, (1980), 10, 93-107.
Christ, O., Wilderer, P.A., Angerhöfer, R. and Faulstich, M. Mathematical modelling of the hydrolysis of anaerobic processes. Water Science and Technology, (2000), 41 (3), 61-65.
Chynoweth, D.P., Turick, C.E., Owens, J.M., Jerger, D.E. and Peck, M.W. Biochemical methane potential of biomass and waste feedstocks. Biomass and Bioenergy, (1993), 5 (1), 95-111.
Clegg, K.M. The application of the anthrone reagent to the estimation of starch in cereals. J. Sci. Food Agric, (1956), 7 (January), 40-44.
11Buffiere et al.: Anaerobic Digestion of Solid Waste
Brought to you by | National Chung-Hsing UniversityAuthenticated | 140.120.135.222
Download Date | 3/20/14 11:59 PM

Davidsson, A., Gruvberger, C., Christensen, T.H., Hansen, T.L. and Jansen, J. Methane yield in source-sorted organic fraction of municipal solid waste. Waste Management. (2007), 27, 406-414.
De Baere, L. Will anaerobic digestion of solid waste survive in the future? Water Science and Technology, (2006), 53 (8), 187-194.
Eleazer, W.E., Odle, W.S., Wang, Y.S. and Barlaz, M.A. Biodegradability of municipal solid waste components in laboratory-scale landfills. Environmental Science and Technology, (1997), 31, 911-917.
Gunaseelan, V.N. Biochemical methane potential of fruits and vegetable solid waste feedstocks. Biomass and Bioenergy, (2004), 26 (4), 389-399.
Gunaseelan, V.N. Regression models of ultimate methane yields of fruit and vegetable solid wastes, sorghum and napiergrass on chemical composition. Bioresource Technology, (2007), 98, 1270-1277.
Hansen, T.L., Svärd, A., Angelidaki, I., Schmidt, J.E., Jansen, J. and Christensen, T.H. Chemical characteristics and methane potentials of source separated and pre treated organic municipal solid waste. Water Science and Technology, (2003), 48 (4), 205-208.
Hartmann, H., Angelidaki, I. and Ahring, B.K. Increase of anaerobic degradation of particulate organic matter in full-scale biogas plant by mechanical maceration. Water Science and Technology, (2000), 41 (3), 145-153.
Jokela, J., Vavilin, V.A. and Rintala, J.. Hydrolysis rates, methane production and nitrogen solubilisation of grey waste components during anaerobic biodegradation. Bioresource Technology, (2005), 96, 501-508.
Komilis, D.P. and Ham, R.K. The effect of lignin and sugars to the aerobic decomposition of solid wastes. Waste Management, (2003), 23, 419-423.
Lowry, O.H., Rosebrough, N.J., Farr, L. and Randall, R. J. Protein measurement with the Folin Phenol reagent. Journal of Biological Chemistry, (1961), 193 (1), 265-275.
Marique, P., Gilles, A., Edeline, F. and Joassin, L. Thermophilic semisolid anaerobic digestion of municipal refuses. Biotechnology and Bioengineering, (1989), 33, 536-541.
Mata-Alvarez, J., Mace, S. and Llabres, P. Anaerobic digestion of organic solid wastes. An overview of research achievements and perspectives. Bioresource Technology, (2000), 74 (1), 3-16.
Moller, H.B., Sommer, S.G. and Ahring, B.K.. Methane productivity of manure, straw and solid fractions of manure. Biomass and Bioenergy. 26, (2004), 485-495.
Mshandete, A., Bjornsson, L., Kivaisi, A.K., Rubindamayugi, S.T. and Mattiasson, B.. Enhancement of anaerobic batch digestion of sisal pulp waste by mesophilic aerobic pre-treatment. Water Research, (2005), 39, 1569-1575.
12 International Journal of Chemical Reactor Engineering Vol. 6 [2008], Article A94
Brought to you by | National Chung-Hsing UniversityAuthenticated | 140.120.135.222
Download Date | 3/20/14 11:59 PM
Noike, T., Endo, G., Chang, J.E., Yaguchi, J.I. and Matsumoto, J.I. Characteristics of carbohydrate degradation and the rate limiting step in anaerobic digestion. Biotechnology and Bioengineering. (1985), 27, 1482-1485.
Owens, J.M. and Chynoweth, D. Biochemical methane potential of MSW components. Water Science and Technology, (1993), 27 (2), 1-14.
Pareek, S., Kim, S.K., Matsui, S. and Shimizu, Y. Hydrolysis of (ligno)cellulosic materials under sulfidogenic and methanogenic conditions. Water Science and Technology, (1998), 38 (2), 193-200.
Peres, C.S., Sanchez, C.R., Matumoto, C. and Schmidell, W. Anaerobic biodegradability of the organic components of municipal solid wastes (OFMSW). Water Science and Technology, (1992), 25 (7), 285-293.
Rintala, J. and Järvinen, K. Full scale mesophilic co-digestion of municipal solid waste and sewage sludge: methane production characteristics. Waste Management and Research, (1996), 14 (2), 163-170.
Sanders, W. Anaerobic hydrolysis during digestion of complex substrates. (2001), PhD Thesis, Wageningen University (NL), 101p.
Scherer, P.A., Schultz, K.U. and Meyer-Pittrof, R. Comparison of methods to characterize the degradation rate of organic matter during solid state fermentation. DECHEMA Biotechnology Conferences, Behrens, (1990), 661-665.
Scherer, P.A., Vollmer, G.R., Fakhouri, T. and Martensen, S. Development of a methanogenic process to degrade exhaustively the organic fraction of municipal grey waste under thermophilic and hyperthermophilic conditions. Water Science and Technology, (2000), 41 (3), 83-91.
Tong, X., Smith, L.H. and McCarthy, P.L. Methane fermentation of selected lignocellulosic materials. Biomass, (1990), 21, 239-255.
Van Soest, P.J. and Wine, R.H. Use of detergent in the analysis of fibrous feeds IV. Determination of plant cell wall constituents. J. Asso. Anal. Chem. (1967), 50 (1), 50-55.
13Buffiere et al.: Anaerobic Digestion of Solid Waste
Brought to you by | National Chung-Hsing UniversityAuthenticated | 140.120.135.222
Download Date | 3/20/14 11:59 PM


