
AN IN VITRO BATCH RELEASE DISSOLUTION TEST FOR THE EVALUATION
OF CONTROLLED RELEASE DRUGS
by
JARROD WRENFRO COLLIER
(Under the Direction of Anthony Capomacchia, Ph.D.)
ABSTRACT
The means by which a drug is introduced into the body is almost as important as the drug
itself. It is imperative that drug concentration in the blood be maintained at a level that
provides maximum therapeutic benefit for all day formulations. This is a function of
dissolution rate and formulation system. Controlled release delivery systems fall into
these categories: transdermal, intravenous, and oral. This type of system is a focus for
regulatory agencies in determining how best to assure drug quality and performance.
Dissolution testing for controlled release formulations is the subject of this research.
INDEX WORDS: Controlled release drugs, Theophylline, Flow-Through Cell, Dissolution

AN IN VITRO BATCH RELEASE DISSOLUTION TEST FOR THE EVALUATION
OF CONTROLLED RELEASE DRUGS
by
JARROD WRENFRO COLLIER
B.S., Fort Valley State University, 2001
A Thesis Submitted to the Graduate Faculty of The University of Georgia in Partial
Fulfillment of the Requirements for the Degree
MASTER OF SCIENCE
ATHENS, GEORGIA
2003

© 2003
Jarrod W. Collier
All Rights Reserved
AN IN VITRO BATCH RELEASE DISSOLUTION TEST FOR THE EVALUATION
OF CONTROLLED RELEASE DRUGS
by
JARROD WRENFRO COLLIER
Major Professor: Anthony Capomacchia
Committee: James Price Robert Lu
Electronic Version Approved: Maureen Grasso Dean of the Graduate School The University of Georgia August 2003

iv
DEDICATION
I dedicate this manuscript to my wonderful, beloved mother, Senesta Collier. In
all my efforts to strive to be the best I can be, my mother shared fully my ambition and
sympathized with me and aided me in every way she possibly could. If I have done
anything in life worth attention, I feel sure that I inherited the disposition from my
mother. Thank you for your everlasting guiding light and vision that has been instilled in
me. I love you.

v
ACKNOWLEDGEMENTS
I would first and foremost like to thank my creator, God. For He helped me to realize my
intellectual level and persistence in all of my spiritual and academic endeavors.
I would like to thank my major professor, Dr. Anthony Capomacchia, for all of
his assistance and support in my strive for academic excellence. I also thank Dr. James
Price and Dr. Robert Lu for their assistance in serving on my committee. A special thanks
goes to Saundra Granade for her immense support and guidance in my research. I thank
my brother-in-law, Dr. Jacob Battle, for his generosity in supplying me with important
materials for my research, in which could not be conducted without his help.
I would also like to thank all the members of Greater Bethel A.M.E. Church who
gave me spiritual guidance and encouragement. Last, but not least, I also thank my
“Support Group” in graduate school that helped to motivate me throughout my graduate
school experience.

vi
TABLE OF CONTENTS
Page
ACKNOWLEDGEMENTS.................................................................................................v
INTRODUCTION ...............................................................................................................1
DISSOLUTION: Theory, Practice and Problems................................................................4
LITERATURE REVIEW ....................................................................................................9
MATERIALS AND METHODS.......................................................................................23
RESULTS AND DISCUSSION........................................................................................28
CONCLUSIONS................................................................................................................50
REFERENCES ..................................................................................................................52
APPENDIX........................................................................................................................56

1
INTRODUCTION
The means by which a drug is introduced into the body is almost as important as
the drug itself. It is imperative that drug concentration in the blood be maintained at a
level that provides maximum therapeutic benefit for all day formulations. This is a
function of dissolution rate and formulation system. Controlled release delivery systems
fall into these categories: transdermal, intravenous, and oral. This type of system is a
focus for regulatory agencies in determining how best to assure drug quality and
performance. Dissolution testing for controlled release formulations is the subject of this
research.
More complicated controlled release drugs are being developed as formulation
technology evolves; which complicates the ability of the pharmaceutical industry to
evaluate drug product dissolution batches in a timely and consistent manner. Existing
dissolution evaluation procedures are often not adequate to fully characterize the
properties that determine formulation effectiveness. Current United States Pharmacopeia
(USP) dissolution test methods may give a dissolution profile of the drug formulation
product but for controlled release products they are lengthy procedures and, as a result,
do not lend themselves to continuous evaluation of drug formulation and manufacturing
problems on the production line (17).
As the manufacturing process becomes more complex, timely methods for
dissolution evaluation of controlled release dosage formulations need to be developed to
assist in monitoring product during manufacturing. The in-vitro test system should

2
measure significant and consistent release of the drug in a short amount of time. This
would enable a manufacturer to correlate drug units across a drug batch, as well as, units
between batches. Manufacturing deviations causing poor dissolution characteristics
would be evaluated and discovered as they occur and sources of problems determined,
thereby reducing the production cost.
Standard USP dissolution testing provides information on rate of release of the
active drug from the formulation as a function of time; however, the tests are time
consuming, have the potential for non-reproducible results, and do not take into account
liquid and encapsulated controlled release drugs. The USP dissolution test is adequate for
developing a profile for solid dosage forms, but should be modified to address controlled
release products. It is important to know how much drug is released from the formulation,
and the drug release. Many current formulations are high potency-low concentration
formulations in which the active drug is present in trace amounts (mg or µg). In some
formulations the formulation may be excipients or other controlled release devices that
could interfere with spectroscopic analysis. When this happens, the preferred method of
analysis is HPLC. All dissolution methods require precise and accurate control of
temperature, stirring configuration, dissolution media, and sample times and volumes
(28).
Operations, the production management of drug formulations at the
manufacturing site, need a rapid dissolution test that will determine the quantity of active
pharmaceutical ingredient released from the formulation. The method needs to be
performed in a limited amount of time so that the manufacturing operation can quickly be
altered if needed. The current study has been designed to develop a dissolution method

3
that can be used at manufacturing sites to ensure a consistent dissolution profile of a
controlled release product, batch to batch.
The objective of this research was to develop an accelerated dissolution method
for controlled release drugs. The variables pH, temperature, flow rate, solvent, and
surfactant addition were evaluated for this purpose. The goal was to find a method that
resulted in at least 80% release of the drug active in 3 hours or less.

4
DISSOLUTION: Theory, Practice and Problems
Dissolution is the process by which a solid enters into solution. The earliest
reference to dissolution is probably the 1897 article by Noyes and Whitney, “The Rate of
Solution of Solid Substances in Their Own Solution.” The authors suggested that the rate
of dissolution of solid substances is determined by the rate of diffusion of a very thin
layer of saturated solution that forms instantaneously around that solid particle. They
developed a mathematical relationship that correlated the dissolution rate to the
concentration gradient of the solid. Their equation is still the basic formula upon which
most of the modern mathematical treatments of the dissolution phenomenon revolve.
Noyes and Whitney’s work was centered mainly on the study of physicochemical
aspects of dissolution as applied to chemical substances. Fick’s law of diffusion was the
most important study to the Noyes and Whitney equation by Nernst and Brunner in 1904.
Soon after, more emphasis was starting to focus on the examination of the effects of
dissolution behavior of drugs on the biological activity of pharmacological dosage forms.
In 1951, Edwards performed various studies on aspirin tablets with that focus in mind. He
found that due to poor solubility, the analgesic action of aspirin tablets would be
controlled by its dissolution rate within the stomach and the intestine. Then again, no in
vivo studies were carried out to support his assumption. However, a few years later,
Edward’s hypothesis was proven valid in an in vitro/in vivo correlation by indicating a
direct relationship between the bioavailability of amphetamine from sustained-release
tablets and its in vitro dissolution rate. Other studies confirmed the significant effect of

5
the dissolution behavior of drugs on their pharmacological activities. Due to these
magnificent findings, dissolution testing began to become a governing topic within both
the pharmaceutical academia and the drug industry.
In 1960, dissolution testing became a mandatory requirement for several dosage
forms. The role of dissolution in absorption of drug products, however, still is far from
being understood perfectly. Although dissolution testing has produced impressive in
vitro/in vivo correlation studies, dissolution is not a predictor of therapeutic efficiency.
Nevertheless, it is a qualitative tool that can provide valuable information about the
biological activity of a drug as well as batch-to-batch consistency. Another problem is
that the accuracy and precision of the testing procedure is dependent on the strict
observance of many parameters and detailed operational controls. Besides the many
inadequacies, dissolution is considered as one of the most important quality-control tests
performed on pharmaceutical dosage forms.
In 1897, dissolution rate studies were done on two insoluble substances, benzoic
acid and lead chloride. The compounds were rotated in a cylinder with water at a constant
rate and sampled for analysis at specific time intervals. To examine the data
quantitatively, the Fick’s second law equation was created by Noyes and Whitney to
describe the dissolution:
dc/dt=K(cs-ct) (1) where dc/dt is the dissolution rate of the drug, K is the proportionality constant, cs is the
saturation concentration (maximum solubility), ct is the concentration at time t, and cs-ct
is the concentration gradient. K is also the dissolution constant, and the equation has been
shown to obey first-order kinetics.

6
In their experiments, Noyes and Whitney maintained a constant surface by using
sticks of the insoluble substance. However, there are some instances where the surface
area is not always constant, which is why Equation 1 was modified to incorporate the
surface area, S, as a separate variable.
dc/dt=k1S(cs-ct) (2) In 1904, Nernst proposed the film-model theory to explain the mechanism of dissolution.
Under the influence of no reactive or chemical forces, a solid particle immersed in a
liquid undergoes two consecutive steps:
1.) The solution of the sold at the interface, forming a thin stagnant layer or film,
h, around the particle. 2.) The diffusion from this layer at the boundary to the bulk of the fluid.
The first step, solution, is almost instantaneous; the second, diffusion, is much slower
and, therefore, is the rate-limiting step.
Figure 1. Diffusion-layer model (film theory)
In the same year, other factors were explored that could affect the dissolution
process. This was to determine the fundamental components of the proportionality
constant in Equation 1. A diffusion coefficient, D, was included by combining Fick’s first
law of diffusion and the newly formed film theory to expand Equation 2. The equation

7
also included the thickness of the stagnant diffusion layer, h, and the volume of the
dissolution medium, V, producing:
dc/dt=k2*Ds/Vh(cs-ct) (3) The proportionality constant, k2, is known as the intrinsic dissolution rate constant and is
characteristic of each chemical compound.
The term sink conditions comes from the fact that the drug concentration on both
sides of the epithelial layer of the intestinal wall approaches equilibrium in a short time,
and that the gastrointestinal (GI) tract acts as a natural sink. Basically, the drug is
absorbed instantaneously the moment it dissolves. Therefore, under in vivo conditions,
there is no concentration buildup and the retarding of the concentration gradient on the
dissolution rate does not occur.
To simulate the in vivo sink conditions, in vitro dissolution testing usually is
conducted using either a large volume of dissolution medium of a mechanism by which
the dissolution medium is refreshed constantly with solvent at a predetermined rate so
that the concentration of the solute never reaches more than 10 to 15% of its maximum
solubility. If these parameters are sustained then sink conditions are met, meaning there is
no influence on the concentration gradient.
Dissolution can provide valuable information about drug availability; however,
there are many factors that can cause erroneous results may be caused by testing
equipment and its environment, handling of the sample formulation, in-situ reactions,
automation problems, and faulty analytical techniques. Results reported from product
studies indicate that the ordinary USP dissolution method is not robust for controlled
release products, which can cause difficulty in identifying trends and effects of

8
formulation changes (28). Two major causes that influence variability, other that those
listed above, are mechanical and formulation factors. Mechanical problems can come
from the dissolution conditions chosen. The product may have not been closely observed
during dissolution, or there may have been a need for an apparatus change or
experimental condition change. The formulation may have a poor content uniformity, and
reactions and/or degradation may have been occurring in situ. Also, film coatings may
cause sticking to the vessel walls. Upon aging, capsule shells are known for pellicle
formation and tablets may become harder or softer, affecting the dissolution and
disintegration rate, depending upon the excipient and drug interaction with moisture.
Equipment can also cause problems with dissolution studies. Major components of
dissolution equipment are the tester, water bath, paddles, basket and shafts, vessels,
samplers, and analyzers. Mechanical aspects of the dissolution apparatus, such as paddle
or basket speed, shaft centering and wobble, and vibration can all have significant impact
on the dissolution of a product. Automation is also a problem that has been considered in
dissolution testing. Although it is very convenient and laborsaving, errors occur because
the analyst tends to overlook problem areas. Sample dissolution testing are often a source
of error for a variety of reasons: unequal lengths, crimping, wear beyond limits,
disconnection, carryover, mix-ups or crossing, and inadequate cleaning.

9
LITERATURE REVIEW
Regulatory agencies, the pharmaceutical industry, and the USP are searching for
improved in-vitro release testing methods that can be used to facilitate the regulatory
process for controlled release drug products. The common concern is that quality needs to
be built into the products rather than testing into them. A major obstacle to the
application of controlled release solid oral dosage forms for biotechnology and traditional
therapeutics is the lack of suitable in-vitro dissolution test methods to develop the
necessary standards for product approval and Good Manufacturing Practices.
Former FDA member, Eric Scheinen, who is now the Vice-President for
information standards development at USP, asked the question “Is it possible to have a
test similar to dissolution test for solid oral dosage forms that would demonstrate the
quality, batch to batch, of these products (19)?”
Ajaz Hussain, who is the FDA Office of Pharmaceutical Science Deputy Director,
indicated that the challenge in regulating these products involves four key topics:
1.) the identification, optimization and control of critical formulation and
process variables,
2.) the current state of stability testing and the challenge of ensuring shelf-life
for some products that have a long duration of action,
3.) in-vitro release testing and its role in quality assurance and in-vitro
relevance, and

10
4.) defining and assuring bioavailability, bioequivalence and pharmaceutical
equivalence.
(19)
Pharmaceutical makers are also increasing drug dosage, extending drug release
from a single dosage form or providing longer, flatter bloodstream concentration profiles.
Lower active concentrations and more complex excipients often mean that conventional
testing, such as dissolution, become more difficult to accomplish. More sophisticated
analytical techniques are now needed in the formulation development phase and
throughout the production process to monitor these characteristics. Examples of some of
the complex structures for solid dosage forms are as follows:
Figure 2. Oros tablet
The Alza Corporation pioneered the transformation of the standard pharmaceutical tablet
into an advanced drug delivery system with its Oros osmotic technology shown in Figure
2. Osmotic technology is used in more than a dozen products marketed around the world.
Some of their rate-controlled release systems include the Push-Pull, Delayed Push-Pull,
Multi-Layer Push-Pull, and Push-Stick systems. Pfizer, as well as other pharmaceutical

11
companies use this tablet. It retains its shape in gastric fluids and releases therapeutic
doses through an osmotic aperture (21).
Figure 3. Selective-Release microspheres
Figure 3 shows selected drugs that are absorbed into inorganic or polymeric
microspheres. Concentrations and release rates are staggered to provide a complex
therapeutic pattern in the bloodstream. This is achieved through enteric coatings, which
release at a particular pH in the body to give the desired effect (21).
Figure 4. Barrier-Layer Reservoir capsule
Figure 4 displays particular drugs are unique because as the drug releases, additional drug
refreshes the upper chamber to maintain constant concentration in the body. This dosage
form provides long plateaus of drug in the bloodstream (21).

12
Figure 5. Cored tablet
The tablets shown in Figure 5 are used for sequential drug delivery of one drug at two
distinct concentrations or back-to-back dual drug delivery; immediately then, the outer
portion is released, a second dose located in the tablet core is released to give the desired
therapeutic effect (21).
Since the manufacture of controlled release drugs is technically difficult
compared to conventional dosage forms, and the drug bead formulations, which comprise
many controlled release drugs, are often patented; normal dissolution studies do not
detect specific defects in the structure or composition of the controlled-release system.
Some analytical techniques, such as vibrational spectroscopy (Raman microprobe and
FT-IR microscopy), are useful for chemical characterization, but do not have the ability
to analyze the distribution of ingredients or excipients within the system. Therefore, it
offers no support to the development of an in-vitro dissolution method (20).
A study was conducted utilizing a supercritical fluid extraction-liquid
chromatography method for the testing of a polymeric controlled release drug
formulation. Several parameters were investigated to optimize the recovery of the drug
substance from the formulation. Sample quantity, extraction cell volume, extraction
duration, temperature, pressure, pH, and solvents were among the parameters evaluated.
These are some of the parameters that will be evaluated during the development of the

13
proposed method (26). Although supercritical fluid extraction-liquid chromatography
eventually may be beneficial in testing controlled release drug formulations, a universal
test procedure using supercritical fluid extraction is likely to be difficult and very
expensive.
Another study was performed comparing the standard USP method to an
accelerated dissolution rate analysis (ACDRA) method. This method forced the release of
the test drug, Roxiam, through elevated temperatures; it was evaluated for use as an in-
process test. The results of the study indicated that the ACDRA method required less than
5% of the analysis time in the USP method. This method has potential for future studies
(7).
Capsules are the second most popular form of oral dosage formulation. When the
ingredients are powders, a hard-gelatin capsule is used, but for oily liquids, soft-gelatin
capsules are preferred. The use of hard-gelatin capsules is almost axiomatic in the
preliminary pharmacologic study of a new drug before any technological study is even
contemplated. The fine particles in a capsule are usually not subjected to high
compressional forces and possible fusion, which would reduce the specific surface area.
A large effective surface area will be available for dissolution provided that the particles
in a capsule are intimately wetted by the biological fluids (5).
The dissolution of capsule formulations has received considerably less attention
than tablets, probably because of their apparent simplicity and consideration as loose
powders (5). Although the hard-gelatin capsule is widely used in preliminary studies of a
new drug, very little literature on drug availability, even in vitro, exist for this type of
dosage form (5).

14
There are obvious and insurmountable limitations to the official dissolution
testing apparatus (the rotating basket and paddle methods) concerning maintenance of
sink conditions for drugs that saturate rapidly in large volumes of medium. For slightly
soluble drugs, the limiting volume of 1000mL becomes critical with regard to sink
requirements. The solution to this problem would be continuous dissolution fluid
replacement (5).
Although the USP “basket” apparatus is widely used for testing tablets and
capsules, conventional hard-gelatin capsules present problems due to clogging of the
wire-mesh basket due to the formation of a barrier film along the inner surface of the
restrainer basket. This results in an apparent increase in lag time before the shell gets
ruptured and the contents available for absorption. Particle aggregation is another
problem that can occur due to centrifugal force. The inhomogeneity of the solution in the
rotating basket and poor reproducibility led to the enhanced use of the paddle apparatus
for testing tablets and capsules. With the paddle apparatus, “sinkers” are necessary to
avoid initial floating, but no agreement on a suitable design could be achieved and poor
reproducibility still exists (5). “Sinkers” are utilized in dissolution testing to prevent the
dosage form from floating in the media, which can affect the dissolution rate.
Flow-Through Cell
The flow-through model of a dissolution system effectively solves the problem of
non-sink conditions by supplying an unlimited quantity of fresh dissolution medium.
There have been few reports in the literature regarding the testing of drugs using the
flow-through dissolution apparatus. The flow-through dissolution testing model has been

15
proposed by many, but has been studied most extensively by Langenbucher (5). The
apparatus was added to the USP in 1990 for the convenience of European companies that
were using them to characterize extended-release products. It was devised in response to
the recent explosion of new drug delivery technologies (10). This method, which is
designed to test the dissolution characteristics of a wide range of dosage forms, is
becoming more accepted in the area of pharmaceutics (5). The system has not been
extensively used in the United States, but its obvious advantages, particularly for drugs
with low solubility, suggests that it may be used universally in the future (13).
In addition to the maintenance of sink conditions, flow-through systems offer
distinct advantages, particularly in comparison with the more conventional USP paddle
method (5):
1. The method permits the convenience of changing pH during dissolution
testing.
2. There are only a small number of apparatus parameters that affect the test and
need standardization.
3. The method has built-in filtration.
4. The method eliminates most of the problems of sample position in the stream
of the dissolution medium.
5. The method offers ideal hydrodynamic conditions for mild agitation,
homogeneity, and a mathematically definable solvent (dissolution medium)
flow pattern.
6. The test can be run as either an open or a closed system.

16
The flow-through dissolution apparatus is specially designed to have a small hold
up volume compared with other USP dissolution apparati that helps to minimize the
spreading of drug particles to undefined sites of the apparatus. The feature is useful in
the testing of drugs, especially those with poor solubility and wettability, as spreading
results in erratic and highly variable dissolution profiles (13).
The flow-through cell, of transparent and inert material, is mounted vertically
with a filter system that prevents escape of undissolved particles from the top of the cell;
standard cell diameters are 12 and 22.6mm; the bottom cone is usually filled with small
glass beads of about 1mm diameter with one bead of about 5mm positioned at the apex to
protect the fluid entry tube. The cell is immersed in a water bath, and the temperature is
maintained at 37±0.5ºC. This method overcomes the problems of sampling steps and
centrifugal force that can cause microsphere aggregation and breakage that occurs on
conventional methods, which can affect the release profile (22).
The flow-through cell (Apparatus IV) consists of a reservoir and a pump for the
dissolution medium, a flow-through cell, and a water bath that maintains the dissolution
medium at 37±0.5ºC. The pump forces the dissolution medium upwards through the
flow-through cell. The pump has a delivery range between 240 and 960-mL per hour,
with standard flow rates of 4, 8, and 16-mL per minute. The flow rate of Apparatus IV is
typically adjusted to yield at least 80% dissolved by the end of the specified dosing
interval as suggested in the current International Pharmaceutical Federation (FIP) (10).
The flow-through system provides several advantages compared to a closed system for
dissolution. The flow-through system exposes the dosage form to fresh dissolution
medium maintaining perfect sink conditions. Because the apparatus uses no stirring

17
mechanism, the capsule is exposed continuously to a homogenous, nonturbulent laminar
flow that can be precisely controlled. All the problems associated with shaft wobbling,
eccentricity, vibration, and stirrer position are eliminated with the flow-through cell.
It is critical that the dissolution method employed be capable of demonstrating the
extent of improvement in dissolution that may be achieved by further processing of the
drug substance. The flow through dissolution apparatus appears to be suitable for the
application (13).
In Vitro-In Vivo Correlation (IVIVC)
The value of dissolution as a quality control tool for predicting in vivo
performance of a drug product is significantly enhanced if an in vitro-in vivo relationship
is established. IVIVC has been defined by the United States Pharmacopeia as: “the
establishment of a relationship between a biological property produced by a dosage
form.” A FDA interpretation of IVIVC has been cited as: “To show a relationship
between two parameters.” Typically a relationship is sought between in vitro dissolution
rate and “in vivo” input rate. The in vitro test serves as a tool to distinguish between
acceptable and unacceptable drug products. The initial relationship may be expanded to
critical formulation parameters and “in vivo” input rate. One or more batches of the
formulation which release at different rates should be examined in an in vivo study to
determine whether the correlation is supported (6,10).
With controlled-release formulations, there is an inherent need to “profile” the
release over time. Dissolution specifications define the acceptable range of dissolution-
time data and should be representative of the profile and variability associated with a

18
controlled-release dosage form. There should also be a minimum of three dissolution
time points for dissolution testing of controlled-release dosage forms: the first time point
should assess dose dumping, the second or more time points should “profile” the
dissolution-time curve, and the last time point should provide information as to the
recovery of drug in the dosage form (6).
An investigation of the dependence of the formulation on pH and surfactants is
recommended in media of various compositions. However, controlled-release
formulations that are sensitive to changes in the dissolution environment should be
examined to determine the in vitro conditions which achieve optimal IVIVC. Once a
formulation has been finalized for clinical use, dissolution data should be collected and
tracked, and include batch-to-batch variation. Dissolution specifications have
implications related to critical manufacturing parameters. Batched manufacturing near the
limit of a critical manufacturing parameter must pass dissolution specifications. The USP
has acceptance tables that are based on the developed “decision tree,” and are used as a
guide for setting specifications (6).
Dissolution assay modification involves three types of variables, apparatus and
medium, and temperature at which the test is run. Apparatus variables control the
hydrodynamics and include types of apparatus (basket, paddle, reciprocating cylinder, or
flow through) and agitation of flow rate. From a theoretical viewpoint, apparatus
variables should affect formulations where disintegration, deaggregation, erosion, or
dispersion plays an important part in release of drug from the dosage form.
Medium/Solvent variables include pH, ionic strength, surfactant type/concentration, and
buffer species; control factors like solubility, wettability, osmotic pressure, buffer

19
capacity, etc. Changes in the dissolution medium will affect formulations where these
factors have a role in the drug release mechanism (6). Temperature change can result in
phase changes of the active ingredient or the controlling matrix of coatings.
Lack of correlation between an accelerated method and its corresponding ordinary
dissolution test is not unusual. It could be due to (for example) a phase transition in one
or several of the components (excipients or active) in the formulation. The phase
transition could be due to an increased temperature, or a different interaction with a new
solvent (6).
Theophylline
Theophylline is the drug that will be evaluated in this study. It is structurally
classified as di-methylxanthine. Theophylline occurs as a white odorless, crystalline
powder with a bitter taste. Anhydrous theophylline has the chemical name 1H-Purine-2,6
dione-3,7-dimethyl. There are two distinct actions of theophylline in the airways of
patients with reversible obstruction: smooth muscle relaxation and suppression of the
response of the airways to stimuli (ie. non-bronchodilator prophylactic effects). While the
mechanisms of action are not known with certainty, studies in animals suggest that
bronchodilation is mediated by the inhibition of two isozymes of phosphodiesterase(PDE
III and, to a lesser extent, PDE IV) while non-bronchodilator prophylactic actions are
probably mediated through one or more different molecular mechanisms that do not
involve inhibition of PDE III of antagonism of adenosine receptors. Theophylline also
increases the force of contraction of diaphragmatic muscles. This action appears to be due
to enhancement of calcium uptake through an adenosine-mediated channel (23).

20
Theophylline is rapidly and completely absorbed after oral administration in
solution or immediate release solid oral dosage form. Furthermore, it does not undergo
any appreciable pre-systemic elimination, is distributed freely into fat-free tissue and is
extensively metabolized in the liver (23). However, theophylline has a narrow therapeutic
index which makes a reliable controlled release dosage form desirable in order to
minimize side effects and reduce the number of doses required per day.
Shellac
Coatings are often used to give to prototype formulation useful characteristics,
such as an initial lag period before drug release. The physical and chemical properties of
the coating material may come into play when developing the optimal method. In the
dosage form tested, shellac, a refined natural product, is the coating used to prepare the
desired timed-release therapeutic effect for the theophylline pellets. Lac is a resinous
substance prepared from a secretion that encrusts the bodies of a scale insect, Laccifer
lacca (Coccidae), which lives on the sap of the stems of various trees. The main
component (about 95%) of shellac is a resin, which on mild basic hydrolysis gives a
mixture of aliphatic and alicyclic hydroxyacids. The composition of the hydrolysate is
variable, but in general there are about 50% aliphatic and 5-10% of alicyclic acids.
Aleurtic acid and shellolic acid are the major aliphatic and alicyclic components,
respectively. It is noticed that aleuritic acid, shellolic acid and its CH2 homologues
together make up 73 percent of the lac complex. Shellac also contains about 5-6% wax
and a small amount of pigment (24).

21
Percent by Weight
Aleuritic acid 46
Shellolic acid and homologues 27
Kerrolic acid 5
Butolic acid (approx.) 1
Esters of wax alcohols and acids (approx.) 2
Unidentified neutral material, dyes, etc. 7
Unidentified polybasic acid interesters 12
Table 1. Presents the percentage composition of shellac in terms of the individual acids and fractions which have been isolated up to the present time (27).
The question that arises in the regulatory agency is how the drug and dosage form
will react when altering the parameters to obtain a faster release for test purposes.
Degradation of the drug will be different in the body depending upon the release site, and
the nature and purpose of the drug. The rate-limiting properties of controlled drug
delivery systems reside in the design properties of the drug delivery device itself and are
not necessarily dependent on the physiology of the subject. This means that the focus of a
new analytical test method will need to include the specific properties of the drug, the
method of drug diffusion and matrix (excipients) erosion of diffusion characteristics. The
location in the body where absorption occurs must be identified so as to create the same
or similar conditions such that the release can be correlated to the actual activity that
occurs during release of the drug in the body.
Regulatory agencies face the reality that for the last 25 years products have had
dissolution testing as part of their product development. The current tension between

22
industry and the FDA arises from the USP decision to test a batch for batch properties
where a composite drug sample is attained, then assayed. Then, there are the individual
dosage and content uniformity questions. With the introduction of extended-release in
1983, the focus was still on the unit value. Recognizing the fact that the tablet or capsule
is a physical-chemical entity in time and space, a problem associated with bioavailability
may be caused by a problem within its physical and chemical nature. This is the
challenge and should be able to be determined.
When reviewing the literature and various analytical methods, it is not the
solubility of the drug alone that is critical; it is also necessary to understand the effective
surface area of the formulated drug. There are also problems associated with the
lubricants such as magnesium stearate and the coatings such as shellac, cellulose acetate
phthalate, cellulose acetate trimellitate, or other agents used in the manufacture of tablets
and capsules. These characteristics affect the standard dissolution test and must also be
defined when establishing the parameters to be used to test the products.

23
MATERIALS AND METHODS
Materials
Materials used in this study were obtained from the following commercial
suppliers and used without further purification. THEO-24 Controlled Release capsules
(100mg) from the Wal-Mart Pharmacy, 4375 Lexington Road, Athens, G.A. 30605;
Potassium phosphate monobasic, hydrochloric acid, methyl alcohol, and sodium
hydroxide from Aldrich Chemicals, P.O. Box 2060, Milwaukee, W.I. 53201; Sodium
hydroxide pellets from J.T. Baker, Phillipsburg, N.J. 08865; Sodium lauryl sulfate, U.S.P.
from the Fisher Scientific Company, Fair Lawn, N.J.; Theophylline RS Anhydrous
(U.S.P.) from Spectrum Chemical Manufacturing Corporation, New Brunswick, N.J.
08901. All solvents used in this study were A.C.S. reagent grade.
Instruments
The major instruments in this study were: Spectronic 2000 Spectrophotometer,
Bausch and Lomb, 820 Linden Avenue, N.J. 08802; Haake E-52 Water Bath, Haake
Instruments, Inc., 244 Saddle River Road, Saddle Brook, N.J. 07662; Sigma Motor
Peristaltic Pump Model T8, Middleport, N.Y. 14105; Flow Through Cell was
manufactured in-house at USP specifications by the Instrument Shop on the campus of
the University of Georgia.

24
Analyses
The UV Spectrophotometer analyses were performed on a Spectronic 2000
system equipped with a 10mm quartz cell. A standard curve of absorbance was
constructed using solutions of Theophylline reference standard in the dissolution
medium, ranging in the concentration from 5 to 100mg/L. Absorbance versus
concentration plots were linear over this concentration range and used to determine the
percent drug dissolved in the dissolution experiments. The UV maximum employed was
271nm.
USP Dissolution Method
The following dissolution method comes from the USP monograph for
Theophylline Extended Release capsules and is currently used for dissolution release
profiles of this particular drug product. The medium used was 0.05M phosphate buffer at
a constant temperature of 37ºC and pH 6.6. The speed of the apparatus was set at 100
revolutions per minute (rpm). Table 2 shows the times and tolerances for 100mg of
theophylline dissolved at times specified by the Acceptance Table 1 of the USP.
Time (hours) Amount Dissolved
1 Between 5% and 15%
2 Between 12% and 30%
4 Between 25% and 50%
5 Between 30% and 60%
8 Between 55% and 75%
Table 2. USP times and tolerances for Theophylline Extended Release capsules.

25
The procedure was to determine the amount of theophylline from UV absorbances
at a wavelength of maximum absorbance at 271nm of filtered portions of the solution
under test, diluted with dissolution medium, if necessary.
Dissolution Method
In vitro dissolution studies of THEO-24 CR capsules were performed (in
triplicate) using the flow-through cell method (USP Apparatus IV). The dissolution
variables temperature, pH, flow rate, solvent, and surfactant addition were changed to
obtain the fastest release method possible.
One hundred milligrams of THEO-24 CR pellets were introduced into the flow
cell. The dissolution media (1000-ml) was altered depending on the desired change in
variable(s). Samples were withdrawn from the media reservoir at predetermined time
intervals, and the amounts of dissolved theophylline were measured
spectrophotometrically. The reservoir was then replenished with fresh dissolution media.
Flow-Through Dissolution
The flow-through cell, of transparent and inert material, was mounted vertically
with a filter system that prevents escape of undissolved particles from the top of the cell;
standard cell diameters are 12 and 22.6mm; the bottom cone is usually filled with small
glass beads of about 1mm diameter with one bead of about 5mm positioned at the apex to
protect the fluid entry tube. The flow-through cell used is described as having 3 parts: the
lower cone, the middle cylindrical portion, and the filter head on top. The cone is

26
separated from the cylindrical portion by a #40 mesh screen and a microfiber filter. The
filter head on top also holds a glass microfiber filter. The cell is immersed in a water
bath, and the temperature maintained at 37±0.5ºC. All experiments were carried out in a
closed loop setup. The flow rates of the dissolution medium through the cells were within
the USP specifications of 4, 8, and 16mL/minute. Samples (4mL) were withdrawn every
thirty minutes for 3 hours.
Electron Microscope Study
Figures 16-23 display the physical appearance of theophylline microspheres after
a dissolution test using the flow-through cell apparatus. All figures were dried overnight
and placed in a vacuum dessicator for two days before electron microscope observations.
Figure 15 shows a picture of an in tact theophylline microsphere to illustrate its initial
appearance before dissolution testing.
Figures 16, 17, 20 and 22 presented no physical damage done to the microspheres.
Figure 16 was performed under similar conditions as the ordinary dissolution test
utilizing Apparatus I. Figure 17 shows that the increasing pH value had no harmful
effects on the strength of the microsphere. Figure 20 displayed no obvious variability of
appearance with elevated temperature. Figure 22, with the addition of the surfactant, also
showed no indication of disintegration upon the formulation.
Figures 18 and 19 showed lack of pH integrity and robustness of the formulation
due to increasing pH values. Increasing pH values can affect the phase transition of the
microspheres and, therefore, cause damage in the dissolution process. Most controlled

27
release systems are pH dependent, which should be taken into consideration when
developing new, innovative test methods.
Figure 21 exhibited poor pH integrity and robustness in the presence of extreme
pH values. The microspheres quickly degraded when they came into contact with the
sodium hydroxide. As in Figures 18 and 19, extreme pH values can destroy the physical
appearance of theophylline microspheres. The use of a medium with a higher pH resulted
in coating disintegration but, because of the chemical properties of drug substance, the
dissolution profile was also affected, showing the point where the in vitro test was no
longer representative of the in vivo performance.
Figure 23 revealed no visible signs of disintegration during dissolution testing.
Theophylline microspheres to dissolved readily in methanol; however, the shellac coating
dissolved at a rapid rate leaving only the drug active to enter into solution. Therefore, the
use of a less polar solvent, like methanol, is not a good quality control tool for dissolution
test methods.

28
RESULTS AND DISCUSSION
The temperature, pH, and flow rates are the most important variables to consider
in flow-through dissolution testing. In the present study, the drug release rates of
theophylline microspheres were determined using a flow-through cell apparatus (USP
Apparatus 4).
The effect of temperature (37ºC, 47ºC, and 57ºC), pH (1.2-12), solvent (1000mL),
and flow rate (4, 8, and 16mL/min) on microsphere release rates are examined and
presented in Figures 1-12. It is apparent in Figure 1 that the rate of release is relatively
lengthy and is not adequate when compared to the USP rate of release of the product. The
increase in temperature in Figure 2, relative to Figure 1, showed an increase in release
rate. Importantly, the pH settings of 7.6, 8.6, and 9.6 showed a release of over 80% of the
active drug with 3 hours. The release rates of Figure 3, compared to those on Figure 2,
appear that conditions of temperature 57ºC and pH of 7.6 should be acceptable for
accelerated batch release testing of theophylline microspheres. As temperature and pH
increased in Figure 4 the release rate is greatly accelerated, compared to USP dissolution
testing of the controlled release product. It is clear that, in the investigated range, the
easiest was to accelerate the dissolution process is to increase temperature and pH. The
pH value of 7.6 of the dissolution in Figure 5 showed a rapid acceleration rate and an
80% or better drug release within a 3 hour time period. A pH value of 7.6 appears to give
the best release of the active. The release rates were slightly slower in Figure 6 than the
47ºC temperature evaluation. It can be assumed from this particular graph that excessive

29
temperature and pH values, in some instances, can retard the release rate of the drug
product. Figure 7 shows that all rates of release were inadequate for the evaluation.
However, there was an increase in the release of drug particles as compared to the flow
rates of 4 and 8mL/minute. This indicates that an increase in the flow rate is directly
proportional to an increase in the rate of release of the microspheres due to flux transport.
Figure 8 showed a significant change in the release due to the increase in the temperature,
as compared to Figure 7. The pH values of 7.6, 8.6, and 9.6 displayed and 80% or better
release of the microspheres within a 3 hour time period. This is another parameter set that
would be acceptable to batch release testing as a quality control tool. Figure 9 shows that
all pH settings released 80% or more of the active within a 3 hour time period.
As predicted, an increase in temperature, pH, and flow rate result in an increase in
the release rate of the microspheres dramatically. This is because of an increase in
molecular diffusion, the flux-transport, and the solubility. It is easy to accelerate the
dissolution process; the trick is to do it without loss of the correlation to the ordinary
dissolution test. It is not unusual to have a lack of correlation between an accelerated and
its corresponding ordinary dissolution test. This could be due to a phase transition of the
excipients or active in the formulation. The phase transition could be due to an increased
temperature or a different interaction with a new solvent. Flow patterns in the cell could
also cause a lack of correlation due to the fact that the flux of solvent around the sample
could be different from the paddle of Apparatus I.
The use of sodium hydroxide as a solvent also showed impressive results as far as
flow through dissolution testing. Changing the solvent, in Figure 10, to sodium hydroxide
caused a tremendous increase in release of drug from the microspheres. The experiment

30
was completed within 1 and 2 hours of the start of the run depending on the temperature
of the solvent. However, the physical appearance of the microspheres, pH integrity, and
robustness showed severe disintegration of the drug. A solvent change to sodium
hydroxide does not appear to be adequate from batch release testing of the final product.
All three temperature settings in Figure 11 demonstrated an 80% or better release of all
three trials of theophylline microspheres. Even though this information illustrates
desirable data, the appearance of the microspheres indicated that this test would not be
feasible in the manufacturing process of the capsules. Figure 12 displayed similar results
in release rates as in Figure 11. All temperature values released the desired 80% or better
of the drug active within 1 hour of dissolution testing. Carboxylic acids, which coat the
theophylline microspheres, dissolve readily into aqueous sodium hydroxide creating a
salt formation. Although the dissolution profiles were rather rapid, the pH integrity and
robustness did not hold up adequately in the evaluations.
For in vitro dissolution studies, the addition of surfactant to the dissolution
medium is proposed to simulate the phosphate buffer solution with low surface tension,
to ensure sink conditions for sparingly water-soluble drugs and to improve wettability of
the dosage form. Sodium lauryl sulfate is commonly used for this purpose. As expected,
the theophylline dissolution rate was quicker with the addition of 0.1% sodium lauryl
sulfate to the pH value of 7.6. Addition of the surfactant to the media reservoir slightly
increased the rate of release of the microspheres as opposed to the release rate without the
surfactant. This enhancing effect is due, in part, to an increase in the microenvironment
pH surrounding the sparingly soluble weak acid and to increase wetting and better
solvent penetration into the microspheres as a result of lowering the interfacial tension

31
between the solid surface and the solvent. Hydrophobic lubricants, such as magnesium
stearate, aluminum stearate, stearic acid, and talc, decrease the effective drug-solvent
interfacial area by reducing the surface wettability. This prolongs the disintegration time
and the area of the interface between the active ingredient and solvent. Sodium lauryl
sulfate was established at low concentrations (0.1%) just above the critical micellar
concentration (0.023g/l) to minimize the effect on the drug release of theophylline
microspheres. A pH value of 1.2 with the addition of sodium lauryl sulfate did not show
favorable results in the release rate.
The use of methanol as a solvent for accelerated release testing showed dramatic
results in the dissolution profile for theophylline. Figure 14 revealed all samples were
completed within an hour of the dissolution with 80% or more of the drug released. This
evaluation indicates that theophylline microspheres are extremely soluble in alcohols.
Due to the fact that the two main components of the shellac coating are comprised of
aliphatic and alicylic acids with carbonyl groups, the methanol may have caused the
compound’s solubility to increase. As we can expect from the structure of carboxylic
acids, the molecules are polar and like molecules can form hydrogen bonds with each
other. Carboxylic acids are soluble in less polar solvents like ether, alcohol, benzene, etc.
The aliphatic acids therefore show very much the same solubility behavior. Although the
dissolution of the microspheres was extremely rapid utilizing an alcohol, the coating was
dissolved too quickly leaving only the drug active to enter into solution. Therefore, it can
be understood that methanol is not an adequate solvent for dissolution testing.
All experiments were carried out in a closed loop setup. Tabulations of Figures 1-
14 are revealed in the Appendix. Figures 15-23 show the physical appearances of the

32
microspheres before and after each dissolution test. The results from these studies
demonstrate that the flow-through apparatus is a useful tool to study controlled release
dosage form dissolution.

33
0
10
20
30
40
50
60
0 1 2 3 4
Time(hrs)
% R
ele
ase
d
pH=6.6pH=7.6pH=8.6pH=9.6USP
Figure 1. Dissolution profiles at 37°C, a flow rate of 4mL/minute, and pH values of 6.6, 7.6, 8.6, and 9.6. The media used in this study was 0.05M KH2PO4. USP data shows the
release rate of monograph theophylline extended release capsules.

34
0102030405060708090100
0 1 2 3 4
Time(hrs)
% R
ele
ase
d pH=6.6pH=7.6pH=8.6pH=9.6
Figure 2. Dissolution profiles at 47°C, a flow rate of 4mL/minute, and pH values of 6.6, 7.6, 8.6, and 9.6. The media used in this study was 0.05M KH2PO4 adjusted to the test pH
with 1M sodium hydroxide.

35
0102030405060708090100
0 1 2 3 4
Time(hrs)
% R
elea
sed pH=6.6
pH=7.6pH=8.6pH=9.6
Figure 3. Dissolution profiles at 57°C, a flow rate of 4mL/minute, and pH values of 6.6, 7.6, 8.6, and 9.6. The media used in this study was 0.05M KH2PO4 adjusted to the test pH
with 1M sodium hydroxide.

36
0
10
20
30
40
50
60
0 1 2 3 4
Time(hrs)
% R
ele
ase
d pH=6.6pH=7.6pH=8.6pH=9.6USP
Figure 4. Dissolution profiles at 37°C, a flow rate of 8mL/minute, and pH values of 6.6, 7.6, 8.6, and 9.6. The media used in this study was 0.05M KH2PO4 adjusted to the test pH with 1M sodium hydroxide. USP data shows the release rate of monograph theophylline
extended release capsules.

37
0
10
20
30
40
50
60
70
80
90
0 1 2 3 4
Time(hrs)
% Re
leas
ed pH=6.6
pH=7.6
pH=8.6
pH=9.6
Figure 5. Dissolution profiles at 47°C, a flow rate of 8mL/minute, and pH values of 6.6, 7.6, 8.6, and 9.6. The media used in this study was 0.05M KH2PO4 adjusted to the test pH
with 1M sodium hydroxide.

38
0102030405060708090100
0 1 2 3 4
Time(hrs)
% R
ele
ase
d pH=6.6pH=7.6pH=8.6pH=9.6
Figure 6. Dissolution profiles at 57°C, a flow rate of 8mL/minute, and pH values of 6.6, 7.6, 8.6, and 9.6. The media used in this study was 0.05M KH2PO4 adjusted to the test pH
with 1M sodium hydroxide.

39
0
10
20
30
40
50
60
70
0 1 2 3 4
Time(hrs)
% R
ele
ase
d
pH=6.6pH=7.6pH=8.6pH=9.6USP
Figure 7. Dissolution profiles at 37°C, a flow rate of 16mL/minute, and pH values of 6.6, 7.6, 8.6, and 9.6. The media used in this study was 0.05M KH2PO4 adjusted to the test pH with 1M sodium hydroxide. USP data shows the release rate of monograph theophylline
extended release capsules.

40
0102030405060708090100
0 1 2 3 4
Time(hrs)
% R
elea
sed pH=6.6
pH=7.6
pH=8.6
pH=9.6
Figure 8. Dissolution profiles at 47°C, a flow rate of 16mL/minute, and pH values of 6.6, 7.6, 8.6, and 9.6. The media used in this study was 0.05M KH2PO4 adjusted to the test pH
with 1M sodium hydroxide.

41
0102030405060708090100
0 1 2 3 4
Time(hrs)
% R
elea
sed pH=6.6
pH=7.6pH=8.6pH=9.6
Figure 9. Dissolution profiles at 57°C, a flow rate of 16mL/minute, and pH values of 6.6, 7.6, 8.6, and 9.6. The media used in this study was 0.05M KH2PO4 adjusted to the test pH
with 1M sodium hydroxide.

42
0102030405060708090100
0 1 2 3 4
Time(hrs)
% R
elea
sed
Temp=57Temp=47Temp=37
Figure 10. Dissolution profiles at pH 12, a flow rate of 4mL/minute, and temperature values of 37°C, 47°C, and 57°C. The media used in this study was 0.05M sodium
hydroxide (NaOH).

43
0
20
40
60
80
100
120
0 1 2 3 4Time(hrs)
% R
elea
sed
Temp=57Temp=47Temp=37
Figure 11. Dissolution profiles at pH 12, a flow rate of 8mL/minute, and temperature values of 37°C, 47°C, and 57°C. The media used in this study was 0.05M sodium
hydroxide (NaOH).

44
0
20
40
60
80
100
120
0 0.5 1 1.5 2 2.5
Time(hrs)
% R
elea
sed
Temp=57Temp=47Temp=37
Figure 12. Dissolution profiles at pH 12, a flow rate of 16mL/minute, and temperature values of 37°C, 47°C, and 57°C. The media used in this study was 0.05M sodium
hydroxide (NaOH).

45
0
10
20
30
40
50
60
70
0 1 2 3 4Time(hrs)
% R
elea
sed
pH=1.2(0.1%SLS)pH=7.6(0.1%SLS)pH=7.6
Figure 13. Dissolution profile using media of pH 1.2 and 7.6 with 0.1% of a surfactant, sodium lauryl sulfate. The pH value of 7.6 without surfactant is used as a comparison.
The temperature was 37°C with a flow rate of 8mL/minute.

46
0
20
40
60
80
100
120
0 0.5 1 1.5 2
Time(hrs)
% R
elea
sed
37°C47°C57°C
Figure 14. Dissolution profiles using 1 liter of methanol as the media. Temperature values were at 37°C, 47°C, and 57°C. Flow rate was 8mL/minute.

47
Figure 15. In tact theophylline microspheres before dissolution run.
Figure 17. Theophylline microspheres after dissolution at 37ºC, pH of 7.6, and flow rate of 8mL/minute. Dissolution media used was 0.05M KH2PO4 adjusted to the test pH with 1M sodium hydroxide.
Figure 16. Theophylline microspheres after dissolution at 37ºC, pH of 6.6, and flow rate of 8mL/minute. Dissolution media used was 0.05M KH2PO4 adjusted to the test pH with 1M sodium hydroxide.
Figure 18. Theophylline microspheres after dissolution test at 37ºC, pH of 8.6, and flow rate of 8mL/minute. Dissolution media used was 0.05M KH2PO4 adjusted to the test pH with 1M sodium hydroxide.

48
Figure 19. Theophylline microspheres after dissolution at 37ºC, pH of 9.6, and flow rate of 8mL/minute. Dissolution media used was 0.05M KH2PO4 adjusted to the test pH with 1M sodium hydroxide.
Figure 21. Theophylline microspheres after dissolution at 37ºC, pH of 12, and flow rate of 8mL/minute. Dissolution media used was 0.05M NaOH.
Figure 20. Theophylline microspheres after dissolution at 47ºC, pH of 7.6, and flow rate of 8mL/minute. Dissolution media used was 0.05M KH2PO4 adjusted to the test pH with 1M sodium hydroxide.
Figure 22. Theophylline microspheres after dissolution at 37ºC, pH of 7.6, and flow rate of 8mL/minute. Dissolution media used was 0.05M KH2PO4 with adjusted to the test pH with 1M sodium hydroxide and 0.1% sodium lauryl sulfate.

49
Figure 23. Theophylline microspheres after dissolution at 37ºC and flow rate of 8mL/minute. Dissolution media used was 1 liter of methanol.

50
CONCLUSIONS
The purpose of this study was to evaluate the parameter effects of USP apparatus
IV (Flow-Through Cell) for accelerated drug release of theophylline controlled release
microspheres. It was found throughout all of the evaluations that an increase in
temperature and pH play a major role in the accelerated dissolution of Theophylline
100mg CR capsules. This is because higher temperature increases the molecular
diffusion, the flux-transport, and the solubility, respectively. However, increased pH
integrity and robustness did not hold up with pH 8.6, 9.6, or the use of 0.05M sodium
hydroxide as the media. It can be understood that extreme pH values can cause
disintegration and damage of the microspheres. An increase in flow rate and surfactant
addition also showed improvement in the rate of release of the drug product. Out of all
the studies mentioned, it appears that a temperature of 47ºC, pH 7.6, and flow rate
8mL/minute exhibit the best parameters for accelerated dissolution testing of theophylline
microspheres in a 0.05M phosphate buffer.
The Flow-Through Cell method is well suited for use in process control as well as
in the early stages of the formulation development. Current applications of dissolution
testing include formulation selection, assessment of product quality and evaluation of
product and process changes. There is plenty of room for innovation. Dissolution testing
will continue to be extremely important in the early stages of formulation design and
optimization. Methods that are too complicated or which fail to meet compendial
requirements may still provide advantages in product development. In the past,

51
dissolution test methods have been useless since they were proved insensitive to
parameter changes critical to in vivo performance. Nevertheless, dissolution testing has
established itself as a regular quality control procedure in good manufacturing practices
and will remain a simple and cost-effective indicator of a product’s physical consistency.

52
REFERENCES
1. Skelly, J.P., Amidon G.L., Barr W.H., et al. Workshop Report: In Vitro and in
vivo testing and correlation for oral controlled/modified-release dosage forms.
Pharmaceutical Research. 7:975-82 (1990).
2. Dighe S.V., Adams, W.P. Bioavailability and bioequivalence of oral
controlled release products: A regulatory perspective. In: Welling, P.G., Tse,
F.L.S., eds. Pharmacokinetics: Regulatory, Industrial, and Academic
Perspectives. New York: Marcel Dekker Inc. 307-36. (1988).
3. Skelly J.P., Barr W.H. Regulatory Assessment. In: Robinson J.R., Lee V.H.L.,
eds. Controlled Drug Delivery-Fundamentals and Application. 2nd edition.
New York: Marcel Dekker Inc., 4-33; 294-331 (1987).
4. Chien, Y.W. Regulatory considerations in controlled drug delivery. In: Chien
Y.W. ed. Novel Drug Delivery Systems. 2nd edition, New York: Marcel
Dekker Inc. 747-76 (1992).
5. Banakar, Umesh V. Pharmaceutical Dissolution Testing. New York: Marcel
Dekker, Inc. 1-49, 77-90, 172-210, 265-319, 324 (1992).
6. Young D., Devane J.G., and Butler J. In Vitro-In Vivo Correlations. New
York: Plenum Press, 1-18 (1997).
7. G. Zackrisson, G. Ostling, B. Skagerberg, and T. Anfalt. Accelerated
Dissolution Rate Analysis (ACDRA) for Controlled Release Drugs.
Application to Roxiam®. J. Pharm. & Biomed. Anal. 13:377-383(1995).

53
8. Katarzyna Swiader and Wiktor Czarnecki. Influence of Medium Acidity on
Release Kinetics of Citocoline Sodium from Tablets in the Flow-Through Cell
Apparatus. Acta Pharm. 51:131-137(2001).
9. Silvina A. Bravo, Maria C. Lamas, and Claudio J. Salomon. In-Vitro Studies
of Diclofenac Sodium Controlled-Release from Biopolymeric Hydrophilic
Matrices. J. Pharm Sci. 5(3):213-219(2002).
10. Ellen D. Jorgensen and Dileep Bhagwat. Development of Dissolution Tests
for Oral Extended-Release Products. PSST. 1:128-135(1998).
11. O. Chambin, V. Berard, M.H. Rochat-Gonthier, and Y. Pourcelot. Dry
Absorbed Emulsion: 2. Dissolution Behavior of an Intricate Formulation.
Inter. J. Pharm. 235:169-178(2002).
12. Per-Ola Quist and Goran Ostling. Accelerated Dissolution Testing for
Improved Quality Assurance. J. Pharm. & Biomed. Anal. 28:1081-
1089(2002).
13. Shobha N. Bhattachar, James A. Wesley, Ann Fioritto, Peter J. Martin, and
Surech R. Babu. Dissolution Testing of a Poorly Soluble Compound Using the
Flow-Through Cell Dissolution Apparatus. Inter. J. Pharm. 236:135-
143(2002).
14. Pillay V. and Fassihi R. Evaluation and Comparison of Dissolution Data
Derived from Different Modified Release Dosage Forms: an Alternative
Method. J. Controlled Release. 55(1):45-55(1998).

54
15. Martin Siewert, Ludwig Weinandy, David Whiteman, and Catherine Judkins.
Typical Variability and Evaluation of Sources of Variability in Drug
Dissolution Testing. European J. Pharm. And Biopharm. 53(1):9-14(2002).
16. Zs. Musko, K. Pintye-Hodi, R. Gaspar, J. Pintye, P. Szabo-Revesz, I. Ers, and
G. Falkay. Study of In Vitro and In Vivo Dissolution of Theophylline from
Film-Coated Pellets. European J. Pharm. And Biopharm. 51(2):143-
146(2001).
17. John S. Kent, Paul P. Wong, and G.P. Hegde. Design and Evaluation of an
Automated System for In Vitro Dissolution Testing Utilizing a High-Pressure
Liquid Chromatographic Multiport Switching Valve. J. Pharm. Sci.
66(12):1665-1670(1977).
18. Guo, J.H.; Harcum, W.W.; Skinner, G.W.; Dluzneski, P.R.; Trumbull, D.E.
Validation of Tablet Dissolution Method by High-Performance Liquid
Chromatography. Drug Development and Industrial Pharmacy. 26(3):337-
342(2000).
19. FDC Reports. “The Gold Sheet” - Pharmaceutical and Biotechnology Quality
Control. 35(5); May 2001.
20. Anna M. Belu, Martyn C. Davies, J. Mike Newton, and Nikin Patel. TOF-
SIMS Characterization and Imaging of Controlled-Release Drug Delivery
Systems. Anal. Chem. 72:5625-5638(2000).

55
21. E. Neil Lewis, John E. Carroll, and Fiona Clarke. A Near Infrared View of
Pharmaceutical Formulation Analysis. NIR News. 12(3):16(2001).
22. The United States Pharmacopeia (USP). National Publishing. 1628-1631,
1941-1946. 1999
23. William O. Frye. Principles of Medicinal Chemistry. 3rd edition, New York:
Lea and Febiger, Inc. 279-282(1989).
24. Arthur H. Kibbe. Handbook of Pharmaceutical Excipients. 3rd edition,
London: Pharmaceutical Press. 462-464, 487-489(2000).
25. Robert Morrison and Robert Boyd. Organic Chemistry. 6th edition, New
York: Prentice Hall, 713-742(1992).
26. Daryle A. Roston, Jeffrey J. Sun, Paul W. Collins, William E. Perkins, and
Samuel J. Tremont. Supercritical fluid extraction-liquid chromatography
method development for a polymeric controlled-release drug formulation. J.
Pharm. & Biomed. Anal. 13: 1513-1520(1995).
27. H.S. Cockeram and S.A. Levine. The Physical and Chemical Properties of
Shellac. J. Society of Cosmetic Chemist. 316-322(1961).
28. Gray, Vivian. Identifying Sources of Error and Variability in Dissolution
Calibration and Sample Testing. American Pharmaceutical Review. 8-12.
29. Gennaro, A.R. Remington: The Science and Practice of Pharmacy. 20th
edition. Lippincott, Williams, and Wilkins Inc. 654-663(2000).

56
APPENDIX
The following data are tabulations of the dissolution profiles in Figures 1-14.
Time(hrs) pH=6.6 pH=7.6 pH=8.6 pH=9.6
.5 3% 1% 5% 6%
1 6% 6% 14% 17%
1.5 13% 15% 27% 28%
2 21% 21% 36% 37%
2.5 25% 30% 47% 46%
3 31% 37% 57% 55%
Table 1. Percent released at selected pH values with a temperature of 37ºC, flow rate of
4mL/minute, and 0.05M KH2PO4 as the media.
Time(hrs) pH=6.6 pH=7.6 pH=8.6 pH=9.6
.5 6% 10% 18% 15%
1 11% 18% 35% 33%
1.5 17% 27% 57% 58%
2 25% 46% 73% 78%
2.5 31% 66% 83% 89%
3 38% 82% ---- ----
Table 2. Percent released at selected pH values with a temperature of 47ºC, flow rate of
4mL/minute, and 0.05M KH2PO4 as the media.
57
Time(hrs) pH=6.6 pH=7.6 pH=8.6 pH=9.6
.5 12% 11% 13% 34%
1 25% 36% 49% 62%
1.5 40% 56% 72% 87%
2 53% 75% 91% ----
2.5 65% 90% ---- ----
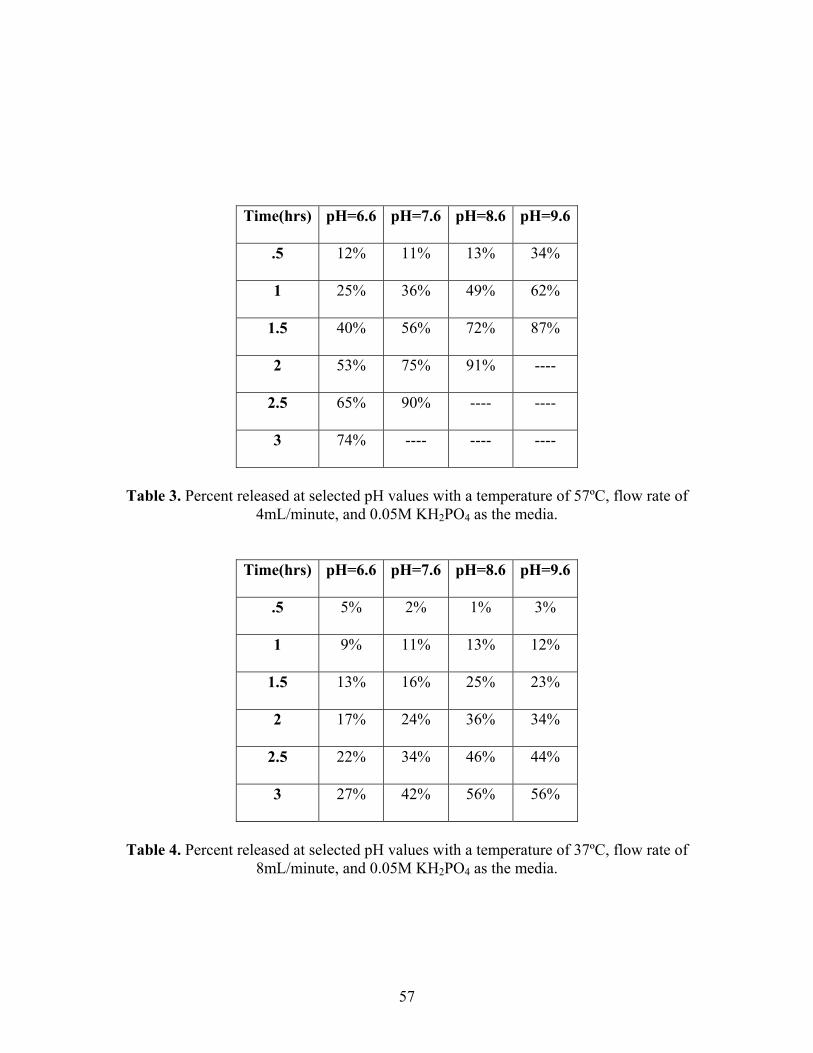
3 74% ---- ---- ----
Table 3. Percent released at selected pH values with a temperature of 57ºC, flow rate of
4mL/minute, and 0.05M KH2PO4 as the media.
Time(hrs) pH=6.6 pH=7.6 pH=8.6 pH=9.6
.5 5% 2% 1% 3%
1 9% 11% 13% 12%
1.5 13% 16% 25% 23%
2 17% 24% 36% 34%
2.5 22% 34% 46% 44%
3 27% 42% 56% 56%
Table 4. Percent released at selected pH values with a temperature of 37ºC, flow rate of
8mL/minute, and 0.05M KH2PO4 as the media.
58
Time(hrs) pH=6.6 pH=7.6 pH=8.6 pH=9.6
.5 8% 12% 14% 22%
1 14% 34% 34% 47%
1.5 24% 52% 54% 68%
2 32% 73% 75% 82%
2.5 38% 83% 85% ----
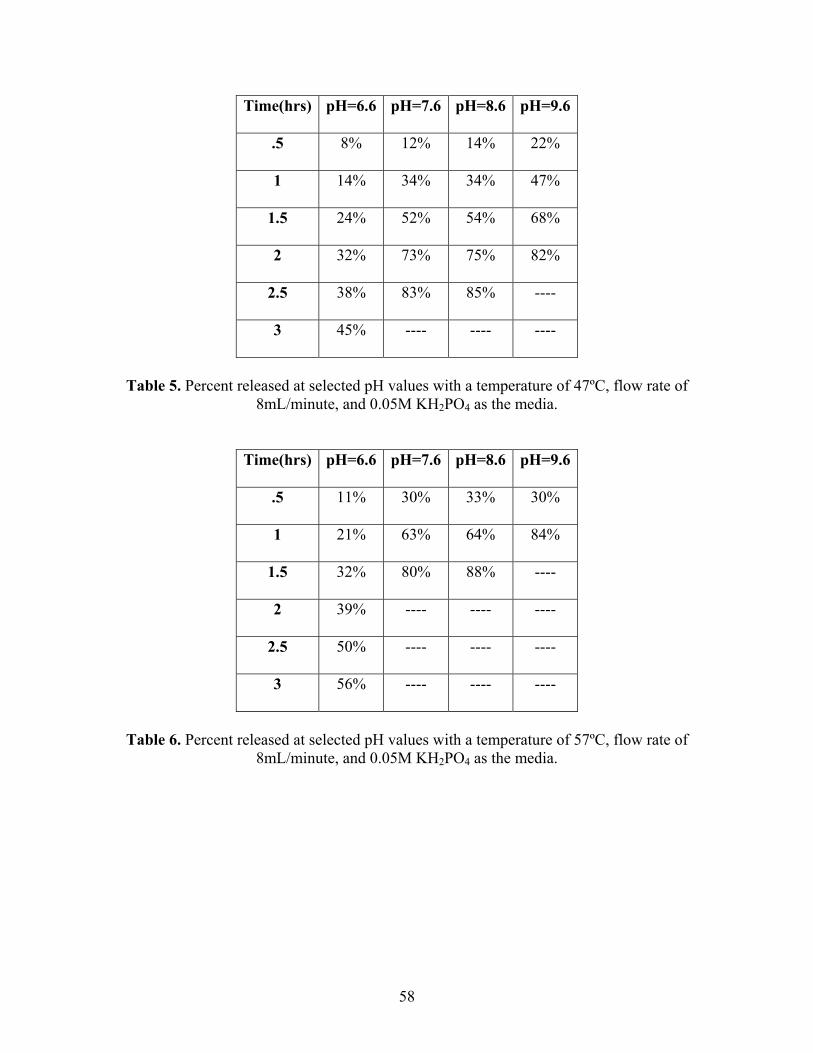
3 45% ---- ---- ----
Table 5. Percent released at selected pH values with a temperature of 47ºC, flow rate of
8mL/minute, and 0.05M KH2PO4 as the media.
Time(hrs) pH=6.6 pH=7.6 pH=8.6 pH=9.6
.5 11% 30% 33% 30%
1 21% 63% 64% 84%
1.5 32% 80% 88% ----
2 39% ---- ---- ----
2.5 50% ---- ---- ----
3 56% ---- ---- ----
Table 6. Percent released at selected pH values with a temperature of 57ºC, flow rate of
8mL/minute, and 0.05M KH2PO4 as the media.

59
Time(hrs) pH=6.6 pH=7.6 pH=8.6 pH=9.6
.5 4% 7% 8% 8%
1 10% 11% 15% 19%
1.5 15% 20% 26% 31%
2 20% 31% 38% 46%
2.5 25% 42% 48% 53%
3 31% 50% 57% 63%
Table 7. Percent released at selected pH values with a temperature of 37ºC, flow rate of
16mL/minute, and 0.05M KH2PO4 as the media.
Time(hrs) pH=6.6 pH=7.6 pH=8.6 pH=9.6
.5 7% 12% 15% 16%
1 17% 32% 38% 37%
1.5 29% 49% 57% 57%
2 39% 66% 76% 73%
2.5 50% 80% 88% 91%
3 58% ---- ---- ----
Table 8. Percent released at selected pH values with a temperature of 47ºC, flow rate of
16mL/minute, and 0.05M KH2PO4 as the media.

60
Time(hrs) pH=6.6 pH=7.6 pH=8.6 pH=9.6
.5 14% 35% 29% 40%
1 32% 69% 61% 70%
1.5 58% 89% 86% 91%
2 71% ---- ---- ----
2.5 82% ---- ---- ----
3 ---- ---- ---- ----
Table 9. Percent released at selected pH values with a temperature of 57ºC, flow rate of
16mL/minute, and 0.05M KH2PO4 as the media.
Time(hrs) 37ºC 47ºC 57ºC
.5 8% 52% 76%
1 40% 92% 92%
1.5 54% ---- ----
2 85% ---- ----
2.5 ---- ---- ----
3 ---- ---- ----
Table 10. Percent released at selected temperature values with a pH of 12, flow rate of
4mL/minute, and 0.05M NaOH as the media.

61
Time(hrs) 37ºC 47ºC 57ºC
.5 21% 43% 68%
1 56% 87% 97%
1.5 80% ---- ----
2 ---- ---- ----
2.5 ---- ---- ----
3 ---- ---- ----
Table 11. Percent released at selected temperature values with a pH of 12, flow rate of
8mL/minute, and 0.05M NaOH as the media.
Time(hrs) 37ºC 47ºC 57ºC
.5 46% 64% 92%
1 84% 96% ----
1.5 ---- ---- ----
2 ---- ---- ----
2.5 ---- ---- ----
3 ---- ---- ----
Table 12. Percent released at selected temperature values with a pH of 12, flow rate of
16mL/minute, and 0.05M NaOH as the media.

62
Time(hrs) pH=1.2 (0.1%SLS)
pH=7.6 (0.1%SLS)
pH=7.6
05 2% 9% 5%
1 5% 18% 18%
1.5 8% 33% 24%
2 11% 47% 35%
2.5 15% 55% 44%
3 17% 66% 54%
Table 13. Percent released at selected pH values with a temperature of 37ºC, flow rate of 8mL/minute, and 0.05M KH2PO4 with the addition of 0.1% sodium lauryl sulfate as the
media.
Time(hrs) 37ºC 47ºC 57ºC
.5 19% 104% 106%
1 92% ---- ----
1.5 ---- ---- ----
2 ---- ---- ----
2.5 ---- ---- ----
3 ---- ---- ----
Table 14. Percent released at selected temperature values with a flow rate of
8mL/minute, and 1L of methanol as the media.


