
Indian Journal of Commerce & Management Studies ISSN: 2249-0310 EISSN: 2229-5674
Volume VIII Issue 3, September 2017 77 www.scholarshub.net
Introduction:
Gujarat offers holistic medicinal services and cost
effective treatment. Market for tertiary care is
expected to grow at a faster rate due to rise in income
levels, increasing adoption of health insurance and rise
in complex in-patient ailments (heart diseases, kidney
ailments, cancer). Upcoming trends in Gujarat state
like increasing rate of medical tourism clinical
research activities, public private partnership and
medical equipment market also boost growth of health
care sectors in Gujarat state. This ever increasing
growth rate put pressure on hospital to measure and
continuously improves health care service quality.1
Researchers are having opinion that service quality
plays an important role in achieving higher patronage,
1 Industries commisionerate, Government of Gujarat (2014).
Healthcare. Gujarat: iNDEXTb.
competitive advantage, sustained profitability (Brown,
S. W. and Swartz, T. A., 1989; Headly, D. E. and
Miller, S. J., 1993), corporate marketing, enhancing
financial performance (Buttle, F., 1996). There is
direct link between service quality and increased
market share, profit and saving. (Devlin, S. J. and
Dong, H. K., 1994). The ‘Gap Model’ of service
quality was propounded by Parsuraman, A. et al.
(1985) to measure service quality gap. As shown in
figure 1, model identified following five service
quality gaps. These gaps can be major obstacles to
deliver a high quality service.
Gap 1: Consumer expectation- Management
perception gap
Gap 2: Management perception- Service quality
specification gap
Gap 3: Service quality specification- Service delivery gap
Gap 4: Service delivery –External communication gap
DOI: 10.18843/ijcms/v8i3/10
DOI URL: http://dx.doi.org/10.18843/ijcms/v8i3/10
AN EMPIRICAL STUDY ON INTEGRATION OF SERVQUAL
AND KANO MODEL FOR MEASURING SERVICE QUALITY
OF HOSPITALS IN AHMEDABAD
Ms. Nikita Patel,
Ph. D Research Scholar,
Ganpat University, Ganpat Vidyanagar,
Mehsana – Gozaria Highway, Kherva,
Gujarat, India.
Dr. Nishith Kumar H. Bhatt,
Associate Professor,
S. K. School of Business Management,
Hemchandracharya North Gujarat
University, Patan, Gujarat, India
ABSTRACT
To survive in this competitive market and to achieve competitive advantage, hospital should
continuously measure and improve their service quality which leads to patient satisfaction. Lot of
research has been carried out to measure service quality through SERVQUAL or modified SERVQUAL
scale. But Literature has explored that SERVQUAL cannot directly relate performance with satisfaction
level because it assumes a linear relationship between customer satisfaction and service attribute
performance. But the factors that cause dissatisfaction are different from the factors that cause
satisfaction. Kano Model can be used to classify service quality attribute based on satisfaction level.
This research paper will emphasis on integration of SERVQUAL and Kano model to measure service
quality of Private Multispecialty Hospitals in Ahmedabad, Gujarat to find out the major areas for
improvement as per the service quality is concerned. Research has identified high service quality gap
for the dimensions reliability, responsiveness, assurance and empathy on the other hand tangibility
shown least service quality gap. Service quality gap was observed in Must be service quality attributes
that shown that hospitals are lacking in proving basic services too. To satisfy patients, Private
Multispecialty Hospitals in Ahmedabad should focus more on improving service quality.
Keywords: Hospital Service Quality, SERVQUAL, Kano Model.

Indian Journal of Commerce & Management Studies ISSN: 2249-0310 EISSN: 2229-5674
Volume VIII Issue 3, September 2017 78 www.scholarshub.net
These four gaps cause a fifth gap that is Gap 5.
Gap5 = f (Gap1, Gap2, Gap3, Gap4)
Gap 5: Expected Services-Perceived Services gap
Parsuraman, A. et al. (1988) developed SERVQUAL
scale based on five service quality dimensions
Tangibility- Infrastructural aspects of services and
aesthetic of personnel, Reliability- Ability to execute
services as per the promise, Responsiveness-
Eagerness to help customers and providing fast
service, Assurance- Trust and confidence generating
ability of knowledgeable and courteous employees
and Empathy- Trust and confidence generating ability
of knowledgeable and courteous employees.
SERVQUAL is concise multi item scale (22 item
scale) with good reliability and validity. It is widely
adopted approach to measure service quality in both
manufacturing and service industry. When necessary
it can be modified or supplemented to fit the
characteristics of particular service (Parsuraman, A. et
al., 1988). This instrument was administered twice to
measure expectation and perceptions for each of the
five service quality dimensions using seven-point
Likert scale ranging from 1 (strongly disagree) to 7
(strongly agree). SERVQUAL is extensively adopted
in both private and public service sectors such as
retailing, healthcare, education, tourism and
hospitality, financial services, B2B, real estate and
government as well (Buttle, F., 1996). SERVQUAL
provides better understanding about current service
quality trends if applied periodically (Parsuraman, A.
et al., 1988; Tan, K. C. and Pawitra, T. A., 2001).
Areas of excellence and improvement can be
identified and priorities through service gap using
SERVQUAL. This provides basis for formulating
strategy and tactics (Tan, K. C. and Pawitra, T. A.,
2001). SERVQUAL assumes a linear relationship
between customer satisfaction and service attribute
performance but it is not necessary that paying more
attention to a particular service attribute may always
lead to higher customer satisfaction (Tan, K. C. and
Pawitra, T. A., 2001) because the factors that cause
dissatisfaction are different from the factors that cause
satisfaction (Herzberg et al., 1959). This limitation of
SERVQUAL can be overcome using integration of
SERVQUAL and Kano Model.
Kano Model - Theory of Attractive Quality
Dr. Noriaki Kano of Tokyo Rika University and his
colleagues from Japan in 1984(Kano et al., 1984)
developed Kano Model to categorise the attributes of a
product or service, based on how well products or
services are able to satisfy customers’ need (Berger et
al., 1993; Witell, L. and Lofgren, M., 2007; Chen, Y.
H. and Su, C. T., 2006). This model was developed
on the basis Herzberg’s ‘Motivator-Hygiene Theory-
M-H Theory’ (Herzberg et al., 1959; 1966). This
model is also known as ‘Kano’s theory of attractive
quality’ (Kano et al., 1984). Professor Kano proposed
that sometimes quality attributes may reveal non-
linear and two dimensional relationship with customer
satisfaction (Kano, N. et al., 1984; Birdogan, B. et al.,
2009; Witell, L. and Lofgren, M., 2007). Kano’s
model has been applied in quality management,
product development, strategic management and
employee management, business planning and service
management (Witell, L. and Lofgren, M., 2007). In
service sector, Kano model has been applied to
investigate various services such as superstores (Ting,
S. C. and Chen, C. N., 2002), web page design (Tan
K.C. et al., 1999), health-care services (Jane ´, A. C.
and Domı ´nguez, S. M., 2003), financial services
(Bhattacharyya, S. K. and Rahman, Z., 2004), and
electronic services (Fundin, A. and Nilsson, L., 2003).
As shown in the figure 2, Horizontal axis in the Kano
diagram express the physical sufficiency of an quality
attribute and the vertical axis express the satisfaction
with an quality attribute (Kano, N. et al., 1984).
Quality attributes were classified in five Categories:
“Attractive Quality”, “One-Dimensional Quality”,
“Must-be Quality”, “Indifferent Quality” and
“Reverse Quality” (Witell, L. and Lofgren, M., 2007).
‘Attractive Quality Attribute’- Surprise and delight
attributes (Kano, N. et al., 1984). When this
quality attributes achieved fully, customer
satisfaction increases super linearity with
increasing service attribute performance. However,
there is no corresponding decrease in customer
satisfaction with decrease in performance (Kano,
N. et al. 1984, Tan, K. C. and Pawitra, T. A., 2001;
Witell, L. and Lofgren, M., 2007). If these
attributes delivered properly they lead to
satisfaction. These are neither demanded nor
normally expected so they are sufficient, but not a
necessary condition for satisfaction (Kano, N. et
al., 2001; Lilja, J. and Wiklund, H., 2006;
Busacca, B. and Padula, G., 2005; Birdogan, B. et
al., 2009). To get competitive advantage and
attract competitors’ customer, ‘Attractive attribute’
works an element for an aggressive marketing
strategy (Birdogan, B. et al., 2009).
‘One-Dimensional Quality Attribute’: They lead to
satisfaction when fulfilled and result in
dissatisfaction when not fulfilled (Kano, N. et al.,
1984; Witell, L. and Lofgren, M., 2007). It explains
linear relationship between service attributes and
customer satisfaction (Shen, X. X. et al., 2000).
These are called spoken needs (Gustafsson, A.,
1998) and so they are both a necessary and
sufficient condition for customer satisfaction
(Busacca, B. and Padula, G., 2005).
‘Must-be Quality Attribute’: Customer satisfaction
does not increase above neutral level even if these
attributes fulfilled fully (Tan, K. C. and Pawitra, T.
A., 2001) but result in dissatisfaction when not
fulfilled (Kano, N. et al., 1984).
‘Indifferent Quality Attribute’: These attributes are
neither good nor bad; they do not result in either

Indian Journal of Commerce & Management Studies ISSN: 2249-0310 EISSN: 2229-5674
Volume VIII Issue 3, September 2017 79 www.scholarshub.net
satisfaction or dissatisfaction (Kano, N. et al., 1984;
Witell, L. and Lofgren, M., 2007).
‘Reverse Quality Attribute’: If these attributes
achieved fully, they results in dissatisfaction and vice
versa; if not achieved fully results in satisfaction. The
reason behind this is not all customers are alike (Kano,
N. et al., 1984; Gustafsson, A., 1998; Witell, L. and
Lofgren, M., 2007).
Model also proposes that over the time an attribute
changes from being ‘Indifferent’, to ‘Attractive’, to
‘One-Dimensional’, and, finally, to being a ‘Must-be’
item so timely and continual development
/improvement and introduction of products or services
with innovative and novel attributes are important to
get competitive advantage (Shen, X. X. et al., 2000;
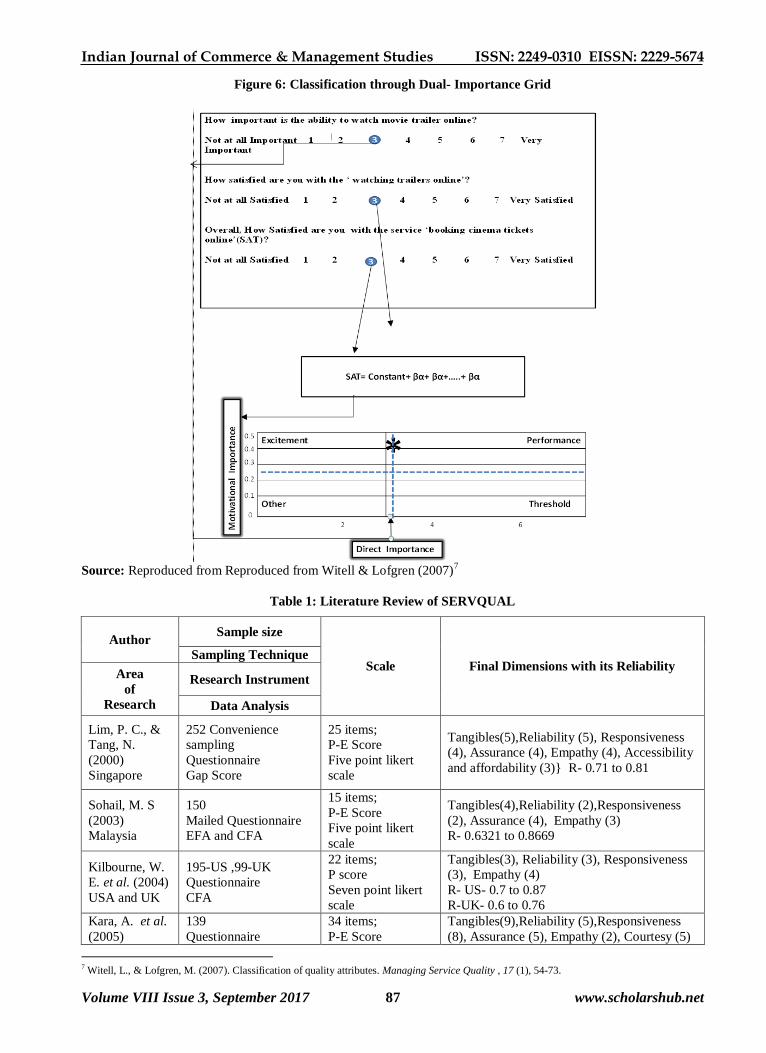
Tan, K. C. and Pawitra, T. A., 2001). Figure 3, 4, 5
and 6 explains four different approaches for
classification of quality attributes like ‘Five level
Kano Questionnaire’, ‘Three level Kano
Questionnaire’, ‘Classification through Direct
Question’ and ‘Classification through Dual-
Importance Grid’ (Witell, L. and Lofgren, M., 2007).
Literature Review:
Healthcare is a typical service that people need but do
not necessarily wish for it (Berry, L. L. and
Bengdapudi, N., 2007). According to Andaleeb, S. S.
(2001), Health care is one of the fastest growing
sectors in the service economy due to an aging
population, mounting competitive pressures (Pai, Y. P.
and Chary, S. T., 2013), increasing consumerism,
emerging treatments and technologies (Ludwig-
Beymer, P. et al., 1993; O’Connor et al., 2000).
Patients and their family must be recognised as
consumers in healthcare thus to offer them new
products and services, a thorough understanding of
their needs and expectations is significantly important
(Pai, Y. P. and Chary, S. T., 2013). Translating the
patient’s view into actual service offering is one of the
ways to make healthcare services more responsive to
people’s need (Rao, K. D. et al., 2006). Globally there
is a shift towards the private sector from the
traditional charity state-run system in the delivery of
health services (Marchand, M. and Schroyen, F.,
2005). Various studies had been carried out in health
care sector to measure service quality through
SERVQUAL or modified SERVQUAL (Pai, Y. P. and
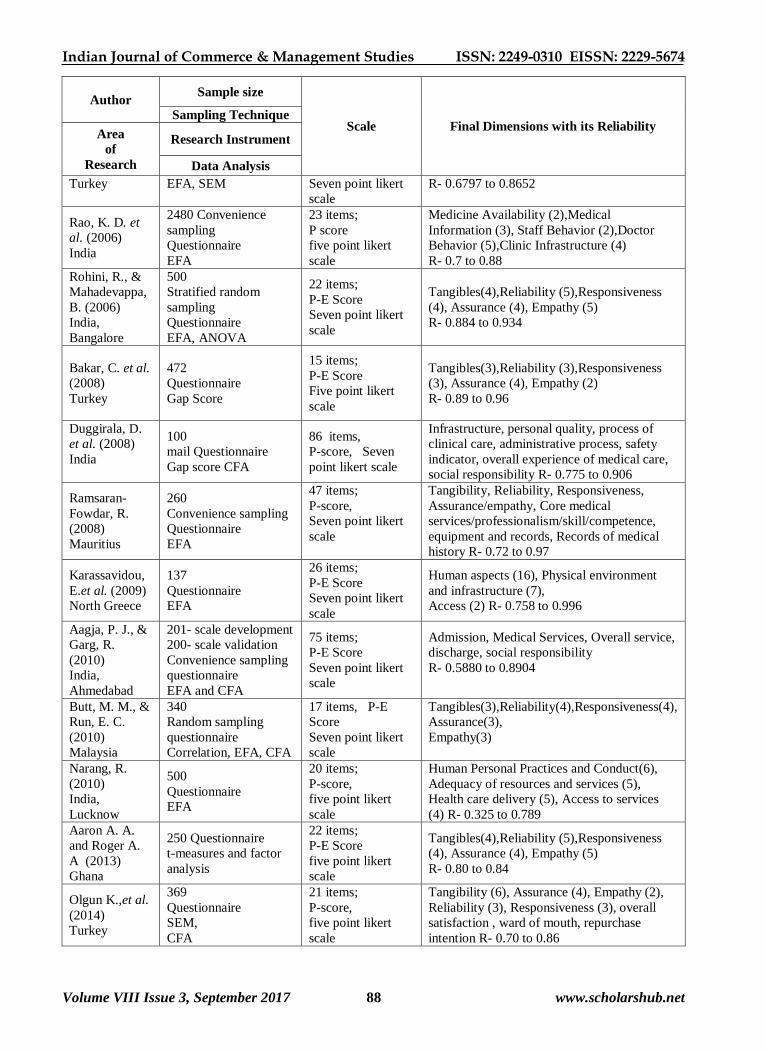
Chary, S. T., 2013). Table 1 show major studies
recently conducted in health care sector. SERVQUAL
can be improved by integrating it with Kano Model. In
the service industry Kano model has also been applied
successfully alone or in integration with other
approaches for investigating various services as Tv’s
and table Clocks (Kano, N. et al., 1984), Skis
(Matzler, K. et al.,1996; Matzler, K. and Hinterhuber,
H. H., 1998), Web pages (Tan, K. C. et al.,1999),
Television (Kano, N., 2001), Tourism (Tan, K. C. and
Pawitra, T. A., 2001; Pawitra, T. A. and Tan, K. C.,
2003), Education (Emery, C. R. and Tian, R. G.,
2002; Hogstrom, C. et al., 2010), Financial services
(Bhattacharyya, S. K. and Rahman, Z., 2004),
Logistics services (Birdogan, B. et al., 2009) and
health care services (Cardero-Ampiero, J. et al., 2012;
Sulisworo, D. et al.,2012; Momani, A. et al.,2014). It
has been also applied in conjunction with
SERVQUAL (Bhattacharyya, S. K. and Rahman, Z.
2004 ; Tan, K. C. and Pawitra, T. A., 2001; Pawitra,
T. A. and Tan, K. C., 2003; Birdogan, B. et al., 2009).
Few researches had been conducted to further improve
SERVQUAL by integrating it with Kano Model as
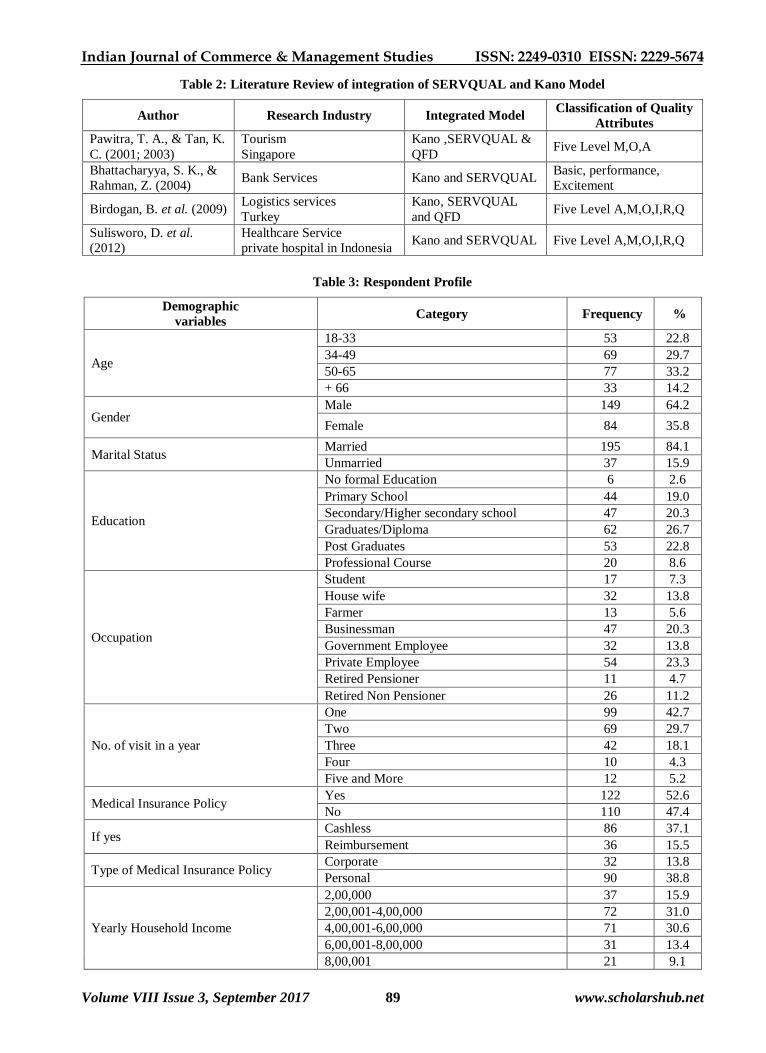
mentioned in Table 2.
Research Gap:
It is of utmost importance for hospitals to concern
about health care service quality provided by them. To
provide best service, hospitals should continuously
measure the voice of patients regarding service
provided by them and their satisfaction towards the
services. Increasing rate of medical tourism, rise in
infectious and chronic degenerative diseases and
lifestyle-related diseases has put pressure on
healthcare service provider to get NABH or NABL
accreditation as a basic requirement to become world
class. Moreover to imbibe the best global practices in
the value chain, there is a moral pressure on health
care service providers to provide seamless patient care
of highest quality in Gujarat state. To provide
seamless patient care and compete in this competitive
environment hospital should continuously measure
and improve of service quality. Hospitals can measure
their own service quality using SERVQUAL. But
there is scope for improvement in SERVQUAL by
integrating it with Kano model to achieve excellent
service quality. Integrated model will help hospitals to
relate service quality gap about and satisfaction level.
Lots of research has been carried out to measure
service quality of hospitals through SERVQUAL or
modified SERVQUAL scale. Lack of literature is
observed in the area of integration of SERVQUAL
and Kano model in Healthcare sector.
Research Methodology:
Objective of this research was to measure service
quality of Private Multispecialty Hospitals of
Ahmedabad, Gujarat, India and to classify service
quality attributes using Kano model to relate service
quality attributes performance and customer
satisfaction. This research began with exploratory
research design as its immediate purpose was to explore
service quality attributes for further research. For
making the study conclusive after exploratory research,
descriptive research design-single cross sectional design
was used. Both secondary and primary data were
collected in this study. Secondary data was collected
from books, magazines, journals, newspaper, published
Indian Journal of Commerce & Management Studies ISSN: 2249-0310 EISSN: 2229-5674
Volume VIII Issue 3, September 2017 80 www.scholarshub.net
report like economic survey and other government
published data and computerized data base like SSRN,
Proquest and Emerald. For collecting primary data to
achieve research objective, patients were surveyed
based on structured questionnaire in Ahmedabad,
Gujarat. Target population was patients who were
benefiting (continuously being administered at least for
three days) / had benefited (within last three months and
administered at least for three days) from the service of
Private Multispecialty Hospitals. There are
approximately 53 Private Multispecialty Hospitals in
Ahmedabad. Survey of Total 232 patients from 22
hospitals of Ahmedabad were conducted using non-
probability convenience sampling technique. The data
collected from the survey was analyzed through
reliability statistics, descriptive statistic, paired sample
t-test and three levels kano classification for service
quality attributes. Total 50 service quality attributes
were found out based on literature review to design a
questionnaire. Following two research scale were used.
1. Kano three Level Questionnaire approach was used
to classify service quality attributes based on
following two scales.
Feeling if service quality attribute available: S-
Satisfied, N- Neutral, D- Dissatisfied
Feeling if service quality attribute not available: S-
Satisfied, N- Neutral, D- Dissatisfied
2. SERVQUAL scale as proposed by Parasuraman, A.
et al. (1988) was adapted and modified in this research
to develop structured questionnaire based on five
service quality dimensions Tangibility, Reliability,
Responsiveness, Assurance and Empathy. Five point
likert scale was used to measure expectation and
perception of patient’s about service quality attributes.
Once the questionnaire was constructed, a small pilot
study was conducted among 50 respondents bearing
the same demographic profile as the final sample of
the study. Their feedback and comments are
incorporated in the study.
Findings and Discussion:
Respondent’s Profile: Table 3 explains detail respondent
profile.
Reliability of scale: Reliability analysis allows a
researcher to determine the extent to which a scale
produces consistent results, if the measurements are
repeated. Cronbach's alpha is a statistic used to determine
the internal consistency. As shown in Table 4 Cronbach's
alpha for all five dimensions of four different measure of
patient’s questionnaire were greater than 0.7 indicating
that the construct was reliable.
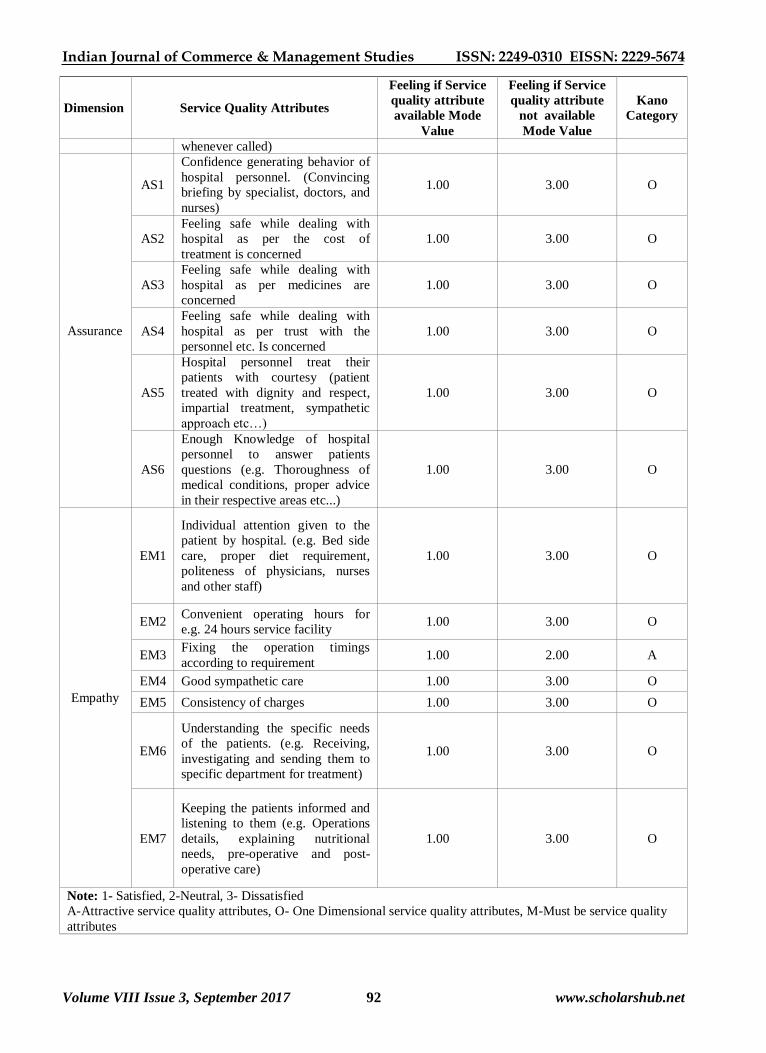
Kano classification: As shown in Table 5 service
quality attributes were classified on the basis of three
level Kano questionnaire using mode value. Table 5
shows classification of total 50 service quality
attributes in different Kano category. From total 50
service quality attributes 13 service attributes were
classified as ‘Must be’ category, 34 service attributes
were classified as ‘One dimensional’ category and 3
service attributes were classified as ‘Attractive’
category.
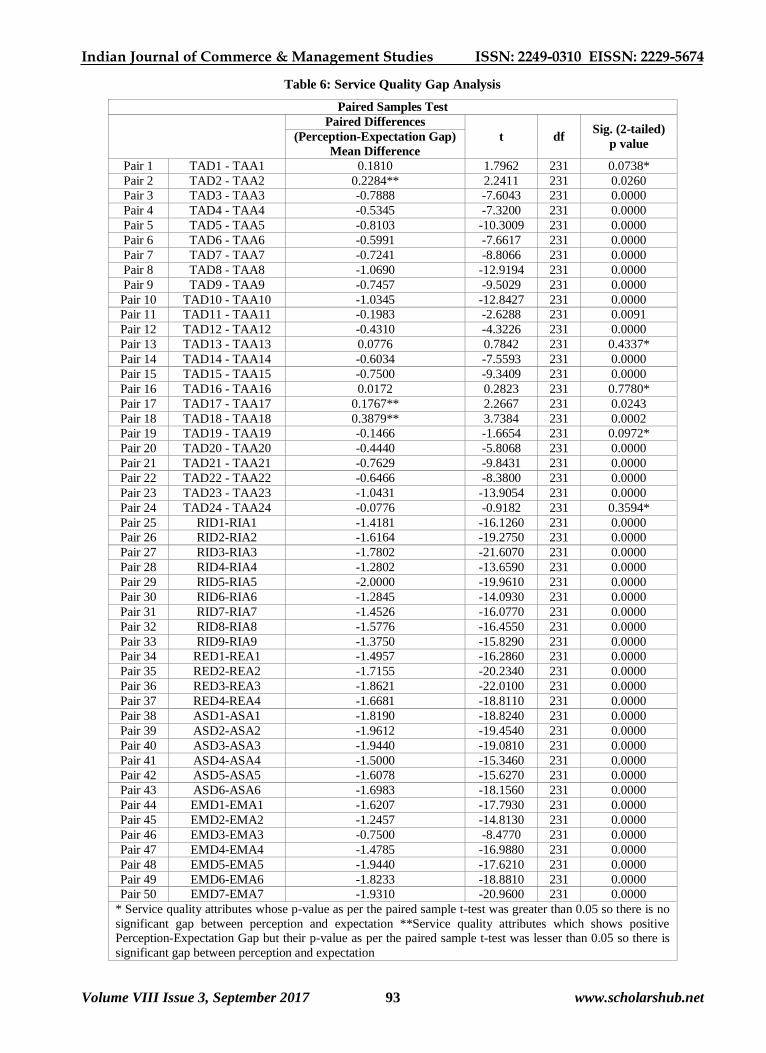
Gap analysis: Paired sample t-test was carried out to
find out P-E gap for each service quality attribute. As
per the table 6 there is no significant P-E gap was
observed for five Service quality attributes ‘uniform
/professional appearance of staff’ , ‘laundry facilities
available within the premises’, ‘clean drinking water’,
‘well furnished/decorated/ventilated/clean wards’ and
‘adequate, comfortable and clean bathrooms and
toilets’ because their p-value as per the paired sample
t-test was greater than 0.05. As per the paired sample
t-test, p-value of rest of other service quality attributes
was less than 0.05 which shows significant P-E gap,
so hospital should try to overcome this service quality
gap. As per Table 7 P-E gap was observed for all five
service quality dimensions. Tangibility shows least
gap which proves that Private Multispecialty Hospital
of Ahmedabad are good at tangibility aspects but these
tangibility aspects cannot be ignored as some of the
service quality attributes related to tangibility aspects
are falling in ‘Must be’ category. Research found that
hospitals are lacking in providing other four service
quality dimensions like reliability, responsiveness,
assurance and empathy. Highest service quality gap
was observed for assurance aspect of hospital service.
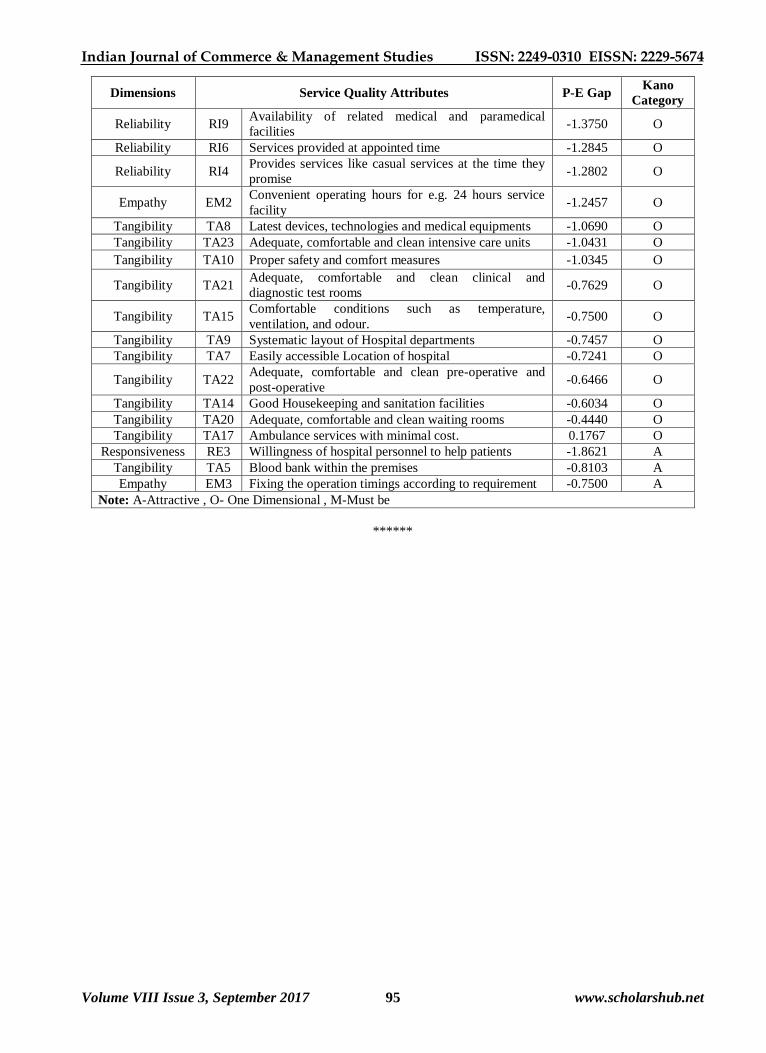
Integration of SERVQUAL and Kano model: Table
8 shows integration of SERVQUAL and Kano model
for service quality attribute which shows significant P-
E gap. The table shows the P-E gap with its
classification in Kano category.
‘Attractive service quality attribute’ which shows
highest service quality gap was ‘Willingness of
hospital personnel to help patients (Responsiveness) ’.
‘Blood bank within the premises (Tangibility)’ and
‘Fixing operation timings according to requirement
(Empathy)’ also shows service quality gap in this
category. These service quality attribute create delight
for patient. When above mentioned attractive quality
attribute are fully provided by Private Multispecialty
Hospital, patient satisfaction increases super linearly
with increasing service quality attribute performance.
There is, however, no corresponding decrease in
patient satisfaction with decrease in such service
quality attribute performance. These service quality
attributes are neither demanded nor normally
expected, but when properly delivered, they bring
satisfaction. So they are desirable, but not a necessary
condition for satisfaction. To achieve competitive
advantage, Attractive service quality attribute can be
used as an element of an aggressive marketing
strategy by private multispecialty hospital.
‘Must be service quality attribute’ are taken for
granted when fulfilled but result in dissatisfaction
when not provided by private multispecialty hospital.
However patient satisfaction does not increase above
neutral level even if these service qualities attributes
Indian Journal of Commerce & Management Studies ISSN: 2249-0310 EISSN: 2229-5674
Volume VIII Issue 3, September 2017 81 www.scholarshub.net
are provided fully. These service quality attributes are
generally expected by patients’ and they view them as
basic, so it is possible that they are not going to tell
hospital about these service quality attributes when
asked about their expected quality attribute. Thus it is
compulsory for every Private Multispecialty Hospital
in Ahmedabad to fulfill ‘Must be’ services in their
organisation. ‘Must be service quality attribute’ which
shows highest service quality gap were ‘Provide all
the required information and instructions regarding
admission, Treatment, and discharge clearly to
patients and attendants (Reliability)’, ‘Error free and
fast retrieval of documents (Reliability) ’, ‘Fast and
Computerized registration and billing procedures
(Tangibility)’ , ‘Pharmacy within the premises
(Tangibility)’, ‘Pathology laboratory and or imaging
centre within the premises (Tangibility)’ , ‘Canteen
with hygienic food (Tangibility)’, ‘Continuous
electricity and water supply (Tangibility)’ , ‘Staff with
appropriate name badges (Tangibility)’ and
‘Promotional information material (Tangibility)’.
Service quality attributes having Tangibility service
aspects observed least service quality gap but as they
are classified as ‘Must be’ category each and every
hospital must have these attributes.
All the service quality attributes other than above
mentioned ‘Attractive’ and ‘Must be’ service quality
attributes were classified in ‘One Dimensional’
category. These service quality attribute result in
satisfaction when fulfilled and result in dissatisfaction
when not fulfilled. There is a linear relationship
between service quality attribute and patient
satisfaction. They are explicit and are ones with which
hospitals can compete and so they are both a necessity
as well as a primary condition for patient satisfaction.
‘One dimensional’ service quality attribute which
observed highest service quality gap was ‘Doing
correct diagnosis right at the first time (Reliability)’; ‘
Feeling safe regarding cost of treatment and medicines
(Assurance)’; ‘Consistency of charges (Empathy)’;
‘Keeping the patients informed and listening to them
(Empathy)’ and ‘Understanding the specific needs of
the patients (Empathy)’. As this service attributes are
more important and leads to dissatisfaction of patient
if not delivered, hospitals should try to improve
quality of these service attributes on continuous basis.
‘One dimensional service quality attribute' having
tangibility aspects observed least service quality gap
which shows that most of the hospital are
satisfactorily performing in this aspects.
Conclusion:
This study puts forward that patients define hospital
service quality in terms of five service quality
dimensions like Tangibility, Reliability, Responsiveness,
Assurance and Empathy. Through this study
SERVQUAL appears to be a consistent and reliable
instrument to measure and find out areas for attention to
improve service quality of Private Multispecialty
Hospital in Ahmedabad city. The negative SERVQUAL
Gap between perception and expectation across all the
dimensions clearly shows that there is an opportunity for
improving service quality in Private Multispecialty
Hospital in Ahmedabad city. Highest service quality gap
was observed for the aspect Assurance while the least
gap was observed for dimension Tangibility which
indicates that most of the Private Multispecialty
Hospitals in Ahmedabad city are performing
satisfactorily on Tangibility aspect and not providing
satisfactory service for the services related to assurance
aspect. While framing strategy, Private Multispecialty
Hospital of Ahmedabad should focus more on ‘Attractive
service quality attribute’ to achieve competitive
advantage. It is compulsory for each and every hospital
to provide highest quality of services which are classified
as ‘Must be’ category because these are the basic need of
Patients. As service quality gap was observed for all one
dimensional service quality attributes, hospitals should
try to continuously improve these service quality
attributes to increase the satisfaction level of patient and
reduce the gap between perception and expectation.
References:
Aagja, P. J., & Garg, R. (2010). Measuring perceived
service quality for public hospitals
(PubHosQual) in the India Context.
International Journal of Pharmaceutical and
Healthcare Marketing, 4 (1), 60-83.
Aaron A. Abuosi & Roger A. Atinga. (2013). Service
quality in health care institutions: establishing
the gaps for policy action. International
Journal of Health Care Quality Assurance, 26
(5), 481-492.
Andaleeb, S. S. (2001). Service quality perception and
patient satisfaction: a study of hospitals in a
developing country. Social Science and
Medicine, 52 (9), 1359-1370.
Bakar, C., Akgun, H. S., & Assaf, A. (2008). The Role
of role expectations in patients’ hospital
assessments: a Turkish university hospital
example. International Journal of Health care
Quality Assurance, 21 (5), 503-516.
Bedi,K.(2009). Production and Operations Management.
New Delhi: Oxford University Press.
Berger, C., Blauth, R., Boger, D., Bolster, C.,
Burchill, G., DuMouchel, W., et al. (1993).
Kano's method for understanding customer-
defined quality. The centre for quality
management Journal, 2 (4), 2-36.
Berry, L. L., & Bengdapudi, N. (2007). Health care: a
fertile field for service research. Journal of
Service Research, 10 (2), 111-122.
Bhattacharyya, S. K., & Rahman, Z. (2004). Capturing
the customer’s voice, the centerpiece of
strategy making: a case study in banking.
European Business Review, 16 (2), 128-38.

Indian Journal of Commerce & Management Studies ISSN: 2249-0310 EISSN: 2229-5674
Volume VIII Issue 3, September 2017 82 www.scholarshub.net
Birdogan, B., Cigdem, S. B., Zuhal, C., & Ilker, M. A.
(2009). An application of integrating
SERQUAL and Kano's model into QFD for
logistics services: A case study from Turkey.
Asia Pacific Journal of Marketing and
logistics, 21 (1), 106-126.
Brown, S. W., & Swartz, T. A. (1989). A gap analysis
of professional service quality. Journal of
Marketing, 53, 92-98.
Busacca, B., & Padula, G. (2005). Understanding the
relationship between attribute performance
and overall satisfaction: theory,measurment
and implications. Marketing Intelligence and
Planning , 23 (6), 543-61.
Butt, M. M., & Run, E. C. (2010). Private healthcare
quality: Applying a SERVQUAL model.
International Journal of Healthcare Quality
Assurance, 23 (7), 658-673.
Buttle, F. (1996). SERVQUAL: review, critique and
research agenda. European Journal of
Marketing, 30 (1), 8-32.
Cardero-Ampiero, J., Darder, A., Santillana, J., Caloto,
M. T., & Nocea, G. (2012). Evaluation of
patients' and physician's expectation and
attributes of Osteoarthritis treatment using Kano
methodoly. Qual Life Res, 21, 1391-1404.
Chen, Y. H., & Su, C. T. (2006). A Kano-CKM model
for customer knowledge discovery. Total
Quality Management, 17 (5), 589-608.
Devlin, S. J., & Dong, H. K. (1994). Service Quality
from Customer's Perspectives. Marketing
Research, 6 (1), 5-13.
Duggirala, D., Rajendran, C., & Anantharaman, R. N.
(2008). Patient perceived dimensions of total
quality service in healthcare. Benchmarking:
An International Journal, 15 (5), 560-583.
Emery, C. R., & Tian, R. G. (2002). Schoolwork as
products, professors as customers: a practical
teaching approach in business education. Journal
of Education for Business, 78 (2), 97-102.
Fundin, A., & Nilsson, L. (2003). Using Kano's theory
of attractive quality to better understand
customer experience with e-services. Asian
Journal on quality , 4 (2), 32-49.
Gustafsson, A. (1998). QFD – Va¨gen till no¨jdare
kunder i teori och praktik (in Swedish),
Studentlitteratur, Lund.
Headly, D. E., & Miller, S. J. (1993). Measuring
service quality and its relationship to future
consumer behavior. Journal of Healthcare
Marketing, 13 (4), 32-40.
Herzberg, F., Bernard, M. and Snyderman, B. (1959).
The Motivation to Work. Wiley, New York, NY.
Herzberg, F. (1966). Work and the Nature of Man.
World Publishing Co., Cleveland, OH.
Hogstrom, C., Rosner, M., & Gustafsson, A. (2010).
How to create attractive and unique customer
experiences: An Application of Kano's theory
of attractive quality to recreational tourism.
Marketing Intelligence and Planning, 28 (4),
385-402.
Industries commisionerate, Government of Gujarat
(2014). Healthcare. Gujarat: iNDEXTb.
Jane´, A. C., & Domı´nguez, S. M. (2003). Citizens'
role in health care services: satisfaction
behavior: Kano's model,Part 1. Quality
Management in Health Care , 12 (1), 64-71.
Kano, N. (2001). Life cycle and creation of attractive
quality. 4th International QMOD (Quality
Management and Organisational
Development) Conference, Linko¨ping
University, Linko¨ping.
Kano, N., Seraku, N., Takahashi, F. & Tsjui, S.
(1984). Attractive quality and must-be quality.
Hinshitsu, Vol. 14 No. 2, pp. 147-56.
Kara, A., Lonial, S., Tarim, M., & Zaim, S. (2005). A
Paradox of service quality in Turkey.
European Business Review, 17 (1), 5- 20.
Karassavidou, E., Glaveli, N., & Papadopoulos, C. T.
(2009). Quality in NHS Hospitals: no one
knows better than patients. Measuring
Business Excellence, 13 (1), 34-46.
Kilbourne, W. E., Duffy, M., Giarchi, G., & Duffy, J.
A. (2004). The applicability of SERVQUAL
in cross national measurements of Health care
Quality. Journal of Service marketing, 18 (7),
524-533.
Lilja, J., & Wiklund, H. (2006). Obstacles to the
creation of attractive quality. The TQM
Magazine , 18 (1), 55-66.
Lim, P. C., & Tang, N. (2000). A study of patients'
expectation and satisfaction in Singapore
hospitals. International Journal of Health care
Quality Assurance, 13 (7), 290-299.
Ludwig-Beymer, p., Ryan, C. J., Johnson, N. J.,
Hennessy, K. A., Gattuso, M. C., Epsom, R.,
et al. Using patient perceptions to improve
quality care. Journal of Nursing Care Quality,
7 (2), 42-51.
Marchand, M., & Schroyen, F. (2005). Can a mixed
health care system be desirable on equity
grounds?. Scandinavian Journal of Economics
, 107 (1), 1-23.
Matzler, K., & Hinterhuber, H. H. (1998). How to
make product development projects more
successful by integrating Kano's model of
customer satisfaction in to quality function
deployment. Technovation , 18 (1), 25-38.
Matzler, K., Hinterhuber, H. H., Bailom, F., &
Sauerwein, E. (1996). How to delight your
customers. Journal of Product and Brand
Management, 5 (2), 6-18.
Momani, A., Al-Hawari, T., Al-Shebami, H., & Al-
Araildah, O. (2014). Classifying and Ranking
Healthcare Quality Attributes Using integrated
Indian Journal of Commerce & Management Studies ISSN: 2249-0310 EISSN: 2229-5674
Volume VIII Issue 3, September 2017 83 www.scholarshub.net
Kano-Fuzzy Analytical Hierarchy process.
Engineering Management Research, 3 (1), 68-88.
Narang, R. (2010). Measuring perceived quality of
health care services in India. International
Journal of Health Care Quality Assurance, 23
(2), 171-186.
O'Connor, S. J., Trinh, H. Q., & Shewchuk, R. M.
(2000). Perceptual gaps in understanding
patient expectation for health care service
quality. Health care management Review, 25
(2), 7-23.
Olgun K.,Ceylan A., & İbrahim T. D.(2014) . The
Impact of Service Quality Dimensions on
Patient Satisfaction, Repurchase Intentions
and Word-of-Mouth Communication in the
Public Healthcare Industry. 2nd International
Conference on Strategic Innovative
Marketing, 148, 161 – 169.
Pai, Y. P., & Chary, S. T. (2013). Dimensions of
hospital service quality: a critical review.
International Journal of Health Care Quality
Assurance, 26 (4), 308-340.
Parasuraman, A., Zeithaml, V., & Berry, L. (1985). A
Conceptual model of service quality and its
implications for future research. Journal of
Marketing , 49 (1), 41-50.
Parasuraman, A., Zeithaml, V., & Berry, L. (1988).
SERVQUAL: a multi item scale for measuring
customer perception of service quality.
Journal of Retailing, 64 (1), 12-37.
Pawitra, T. A., & Tan, K. C. (2003). Tourist
satisfaction in Singapore- a perspective from
Indonesian perspective. European Journal of
Innovation Management, 13 (5), 399-411.
Ramsaran-Fowdar, R. (2008). The relative importance
of service dimensions in a healthcare settings.
International Journal of Healthcare Quality
Assurance, 21 (1), 104-124.
Rao, K. D., Peters, D. H., & Bandeen-Rochen, K.
(2006). Towards patient centered health
services in India- a scale to measure patient
perception of quality. International Journal
for Quality in Health Care, 18 (6), 414-421.
Rohini, R., & Mahadevappa, B. (2006). Service Quality
in Bangalore hospitals- an empirical study.
Journal of Service Research, 6 (1), 59-85.
Shen, X. X., Tan, K. C., & Xie, M. (2000).
Benchmarking in QFD for Quality
improvement. An International Journal , 7 (4),
282-291.
Sohail, M. S. (2003). Service quality in hospitals:
more favorable than you might think.
Managing Service Quality, 13 (3), 197-207.
Sulisworo, D., Elizabeth, N., & Maniquiz, F. (2012).
Integrating Kano’s Model and SERVQUAL to
Improve Healthcare service quality. IC-
GWBT, 130-144.
Tan, K. C., & Pawitra, T. A. (2001). Integrating
SERVQUAL and Kano's model into QFD for
service excellence development. Managing
Service quality, 11 (6), 418-430.
Tan, K. C., Xie, M., & Shen, X. X. (1999).
Development of innovative products using
Kano's model and quality function
deployment. International Journal of
Innovation Management, 3 (3), 271-86.
Ting, S. C., & Chen, C. N. (2002). The asymmetrical
and non-linear effects of store quality
attributes on customer satisfaction. Total
Quality Management , 13 (4), 547-69.
Witell, L., & Lofgren, M. (2007). Classification of
quality attributes. Managing Service Quality,
17 (1), 54-73.

Indian Journal of Commerce & Management Studies ISSN: 2249-0310 EISSN: 2229-5674
Volume VIII Issue 3, September 2017 84 www.scholarshub.net
APPENDIX
Figure 1: The Gap Model
Source: Reproduced from Bedi (2011)2
Figure 2- The Kano Diagram
Source: Reproduced from Berger, C., et al. (1993)
3
Figure 3: Five Level Kano Questionnaire
2Bedi, K. (2011). Quality Management. New Delhi, India: Oxford University Press. 3 Berger, C., Blauth, R., Boger, D., Bolster, C., Burchill, G., DuMouchel, W., et al. (1993). "Kano's method for understanding customer-defined
quality". The centre for quality management Journal , 2 (4), 2-36.

Indian Journal of Commerce & Management Studies ISSN: 2249-0310 EISSN: 2229-5674
Volume VIII Issue 3, September 2017 85 www.scholarshub.net
Source: Reproduced from Witell and Lofgren (2007)
4
Figure 4: Classifications through Three Level Kano Questionnaire
4 Witell, L., & Lofgren, M. (2007). Classification of quality attributes. Managing Service Quality , 17 (1), 54-73.

Indian Journal of Commerce & Management Studies ISSN: 2249-0310 EISSN: 2229-5674
Volume VIII Issue 3, September 2017 86 www.scholarshub.net
Source: Reproduced from Witell and Lofgren (2007)5
Figure 5: Classifications through Direct Question
Source: Reproduced from Witell & Lofgren (2007)
6
5 Witell, L., & Lofgren, M. (2007). Classification of quality attributes. Managing Service Quality , 17 (1), 54-73. 6 Witell, L., & Lofgren, M. (2007). Classification of quality attributes. Managing Service Quality , 17 (1), 54-73.
Indian Journal of Commerce & Management Studies ISSN: 2249-0310 EISSN: 2229-5674
Volume VIII Issue 3, September 2017 87 www.scholarshub.net
Figure 6: Classification through Dual- Importance Grid
Source: Reproduced from Reproduced from Witell & Lofgren (2007)
7
Table 1: Literature Review of SERVQUAL
Author Sample size
Scale Final Dimensions with its Reliability Sampling Technique
Area
of
Research
Research Instrument
Data Analysis
Lim, P. C., &
Tang, N.
(2000)
Singapore
252 Convenience
sampling
Questionnaire
Gap Score
25 items;
P-E Score
Five point likert
scale
Tangibles(5),Reliability (5), Responsiveness
(4), Assurance (4), Empathy (4), Accessibility
and affordability (3)} R- 0.71 to 0.81
Sohail, M. S
(2003)
Malaysia
150
Mailed Questionnaire
EFA and CFA
15 items;
P-E Score
Five point likert
scale
Tangibles(4),Reliability (2),Responsiveness
(2), Assurance (4), Empathy (3)
R- 0.6321 to 0.8669
Kilbourne, W.
E. et al. (2004)
USA and UK
195-US ,99-UK
Questionnaire
CFA
22 items;
P score
Seven point likert
scale
Tangibles(3), Reliability (3), Responsiveness
(3), Empathy (4)
R- US- 0.7 to 0.87
R-UK- 0.6 to 0.76
Kara, A. et al.
(2005)
139
Questionnaire
34 items;
P-E Score
Tangibles(9),Reliability (5),Responsiveness
(8), Assurance (5), Empathy (2), Courtesy (5)
7 Witell, L., & Lofgren, M. (2007). Classification of quality attributes. Managing Service Quality , 17 (1), 54-73.
Indian Journal of Commerce & Management Studies ISSN: 2249-0310 EISSN: 2229-5674
Volume VIII Issue 3, September 2017 88 www.scholarshub.net
Author Sample size
Scale Final Dimensions with its Reliability Sampling Technique
Area
of
Research
Research Instrument
Data Analysis
Turkey EFA, SEM Seven point likert
scale
R- 0.6797 to 0.8652
Rao, K. D. et
al. (2006)
India
2480 Convenience
sampling
Questionnaire
EFA
23 items;
P score
five point likert
scale
Medicine Availability (2),Medical
Information (3), Staff Behavior (2),Doctor
Behavior (5),Clinic Infrastructure (4)
R- 0.7 to 0.88
Rohini, R., &
Mahadevappa,
B. (2006)
India,
Bangalore
500
Stratified random
sampling
Questionnaire
EFA, ANOVA
22 items;
P-E Score
Seven point likert
scale
Tangibles(4),Reliability (5),Responsiveness
(4), Assurance (4), Empathy (5)
R- 0.884 to 0.934
Bakar, C. et al.
(2008)
Turkey
472
Questionnaire
Gap Score
15 items;
P-E Score
Five point likert
scale
Tangibles(3),Reliability (3),Responsiveness
(3), Assurance (4), Empathy (2)
R- 0.89 to 0.96
Duggirala, D.
et al. (2008)
India
100
mail Questionnaire
Gap score CFA
86 items,
P-score, Seven
point likert scale
Infrastructure, personal quality, process of
clinical care, administrative process, safety
indicator, overall experience of medical care,
social responsibility R- 0.775 to 0.906
Ramsaran-
Fowdar, R.
(2008)
Mauritius
260
Convenience sampling
Questionnaire
EFA
47 items;
P-score,
Seven point likert
scale
Tangibility, Reliability, Responsiveness,
Assurance/empathy, Core medical
services/professionalism/skill/competence,
equipment and records, Records of medical
history R- 0.72 to 0.97
Karassavidou,
E.et al. (2009)
North Greece
137
Questionnaire
EFA
26 items;
P-E Score
Seven point likert
scale
Human aspects (16), Physical environment
and infrastructure (7),
Access (2) R- 0.758 to 0.996
Aagja, P. J., &
Garg, R.
(2010)
India,
Ahmedabad
201- scale development
200- scale validation
Convenience sampling
questionnaire
EFA and CFA
75 items;
P-E Score
Seven point likert
scale
Admission, Medical Services, Overall service,
discharge, social responsibility
R- 0.5880 to 0.8904
Butt, M. M., &
Run, E. C.
(2010)
Malaysia
340
Random sampling
questionnaire
Correlation, EFA, CFA
17 items, P-E
Score
Seven point likert
scale
Tangibles(3),Reliability(4),Responsiveness(4),
Assurance(3),
Empathy(3)
Narang, R.
(2010)
India,
Lucknow
500
Questionnaire
EFA
20 items;
P-score,
five point likert
scale
Human Personal Practices and Conduct(6),
Adequacy of resources and services (5),
Health care delivery (5), Access to services
(4) R- 0.325 to 0.789
Aaron A. A.
and Roger A.
A (2013)
Ghana
250 Questionnaire
t-measures and factor
analysis
22 items;
P-E Score
five point likert
scale
Tangibles(4),Reliability (5),Responsiveness
(4), Assurance (4), Empathy (5)
R- 0.80 to 0.84
Olgun K.,et al.
(2014)
Turkey
369
Questionnaire
SEM,
CFA
21 items;
P-score,
five point likert
scale
Tangibility (6), Assurance (4), Empathy (2),
Reliability (3), Responsiveness (3), overall
satisfaction , ward of mouth, repurchase
intention R- 0.70 to 0.86
Indian Journal of Commerce & Management Studies ISSN: 2249-0310 EISSN: 2229-5674
Volume VIII Issue 3, September 2017 89 www.scholarshub.net
Table 2: Literature Review of integration of SERVQUAL and Kano Model
Author Research Industry Integrated Model Classification of Quality
Attributes
Pawitra, T. A., & Tan, K.
C. (2001; 2003)
Tourism
Singapore
Kano ,SERVQUAL &
QFD Five Level M,O,A
Bhattacharyya, S. K., &
Rahman, Z. (2004) Bank Services Kano and SERVQUAL
Basic, performance,
Excitement
Birdogan, B. et al. (2009) Logistics services
Turkey
Kano, SERVQUAL
and QFD Five Level A,M,O,I,R,Q
Sulisworo, D. et al.
(2012)
Healthcare Service
private hospital in Indonesia Kano and SERVQUAL Five Level A,M,O,I,R,Q
Table 3: Respondent Profile
Demographic
variables Category Frequency %
Age
18-33 53 22.8
34-49 69 29.7
50-65 77 33.2
+ 66 33 14.2
Gender Male 149 64.2
Female 84 35.8
Marital Status Married 195 84.1
Unmarried 37 15.9
Education
No formal Education 6 2.6
Primary School 44 19.0
Secondary/Higher secondary school 47 20.3
Graduates/Diploma 62 26.7
Post Graduates 53 22.8
Professional Course 20 8.6
Occupation
Student 17 7.3
House wife 32 13.8
Farmer 13 5.6
Businessman 47 20.3
Government Employee 32 13.8
Private Employee 54 23.3
Retired Pensioner 11 4.7
Retired Non Pensioner 26 11.2
No. of visit in a year
One 99 42.7
Two 69 29.7
Three 42 18.1
Four 10 4.3
Five and More 12 5.2
Medical Insurance Policy Yes 122 52.6
No 110 47.4
If yes Cashless 86 37.1
Reimbursement 36 15.5
Type of Medical Insurance Policy Corporate 32 13.8
Personal 90 38.8
Yearly Household Income
2,00,000 37 15.9
2,00,001-4,00,000 72 31.0
4,00,001-6,00,000 71 30.6
6,00,001-8,00,000 31 13.4
8,00,001 21 9.1

Indian Journal of Commerce & Management Studies ISSN: 2249-0310 EISSN: 2229-5674
Volume VIII Issue 3, September 2017 90 www.scholarshub.net
Table 4: Reliability Statistics- Cronbach's alpha
Dimension Expectation Perception Feeling if Service quality attribute
Available Not available
Tangibility 0.876 0.929 0.914 0.823
Reliability 0.749 0.918 0.736 0.764
Responsiveness 0.729 0.921 0.711 0.700
Assurance 0.821 0.924 0.760 0.774
Empathy 0.820 0.937 0.701 0.777
Table 5: Service Quality Classification based on Three Level Kano Questionnaire
Dimension Service Quality Attributes
Feeling if Service
quality attribute
available Mode
Value
Feeling if Service
quality attribute
not available
Mode Value
Kano
Category
Tangibility
TA1 All staff members with uniform
/professional appearance of staff 2.00 3.00 M
TA2 Staff with appropriate name
badges 2.00 3.00 M
TA3 Fast and Computerized registration
and billing procedures 2.00 3.00 M
TA4 Pathology laboratory and or
imaging centre within the premises 2.00 3.00 M
TA5 Blood bank within the premises 1.00 2.00 A
TA6 Pharmacy within the premises 2.00 3.00 M
TA7 Easily accessible Location of
hospital 1.00 3.00 O
TA8 Latest devices, technologies and
medical equipments 1.00 3.00 O
TA9
Systematic layout of Hospital
departments (easier for the patients
to access services especially for
physically challenged, elderly &
emergency patients)
1.00 3.00 O
TA1
0
Proper safety and comfort
measures (e.g: handrails in aisles,
rooms and bathrooms, ramps
suitably designed for wheelchairs
and stretchers, elevators and
spacious corridors)
1.00 3.00 O
TA1
1
Continuous electricity and water
supply 2.00 3.00 M
TA1
2 Canteen with hygienic food 2.00 3.00 M
TA1
3
Laundry facilities available within
the premises 2.00 3.00 M
TA1
4
Good Housekeeping and sanitation
facilities 1.00 3.00 O
TA1
5
Comfortable conditions such as
temperature, ventilation, and odour 1.00 3.00 O
TA1
6 Clean drinking water 2.00 3.00 M
TA1
7
Ambulance services with minimal
cost 1.00 3.00 O
TA1
8
Promotional brochures, service
tracking documents etc. 2.00 3.00 M

Indian Journal of Commerce & Management Studies ISSN: 2249-0310 EISSN: 2229-5674
Volume VIII Issue 3, September 2017 91 www.scholarshub.net
Dimension Service Quality Attributes
Feeling if Service
quality attribute
available Mode
Value
Feeling if Service
quality attribute
not available
Mode Value
Kano
Category
TA1
9
Well furnished, decorated, well
ventilated and clean wards 2.00 3.00 M
TA2
0
Adequate, comfortable and clean
waiting rooms 1.00 3.00 O
TA2
1
Adequate, comfortable and clean
clinical and diagnostic test rooms 1.00 3.00 O
TA2
2
Adequate, comfortable and clean
pre-operative and post-operative
(or patient/resident ward) rooms
1.00 3.00 O
TA2
3
Adequate, comfortable and clean
intensive care units 1.00 3.00 O
TA2
4
Adequate, comfortable and clean
bathrooms and toilets 1.00 3.00 O
Reliability
RI1
Provides services by a certain date
as per the promises (e.g. Test,
follow-up checks, surgeries etc...)
1.00 3.00 O
RI2
Problem solving with sincere
interest (Registration, calling a
concerned doctor to attend the case
etc...)
1.00 3.00 O
RI3 Provides services like emergency
care at the time they promise 1.00 3.00 O
RI4 Provides services like casual
services at the time they promise 1.00 3.00 O
RI5 Doing correct diagnosis right at the
first time 1.00 3.00 O
RI6 Services provided at appointed
time 1.00 3.00 O
RI7 Error free and fast retrieval of
documents 2.00 3.00 M
RI8
Provide all the required
information and instructions
regarding admission, Treatment,
and discharge clearly to patients
and attendants
2.00 3.00 M
RI9 Availability of related medical and
paramedical facilities 1.00 3.00 O
Responsive
ness
RE1
Accurate information regarding
when services are to be provided
by hospital personnel (e.g
admissions, ward facility, visiting
hours etc…)
1.00 3.00 O
RE2
Prompt services to patients by
hospital personnel (e.g. Good
reception, housekeeping, nursing,
speed and ease of admissions and
discharge)
1.00 3.00 O
RE3
Willingness of hospital personnel
to help patients (ever smiling, kind
hearted staff)
1.00 2.00 A
RE4
Availability of hospital personnel
to respond to patients’ requests
always (attending immediately
1.00 3.00 O
Indian Journal of Commerce & Management Studies ISSN: 2249-0310 EISSN: 2229-5674
Volume VIII Issue 3, September 2017 92 www.scholarshub.net
Dimension Service Quality Attributes
Feeling if Service
quality attribute
available Mode
Value
Feeling if Service
quality attribute
not available
Mode Value
Kano
Category
whenever called)
Assurance
AS1
Confidence generating behavior of
hospital personnel. (Convincing
briefing by specialist, doctors, and
nurses)
1.00 3.00 O
AS2
Feeling safe while dealing with
hospital as per the cost of
treatment is concerned
1.00 3.00 O
AS3
Feeling safe while dealing with
hospital as per medicines are
concerned
1.00 3.00 O
AS4
Feeling safe while dealing with
hospital as per trust with the
personnel etc. Is concerned
1.00 3.00 O
AS5
Hospital personnel treat their
patients with courtesy (patient
treated with dignity and respect,
impartial treatment, sympathetic
approach etc…)
1.00 3.00 O
AS6
Enough Knowledge of hospital
personnel to answer patients
questions (e.g. Thoroughness of
medical conditions, proper advice
in their respective areas etc...)
1.00 3.00 O
Empathy
EM1
Individual attention given to the
patient by hospital. (e.g. Bed side
care, proper diet requirement,
politeness of physicians, nurses
and other staff)
1.00 3.00 O
EM2 Convenient operating hours for
e.g. 24 hours service facility 1.00 3.00 O
EM3 Fixing the operation timings
according to requirement 1.00 2.00 A
EM4 Good sympathetic care 1.00 3.00 O
EM5 Consistency of charges 1.00 3.00 O
EM6
Understanding the specific needs
of the patients. (e.g. Receiving,
investigating and sending them to
specific department for treatment)
1.00 3.00 O
EM7
Keeping the patients informed and
listening to them (e.g. Operations
details, explaining nutritional
needs, pre-operative and post-
operative care)
1.00 3.00 O
Note: 1- Satisfied, 2-Neutral, 3- Dissatisfied
A-Attractive service quality attributes, O- One Dimensional service quality attributes, M-Must be service quality
attributes
Indian Journal of Commerce & Management Studies ISSN: 2249-0310 EISSN: 2229-5674
Volume VIII Issue 3, September 2017 93 www.scholarshub.net
Table 6: Service Quality Gap Analysis
Paired Samples Test
Paired Differences
t df Sig. (2-tailed)
p value (Perception-Expectation Gap)
Mean Difference
Pair 1 TAD1 - TAA1 0.1810 1.7962 231 0.0738*
Pair 2 TAD2 - TAA2 0.2284** 2.2411 231 0.0260
Pair 3 TAD3 - TAA3 -0.7888 -7.6043 231 0.0000
Pair 4 TAD4 - TAA4 -0.5345 -7.3200 231 0.0000
Pair 5 TAD5 - TAA5 -0.8103 -10.3009 231 0.0000
Pair 6 TAD6 - TAA6 -0.5991 -7.6617 231 0.0000
Pair 7 TAD7 - TAA7 -0.7241 -8.8066 231 0.0000
Pair 8 TAD8 - TAA8 -1.0690 -12.9194 231 0.0000
Pair 9 TAD9 - TAA9 -0.7457 -9.5029 231 0.0000
Pair 10 TAD10 - TAA10 -1.0345 -12.8427 231 0.0000
Pair 11 TAD11 - TAA11 -0.1983 -2.6288 231 0.0091
Pair 12 TAD12 - TAA12 -0.4310 -4.3226 231 0.0000
Pair 13 TAD13 - TAA13 0.0776 0.7842 231 0.4337*
Pair 14 TAD14 - TAA14 -0.6034 -7.5593 231 0.0000
Pair 15 TAD15 - TAA15 -0.7500 -9.3409 231 0.0000
Pair 16 TAD16 - TAA16 0.0172 0.2823 231 0.7780*
Pair 17 TAD17 - TAA17 0.1767** 2.2667 231 0.0243
Pair 18 TAD18 - TAA18 0.3879** 3.7384 231 0.0002
Pair 19 TAD19 - TAA19 -0.1466 -1.6654 231 0.0972*
Pair 20 TAD20 - TAA20 -0.4440 -5.8068 231 0.0000
Pair 21 TAD21 - TAA21 -0.7629 -9.8431 231 0.0000
Pair 22 TAD22 - TAA22 -0.6466 -8.3800 231 0.0000
Pair 23 TAD23 - TAA23 -1.0431 -13.9054 231 0.0000
Pair 24 TAD24 - TAA24 -0.0776 -0.9182 231 0.3594*
Pair 25 RID1-RIA1 -1.4181 -16.1260 231 0.0000
Pair 26 RID2-RIA2 -1.6164 -19.2750 231 0.0000
Pair 27 RID3-RIA3 -1.7802 -21.6070 231 0.0000
Pair 28 RID4-RIA4 -1.2802 -13.6590 231 0.0000
Pair 29 RID5-RIA5 -2.0000 -19.9610 231 0.0000
Pair 30 RID6-RIA6 -1.2845 -14.0930 231 0.0000
Pair 31 RID7-RIA7 -1.4526 -16.0770 231 0.0000
Pair 32 RID8-RIA8 -1.5776 -16.4550 231 0.0000
Pair 33 RID9-RIA9 -1.3750 -15.8290 231 0.0000
Pair 34 RED1-REA1 -1.4957 -16.2860 231 0.0000
Pair 35 RED2-REA2 -1.7155 -20.2340 231 0.0000
Pair 36 RED3-REA3 -1.8621 -22.0100 231 0.0000
Pair 37 RED4-REA4 -1.6681 -18.8110 231 0.0000
Pair 38 ASD1-ASA1 -1.8190 -18.8240 231 0.0000
Pair 39 ASD2-ASA2 -1.9612 -19.4540 231 0.0000
Pair 40 ASD3-ASA3 -1.9440 -19.0810 231 0.0000
Pair 41 ASD4-ASA4 -1.5000 -15.3460 231 0.0000
Pair 42 ASD5-ASA5 -1.6078 -15.6270 231 0.0000
Pair 43 ASD6-ASA6 -1.6983 -18.1560 231 0.0000
Pair 44 EMD1-EMA1 -1.6207 -17.7930 231 0.0000
Pair 45 EMD2-EMA2 -1.2457 -14.8130 231 0.0000
Pair 46 EMD3-EMA3 -0.7500 -8.4770 231 0.0000
Pair 47 EMD4-EMA4 -1.4785 -16.9880 231 0.0000
Pair 48 EMD5-EMA5 -1.9440 -17.6210 231 0.0000
Pair 49 EMD6-EMA6 -1.8233 -18.8810 231 0.0000
Pair 50 EMD7-EMA7 -1.9310 -20.9600 231 0.0000
* Service quality attributes whose p-value as per the paired sample t-test was greater than 0.05 so there is no
significant gap between perception and expectation **Service quality attributes which shows positive Perception-Expectation Gap but their p-value as per the paired sample t-test was lesser than 0.05 so there is
significant gap between perception and expectation

Indian Journal of Commerce & Management Studies ISSN: 2249-0310 EISSN: 2229-5674
Volume VIII Issue 3, September 2017 94 www.scholarshub.net
Table 7: Gap Analysis P-E Gap
Dimensions Perception Mean Score Expectation Mean Score P-E Gap
Tangibility 3.7532 4.1841 -0.4309
Reliability 2.8482 4.3798 -1.5316
Responsiveness 2.6422 4.3276 -1.6854
Assurance 2.7282 4.4842 -1.7560
Empathy 2.6761 4.218 -1.5419
Table 8: Integration of SERVQUAL and Kano model
Dimensions Service Quality Attributes P-E Gap Kano
Category
Reliability RI8
Provide all the required information and instructions
regarding admission, Treatment, and discharge clearly
to patients and attendants
-1.5776 M
Reliability RI7 Error free and fast retrieval of documents -1.4526 M
Tangibility TA3 Fast and Computerized registration and billing
procedures -0.7888 M
Tangibility TA6 Pharmacy within the premises -0.5991 M
Tangibility TA4 Pathology laboratory and or imaging centre within the
premises -0.5345 M
Tangibility TA12 Canteen with hygienic food -0.4310 M
Tangibility TA11 Continuous electricity and water supply -0.1983 M
Tangibility TA2 Staff with appropriate name badges 0.2284 M
Tangibility TA18 Promotional brochures, service tracking documents etc. 0.3879 M
Reliability RI5 Doing correct diagnosis right at the first time -2.0000 O
Assurance AS2 Feeling safe while dealing with hospital as per the cost
of treatment is concerned. -1.9612 O
Assurance AS3 Feeling safe while dealing with hospital as per
medicines are concerned. -1.9440 O
Empathy EM5 Consistency of charges -1.9440 O
Empathy EM7 Keeping the patients informed and listening to them -1.9310 O
Empathy EM6 Understanding the specific needs of the patients -1.8233 O
Assurance AS1 Confidence generating behavior of hospital personnel -1.8190 O
Reliability RI3 Provides services like emergency care at the time they
promise -1.7802 O
Responsiveness RE2 Prompt services to patients by hospital personnel -1.7155 O
Assurance AS6 Enough Knowledge of hospital personnel to answer
patients questions -1.6983 O
Reliability RE4 Availability of hospital personnel to respond to
patients’ requests always -1.6681 O
Empathy EM1 Individual attention given to the patient by hospital -1.6207 O
Reliability RI2 Problem solving with sincere interest -1.6164 O
Assurance AS5 Hospital personnel treat their patients with courtesy -1.6078 O
Assurance AS4 Feeling safe while dealing with hospital as per trust
with the personnel etc. is concerned. -1.5000 O
Responsiveness RE1 Accurate information regarding when services are to be
provided by hospital personnel -1.4957 O
Empathy EM4 Good sympathetic care -1.4785 O
Reliability RI1 Provides services by a certain date as per the promises -1.4181 O
Indian Journal of Commerce & Management Studies ISSN: 2249-0310 EISSN: 2229-5674
Volume VIII Issue 3, September 2017 95 www.scholarshub.net
Dimensions Service Quality Attributes P-E Gap Kano
Category
Reliability RI9 Availability of related medical and paramedical
facilities -1.3750 O
Reliability RI6 Services provided at appointed time -1.2845 O
Reliability RI4 Provides services like casual services at the time they
promise -1.2802 O
Empathy EM2 Convenient operating hours for e.g. 24 hours service
facility -1.2457 O
Tangibility TA8 Latest devices, technologies and medical equipments -1.0690 O
Tangibility TA23 Adequate, comfortable and clean intensive care units -1.0431 O
Tangibility TA10 Proper safety and comfort measures -1.0345 O
Tangibility TA21 Adequate, comfortable and clean clinical and
diagnostic test rooms -0.7629 O
Tangibility TA15 Comfortable conditions such as temperature,
ventilation, and odour. -0.7500 O
Tangibility TA9 Systematic layout of Hospital departments -0.7457 O
Tangibility TA7 Easily accessible Location of hospital -0.7241 O
Tangibility TA22 Adequate, comfortable and clean pre-operative and
post-operative -0.6466 O
Tangibility TA14 Good Housekeeping and sanitation facilities -0.6034 O
Tangibility TA20 Adequate, comfortable and clean waiting rooms -0.4440 O
Tangibility TA17 Ambulance services with minimal cost. 0.1767 O
Responsiveness RE3 Willingness of hospital personnel to help patients -1.8621 A
Tangibility TA5 Blood bank within the premises -0.8103 A
Empathy EM3 Fixing the operation timings according to requirement -0.7500 A
Note: A-Attractive , O- One Dimensional , M-Must be
******


