
An Automated Airspace Concept for the Next Generation Air Traffic Control System
Todd Farley, David McNally, Heinz Erzberger, Russ Paielli
SAE Aerospace Control & Guidance Committee Meeting
Boulder, Colorado
1 March 2007

2
Demand for air travel continues to increase
Scheduled Revenue Passenger-Kilometers by Region
0
200
400
600
800
1000
1200
1400
1970 1980 1990 2000 2010
RP
K (
bill
ion
)
North America
Europe
Asia andPacific
Latin America &Caribbean
Middle East
Africa
Substantial increase in traffic expected in next 20 years.
Today’s airspace system is not expected to be able to accommodate future demand.
Data source: ICAO scheduled services of commercial carriers (courtesy, John Hansman, MIT)

3
Insufficient capacity?
• Spatial capacity• Practical capacity as presently operated
– Competition for prime runways (& airspace) at prime time– Cognitive capacity for keeping aircraft separated
• Increases in demand are expected to exacerbate these demand/capacity mismatches
• Many approaches to alleviating the problem– Automated separation assurance
4
Air Traffic Control functions
• Keep aircraft safely separated
– Monitor separation
– Detect potential conflicts
– Resolve them
– Transfer separation responsibility
• Minimize delay

5
Elements of a Future Airspace System
Humans
Data Link Voice Link
Trajectory-BasedAutomation
(2-20 min time horizon)
Safety Assurance(0-3 min time horizon)
Trajectory Database
Collision Avoidance(0-1 min time horizon)
6
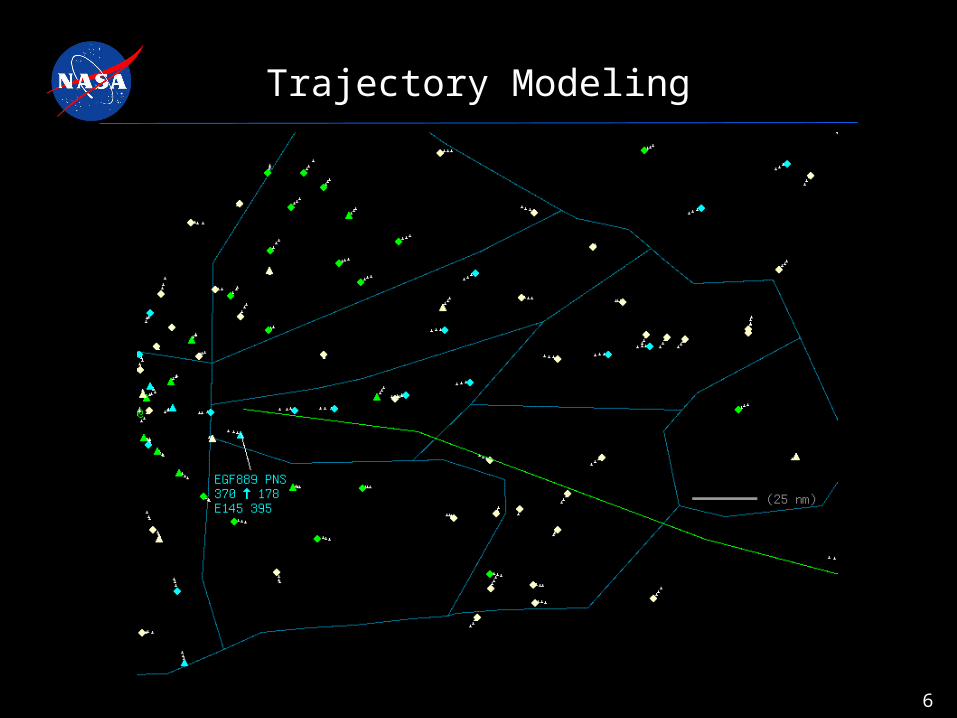
Trajectory Modeling
7
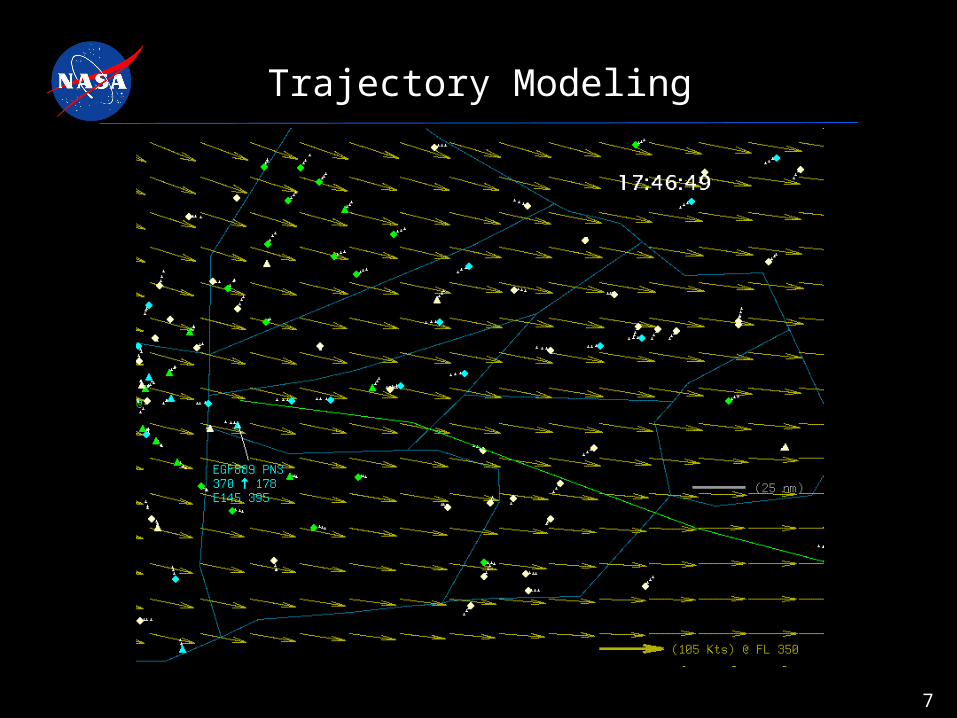
Trajectory Modeling
8
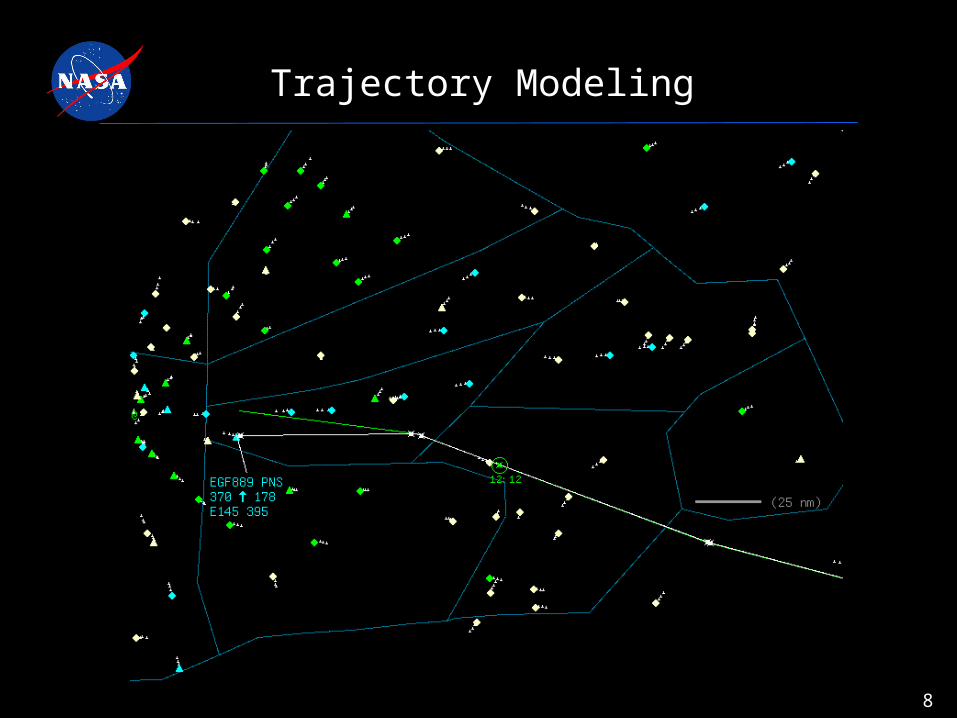
Trajectory Modeling
9
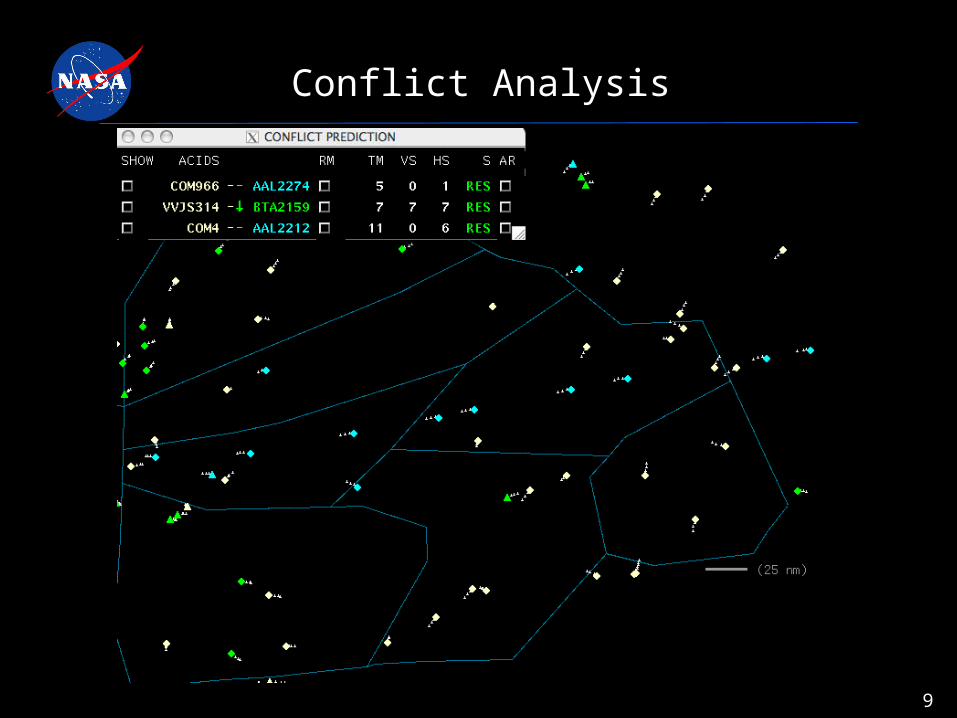
Conflict Analysis

10
Conflict Detection

11
Conflict Resolution

12
Technical Challenges
• Allocation of functions
between automation and
human operators
• Allocation of automation
between cockpit and
ground
• Automation of conflict
detection and resolution
• Fault tolerance and
Safety assurance

13
Human/Automation Allocation
• Human detects conflict with
automation support, human
resolves
• Automation detects conflict,
human resolves
• Automation detects conflict,
suggests resolution, human
(modifies and) resolves
• Automation detects conflict,
automation resolves
14
Probing the low end of the automation spectrum
• Experiment
– Real-time lab simulation, Fort Worth Center traffic data
– 5 airspace sectors combined, 90 min traffic sample
– Traffic levels comparable to today’s operations
15
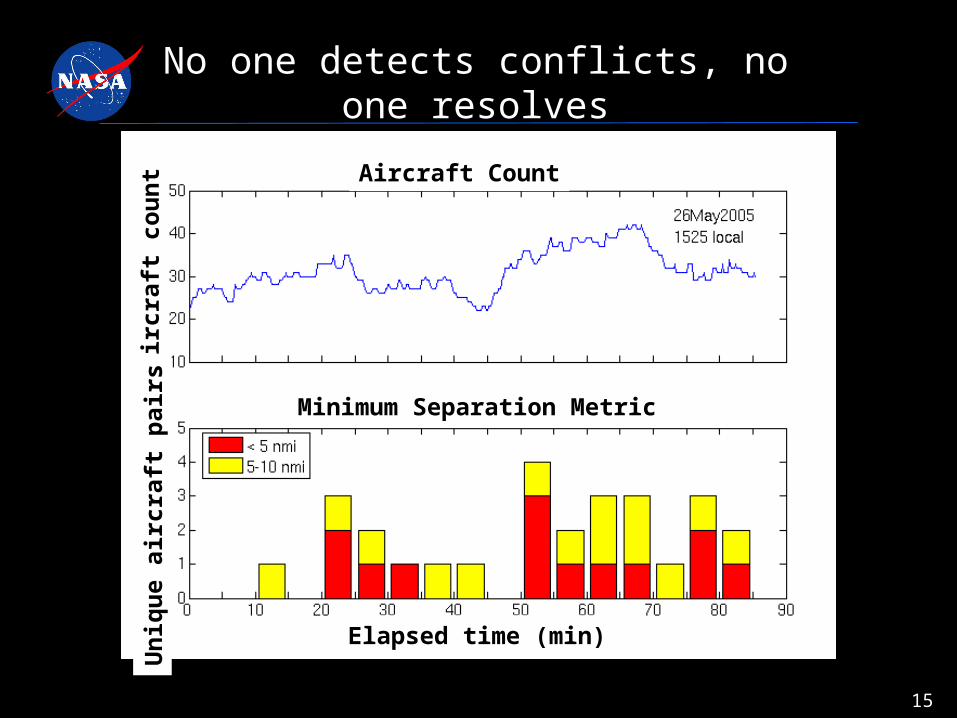
No one detects conflicts, no one resolves
Minimum Separation Metric
Elapsed time (min)
Aircraft CountA
ircr
aft
cou
nt
Un
iqu
e ai
rcra
ft p
airs

16
Human detects conflicts, human resolves
Elapsed time (min)
Air
craf
t co
un
t
Minimum Separation Metric
Un
iqu
e ai
rcra
ft p
airs
Aircraft Count

17
Automation Detects, Human Resolves

18
Simulation Results
One controller doing work of 5 to 10 people. No loss of separation.
Un
iqu
e ai
rcra
ft p
airs
Un
iqu
e ai
rcra
ft p
airs
Elapsed time (min)
Elapsed time (min)
Human Detects, Human Resolves
Automation Detects, Human Resolves

19
Probing the high end of the automation spectrum
• Which aircraft moves, what maneuver, when, constraints
• Airborne and ground-based implementations
• Surveillance, intent, data exchange, coordination
• Metrics

20
Auto Resolution Example

21
Auto Resolution Example

22
Auto Resolution Example

23
Auto Resolution Results Summary
Traffic level, Cleveland Center 1X ~2X ~3X
Traffic count (24 hours) 7000 17800 26000
Conflicts detected and resolved 532 1572 3099
% flights in conflict 12 20 23
Mean delay (sec) 21 22 25
100% of en-route conflicts resolved.
Cost of resolution rises acceptably with traffic level.
24
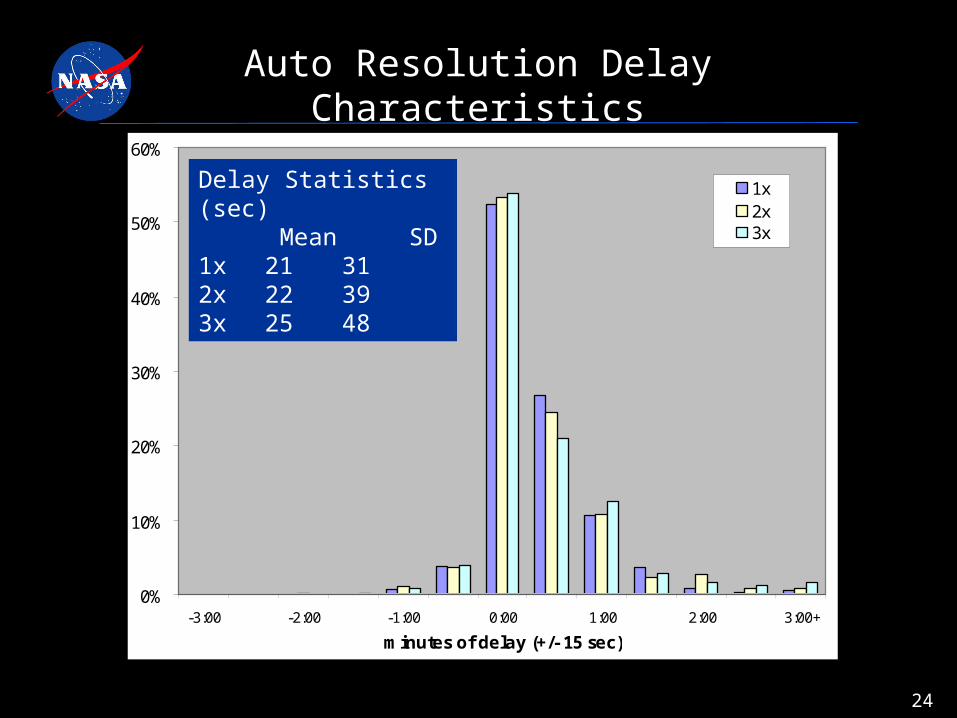
Auto Resolution Delay Characteristics
Delay histogram(en-route flights only)
0%
10%
20%
30%
40%
50%
60%
-3:00 -2:00 -1:00 0:00 1:00 2:00 3:00+
minutes of delay (+/- 15 sec)
1x2x3x
Delay Statistics (sec) Mean SD
1x 21 312x 22 393x 25 48

25
Safety Assurance
• Tactical, safety-critical conflict analysis (0-3 min)
• Simple, safe maneuvers to clear the conflict
• Multiple trajectories for each aircraft

26
Multiple Trajectory Models - Horizontal

27
Multiple Trajectory Models - Vertical

28
Tactical Safety Assurance vsToday’s Conflict Alerting
69 Operational ErrorsTactical safety assurance
Today’s conflict alerting

29
Collision Avoidance
• Tactical, safety-critical conflict analysis (0-1 min)
• Urgent maneuvers to avoid collision

30
Technical Challenges
• Allocation of functions
between automation and
human operators
• Allocation of automation
between cockpit and
ground
• Automation of conflict
detection and resolution
• Fault tolerance and
Safety assurance

31
Initial Safety Analysis
NOTRESOLVED BY
TCAS
NOTRESOLVED BY
TSAFE
NOTRESOLVED BY
ATS
NOTRESOLVED BY
VISUAL MEANS
COLLISIONRATE
PRE-RESOLUTIONRATE OF NMACS
COLLISION IFCRITICAL MISS
TIME BETWEEN COLLISIONS
1.5 hours
4.3 min
3.14 years
31 years
157 years
523 years
0.05
5.25E-05
0.10
0.20
0.30
Reference: Andrews, John W., Erzberger, Heinz, and Welch, Jerry D., “Safety Analysis for Advanced Separation Concepts”, 6th USA/Europe Seminar on Air Traffic Management Research and Development, Baltimore. June 27-30, 2005
Traffic Density = 0.002 AC/nmi3
Activity Level: 20 million flight hours/year
• Identify failure and recovery modes
• Identify risk of failures and risk of collision if failure occurs.
• Analyze safety criticality requirements of key architectural components
• Interoperability of tactical safety assurance automation and TCAS.

32
Challenges Ahead
• Interoperability of layered separation assurance functions
• Modeling, measuring human awareness
• Failure and uncertainty modeling
• Understanding, building the safety case
• Consistent objective metrics
• Comparison of airborne and ground-based methods
• Testing in today’s operations
• Transition strategy

33
Concluding Remarks
• Today’s airspace operations are not expected
to be able to support anticipated growth
in air traffic demand.
• Automation of primary separation assurance functions
is one approach to expand airspace capacity.
• Primary technical challenge: develop technology
and procedures to deliver a safe, fail-operational
automated separation assurance capability.


