Download - AMRP REPORT
APPLIED MANAGEMENT RESEARCH PROJECT REPORT
Submitted By
Pooja Gupta
Roll No – 11BM60105
Vinod Gupta School of Management
IIT Kharagpur
Consumer Usage and
Attitudes for Shower Gels
ITC LTD.

AMRP PROJECT ITC
V i n o d G u p t a S c h o o l o f M a n a g e m e n t , I I T K h a r a g p u r
Page 2
ACKNOWLEDGEMENT
The completion of this project would be incomplete without the mention of the people
whose constant support and guidance have helped me to complete this project successfully.
I would like to express my deepest appreciation to Mr. Kushal (Brand Manager), ITC Ltd., for
his words of encouragement and extending all help from his department, necessary for the
project. I am thankful to him for giving his valuable time and for providing a systematic way
for completing the project in time.
I would like to specially thank my Project Mentor, Prof. Sujoy Bhattacharya ,Vinod Gupta
School of Management, IIT Kharagpur, for his great help. He provided me necessary
guidance and support until the completion of my project.
Last, but not the least, I would like to thank my esteemed Institute and my Faculty, for the
learning given to me so that I could complete my Project.
Pooja Gupta

AMRP PROJECT ITC
V i n o d G u p t a S c h o o l o f M a n a g e m e n t , I I T K h a r a g p u r
Page 3
Table of Contents
Page No.
1. Executive Summary 4
2. Goals 5
3. Methodology 6
4. Results 13
5. References 28
AMRP PROJECT ITC
V i n o d G u p t a S c h o o l o f M a n a g e m e n t , I I T K h a r a g p u r
Page 4
Executive Summary
The project requires me to perform qualitative market research and customer data analysis
using SPSS on the factors that affect the consumer usage patterns and consumer behaviour
towards shower gels. I am required to analyze the findings and make recommendations for
the marketing and brand positioning strategy of shower gels.
At the start of the project, business analysis was done. It involved secondary research,
understanding the consumer behaviour by one to one interaction at the point of purchase. I
interacted with 50 consumers of different age groups, gender and a healthy mix of users,
trailers and non users. With the help of this customer understanding, questionnaire was
prepared including all the data parameters necessary to conduct this project. Primary
research was done on 90 respondents. Two focus group interviews were conducted, each
group having 8-9 participants. The first group consisted of a healthy mix of men and women,
users, trailers and non users. This group discussion was focussed to get an overall idea of
consumer behaviour targeting at different segments at the same time. The second focus
group consisted of either trailers or non users. The discussion was focussed mainly on
barriers to trial of shower gel.
Analysis was done on the consumer patterns and behaviour towards shower gel. I plan to
extend the project by expanding my primary research, visiting distributors if required,
detailed analysis of the final collected data using SPSS and recommending marketing
strategy to ITC on the basis of the findings.

AMRP PROJECT ITC
V i n o d G u p t a S c h o o l o f M a n a g e m e n t , I I T K h a r a g p u r
Page 5
Goals
The project requires me to find out and understand the factors that affect the consumer usage patterns with respect to the shower gels in general, what impacts the buying behaviour and consumer attitude towards the shower gels present in the market and what makes them go for the shower gel they choose. I have conducted a qualitative research on consumers to fulfil the above mentioned factors. The consumers consist of a healthy mix of regular users( users who have been using shower gels regularly), trialists(users who have been using shower gels/ want to use shower gels on a trial basis), lapsers(users who have used the shower gels but have decided not to use them any further). The consumers also consist of a healthy mix of consumers buying from different point of purchase (general trade & modern trade). PROJECT OBJECTIVES The project requires me to perform qualitative market research and customer data analysis
using SPSS on the factors that affect the consumer usage patterns and consumer behaviour
towards shower gels. I am required to analyze the findings and make recommendations for
the marketing and brand positioning strategy of shower gels.
• Qualitative Market Research • Key value drivers (Factors that affect the consumer usage patterns, buying behavior) • Analysis of consumer behavior • Attitudes towards shower gels • Formulate marketing strategy
AMRP PROJECT ITC
V i n o d G u p t a S c h o o l o f M a n a g e m e n t , I I T K h a r a g p u r
Page 6
Methodology
Data parameters:
The data is collected from the consumers keeping the following factors in mind:
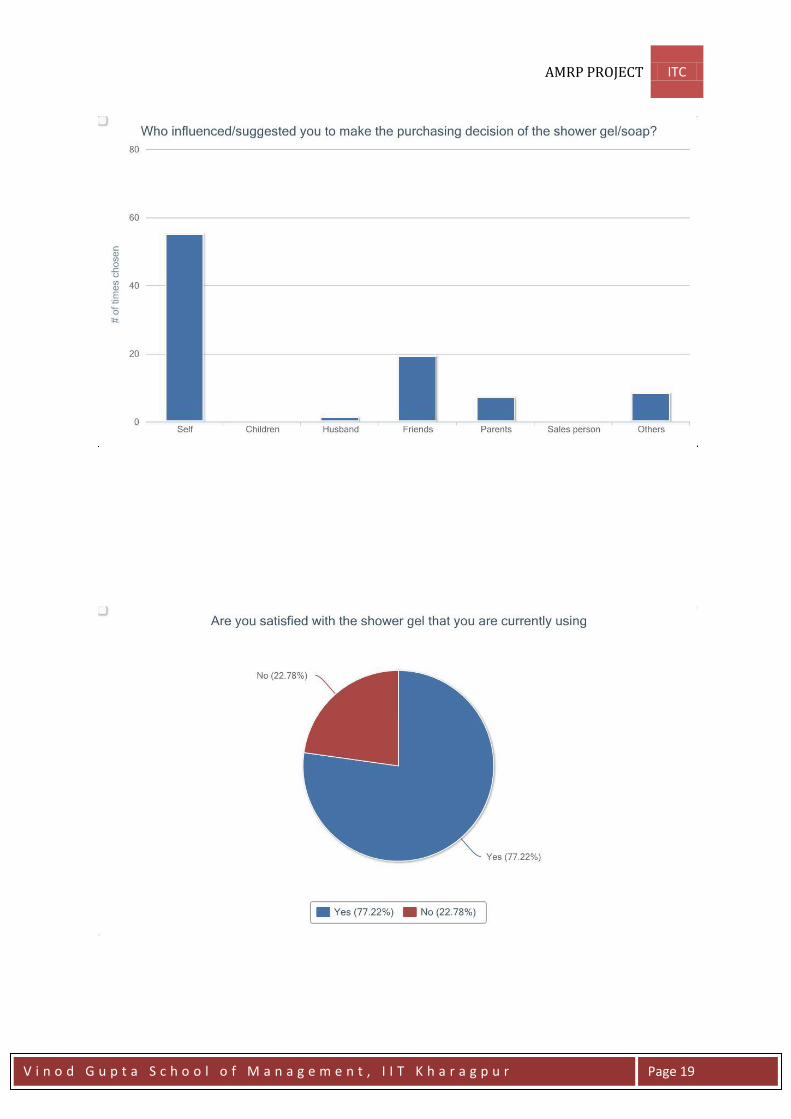
Gender Age group of the consumer Understand who is the influencer and the decision maker in the purchase decision
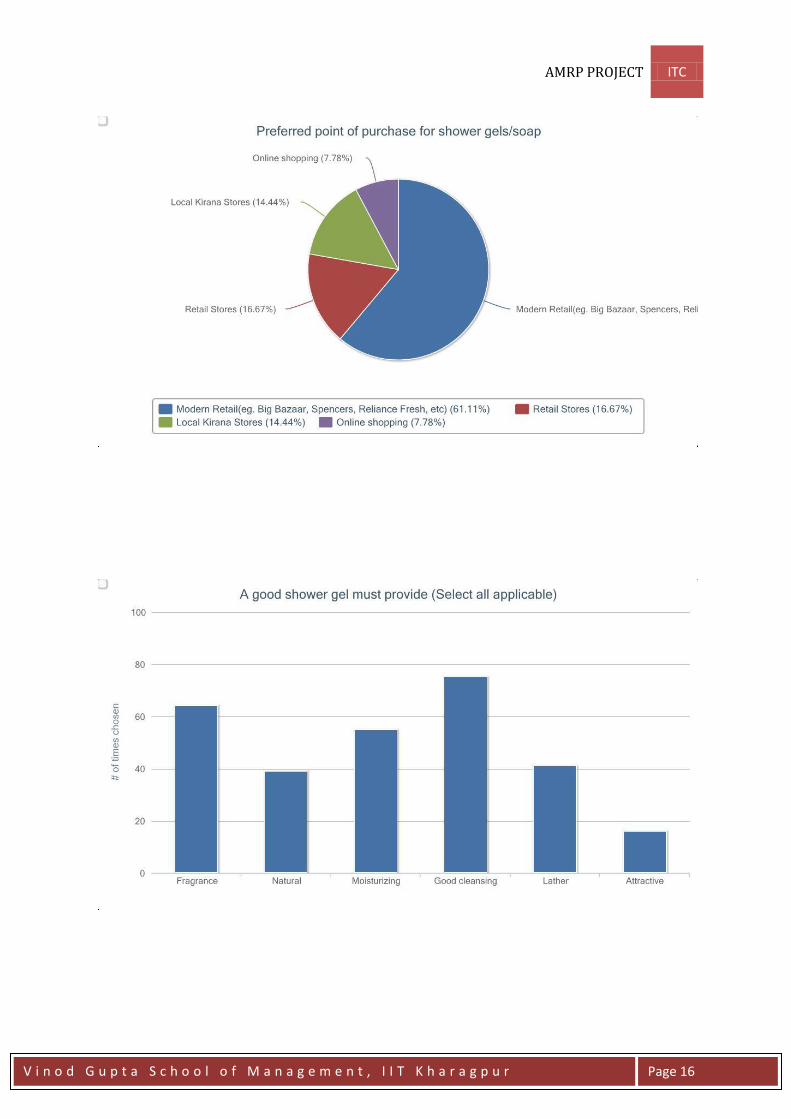
process Buying frequency Perceived end benefits of the product for the consumer Customer’s price perception in terms of the value proposition Preferred point of purchase for the consumer Factors affecting choice:
o Ingredients o Fragrance o Effect on skin (eg moisturising effect on skin) o Lather o Consistency o Packaging o Price o Brand Name o Promotional scheme of the product o Seasonal effects (e.g. people might prefer a moisturising shower gel in
winter) o Any other
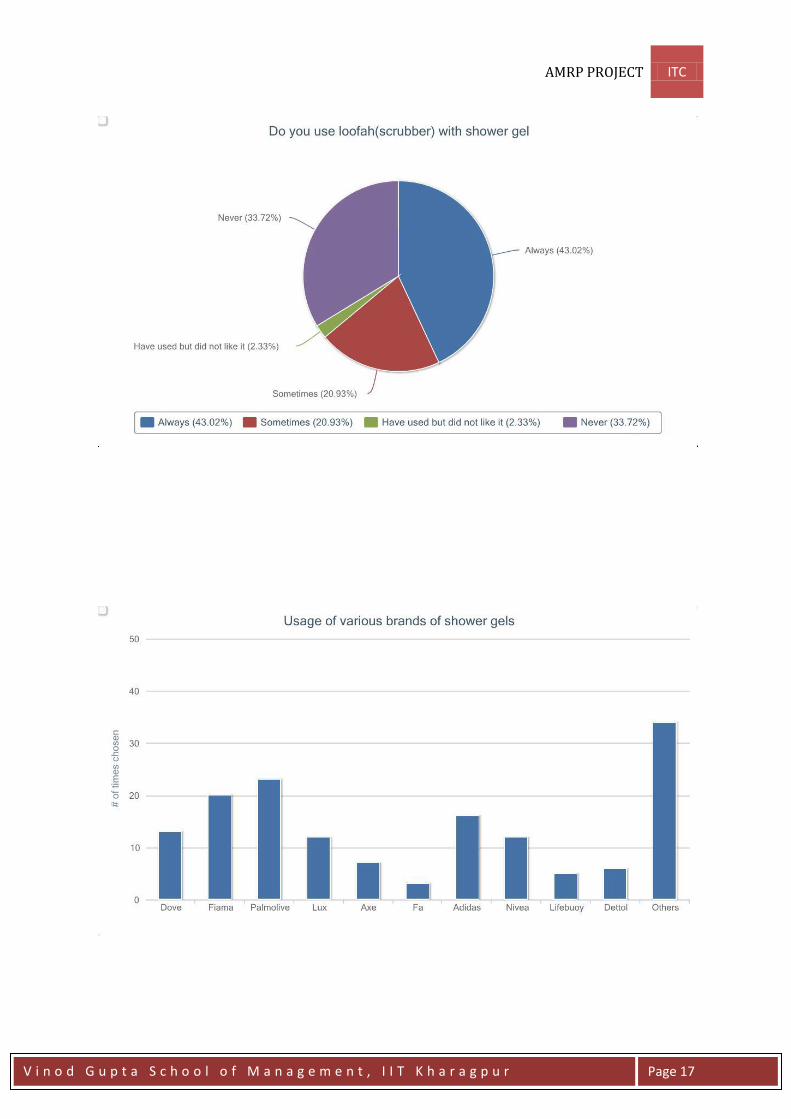
Whether the consumer uses loofah with shower gel or not What the customer prefers: shower gel or soap? And why? Awareness about the shower gel benefits Switching behaviour Does the consumer exhibit switching behaviour, if yes then why? How specific marketing programs affect the consumer buying behaviour for shower
gels. Is the customer satisfied with the shower gel he/she is currently using? If yes, why? If
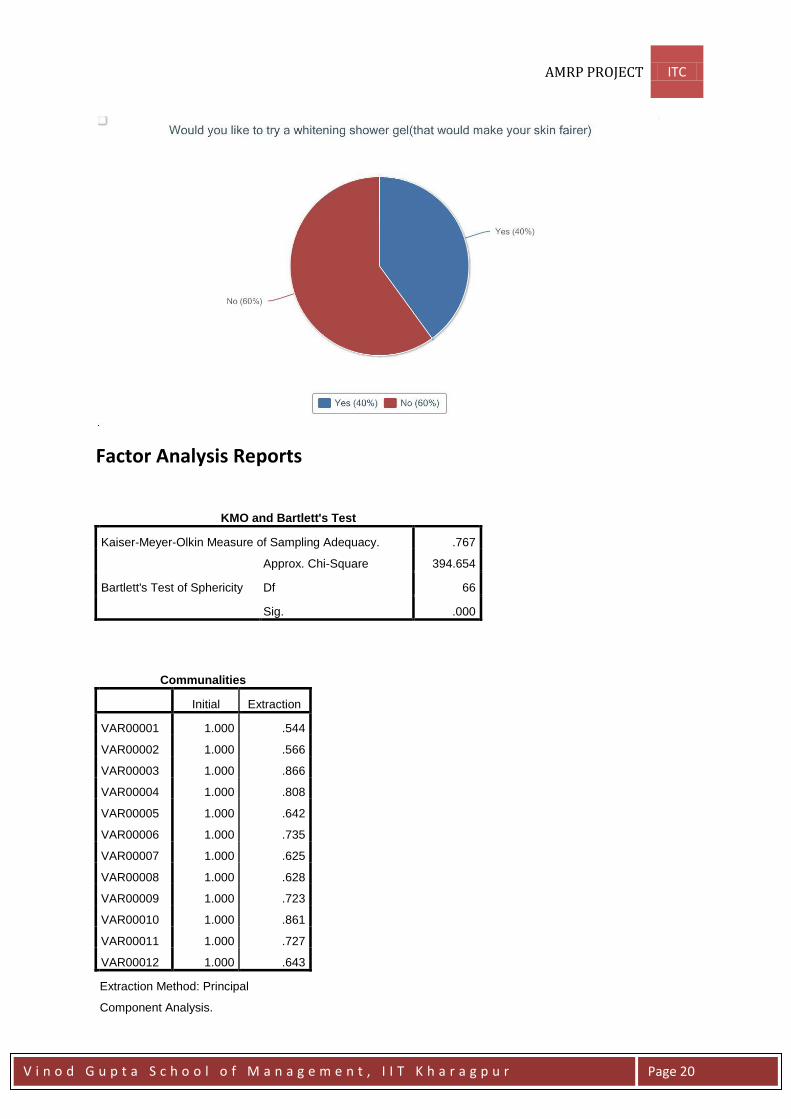
no, why not? Would the consumer like to buy a fairness shower gel if such a product is made
available

AMRP PROJECT ITC
V i n o d G u p t a S c h o o l o f M a n a g e m e n t , I I T K h a r a g p u r
Page 7
Methods followed for data collection:
For collecting the data for qualitative research, three different methodologies were followed. Method 1: Personal interviews were conducted at the point of purchases.
To understand the profiles of people - products are made for aspirational urban consumer:
o middle class o aspirational middle class o upper middle class o upper class
To study the consumer reaction towards shower gels For competitor analysis To understanding the profit margin of distributors for different kinds of shower gels What are the different promotional schemes for shower gels To understanding the switching behaviour - people might buy different shower gel
everytime or remain loyal to same shower gel everytime they buy. To understanding if it’s a high or low involvement product Pre usage, in use & post usage behaviour analysis
Method 2: Focus group interviews. It would help to give insights on consumer behaviour towards shower gels.
Method 3:
Primary research is collected by floating questionnaire among various people.
AMRP PROJECT ITC
V i n o d G u p t a S c h o o l o f M a n a g e m e n t , I I T K h a r a g p u r
Page 8
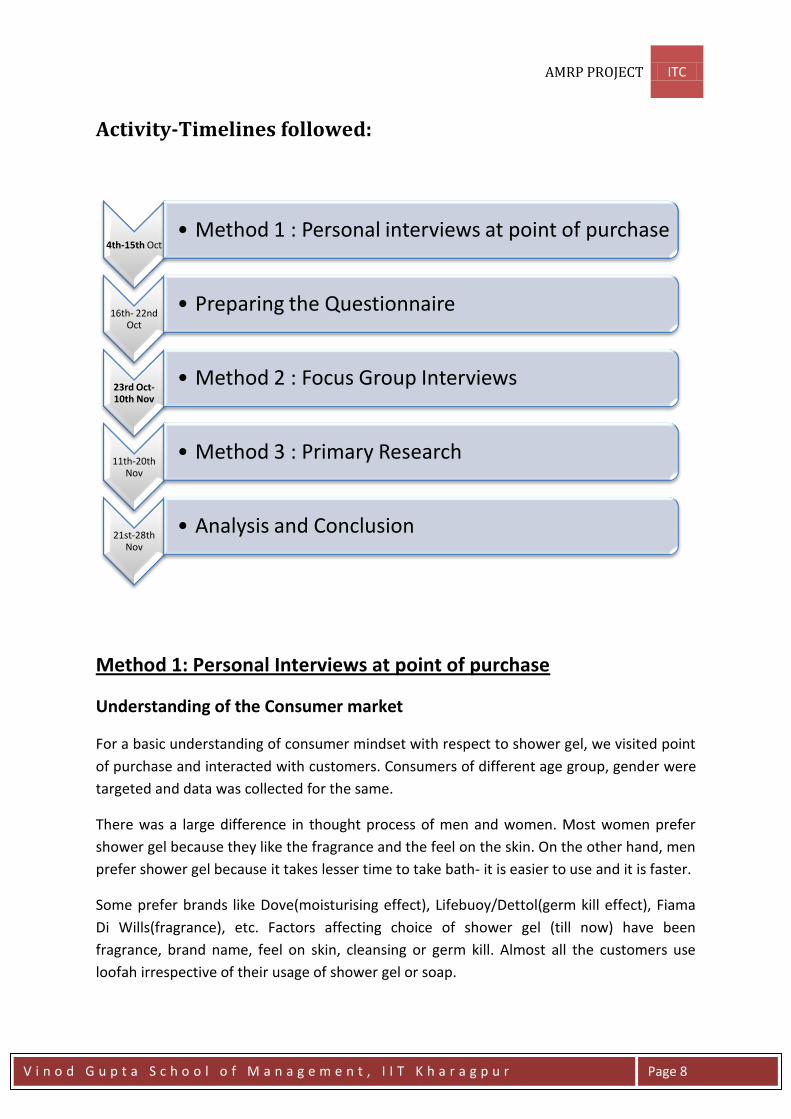
Activity-Timelines followed:
Method 1: Personal Interviews at point of purchase
Understanding of the Consumer market
For a basic understanding of consumer mindset with respect to shower gel, we visited point
of purchase and interacted with customers. Consumers of different age group, gender were
targeted and data was collected for the same.
There was a large difference in thought process of men and women. Most women prefer
shower gel because they like the fragrance and the feel on the skin. On the other hand, men
prefer shower gel because it takes lesser time to take bath- it is easier to use and it is faster.
Some prefer brands like Dove(moisturising effect), Lifebuoy/Dettol(germ kill effect), Fiama
Di Wills(fragrance), etc. Factors affecting choice of shower gel (till now) have been
fragrance, brand name, feel on skin, cleansing or germ kill. Almost all the customers use
loofah irrespective of their usage of shower gel or soap.
4th-15th Oct • Method 1 : Personal interviews at point of purchase
16th- 22nd Oct
• Preparing the Questionnaire
23rd Oct-10th Nov
• Method 2 : Focus Group Interviews
11th-20th Nov
• Method 3 : Primary Research
21st-28th Nov
• Analysis and Conclusion

AMRP PROJECT ITC
V i n o d G u p t a S c h o o l o f M a n a g e m e n t , I I T K h a r a g p u r
Page 9
There were two categories amongst non users of shower gel. Some of them were ready to
use shower gel in future if given a chance. Some others were strictly against using shower
gel as they are very much used to using bar soaps and do not want to change their habit at
any cost. Few others do not bother what they use for bathing purpose. Also some exhibit
switching behaviour between shower gel-soap and varieties of shower gels.
The major barriers to trial were the following factors: no awareness at all, habit of using
soap, people do not understand the need of switching from soap to shower gel. There were
some lapsers as well; the reason being the belief that shower gel do not wash off easily from
the body, do not suit the skin resulting in allergic effects on skin and price factor mainly.
Also the gender factor comes into play here. It was observed that for men, soap is a low
involvement product and when it comes to shower gel, most of them are non users either
due to lack of awareness or due to the low importance attached to such products.
Brand preference of shower gels were seen among the consumers. Most of them preferred
Fiama di Wills due to its fragrance, packaging and freshness feel. Dove was preferred mostly
due to its moisturising effect on skin. Palmolive was again preferred due to fragrance. Some
preferred Fiama di Wills and Lux because of the current promotional schemes- free loofah
with the pack.
Also, influencer and decision maker vary according to various age groups. For teenagers,
decision makers are usually their parents. For people in age group between 20 and 40,
influencer and decision makers are usually they themselves or influenced by their social
circles. For people with age group greater than 40, many a times the children especially
daughters are the influencers and decision makers. Most of them in this age group prefer to
use soap, but still use shower gels regularly or on frequent basis since their children are the
decision makers.
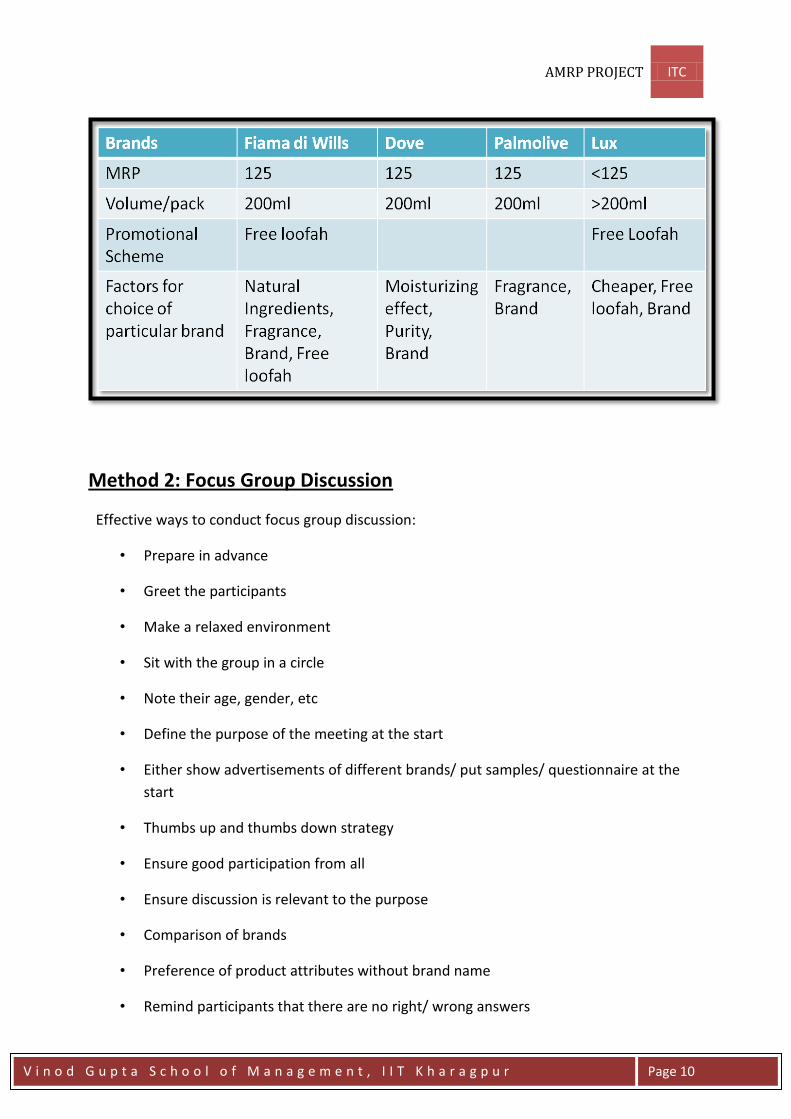
Competitor Analysis at point of purchase:
Fiama Di Wills, Dove, Palmolive and Lux shower gels were available in the local retail
outlets. Other than Lux, all are priced at MRP of Rs 125 for 200ml of quantity. Lux is priced
at lesser MRP for more quantity volume. Even then, the retailers reported that sales
quantity of Lux is less than others. According to most of the retail outlets, Fiama Di Wills and
Palmolive sell more than Dove. The retail shops have a profit margin of 10-15%(depending
on schemes), though some retailers sell the products at a price less than the MRP and have
margins of 7-12%. Lux has also come out with packaging same as Fiama Di Wills(free loofah).
Only Fiama Di Wills for men does not have a free loofah with it, when all the other 3
varieties have it in their packaging.
AMRP PROJECT ITC
V i n o d G u p t a S c h o o l o f M a n a g e m e n t , I I T K h a r a g p u r
Page 10
Method 2: Focus Group Discussion
Effective ways to conduct focus group discussion:
• Prepare in advance
• Greet the participants
• Make a relaxed environment
• Sit with the group in a circle
• Note their age, gender, etc
• Define the purpose of the meeting at the start
• Either show advertisements of different brands/ put samples/ questionnaire at the
start
• Thumbs up and thumbs down strategy
• Ensure good participation from all
• Ensure discussion is relevant to the purpose
• Comparison of brands
• Preference of product attributes without brand name
• Remind participants that there are no right/ wrong answers

AMRP PROJECT ITC
V i n o d G u p t a S c h o o l o f M a n a g e m e n t , I I T K h a r a g p u r
Page 11
• Participants can write down their points/ summarize
• Someone should be taking notes/video of the discussion
• Summarize. Results
Two focus group discussions were conducted. First group had a mixed group of users,
trailers and non users. The second group consisted of all non users and it focussed on
understanding the barriers to trial of shower gel. The videos of both the focus group were
taken
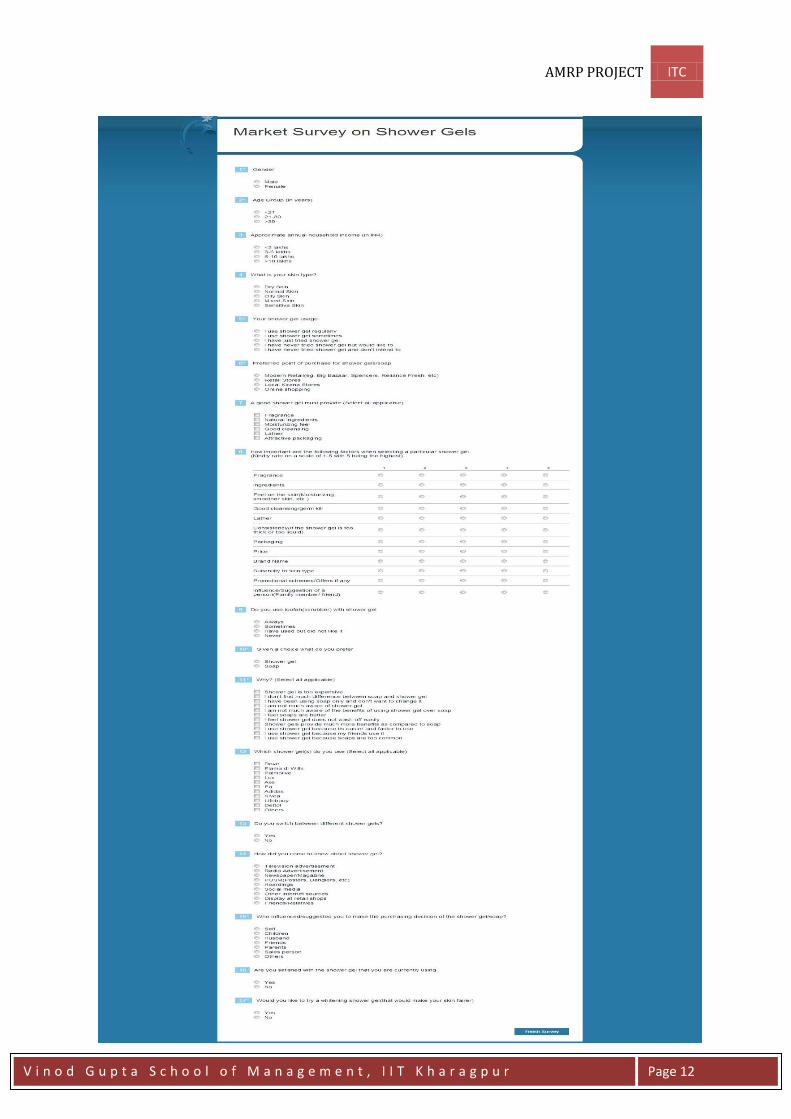
Method 3: Primary Research
Primary research was done by floating questionnaire among various people. There were 90
responses collected consisting of a healthy mix of men-women and users-non users.
Preparing Questionnaire
The questionnaire was prepared keeping in mind the required data parameters for analysis.
Link to questionnaire:
http://kwiksurveys.com/app/rendersurvey.asp?sid=qkj1d9smzqo8nj619136&refer=
The questionnaire was floated on various portals to collect responses creating an exhaustive sample
space for analysis purpose. Responses were collected for different age group and genders.
AMRP PROJECT ITC
V i n o d G u p t a S c h o o l o f M a n a g e m e n t , I I T K h a r a g p u r
Page 12
AMRP PROJECT ITC
V i n o d G u p t a S c h o o l o f M a n a g e m e n t , I I T K h a r a g p u r
Page 13
Results
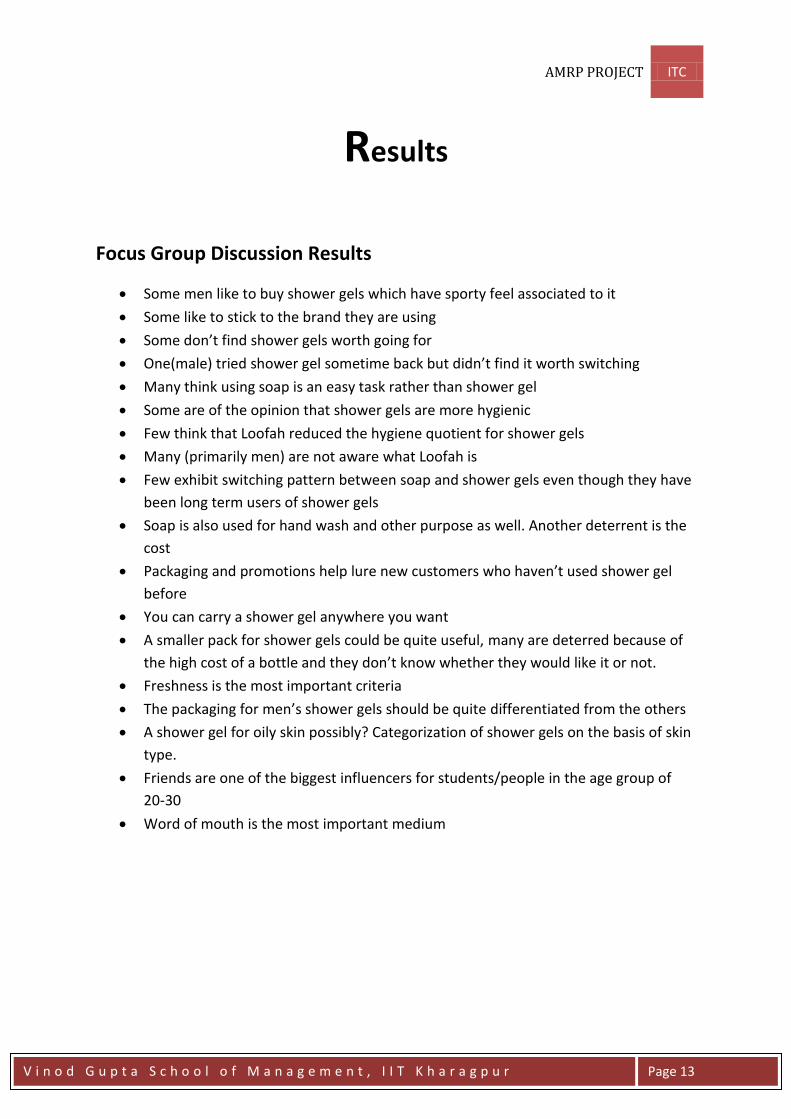
Focus Group Discussion Results
Some men like to buy shower gels which have sporty feel associated to it
Some like to stick to the brand they are using
Some don’t find shower gels worth going for
One(male) tried shower gel sometime back but didn’t find it worth switching
Many think using soap is an easy task rather than shower gel
Some are of the opinion that shower gels are more hygienic
Few think that Loofah reduced the hygiene quotient for shower gels
Many (primarily men) are not aware what Loofah is
Few exhibit switching pattern between soap and shower gels even though they have
been long term users of shower gels
Soap is also used for hand wash and other purpose as well. Another deterrent is the
cost
Packaging and promotions help lure new customers who haven’t used shower gel
before
You can carry a shower gel anywhere you want
A smaller pack for shower gels could be quite useful, many are deterred because of
the high cost of a bottle and they don’t know whether they would like it or not.
Freshness is the most important criteria
The packaging for men’s shower gels should be quite differentiated from the others
A shower gel for oily skin possibly? Categorization of shower gels on the basis of skin
type.
Friends are one of the biggest influencers for students/people in the age group of
20-30
Word of mouth is the most important medium
AMRP PROJECT ITC
V i n o d G u p t a S c h o o l o f M a n a g e m e n t , I I T K h a r a g p u r
Page 14
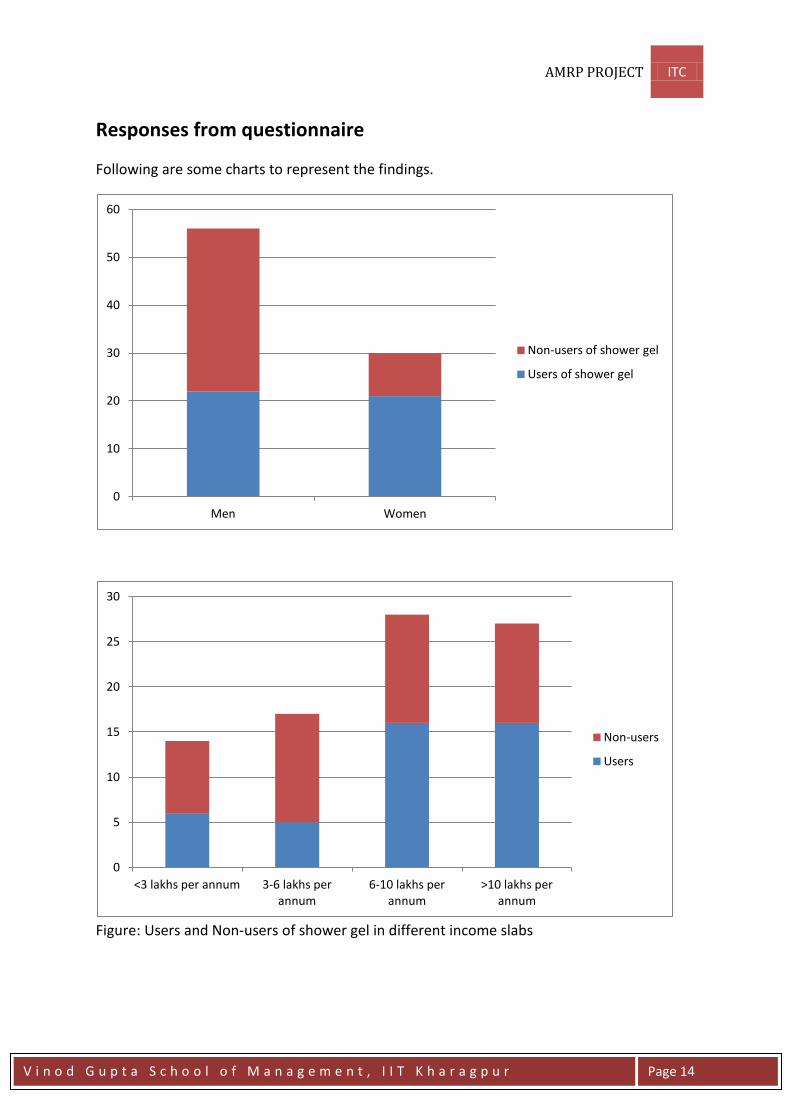
Responses from questionnaire
Following are some charts to represent the findings.
Figure: Users and Non-users of shower gel in different income slabs
0
10
20
30
40
50
60
Men Women
Non-users of shower gel
Users of shower gel
0
5
10
15
20
25
30
<3 lakhs per annum 3-6 lakhs per annum
6-10 lakhs per annum
>10 lakhs per annum
Non-users
Users

AMRP PROJECT ITC
V i n o d G u p t a S c h o o l o f M a n a g e m e n t , I I T K h a r a g p u r
Page 15
AMRP PROJECT ITC
V i n o d G u p t a S c h o o l o f M a n a g e m e n t , I I T K h a r a g p u r
Page 16
AMRP PROJECT ITC
V i n o d G u p t a S c h o o l o f M a n a g e m e n t , I I T K h a r a g p u r
Page 17

AMRP PROJECT ITC
V i n o d G u p t a S c h o o l o f M a n a g e m e n t , I I T K h a r a g p u r
Page 18
AMRP PROJECT ITC
V i n o d G u p t a S c h o o l o f M a n a g e m e n t , I I T K h a r a g p u r
Page 19
AMRP PROJECT ITC
V i n o d G u p t a S c h o o l o f M a n a g e m e n t , I I T K h a r a g p u r
Page 20
Factor Analysis Reports
KMO and Bartlett's Test
Kaiser-Meyer-Olkin Measure of Sampling Adequacy. .767
Bartlett's Test of Sphericity
Approx. Chi-Square 394.654
Df 66
Sig. .000
Communalities
Initial Extraction
VAR00001 1.000 .544
VAR00002 1.000 .566
VAR00003 1.000 .866
VAR00004 1.000 .808
VAR00005 1.000 .642
VAR00006 1.000 .735
VAR00007 1.000 .625
VAR00008 1.000 .628
VAR00009 1.000 .723
VAR00010 1.000 .861
VAR00011 1.000 .727
VAR00012 1.000 .643
Extraction Method: Principal
Component Analysis.
AMRP PROJECT ITC
V i n o d G u p t a S c h o o l o f M a n a g e m e n t , I I T K h a r a g p u r
Page 21
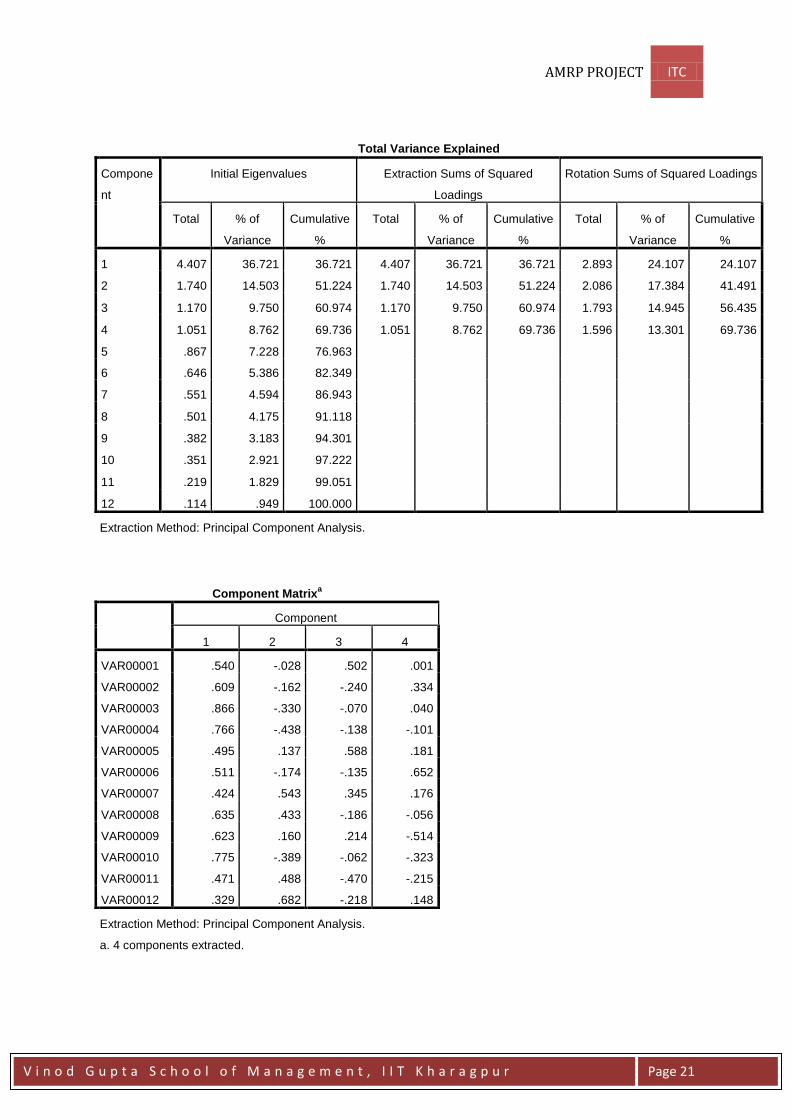
Total Variance Explained
Compone
nt
Initial Eigenvalues Extraction Sums of Squared
Loadings
Rotation Sums of Squared Loadings
Total % of
Variance
Cumulative
%
Total % of
Variance
Cumulative
%
Total % of
Variance
Cumulative
%
1 4.407 36.721 36.721 4.407 36.721 36.721 2.893 24.107 24.107
2 1.740 14.503 51.224 1.740 14.503 51.224 2.086 17.384 41.491
3 1.170 9.750 60.974 1.170 9.750 60.974 1.793 14.945 56.435
4 1.051 8.762 69.736 1.051 8.762 69.736 1.596 13.301 69.736
5 .867 7.228 76.963
6 .646 5.386 82.349
7 .551 4.594 86.943
8 .501 4.175 91.118
9 .382 3.183 94.301
10 .351 2.921 97.222
11 .219 1.829 99.051
12 .114 .949 100.000
Extraction Method: Principal Component Analysis.
Component Matrixa
Component
1 2 3 4
VAR00001 .540 -.028 .502 .001
VAR00002 .609 -.162 -.240 .334
VAR00003 .866 -.330 -.070 .040
VAR00004 .766 -.438 -.138 -.101
VAR00005 .495 .137 .588 .181
VAR00006 .511 -.174 -.135 .652
VAR00007 .424 .543 .345 .176
VAR00008 .635 .433 -.186 -.056
VAR00009 .623 .160 .214 -.514
VAR00010 .775 -.389 -.062 -.323
VAR00011 .471 .488 -.470 -.215
VAR00012 .329 .682 -.218 .148
Extraction Method: Principal Component Analysis.
a. 4 components extracted.
AMRP PROJECT ITC
V i n o d G u p t a S c h o o l o f M a n a g e m e n t , I I T K h a r a g p u r
Page 22
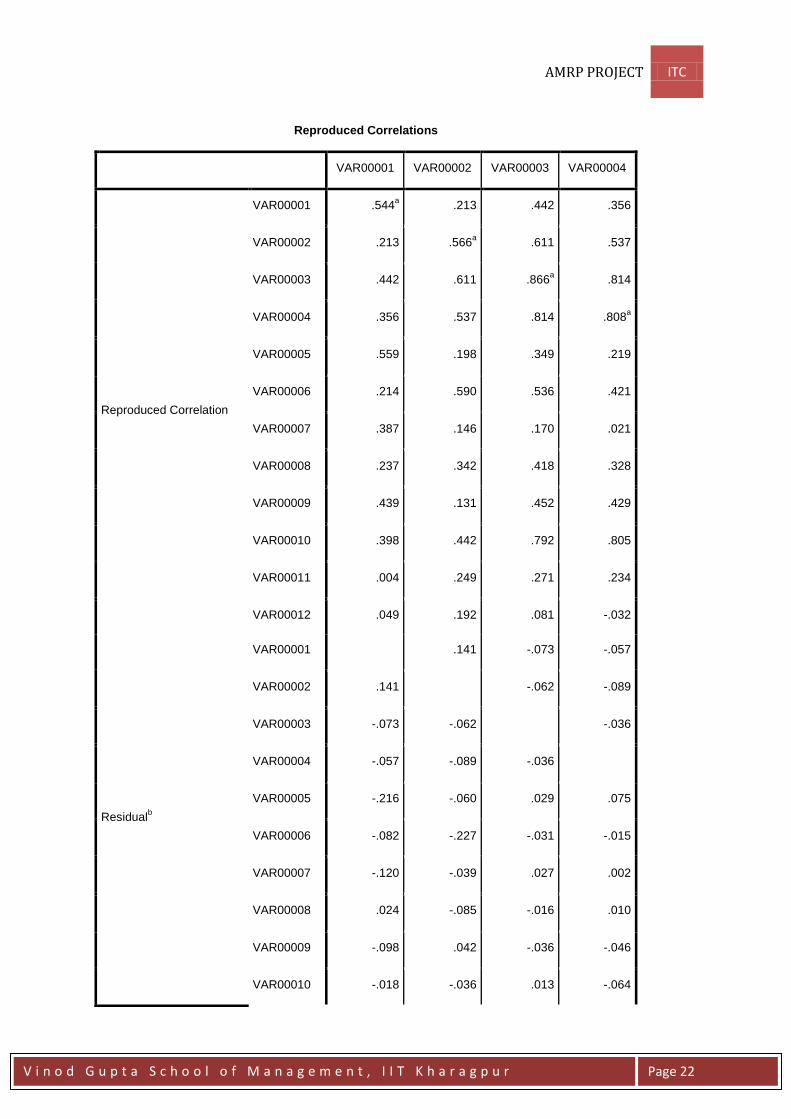
Reproduced Correlations
VAR00001 VAR00002 VAR00003 VAR00004
Reproduced Correlation
VAR00001 .544a .213 .442 .356
VAR00002 .213 .566a .611 .537
VAR00003 .442 .611 .866a .814
VAR00004 .356 .537 .814 .808a
VAR00005 .559 .198 .349 .219
VAR00006 .214 .590 .536 .421
VAR00007 .387 .146 .170 .021
VAR00008 .237 .342 .418 .328
VAR00009 .439 .131 .452 .429
VAR00010 .398 .442 .792 .805
VAR00011 .004 .249 .271 .234
VAR00012 .049 .192 .081 -.032
Residualb
VAR00001 .141 -.073 -.057
VAR00002 .141 -.062 -.089
VAR00003 -.073 -.062 -.036
VAR00004 -.057 -.089 -.036
VAR00005 -.216 -.060 .029 .075
VAR00006 -.082 -.227 -.031 -.015
VAR00007 -.120 -.039 .027 .002
VAR00008 .024 -.085 -.016 .010
VAR00009 -.098 .042 -.036 -.046
VAR00010 -.018 -.036 .013 -.064
AMRP PROJECT ITC
V i n o d G u p t a S c h o o l o f M a n a g e m e n t , I I T K h a r a g p u r
Page 23
VAR00011 .019 -.046 -.014 .005
VAR00012 .082 .063 .025 .026
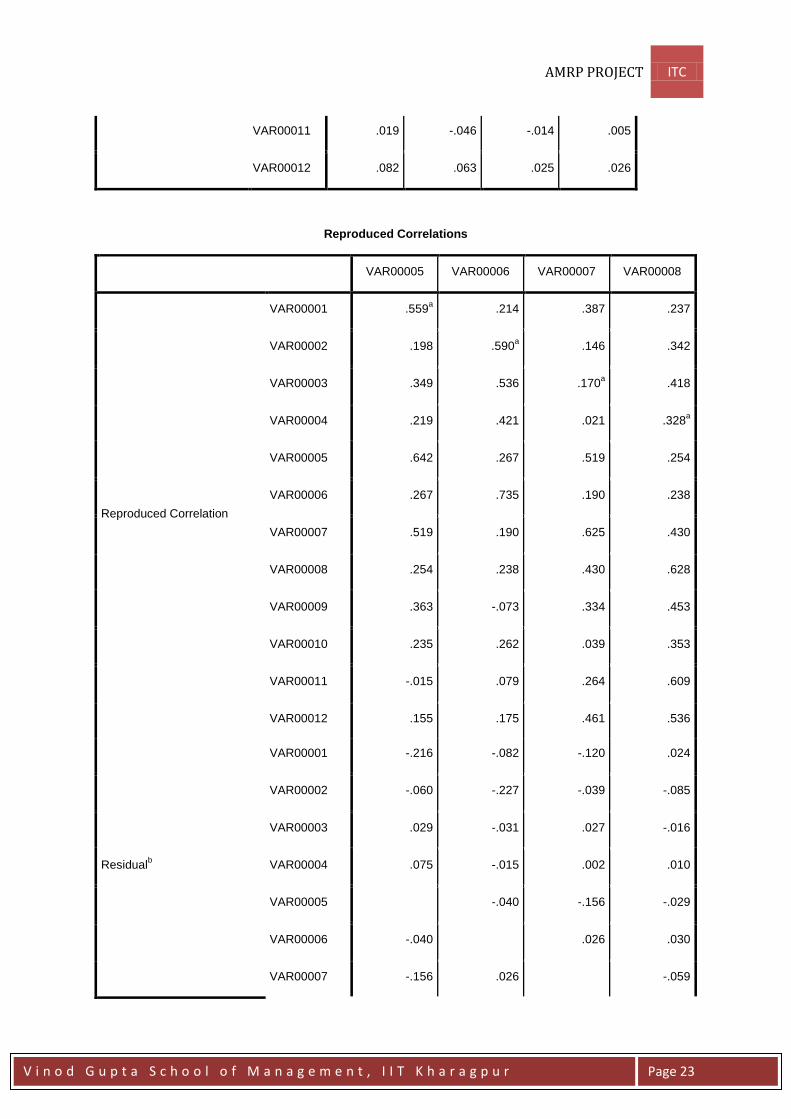
Reproduced Correlations
VAR00005 VAR00006 VAR00007 VAR00008
Reproduced Correlation
VAR00001 .559a .214 .387 .237
VAR00002 .198 .590a .146 .342
VAR00003 .349 .536 .170a .418
VAR00004 .219 .421 .021 .328a
VAR00005 .642 .267 .519 .254
VAR00006 .267 .735 .190 .238
VAR00007 .519 .190 .625 .430
VAR00008 .254 .238 .430 .628
VAR00009 .363 -.073 .334 .453
VAR00010 .235 .262 .039 .353
VAR00011 -.015 .079 .264 .609
VAR00012 .155 .175 .461 .536
Residualb
VAR00001 -.216 -.082 -.120 .024
VAR00002 -.060 -.227 -.039 -.085
VAR00003 .029 -.031 .027 -.016
VAR00004 .075 -.015 .002 .010
VAR00005 -.040 -.156 -.029
VAR00006 -.040 .026 .030
VAR00007 -.156 .026 -.059
AMRP PROJECT ITC
V i n o d G u p t a S c h o o l o f M a n a g e m e n t , I I T K h a r a g p u r
Page 24
VAR00008 -.029 .030 -.059
VAR00009 -.045 .140 -.040 -.045
VAR00010 -.037 .008 .096 -.052
VAR00011 .108 .024 .039 -.121
VAR00012 .012 -.091 -.186 -.128
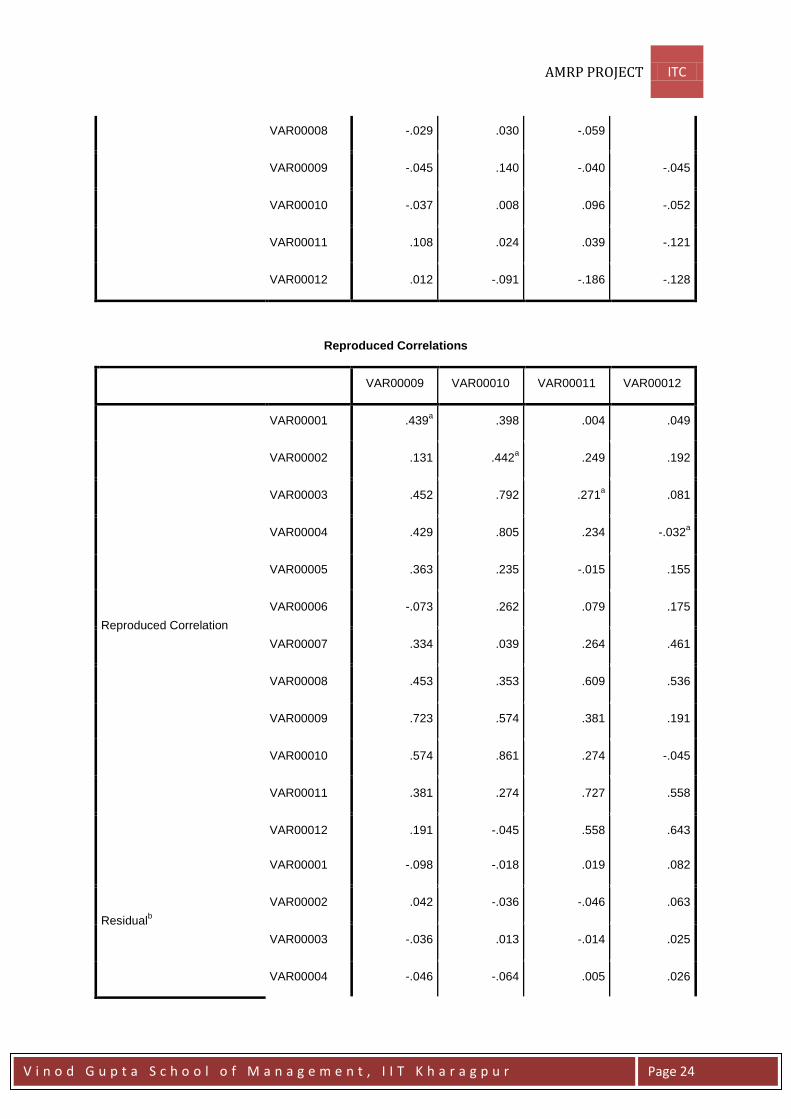
Reproduced Correlations
VAR00009 VAR00010 VAR00011 VAR00012
Reproduced Correlation
VAR00001 .439a .398 .004 .049
VAR00002 .131 .442a .249 .192
VAR00003 .452 .792 .271a .081
VAR00004 .429 .805 .234 -.032a
VAR00005 .363 .235 -.015 .155
VAR00006 -.073 .262 .079 .175
VAR00007 .334 .039 .264 .461
VAR00008 .453 .353 .609 .536
VAR00009 .723 .574 .381 .191
VAR00010 .574 .861 .274 -.045
VAR00011 .381 .274 .727 .558
VAR00012 .191 -.045 .558 .643
Residualb
VAR00001 -.098 -.018 .019 .082
VAR00002 .042 -.036 -.046 .063
VAR00003 -.036 .013 -.014 .025
VAR00004 -.046 -.064 .005 .026

AMRP PROJECT ITC
V i n o d G u p t a S c h o o l o f M a n a g e m e n t , I I T K h a r a g p u r
Page 25
VAR00005 -.045 -.037 .108 .012
VAR00006 .140 .008 .024 -.091
VAR00007 -.040 .096 .039 -.186
VAR00008 -.045 -.052 -.121 -.128
VAR00009 -.062 -.100 .036
VAR00010 -.062 .007 .010
VAR00011 -.100 .007 -.152
VAR00012 .036 .010 -.152
Extraction Method: Principal Component Analysis.
a. Reproduced communalities
b. Residuals are computed between observed and reproduced correlations. There are 29 (43.0%)
nonredundant residuals with absolute values greater than 0.05.
Rotated Component Matrixa
Component
1 2 3 4
VAR00001 .343 -.018 .648 .078
VAR00002 .368 .199 .065 .622
VAR00003 .762 .128 .226 .467
VAR00004 .821 .044 .074 .355
VAR00005 .131 .037 .776 .148
VAR00006 .137 .071 .160 .828
VAR00007 -.092 .436 .648 .082
VAR00008 .282 .693 .220 .139
VAR00009 .595 .343 .407 -.294
VAR00010 .906 .076 .120 .137
VAR00011 .247 .809 -.102 .006
VAR00012 -.156 .757 .162 .142
Extraction Method: Principal Component Analysis.
Rotation Method: Varimax with Kaiser Normalization.
a. Rotation converged in 6 iterations.
AMRP PROJECT ITC
V i n o d G u p t a S c h o o l o f M a n a g e m e n t , I I T K h a r a g p u r
Page 26
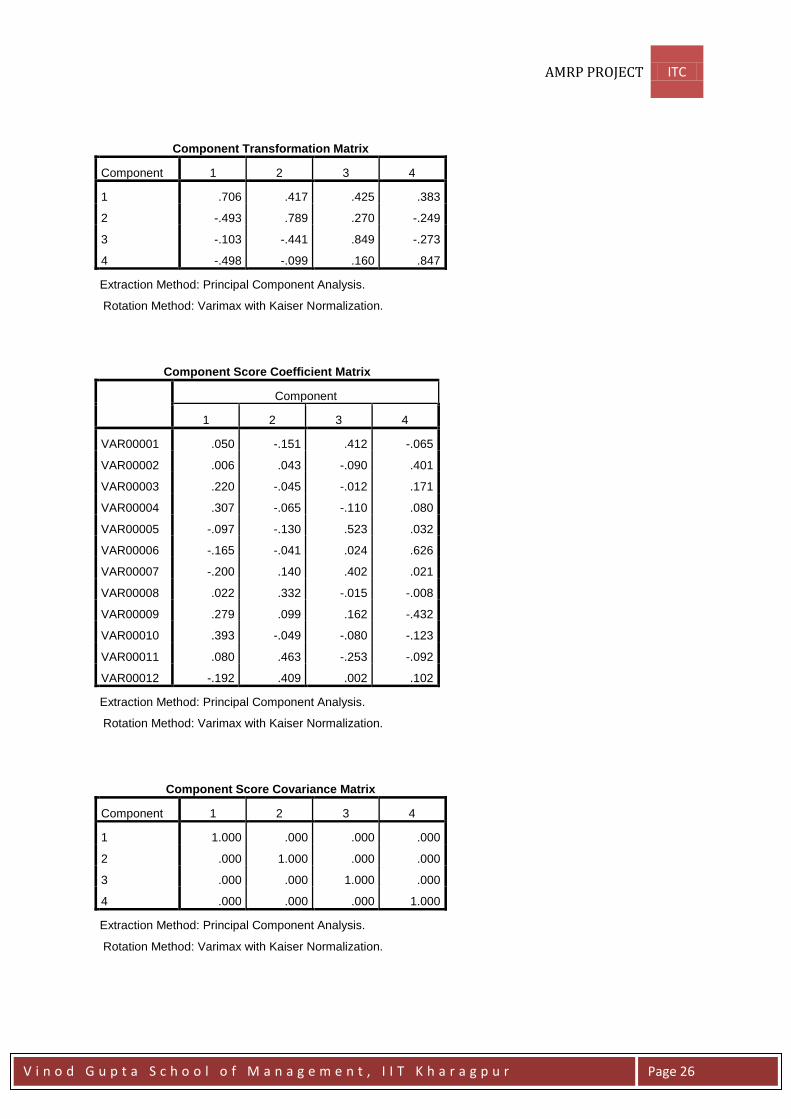
Component Transformation Matrix
Component 1 2 3 4
1 .706 .417 .425 .383
2 -.493 .789 .270 -.249
3 -.103 -.441 .849 -.273
4 -.498 -.099 .160 .847
Extraction Method: Principal Component Analysis.
Rotation Method: Varimax with Kaiser Normalization.
Component Score Coefficient Matrix
Component
1 2 3 4
VAR00001 .050 -.151 .412 -.065
VAR00002 .006 .043 -.090 .401
VAR00003 .220 -.045 -.012 .171
VAR00004 .307 -.065 -.110 .080
VAR00005 -.097 -.130 .523 .032
VAR00006 -.165 -.041 .024 .626
VAR00007 -.200 .140 .402 .021
VAR00008 .022 .332 -.015 -.008
VAR00009 .279 .099 .162 -.432
VAR00010 .393 -.049 -.080 -.123
VAR00011 .080 .463 -.253 -.092
VAR00012 -.192 .409 .002 .102
Extraction Method: Principal Component Analysis.
Rotation Method: Varimax with Kaiser Normalization.
Component Score Covariance Matrix
Component 1 2 3 4
1 1.000 .000 .000 .000
2 .000 1.000 .000 .000
3 .000 .000 1.000 .000
4 .000 .000 .000 1.000
Extraction Method: Principal Component Analysis.
Rotation Method: Varimax with Kaiser Normalization.
AMRP PROJECT ITC
V i n o d G u p t a S c h o o l o f M a n a g e m e n t , I I T K h a r a g p u r
Page 27
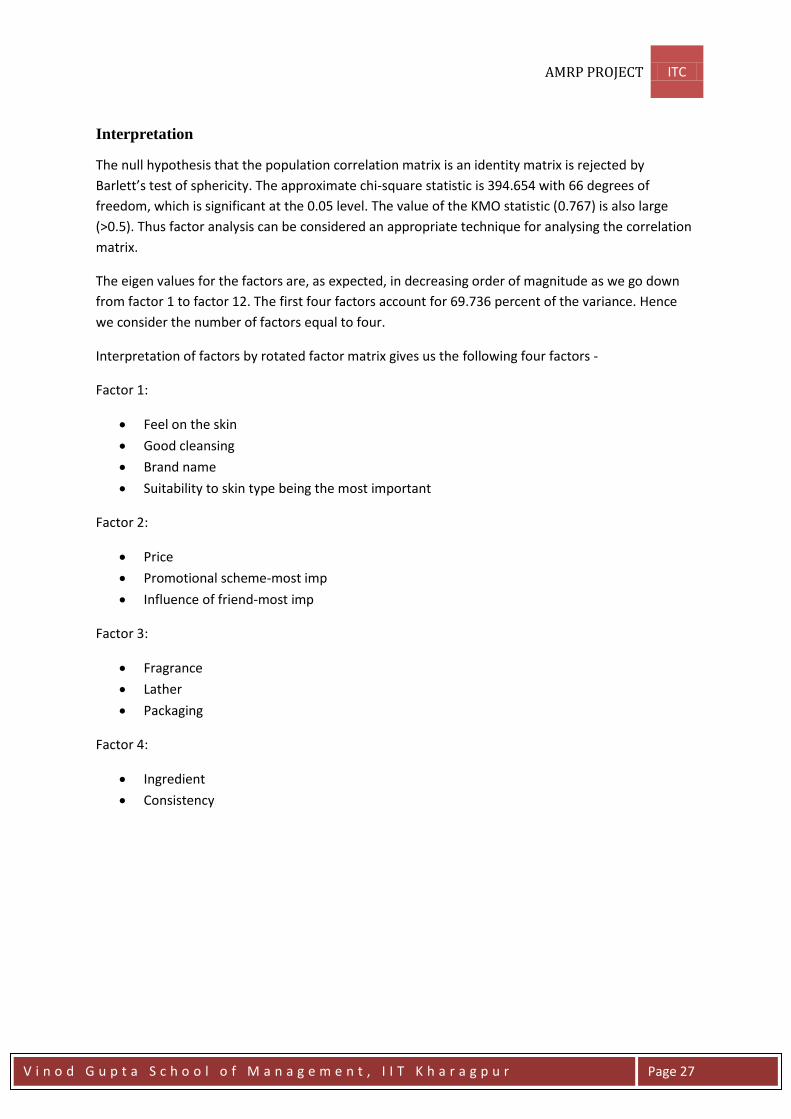
Interpretation
The null hypothesis that the population correlation matrix is an identity matrix is rejected by
Barlett’s test of sphericity. The approximate chi-square statistic is 394.654 with 66 degrees of
freedom, which is significant at the 0.05 level. The value of the KMO statistic (0.767) is also large
(>0.5). Thus factor analysis can be considered an appropriate technique for analysing the correlation
matrix.
The eigen values for the factors are, as expected, in decreasing order of magnitude as we go down
from factor 1 to factor 12. The first four factors account for 69.736 percent of the variance. Hence
we consider the number of factors equal to four.
Interpretation of factors by rotated factor matrix gives us the following four factors -
Factor 1:
Feel on the skin
Good cleansing
Brand name
Suitability to skin type being the most important
Factor 2:
Price
Promotional scheme-most imp
Influence of friend-most imp
Factor 3:
Fragrance
Lather
Packaging
Factor 4:
Ingredient
Consistency
AMRP PROJECT ITC
V i n o d G u p t a S c h o o l o f M a n a g e m e n t , I I T K h a r a g p u r
Page 28
Way Ahead
• Meeting distributors
• Increasing the scope of primary research
• Customer data analysis
• Recommendations for the marketing strategy
I plan to increase the primary research getting more responses on the questionnaire which
would help me give better and true picture of the results for analysis. Also, I could meet
some distributors to gain better insights into the market scenario. On the basis of these
analyses done, I would be able to recommend marketing strategy to ITC for shower gels.
AMRP PROJECT ITC
V i n o d G u p t a S c h o o l o f M a n a g e m e n t , I I T K h a r a g p u r
Page 29
References
• N.Pag. The 2011-2016 Outlook for Body Wash and shower gels in India. Country
Outlook Reports. Retrieved from http://bit.ly/P9mvAD
• Gihan Wijesundera, Ruwan Abeysekera. Factors influencing the demand of beauty
soap among female consumers in the greater Colombo region. Retrieved from
http://bit.ly/RSwp63
• Mason, S. (2006). Shower Power. Global Cosmetic Industry, 174(11), 47-49.
Retrieved from http://bit.ly/Qqx0dj


