
United Utilities
AMP7 performance commitments and outcome delivery incentives
Definition document

AMP7 performance commitments and outcome delivery incentives: definition document 2
Table of Contents Outcome delivery – Introduction to performance commitments and ODIs .......................................... 4
Performance commitments ................................................................................................................ 5
Outcome delivery incentives (ODIs) ................................................................................................... 6
Outcome A – Your drinking water is safe and clean ............................................................................... 7
Water quality compliance - CRI (A01-CF) ............................................................................................ 8
Reducing the need for customers to contact us about taste and smell of their drinking water (A02-
WN) ................................................................................................................................................... 14
Number of properties with lead risk reduced (A03-WN) ................................................................. 19
Helping customers look after water in their home (A04-WN) .......................................................... 23
Reducing discolouration from the Vyrnwy treated water aqueduct (A05-WN) ............................... 26
Outcome B – You have a reliable supply of water now and in the future ............................................ 30
Leakage (B01-WN) ............................................................................................................................ 31
Mains repairs (B02-WN) .................................................................................................................... 35
Interruptions to supply (B03-WN) .................................................................................................... 39
Unplanned outage (B04-CF) .............................................................................................................. 45
Per capita consumption (B05-WN) ................................................................................................... 51
Drought risk resilience (B06-CF) ....................................................................................................... 55
Reducing areas of low water pressure (B07-WN) ............................................................................. 60
Water service resilience (B08-WN) ................................................................................................... 66
Manchester and Pennine resilience (B09-DP) .................................................................................. 70
Keeping reservoirs resilient (B10-WR) .............................................................................................. 73
Thirlmere transfer into West Cumbria - AMP7 (B11-WN) ................................................................ 77
Outcome C – The natural environment is protected and improved .................................................... 79
Pollution incidents (C01-WWN) ........................................................................................................ 80
Treatment works compliance (C02-CF) ............................................................................................. 85
Abstraction incentive mechanism (C03-WR) .................................................................................... 90
Improving the water environment (C04-WR) ................................................................................... 95
Improving river water quality (C05-WWN) ..................................................................................... 103
Protecting the environment from growth and new development (C06-WWN) ............................ 110
Enhancing natural capital value for customers (C08-CF) ................................................................ 115
Recycling biosolids (C09-BR) ........................................................................................................... 126
Better air quality (C10-BR) .............................................................................................................. 132
Outcome D – You’re highly satisfied with our service and find it easy to do business with us .......... 137
C-MeX (D01-HH) .............................................................................................................................. 138
D-MeX (D02-CF) .............................................................................................................................. 141
AMP7 performance commitments and outcome delivery incentives: definition document 3
Priority services for customers in vulnerable circumstances (D03-HH) ......................................... 144
Street works performance (D04-CF) ............................................................................................... 147
Priority services - BSI accreditation (D05-HH) ................................................................................ 150
Outcome E – We will improve the way we work to keep bills down and improve services .............. 152
Number of customers lifted out of water poverty (E01-HH) .......................................................... 153
Non-household vacancy incentive (E03-CF) ................................................................................... 157
Gap sites - Wholesale (E04-CF) ....................................................................................................... 161
Gap sites – Retail (E05-HH) ............................................................................................................. 165
Systems thinking capability (E06-CF) .............................................................................................. 168
Successful delivery of direct procurement of Manchester and Pennine resilience (E07-DP) ........ 171
Customers say that we offer value for money (E09-HH) ................................................................ 174
Voids (E010-DP) .............................................................................................................................. 176
Outcome F – We collect and recycle your wastewater ...................................................................... 178
Sewer collapses (F01-WWN) ........................................................................................................... 179
Sewer blockages (F02-WWN) ......................................................................................................... 183
Outcome G – The risk of sewer flooding for homes and businesses is reduced ................................ 188
Risk of sewer flooding in a storm (G01-WWN) ............................................................................... 189
Internal sewer flooding (G02-WWN) .............................................................................................. 195
External sewer flooding incidents (G03-WWN) .............................................................................. 200
Raising customer awareness to reduce the risk of flooding (G04-WWN) ...................................... 206
Hydraulic internal flood risk resilience (G05-WWN) ....................................................................... 211
Hydraulic external flood risk resilience (G06-WWN) ...................................................................... 219

AMP7 performance commitments and outcome delivery incentives: definition document 4
Outcome delivery – Introduction to performance commitments and
ODIs The outcome of a price review is a defined price and service package that companies are tasked to deliver for customers, the environment and other stakeholders. Delivery of service is described through a series of customer-focused outcomes which in turn are supported by more granular performance commitments.
We routinely report performance against these outcomes and performance commitments to customers, stakeholders and regulators, including to the YourVoice customer and stakeholder panel.
Having performance information that is easy to understand and navigate allows customers and other stakeholders to challenge water and sewerage companies on their performance and encourages them to deliver better levels of service. This helps everyone build trust and confidence.
We have committed to seven outcomes for the AMP7 period (2020–25):
Your drinking water is safe and clean.
You have a reliable supply of water now and in the future.
The natural environment is protected and improved in the way we deliver our services.
You’re highly satisfied with our service and find it easy to do business with us.
We will improve the way we work to keep bills down and improve services for you and future customers.
We collect and recycle your wastewater.
The risk of sewer flooding for homes and businesses is reduced.

AMP7 performance commitments and outcome delivery incentives: definition document 5
Performance commitments Underpinning each outcome is a set of performance commitments. These are service targets for specific types of activities that we undertake to deliver. If we achieve or outperform against these targets, then this supports the delivery of outcomes for customers, the environment and other stakeholders. Performance commitments are designed to be stretching and deliver an improved level of performance for customers and stakeholders compared to the levels achieved in the past.
There are 15 performance commitments that are being applied to all water companies during AMP7. These are ‘common measures’ and each has a standard definition set by Ofwat. These common measures are then supplemented by ‘bespoke’ performance commitments which reflect additional levels of service or focus for investment which are specific to each company’s customers.
We need to deliver against 46 performance commitments in the AMP7 Final Determination, comprising the 15 common measures and 31 bespoke measures which are specific to UU.
AMP7 performance commitments and outcome delivery incentives: definition document 6
Outcome delivery incentives (ODIs)
Outcome delivery incentives (ODIs) are incentives which apply to performance commitments.
There are four types of ODI incentive which can apply to performance commitments. These are:
Underperformance only – This is a financially driven incentive. When performance is worse than the target or deadband level, this results in an underperformance payment.
Outperformance only – This is a financially driven incentive. When performance is better than the target or deadband level, this results in an outperformance payment.
Underperformance and outperformance – This is a financially driven set of incentives.
Underperformance payments are incurred when performance is worse than the target or deadband
level, outperformance payments apply when performance is better.
Non-financial – This is an incentive driven by reputation only. Poor performance could cause reputational damage but good performance could enhance our reputation, but no direct financial incentives are applied.
39 of our 46 performance commitments have a financial incentive. The other seven performance commitments do not have a financial incentive and are therefore driven by reputation only.
Some ODIs have an outperformance cap or underperformance collar, beyond this point no further incentive is applied. Some performance commitments include a deadband. This is a narrow range of performance above and/or below the target level within which the company can operate without being subject to financial incentives. For measures without a deadband, any incentive applies as soon as our performance is above or below the target level for the performance commitment.
Most ODIs are applied on an annual basis during the AMP. These are referred to as ‘in-period’
incentives. Some ODIs, however, are applied only at the end of the AMP. These are known as ‘end of
period’ incentives.

AMP7 performance commitments and outcome delivery incentives: definition document 7
Outcome A – Your drinking water is safe and clean
Customers want a reliable supply of high quality water that they trust. To deliver this outcome we will continue to ensure water quality is at the heart of our decision making, achieving a significant reduction in water quality events and an improvement in the aesthetic parameters that impact customers’ perceptions of water quality. Our water quality vision is 100% compliance with current and future drinking water quality standards, providing a reliable supply of safe clean drinking water for future generations.

AMP7 performance commitments and outcome delivery incentives: definition document 8
Water quality compliance - CRI (A01-CF)
Purpose of this measure
The performance commitment incentivises the company to fully comply with water quality and
sufficiency statutory obligations and to mitigate any issues affecting performance.
Benefits of this measure
This performance commitment incentivises companies to fully comply with statutory obligations
which promotes customer confidence that water is clean and safe to drink.
Measure Description
The compliance risk index (CRI) is an industry common measure of drinking water quality that has been defined by the water quality regulator, the Drinking Water Inspectorate (DWI). Performance against this measure is calculated by the DWI and reported on a calendar year basis. It has replaced the mean zonal compliance metric which was in use during AMP6.
This measure is defined by the Drinking Water Inspectorate within their 28 March 2018 guidance
document DWI Compliance Risk Index (CRI) as: ‘The Compliance Risk Index (CRI) is a measure
designed to illustrate the risk arising from treated water compliance failures, and it aligns with the
current risk based approach to regulation of water supplies used by the Drinking Water Inspectorate
(DWI). All compliance failures are assessed by DWI using the provisions of the Water Industry Act
1991. In doing so, DWI has regard to its published Enforcement Policy1 (Securing safe, clean drinking
water for all), and it also follows the principles of ‘better regulation’ to scrutinise company
performance on the basis of their risk of failing to meet the requirements of the Regulations.’
CRI is calculated by the DWI taking into account not just an absolute number of water quality
failures, but also:
The significance of the parameter failing the standard.
An impact effect, e.g. scale of population affected or size of water treatment works or service
reservoir.
The cause of the failure together with the company’s handling of the failure by means of
measuring the need for regulatory intervention.
Decreasing numbers indicate improving performance.
Measure Definition
The definition for this performance commitment was set by the Drinking Water Inspectorate (DWI)
in collaboration with the industry. This is published as DWI Compliance Risk Index (CRI), August 2018:
https://www.ofwat.gov.uk/wp-content/uploads/2019/12/DWI-Compliance-Risk-Index-CRI_Def.pdf
A CRI score is calculated for every individual compliance failure at water supply zones, supply points,
treatment works and service reservoirs. The annual CRI for a company, for any given calendar year,
is the sum of the individual CRI scores for every compliance failure reported during the year. The
calculation is summarised below (see the link above: DWI Compliance Risk Index for further detail on
the full calculations).
1 http://www.dwi.gov.uk/about/our-strategic-plan/dwi-enforcement.pdf

AMP7 performance commitments and outcome delivery incentives: definition document 9
This measure is an index which is calculated by the DWI and reported in July of each year, within the
Chief Inspector’s Report.
A CRI score is calculated for every individual compliance failure as follows:
i. Water supply zones:
CRI = Parameter Score x Assessment Score x Population affected Total company population served
ii. Supply Points and treatment works:
CRI = Parameter Score x Assessment Score x volume supplied (m3/day)
Total daily volume supplied by the company (m3/day)
iii. Service reservoirs:
CRI = Parameter Score x Assessment Score x reservoir capacity (m3)
Total service reservoir capacity of the company (m3)
The annual CRI for a company, for any given calendar year, is the sum of the individual CRI scores for
every compliance failure reported during the year. The resulting number has no units, and as this is a
common measure, can be used to compare the performance of each of the water companies. The
individual elements are defined below:
Parameter score
Compliance failures for different parameters do not pose equal risk to consumers. The standards in
the Regulations are based on different criteria: whilst some are set on a human health basis, others
are based on aesthetic concerns. Those parameters that could pose a risk to human health attract a
higher score in CRI. The scores are set by the DWI and laid out in their definition document so they
are consistent across the industry.
The CRI Parameter score reflects this difference and scores allocated for each as follows:
Basis for standard Score
Health Risk 5
Health Risk Indicator 4
Aesthetic 3
Regulatory Impact 2
Non Health Risk Indicator 1
Assessment score
All compliance failures are assessed to ensure that the wellbeing and interests of consumers were
protected by best practice in management of compliance failures. The DWI assessment score
includes a view on the root cause of the failure and whether it could have been avoided as well as
the company’s response. A well-managed response to a compliance failure with appropriate and
speedy mitigation action poses a lower risk to consumers.

AMP7 performance commitments and outcome delivery incentives: definition document 10
Score DWI Inspector assessment
5 Enforce
4 Covered by legal instrument
3 Enforcement considered
2 Recommendations made
2 Suggestions made
1 Trivial
1 Unlikely to recur
1 Incorrect data
0 Outside operational limits
Impact score
This element accounts for the likely impact of the compliance failure and to reflect the potential
number of people that may have been impacted by any infringement. The score for this element is
related to the asset where the infringing sample was taken:
For company assets this impact element relates to the size of the asset (output of water
treatment works and capacity of service reservoirs).
For failures occurring in water supply zones (WSZ) the impact will tend to relate to the size of
the whole zone. The impact will therefore default to the population of the whole WSZ
Supply points and water supply zones: For some parameters, for example lead and pH, the amount
found in the treated water can change because of interaction with the water supply pipes. The
samples have to be collected from a customer’s tap, and are known as water supply zone samples.
For other parameters found in drinking water, for example pesticides, the amounts found in the
drinking water do not change in the water distribution network. These unchanged parameters can
be collected from the water treatment works ‘or a designated supply point’ and do not need to be
sampled in a water supply zone. For these parameters, the water treatment works or ‘location
nominated’ is known as a supply point.
Special rules
A limited number of risks may manifest themselves to a smaller population than the whole WSZ.
Under this circumstance there is the option for DWI to consider whether the failure can be assigned
to the Domestic Distribution System, or in the case of Lead, to the District Metered Area. The smaller
population options will be fixed.
ii. Impact scores related to Domestic Distribution Systems (DDS)
The burden of proof rests with the company to provide compelling evidence that the DDS is the root
cause of the failure. If the Inspectorate agree that the failure was caused by and isolated to the
domestic system the impact (population) will automatically reduce to:
• 2.4 – Occurred at a single property (compelling evidence required)
• 50 – Occurred at a public building
iii. Impact scores related to District Metered Areas (DMAs) - applies to lead failures only.
The burden of proof rests with the company to demonstrate the effectiveness of the company
plumbosolvency strategy within the DMA. Companies will be expected to carry out a full and
thorough investigation to include:
1. A review of plumbosolvency measures in place.

AMP7 performance commitments and outcome delivery incentives: definition document 11
2. Whether there are other properties in the DMA with lead supply and communication pipes.
3. If there are other sources that might contribute to the lead failure apart from lead pipe. If the
company’s investigation can demonstrate that the plumbosolvency strategy is effective within the
DMA and that the lead failure was an isolated, property specific failure then the single property
multiplier above will be used. If the investigation cannot establish this, the fixed population of 1,000
(a standardised DMA) will be used as the default multiplier. If the WSZ is < 1,000 the whole zone
population will be used.
Measurement units
This is a numerical index score reported to two decimal places. It will be measured on a calendar
year basis to align with DWI reporting. The measure will be provisionally reported by the end of April
each year, covering the previous calendar year (i.e. CRI for 2020 will be reported at the end of April
2021). This will include CRI scores for all compliance failures that occurred in the relevant calendar
year. There may be a small number of compliance failures where investigations are still ongoing at
the end of April. For these an estimation of the CRI will be included based on the evidence to date.
An updated CRI will be reported in the Chief Inspector’s Report in July by which time all compliance
failure assessments for that year will have been completed.
Mitigation/exceptions/assumptions
There are no specific exclusions, however, for some special rules on calculation of risk score refer to the DWI definition.
The impact of the European Union adoption of a proposed revision to the Drinking Water Directive has not been considered within the commitments/targets of this performance measure.
Common performance commitment
This is a common performance commitment developed by Ofwat for AMP7.
Incentive type
Financial – underperformance payment only
Price control allocation
Water resources
Water network+
Wastewater network+
Bioresources Residential retail
Business retail Direct procurement
10% 90% 0% 0% 0% 0% 0%
This measure has been split across the water resources and water network+ price controls due to
there being an element of control of water quality parameters with our water resources catchment
management activities. Implementation of the safeguard zones means that steps are taken to
reduce levels of nitrates, pesticides and algae management (which has a significant risk for
organoleptic taste and odour related compounds, geosmin and 2-methylisoborneol (2MIB)). Whilst
the majority of control for these parameters falls at the water treatment works, they can be reduced
by effective catchment management to reduce the cost and increase the effectiveness of removal at
the treatment works.
Performance commitment for AMP7
Our target for AMP7 is set at zero. This is extremely challenging for us to meet. CRI performance is
volatile due to the inclusion of a risk based factor associated with the nature of the infringement, the
impact of the infringement location and assessor score. There is also the impact of failures

AMP7 performance commitments and outcome delivery incentives: definition document 12
associated with customer’s plumbing or fittings. This will impact the CRI score despite the very
limited control over these variable exercised by companies.
For reporting purposes the data reported in financial year 2020/21 aligns to the information
reported to the DWI for calendar year 2020.
Figure 1
Deadbands, caps and collars
Outcome Delivery Incentive
This measure is subject to an underperformance penalty only, which will be reconciled on an in-period
basis.
Unit
AMP7
2020/21 2021/22 2022/23 2023/24 2024/25
Calendar year 2020
Calendar year 2021
Calendar year 2022
Calendar year 2023
Calendar year 2024
Index Score 0.00 0.00 0.00 0.00 0.00
Unit AMP7
2020/21 2021/22 2022/23 2023/24 2024/25
Calendar year 2020
Calendar year 2021
Calendar year 2022
Calendar year 2023
Calendar year 2024
Underperformance collar
Index score 9.50 9.50 9.50 9.50 9.50
Underperformance deadband
Index score 2.00 2.00 2.00 2.00 2.00

AMP7 performance commitments and outcome delivery incentives: definition document 13
Underperformance outperformance incentive rate
This measure is subject to an underperformance penalty only, which has been set at £1.125m per
CRI point.
Worked examples
If in any year our performance resulted in an annual score of 1.20, the index value would be within the deadband (it is above the target of zero but below the deadband of 2.00), therefore no underperformance payment would be applied.
If our performance resulted in an annual score of 5.10, this would be above the deadband of 2.00 (and below the cap of 9.50), an underperformance payment would be incurred. The value of the underperformance payment would be calculated as:
Underperformance payment = (actual performance – underperformance deadband) x incentive rate
= (5.10 – 2.00) x -£1,125,000 = -£3,487,500 underperformance
If in any year our performance resulted in an annual score of 10.00, this would be above the cap of 9.50, an underperformance payment would be incurred but capped at the performance level of 9.50.
= (9.50 – 2.00) x -£1,125,000 = -£8,437,500 underperformance
Long-term ambition
Our long term ambition is to:
Show an improving and sustainable trend in water quality performance and the compliance risk
index.
See customers reduce their consumption of bottled water because they are confident in the
quality of tap water.
Have a service that is 100% compliant with regulatory, quality and environmental requirements,
and trusted by our community and stakeholders.

AMP7 performance commitments and outcome delivery incentives: definition document 14
Reducing the need for customers to contact us about taste and
smell of their drinking water (A02-WN)
Purpose of this measure
The performance commitment incentivises the company to reduce water quality contacts relating to
appearance, taste and odour.
Benefits of this measure
This performance commitment improves the appearance, taste and odour of drinking water by
incentivising the company to reduce the number of customer contacts it received in relation to the
appearance of drinking water.
Measure Description
The number of times the company is contacted due to the appearance, taste and odour of drinking
water, reported per 10,000 resident population.
Measure Definition
This measure counts the number of customer contacts received due to appearance, taste and odour. The number stated reflects the information reported in the Drinking Water Inspectorate Chief Inspector’s Report on Drinking Water. The contacts counted use the definitions outlined in the Drinking Water Inspectorate’s Information Letter 1/2006 which was issued on 6th January 2006. Should there be any future Drinking Water Inspectorate revision of the definition, our performance commitment will continue to be monitored against the criteria within information letter 1/2006 until the end of AMP7.
A contact should only be included when it is clear that the consumer’s concern about their drinking
water quality is clearly based on an observation (or a perception) that its appearance is other than
“normal”. Contacts included are those by phone, letter, email, in person, completion of web forms,
messages left on a helpline and water quality contacts on social media (where the matter is
associated with an address within our region and the address is obtained).
Customer contacts are only recorded if they relate to drinking water that is supplied within our region and falls into one of the categories below:
Discoloured water – brown/black/orange the colour of the water is the focus of the contact even
though this may be understood by the company to be accompanied by mains deposits suspended in
the water (also include here staining of laundry due to discoloured water and concerns arising from
problems with tanks and boilers due to mains deposits after a burst).
Discoloured water – blue/green the colour of the water is the focus of the contact (do not include
here if the colour is only mentioned as being present on deposits adherent to a tap, bath or shower
tiles/tray – these should be recorded in the General Conditions category, see below).
Particles – the focus is reported as visible particles, either floating in the water or settled out in the
bottom of a glass or jug (the water would be reported as clear).
White – air the contact refers to white or milky looking water and the glass test confirms that the
cloudiness clears from the bottom up leaving no sediment.
White – chalk the contact refers to white or milky looking water and the glass test confirms that the
cloudiness clears from the top down leaving white sediment on the bottom.

AMP7 performance commitments and outcome delivery incentives: definition document 15
Animalcules the contact refers to seeing a creature, living or dead. Typically these will be either
chironomid larvae or Ascellus and include here any contact where a specimen is subsequently
provided and identified by the company’s water quality scientist as an aquatic animal. (Exclude
contacts about slimes adhering to a tap or water fitting – these should be recorded in the General
Conditions category, see below).
General conditions the contact relates to the appearance of a deposit or slime or colour that is
present on the outside of a tap or water fitting, included here are contacts about hardness deposits
in kettles, staining of the sink, bath, shower cubicle, tiles etc. This category of contact deals with
common consumer concerns where the water itself appears normal (it is clear and bright in
appearance and free from taste and odour) and the phenomenon is arising within the household
environment. A typical cause being inadequate ventilation combined with the use of aerosol
dispensed household or personal products. This category should also be used for contacts relating to
the quality of water in hot water systems or heating/cooling systems and humidifiers.
Some consumers may refer to more than one matter during a single contact; for example, a
consumer may wish to query their bill at the same time as commenting on their drinking water
quality. Companies should strive to ensure that these “multiple contacts” which deal in part with
drinking water quality are recorded as a consumer contact about drinking water quality.
Measurement units
The number of customer contacts per 10,000 population, reported to one decimal place.
Mitigation/exceptions/assumptions
In line with Drinking Water Inspectorate guidance on the notification of events (2009), this measure
does not include customer contacts for taste, smell or appearance where they are linked to a water
quality event subject to a Drinking Water Inspectorate notification. This includes events where there
is a breach of the parametric standard, which leads to deterioration in the aesthetic quality of the
water supplied and resulting in customer concerns (e.g. taste/odour)’.
The customer contact must be in relation to water served by us within our region and this is
validated using the contact address.
If a consumer contacts the company on more than one occasion about the same aspect of their
drinking water quality this should only be recorded as a single contact if the second, or subsequent
contacts, are progress seeking in nature e.g. asking for results of testing.
The original ODI definition did not state that the social media contacts were included. DWI carried
out a Technical Audit of Consumer Complaints on 25 July 2017 and specifically asked about social
media contacts. On 22 December 2017, we received the assessment letter, in Section 5.3 of the
letter the DWI noted that UU excluded the vast majority of social media contacts. Only 17 of 3,235 in
one quarterly report were captured. Whilst the auditor acknowledged that it is reasonable to
exclude contacts where the address of the contact cannot be established, they recommended that
the company reviews its processes to ensure that complaints from social media contacts can be
more appropriately represented in the consumer contacts return. In our response on 24 January
2018 we stated that the process ‘Managing Water Quality Contacts Via Social Media’, Document
Reference: 70650 had been issued and that this process ensures that when a customer reports a
water quality concern on social media pages, the customer will either be directed to the website if
there is an event in the area, or requested to provide their contact details to enable the Integrated
Control Centre (ICC) to contact them or they contact the ICC directly on a telephone number given.

AMP7 performance commitments and outcome delivery incentives: definition document 16
This contact will then be recorded on the company’s customer contact system as a social media
contact and included in the number of water quality contacts received.
Common performance commitment
This is an asset health measure which we have selected from Ofwat’s asset health long list.
Incentive type
Financial – subject to outperformance payments and underperformance penalties.
Price control allocation
This performance commitment is allocated to the water network plus price control and will be subject to outperformance payments and underperformance penalties.
Water resources
Water network+
Wastewater network+
Bioresources Residential retail
Business retail
Direct procurement
0% 100% 0% 0% 0% 0% 0%
Performance commitment for AMP7
For reporting purposes the data reported in financial year 2020/21 aligns to the information
reported to the Drinking Water Inspectorate for calendar year 2020.
This measure is aligned to the Drinking Water Inspectorate guidance and to their calendar year
reporting process. When the data is normalised by 10,000 population it will be consistent with the
way the measure is reported on the Discover Water dashboard.
At the final determination Ofwat revised the targets to align it with an upper quartile improvement
of 34% based on companies’ forecasts.
* N.B. The contacts per 10,000 population figures in the table above are based on PR19 population forecasts and are
therefore subject to minor variation. The actual population figures are calculated on an annual basis and submitted
to the DWI in December of the preceding year.
Unit
AMP7
2020/21 2021/22 2022/23 2023/24 2024/25
Calendar year
2020
Calendar year
2021
Calendar year
2022
Calendar year
2023
Calendar year
2024
Contacts per
10,000
population*
17.20 16.00 14.70 13.50 12.20

AMP7 performance commitments and outcome delivery incentives: definition document 17
Figure 2
Deadbands, caps and collars
The measure is subject to an underperformance collar and an outperformance cap. There are no
deadbands.
Outcome Delivery Incentive
This measure is subject to an outperformance payment and an underperformance penalty, which will be
reconciled on an in-period basis.
Underperformance and outperformance incentive rates
This measure is subject to an underperformance penalty, which has been set at £2.491m for every
customer contact per 10,000 population. The outperformance payment has been set at £2.076m for
every customer contact per 10,000 population.
Worked examples
Annual performance is calculated using the formula:
(A -B) x C
where:
Unit
AMP7
2020/21 2021/22 2022/23 2023/24 2024/25
Calendar year 2020
Calendar year 2021
Calendar year 2022
Calendar year 2023
Calendar year 2024
Underperformance collar Number 34.5 34.5 34.5 34.5 34.5
Underperformance deadband
Number 15.4 14.3 13.1 12.0 10.8
AMP7 performance commitments and outcome delivery incentives: definition document 18
A is the normalised number of customer contacts, as stated as our performance commitment, in any given year.
B is the normalised number of customer contacts that we actually receive in a calendar year, in relation to the taste and smell of drinking water in the North West.
C is the incentive rate associated with the measure.
Worked example:
In year one of AMP7, if we had 16.5 normalised customer contacts in relation to water quality, this would result in fewer customer contacts than the target and therefore will result in an outperformance payment:
(17.2 –16.5) x £2,491,000 = £1,743,700 outperformance
If in year one of AMP7 we had 18.2 normalised customer contacts in relation to water quality, this would result in a performance level above our target and therefore will result in an underperformance payment:
(17.2 –18.2) x £2,076,000 = -£2,076,000 underperformance
Long-term ambition
Our 2045 ambition is to ensure that:
Customers will reduce their consumption of bottled water because they are confident in the
taste and smell of their tap water.
We will have reduced the need for customers to contact us about taste and smell, although
we accept that there will remain a small number of customers who are most sensitive to the
presence of chlorine. This will be achieved through a suite of improvements together with
helping customers look after water in their home (recognising that some taste and smell
contacts arise from issues in the customer’s home) and targeted proactive customer
communication.
For reporting purposes we will continue to align with reporting requirements for the Drinking Water
Inspectorate. Therefore, data reported in financial year 2025/26 aligns to the information reported
to the Drinking Water Inspectorate for calendar year 2025, and so on.

AMP7 performance commitments and outcome delivery incentives: definition document 19
Number of properties with lead risk reduced (A03-WN)
Purpose of this measure
This performance commitment incentivises the company to reduce the amount of lead in drinking
water.
Benefits of this measure
This performance commitment protects public health by encouraging the company to reduce the
number of lead service pipes, reducing the amount of lead in drinking water.
Measure description
This measure sustainably addresses the long-term challenge of customers’ exposure to lead in the north west of England by the complete removal of any lead pipework in the supplying service pipe. This includes the replacement of company owned and non-owned lead pipework from the water main connection to the point at which water quality performance is measured i.e. the first incoming tap at the customers’ property.
Measure definition
The use of lead service pipes in water
distribution (communication and supply
pipes) stopped nearly half a century ago, but
the majority of the lead pipes that were
installed before this date are still in use,
creating a potential risk to public health. This
measure seeks to reduce the number of lead
service pipes across our region and thereby
sustainably reduce customer exposure to
lead.
In counting lead replacements for this
measure, we will include:
Any property that has a full service pipe replacement from the water main to the first
incoming tap, either with any new ownership model or within the existing legal framework
Any property that has either its communication pipe or supply pipe replaced where the
remainder of the service pipe is confirmed to already not be lead. We will not include any
replacements where the work is funded through the lead and/or common supply pipe
replacement scheme (LCSP)1 as in these instances customers have paid for the work on the
pipework that is within their ownership.
The number of replacements will be the total number of lead pipe replacements that meet the
above criteria. This will be reported annually on a financial year basis.
Measure units
Number of qualifying complete lead service pipe replacements completed per year reported to zero
decimal places.
Figure 3

AMP7 performance commitments and outcome delivery incentives: definition document 20
Mitigation/exceptions/assumptions
The company will not include any replacements where the work is funded through the lead and/or
common supply pipe replacement scheme (LCSP) as in these instances customers have paid for the
work on the pipework that is within their ownership.
Common performance commitment
This is a bespoke measure.
Incentive type
Financial - This measure is subject to both outperformance and underperformance payments, which
will be reconciled annually on an in-period basis.
Price control allocation
Water resources
Water network+
Wastewater network+
Bioresources Residential
retail Business
retail Direct
procurement
0% 100% 0% 0% 0% 0% 0%
Performance commitment for AMP7
The performance commitment level reflects the number of lead pipes we proposed to remove in
that year. The profile has been generated based on a 12 to 18 month investigation and customer
engagement project at the start of the period to confirm the appropriateness of supply pipe
adoption.
Unit AMP7
2020/21 2021/22 2022/23 2023/24 2024/25
Number lead
service pipes
replaced
0 500 800 750 750

AMP7 performance commitments and outcome delivery incentives: definition document 21
Figure 4 Deadbands, caps and collars
The outperformance collar reflects the P90 assumption of the number of pipes that we could
remove in that year. The performance commitment does not allow outperformance payments in
2020/21. Performance in future years will be subject to an annual outperformance cap. As the
underperformance and outperformance rates are equal this does not lead to a net impact on the
company if there is outperformance in one year and underperformance in another year, unless the
number of services replaced exceeds the outperformance collar.
There are no deadbands.
Outcome Delivery Incentive
This measure is subject to outperformance payments, which will be reconciled annually on an in-period basis. This ODI allows us to recover £1,120 per lead service pipe replacement for every output delivered above the performance commitment.
Unit
AMP7
2020/21 2021/22 2022/23 2023/24 2024/25
Underperformance cap
Nr lead service pipes
replaced 0 0 0 0 0
Outperformance collar
Nr lead service pipes
replaced 0 3,600 3,500 3,500 3,500

AMP7 performance commitments and outcome delivery incentives: definition document 22
Outperformance/underperformance incentive rate
We are proposing to equally share the outperformance/underperformance opportunity/risk with
customers and have therefore determined that the incentive rate should be the equivalent of 50% of
the average project costs, hence an AMP7 incentive rate of £1,120 per full lead service pipe
replaced. This payment also recognises the grant provided under the new Lead Replacement
Scheme
Worked examples
If in 2021/22 we deliver 550 lead replacements against a target of 500, this performance is above
(i.e. better than) our target and therefore will result in an outperformance payment as set out
below:
Outperformance payment = (actual performance – target performance) x incentive rate
(550 – 500) x £1,120 = £56,000 outperformance
If in 2022/23 we deliver 780 lead replacements against a target of 800, this performance is below
our target and therefore will result in an underperformance payment as set out below:
Underperformance payment = (target performance – actual performance) x incentive rate
(800 – 780) x -£1,120 = -£22,400 underperformance
Long-term ambition
Our long-term ambition is to work towards a zero lead pipe water distribution network. Our
ambitious time line is to have replaced all lead pipe work in the supply system (up to the first
incoming tap) within 50 years of the start of AMP7.
1 – In April 2021 the LCSP scheme was replaced by the Lead Replacement Scheme. The new scheme
provides a grant to the customer which helps towards the cost of replacing the lead pipe in their
ownership. We will include these replacements towards our target.
AMP7 performance commitments and outcome delivery incentives: definition document 23
Helping customers look after water in their home (A04-WN)
Purpose of this measure
This performance commitment incentivises the company to deliver an awareness and support
programme to its customers focused on the use of water in the home. Water in the home is inclusive
of water usage and water quality experienced in the home and/or the personal effect a person can
have on water efficiency/ quality.
Benefits on this measure
This performance commitment will increase customer awareness of the factors that can affect water
quality and water efficiency in their home. This should lead to improved public health and reduced
water demand.
Measure Description
The measure monitors the increased awareness of customers to their impact on both water quality
and water efficiency within their home, in terms of the percentage increase from the 2018 baseline.
The baselines was set on the responses to two questions:
Do you recall seeing or hearing anything about the following in recent months:
Water Efficiency? Do you recall seeing or hearing anything about the following in recent months:
Water Quality?
The response rates were 22% and 17% respectively which when combined give an average baseline
of 19.5% (22 + 17 = 39 / 2 = 19.5).
Measure Definition
Throughout AMP7 the same questions will be used, with surveys conducted at least annually, drawing from a statistically representative sample of domestic customers (in terms of age, gender, region, metered/ unmetered and urban/suburban) with a minimum sample of 1,000 customers.
The baseline is based on a survey carried out in 2018. This will be repeated at least annually, using
the same set of questions and drawing from a statistically representative sample of domestic
customers (in terms of age, gender, region, metered/unmetered and urban/suburban) with a
minimum sample of 1,000 customers within the year.
Performance in each year will be calculated as the percentage awareness from the annual survey
less the percentage awareness from the 2018 baseline survey.
Measurement units
Measured annually as the percentage increase in customer awareness to one decimal place.
Mitigation/exceptions
None.
Common performance commitment
This is a bespoke measure.

AMP7 performance commitments and outcome delivery incentives: definition document 24
Incentive type
Reputational.
Price control allocation
Water resources
Water network+
Wastewater network+
Bioresources Residential
retail Business
retail Direct
procurement
NA 100% NA NA NA NA Na
Performance commitment (AMP7)
Deadbands, caps and collars
Not applicable.
Outcome Delivery Incentive
Not applicable.
Outperformance/underperformance incentive rate
The incentive rate is £0.073m per percentage change in awareness from the baseline position reported to two
decimal place above or below the performance commitment.
Worked examples
If our performance in 2020/21 results in an average combined response of 26.5% then this
performance is above or better than the baseline. Our target is to be 2% above the baseline and
therefore our overall target is 21.5% (19.5% + 2%). This will result in an outperformance payment as
set out below: -
Outperformance payment = (actual performance-target performance) x incentive rate
(26.5 – 21.5) x £73,000 = £365000
If our performance in 2020/21 results in an average combined response of 17.5% then this
performance is below or worse than the baseline which will result in an underperformance payment
as set out below: -
Underperformance payment = (target performance - actual performance) x incentive rate
(19.5 – 17.5) x -£73000 = -£146,000
Unit
AMP7 2020/21 2021/22 2022/23 2023/24 2024/25
Performance commitment
Percentage 2% 4% 6% 8% 10%
Incentive type Incentive rate (£m/unit)
Underperformance payment -0.073
Outperformance payment 0.073

AMP7 performance commitments and outcome delivery incentives: definition document 25
Long-term ambition
We are seeking a cultural change for the way people value water and understand the potential
impact their home plumbing and fittings can have upon the quality of their water. We hope to see a
shift in awareness of the population of the North West that is sustainable and passed down through
the generations. However, there may be a need to revise the format of this measure in the long
term, to ensure key messages continue to be delivered in innovative ways and are kept ”fresh”. It
may be necessary to revise our long-term aspirations and develop entirely different approaches to
ensure continued success in this area.

AMP7 performance commitments and outcome delivery incentives: definition document 26
Reducing discolouration from the Vyrnwy treated water aqueduct
(A05-WN)
Purpose of this measure
This performance commitment is designed to reduce discolouration events in drinking water
supplies by measuring the length of the Vyrnwy treated water aqueduct that has been cleaned,
relined or replaced.
Benefits of this measure
This performance commitment will reduce the number of discolouration events experienced by
customers and improve the quality and appearance of drinking water.
Measure Description
This measure records the length of the Vyrnwy treated water aqueduct cleaned, relined or replaced
if required by the Drinking Water Inspectorate (DWI) to meet the target for reduction in water
discolouration.
Measure Definition
The 240km Vyrnwy treated water aqueduct supplies up to 210 Ml/d from Oswestry water treatment
works on the Welsh border, to a population of over one million customers predominantly in
Cheshire and Merseyside.
We have a regulatory obligation with the DWI to reduce the number of discolouration customer
contacts. Cleaning of the Vyrnwy aqueduct started in the 2010-2015 period and over 40% of the
aqueduct system was completed. Following a successful trial of enhanced manganese removal at
Huntington water treatment works, leading directly to reduced discolouration in the zones directly
supplied by the treatment works, we paused the Vyrnwy lining project to reassess the benefit of
cleaning the remainder of the aqueduct and ensure that customer money is spent prudently.
An alternative solution was agreed with the DWI in 2013, to address the source of the discolouration
at Oswestry water treatment works through the inclusion of enhanced manganese removal. The
objective of this is to address the discolouration problem permanently at a lower cost. In addition
the project would improve bacteriological compliance and treatment capability, addressing the long-
term deterioration in raw water colour and dissolved organic carbon.
The AMP7 performance target agreed with the DWI included achieving a 50% reduction in
discolouration customer contacts, to be assessed in a 12 month period following completion of the
Oswestry water treatment works and Vyrnwy automation and control projects. This reduction
applies to those water supply zones with over 50% supply from the Vyrnwy aqueduct. This will be
measured on a zone by zone basis compared with the original baseline year of 2001.
The outcome delivery incentive associated with this measure will allow costs to be recovered, if the
scheme is required, based upon a unit rate per kilometre. The maximum length of the Vyrnwy
treated water aqueduct to be cleaned, relined or replaced will be the 139km of the aqueduct which
has not yet been cleaned.
Measurement units
Measured as the number of kilometres of the Vyrnwy treated water aqueduct cleaned, relined or
replaced reported to two decimal places.

AMP7 performance commitments and outcome delivery incentives: definition document 27
Mitigation/exceptions
None.
Common performance commitment
This is a bespoke measure.
Incentive type
Financial – outperformance payments only.
Price control allocation
Water resources
Water network+
Wastewater network+
Bioresources Residential
retail Business
retail Direct
procurement
0% 100% 0% 0% 0% 0% 0%
Performance commitment for AMP7
This target assumes there is no requirement to undertake any cleaning/relining, so the commitment
level is set at zero. As our target is zero and there is no expenditure for this project in our business
plan, this measure is subject to outperformance payments only, which will be reconciled annually on
an in-period basis.
Figure 5
Deadbands, caps and collars
The measure has an annual outperformance cap, which protects customers by constraining the revenue that can be recovered through the mechanism in each year. The cap is set at zero for the
Unit AMP7
2020/21 2021/22 2022/23 2023/24 2024/25
Km 0.00 0.00 0.00 0.00 0.00

AMP7 performance commitments and outcome delivery incentives: definition document 28
first three years meaning early delivery will not result in a reward either in the year the output is delivered or subsequent years. In year four we can recover costs for cleaning/relining 35.25km of the Vyrnwy LDTM and in year 5 for a further 58.99km.
Outcome Delivery Incentive
This measure is subject to outperformance payments, which will be reconciled annually on an in-
period basis. This ODI allows us to recover £548,000 per km of aqueduct cleaned, lined or replaced
each year up to the outperformance cap.
Outperformance incentive rate
The incentive rate has been valued based on the anticipated project costs as a unit rate per
kilometre of aqueduct cleaned.
The total project cost for cleaning/lining the remaining sections of the aqueduct have been
estimated at £152,250,539. The incentive rate is £0.548m per km of aqueduct cleaned/lined, which
has been calculated as 50% of the total project cost divided by the total length (139km). The totex
sharing mechanism should recover the remaining 50% of the costs. Therefore between the two
mechanisms all of the planned costs would have been recoverable.
Incentive Rate = (Total project cost (£)/Total project scope (km))/2
= (£152,250,539/139)/2 = £547,664 rounded to £548,000
The required scope of work for the whole project comprises 139km of cleaning/lining across all three
Vyrnwy 42” mains over two AMPs.
Scope
Length
Malpas to Bulkeley L1, L2 and L3 25.5km
Norton to Prescott L1 and L2 (including pressure jetting Mersey crossings)
30.4km
Bulkeley to Cotebrook L1, L2 and L3 30.6km
Cotebrook to Weaver L1, L2 and L3 36.3km
Weaver to Norton L1, L2 and L3 16.2km
Total 139km
Unit
AMP7
2020/21 2021/22 2022/23 2023/24 2024/25
Outperformance cap Km 0.00 0.00 0.00 35.25 58.99
AMP7 performance commitments and outcome delivery incentives: definition document 29
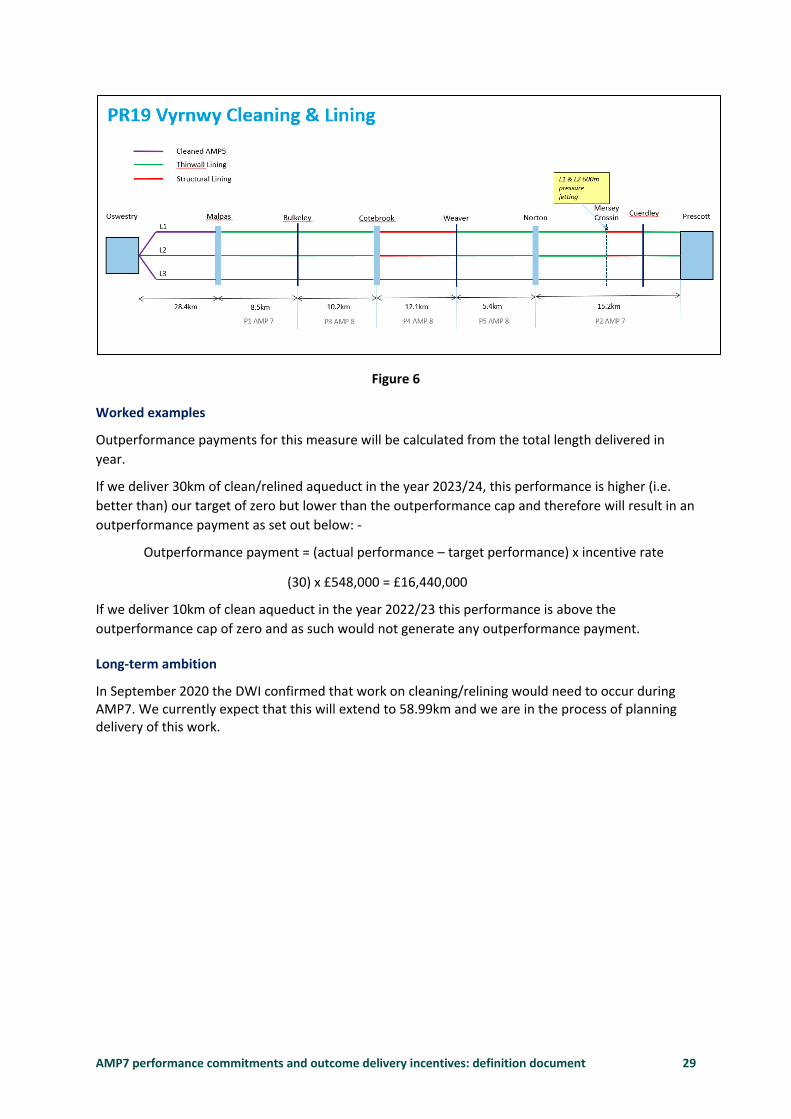
Figure 6
Worked examples
Outperformance payments for this measure will be calculated from the total length delivered in
year.
If we deliver 30km of clean/relined aqueduct in the year 2023/24, this performance is higher (i.e.
better than) our target of zero but lower than the outperformance cap and therefore will result in an
outperformance payment as set out below: -
Outperformance payment = (actual performance – target performance) x incentive rate
(30) x £548,000 = £16,440,000
If we deliver 10km of clean aqueduct in the year 2022/23 this performance is above the
outperformance cap of zero and as such would not generate any outperformance payment.
Long-term ambition
In September 2020 the DWI confirmed that work on cleaning/relining would need to occur during AMP7. We currently expect that this will extend to 58.99km and we are in the process of planning delivery of this work.
AMP7 performance commitments and outcome delivery incentives: definition document 30
Outcome B – You have a reliable supply of water now and in the
future
Customers want to rely on us to provide enough water resources to meet our current and future needs. We want to improve supply reliability, reducing both short-term interruptions and the risk of longer-term interruptions. We are targeting a reduction in leakage and encouraging water efficiency, which research has shown to be key priorities for customers.

AMP7 performance commitments and outcome delivery incentives: definition document 31
Leakage (B01-WN)
Purpose of this measure
This performance commitment is designed to incentivise companies to reduce leakage.
Benefits of this measure
The benefits of reduced leakage are improved water resources resilience, improved supply-demand
balance position, reduced need for water abstraction and increased supply network resilience.
Measure description
In line with Ofwat’s PR19 guidance, we will present the percentage reduction from the three-year average 2019/20 baseline (447.1 Ml/d for leakage) and the three-year average in megalitres per day (Ml/d).
Measure definition
Leakage is presented as the sum of distribution system leakage, including service reservoir losses
and trunk main leakage, and customer supply pipe leakage. It is reported as the annual arithmetic
mean (referred to as ‘average’ in the guidance) daily leakage expressed in megalitres per day (Ml/d).
This measure will be expressed as a percentage change relative to the 2019/20 baseline position in
accordance with the common measure definition https://www.ofwat.gov.uk/wp-
content/uploads/2018/03/Reporting-guidance-leakage.pdf. A reduction in leakage is expressed as a
positive figure and an increase is shown as a negative figure. Baseline total leakage is calculated as a
three-year average of annual values for 2017/18, 2018/19 and 2019/20 and expressed in megalitres
per day (Ml/d).
Annual leakage (Ml/d) 3 year average
Baseline leakage 2017/18 2018/19 2019/20
449.4 452.0 439.8 447.1
Measurement units
Leakage is measured in megalitres per day (Ml/d) and reported to one decimal place on a three-year
average basis. The performance commitment is based on a percentage reduction (%) from the
baseline based on the three year average.
Mitigation/exceptions
In accordance with the common methodology, no elements of the water balance are excluded from
the maximum likelihood estimate.
Common performance commitment
This is a common performance commitment developed by Ofwat for AMP7.
Incentive type
Financial – outperformance and underperformance payments.
AMP7 performance commitments and outcome delivery incentives: definition document 32
Price control allocation
Water resources
Water network+
Wastewater network+
Bioresources Residential
retail Business
retail Direct
procurement
0% 100% 0% 0% 0% 0% 0%
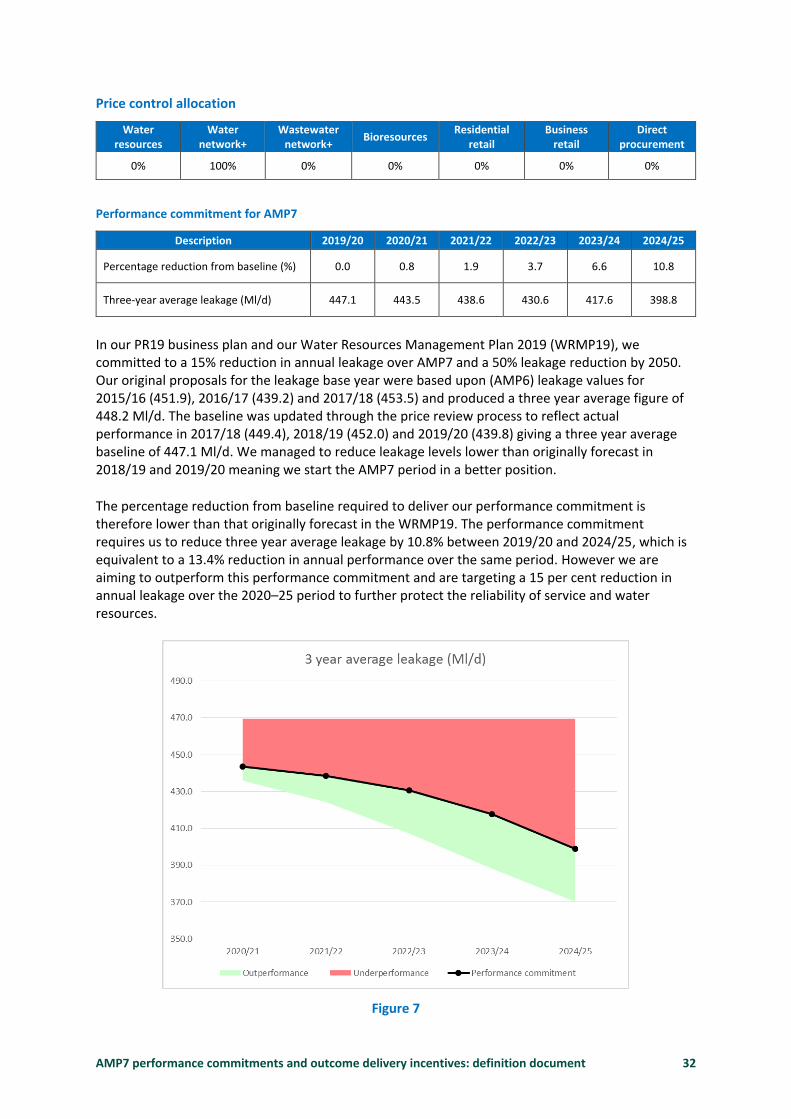
Performance commitment for AMP7
Description 2019/20 2020/21 2021/22 2022/23 2023/24 2024/25
Percentage reduction from baseline (%) 0.0 0.8 1.9 3.7 6.6 10.8
Three-year average leakage (Ml/d) 447.1 443.5 438.6 430.6 417.6 398.8
In our PR19 business plan and our Water Resources Management Plan 2019 (WRMP19), we committed to a 15% reduction in annual leakage over AMP7 and a 50% leakage reduction by 2050. Our original proposals for the leakage base year were based upon (AMP6) leakage values for 2015/16 (451.9), 2016/17 (439.2) and 2017/18 (453.5) and produced a three year average figure of 448.2 Ml/d. The baseline was updated through the price review process to reflect actual performance in 2017/18 (449.4), 2018/19 (452.0) and 2019/20 (439.8) giving a three year average baseline of 447.1 Ml/d. We managed to reduce leakage levels lower than originally forecast in 2018/19 and 2019/20 meaning we start the AMP7 period in a better position.
The percentage reduction from baseline required to deliver our performance commitment is therefore lower than that originally forecast in the WRMP19. The performance commitment requires us to reduce three year average leakage by 10.8% between 2019/20 and 2024/25, which is equivalent to a 13.4% reduction in annual performance over the same period. However we are aiming to outperform this performance commitment and are targeting a 15 per cent reduction in annual leakage over the 2020–25 period to further protect the reliability of service and water resources.
Figure 7

AMP7 performance commitments and outcome delivery incentives: definition document 33
Deadbands, caps and collars
Units 2020-21 2021-22 2022-23 2023-24 2024-25
Underperformance collar % reduction from three-
year average (5.0) (5.0) (5.0) (5.0) (5.0)
Outperformance cap % reduction from three-
year average 2.5 5.1 8.9 13.2 17.2
Outcome Delivery Incentive
This measure is subject to both outperformance and underperformance payments and will be
reconciled annually on an in-year basis.
Outperformance/underperformance incentive rate
This measure is subject to an underperformance penalty, which has been set at £175,000 per Ml/d
above the performance commitment. The outperformance payment has been set at £146,000 per
Ml/d below the performance commitment.
Worked examples
Example 1: Success in delivering outperformance
Three-year average leakage target in 2022/23 = 430.6 Ml/d
Three-year average leakage performance in 2022/23 = 420 Ml/d
430.6 – 420 = 10.6 below performance commitment
Outperformance payment = 10.6 x £146,000 = £1,547,600
Example 2: Failure to achieve performance commitment
Three-year average leakage target in 2022/23 = 430.6 Ml/d
Three-year average leakage performance in 2022/23 = 450 Ml/d
450 – 430.6 = 19.4 above performance commitment
Underperformance payment = 19.4 x -£175,000 = -£3,395,000
Long-term ambition
Climate change and the resultant shifts in weather patterns have the potential to significantly impact our operations and the broader environment as hazards such as droughts and heatwaves become more frequent and more intense. Ensuring a reliable service in the face of a growing population, changing climate and increasing expectations of service requires integrated long-term thinking and targeting investment to ensure both short and longer-term reliability. We have first-hand experience of the impacts of extreme weather events on our operations and customers – during 2018 we experienced two weather extremes, with a deep freeze followed by rapid thaw in the early part of the year, and then extremely hot, dry weather coupled with significantly increased demand for water over the summer. Reducing leakage is a key part of securing sustainable supplies for the future. We are targeting a 15 per cent reduction in leakage over the 2020–25 period to further protect the reliability of service and water resources.
AMP7 performance commitments and outcome delivery incentives: definition document 34
We maintain leakage levels well below the sustainable economic level of leakage. This means that any further reductions will require appropriate investment in order to deliver our performance commitment. This cost has the potential to impact customer bills or impact on our ability to address customers’ other priorities, so we need to ensure that all changes we make are overall affordable to customers. With no leakage reduction, we are currently forecasting a small deficit in our Strategic Resource Zone supply-demand balance close to the end of the planning horizon to 2045, therefore, we consider it appropriate to forecast longer term reductions in leakage and set longer term goals and ambitions. We expect that technology and innovation over time will enable this, however the long term ambitions can be revisited at future plans. In our Water Resources Management Plan 2019 we said we would reduce leakage by just over 40% by 2045. As part of regional planning with Water Resources West (WRW) and in developing our WRMP24, we are looking to align to the National Framework for Water Resources expectation to “halve leakage rates by 2050”.
This long term ambition will also have to consider and accommodate external factors beyond the
company’s control, such as climate change, population growth and changes to the industry &
customer behaviour as a result of the COVID-19 pandemic. We also need to appreciate the influence
of asset deterioration over the longer term and ensure that we adopt the correct delivery strategies
maintain service levels and operational resilience. As our understanding of the influence of these
factors evolves, our ambition may need to adapt, but we will always strive to achieve the best
service outputs for customer and ensure the environment is protected and enhanced.

AMP7 performance commitments and outcome delivery incentives: definition document 35
Mains repairs (B02-WN)
Purpose of this measure
This performance commitment is designed to incentivise the company to appropriately maintain and
improve the asset health of the infrastructure and below ground water mains network and
demonstrate its commitment to its asset stewardship responsibility.
Benefits of this measure
This performance commitment helps to ensure that the overall asset health of the water mains
network is maintained and improved for the benefit of current and future generations.
Measure description
Mains repairs is reported as the number of mains repairs per thousand kilometres of the entire
water main network (excluding communication and supply pipes).
Our definition for mains repairs per 1,000km is consistent with reporting guidance for PR19
published on 27 March 2018. https://www.ofwat.gov.uk/publication/reporting-guidance-mains-
repairs-per-1000km/
Measure definition
Number of mains bursts per thousand kilometres of total length of mains. Mains bursts include all
physical repair work to mains from which water is lost. This is attributable to pipes, joints or joint
material failures or movement, or caused or deemed to be caused by conditions or original pipe
laying or subsequent changes in ground conditions (such as changes to a road formation, loading,
etc. where the costs of repair cannot be recovered from a third party). Any repair work undertaken
on the water mains (i.e. all pipes conveying treated water around the distribution point but not
including communication pipes or supply pipes) shall be included.
Any work that is not undertaken on the mains e.g. solely on a ferrule, hydrant, valve and clamp
associated with the ancillary which does not involve a repair on the main shall be excluded. Clamps
used to repair the main shall be included. All incidents should be included which involve over-
pressure or pressure cycling, and surge failures, etc., which reflect the system operating conditions,
even where these failures are accidental rather than associated with weaknesses in pipe condition.
Once the main is recharged, and customers are back in supply, then if there is a new incident it is
counted as a separate repair. If there is a secondary burst not at the point at where the repair took
place during the recharge, then it should be captured as a separate reported burst. Self-laid mains,
or other mains adopted should be treated as part of the incumbents’ network from the time of
adoption. If a developer has a burst on its main prior to adoption this is not included within the
metric.
Total mains length will be calculated annually and as per the regulatory reporting guidelines for total
mains length. The length of main is the length of all pipes conveying treated water around the
distribution point but not including communication pipes or supply pipes.
The company is also required to report mains repaired proactively and reactively separately. The
phrase ‘proactive mains repair’ denotes a mains where the need for a repair was identified by the
company. The phrase ‘reactive mains repair’ denotes a mains where the need for a repair was
reported to the company by a customer or third party.
AMP7 performance commitments and outcome delivery incentives: definition document 36
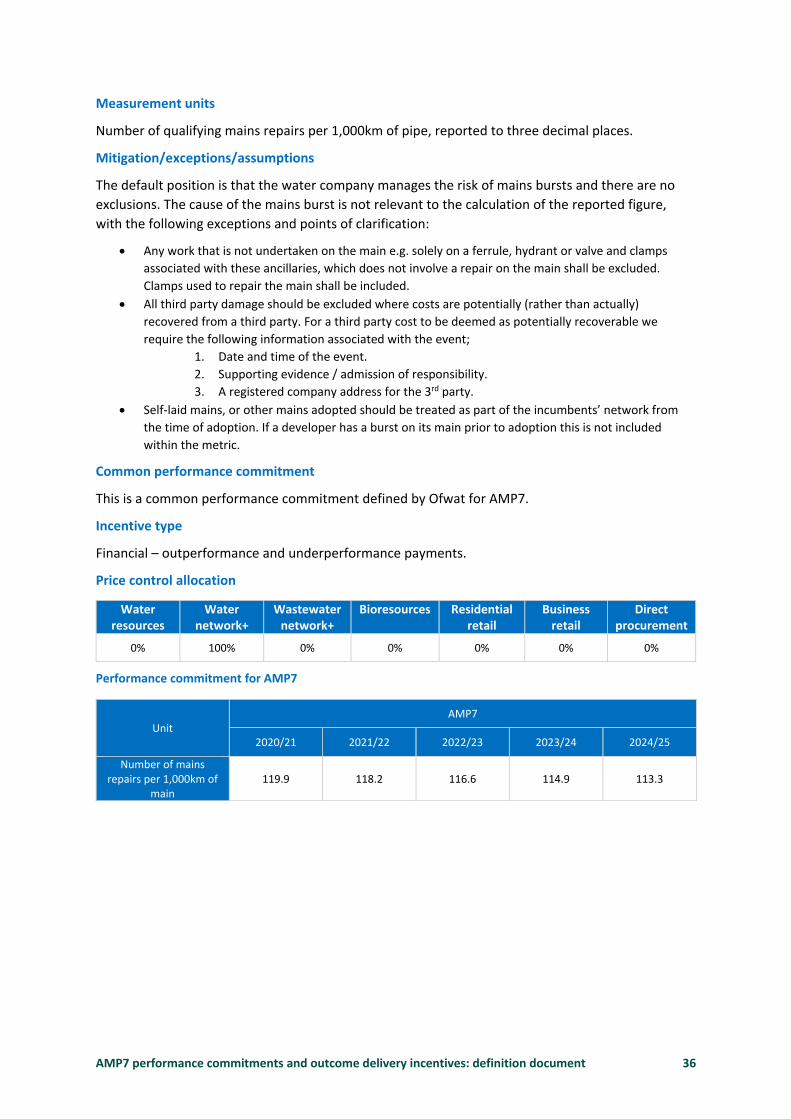
Measurement units
Number of qualifying mains repairs per 1,000km of pipe, reported to three decimal places.
Mitigation/exceptions/assumptions
The default position is that the water company manages the risk of mains bursts and there are no
exclusions. The cause of the mains burst is not relevant to the calculation of the reported figure,
with the following exceptions and points of clarification:
Any work that is not undertaken on the main e.g. solely on a ferrule, hydrant or valve and clamps
associated with these ancillaries, which does not involve a repair on the main shall be excluded.
Clamps used to repair the main shall be included.
All third party damage should be excluded where costs are potentially (rather than actually)
recovered from a third party. For a third party cost to be deemed as potentially recoverable we
require the following information associated with the event;
1. Date and time of the event.
2. Supporting evidence / admission of responsibility.
3. A registered company address for the 3rd party.
Self-laid mains, or other mains adopted should be treated as part of the incumbents’ network from
the time of adoption. If a developer has a burst on its main prior to adoption this is not included
within the metric.
Common performance commitment
This is a common performance commitment defined by Ofwat for AMP7.
Incentive type
Financial – outperformance and underperformance payments.
Price control allocation
Performance commitment for AMP7
Water resources
Water network+
Wastewater network+
Bioresources Residential retail
Business retail
Direct procurement
0% 100% 0% 0% 0% 0% 0%
Unit AMP7
2020/21 2021/22 2022/23 2023/24 2024/25
Number of mains repairs per 1,000km of
main 119.9 118.2 116.6 114.9 113.3

AMP7 performance commitments and outcome delivery incentives: definition document 37
Figure 8
Deadbands, caps and collars
Units 2020-21 2021-22 2022-23 2023-24 2024-25
Underperformance collar Number of mains
repairs per 1,000km of main
167.9 167.9 167.9 167.9 167.9
Outperformance cap Number of mains
repairs per 1,000km of main
89.9 88.3 86.6 84.9 83.3
Outcome Delivery Incentive
This measure is subject to both outperformance and underperformance financial incentives, which
will be reconciled annually on an in-period basis.
Outperformance/underperformance incentive rate
This measure is subject to an underperformance penalty, which has been set at £235,000 for each
burst/1000km over the performance commitment. The outperformance payment has been set at
£132,000 for each burst/1000km under the performance commitment.
Worked examples
In 2020/21 we complete 4,333 mains repairs and the total length of mains is 42,262. The number of
mains repairs per 1000km of mains is 102.0.
Outperformance payment = (target performance – actual performance) x incentive rate
(119.9-102.0)) x £132,000 = £2,362,800
In 2020/21 we completed 7135 mains repairs and the total length of mains is 42262. The number of
mains repairs per 1000km of mains is 168.0. This is above the underperformance cap so the
underperformance penalty is capped.

AMP7 performance commitments and outcome delivery incentives: definition document 38
Underperformance payment = (underperformance cap – target performance) x incentive rate
(167.9- 119.9) x -£235,000 = -£28,176,332
Long-term ambition
Our long term ambition is to maintain a level of asset health, as measured by the numbers of mains
repairs that we conduct that meets customer’s service priorities for leakage, supply interruptions,
and water pressure whilst representing the cheapest whole life costs to the business and customers.
The target of long term stable asset health for mains should not be viewed in isolation. Rather the
service delivered via the water mains in terms of a reliable supply of water, the water pressure
delivered, and reduced water leakage should be viewed holistically. The frequency of mains repairs
will increase if any one of these service areas is targeted for improvement. Our long term ambition
aligns to the volume of mains repairs we expect to have to complete in order to meet our long term
leakage reduction targets. We plan to offset the increase in proactive mains repairs associated with
more intensive leakage detection through innovation and a reduction in reactive mains repairs, but
there remains uncertainty associated with these new technologies and approaches.
This long term ambition will also have to consider and accommodate external factors beyond the
company’s control, such as climate change, population growth and changes to the industry &
customer behaviour as a result of the COVID-19 pandemic. We also need to appreciate the influence
of asset deterioration over the longer term and ensure that we adopt the correct delivery strategies
to maintain service levels and operational resilience. As our understanding of the influence of these
factors evolves, our ambition may need to adapt, but we will always strive to achieve the best
service outputs for customer and ensure the environment is protected and enhanced.

AMP7 performance commitments and outcome delivery incentives: definition document 39
Interruptions to supply (B03-WN)
Purpose of this measure
This performance commitment is designed to incentivise companies to minimise the number and
duration of supply interruptions.
Benefits of this measure
Reducing the number and duration of interruptions events improves the reliability of supply and
reduces negative social and public health impacts on customers. Supply interruptions is the single
biggest reason customers contact us, improving performance against this measure contributes to
increasing overall customer satisfaction.
Measure description
This measure incentivises the successful delivery of an improved water supply interruption
performance, as measured by the average number of minutes that each connected customer
experienced a supply interruption per annum. This is an industry common measure that is an
evolution of our AMP6 measure for average minutes lost.
Our definition for supply interruptions is consistent with reporting guidance for PR19 published on
27 March 2018. https://www.ofwat.gov.uk/publication/reporting-guidance-supply-interruptions/
Measure definition
The measure reports the mean duration customers are without a water supply in a given reporting
year, against a target set through an assessment of the industry upper quartile performance for the
same year.
Calculation:
𝑀𝑒𝑎𝑛 𝑖𝑛𝑡𝑒𝑟𝑟𝑢𝑝𝑡𝑖𝑜𝑛 𝑡𝑖𝑚𝑒 ∑ ((𝑃 ∗ 𝑖𝑇)
𝑐𝑃)
Where: -
P = Number of properties affected by the interruption (may be in phases if partial restoration is
accomplished)
iT = Total duration of the event, provided that it is ≥ =3 hours in duration, in minutes (MM:SS).
Guidance requires caution to be used when multiplying time, the methodology states that it may be
necessary to convert time to a decimal for the avoidance of doubt. For example 02:30 (time) would
be converted to 2.5 (decimal) minutes
NB – P * iT is calculated for each event
cP = Total connected properties: Properties shall include billed mains pressure fed household and non-
household properties connected to the distribution system on 31st March in the reporting year. This
includes properties that are connected, but not billed (for example temporarily unoccupied), but
should exclude properties which have been permanently disconnected. A group of properties supplied
by a single connection shall be considered as several properties. They should only be considered as a
single property if a single bill covers the whole property. The total connected properties figure shall
be those connected at the end of the report year. Cattle troughs shall not be included.
Supply interruptions are defined as when properties are without a continuous supply of water. The
property shall be considered as without a supply when water is lost from the first cold water tap –

AMP7 performance commitments and outcome delivery incentives: definition document 40
taken as being operationally equivalent to ≤3m pressure at the main (adjusted for any difference in
ground or property level). This can be inferred from local logging, network modelling or a customer
contact indicating a loss of supply which was caused by the company operation and has not been
demonstrably restored. Multiple-storey buildings shall be considered on a case-by-case and floor by
floor basis, with properties on a particular floor being considered as receiving the same pressure. A
supply interruption is determined to be over once the pressure in the adjacent supplying water main
reaches 3m. This is also the threshold for resetting the interruption clock and starting a second
interruption should a temporary restoration of supplies be achieved. Unless positive evidence can be
obtained that water supply has been restored to the first incoming tap (i.e. customer contact). This
measure includes all interruptions > 3 hours (180 minutes) in duration caused by the failure of
company assets.
Duration is defined as the length of time for which properties are without a continuous supply of
water. The duration shall only be considered in the calculation of the metric where the duration is 3
hours or greater.
Start time is when water is lost from the first cold water tap at a property – taken as being
operationally equivalent to ≤3m pressure at the main (adjusted for any difference in ground or
property level). In the event of applicable telemetry data or logging being unavailable, the time
should be determined from the earliest of:
As advised by “no water” contact from customer (where not due to a customer side issue);
Indications from flow or pressure monitoring to infer a change in supply; or
Verified modelled data (calibrated, maintained, reflective of the network at the time of the
incident and validated with contemporaneous flow and/or pressure data). The company
shall gain confirmation by consulting complainants (if any) and/or customers at high points
on the system.
Stop time is when water is restored to the first cold water tap at a property – taken as being
operational equivalent to >3m head of pressure at the main. In the event of pressure logging being
unavailable, the time should be determined from the latest of:
As advised by notification from customer;
Indications from flow or pressure monitoring to indicate return to normal supply conditions;
or
Verified modelled data (calibrated, maintained, reflective of the network at the time of the
incident and validated with contemporaneous flow and/or pressure data). It is the
responsibility of the company to demonstrate that supply conditions have been restored
and available to all previously affected customers from the time determined from the above.
In the absence of physical evidence, the company shall gain confirmation by consulting complainants
(if any) and/or customers at high points on the system. The company shall apply the precautionary
principle, using the start and finish times and the properties affected that will give the highest supply
interruption value in the event of uncorroborated or conflicting data.
Property counts shall use the best available information. This should be from the GIS, but paper
records and DMA or similar data can be used where recently connected properties have not yet
been input to the GIS. Properties shall count as having lost supply whether or not occupied.
Properties permanently disconnected will be excluded from the count. Attention should be paid to
the incremental nature of supply loss. For example, for a burst when supply is lost progressively

AMP7 performance commitments and outcome delivery incentives: definition document 41
across an affected area, the time/properties affected relationship should be established. Where the
loss is gradual, the supply interruption should be considered incrementally.
Multiple interruptions - Properties which are affected by more than one interruption during the
report year should be reported separately for each interruption. This means, for example, that a
property affected by three supply interruptions would be reported three times, once for each
interruption. A temporary restoration of ≥ 1 hour (60 minutes) must be achieved for the event clock
to be re-set and a second event started.
Measurement units
Measured in minutes and seconds per connected property per year (hours:minutes:seconds/prop/yr).
Mitigation/exceptions/assumptions
The default position is that the water company manages the risk of supply interruptions and there
are no exclusions. This measure covers planned and unplanned interruptions. The cause of the
interruption is not relevant to the calculation of the reported figure. That is, asset failure caused by
third parties would be treated the same as the failure of the company’s assets and planned or
unplanned interruptions are the same. Companies may make a representation to Ofwat for an
exception to be granted on the basis of a civil emergency under the Civil Contingencies Act 2004,
where the supply interruption is not the cause of the emergency.
Common performance commitment
This is a common performance commitment defined by Ofwat for AMP7.
Incentive type
Financial – outperformance and underperformance payments.
Price control allocation
Water resources
Water network+
Wastewater network+
Bioresources Residential retail
Business retail
Direct procurement
0% 100% 0% 0% 0% 0% 0%
Performance commitment for AMP7
Unit AMP7
2020/21 2021/22 2022/23 2023/24 2024/25
Average minutes and seconds lost per customer per year (mm:ss) 06:30 06:08 05:45 05:23 05:00

AMP7 performance commitments and outcome delivery incentives: definition document 42
Figure 9 Deadbands, caps and collars
Units 2020/21 2021/22 2022/23 2023/24 2024/25
Underperformance collar % reduction from three-
year average 22:45 22:45 22:45 22:45 22:45
Outperformance cap % reduction from three-
year average 03:30 03:21 03:11 03:02 02:54
Outcome Delivery Incentive
This measure is subject to both outperformance and underperformance financial incentives, which
will be reconciled annually on an in-period basis.
Outperformance/underperformance incentive rate
This measure is subject to an underperformance penalty, which has been set at £936,000 for each
average decimal minute lost over the performance commitment. The outperformance payment has
been set at £936,000 for each average decimal minute lost under the performance commitment.
Worked examples
Below are some examples of interruption events and their time impacts.
Event P (nr)
Duration of event (hh:mm:ss)
iT (minutes)
Calculation P * iT (minutes)
Comments
1 150 02:59:00 0 =150*0 0 Event less than 3 hours so not included
2 2 11:30:00 690 =2*690 1,380 Isolate interruption for long time period, included in calculation
3 1,500 03:40:00 220 =1,500*220 330,000 Interruption duration > 3hours, so included in calculation

AMP7 performance commitments and outcome delivery incentives: definition document 43
4 200 03:00:00 180 =200*180 36,000 Interruption duration = 3hours, so included in calculation.
5a 4,250 05:45:00 345 =4,250*345 1,466,250 Interruption of total 5000 properties with a partial restoration of water supplies to 4250 properties after 05:45:00. Remaining properties off supply for total of 07:15:00. Whilst this is the same interruption root cause due to the partial restoration of supplies the events have to be treated as separate for the calculation
5b 750 07:15:00 435 =750*435 326,250
6a 7000 02:45:00 0 =7000*0 0 Interruption of total 7000 properties with a full restoration of supplies for > 1 hour after 02:45:00 of the incident start time. Followed by a second interruption (after >1 hour of the first interruption ending) affecting the same 7000 properties to allow for repairs to be completed
6b 7000 01:55:00 0 =7000*0 0
Based on the above calculation and assuming that there are a total of 1,000,000 connected properties
in the supply network the performance given the above example events would be;
𝑀𝑒𝑎𝑛 𝑖𝑛𝑡𝑒𝑟𝑟𝑢𝑝𝑡𝑖𝑜𝑛 𝑡𝑖𝑚𝑒 ∑ (1,380 + 330,000 + 36,000 + 1,466,250 + 326,250
1,000,000)
𝑀𝑒𝑎𝑛 𝑖𝑛𝑡𝑒𝑟𝑟𝑢𝑝𝑡𝑖𝑜𝑛 𝑡𝑖𝑚𝑒 = 2.1598 𝑚𝑖𝑛𝑢𝑡𝑒𝑠 (𝑑𝑒𝑐𝑖𝑚𝑎𝑙) / property / year
𝑴𝒆𝒂𝒏 𝒊𝒏𝒕𝒆𝒓𝒓𝒖𝒑𝒕𝒊𝒐𝒏 𝒕𝒊𝒎𝒆 = 𝟎𝟐: 𝟏𝟎 (𝒎𝒎: 𝒔𝒔) / property / year
It is important to note that for calculation purposes all times should be recorded in decimal minutes,
as per the output of the calculation above. This is to avoid complications with having to perform
calculations involving time, which can easily lead to errors. Only after calculation of the outcome
delivery incentive impact should the decimal time be converted to minutes and seconds for
presentation purposes.
Worked examples
In 2020/21 average minutes lost is 02:10 which is 2.17 decimal minutes. The performance
commitment is 06:30 which is 6.50 decimal minutes. This is below the outperformance cap so the
outperformance reward is capped. The outperformance cap is 03:30 which is 3.5 in decimal minutes.
Outperformance payment = (performance commitment – outperformance cap) x incentive
rate
(6.5-3.5)) x £936,000 = £2,808,000
In 2020/21 average minutes lost is 07:45 which is 7.75 decimal minutes. The performance
commitment is 06:30 which is 6.50 decimal minutes.
Underperformance payment = (performance commitment – actual performance) x incentive
rate
(7.75-6.5) x -£936,000 = -£1,170,000

AMP7 performance commitments and outcome delivery incentives: definition document 44
Long-term ambition
Our long term ambition is minimise the time that a customer should experience a supply
interruption of greater than 3 hours. We aim to achieve a performance of 03:40 (minutes:seconds)
by the end of 2045.
During AMP6 we have started along this journey with the development of supply interruption risk
based mains investment appraisal tools and through investment in a 24/7 detection and response
team working within our Integrated Control Centre enabling intelligence lead responses to
proactively detected supply interruption events. This is supported by an expanding fleet of
Alternative Supply Vehicles (ASVs) and other innovative techniques helping to minimise customer
impact. We have already started see improvements in performance associated with these new ways
of working. Beyond AMP8 we have profiled an improving performance trend that meets our long
term ambition of no customer supply interruptions by 2040.
This long term ambition will also have to consider and accommodate external factors beyond the
company’s control, such as climate change, population growth and changes to the industry &
customer behaviour as a result of the COVID-19 pandemic. We also need to appreciate the influence
of asset deterioration over the longer term and ensure that we adopt the correct delivery strategies
maintain service levels and operational resilience. As our understanding of the influence of these
factors evolves, our ambition may need to adapt, but we will always strive to achieve the best
service outputs for customers and ensure the environment is protected and enhanced.
AMP7 performance commitments and outcome delivery incentives: definition document 45
Unplanned outage (B04-CF)
Purpose of this measure
This performance commitment is designed to incentivise the company to appropriately maintain and
improve the asset health of the non-infrastructure or above-ground water assets and demonstrate
its commitment to its asset stewardship responsibilities.
Benefits of this measure
This performance commitment helps to ensure that the overall asset health of the above-ground
water assets is maintained and improved for the benefit of current and future generations.
Measure description
This measure assesses asset health (primarily for non-infrastructure assets, i.e. above ground assets), for water abstraction and water treatment activities. The measure is reported as the temporary loss of peak week production capacity (PWPC) and is defined in Ofwat’s final reporting guidance for PR19.
Our definition for unplanned outages is consistent with reporting guidance for PR19 published on 27
March 2018. https://www.ofwat.gov.uk/wp-content/uploads/2018/03/20190327-6.-Unplanned-
outage-final-reporting-guidance.pdf
Measure definition
This measure is defined as the annualised unavailable flow, based on the peak week production capacity (or PWPC), for each company. This measure is proportionate to both the frequency of asset failure as well as the criticality and scale of the assets that are causing an outage. The failure or deterioration of any asset which impacts on the ability to produce the peak week production capacity should be recorded as an unplanned outage. This may be a failure which impacts part or all of the production plant which contributes to peak week production capacity. This can include:
source abstraction assets (e.g. abstraction pumps, screens, boreholes);
raw water transport assets (e.g. pumping plant and mains);
raw water storage assets (e.g. balancing reservoirs);
water treatment assets;
treated water storage assets (e.g. contact tanks, pre-distribution storage); and
treated water distribution assets before distribution input meter (e.g. treated water pumping).
It is important to understand planned and unplanned outage as they both reflect on asset health. The actual unplanned outage should be reported as the temporary loss of peak week production capacity in the reporting year weighted by the duration of the loss (in days). Outages arising from planned works should be recorded separately to outages arising from unplanned causes, such as asset failure. The proposed calculation for both figures is:
Unplanned outage for each water production site is calculated separately and then summed over the reporting year to give a total actual unplanned outage for the water resource zone. The company water resource zone weighted outage can then be summed (Ml/d) and normalised based on overall company peak week production capacity to be reported as a percentage.

AMP7 performance commitments and outcome delivery incentives: definition document 46
Measurement units
The measure will be reported as the percentage of peak week production capacity reported to two
decimal places.
Mitigation/exceptions/assumptions
Exclusions are as defined in the reporting guidance and include:
1. Planned outages
Planned outages are excluded from this measure however they are reported separately. Where the
peak production capacity of the works is limited through planned works to address a design
limitation, deliver an improvement or to address a newly identified need it is recorded as a planned
outage. Where an asset has never had a capability, or a new requirement has been identified in
order to safely and reliably operate at a design capability this is recorded as a planned outage.
Planned outages are evidenced with a planned work order reference, project number or purchase
order.
2. Proactive maintenance
If peak production capacity of the works is limited by proactive maintenance on an asset or process
which has been identified through proactive inspection or condition based monitoring this should be
recorded as a proactive maintenance. This outage should be evidenced with a proactive work order
reference and is reported under the planned outage reporting line.
3. Outages causing no reduction in PWPC
The integrated water system in our region often means the impact of any unplanned outage is not felt by customers. A supply deficit can often be met by an alternative water treatment works and transported through our distribution network to ensure that customer demand is met and supplies are not interrupted.
Example 1
In some circumstances the failure of assets upstream of the treated water distribution assets may
not impact on the peak week production capacity. Where a river abstraction is pumped to bankside
storage and then stored water is pumped onto treatment works, the failure of an abstraction pump
may not impact peak week production capacity as water onto the treatment works can be
maintained from the raw water storage. The length of time that this asset is unavailable will
determine whether the peak week production capacity is reduced and therefore contributes to
unplanned outage.
Example 2
Where asset failures occur at water production sites with standby assets this may also not impact
peak week production capacity. For example, a groundwater site with a peak week production
capacity of 10Ml/d may have three boreholes on site, all with capacity of 5Ml/d. Under normal
circumstances boreholes 1 and 2 may be operated to provide the site output of 10Ml/d. If the pump
in borehole 1 fails then borehole 3 is switched on to replace the lost capacity. Providing borehole 3 is
switched on within 24 hours to replace the failed asset in borehole 1 there would be no unplanned
outage recorded. There may need to be an outage at a later stage to repair or replace the failed
pump. Whilst this can be scheduled and planned for a convenient time the reason for the need to
make the repair is an unforeseen failure of an asset and therefore the outage for the scheduled
repair or replacement would also be classified as unplanned.
4. Outages lasting less than 24 hours

AMP7 performance commitments and outcome delivery incentives: definition document 47
Only outage events which exceed 24 hours in duration are included in this measure. Outage duration
is recorded to the nearest whole day with normal rounding rules applied. For the avoidance of
doubt, all outages below 24 hours are excluded and rounding does not apply. The duration may span
a calendar day. By way of an example of rounding, an unplanned outage of 79 hours would be 3 days
whereas an unplanned outage of 115 hours would be 5 days.
The end of the unplanned outage period should be recorded as the time when the asset was
returned to a state meaning the availability of peak week production capacity is restored. For the
avoidance of doubt this should not be when the individual asset is repaired or planned work
completed but when the recommissioning process is completed, except when there is no immediate
requirement to put an asset back into service. In this case the repair time is taken as the end of the
unplanned outage period. If when the asset is next required to be put into service, it operates in a
way that would count as an unplanned outage, the start time for the reported unplanned outage
should be that of the original outage.
Example 3
If a borehole pump is replaced due to an unexpected failure or planned works the end of the
unplanned outage is not when the pump replacement is completed but when any subsequent
pumping to waste and water quality testing is finished and full peak week production capacity is
restored, if the pump is required in service immediately.
If the pump is not required in service immediately, then repair or replacement time is taken as the
end of the unplanned outage. When the pump is next required to be put into service, should it
operate in a way that would count as an unplanned outage, the start time for the reported
unplanned outage should be that of the original outage. Where planned work exceeds the duration
of the scheduled outage any extension is to be included within the planned outage figure.
5. Water quality beyond the normal water quality operating band
Unplanned outage arising from changes in raw water quality beyond the normal water quality
operating band shall be excluded as this is not a measure of asset health. Exclusions will be evidence
based including evidence to show what the normal water quality operating band for that production
site is. This exclusion applies to transient changes to raw water quality such as turbidity, algae,
pollution, spikes in nitrate and pesticide. If we choose to manage variable raw water quality by
proactively temporarily restricting water production then this will be classed as an exclusion. Long-
term trend based changes in raw water quality which result in unplanned outages are not permitted
as exclusions as companies are expect to have the data to recognise a rising trend and foresee the
need to plan for treatment etc.
6. Extreme weather
Peak week production capacity of the works can be limited through extreme weather or any other
extreme event. This should be recorded as an extreme event, but would need to be well justified
and assured. Examples of extreme events include third party asset failures, power supply outages,
storms etc. Extreme dry weather is categorised separately as described in the category below.
7. Dry weather
If the production capacity of the works is limited by the available raw water then it can be excluded.
If both the available volume and the quality of the raw water are constraints, the outage should be
classified against raw water availability, e.g. a low level reservoir with turbid or high levels of algae.
This outage should be evidenced with a link to the appropriate hydrogeological constraint, i.e. draw-
down curve and current reservoir level.

AMP7 performance commitments and outcome delivery incentives: definition document 48
For clarity repeat unplanned outages at the same production site should not be excluded and should
be treated as separate events with independent start and finish times unless the initial outage repair
and recommissioning was not concluded and there was not full restoration of available peak week
production capacity.
Where a choice has been made not to respond immediately to an unplanned outage such as a failure
at the weekend for which alternative water can be deployed the duration may be longer than it
might otherwise have been, there will be no adjustment for this in the measurement of the duration
of the unplanned outage. This may result in reporting higher unplanned outage figures but given
that alternative sources are available it is unlikely that the unplanned outage in this example would
be contributing a large amount to the overall peak week production capacity and so would therefore
have a relatively small impact on the overall measure.
Common performance commitment
This is a common performance commitment defined by Ofwat for AMP7.
Incentive type
Financial – subject to underperformance penalties.
Price control allocation
Water resources
Water network+
Wastewater network+
Bioresources Residential retail
Business retail
Direct procurement
5% 95% 0% 0% 0% 0% 0%
5% has been allocated to the water resources price control to reflect the percentage of water
resource assets (e.g. borehole abstraction assets which directly supply water treatment works) and
their production capacity on the overall company production capacity.
Performance commitment for AMP7
Unit
AMP7
2020/21 2021/22 2022/23 2023/24 2024/25
Proportion of unplanned outage of the total company
production capacity % 3.56% 3.26% 2.95% 2.65% 2.34%

AMP7 performance commitments and outcome delivery incentives: definition document 49
Figure 10
Deadbands, caps and collars
Unit AMP7
2020/21 2021/22 2022/23 2023/24 2024/25
Underperformance collar
Proportion of unplanned outage of
the total company production capacity %
7.13% 7.13% 7.13% 7.13% 7.13%
Outcome Delivery Incentive
This measure is subject to underperformance financial incentives, which will be reconciled annually
on an in-period basis.
Outperformance/underperformance incentive rate
This measure is subject to an underperformance penalty, which has been set at £2,703,000 per
percentage above the performance commitment.
Worked example
If our total peak week production capacity is 3380.89Ml/d our performance commitment of 3.56%
equates to an unplanned outages volume of 120.36 Ml/d.
1. For a single source works
A source works has a peak week production capacity of 30 Ml/d.
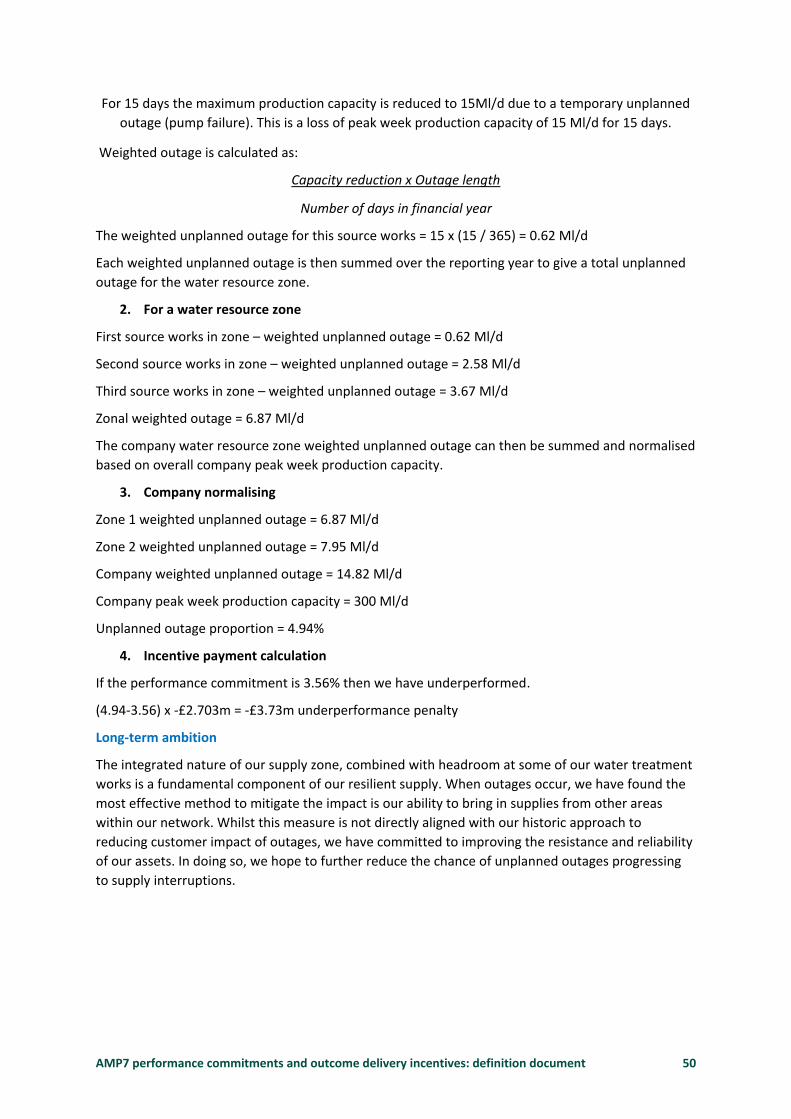
AMP7 performance commitments and outcome delivery incentives: definition document 50
For 15 days the maximum production capacity is reduced to 15Ml/d due to a temporary unplanned
outage (pump failure). This is a loss of peak week production capacity of 15 Ml/d for 15 days.
Weighted outage is calculated as:
Capacity reduction x Outage length
Number of days in financial year
The weighted unplanned outage for this source works = 15 x (15 / 365) = 0.62 Ml/d
Each weighted unplanned outage is then summed over the reporting year to give a total unplanned
outage for the water resource zone.
2. For a water resource zone
First source works in zone – weighted unplanned outage = 0.62 Ml/d
Second source works in zone – weighted unplanned outage = 2.58 Ml/d
Third source works in zone – weighted unplanned outage = 3.67 Ml/d
Zonal weighted outage = 6.87 Ml/d
The company water resource zone weighted unplanned outage can then be summed and normalised
based on overall company peak week production capacity.
3. Company normalising
Zone 1 weighted unplanned outage = 6.87 Ml/d
Zone 2 weighted unplanned outage = 7.95 Ml/d
Company weighted unplanned outage = 14.82 Ml/d
Company peak week production capacity = 300 Ml/d
Unplanned outage proportion = 4.94%
4. Incentive payment calculation
If the performance commitment is 3.56% then we have underperformed.
(4.94-3.56) x -£2.703m = -£3.73m underperformance penalty
Long-term ambition
The integrated nature of our supply zone, combined with headroom at some of our water treatment
works is a fundamental component of our resilient supply. When outages occur, we have found the
most effective method to mitigate the impact is our ability to bring in supplies from other areas
within our network. Whilst this measure is not directly aligned with our historic approach to
reducing customer impact of outages, we have committed to improving the resistance and reliability
of our assets. In doing so, we hope to further reduce the chance of unplanned outages progressing
to supply interruptions.

AMP7 performance commitments and outcome delivery incentives: definition document 51
Per capita consumption (B05-WN)
Purpose of this measure
This performance commitment is designed to incentivise companies to help customers reduce their
consumption.
Benefits of this measure
The benefit of reduced per capita consumption (PCC) is to improve longer term water resources
resilience (improved supply-demand balance position) and reduce the need for water whilst keeping
costs down for customers.
Measure description
Per capita consumption is defined as the sum of measured household consumption and unmeasured
household consumption divided by the total household population.
The performance commitments for this measure are based on the percentage reduction of three
year average per capita consumption in litres/person/day (l/p/d) from the 2019/20 baseline.
Our definition for PCC is consistent with reporting guidance for PR19 pubished on 27 March 2018. https://www.ofwat.gov.uk/wp-content/uploads/2018/03/Reporting-guidance-per-capita-consumption.pdf
In order to account for weather variations and how this impacts on PCC the performance commitment is based on a three-year average. PCC will be reported annually and a company’s performance will be measured as a three-year average of the annual figures. The performance commitment is based on the percentage reduction against the 2019/20 three-year average baseline 144.0 Ml/d.
Measure definition
Annual average per capita consumption is defined as the sum of measured household consumption
and unmeasured household consumption divided by the total household population.
To derive per capita consumption, we will use the standard UK water balance approach, consistent
with the new guidance on leakage reporting2 which also covers the calculation of per capita
consumption. The best practice is still to estimate leakage using two nationally-agreed methods, the
integrated flow approach (‘top down’) and the minimum night flow approach (‘bottom up’) and
providing that the water balance reconciles to within +/- 5%, undertake a reconciliation exercise.
This is carried out using maximum likelihood estimation (MLE) to allocate the reconciliation gap
across the individual components of the water balance. Per capita consumption is then calculated
using the post reconciliation value of total household consumption divided by the total household
population.
2 (UKWIR, Consistency of Reporting Performance Measures - Leakage (17/RG/04/5), 2017)

AMP7 performance commitments and outcome delivery incentives: definition document 52
The population estimates are updated every year, as part of our annual reporting processes, using
data from the Office for National Statistics. The total household population value is the sum of the
resident population in each of our water supply zones, where we provide supply directly to
properties.
Occupancy rates of properties are updated every five years as a minimum, through customer
surveys, and are used to inform the WRMP demand forecasts. In addition to being integral to
demand forecasts, occupancy rates are also used to determine the population associated with the
different consumption components in the water balance.
The definition of household properties is in line with our annual performance reporting and relate to mainstream household properties such as houses, bungalows and flats.
The forecast within this documents relates to our WRMP19, with options selected that represent best long-term value to customers. This process has involved all unconstrained options being considered, and reduced to constrained and feasible options that could be selected in the modelling, to solve any supply-demand balance deficits and form the preferred plan.
Our calculation approach:
Per capita consumption (PCC) performance commitment = A – B
Where:
A – annual performance commitment target expressed as % reduction from baseline
B – % reduction from baseline calculated from three-year rolling average of reported PCC
The approach is based on a three-year rolling average, in line with Ofwat’s requirements for both PCC and leakage, especially given that both are subject to weather related volatility3 and both form part of the same water balance calculation. In order to account for weather variations and how this impacts on PCC the performance commitment is based on a three-year average. The performance commitment is based on the percentage reduction against the 2019/20 three year average baseline 144.0 Ml/d.
Unit 2017/18 2018/19 2019/20
Per capita consumption litres/person/day 143.6 144.4 144.0
Three-year average per capita consumption
litres/person/day, 3 year average
144.0
Measurement units
Percentage reduction from 2019/20 baseline 144.0 Ml/d (average of 2017/18, 2018/19 and 2019/20).
Mitigation/exceptions/assumptions
All estimates of per capita consumption will exclude underground supply pipe losses, and relate to mainstream properties supplied, in line with the Regulatory Accounting Guidelines published by Ofwat.
Common performance commitment
This is a common performance commitment developed by Ofwat for AMP7.
3 Delivering Water 2020: Our methodology for the 2019 price review Appendix 2: Delivering outcomes for customers, Ofwat, Dec 2017
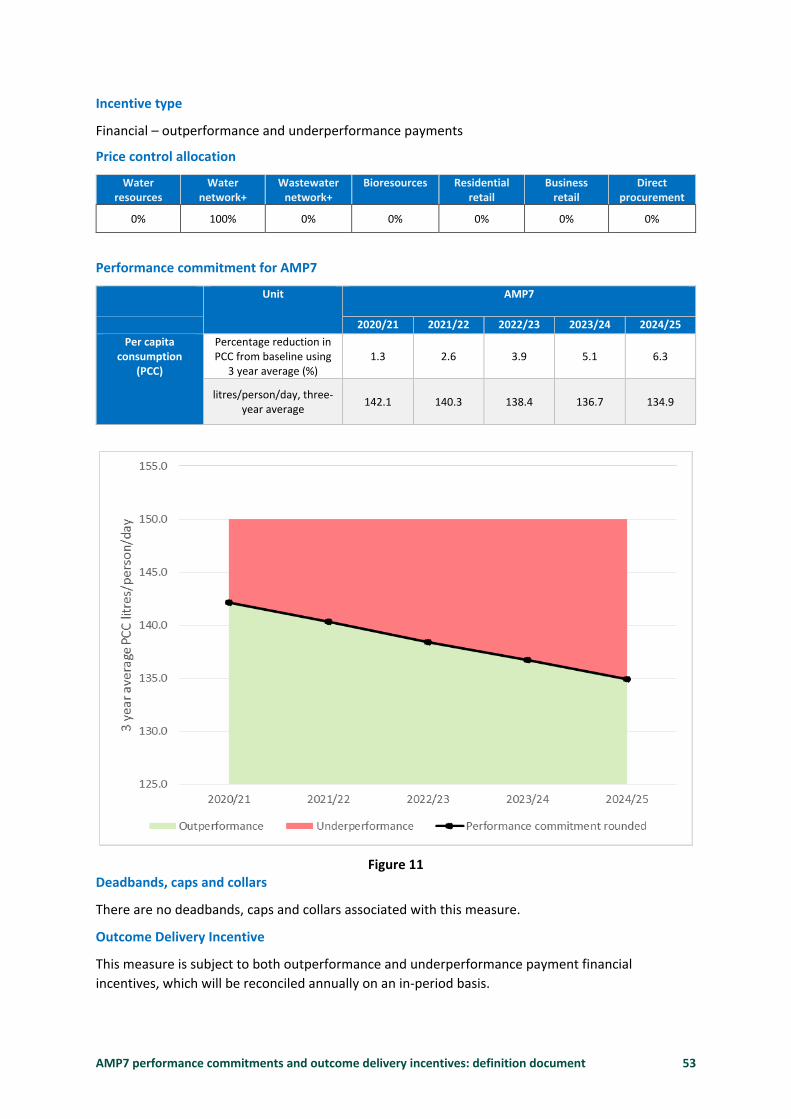
AMP7 performance commitments and outcome delivery incentives: definition document 53
Incentive type
Financial – outperformance and underperformance payments
Price control allocation
Water resources
Water network+
Wastewater network+
Bioresources Residential retail
Business retail
Direct procurement
0% 100% 0% 0% 0% 0% 0%
Performance commitment for AMP7
Unit AMP7
2020/21 2021/22 2022/23 2023/24 2024/25
Per capita consumption
(PCC)
Percentage reduction in PCC from baseline using
3 year average (%) 1.3 2.6 3.9 5.1 6.3
litres/person/day, three-year average
142.1 140.3 138.4 136.7 134.9
Figure 11 Deadbands, caps and collars
There are no deadbands, caps and collars associated with this measure.
Outcome Delivery Incentive
This measure is subject to both outperformance and underperformance payment financial
incentives, which will be reconciled annually on an in-period basis.
AMP7 performance commitments and outcome delivery incentives: definition document 54
Outperformance/underperformance incentive rate
This measure is subject to an underperformance penalty, which has been set at £396,000 for each
litre/person/day over the performance commitment. The outperformance payment has been set at
£330,000 for each litre/person/day under the performance commitment.
Worked examples
Example 1: Success in delivering outperformance
Three-year average PCC target in 2020/21 = 142.1 l/p/d
Three-year average PCC performance in 2020/21 = 140.0 l/p/d
142.1 – 140.0 = 2.1 l/p/d below performance commitment
2.1 x £330,000 = £693,000
Example 2: Failure to achieve performance commitment
Three-year average PCC target in 2020/21 = 142.1 l/p/d
Three-year average PCC performance in 2020/21 = 145.0 l/p/d
145.0 – 142.1 = 2.9 l/p/d above performance commitment
2.9 x -£396,000 = -£1,148,400
Long-term ambition
As part of regional planning with Water Resources West (WRW) and in developing our WRMP24, we are taking account of National Framework for Water Resources expectations and the call to reduce household demand and drive down water use across all sectors.
As discussed in our WRMP19, we are mindful that in order to maintain the long-term forecasts we
need to keep our approach fresh. We are constantly looking for ways to enhance our offering to
customers through research and partnership working, and we have undertaken customer research
to understand the benefits, barriers and motivations to desired behaviours and willingness to act to
achieve greater water efficiency. The results of the research will be used to better inform our
approach and we will continue to drive behavioural change through our customer messaging via
community engagement; social media and digital presence; and more traditional printed messaging
on customer correspondence.
We recognise the important contribution of customer metering in reducing demand for water and,
therefore, metering plays a key role in our demand management plans. We continue to promote
free meters with inserts in unmeasured bills and from time to time we send out targeted mailshots
to specific customer segments. We have also introduced our lowest bill guaranteed proposition.
Initially we have promoted the offer, through a direct campaign supported by social and digital
advertising and more than 90 per cent of those switching have made a saving on their bill. 30,000
customers have already made a combined saving of more than £4.2 million on their water bills.
In addition to this continuation and development of our activities to promote meter free meter
optants, our decision making process has included the lowest AISC option of the metering options
that go beyond our baseline activities, promoting metering in conjunction with mains/service pipe
renewal activities.

AMP7 performance commitments and outcome delivery incentives: definition document 55
Drought risk resilience (B06-CF)
Purpose of this measure
To measure resilience of each company to severe restrictions in a 1 in 200 drought and incentivise
the improvement of this level of resilience in the short and longer term.
Benefits of this measure
A reduction in the risk of severe drought restrictions will reduce the associated risk of substantial
costs and detrimental effects on customers’ wellbeing.
Measure description
This new common measure relates to the risk of severe restrictions in a drought. Specifically, the
measure reports the percentage of the customer population at risk of experiencing severe
restrictions (for example, standpipes or rota cuts as part of emergency drought orders) in a 1 in 200
year drought, on average, over 25 years.
Our definition for drought resilience is consistent with reporting guidance for PR19 published on 27
March 2018. https://www.ofwat.gov.uk/wp-content/uploads/2018/03/Drought-resilience-metric-
March-18.pdf
Measure definition
The population is considered to be ‘at risk’ if the supply-demand balance calculation in each water
resource zone (as used for water resource planning) for the 1 in 200 year drought event results in a
shortfall (deficit). This will occur when the modelled deployable output minus outage allowance
(available supply) is less than the dry year demand plus base year target headroom (demand plus
uncertainty).
𝐴𝑡 𝑟𝑖𝑠𝑘 𝑖𝑓,𝐷𝑂−𝑂𝐴 <𝐷𝐷+𝑇𝐻
Where:
DO = Deployable output (supply)4, including deployable output reductions due to climate
change and sustainability reductions (licence changes)
OA = Outage allowance (unavailable supply)
DD = Dry year demand
TH = Target headroom (uncertainty)5
The data and assumptions used for this metric will be consistent with those forecast and reported
for the WRMP6, which has technical guidance issued by the Environment Agency and Natural
Resources Wales in collaboration with Defra, the Welsh Government and Ofwat.
4 In line with calculating water available for use equivalent, we have also accounted for “Raw Water Losses and Operational Use” and “Treatment Works Losses and Operational Use”. 5 The methodology also states that, for target headroom, companies should use the 95th percentile certainty (or equivalent for complex methods) for the first five years of the planning period forecasts and for performance reporting. Beyond the 5 years the percentile should follow the same trend as the company’s WRMP19. 6 The calculation of this measure largely focuses on data in our WRMP19 table submission, in particular the new Drought Links table (Table 10).

AMP7 performance commitments and outcome delivery incentives: definition document 56
The drought risk resilience ODI is calculated through the use of the supply demand balance data that
was extracted from the Water Resources Management Plan (WRMP) tables and adjusted in-line with
the 1 in 200 year deployable output (DO) values as reported in WRMP Table 10. It is important to
note this is based on the change in our ‘Integrated Resource Zone’ to the ‘Strategic Resource Zone’,
which results from completion of the Thirlmere transfer to West Cumbria early in the planning
horizon.
A key element when reporting this performance commitment is the certainty grading, which
indicates the accuracy of the data that has been submitted and is made up of a:
Methodology grade: the rigour or sophistication of the drought definition process; and
Risk score: how close each company may come to implementing restrictions.
We have calculated the methodology grade and risk score in line with the “Drought Resilience
Metric: "Development of a ‘Certainty Grade’” report (Atkins, 2018)7.
Measurement units
The percentage of customers at risk of experiencing severe restrictions during a 1 in 200 year
drought event, on average over 25 years, reported to one decimal place.
In line with the methodology, we will also report the number of customers at risk of experiencing
severe restrictions during a 1 in 200 year drought event, on average over 25 years, as additional
contextual data in the commentary.
Mitigation/exceptions/assumptions
None.
Common performance commitment
This is a common performance commitment defined by Ofwat for AMP7.
Incentive type
This common measure is reputational.
Price control allocation
The measure will be evenly allocated across our water resources and water network+ price controls.
The rationale for this allocation is that both price controls are responsible for maintaining assets
related to the abstraction, treatment and distribution of water, to ensure drought resilience is
maintained.
Water resources
Water network+
Wastewater network+
Bioresources Residential retail
Business retail
Direct procurement
50% 50% 0% 0% 0% 0% 0%
Performance commitment for AMP7
The performance commitment is set to ensure that there are no customers experiencing severe supply
restrictions in a 1 in 200 year drought.
7 https://www.water.org.uk/publications/reports/drought-resilience-metric-development-%E2%80%98certainty-grade

AMP7 performance commitments and outcome delivery incentives: definition document 57
Unit AMP7
2020/21 2021/22 2022/23 2023/24 2024/25
Percentage of customers that would experience severe
supply restrictions in a 1 in 200 year drought (%)
0.0 0.0 0.0 0.0 0.0
The methodology grades, risk scores and acceptability or certainty grade for our resource zones is
shown in the table below. We have calculated the Methodology Grade and Risk Score in line with
the ‘Drought Resilience Metric: Development of a Certainty Grade’ report (Atkins, 2018)8.
As shown in the table above, the methodology grade for each of our resource zones is either ‘B’ or
‘C’. The choice of approach was driven by the risk-based review of each resource zone, in line with
UKWIR guidance9. The methodology grade of ‘C’ reflects the level of sophistication required to
assess our smaller resource zones. The methodology grade of ‘B’ relates to the use of a ‘weather
generator’ approach, which is one of the most advanced approaches used as part of the WRMP19
process10.
The risk score/label relates to the confidence in the supply-demand balance, with our resource
zones either scoring a ‘1’ or ‘2’, both of which represent a very secure surplus. Overall, our resource
zones all achieve the ‘Blue’ acceptability colour, which means that they are very certain, with no
need to review unless there is a large change to the supply-demand balance.
The 2019/20 baseline supply zone calculation was based on the values in the table below.
Component 2020/21 2025/26 2030/31 2035/36 2040/41 2044/45
1. Strategic Resource Zone
Deployable output (1 in 200 year) 2019.7 2008.2 1997.9 1988.5 1978.9 1971.1
Outage allowance 101.3 101.3 101.3 101.3 101.3 101.3
Dry year demand 1706.3 1697.3 1685.2 1678.1 1675.4 1676.0
Target headroom 95.8 91.4 96.3 94.8 90.0 85.3
Supply-demand balance 116.3 118.2 115.1 114.3 112.2 108.4
1. Barepot Resource Zone
Deployable output (1 in 200 year) 34.1 34.1 34.1 34.1 34.1 34.1
Outage allowance 0.0 0.0 0.0 0.0 0.0 0.0
8 https://www.water.org.uk/publications/reports/drought-resilience-metric-development-%E2%80%98certainty-grade 9 Specifically, WRMP 2019 Methods – Decision Making Process: Guidance (UKWIR, 2016) and WRMP 2019 Methods – Risk Based Planning (UKWIR, 2016). 10 Methodology Grade “A” relates to the use of drought event data from the latest research outputs that have employed global climate model ensemble runs to simulate droughts.
Resource zone Methodology grade Risk score/label Acceptability or certainty grade
Strategic B 2 Blue
Barepot B 1 Blue
Carlisle B 1 Blue
North Eden C 1 Blue

AMP7 performance commitments and outcome delivery incentives: definition document 58
Dry year demand 26.9 26.9 26.9 26.9 26.9 26.9
Target headroom 1.4 1.4 1.4 1.4 1.4 1.4
Supply-demand balance 5.8 5.8 5.8 5.8 5.8 5.8
2. Carlisle Resource Zone
Deployable output (1 in 200 year) 34.7 34.6 34.6 34.5 34.5 34.4
Outage allowance 1.6 1.6 1.6 1.6 1.6 1.6
Dry year demand 28.0 28.2 28.3 28.2 28.1 28.0
Target headroom 2.3 2.0 1.7 1.3 1.0 0.8
Supply-demand balance 2.8 2.9 3.1 3.4 3.8 4.1
3. North Eden Resource Zone
Deployable output (1 in 200 year) 13.0 13.0 13.0 13.0 13.0 13.0
Outage allowance 0.0 0.0 0.0 0.0 0.0 0.0
Dry year demand 6.1 6.2 6.2 6.2 6.2 6.1
Target headroom 0.3 0.3 0.3 0.3 0.3 0.3
Supply-demand balance 6.5 6.5 6.5 6.5 6.5 6.4
Deadbands, caps and collars
There are no deadbands, caps and collars associated with this measure.
Outcome Delivery Incentive
This is a reputational only ODI.
Outperformance/underperformance incentive rate
As a reputational measure, there is no incentive rate associated with this metric.
Worked examples
The below table shows an example calculation for our Strategic Resource Zone for our baseline (end
of AMP6) and AMP7 performance.
2019/20 2020/21 2021/22 2022/23 2023/24 2024/25
1 in 200 deployable output (with the benefit drought permits and drought orders to augment supply) minus outage allowance (Ml/d)
1,923 1,922 1,920 1,917 1,915 1,912
Dry year demand plus target headroom (Ml/d)
1,799 1,802 1,795 1,788 1,778 1,745
1 in 200 supply-demand balance (with the benefit of drought permits and drought orders to augment supply) (Ml/d)
124 120 125 129 137 167
Total population at risk (number) 0.0 0.0 0.0 0.0 0.0 0.0 Percentage of total population at risk (%) 0.0% 0.0% 0.0% 0.0% 0.0% 0.0%

AMP7 performance commitments and outcome delivery incentives: definition document 59
Long-term ambition
As drought resilience is addressed as part of the WRMP process, all of our assessments cover a long-
term view. The planning period for WRMP19 extends from 2020-2045, but we also take an even
longer-term view out to the 2080’s.
As such we have already forecasted the estimated frequency of emergency drought orders through
to 2045. Our long-term ambition is to maintain and, if possible, improve our drought resilience (but
this is subject to the risks and issues set out above).

AMP7 performance commitments and outcome delivery incentives: definition document 60
Reducing areas of low water pressure (B07-WN)
Purpose of this measure
This performance commitment is designed to incentivise the company to reduce the number of
customers that experience their water supply having a low pressure.
Benefits of this measure
This performance commitment reduces the number of customers suffering from poor or no water
supply due to low pressure.
Measure description
The number of properties receiving pressure below the guaranteed standard. This measure is
calculated as the total number of properties receiving pressure below standard, minus the number
of properties that are covered by the predetermined allowable exclusion categories as detailed in
the reporting guidance, divided by the number of connected properties in 10,000s.
Our definition for reducing low pressure is consistent with reporting guidance for PR19 published on
27 March 2018. https://www.ofwat.gov.uk/wp-content/uploads/2017/12/Properties-at-risk-of-
receiving-low-pressure.pdf
Measure definition
This measure is defined as the number of properties receiving pressure below that set out in the
Ofwat guaranteed standards of service of 9 litres per minute at 10 meters pressure at the customer’s
first incoming tap. This will be reported per 10,000 connected properties, all property types will be
included.
The reference level of service is a flow of 9l/min at a pressure of 10m head on the customer’s side of
the main stop tap (mst). The reference level applies to a single property. The reference level of
service must be applied on the customer's side of a meter or any other company fittings that are on
the customer's side of the main stop tap. Where a common service pipe serves more than one
property, the flow assumed in the reference level must be appropriately increased to take account
of the total number of properties served. For two properties, a flow of 18l/min at a pressure of 10m
head on the customers' side of the mst is appropriate. For three or more properties the appropriate
flow should be calculated from the standard loadings provided in BS6700 or Institute of Plumbing
handbook. See below for a tabulation of minimum mains pressures for the reporting of low
pressures on common services.
Because of the difficulty in measuring pressure and flow in the customer’s property a surrogate
reference level is used. A surrogate of 15m head in the adjacent distribution main is used unless a
different level can be shown to be suitable. In some circumstances companies may need to use a
surrogate pressure greater than 15m to ensure that the reference level is supplied at the customer's
side of the mst (for example in areas with small diameter or shared communication pipes).
Common supplies are where a communication pipe supplies more than one property. The required
pressure in the adjacent water main used to estimate properties affected should exceed those given
in the table in the table below.

AMP7 performance commitments and outcome delivery incentives: definition document 61
Figure 12
This table is intended to be a guide to the absolute minimum service acceptable over an hour (i.e. it
is not based on an instantaneous peak flow). The calculations assume delivery of 9 l/minute upstairs
to a combination tank (not in the loft) in the end property on a common service of half-inch bore.
The calculations use the BS 6700 loading units (LU) basis, but at 3 LUs per property (9 l/minute). The
LU calculations on larger groups of properties (i.e. more than 100) give instantaneous flows of
between 4 and 8 times the peak hour flow rates actually observed on local distribution systems,
subject to leakage and hose pipe assumptions. Accordingly, the use of 3 LUs per property is taken as
an acceptable minimum.
There are a number of circumstances under which properties identified as receiving low pressure
should be excluded from the reported figure. The aim of these exclusions is to exclude properties
which receive a low pressure as a result of a one-off event and which, under normal circumstances
(including normal peaks in demand), will not receive pressure or flow below the reference level. For
exclusions see the mitigation/exception/assumption section.
The measure is calculated simply as the cumulative total number of properties receiving pressure
below standard, minus the number of those properties that are covered by the predetermined
allowable exclusion categories detailed below, divided by the number of connected properties in
10,000’s.
𝑃𝑟𝑜𝑝𝑒𝑟𝑡𝑖𝑒𝑠 𝑟𝑒𝑐𝑒𝑖𝑣𝑖𝑛𝑔 𝑙𝑜𝑤 𝑝𝑟𝑒𝑠𝑠𝑢𝑟𝑒 = ∑(𝑝1 − 𝑝2)
(𝑛/10,000)
Where;
p1 = total properties receiving water below standard
p2 = total properties receiving low water pressure that are covered by allowable exclusions
n = number of connect properties for water supply
Measurement units
Measured as the number of customers receiving low pressure per 10,000 connected properties and
reported to three decimal places.

AMP7 performance commitments and outcome delivery incentives: definition document 62
Mitigation/exceptions/assumptions
Verifiable, auditable records of all the exclusions that are applied will be kept in order to confirm the
accuracy and validity of information. All properties identified as having received pressure or flow
below the reference level must be reported, unless it can be confirmed that they are covered by one
of the following exclusions.
Abnormal demand. This exclusion is intended to cover abnormal peaks in demand and not
the daily, weekly or monthly peaks in demand which are normally expected. Some
companies are more affected by low pressures caused by occasional prolonged peaks in
demand than by a few abnormal peak days each year. In such cases, instead of excluding up
to five days each year, companies may choose to apply the abnormal demand exclusion over
a five-year period. This will allow companies to exclude from their figures properties
affected by low pressures that occur on any 25 days in a rolling five-year period. The
'excluded day' may be applied to the company as a whole or at the level of individual zones.
However, in either case, once a property has suffered low pressures on either more than five
days in one year or 25 days in five years, it must be added to the reported figures.
1. Option 1 - During the report year, companies may exclude for each property a
maximum of 25 days of low pressure caused by abnormal demand in a rolling five
year period. Companies should exclude from the reported figures properties that are
affected by low pressure only on the days identified as "high demand" in the report
year. In years where demand is normal (i.e. the exclusion is not being used),
properties affected by relevant low pressure incidents should be reported as
receiving low pressure (unless covered by one of the other exclusions). There are a
number of circumstances under which properties identified as receiving low
pressure will be excluded from the reported figure. The aim of these exclusions is to
remove properties which receive a low pressure as a result of a one-off event and
which, under normal circumstances (including normal peaks in demand), will not
receive pressure or flow below the minimum pressure standard.
2. Option 2 - Where extensive pressure logging covering the majority of properties in
the supply area is used, the company may exclude properties where logger records
verify that up to five incidents of low pressure lasting more than one hour have
occurred. Under this option, it is not necessary to match the low pressure incidents
with high demands. Companies that choose this method must include the number of
properties that suffer more than five incidents of low pressure lasting more than
one hour in the reported figure without necessarily identifying the specific occasions
and reasons for abnormal demand. If this method is used, no other allowance may
be made for abnormal demand but the other exclusions still apply. Companies must
clearly state in their methodologies which approach they have adopted in applying
this exclusion, list the distribution or supply zones they have chosen and the number
of days excluded. If the exclusion is applied at the level of individual zones, rather
than to the company as a whole, the company must maintain verifiable records
which list the number of 'excluded days' used for each distribution zone each year.
Low pressure incidents of short duration – an incident of less than one hour in duration will
be excluded from the reported performance.

AMP7 performance commitments and outcome delivery incentives: definition document 63
Planned maintenance activity – low pressure caused by planned maintenance activity will
be excluded from the reported performance. Evidence such as work orders will be required
to demonstrate that planned maintenance activity was being undertaken.
One-off incidents – low pressure caused by a one-off incident will be excluded from the
reported performance. Such events included firefighting, company mains bursts or
equipment failures and action of third parties operating the water network.
Common performance commitment
This is an asset health measure which we have selected from Ofwat’s asset health long list.
Incentive type
Financial – outperformance and underperformance payments.
Price control allocation
Water resources
Water network+
Wastewater network+
Bioresources Residential retail
Business retail
Direct procurement
0% 100% 0% 0% 0% 0% 0%
Performance commitment for AMP7
The performance commitments for AMP7 deliver a service to customers slightly better than our best
ever performance.
Figure 13
Unit AMP7
2020/21 2021/22 2022/23 2023/24 2024/25
No. of properties with low pressure/poor supply (per 10,000 connections)
0.76 0.72 0.67 0.62 0.58

AMP7 performance commitments and outcome delivery incentives: definition document 64
Deadbands, caps and collars
There are no deadbands, caps, or collars associated with the measure.
Outcome Delivery Incentive
This measure is subject to both outperformance and underperformance financial incentives, which
will be reconciled annually on an in-period basis.
Outperformance/underperformance incentive rate
This performance commitment incentivises us if we outperform our best ever performance and
protects customers’ interests by penalising underperformance. The outperformance and
underperformance incentive rate is applied symmetrically to provide equal motivation for
improvement and avoided deterioration. The incentive rate is £342,000 per unit.
It is important to note that safeguarding against deterioration is central to this measure. The
forecasted growth in new development across the North West region will place increasing demand
on our water supplies and water distribution network. This measure will ensure we not only manage
our existing network from service deterioration but also invest the infrastructure renewal charges
from developers wisely and intelligently so that future development does not have an adverse
impact on existing or new customers.
Worked examples
Below are some examples of the calculation based on the equation in the Measure definition section
above.
Example p1 (total
properties receiving low
pressure)
p2 (properties covered
by allowable exclusions)
n connected properties
(10,000s)
Calculation Performance
1 1,500 1,000 329.31
=(1,500-1,000)/329.31
1.518
2 3,225 3,000 334.08
=(3225-3000)/334.08
0.673
3 5,068 5,000 341.81
=(5068-5000)/341.81
0.199
Outperformance financial payments will be awarded for performance below the AMP7 performance
commitment. We will incur underperformance financial payments for performance above the AMP7
performance commitment. These are calculated by simply subtracting the actual performance from
the performance target and multiplying by the incentive rate. The table below develops the
examples from above to show how outperformance / underperformance payments would be
calculated.
Example Performance (per 10,000 connection)
Performance commitment (per
10,000 connections)
Incentive rate (£)
Calculation
Outperformance/
Underperformance payment
1 1.518 0.62 £342,000 =(0.62-1.518)* £342,000 -£307,116
2 0.673 0.62 £342,000 =(0.62-0.673)* £342,000 -£18,126
3 0.199 0.62 £342,588 =(0.62-0.199)* £342,000 £143,982
AMP7 performance commitments and outcome delivery incentives: definition document 65
Long-term ambition
The performance commitments for AMP7 are challenging however we will continue to evaluate all properties that are on our low pressure register, to identify solutions and prioritise accordingly, and to ensure we can remove as many properties as viable from the low pressure register.
The greatest impact on low pressure performance is increasing demand for water from new developments, especially in some areas with limited additional network capacity. We anticipate an additional 20,000 new homes will be built each year, resulting in an increase of around 3% of connected properties. Without intervention, the number of properties affected by low water pressure is forecast to increase by over 50%. We will need to ensure that these new properties receive the appropriate level of service and protect our existing customers in order to maintain the stable position, in terms of numbers of customers receiving low pressure, which will be challenging.
Working with developers we are incentivising the building of more water efficient properties that have lower water loading impacts on the network, this will be in the form of a reduced infrastructure renewal charge to developers. We will also continue to work with Local Authorities to understand future development plans and demands, so we can focus investment in our network to facilitate development to help prevent determent to existing hydraulic capacity. We will deliver the improvement through delivery of efficient infrastructure investment and investment in innovative event detection, response, and restoration technology and practices. Continuing to deliver effective operation and maintenance of our asset base will enable us to mitigate the effects of asset failure resulting in customers receiving lower than standard water pressure.
This long term ambition will also have to consider and accommodate external factors beyond the
company’s control, such as climate change, population growth and changes to the industry &
customer behaviour as a result of the COVID-19 pandemic. We also need to appreciate the influence
of asset deterioration over the longer term and ensure that we adopt the correct delivery strategies
maintain service levels and operational resilience. As our understanding of the influence of these
factors evolves, our ambition may need to adapt, but we will always strive to achieve the best
service outputs for customer and ensure the environment is protected and enhanced.

AMP7 performance commitments and outcome delivery incentives: definition document 66
Water service resilience (B08-WN)
Purpose of this measure
This performance commitment is designed to measure the company’s ability to maintain a reliable
supply now and in the future by reducing the potential risks of longer duration interruptions.
Benefits of this measure
This performance commitment reduces the risk of longer-term water supply interruptions or of
water quality issues, due to water main or water treatment works supply failures.
Measure description
This measure reports the delivery of water service improvements that reduce the risk of long-term
interruptions to water supply, or of water quality issues, due to water main or water treatment works
supply failures.
Performance is measured as a reduction against a baseline risk assessment for 31 March 2020,
expressed in terms of an annual risk of customer water supply service days lost (customer service
days lost or csd/yr). The measure monitors improvements that affect this risk against the baseline
risk assessment for 2020.
The baseline risk assessment includes:
those water treatment works that cannot be switched off for longer than five days and
water mains where more than 4,000 customer properties could lose supply during a burst
repair.
Measure definition
Our customer research has shown that reducing the risking of long-term water supply interruptions is a high priority for customers. Since such interruptions are infrequent, performance on delivering this improvement in service needs to be measured in terms of reduction in risk of interruptions. The risk is quantified in terms of the risk of customer supply days lost per year.
The baseline risk level for 31st March 2020 is made up from two components; the water treatment
works baseline and the trunk main baseline. The Water Service Resilience baseline risk assessment is
based upon the 28 water treatment works (WTWs) that serve demand that can't be met from
alternative supplies on a sustainable basis. The primary data sources used to calculate the baseline
position for WTWs assessments are hydraulic network models and at least 15 years of historic
incident data. For water treatment works, risk is assessed based upon three factors:
The probability of an incident (such as flooding or loss of power supply) occurring and its
potential duration.
The probability of a service impact, if an incident occurs, taking into account our ability to
mitigate the impact using supply from other works and water storage.
The number of customers potentially affected.
The Water Service Resilience baseline risk assessment is based upon 361 critical trunk mains. The
primary data sources used to calculate the baseline position for water mains are the regional trunk
mains model which covers the old integrated resource zone and the DMZ models for the remaining 3
resource zones; Eden, Allerdale and Copeland. For water mains, the risk assessment is based on:

AMP7 performance commitments and outcome delivery incentives: definition document 67
The number of customers who could not be supplied by alternative routes if a trunk mains
fails
The likely duration of repair
The probability of the trunk main failing
The WTW and trunk mains risk assessments were independently audited to confirm the Water
Resilience Service baseline risk as of 31st March 2020.
unit 2019/20
WTW baseline assessment customer supply days lost/year
14,893
Trunk mains baseline assessment customer supply days lost/year
8,047
Overall water resilience baseline assessment
customer supply days lost/year
22,940
When future work is completed, resulting in a sustainable change to the risk of customer service
failure from water mains and water treatment works, we will assess the resultant risk position
against the baseline to quantify any change in risk, which we will report for this measure.
The risk assessment methodology and calculation of the baseline position for WTWs and water
mains are provided in the document ‘performance commitment technical document, chapter 5
supplementary document,’ reference S3001 as submitted to Ofwat in September 2018. We will aim
to use the same methodology and data each year and the resulting improvements will result from
the company delivered water service improvements only and not from methodological or data
changes.
Measurement units
Reduction in the number of customer water supply service days at risk per year reported to zero
decimal places.
Mitigation/exceptions/assumptions
None.
Common performance commitment
This is a bespoke measure.
Incentive type
Financial – outperformance and underperformance payments.
Price control allocation
Water resources
Water network+
Wastewater network+
Bioresources Residential retail
Business retail
Direct procurement
0% 100% 0% 0% 0% 0% 0%

AMP7 performance commitments and outcome delivery incentives: definition document 68
Performance commitment for AMP7
The performance commitment measures the reduction in risk level relative to the baseline risk level
of 22,940 customer supply days at risk per year. In developing the performance commitment target
values we have identified our target risk reduction for the period and calculated a linear profile. This
is on the assumption that any risk reduction work will be evenly delivered throughout the period.
Figure 14
Deadbands, caps and collars
Caps and collars are associated with this measure although there are no deadbands.
Outperformance caps and underperformance collars have been set at nominal, aggregate P90 and
P10 performance levels across the AMP. These are not technically exceedance probabilities as there
is no historic performance data to evaluate, they are instead credible delivery limits within our
AMP7 plan.
Unit AMP7
2020/21 2021/22 2022/23 2023/24 2024/25
csd/yr 0 382 764 1,145 1,526
AMP7
Unit 2020/21 2021/22 2022/23 2023/24 2024/25
Underperformance collar
AMP7 Cumulative Reduction in
risk csd/yr 0 0 0 0 0
Outperformance cap AMP7 Cumulative Reduction in
risk csd/yr 0 1,023 2,046 3,068 4,089

AMP7 performance commitments and outcome delivery incentives: definition document 69
The outperformance cap has been set at a level which would mitigate significant additional risks and
would be equivalent to managing the risk associated with a further 3 critical water treatment works,
in addition to the performance commitment.
Outcome Delivery Incentive
This measure is subject to both outperformance and underperformance payments and will be
reconciled annually on an in-year basis.
Outcome Delivery Incentive
Incentive type Incentive rate (£m/unit)
Underperformance payment -0.003617
Outperformance payment 0.003617
The incentive rate for this measure has therefore been set £3,617 per “customer service day”
change in risk from the performance commitment.
Worked examples
If we had a cumulative risk reduction by the end of 2021/22 of 482, the risk reduction would be
better than the target (382) and within the outperformance cap (1,023), and therefore an
outperformance payment would be calculated as: -
Outperformance payment = (actual performance – target) x incentive rate
= (482 – 382) x £3,617
= 100 x £3,617 = £361,700
Long-term ambition
Our 2045 ambition is to reduce the risk and the associated water service failures from water
treatment works and trunk mains to a level of risk similar to the level of drought risk, and to provide
an even level of risk across the region that we serve.
For water mains, this means having a plan for the continued supply of customers from the majority
of water mains that currently have a potential consequence of above 4,000 customers being
affected through a mains failure.
As our maturity in understanding the resilience of our asset systems and the related hazards and
risks increases, we may look to extend the scope of this measure to cover further parts of our asset
base with inherit resilience risks in future price reviews.

AMP7 performance commitments and outcome delivery incentives: definition document 70
Manchester and Pennine resilience (B09-DP)
Purpose of this measure
This performance commitment measures the progress of United Utilities in implementing the Direct
Procurement for Customers (DPC) process to support the appointment of a competitively appointed
provider (CAP) to design, build, finance and maintain the Haweswater Aqueduct Resilience
Programme (previously referred to as the ‘Manchester and Pennines Resilience’ scheme.)
Progress is measured against the satisfactory delivery of three key DPC control points. These are the
Strategic Outline Case (SOC), the Outline Business Case (OBC) and the Full Business Case (FBC).
These need to be successfully delivered to allow the scheme to progress to the point where a CAP
can be appointed.
Benefits of this measure
This performance commitment incentivises the timely and effective completion of the procurement
process to deliver a scheme to improve resilience of treated water supplies to 2.5 million people and
200,000 businesses customers in Greater Manchester, Cumbria and Lancashire.
In order for a project to proceed under DPC, Ofwat guidance requires the demonstration that the
project and delivery approach provide best value for money for customers. It is anticipated that
customers will benefit through innovation and lower whole life costs from outsourcing the delivery
of infrastructure projects using DPC.
Measure description
This measure assesses whether United Utilities has been able to utilise a “Direct Procurement for
Customers” approach to procuring a solution for the HARP programme, based on a series of target
dates.
Delivery of HARP by way of Direct Procurement for Customers (DPC) is expected to deliver financial
savings and promote innovation. Under this performance related mechanism United Utilities will
have to pay an underperformance payment for delays in procuring the HARP scheme under DPC.
Measure definition
This performance commitment is designed to generate underperformance penalties as consequence
of delays to the DPC process that are within the control of United Utilities (in this case, the
submission of the Strategic Outline Case, the Outline Business Case and the Full Business Case).
The performance commitment measures successful and timely delivery of key DPC control points;
the Strategic Outline Case submission (SOC),
the Outline Business Case submission (OBC) and
the Full Business Case submission (FBC).
The measure is reported as the number of control points delivered by the target date within each
reporting year.
Delivery Point Target Date Weights of incentive
Strategic Outline Case (SOC) 30 April 2020 33%
Outline business Case (OBC) 1 May 2022 33%
Full Business Case (FBC) 1 May 2023 33%

AMP7 performance commitments and outcome delivery incentives: definition document 71
We will only be able to claim completion of each control point following both
(a) United Utilities having provided the appropriate document by the prescribed date, and
(b) Ofwat subsequently agreeing that the submission is satisfactory.
At OBC and FBC stages, the procurement decision could recommend exit from DPC. If this were to be
the optimum output from the process, then this would still be considered a successful completion of
the control point, provided that Ofwat agrees that DPC-exit is an appropriate and a reasonable
conclusion at that control point.
In that eventuality there would not be an underperformance payment in relation to any subsequent
delivery point. The successful completion of each control point will be assessed against United
Utilities meeting the specific date set out in the additional detail, section above.
Measurement units
The performance commitment measures, are the number of control points which were due to be
delivered in that reporting year, which have been delivered on or before the target date.
The measure will be reported to no decimal places.
Mitigation/exceptions/assumptions
None.
Common performance commitment
This is a bespoke measure.
Incentive type
Financial underperformance payment only.
Price control allocation
Water resources
Water network+
Wastewater network+
Bioresources Residential retail
Business retail
Direct procurement
0% 100% 0% 0% 0% 0% 0%
Performance commitment for AMP7
As set out above the performance commitment has been aligned to the delivery of the control
points completed each year.
Deadbands, caps and collars
There are no deadbands, caps or collars associated with this measure.
Outcome Delivery Incentive
This measure is subject to underperformance payments only and will be reconciled at the end of the
AMP period.
Unit AMP7
2020/21 2021/22 2022/23 2023/24 2024/25
Control points
delivered 1 (SOC) 0 1 (OBC) 1 (FBC) 0

AMP7 performance commitments and outcome delivery incentives: definition document 72
Outperformance/underperformance incentive rate
The underperformance incentive rate is £1,914,000 for every deliverable not completed by the target
date. The underperformance payment is capped at £5.74m (2017/18, FYA, CPIH prices)
Worked examples
Deliverable not complete by target date Underperformance payment
Strategic Outline Case (SOC) £1,914,000
Outline business Case (OBC) £1,914,000
Full Business Case (FBC) £1,914,000
Long-term ambition
The initial work on this project is to determine the most cost effective approach for securing the
required additional resilience to water supplies for the Greater Manchester, Cumbria and Lancashire
areas. Irrespective of the procurement route we plan to implement this work, which will continue
into AMP8.

AMP7 performance commitments and outcome delivery incentives: definition document 73
Keeping reservoirs resilient (B10-WR)
Purpose of this measure
This performance commitment measures the reduction in risk of potential loss of life due to dam
failure at the company’s reservoir sites.
Benefits of this measure
The investment will reduce the individual and societal risks presented by reservoir failures. It will help
ensure that the company has resilient raw water supplies in the future.
Measure description
This measure assesses the reduction in risk from planned improvements at dams, which reduce the risk of individual dam failure to a tolerable level as defined by the Health and Safety Executive, as a result of our risk reduction activities. A tolerable risk will have an annual probability below 1 in 10,000 or 1 in 1,000,000 depending upon the population at risk; the probability should be as low as reasonably practicable. Proactive risk reduction will be achieved through our industry leading Portfolio Risk Assessment methodology, which assesses the probability of failure at dams on an ongoing basis.
We prioritise and deliver work to lower the risk of failure at dams, lowering the probability of their failure until the dam is no longer in either the Health and Safety Executive’s ‘unacceptable individual risk’ or ‘unacceptable societal risk’ category. Beyond this we seek to reduce the probability of risk to a level as low as reasonably practicable.
Measure definition
This measure counts the number of people11 moved to a level of tolerable risk from catastrophic
dam failure and therefore no longer exposed to ‘unacceptable individual risk’ or ‘unacceptable
societal risk’ following our risk reduction activities. The Health and Safety Executive guidance is
contained in the document ‘Reducing Risk – Protecting People (R2P2)’, Health and Safety Executive
2002, ISBN 0-7176-2151-0.
We will prioritise and deliver work which will lower the risk of the failure at dams, lowering the
probability of their failure until the dam is no longer in either the ‘unacceptable individual risk’ or
‘unacceptable societal risk’ categories.
The measure is expressed in risk reduction units and is the difference (the risk reduction benefit) between the pre-intervention risk level, and the risk level at the boundary of the “Tolerable” risk category as defined by the Health and Safety Executive. Risk is defined as:
Equivalent population exposed x probability of dam failure
The equivalent population exposed is a weighted figure which primarily ensures that unacceptable risks to individuals are prioritized, followed by unacceptable societal risks. The cumulative risk reduction achieved by each project delivered in each year will be summed, and compared to the cumulative annual target.
Measurement units
Risk reduction units, reported to 5 decimal places.
11 This is the actual number of people rather than the number of customers.

AMP7 performance commitments and outcome delivery incentives: definition document 74
Mitigation/exceptions/assumptions
International best practice relating to dam safety risk assessment may change over time. The company may adapt its processes and methodologies as new techniques and tools for assessment become available. However reduction in risk achieved by changes in the Portfolio Risk Assessment methodology or any other changes in information about the dams does not count towards the measure. Only changes that are due to the company’s physical actions can be taken into account in measuring performance.
Common performance commitment
This is a bespoke measure.
Incentive type
Financial – outperformance and underperformance payments based on performance in 2024/25
only.
Price control allocation
Water resources
Water network+
Wastewater network+
Bioresources Residential retail
Business retail
Direct procurement
100% 0% 0% 0% 0% 0% 0%
Performance commitment for AMP7
Figure 15
Unit AMP7
2020/21 2021/22 2022/23 2023/24 2024/25
Risk reduction 0.00000 0.00000 0.04439 2.99149 7.99180

AMP7 performance commitments and outcome delivery incentives: definition document 75
When setting the targets a balance was needed between delivering the maximum possible risk
reduction benefits but without compromising our ability to maintain reliable supplies given
reservoirs often need to be taken out of service during the construction phase of risk reduction
projects, and we manage this activity so that our service outages do not affect customer supplies
(multiple reservoirs cannot be taken out of service simultaneously). The performance commitment
targets represent a stretching level of risk reduction, whilst considering customer affordability and
supply security.
A target of zero has been set for the first two years of the AMP. As no transitional investment is
permitted for the water resources price control, and the design and permitting process for reservoir
safety projects regularly takes 24 months the first two years will be spent designing the risk
reduction measures, with delivery of the projects in the final years three years.
Deadbands, caps and collars
There are no deadbands, caps and collars associated with this measure.
Outcome Delivery Incentive
This measure is subject to both outperformance and underperformance financial incentives, which
will be reconciled on an in-period basis.
Outperformance/underperformance incentive rate
This measure is subject to an underperformance penalty, which has been set at £3,202,500 for each
risk unit reduced under the performance commitment. The outperformance payment has been set
at £3,202,500 for each risk unit above the performance commitment.
Worked example
Underperformance and outperformance payments are based on performance in 2024-25 only.
The performance commitment for 2024-25 is 7.99180. We outperform the performance
commitment and deliver a larger risk reduction of 9.12345.
(Actual performance-performance commitment) x outperformance incentive rate = outperformance
payment
(9.12345-7.99180) x 3,202,500 = £3,624,109 outperformance payment
Long-term ambition
Our long term ambition is to eliminate community risk exposure to ‘unacceptable individual risk’ and
‘unacceptable societal risk’. In future AMPs we will manage the programme delivery in order to
allow time for planning and regulatory approvals, and to enable us to trial innovative new
techniques prior to their deployment across the wider fleet.
Long term ambition is based on known outstanding ‘unacceptable societal risk’ dams requiring an
intervention (the population de-risked) divided approximately evenly across future AMPs, which
assumes that there is not a step change in the number of projects delivered across future AMPs.
These future performance figures are based on the remaining population who require risk
management benefits (de-risking from exposure to an unacceptable risk), based on our current view
of the risk profile at March 2018. We will repeat the Portfolio Risk Assessment every AMP, in order
to utilise evolving best practice for risk assessments, and to take account of any change in the
condition of our dams over time. These future figures therefore may be subject to change,
particularly as we complete further risk assessments.

AMP7 performance commitments and outcome delivery incentives: definition document 76
We prioritise the risk reduction interventions that we undertake, with a view to addressing the dams
with the largest population at risk first (where operational supply constraints allow). As such, we will
expect to see the population de-risked decreasing over time, as we work our way down the
prioritised list of sites for potential future interventions (i.e. fewer people exposed to risk per dam as
we work through the prioritised list).
We have assumed that, as at PR19, transitional investment for the water resources price control will
not be available for future AMPs. Reservoir risk reduction projects are subject to a comprehensive
regulatory permitting and approvals process, resulting in projects typically takes two to three years
from inception to delivery. We therefore propose targets of zero for the first two years of every
AMP.
AMP7 performance commitments and outcome delivery incentives: definition document 77
Thirlmere transfer into West Cumbria - AMP7 (B11-WN)
Purpose of this measure
This performance commitment monitors and incentivises the delivery of the Thirlmere transfer
project which will allow water to be supplied from Thirlmere reservoir to customers in West
Cumbria.
Benefits of this measure
This performance commitment protects customers from late delivery of the Thirlmere transfer
scheme. This project will allow abstraction from Ennerdale Water to cease as soon as possible,
thereby maintaining security of supply while meeting statutory environmental obligations.
Measure description
The measure tracks progress of the project through completion of project milestones as an indicator
of earned value.
Measure definition
This metric measures the percentage progress which is similar to ‘earned value’ in project
management, where completion of milestones is recognised as completing a proportion of the
baseline project value. In 2019/20 99% of the project had been delivered this measure tracks
delivery of the final 1% of the project milestones as an indicator of earned value.
The remaining milestones in 2020-2022 are:
Service reservoirs complete 0.65%
Water treatment works complete 0.65%
The 2021-22 performance commitment level (100% complete) will remain unchanged.
Measurement units
As a percentage of project completion milestones based on earned value to zero decimal places.
Mitigation/exceptions
None.
Common performance commitment
This is a bespoke measure.
Incentive type
Financial – outperformance and underperformance payments.
Price control allocation
Water resources
Water network+
Wastewater network+
Bioresources Residential
retail Business
retail Direct
procurement
0% 100% 0% 0% 0% 0% 0%

AMP7 performance commitments and outcome delivery incentives: definition document 78
Performance commitment for AMP7
Reporting Period
Description 2020/21 2021/22 2022/23 2023/24 2024/25
Annual % completion 99 100 100 100 100
Deadbands, caps and collars
The underperformance cap is set equal to the 2019-20 performance and the performance level in
2020-21 adjusted.
Reporting Period Description 2020/21 2021/22 2022/23 2023/24 2024/25
Underperformance collar
% completion 99 100 100 100 100
Outperformance cap % completion 100 100 100 100 100
Outcome delivery incentive
This measure is subject to both outperformance and underperformance financial incentives, which
will be reconciled on an in-period basis.
Outperformance/underperformance incentive rate
Incentive type Incentive rate (£m/unit)
Underperformance payment -2.34
Outperformance payment 1.17
Worked example
The final milestones are delivered in 2020/21 leading to completion of 100% of the project against a
performance commitment of 99%.
(Actual performance - performance commitment) x outperformance incentive rate =
outperformance payment
(100-99) x 1,170,000 = £1,170,000
In 2021/22 0.65% of the milestones are delivered leading to 99.35% completion of the project.
Performance is rounded to the nearest percentage which is 99% against a performance commitment
of 100%.
(Performance commitment - actual performance) x underperformance incentive rate =
underperformance payment
(100-99) x -2,340,000 = -£2,340,000
Long-term ambition
This is a one-off project that will be fully completed during AMP7.

AMP7 performance commitments and outcome delivery incentives: definition document 79
Outcome C – The natural environment is protected and improved Our customers, stakeholders and regulators expect us to improve the quality of the environment. We will deliver a programme of environmental improvements on our overflows and wastewater treatment works. Where possible, we will do this in a more sustainable way by recognising the value of natural capital. We will effectively operate and maintain our assets so that we can mitigate the impact of external factors such as climate change, population growth and changing customer behaviours and will reduce our abstraction from sensitive sites during periods of low flow.
AMP7 performance commitments and outcome delivery incentives: definition document 80
Pollution incidents (C01-WWN)
Purpose of this measure
This performance commitment is designed to incentivise companies to reduce the number of pollution
incidents that impact the environment.
Benefits of this measure
Delivery of this performance commitment will improve the quality of the environment by reducing
the number of pollution incidents that occur.
Measure description
This measure counts the total number of category 1, 2 and 3 pollution incidents from discharges, to
a controlled water, in a calendar year due to a discharge, or escapes of containment, from a
sewerage company asset per 10,000km of sewerage network.
Measure definition
This measure counts the total number of category 1-3 pollution incidents from both consented and
unconsented discharges. The methodology in year 1 of AMP7 used to identify discharges is
compliant with the Environment Agency Environmental Performance assessment (EPA)
Methodology (version 3) and the Incidents and their classification: the Common Incident
Classification Scheme (CICS) version 12. From year 2 of AMP7, the methodology will be amended to
align with the Environment Agency Environmental Performance assessment (EPA) Methodology
(version 8).
Assets included in this measure are sewers, rising mains, wastewater pumping stations, combined
sewer overflows, surface water outfalls, detention tanks, bioresources, and wastewater treatment
works. The links below are to the Environment Agency guidance material.
https://www.ofwat.gov.uk/wp-content/uploads/2017/12/WatCoPerfEPAmethodology_v3-Nov-
2017-Final.pdf
https://www.ofwat.gov.uk/wp-content/uploads/2017/12/20171129-Incidents-and-their-
classification-the-Common-Incident-Classification-Scheme-CICS-23.09.16.pdf
https://www.ofwat.gov.uk/wp-content/uploads/2021/01/EPA-methodology-version-8-October-
2020.pdf
This includes incidents highlighted by event duration monitors (EDM) and those associated with
transferred asset sewers. Incidents originating from a bioresource asset are also included.
Performance is assessed and reported on a calendar year basis in line with our reporting to the
Environment Agency, applying the EA’s Environmental Performance Assessment guidance.
AMP7
2020 2021 2022 2023 2024
Sewer length (km)
77,914 77,339 77,339 77,339 77,339

AMP7 performance commitments and outcome delivery incentives: definition document 81
The sewer length that will be applied throughout the AMP will be 77,914.00 km (as per version 3 of
the EPA) in 2020, and 77,339.00 km (as per version 9 of the EPA) in the remaining four years. The
total length of sewer includes transfer pipeline assets used by Bioresources.
Measurement units
Total number of category 1-3 pollution incidents per 10,000km of sewer network per calendar year
to two decimal places. Details of the absolute number of incidents will be detailed each year is in
our supporting commentary.
Mitigation /exceptions / assumptions
This measure excludes pollution incidents from water assets and incidents caused by third parties.
This measure does not include pollution incidents from transferred/adopted private pumping
stations or transferred/adopted private rising mains (transferred in 2016).
It is assumed that only pollution incidents from the assets set out in the description section above
are included in this measure. There is a risk that the Environment Agency may have a different view
of pollution incident classification than UUW. Should this occur, any differences between the two
positions will be documented, however regular liaison with the Environment Agency minimises this
risk.
The inclusion and classification of pollution incidents will be agreed at quarterly liaison meetings
between the EA and UU.
Significant changes in sewer length are noted in our supporting commentary. Evidence of any
exclusions will be retained by the company and be made available for supplementary audit where
necessary.
Common performance commitment
This is a common performance commitment developed by Ofwat for AMP7.
Incentive type
This measure is subject to financial outperformance and underperformance incentive payments.
Price control allocation
Water resources
Water network+
Wastewater network+
Bioresources Residential retail
Business retail
Direct procurement
0% 0% 100% 0% 0% 0% 0%
Performance commitment for AMP7
*Note – calendar year data is used for reporting in order to align with data reported to the
Environment Agency for its Environmental Performance Assessment. Each calendar year will be
reported to Ofwat in the following financial year.
Unit AMP7
2020 2021 2022 2023 2024
No. of incidents per 10,000km.
24.50 23.70 23.00 24.40 19.50

AMP7 performance commitments and outcome delivery incentives: definition document 82
The graph below highlights not only our historic performance but the performance commitments
that we have agreed to for AMP7. We have been industry leading for this measure across AMP6 and
intend to continue to strive for this level of exceptional performance throughout AMP7. We have
made significant improvements to our operational practices and incident review processes over the
past few years that have resulted in frontier or upper quartile performance in the industry for
pollution. Improving our performance will become increasingly difficult as the AMP progresses and
the targets tighten.
Figure 1 Pollution performance in AMP6 with AMP7 performance commitments, caps and collars
Figure 16
Deadbands, caps and collars
This measure has both caps and collars.
0.00
10.00
20.00
30.00
40.00
50.00
60.00
70.00
80.00
90.00
100.00
2020 2021 2022 2023 2024
Nu
mb
er o
f C
ateg
ory
1, 2
an
d 3
po
lluti
on
inci
den
ts p
er 1
0,0
00
km
of
sew
erag
e n
etw
ork
, as
rep
ort
ed t
o t
he
Envi
ron
men
t A
gen
cy
Enhanced outperformance Outperformance
Underperformance Enhanced underperformance
Performance commitment Standard underperformance collar
Standard outperformance cap Enhanced underperformance collar
Enhanced outperformance cap

AMP7 performance commitments and outcome delivery incentives: definition document 83
Outcome Delivery Incentive
This measure is subject to both outperformance and underperformance financial incentives, which
are reconciled annually on an in-period basis. There are two tiers of incentive rates to be applied to
this measure; standard and enhance performance.
Outperformance / underperformance incentive rate
The standard outperformance rate is set at £760,000 per incident / 10,000km of sewer.
The enhanced outperformance rate is set at £1,520,000 per incident / 10,000km of sewer.
The standard underperformance rate is set at £912,000 per incident / 10,000km of sewer.
The enhanced underperformance rate is set at £1,520,000 per incident / 10,000km of sewer.
Worked examples
There are three possible incentive scenarios with this measure. These are an outperformance
payment, an underperformance payment and no payment. As this measure is set up for in-period
payments, the payment is calculated at the end of each calendar year.
If the number of incidents is above the performance commitment, there would be an
underperformance payment due on the measure. Each normalised incident above the performance
commitment would result in a payment of £912,000. Should the performance exceed the forecast
for lower quartile, each normalised incident from that point is £1,5200,000.
At the end of each year, the number of normalised incidents above the performance commitment
and below lower quartile will be totalled and multiplied by £760,000 to calculate the
underperformance payment. The number of normalised incidents above lower quartile would be
totalled and multiplied by £1,520,000. The sum of these two calculations is the total
underperformance payment.
Should the number of incidents be exactly the performance commitment, this would result in no
payment.
As an example, the performance commitment for year one of AMP7 is 24.50 pollution incidents per
10,000km of sewer. Should we finish that year on 24.00 pollution incidents per 10,000km, there
would be an outperformance payment of £380,000. This is calculated as below.
Unit
AMP7 2020 2021 2022 2023 2024
Standard outperformance cap
No. of incidents per 10,000km of sewer
11.83 11.46 11.11 10.82 9.42
Enhanced outperformance cap
No. of incidents per 10,000km of sewer
0.00 0.00 0.00 0.00 0.00
Standard underperformance collar
No. of incidents per 10,000km of sewer
41.60 41.60 41.60 41.60 41.60
Enhanced underperformance collar
No. of incidents per 10,000km of sewer
98.00 98.00 98.00 98.00 98.00
AMP7 performance commitments and outcome delivery incentives: definition document 84
(Target performance – actual performance) x incentive rate
= (24.50 – 24.00) x £760,000 = £380,000 outperformance
We would not receive an additional payment for enhanced performance until our performance was
below the standard outperformance cap.
Another example is if the performance commitment for year three of AMP7 is 23.00 pollution
incidents per 10,000km of sewer. Should we finish that year on 23.85 pollution incidents per
10,000km of sewer, there would be an underperformance payment of £775,200. This is calculated as
below.
(Target performance – actual performance) x incentive rate
= (23.00 – 23.85) x £912,000 = -£775,200 underperformance
We would only apply enhanced underperformance payments when performance was above the
standard performance collar but below the enhanced underperformance collar.
Long-term ambition
Our long-term ambition is to reach zero pollution incidents. We plan to do this at an affordable rate
for customers and so propose to phase the improvements in an incremental way over a number of
Business Plan Periods.

AMP7 performance commitments and outcome delivery incentives: definition document 85
Treatment works compliance (C02-CF)
Purpose of this measure
This performance commitment is primarily designed as an indicator of environmental protection. It
also seeks to incentivise that the asset health of the non-infrastructure or above ground water and
wastewater assets are being appropriately operated, maintained and improved and that the
company is committed to both environmental and asset stewardship.
Benefits of this measure
This performance commitment helps to ensure that the appropriate levels of environmental
protection are sustained, and that the overall asset health of the above-ground water and
wastewater assets is maintained and improved.
Measure Description
This measure is a common performance commitment defined by Ofwat. It uses the same definition
of treatment works compliance as the Environment Agency’s Environmental Performance
Assessment (EPA) Methodology, version 3 (November 2017) and reports the percentage of
compliant treatment works, including both wastewater and water treatment works with discharge
permit conditions as defined in the EPA methodology (a link to this document is provided below).
Measure Definition
This measure is a common performance commitment and includes discharge permit compliance at
both water and wastewater treatment works.
Reporting of this measure is designed against the Environment Agency Environmental Performance
Assessment methodology (version 3, November 2017), percentage of water and wastewater
treatment works that are compliant.
This measure assesses the performance of:
Wastewater treatment works when treating and disposing of sewage in line with its discharge permit conditions; and
Water treatment works used for water supply in line with its discharge permit conditions.
Discharge permit compliance is reported using the percentage of compliant treatment works and not the percentage of compliant discharges. The number of discharges is agreed annually on a calendar year basis between the Environment Agency and the Environmental Regulation team.
This measure includes compliance with environmental laws including the Environmental Permitting (England & Wales) Regulations 2010. Compliance is assessed against the requirements of permits issued for water discharge activities and groundwater activities under the Environmental Permitting Regulations (2010). The measure only includes final effluent discharges from water or wastewater treatment works which are subject to the following conditions:
Sanitary parameters numeric limits
Sanitary parameters Look Up Table (LUT) numeric limits (12 months counting exceedances that have occurred in the year only)
Sanitary parameters Upper Tier (UT) numeric limits
Nutrient parameters numeric limits
Non sanitary parameters numeric limits
Urban Wastewater Treatment Directive (UWWTD) numeric parameters compliance

AMP7 performance commitments and outcome delivery incentives: definition document 86
UWWTD failure to collect or analyse required number of samples and/or parameters
UWWTD LUT parameters numeric limits
UWWTD UT parameters numeric limits
UWWTD Nutrients parameters numeric limits
Ultraviolet (UV) disinfection dose (failure to meet the annual or daily dose requirements)
Water Treatment Works (WTW) compliance with numeric parameter limits
Note: ‘sanitary parameters’ mean Biochemical Oxygen Demand (BOD), ammonia and suspended solids.
The calculation of the metric is set out below.
(A-B)/A x 100 where:
A is the total number of treatment works with an environmental permit which includes any of the above requirements (in force) that are listed on the Environment Agency register during the calendar year; and B is the number of treatment works where one or more discharges are confirmed as failing in a calendar year.
In line with the Environment Agency document Guidance on the Annual Confirmation of the number of WaSC assets for Performance Reporting the total number of treatment works shall include all wastewater numeric discharges. Water numeric discharges are included only where the volume is in excess of 20m3/d. Numeric discharge sites closed within the reporting year will be included if the permit was live during part of the year. Likewise, numeric discharges from sites opened in the reporting year will be included if the permit was live during at least part of the year.
For example
If we have a combined total of 379 water and wastewater treatment works and five of those are classified as failing at the end of the calendar year, this would equate to a position of 98.68% compliance.
(379-5)/379 x 100 = 98.68% compliant
The number of treatment works included in this measure is subject to change on an annual basis. Therefore, if we have a combined total of 370 water and wastewater treatment works and five of those are classified as failing at the end of the calendar year, this would equate to a position of 98.64% compliance.
(370-5)/370 x 100 = 98.64% compliant
Measurement units
Percentage (%) of treatment works compliant to two decimal places in a calendar year.
Mitigation /exceptions /assumptions
This measure excludes any compliance failure where we have notified the Environment Agency and
provided evidence to demonstrate that the failure is beyond our control. This includes elements
such as illegal trade discharge and instances of abnormal operating conditions or unusual weather.
Under such instances written acceptance will be obtained from the Environment Agency confirming
that the number of samples is accepted, but the result has been discounted due to these conditions.
We will be required to provide the Environment Agency with sufficient evidence to demonstrate that
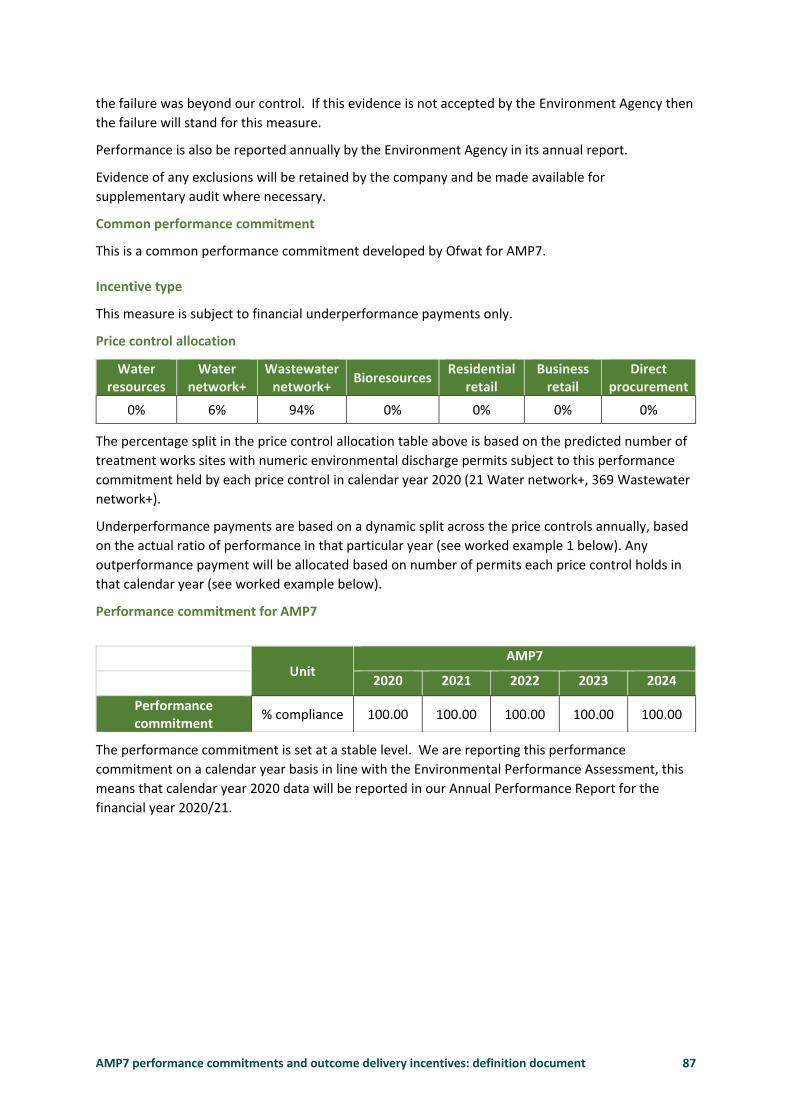
AMP7 performance commitments and outcome delivery incentives: definition document 87
the failure was beyond our control. If this evidence is not accepted by the Environment Agency then
the failure will stand for this measure.
Performance is also be reported annually by the Environment Agency in its annual report.
Evidence of any exclusions will be retained by the company and be made available for
supplementary audit where necessary.
Common performance commitment
This is a common performance commitment developed by Ofwat for AMP7.
Incentive type
This measure is subject to financial underperformance payments only.
Price control allocation
Water resources
Water network+
Wastewater network+
Bioresources Residential
retail Business
retail Direct
procurement
0% 6% 94% 0% 0% 0% 0%
The percentage split in the price control allocation table above is based on the predicted number of
treatment works sites with numeric environmental discharge permits subject to this performance
commitment held by each price control in calendar year 2020 (21 Water network+, 369 Wastewater
network+).
Underperformance payments are based on a dynamic split across the price controls annually, based
on the actual ratio of performance in that particular year (see worked example 1 below). Any
outperformance payment will be allocated based on number of permits each price control holds in
that calendar year (see worked example below).
Performance commitment for AMP7
The performance commitment is set at a stable level. We are reporting this performance
commitment on a calendar year basis in line with the Environmental Performance Assessment, this
means that calendar year 2020 data will be reported in our Annual Performance Report for the
financial year 2020/21.
Unit
AMP7
2020 2021 2022 2023 2024
Performance commitment
% compliance 100.00 100.00 100.00 100.00 100.00

AMP7 performance commitments and outcome delivery incentives: definition document 88
Figure 17
Deadbands, caps and collars
A deadband of 99.00% has been applied to this measure. Due to the nature of this measure,
performance cannot exceed 100% compliance, meaning there is a natural cap on outperformance.
Outcome Delivery Incentive
This measure is subject to underperformance financial incentives, which will be reconciled annually
on an in-period basis.
Outperformance/underperformance incentive rate
This measure applies an underperformance rate of £1,525,000 per percentage point below the
deadband.
Worked examples
Worked example 1:
In year one of AMP7, if we had five failing wastewater treatment works and one failing water
treatment works, this would equate to a total of six failing works. If the total number of treatment
works included under the measure that year was 390, this would equate to a performance level of
98.46% compliance, as this is below the deadband it would be subject to an underperformance
payment of -£823,500.
95.00
96.00
97.00
98.00
99.00
100.00
2020 2021 2022 2023 2024
Per
cen
tage
of
trea
tme
nt
wo
rks
com
plia
nt
in a
cal
end
ar
year
(%
)
Underperformance Performance commitment Underperformance deadband
Unit
AMP7 2020 2021 2022 2023 2024
Underperformance deadband
% 99.00 99.00 99.00 99.00 99.00

AMP7 performance commitments and outcome delivery incentives: definition document 89
(390-6)/390 x 100 = 98.46% compliant 99.00% - 98.46% = 0.54%
The incentive rate is £1,525,000 per 1%, therefore the underperformance payment would be -£823,500.
Long-term ambition
Our long-term ambition for this measure is that our service is 100% compliant with environmental
requirements. We plan to provide a higher level of service, which will meet tighter environmental
standards whilst reducing our operating costs to support our ambition to keep bills as low as we can.
Capital investment through our water and wastewater treatment works maintenance programmes
will be prioritised through our corporate investment prioritisation system, to capture all risks as well
as the costs of intervention. This allows us to manage risk across the business using values from
customer research to underpin the benefit of the intervention to aid prioritisation of investment.

AMP7 performance commitments and outcome delivery incentives: definition document 90
Abstraction incentive mechanism (C03-WR)
Purpose of this measure
The purpose of this performance commitment is to incentivise the company to reduce abstraction
from environmentally sensitive sites when river flows are low.
Benefits of this measure
The benefit of this performance commitment is that environmentally sensitive sites are protected by
reducing the amount of water abstracted during lower river flows.
Measure description
The abstraction incentive mechanism (AIM) reduces abstraction of water at environmentally sensitive sites when river flows are below an agreed point otherwise known as a trigger. The trigger point is based on a flow, below which the AIM is considered to be ‘switched on’. This trigger will usually be related to the point at which damage is caused and is intended to prevent this from happening or ameliorate the negative impacts.
The company has included two sites for AIM for the period 2020-25:
Old Water: This site has a baseline abstraction rate of 3.445 Ml/day and an AIM river flow trigger of 9.1 Ml/day (based on flows at the Environment Agency’s Hynam Bridge gauging station on the River Gelt). The trigger is set at Q95 (the flow which is exceeded 95% of the time) of the Environment Agency’s Hynam Bridge gauging station daily average flow data set for 28 July 1995 to 31 March 2017.
Ennerdale: This site has a baseline of abstraction rate of 24.819 Ml/day and an AIM river flow trigger of 80.0 Ml/day (based on flows at the Environment Agency’s Bleach Green gauging station on the River Ehen). The trigger is based on the upper band compensation flow release required in the impoundment licence. Abstraction from this site is expected to cease in 2022.
The abstraction incentive mechanism is defined in the reporting guidance – Guidelines on the abstraction incentive mechanism, published in 2016: https://www.ofwat.gov.uk/wp-content/uploads/2016/02/gud_pro20160226aim.pdf
Measure definition
For the period 2020 to 2025 we have reviewed our AIM sites in line with Ofwat’s guidance; this has
identified that Old Water (a tributary of the River Gelt) and Ennerdale are suitable AIM sites. This
position has been endorsed by the Environment Agency. At Ennerdale we plan to cease abstraction
in 2022 meaning that the potential for environmental impact will be removed, and it will fall out of
AIM when we revoke the abstraction licence.
In calculating our AIM performance we will follow the AIM calculation methodology set out in Ofwat’s 2016 guidance.
The AIM calculation looks back at a historic baseline period (2011-2017) and works out the average
daily abstraction rate at the AIM site during periods when AIM was triggered (i.e. when the river
flow is at or below the AIM trigger). Actual performance is compared against this historic baseline to
judge if abstraction has been reduced or not.
AIM performance in Ml = (average daily abstraction during period when flows are at or below trigger – baseline average daily abstraction during period when flows are at or below trigger) x length of period (number of days) when river flows are at or below the trigger.

AMP7 performance commitments and outcome delivery incentives: definition document 91
We will also report the additional information specified in the guidance:
1. AIM performance for individual sites
2. Overall company AIM performance
3. Cumulative overall company AIM performance for Years 2-5
4. Normalised AIM performance (no units) based on:
AIM performance (Ml) / (baseline average daily abstraction (Ml/day) x length of period when river flows are at or below the trigger (days))
5. Normalised AIM performance (%) = normalised AIM performance (no units) * 100%
6. Contextual information around AIM performance. For example, explain the environmental challenges that affect the region, the past, current and future measures we are taking to deal with unsustainable abstraction and other information relevant to put AIM performance into context
Measurement units
AIM performance measured as the number of megalitres (Ml) of water abstracted greater, or less,
than historic baseline abstraction when the AIM river flow trigger is met, reported to one decimal
place.
Mitigation/exceptions/assumptions
Exclusions are as defined in the reporting guidance.
Common performance commitment
This is a bespoke compulsory measure for AMP7.
Incentive type
Financial – outperformance and underperformance payments.
Price control allocation
Water resources
Water network+
Wastewater network+
Bioresources Residential retail
Business retail
Direct procurement
100% 0% 0% 0% 0% 0% 0%
Performance commitment for AMP7
The targets are zero for each year. This target figure means that we are not abstracting any more or
less water than the long term baseline average, in the event of AIM being triggered by low river
flows. A negative AIM performance would indicate that we had abstracted less water compared to
the long term average (in the event of AIM being triggered by low river flows) and so would attract
an outperformance payment, because we had reduced the environmental impact of our abstraction
at a time of environmental stress. A positive figure would mean that we had abstracted more water
Unit AMP7
2020/21 2021/22 2022/23 2023/24 2024/25
Performance commitment level Old Water 0.0 0.0 0.0 0.0 0.0
Performance commitment level Ennerdale 0.0 0.0

AMP7 performance commitments and outcome delivery incentives: definition document 92
than the long term average (in the event of AIM being triggered by low river flows) and so would
incur an underperformance payment, because the impact of our abstraction would have increased.
Figure 18
Deadbands, caps and collars
There are no deadbands, caps and collars associated with this measure.
Outcome Delivery Incentive
This measure is subject to both outperformance and underperformance financial incentives and will
be reconciled annually on an in-period basis.
Outperformance/underperformance incentive rate
Incentive type Incentive rate (£m/unit)
Underperformance payment – standard (Old Water) -0.00080
Underperformance payment – standard (Ennerdale) -0.00036
Outperformance payment – standard (Old Water) 0.00078
Outperformance payment – standard (Ennerdale) 0.00036
Worked examples
In calculating our AIM performance we will follow the AIM calculation methodology set out in
Ofwat’s 2016 guidance. The AIM calculation looks back at a historic period (2011-2017) and works
out the average abstraction rate at the AIM site during periods when AIM is triggered (i.e. when the
river flow is at or below the AIM trigger flow). Actual performance is then compared against the
historic period to judge if abstraction has been reduced or not. Taking Ennerdale as an example of
the calculation:

AMP7 performance commitments and outcome delivery incentives: definition document 93
The AIM trigger flow in the downstream River Ehen at the Environment Agency’s Bleach Green
gauging station is 80.0 Ml/day (this is used as it’s the upper band compensation flow release required
in the impoundment licence)
The baseline (2011-17 period) abstraction rate during AIM periods when the river flow is at or below
its AIM trigger flow is 24.8 Ml/day (rounded to 1 decimal place. This is based on our records of daily
abstracted volumes)
If, in a future year, AIM was triggered for 10 days and on these days we managed our abstraction so it
averaged 23.0 Ml/day
The resulting AIM performance (Ml) is: [(23.0-24.8) x 10 days] = -18.0 Ml i.e. over the period when
AIM applies we abstracted 18.0 Ml less water than during the baseline period
The resulting normalised AIM performance (no units) is: [-18.0/(24.8x10 days)] = -0.1
The resulting normalised AIM performance (%) is: [-18.0/(24.8x10 days)]x100% = -7.3%
The AIM performance (Ml) is used to calculate the outperformance/underperformance. For this
metric, a negative value is good, showing that abstraction is lower than the historic baseline (2011-
2017).
The worked examples assume that AIM is triggered for 5% of the time i.e. 18 days per year. 5% has
been used as the Q95 is a typical low flow statistic used in hydrology; it is the flow that is exceeded
95% of the time and hence, the river flow is lower than this for 5% of the time. The resulting
financial reward/penalty is shown to the nearest pound.
Example 1: If abstraction at Old Water reduces by 50% (i.e. from the baseline abstraction rate of
3.4 Ml/day to 1.7 Ml/day)
Outperformance payment = -[AIM performance (Ml) x £780]
= -[(1.7-3.4) x 18] x £780
= 30.6 x £780
= £23,868
Example 2: If abstraction at Old Water increases by 50% (i.e. from the baseline abstraction rate of
3.4 Ml/day to 5.1 Ml/day)
Underperformance payment = -[AIM performance (Ml) x £800]
= -[(5.1-3.4) x 18] x £800
= -30.6 x £800
= -£24,480
Example 3: If abstraction from Ennerdale reduces by 4 Ml/day (i.e. from the baseline abstraction
rate of 24.8 Ml/day to 20.8 Ml/day)
Outperformance payment = -[AIM performance (Ml) x £360]
= -[(20.8-24.8) x 18] x £360
= 72 x £360
= £25,920
Example 4: If abstraction from Ennerdale increases by 4 Ml/day (i.e. from the baseline abstraction
rate of 24.8 Ml/day to 28.8 Ml/day)

AMP7 performance commitments and outcome delivery incentives: definition document 94
Underperformance payment = -[AIM performance (Ml) * £360]
= -[(28.8-24.8) x 18] x £360
= -72 x £360
= -£25,920
Long-term ambition
The river flow that triggers AIM at Old Water is higher than in AMP6 (i.e. AIM will be triggered more
often). This is because the calculation of the AIM river flow trigger for AMP7 is based on a longer
dataset which includes the early years of AMP6 when we were managing our abstraction under AIM,
resulting in higher river flows.
The table below shows how the AIM river flow triggers have altered from AMP6 to AMP7; showing
that the AIM trigger flow at Old Water has increased meaning that AIM will be triggered more often
and so is a more stretching target.
AIM site AMP6 (2015-20) Business Plan AIM river flow trigger (Ml/d)
AMP7 (2020-25) Business Plan AIM river flow trigger (Ml/d)
Rationale for change
Old Water 8.8 Q95 of EA’s Hynam Bridge gauging station daily average
flow data set for 28 July 1995 to 22 October 2013
9.1 Q95 of EA’s Hynam Bridge gauging station daily average
flow data set for 28 July 1995 to 31 March 2017
Data set extended with more recent
data
Ennerdale 80.0 Upper band compensation flow release required in the impoundment licence
80.0 Upper band compensation flow release required in the impoundment licence
No change
In the long term, i.e. by 2040, we want to have addressed environmental concerns associated with
our abstractions through formal operational changes (e.g. changes to abstraction licences,
development of alternative sources). Where this is not cost beneficial (e.g. at Old Water on the River
Gelt), AIM provides an appropriate approach to encourage us to reduce the environmental impact of
our abstractions wherever possible. Our water resources management plan sets our strategy for
demand management, such as leakage reduction and water efficiency activities, which influence the
volume of water we need to abstract, including at AIM sites. Changes in customer demand for water
and climate change may result in new abstraction pressures being identified in the future.

AMP7 performance commitments and outcome delivery incentives: definition document 95
Improving the water environment (C04-WR)
Purpose of this measure
This performance commitment measures the progress of the company in delivering its agreed Water
Industry National Environment Programme (WINEP) water resources schemes in a timely manner.
This measure protects customers from late delivery of our environmental improvement programme
through incentives.
Benefits of this measure
This performance commitment improves the natural environment by encouraging the timely
delivery of water resources environmental improvement schemes. It will help ensure that water can
be abstracted from rivers and lakes without any negative impacts on the environment.
Measure description
This measure assesses the timely delivery of water resources schemes set out by the Environment
Agency in its Water Industry National Environment Programme.
Measure definition
In AMP6 we had a measure of ‘contribution to rivers improved – water’, this combined both delivery
of schemes in the Environment Agency’s National Environment Programme and sites abstracting
water from rivers at times of low flow, Abstraction Incentive Mechanism (AIM). In our Business Plan
for 2015-2020 our performance against this measure was translated into an equivalent length of
rivers improved in kilometres. We now consider that this was complex to calculate and difficult to
explain to customers and stakeholders. We have therefore evolved this into two separate measures
for AMP7, one which tracks the Environment Agency’s WINEP scheme delivery and a separate
Abstraction Incentive Mechanism (C03-WR) measure aligned to Ofwat’s compulsory measure.
This performance commitment measures the net number of days early that the company’s WINEP water resources schemes are delivered. The company agreed the programme of environmental improvement schemes with the Environment Agency, and these schemes are published in the Environment Agency’s WINEP, along with a planned schedule. The scope of this performance commitment is limited to schemes under the FBG (fisheries, biodiversity and groundwater) and WR (water resources) and WQ (Water Quality) functions on the WINEP with the below drivers:
Driver Description
DrWPA_INV Catchment investigations by water companies to fully characterise groundwater and surface water SgZs, undertake an options appraisal and identify and recommend measures for catchment schemes to include in the next AMP period and carry out a cost benefit/cost effectiveness analysis. Monitoring as part of the investigation to understand the issue and identify the action can be included.
DrWPA_ND Catchment scheme actions and measures recommended by either previous investigations; or, actions for water companies identified in safeguard zone action plans to prevent WQ deterioration to avoid the need for additional treatment (WFD ‘must do’): subject to cost effectiveness, sustainability and measurement of effectiveness. Some limited post-scheme appraisal can be included in the catchment management driver. Ongoing surveillance monitoring does not form part of the WINEP and falls into the company’s ongoing, business as usual operations, such as catchment monitoring for water safety plans.
EE_IMP Schemes to improve abstractions and outfalls to prevent the entrainment of fish.
HD_IMP Action is required to improve a site so as to contribute towards meeting conservation objectives of a Natura 2000 or RAMSAR site.

AMP7 performance commitments and outcome delivery incentives: definition document 96
HD_INV Investigation and/or options appraisal to determine impacts of Water Company activities, or permits or licence standards on the Natura 2000 or RAMSAR site or to determine the costs and technical feasibility of new targets.
INNS_INV Includes pathway analysis, prevention of deterioration and measures to achieve conservation objectives.
INNS_ND Schemes to prevent deterioration by reducing the risks of spread of INNS and reducing the impacts of INNS.
NERC_INV1 Undertake investigations and/or options appraisal on opportunities for priority habitat creation, restoration, species recovery or ecosystem services, so as to contribute towards biodiversity priorities and the NERC Act. This includes opportunities on water company owned landholdings or in catchments they influence and operate in when delivering landscape or catchment scale wider benefits and ecosystem services, either in isolation or in partnership.
SSSI_IMP Action is required to improve a site so as to contribute towards meeting conservation objectives of a SSSI.
WFD_IMP_WRHMWB Action to prevent deterioration of ecological potential of WR A/HMWB.
WFD_INV_FISH Investigation to confirm or not, that the reason for not achieving good fish status in a WFD water body not designated as AHMWB is related to fish passage on a water company asset.
WFD_INV_WRFlow Action to Investigate & undertake Options Appraisal for improvements to the hydrological regime to meet WFD objectives.
WFD_INV_WRHMWB Action to Investigate & undertake Options Appraisal for improvements to ecological potential of WR A/HMWB.
WFD_ND_WRHMWB Action to Investigate & undertake Options Appraisal for preventing deterioration of ecological status from flow pressures.
WFD_NDINV_WRFlow Action to Investigate & undertake Options Appraisal for preventing deterioration of ecological potential of WR A/HMWB.
WFDGW_NDINV_GWR Groundwater No deterioration investigation relating to water resource.
There are a number of schemes which fall into the above categories but are not included within this performance commitment. The ‘Specific exclusions’ section below provides details of these schemes. During each year of the 2020-25 period, we will record the actual delivery date of each included scheme compared with the scheduled delivery date set out in the WINEP to calculate the net number of days early or late for each scheme. The scheme-specific estimates will then be aggregated into a single company-wide estimate which records the net number of days early or late across all schemes combined.
There are 16 catchment schemes included within this performance commitment, and it will be possible for these schemes to be partly delivered, with certain elements being complete and other elements incomplete. In these cases, we will calculate the number of days late by multiplying the number of days that the incomplete elements are late by the proportion of overall scheme benefits represented by the incomplete elements. This calculated figure will then feed into the company-level aggregation of net days early or late, along with all other aggregation inputs.
If changes to the programme of water resources schemes are required during the 2020-25 period, we will work with the Environment Agency to agree changes to its WINEP programme through a change control process. Where such changes are formally agreed with the Environment Agency, as defined by the sign-off of an alterations form, performance against this commitment will subsequently be measured against the delivery dates agreed for the revised programme. This change control will be recorded in a separate audited document.
On completion of each scheme the company will ensure that detailed output in use packs are available for sharing with the Environment Agency to demonstrate completion of the work. For a scheme to be considered complete, the company will complete an ‘output in use’ certificate. If the scheme results in a licence change, the company will reference the licence change and include this on the Environment Agency tracker.

AMP7 performance commitments and outcome delivery incentives: definition document 97
Measurement units
This performance commitment measures the extent to which the company’s WINEP water resource
schemes have been delivered, expressed as cumulative net aggregate number of days early or late.
This will be assessed annually and reported to zero decimal places.
Mitigation/exceptions/assumptions
The following wastewater schemes fit within the aforementioned criteria for this performance commitment but are excluded because they are wastewater schemes and the measure is water resources only. Although the schemes are excluded from the ODI we still have a duty to deliver them and they are funded appropriately;
Rochdale WWTW Weir scheme
Stockport WWTW Weir scheme
Ringley Weir scheme
Common performance commitment
This is a bespoke measure.
Incentive type
Financial – underperformance payments only
Price control allocation
Water resources
Water network+
Wastewater network+
Bioresources Residential retail
Business retail
Direct procurement
100% 0% 0% 0% 0% 0% 0%
Performance commitment for AMP7
Our performance commitment requires us to deliver the projects we have agreed with the
Environment Agency on time throughout the AMP7 period.
Unit AMP7
2020/21 2021/22 2022/23 2023/24 2024/25
Net days early or late 0 0 0 0 0
Deadbands, caps and collars
There are no deadbands, caps and collars associated with this measure.
Outcome Delivery Incentive
This measure is subject to underperformance payments, which will be reconciled annually on an in-
period basis. Underperformance payments are only applicable until one year after the end of the
Business Plan Period (31st March 2026).
We will assess the number of days early or late each scheme is delivered and the cumulative view of early or late delivery will be reported annually. There may be instances where it is necessary to follow the change process with the Environment Agency during the five year period and adjust the programme of work. Agreed changes with the Environment Agency as defined by the sign off of an alterations form will update and re-baseline the schemes to be delivered in the programme.

AMP7 performance commitments and outcome delivery incentives: definition document 98
This change control will be recorded in a separate audited document. It is only late delivery of a
scheme against these amended dates which would be subject to an underperformance payment.
Any changes to schemes in or out of the programme is cost neutral.
Outperformance/underperformance incentive rate
£10,000 programme wide incentive rate, or £145 per net day late.
Incentive application
As set out in the Final Determination the ‘programme wide’ incentive rate is £0.01 (£m/day).
This programme originally included 69 schemes, therefore the incentive rate per scheme is
£0.01m/day / 69 = £0.000145m/day. (£145/scheme per day)
In the case of partial delivery of a catchment scheme the number of days late will be calculated as the number of days that the incomplete elements are late by the proportion of overall scheme benefits represented by the incomplete elements. The net days early or late of catchment schemes will be added to the net days early or late for all other schemes included in this performance commitment before being multiplied by the scheme incentive rate. Worked examples
In this example 6 schemes are delivered in the report year, which include three catchment schemes. One of the non-catchment schemes is delivered late, one of the catchment schemes is fully delivered early and two of the catchment schemes are partly delivered on time with a proportion of the schemes being delivered late. The net number of days early or late across all schemes is derived by summing the days early or late.
Scheme name
Scheme A On schedule n/a 0
Scheme B 30 days late n/a -30
Scheme C On schedule n/a 0
Scheme D 30 days early 0% 30
Scheme E 31 days late 45% -13.95
Scheme F 31 days late 66% -20.46
Net days early or late -34.41
The net number of days is rounded to the nearest whole number, in this case it is 34 days late. The underperformance payment is calculated as:
Underperformance payment = Net days late for schemes delivered in the year (to zero decimal places) x scheme level daily incentive rate
34 days x £145 day
= £4930 underperformance payment
Long-term ambition
It is assumed that by 2030 (end of AMP8) all required AMP7 WINEP environmental improvements
will have been completed and this performance commitment will no longer be required. However if
new environmental regulatory drivers are identified, then future programmes of work may be
required to address them. In addition, investigations carried out in AMP7 may lead to
implementation schemes being required in AMP8 (for example, schemes to avoid deterioration
under the Water Framework Directive). We will work with the Environment Agency to identify any
additional future needs and deliver our obligations.

AMP7 performance commitments and outcome delivery incentives: definition document 99
Appendix - Schemes included in this measure
Unique ID WINEP ID Driver code Project Name Catchment schemes
Reg Date
7UU200364 CLA00364 DrWPA_INV Mitchells AMP7 safeguard zone algae and
geosmin investigation X 31/03/2022
7UU200365 CLA00365 DrWPA_INV Rivington AMP7 safeguard zone algae
investigation X 31/03/2022
7UU200375 CLA00375 INNS_INV Water Company Activities & Recreational
Pathway Investigation and Options Appraisal X 31/03/2022
7UU200376 CLA00376 INNS_INV Raw Water Transfer Investigation and Options
Appraisal X 31/03/2022
7UU100043 CLA00527 HD_INV River Ehen Common Standards Monitoring
Guidance (CSMG) investigation1 X 31/03/2022
7UU100058 CLA00529 WFD_NDINV_WRFlow
WFD no-deterioration investigations: Investigation into impact of groundwater abstractions in the Fylde Aquifer on surface water bodies
X 31/03/2022
7UU200485 CLA00531 WFD_INV_WRHMWB
Investigation of work to improve river morphology and minimise the impact of Stocks Reservoir on the River Hodder HMWB downstream.
X 31/03/2022
7UU100050 CLA00532 WFD_NDINV_WRFlow
WFD no-deterioration investigations - SWB - impact of abstraction at Laneshaw, Corn Close boreholes and Trawden Springs on Colne Water
X 31/03/2022
7UU100047 CLA00533 WFD_INV_WRFlow
WFD no-deterioration investigations - SWB CAT3 - surface water licences (Langden/Hareden/Cowley/Dean system)2
X 31/03/2022
7UU100059 CLA00534 WFDGW_NDINV_GWR Investigation into sustainability of the Furness
aquifer X 31/03/2022
7UU300102 CLA00559 DrWPA_INV Laneshaw AMP7 safeguard zone algae and
geosmin investigation X 31/03/2022
7UU300113 CLA00570 NERC_INV1 River Calder intake fish passage (new entry on
WINEPv3) X 31/03/2022
7UU100084y GMC00001 WFD_NDINV_WRFlow
Wirral and West Cheshire Permo-Triassic Sandstone Aquifers (Groundwater abstraction and surfacewater flows)
X 31/03/2022
7UU100085 GMC00035 WFD_NDINV_WRFlow Manchester and East Cheshire Carboniferous
Aquifer Investigation3 X 31/03/2022
7UU100084j GMC00038 WFDGW_NDINV_GWR Wirral and West Cheshire Permo-Triassic
Sandstone Aquifer (Groundwater only) X 31/03/2022
7UU1000856h GMC00046 WFD_NDINV_WRFlow Northern Manchester Carboniferous Aquifer3 X 31/03/2022
7UU1000857 GMC00047 WFD_NDINV_WRFlow Lower Mersey Basin and North Merseyside
Permo-Triassic Sandstone Aquifers X 31/03/2022
7UU110092 GMC00050 WFD_INV_FISH Investigation of fish passage solution at Hug
Bridge abstraction weir, River Dane X 31/03/2022
7UU200532 GMC00083 DrWPA_INV Huntington and Sutton Hall AMP7 safeguard
zone turbidity investigation X 31/03/2022
7UU200537 GMC00088 DrWPA_INV Ashworth Moor AMP7 safeguard zone algae
investigation X 31/03/2022

AMP7 performance commitments and outcome delivery incentives: definition document 100
Unique ID WINEP ID Driver code Project Name Catchment schemes
Reg Date
7UU200542 GMC00093 DrWPA_INV Ridgegate AMP7 safeguard zone algae
investigation X 31/03/2022
7UU200545 GMC00096 DrWPA_INV Erwood and Fernilee AMP7 safeguard zone
colour investigation X 31/03/2022
7UU200546 GMC00097 DrWPA_INV Wybersley (Horse Coppice) AMP7 safeguard
zone colour investigation X 31/03/2022
7UU200547 GMC00098 DrWPA_INV Haslingden Grane AMP7 safeguard zone algae
investigation X 31/03/2022
7UU200549 GMC00100 DrWPA_INV Piethorne AMP7 safeguard zone algae
investigation X 31/03/2022
7UU200710 GMC00272 DrWPA_INV Winwick and Houghton Green bacti AMP7
safeguard zone bacti investigation X 31/03/2022
7UU200914 GMC00497 WFD_INV_WRHMWB Investigation of fish passage solution at Taxal
gauging weir X 31/03/2022
7UU200903 WMD00139 WFD_NDINV_WRFlow WFD no-deterioration investigations - GWB
CAT4 - Bearstone borehole X 31/03/2022
7UU100017 CLA00499 HD_IMP Ennerdale - revocation of abstraction licence X 16/12/2022
7UU100020 CLA00502 HD_IMP Overwater - Revocation of abstraction licence -
compensatory measures X 16/12/2022
7UU100021 CLA00504 HD_IMP Crummock - Revocation of abstraction licence -
compensatory measures X 16/12/2022
7UU100023 CLA00506 HD_IMP Chapel House - Revocation of abstraction licence
- compensatory measures X 16/12/2022
7UU200354 CLA00354 DrWPA_ND Thirlmere AMP7 safeguard zone turbidity and
colour and SSSI scheme 22/12/2024
7UU200357 CLA00357 DrWPA_ND Poaka Beck AMP7 safeguard zone pesticides and
2MIB 22/12/2024
7UU200362 CLA00362 DrWPA_ND Hodder/Stocks AMP7 safeguard zone colour 22/12/2024
7UU200363 CLA00363 DrWPA_ND Bowscar AMP7 safeguard zone nitrate 22/12/2024
7UU100026 CLA00509 HD_IMP Yearl weir improvement to geomorph and fish
passage X 22/12/2024
7UU100030 CLA00513 WFD_ND_WRHMWB
HMWB Stage 3s under investigation by UU in 2016/17: compensation flow change at Dean Clough
X 22/12/2024
7UU100039 CLA00522 WFD_ND_WRHMWB
HMWB Stage 2s still with the EA (for Stage 3 assessment by UU in 2019) - flow change at Grizedale
X 22/12/2024
7UU300103 CLA00560 DrWPA_ND Castle Carrock AMP7 safeguard zone geosmin 22/12/2024
7UU100072 GMC00020 WFD_IMP_WRHMWB HMWB Stage 3s under investigation by UU in
2016/17: compensation flow change at Clowbridge X 22/12/2024
7UU100079 GMC00027 WFD_IMP_WRHMWB Pre and post flow change monitoring at
Readycon Dean1 X 22/12/2024
7UU100080 GMC00028 WFD_IMP_WRHMWB Adaptive Management schemes under
investigation in AMP6: Castleshaw2 X 22/12/2024
7UU100082 GMC00029 WFD_IMP_WRHMWB Adaptive Management schemes under
investigation in AMP6: Fernilee2 X 22/12/2024

AMP7 performance commitments and outcome delivery incentives: definition document 101
Unique ID WINEP ID Driver code Project Name Catchment schemes
Reg Date
7UU100083 GMC00030 WFD_ND_WRHMWB Pre and post flow change monitoring at Horse
Coppice1 X 22/12/2024
7UU200711 GMC00273 DrWPA_ND Winwick and Houghton Green AMP7 safeguard
zone nitrate 22/12/2024
7UU200712 GMC00274 DrWPA_ND Delamere AMP7 safeguard zone nitrate 22/12/2024
7UU200713 GMC00275 DrWPA_ND Manley Common AMP7 safeguard zone nitrate 22/12/2024
7UU200714 GMC00276 DrWPA_ND Five Crosses AMP7 safeguard zone nitrate 22/12/2024
7UU200715 GMC00277 DrWPA_ND Rushton Spencer AMP7 safeguard zone nitrate 22/12/2024
7UU200716 GMC00280 DrWPA_ND Pocket Nook AMP7 safeguard zone solvents 22/12/2024
7UU200902 WMD00090 DrWPA_ND Bearstone AMP7 safeguard zone nitrate 22/12/2024
7UU200353 CLA00353 HD_IMP Haweswater Catchment AMP7 SSSI scheme 31/03/2025
7UU200367 CLA00367 INNS_ND INNS biosecurity e-learning package X 31/03/2025
7UU200374 CLA00374 INNS_ND Company-wide Invasive Non-native Species Plan X 31/03/2025
7UU200425 CLA00441 SSSI_IMP Bowland AMP7 SSSI scheme 31/03/2025
7UU200426 CLA00442 SSSI_IMP West Pennine Moors AMP7 SSSI scheme 31/03/2025
7UU100018 CLA00500 HD_IMP Ennerdale Water - weir removal investigation
and options appraisal X 31/03/2025
7UU200483 CLA00503 HD_IMP River Ehen Compensatory Measures - phase 1
infrastructure removal Overwater X 31/03/2025
7UU100022 CLA00505 HD_IMP River Ehen Compensatory Measures -
infrastructure removal Crummock Water X 31/03/2025
7UU100024 CLA00507 HD_IMP River Ehen Compensatory Measures -
infrastructure removal Chapel House X 31/03/2025
7UU200486 CLA00536 SSSI_IMP Blea Water - weir removal implementation X 31/03/2025
7UU200905 CLA00553 EE_IMP
River Lune at LCUS (Halton) eel screen (pump house band screen replacement with fish recovery and return system)
X 31/03/2025
7UU200906 CLA00554 EE_IMP River Lune at Caton – Eel Screening solution X 31/03/2025
7UU200907 CLA00555 EE_IMP Eel Regulations alternative measures payments
for Poaka Beck4 X 31/03/2025
CLA00576 Eel Regulations alternative measures payments
for Harlock5 X
7UU200908 CLA00556 EE_IMP Eel Regulations alternative measures payments
for Grizedale 6 X 31/03/2025
7UU110093 GMC00051 EE_IMP
Eel Regulations sites under investigation in 2016-17: River Dee: Huntington (replacement of the band screens and provision of a fish recovery system)
X 31/03/2025
7UU110094 GMC00052 EE_IMP Eel Regulations alternative measures payments
for Heronbridge X 31/03/2025
7UU200779 GMC00356 HD_IMP South Pennine SPA AMP7 SSSI scheme 31/03/2025
1 The EA are in the process of removing this scheme from the WINEP
2 The scheme was removed prior to agreement of the final WINEP

AMP7 performance commitments and outcome delivery incentives: definition document 102
3 The scheme has been formally removed from the WINEP
4 The scheme originally included Harlock but this has been added as a new separate scheme
5 The scheme was originally combined with Pocka Beck but has been separated into a new scheme by the EA
6 Originally included Rivington but this has been removed from the scope of the project by the EA

AMP7 performance commitments and outcome delivery incentives: definition document 103
Improving river water quality (C05-WWN)
Purpose of this measure
This performance commitment measures the progress of the company in delivering Water
Framework Directive river water quality enhancement schemes within its agreed Water Industry
National Environmental Programme (WINEP) in a timely manner.
Benefits of this measure
This performance commitment improves the natural environment by encouraging the timely
delivery of Water Framework Directive river water quality enhancement schemes. It should deliver
measurable environmental benefits by improving the cleanliness of local rivers and thereby support
the preservation of river ecosystems including river-based wildlife.
Measure Description
This measure is designed to track and assess the successful delivery of the Water Framework
Directive river water quality enhancement schemes within the Water Industry National Environment
Programme. Changes or alterations to the programme identified within period are discussed with
the Environment Agency and if needed are managed though a change control process.
Measure definition
In AMP6 we had a measure of ‘contribution to rivers improved – wastewater’ which assesses the
lengths of river which had been improved as a result of our programme of projects. We have
therefore evolved this for AMP7 to a measure which demonstrates to customers that our quality
enhancement programme is being delivered to the planned schedule.
This measure focuses on the delivery of Wastewater network+ schemes that have an Environment
Agency primary or secondary water quality improvement driver, WFD IMPg, WFD_IMPm,
NERC_IMP1.
This measure focuses on the Water Framework Directive as this work should deliver measurable
environmental improvements whereas the statutory programme is more likely to just maintain a
stable level of river or bathing water quality. Customers are protected because the Environment
Agency can hold us to account through the use of environmental permits for any non-delivery of the
statutory programme. Additionally, a separate Water Industry National Environment Programme
uncertainty mechanism will be used to manage costs borne by customers if there are any future
changes in the scope of the programme.
There are 96 identified schemes under the performance commitment, which are detailed below in
the table in section P. These schemes are then grouped into 16 catchments. The Final Determination
sets out a banding for the schemes within this programme, which is based on the totex value of the
schemes and designed to be used to weight the incentive applied to each scheme. These bandings
are fixed for AMP7.

AMP7 performance commitments and outcome delivery incentives: definition document 104
Band Number of
schemes Cost of schemes Ratio to apply
1 60 Below £6m 1
2 22 £6m-£10m 3
3 9 £10m-£17m 4
4 5 Greater than
£17m 11
Each banding is associated with a ratio. These ratios serve as relative weightings which are then applied to the scheme-specific delivery timeliness recordings in order to calculate a cost-weighted net delivery timeliness position for the catchment.
Once all aggregated catchment level delivery timeliness positions have been calculated within a given year, these positions are added together to determine a company-level delivery timeliness figure for that year. This is then reported once the final scheme within a catchment has been delivered.
There may be instances where it is necessary to adjust the programme of work that has been agreed
with the Environment Agency during the five year period. Any changes will be managed through a
formal change control with the Environment Agency. Where changes to the programme result in
either reductions or increases in scope this will be managed by a separate Water Industry National
Environment Programme uncertainty mechanism. During the development of our Water Industry
National Environment Programme we have worked closely with the Environment Agency to
understand its requirements and worked with them to develop an appropriate list of schemes.
Where changes to the programme are formally agreed with the Environment Agency we will track
against the revised scheme for the delivery date.
Output in use packs are available once projects are complete. These packs help us track progress and
demonstrates the completion of work to the Environment Agency.
Measurement units
This performance commitment measures the extent to which the company’s Water Framework
Directive river water quality enhancement schemes have been delivered, expressed as cumulative
net aggregate number of days early or late. This will be assessed annually and reported to zero
decimal places.
Mitigation/exceptions/ assumptions
None.
Common performance commitment
This is a bespoke measure.
Incentive type
Financial – underperformance payments only.
Price control allocation

AMP7 performance commitments and outcome delivery incentives: definition document 105
Water resources
Water network+
Wastewater network+
Bioresources Residential
retail Business
retail Direct
procurement
0% 0% 100% 0% 0% 0% 0%
Performance commitment for AMP7
Our performance commitment requires us to deliver the projects we have agreed with the
Environment Agency on time throughout the AMP7 period.
Due to the complex nature of the project being developed and the challenging nature of some of the
construction works it will be difficult to deliver the entire programme to time.
Deadbands, caps and collars
There are no deadbands, caps and collars associated with this measure.
Outcome Delivery Incentive
Delivery will be aligned to the Environment Agency regulatory date. Agreed changes with the
Environment Agency as defined by the sign off of an amendment form will update and re-baseline
the schemes to be delivered in the programme. It is only late delivery within a catchment (as defined
below) against these amended dates which would be subject to underperformance payments. If
schemes are not required or additional schemes come into the programme as agreed with the
Environment Agency they will fall under the WINEP uncertainty mechanism. This will protect
customers from changes to our programme. Any additions or removals from the programme will not
change the annual incentive rate or banding for a scheme. Additions will fall into the appropriate
banding based on the estimated capital expenditure required for scheme delivery.
Projects are deemed to be finished when our internal governance procedure for claiming outputs
has been completed (as demonstrated through the completion of an output in use certificate) and
the new environmental permit for that site has been issued by the Environment Agency and is in
force. Where alternative permit approaches are used such as catchment permits or stretch targets,
an individual site will have been delivered if enhancement requirements to achieve these alternative
permits, and an output in use certificate has been completed. Where schemes are late with no
agreement from the Environment Agency, the permit will come into force and we are at risk of
failing it without the completion of the scheme.
Outperformance/underperformance incentive rate
£14,500 programme wide incentive rate, or £151 per net day late.
Incentive application
As set out in the Final Determination the ‘programme wide’ incentive rate is £0.0145 (£m/day).
This programme has 96 schemes, each of which is weighted. The incentive rate that applies to an
‘average weighted’ scheme is therefore £0.0145m/day / 96 = £0.000151m/day. (£151/scheme per
day)
Unit
AMP7
2020/21 2021/22 2022/23 2023/24 2024/25
Performance commitment
Net position of number of days
early or late 0 0 0 0 0

AMP7 performance commitments and outcome delivery incentives: definition document 106
The incentive rate that applies to each scheme, is therefore, the average scheme specific rate,
multiplied by a weighting factor. The weighting factor is determined by: the sum of the number of
schemes (96) divided by sum of the bandings of all the schemes (220), this produces a weighting
factor of 0.436363636.
The specific incentive rate applied to any project is then the average incentive rate multiplied by the
weighting factor multiplied by the size band of the scheme. This scheme level incentive rate is then
applied, on an annual basis, by determining a weighted net days late position for all the projects
within each catchment that complete delivery in the report year.
Worked examples
Catchment A is the only catchment to deliver in the report year and has 5 schemes. In this example,
two schemes are early and one is late. The two early schemes both have a banding of 1, the late
scheme has a banding of 11. The net number of days early/late is calculated below:
Scheme name Band
Weighting
(band * weighting
factor 0.436363636)
Days early / days
late
net days early/late
(weighted (3.d.p))
Scheme A 1 0.436 180 days early 78.545
Scheme B 4 1.745 0 days early or
late 0
Scheme C 11 4.800 180 days late -864.0
Scheme D 1 0.436 365 days early 159.272
Scheme E 1 0.436 0 days early or
late 0
Net days early or late in catchment A -626.182
The net number of days is rounded to the nearest whole number, in this case it is 626 days late. The
underperformance payment is calculated as:
Underperformance payment = Net days late for aggregated catchments delivered in the year
(to zero decimal places) x scheme level daily incentive rate
-626 days x £151 = -£94,526 underperformance
Long-term ambition
The long-term target for this measure will continue to require delivery on time of all outputs as
required in our WINEP for the improvement of statutory plus driven schemes. This requirement will
no longer be applicable if all rivers in the North West, which our assets discharge into, are achieving
Water Framework Directive good ecological status and bathing waters are achieving good status or
better. This will be dependent on the cost benefit analysis and customer willingness to pay for these
improvements.

AMP7 performance commitments and outcome delivery incentives: definition document 107
It is assumed that by 2030 all required environmental improvements to achieve Water Framework
Directive and appropriate bathing waters standards will have been completed.
Schemes included in this measure
Project Name Catchment
1 Barnoldswick WwTW - AMP7 Big Ribble
2 Blackburn WwTW - WINEP Requirements - AMP7 Big Ribble
3 BUR0026 - WFD - AMP7 Big Ribble
4 BUR0036 - WFD - AMP7 Big Ribble
5 Burnley WwTW - WFD - AMP7 Big Ribble
6 Burnley WwTW - WFD - AMP7 STs Big Ribble
7 PEN0056 - WFD - AMP7 Big Ribble
8 PEN0058 - WFD - AMP7 Big Ribble
9 Wilpshire WwTW - WFD Drivers - AMP7 Big Ribble
10 Hyndburn - WFD - AMP7 (No build Soln, confirmed by engineering)
Big Ribble
11 Chipping WwTW - P driver - AMP7 Big Ribble
12 Alderley Edge WwTW - WFD & UWWTD P Removal AMP7 Bollin Upper Mersey
13 Bowden WwTW - WFD - AMP7 Bollin Upper Mersey
14 Great Warford WwTW - WFD - AMP7 Bollin Upper Mersey
15 High Legh WwTW - WFD Drivers - AMP7 Bollin Upper Mersey
16 Knutsford WwTW - WFD Drivers - AMP7 Bollin Upper Mersey
17 Macclesfield WwTW - UWWTD & WFD - AMP7 Bollin Upper Mersey
18 Mobberley WwTW - WFD - AMP7 Bollin Upper Mersey
19 Moor Pumping Station MAC0144 - WFD - AMP7 Bollin Upper Mersey
20 Wilmslow WwTW - P Removal - AMP7 Bollin Upper Mersey
21 Bury WwTW - ND - AMP7 Croal/Irwell
22 BOL0056 - WFD - AMP7 Croal/Irwell
23 BOL0073 - WFD - AMP7 Croal/Irwell
24 BOL0095 - WFD - AMP7 Croal/Irwell
25 BOL0129 - WFD - AMP7 Croal/Irwell
26 BOL0144 - WFD - AMP7 Croal/Irwell
27 BOL0153 - WFD - AMP7 Croal/Irwell
28 BOL0176 - WFD - AMP7 Croal/Irwell
29 BOL0229 - WFD - AMP7 Croal/Irwell
30 Rossendale WwTW - WFD - AMP7 Croal/Irwell
31 Rossendale WwTW Storm Tanks - WFD - AMP7 Croal/Irwell
32 Burscough WwTW - WFD Drivers - AMP7 Crossens System
33 Mere Brow WwTW - WFD - AMP7 Crossens System
34 Alsager WwTW - WFD Drivers - AMP7 Dane
35 Biddulph WwTW - WFD - AMP7 Dane
36 CON0012 King Street CSO - WFD Drivers - AMP7 Dane
37 Congleton WwTW - Ammonia - AMP7 Dane
38 Holmes Chapel WwTW Dane
39 Kidsgrove WwTW - WFD - AMP7 Dane
40 Lawton Gate WwTW - WFD - AMP7 Dane
41 Middlewich WwTW and Network - Supply Demand - AMP7 Dane

AMP7 performance commitments and outcome delivery incentives: definition document 108
Project Name Catchment
42 Sandbach WwTW - WFD - AMP7 Dane
43 'South Park Hall Road/ Stocks Lane CSO, CHR0012 Douglas
44 Chorley WwTW - WFD - AMP7 Douglas
45 Horwich Storm Tanks - WFD - AMP7 Douglas
46 Horwich WwTW - WFD - AMP7 IO BOL0060 Douglas
47 Horwich WwTW - WFD - AMP7 Douglas
48 Leyland WwTW & Leyland Network - S&D - AMP7 Douglas
49 Westhead WwTW - WFD - AMP7 Douglas
50 Glazebury WwTW - WFD - AMP7 Glaze
51 Leigh WwTW - Biodiversity - AMP7 Glaze
52 Leigh WwTW - WFD - AMP7 Glaze
53 Tyldesley WwTW - WFD - AMP7 Glaze
54 Westhoughton WwTW - WFD - AMP7 Glaze
55 WIG0207 - WFD - AMP7 Glaze
56 Worsley WwTW & Inlet - WFD - AMP7 Glaze
57 Worsley WwTW & Inlet - WFD - AMP7 STs Glaze
58 Worsley WwTW & Inlet - WFD - AMP7 IO Glaze
59 Bunbury WwTW - WFD Drivers - AMP7 Gowy
60 Duddon WwTW - WFD P Removal AMP7 Gowy
61 Helsby WwTW - Q - AMP7 Gowy
62 Tarvin WwTW - WFD P Removal AMP7 Gowy
63 Utkinton WwTW - WFD P Removal AMP7 Gowy
64 Waverton WwTW - WFD P Removal AMP7 Gowy
65 Chapel-en-le-Frith WwTW - WFD - AMP7 Goyt Etherow Tame
66 Glossop WwTW - Q and X Requirements AMP7 Goyt Etherow Tame
67 Mossley WwTW Goyt Etherow Tame
68 Mossley WwTW STs Goyt Etherow Tame
69 Saddleworth WwTW Goyt Etherow Tame
70 Whaley Bridge WwTW - Q and X Requirements - AMP7 Goyt Etherow Tame
71 Cotebrook WwTW - WFD Drivers - AMP7 Lower Weaver
72 Gawsworth WwTW - WFD Drivers - AMP7 Lower Weaver
73 Kingsley WwTW - WFD Drivers - AMP7 Lower Weaver
74 Little Budworth South WwTW - WFD Drivers - AMP7 Lower Weaver
75 Marton North WwTW - WFD - AMP7 Lower Weaver
76 Whitegate WwTW - WFD - AMP7 Lower Weaver
77 Forton WwTW - AMP7 Lune
78 Greystoke WwTW - Q - AMP7 Petteril
79 Southwaite WwTW - Q - AMP7 Petteril
80 Rochdale WwTW Roch Irk Medlock
81 Castleton WwTW - WFD - AMP7 Roch Irk Medlock
82 Castleton WwTW - WFD - AMP7 STs Roch Irk Medlock
83 Failsworth WwTW - WFD Phosphorous AMP7 Roch Irk Medlock
84 ROC0094 - WFD - AMP7 Roch Irk Medlock
85 Audlem WwTW - WFD Drivers - AMP7 Upper Weaver
86 Audley WwTW - WFD Drivers - AMP7 Upper Weaver
87 Betley WwTW - Q - AMP7 Upper Weaver

AMP7 performance commitments and outcome delivery incentives: definition document 109
Project Name Catchment
88 Buerton South WwTW - WFD Drivers - AMP7 Upper Weaver
89 Bulkeley WwTW - WFD Drivers - AMP7 Upper Weaver
90 Little Budworth North WwTW - WFD Drivers - AMP7 Upper Weaver
91 Madeley WwTW WFD P AMP7 Upper Weaver
92 Rushton WwTW - WFD P Removal AMP7 Upper Weaver
93 Tarporley WwTW - WFD P Removal AMP7 Upper Weaver
94 Wrenbury WwTW - WFD P AMP7 Upper Weaver
95 Elswick WwTW - WFD Drivers - AMP7 Wyre
96 Inskip WwTW - WFD Drivers - AMP7 Wyre
AMP7 performance commitments and outcome delivery incentives: definition document 110
Protecting the environment from growth and new development
(C06-WWN)
Purpose of this measure
This performance commitment measures the equivalent number of new customers we can serve as a
result of work completed to provide additional capacity at wastewater treatment works.
Benefits of this measure
This performance commitment ensures that the increase in demand caused by population and
economic growth can be met and that the receiving environment is protected from the impact.
Measure description
This measure reports the total additional population equivalent that we can serve as a result of work completed to increase capacity at wastewater treatment works or remove/redirect flows away from areas with a shortfall in capacity.
This is aligned to our AMP6 (2015-20) measure of ‘km of rivers protected from growth and new development’. We reported the km of river associated with the treatment works discharge that was protected from the impact of additional growth. We recognised that whilst this reflected the environmental outcome it was quite a complex measure for customers and stakeholders to understand and did not reflect the level of investment required, therefore we evolved the measure for AMP7 to assess the additional population equivalent capacity created to enable the wastewater treatment works to accommodate growth.
The population increase has a link to the scale of a project, this enables customers and stakeholders to hold our performance to account while providing protection from any underperformance.
Measure definition
This performance commitment is allocated to the wastewater network plus price control and will be
subject to outperformance and underperformance payments.
This measure reports the total additional population equivalent that will be served as a result of
investment to increase wastewater treatment works capacity or remove/redirect flows away from
areas with a shortfall in wastewater treatment capacity, thus protecting the environment from
decline. The measure reflects the level of protection we are providing at wastewater treatment
works and will be measured as a cumulative total for each year, starting at 2021.
The target is defined by the additional population equivalent forecast that will discharge to a
wastewater treatment works where capacity risk has been identified. The baseline population
equivalent is that from which the design is developed for each works. The programme of work to
meet the outcome has defined dates which, where appropriate, align with other drivers (e.g. where
we are enhancing wastewater treatment works and delivering a solution to meet an Environment
Agency requirement or carrying out maintenance) and the timing of the expected development.
The additional population equivalent is calculated on a scheme by scheme basis using a range of
data sources for example:
Local authority planning information and combined authority strategies such as Greater
Manchester spatial strategy
Planning applications and planning enquiries

AMP7 performance commitments and outcome delivery incentives: definition document 111
Knowledge from liaison with local authorities
Knowledge of future trade effluent requirements
This information is used to assess the number of properties that are to be built, the extent of the risk
and the timescale of the development for each wastewater treatment works drainage area. A
standard occupancy rate is applied in line with the Water Resources Management Plan assumptions.
Where an increase in trade effluent is forecast, a population equivalent for this trade increase is
calculated from the forecast daily Biochemical Oxygen Demand assuming 60g per population
equivalent per day. If more accurate occupancy information is available for a specific development
or location, for example a collection of proposed single occupancy dwellings, then this information
will be incorporated into the calculation where appropriate to do so.
The population equivalent forecast for individual wastewater treatment drainage areas may change
over the business plan timescale if the size of the predicted development increases or reduces. The
timescale or rate of development build may accelerate or slow down and unforeseen development
in locations where a risk was not identified may also occur. A flexible programme has been created
to accommodate these risks and enable reprioritisation of projects to meet the target. In addition to
this there is an underperformance payment mechanism if the equivalent of the full programme is
not realised or is delayed and investment is no longer required to the extent predicted and an
outperformance payment mechanism if additional needs materialise.
For efficiency, the project is only identified for inclusion in the programme if an impact occurs within
the business plan timescale. However, the solution design will incorporate all growth where there is
certainty in the planning data available and includes growth beyond the business planning timescale.
This will enable us to deliver solutions that are more resilient in the longer term. Additional drivers
(quality or maintenance) are also addressed as part of the overall project with the relevant funding
mechanism applied, which helps facilitate efficiencies.
The amount claimed is the additional population equivalent for which the wastewater treatment
works can now serve as a result of intervention. In the example below this would be 11,500
population equivalent.
Current Population
202
0 202
5
2030 -
2040 Figure 19

AMP7 performance commitments and outcome delivery incentives: definition document 112
This measure will be delivered alongside the measures to reduce sewer flooding for a more resilient
sewer network (measures G01-WWN, G02-WWN, G03-WWN, G05-WWN, G06-WWN); reducing
pollution incidents (C01); raising customer awareness to reduce the risk of flooding (G04-WWN);
enhancing natural capital value for customers (C08-CF); the investment of developer charges to
mitigate the impact of new development on the sewer network and; the internal SuDS policy to
encourage and facilitate the accommodation of surface water from new developments in a more
sustainable way. This will help prevent exceedance of sewer network and wastewater treatment
works capacity and ensure that we only invest when the need is clear.
Increases in sludge production as part of the bioresources plan have been calculated based on
forecast trade and population changes as well as from changes in wastewater treatment technology
required to deliver environmental regulatory improvements, notably phosphorus removal schemes.
These changes will be tracked through the bioresources price control. Projects at wastewater
treatment works which are co-located with sludge treatment centres will consider changes in sludge
treatment as part of solution development. We have developed guidance on this which will be used
as part of project development.
Ofwat require that the performance for this measure is externally audited to demonstrate that the
additional capacity is required by 31 March 2025.
Measurement units
Measured as the additional population equivalent capacity at the wastewater treatment works reported annually to zero decimal places.
Mitigation/exceptions/assumptions
When a trader has requested an increase in the flow or load into our network above its current
discharge permit, the impact is reviewed and in some circumstances work required to accommodate
this change is funded by the trader as it is less costly than a pre-treatment option with more
stringent trader permit limits. Such work will be delivered alongside any other projects at the
wastewater treatment works or independently depending on the need and timing of the risk from
the additional load and will not contribute to the additional population equivalent assessed for this
measure. The measure does not include interventions required on the wastewater network to
facilitate new connections as these are funded through the developer charging system. This is unless
a network solution is developed to provide additional capacity for the downstream works but there
will be collaboration with projects to accommodate growth in the networks so that the most
efficient intervention is provided for all elements of the system.
Common performance commitment
This is a bespoke measure.
Incentive type
Financial – outperformance and underperformance payments.

AMP7 performance commitments and outcome delivery incentives: definition document 113
Price control allocation
This measure is only assigned to the Wastewater Network+ price control.
Performance commitment for AMP7
Unit AMP7
2020/21 2021/22 2022/23 2023/24 2024/25
Performance commitment
Population Equivalent
(cumulative) 0 8,848 8,848 8,848 75,113
Number of projects (subject to reprioritisation)
Cumulative 0 7 7 7 21
This is aligned to our AMP6 measure km of river protected from growth and new development but
measures additional p.e. instead of kms of river associated with each project. The programme will be
delivered in the same way.
Figure 20
The graph above highlights our performance commitment for AMP7. By delivering against this
profile it should allow us to provide the extra capacity that is required to enable development to
progress. The timing of this is crucial so that we can provide the correct capacity at the right time
without compromising our environmental performance.
0
10,000
20,000
30,000
40,000
50,000
60,000
70,000
80,000
2020/21 2021/22 2022/23 2023/24 2024/25
Ad
dit
ion
al p
op
ula
tio
n e
qu
ival
ent
acco
mm
od
ated
to
p
rote
ct t
he
was
tew
ater
tre
atm
ent
wo
rks,
Underperformance Outperformance Performance commitment
Water resources
Water network+
Wastewater network+
Bioresources Residential retail
Business retail
Direct procurement
0% 0% 100% 0% 0% 0% 0%

AMP7 performance commitments and outcome delivery incentives: definition document 114
Deadbands, caps and collars
There are no deadbands, caps and collars associated with this measure.
Outcome Delivery Incentive
This measure is subject to both outperformance and underperformance financial incentives, which
will be reconciled at an end of AMP basis with an additional year for projects delayed outside the
business plan timescale. A larger project that impacts on greater current and future population holds
more risk if delayed. This will drive us to substitute equivalent sized projects (or several smaller
projects) to accommodate the population increase, if the need arises.
Where unforeseen development occurs that has an impact on our treatment capacity, we will prioritise it along with the rest of the programme. Changes to the other projects within the programme (reduction in households being built or a delay in development build) may provide scope for inclusion of the additional development without reducing performance against the target for any delivery year. If the additional population equivalent from this unforeseen development exceeds the forecast for the project delivery year, it will lead to outperformance payments.
If additional projects have lower population equivalent to be accommodated than other deferred or removed projects, it will result in underperformance payments for the delivery year from which the target is not met. An example of the outperformance and underperformance calculation is shown below.
Outperformance/underperformance incentive rate
The incentive rate is:
Valuation per 1% of river length / 1% population equivalent x allowance for totex sharing mechanism
x allowance for benefits beyond AMP7
£1,403,000 / 84,761 x 0.5 x 2 = £16.55 per population equivalent per year
We have rounded this to £17 per p.e. per year
This will be applied on a daily basis at a rate of £0.04657 per p.e. per day.
We have applied the value symmetrically to improvements and deterioration because our asset
health customer research supported both outperformance payments for beating the target for
maintaining compliance and payments for underperformance (87% support for outperformance
payments for us to beat our targets, as meeting standards was seen by customers as very
important).
The underperformance payment will apply if the full need does not materialise within the timescales
and/or we don’t provide the capacity in line with our targets.
Delivery, or outperformance, against our performance commitment will see us successfully increase
the wastewater treatment works capacity that we are providing to accommodate growth and new
development whilst ensuring we continue to protect the environment. It is essential that we are
efficient in delivering interventions to accommodate a higher population equivalent for less
investment. It will also drive our ambition to deliver additional customer benefits as part of our
service, such as green infrastructure or combined network and treatment solutions
AMP7 performance commitments and outcome delivery incentives: definition document 115
Enhancing natural capital value for customers (C08-CF)
Purpose of this measure
This performance commitment incentivises the company to use catchment approaches to deliver
water quality improvements and encourages the uptake of nature based solutions, meeting our
requirements through natural capital approaches and assets.
Benefits of this measure
This performance commitment will enhance the region’s natural capital value by promoting
solutions that have the capacity to generate ecosystem goods and services.
Measure description
This measure assesses the added natural capital value, in millions of pounds, created by delivering
investment outcomes through non-conventional approaches, as compared to delivering outcomes
through conventional approaches.
We will deliver these improvements through our integrated catchment strategy and innovative ways
of working. This supports our Catchment Systems Thinking (CaST) approach and builds on our long-
term vision of establishing a resilient systems operation approach to catchment planning and
establishing a baseline natural capital account for our operational area. We will work in
collaboration with landowners, environmental organisations, community groups and other
stakeholders to deliver enhanced environmental outcomes and add value beyond our statutory
requirements.
Measure definition
Natural Capital is defined by Defra as ‘the sum of our ecosystems, species, freshwater, land, soils,
minerals, our air and our seas’. In other words, elements of nature which produce value (e.g. timber
production, water purification, recreation and amenity etc.) and benefit people directly or indirectly.
The ecosystem service wheel below shows a typical breakdown of components which are measured
in a Natural Capital Account.

AMP7 performance commitments and outcome delivery incentives: definition document 116
For the
purposes of this performance commitment:
a non-conventional approach is defined as a solution that is not conventional but
incorporates green solutions and/or catchment solutions to deliver on regulatory
requirements and deliver added value;
a conventional solution is defined as an intervention principally consisting of the
construction of new hard engineered assets, the enhancement of existing hard engineered
assets or the augmentation of the operation of an existing hard engineered asset.
A conventional solution also includes any existing operational activity undertaken outside of a capital
scheme which has the potential to be improved to deliver added natural capital value.
We have set an independently audited and baselined level of performance based on the assumed
delivery of statutory requirements for improvements to water quality, as set out in the Environment
Agency’s Water Industry National Environment Programme (WINEP) and other performance
commitments, utilising the conventional solutions included within our PR19 business plan. This
baseline level of performance has been subject to an independent audit to determine its reliability.
The added value of individual ecosystem services is calculated using a natural capital accounting
approach with a 30-year time horizon. This adopts The Green Book12 parameters to discount future
flows of services to a “net present value” and assumes solutions will be maintained to standard for
the full time horizon. The valuations for the prioritised services are based on peer-reviewed
literature and industry recognised frameworks and will be subject to an independent third party
review in AMP7.
The value of the enhanced services will be quantified using Ciria’s independent B£ST tool in line with
an independently assured methodology. To quantify added value we will assume that the statutory
requirements are realised in both the conventional and natural capital solutions i.e. the additional
12 The Green Book - Appraisal and Evaluation in Central Government (HM Treasury, 2011)
Figure 21: Ecosystem service summary (Source: www.wwf.eu/what_we_do/biodiversity)

AMP7 performance commitments and outcome delivery incentives: definition document 117
benefits of delivering our statutory requirements using the non-conventional approach relative to
the benefits of delivering the schemes as set out within the audited baseline programme.
We will measure added natural capital value by identifying the ecosystem services that are delivered
using a non-conventional approach. We will restrict our measurement of ecosystem services to six
defined services which our customers consider to be important, as set out below.
1. Water quality
2. Flooding
3. Climate change
4. Biodiversity
5. Recreation and amenity
6. Health and wellbeing
When deciding whether to apply a conventional or nonconventional approach to deliver a particular
scheme, we will apply a standard methodology that is aligned with price review guidance and best
practice to select the solution which is the best value (for definition of best value see C08 appendix
A) and manages the risk to the environment. This methodology will include an assessment of the
whole life costs required to deliver each type of solution.
In order to protect customers in the event of outperformance, the possible outperformance
payments that can be accrued from each scheme will be capped at 10% of the totex cost of the
scheme.
The conventionality of the solution, assessment of best value option selected and claimed added
value contributing to this performance commitment, will be subject to annual independent
assurance.
The glossary of definitions, set out below in C08 Appendix A will apply for the purposes of measuring
performance.
Measurement units
Total added natural capital value generated through the use of non-conventional solutions to deliver
water quality improvement schemes (£m), measured to three decimal places.
Mitigation/exceptions
None.
Common performance commitment
This is a bespoke measure.
Incentive type
Financial – outperformance and underperformance payments.
Price control allocation
Water resources
Water network+
Wastewater network+
Bioresources Residential
retail Business
retail Direct
procurement
10% 0% 90% 0% 0% 0% 0%

AMP7 performance commitments and outcome delivery incentives: definition document 118
Performance commitment for AMP7
The performance commitment target is based upon delivering the non-conventional solutions for a
number of the schemes identified in the Water Industry National Environment Programme (WINEP),
which were embedded within our PR19 business plan. Outperformance would only be achieved if we
deliver additional non-conventional solutions and underperformance would be generated if we do
not deliver the non-conventional schemes proposed.
The profile of the performance commitment is based on the delivery dates of these schemes within
the WINEP.
Deadbands, caps and collars
Outperformance/underperformance incentive rate
The outperformance and underperformance incentive is £0.5m per £1m of added natural capital
value. The added value for any outperformance is also capped at 10% of the assumed totex
allowance for that scheme. This will ensure that the added value (multiple benefits) for customers is
always higher than the outperformance incentive.
A 50:50 split is assumed for both the capped outperformance reward with customers and
underperformance.
Outcome delivery incentive
This measure is subject to both outperformance and under performance financial incentives, which
will be reconciled annually on an in period basis.
Outperformance and underperformance incentive rate
This measure is subject to an underperformance penalty which has been set at £500k for each £1m
natural capital value under the performance commitment, and subject to £500k reward for each
£1m natural capital value added up to 10% totex of the scheme
Worked example
Worked example 1
Performance commitment in Year 1 = £0
Total scheme(s) totex= £20,000,000
Scheme cap (10%) = £2,000,000
Total added value delivered = £6,000,000 (calculated via B£ST)
Unit AMP7
2020/21 2021/22 2022/23 2023/24 2024/25
Added value £m (3dp) 0.000 1.750 0.000 0.000 2.250
Unit
AMP6 AMP7
2019/20 2020/21 2021/22 2022/23 2023/24 2024/25
Outperformance cap
Added value
£m (3dp) n/a 9.000 5.750 4.000 4.000 9.000

AMP7 performance commitments and outcome delivery incentives: definition document 119
The added value is greater than the 10% totex and so the 10% value will be utilised.
£2,000,000 -£0 = £2,000,000
£2,000,000 x 0.5 = £1,000,000 outperformance
Worked example 2
Performance commitment in Year 5 = £2,250,000
Total added value delivered in year = £1,750,000 (calculated via B£ST)
£1,750,000 -£2,250,000 = -£500,000
-£500,000 x 0.5 = -£250,000 underperformance
Long-term ambition
Our long-term ambition is that this becomes a business as usual approach and supports risk-based
decision making by considering the multiple benefits of integrated solutions. This is emphasised in
our vision to establish Catchment System Thinking (an approach to planning and service delivery),
widening the focus of catchment investment beyond statutory requirements, ensuring we and our
partners deliver more for customers, communities and the environment. Our long-term stepped
approach to achieve this is summarised in Figure 81.
Figure 22 - Our vision for the future

AMP7 performance commitments and outcome delivery incentives: definition document 120
Appendix: Natural Capital Calculator – glossary of definitions
The glossary of definitions set out in the table below, which is reproduced from the table with Annex
3 of the United Utilities PR19 final documentation - Outcomes performance commitments appendix,
will be used in measuring performance.
Key Term Definition Evidence/reference
(if applicable)
Added value
The benefits to customers and the environment
provided by ecosystem services that enhance the
natural capital beyond statutory or regulatory
requirements.
Alternative or Integrated or non-
conventional solution
A solution that is not conventional but incorporates
green solutions and / or catchment solutions to
deliver on regulatory requirements and deliver
added value
Baseline natural
capital
The current situation at the time of the investment
which also reflects future trends (including delivery
of future regulatory requirements). This allows the
estimation of costs and benefits both when the
supply (or quality) of goods and services are
increased relative to current baseline, and when a
deterioration of natural capital is halted.
NCC (2015) – The Economic Case for
Investment in Natural Capital in
England
Best value
Solutions where the whole life cost and added value (evidenced by willingness to pay) gives the greatest cost-to-benefit ratio across wholesale.
This will be assessed using cost benefit analysis
assessment.
Catchment
intervention
Catchment management options are those
which use changes in land use, larger scale
changes in activities (eg agricultural practices)
and/or larger scale natural processes to deliver
outcomes for water/wastewater services for
customers. Catchment management options can
also be used to deliver other obligations or
ambitions such as for the environment (water
quality and sustainability outcomes).
The nature of catchment management options
means that they often require partnership working
to be effective and may provide multiple benefits
through a single scheme, some of which might be
societal and intergenerational in nature.
Ofwat – Table WS18
line 3 UU PR19
submission plan

AMP7 performance commitments and outcome delivery incentives: definition document 121
Conventional
solution
An intervention to provide an outcome that is
demonstrably valued by customers, spending on
which is directed principally on the construction
of new hard engineered assets, the
enhancement of existing hard engineered assets
or the augmentation of the operation of an
existing hard engineered asset.
A conventional solution also includes any existing
operational activity undertaken outside of a capital
scheme which has the potential to be improved to
deliver added value.
Water industry
standards for water
and wastewater
treatment
Ecosystem services
Functions and products from nature that can be
turned into benefits with varying degrees of
human input. Examples include products such as
food and clean water, protection from hazards
such as regulation from floods, wildlife, and
non-material benefits such as recreational
benefits. The term "services" is usually used to
encompass the tangible and intangible benefits
that humans obtain from ecosystems, which are
sometimes separated into "goods" and
"services".
For the purpose of this performance commitment
this only includes services which customers have
shown a preference for. These are water quality,
biodiversity, climate change, flooding, health &
wellbeing and recreation & amenity.
UK National
Ecosystem
Assessment
Millennium
Ecosystem
Assessment
Ecosystems
Ecosystems are a dynamic complex of plant, animal
and micro-organism communities and their non-
living environment interacting as a functional unit.
NCC (2015) - The
Economic Case for
Investment in
Natural Capital in
England
Enhanced
ecosystems See enhancement of natural capital
Enhanced
environmental
outcomes
See enhancement of natural capital
Enhanced services See enhancement of natural capital
Enhanced value See added value

AMP7 performance commitments and outcome delivery incentives: definition document 122
Enhancement of
natural capital
Improvement of natural capital assets and the
ecosystem services they provide to some target
condition (e.g. "good" from a "moderate" WFD
status) or extent from a baseline, based on human
and economic actions.
NCC (2015) - The
Economic Case for
Investment in
Natural Capital in
England
Flexible operating
agreement
Refers to Operating Techniques Agreement
developed with reference to the planning,
permitting and compliance principles outlined by
the Environment Agency, which sets out a flexible
permitting approach to meet Water Framework
Directive objectives, via an integrated approach, of
both improved WwTW effluent quality and
catchment solutions, to deliver regulatory
requirements and added value to ecosystem
services.
Environment
Agency’s position
statements
(Catchment
Permitting (October
2018) and
Catchment Nutrient
Balancing (October
2018)
Green solutions
Nature-based technologies, systems, assets,
or interventions that provide social,
environmental and/or economic value. In this
performance commitment it refers to
physical, soft- engineered assets such as SuDS
(sustainable urban drainage solutions, "green
infrastructure") and wetlands.
SUDS manual;
guidance manual for
constructed
wetlands: updated
11/11/2015.
Holistic planning
Working in partnership with multiple stakeholders
to develop long-term aligned plans that address
risks and needs (identified through holistic risk
assessment) to deliver improvements to ecosystem
services at catchment scale.
Holistic risk
assessment
Working in partnership with multiple stakeholders
to understand and prioritise risks and needs that
deteriorate or compromise ecosystem services at
catchment scale.
Infrastructure
enhancement
Improvements made on existing infrastructure.
Refers to physical, manufactured, hard-engineered
assets.
Innovative finance
Leveraging of multiple sources of environmental
investment to improve natural capital and
deliver holistic plans. This benefits customers by
aligning water company funding to other
investors to deliver more for less.
Incorporation of ecosystems services with asset
management through natural capital valuation.

AMP7 performance commitments and outcome delivery incentives: definition document 123
Integrated
catchment
approach
This moves the water company away from a linear
model of asset versus catchment, water versus
wastewater divide, and more towards a systems
thinking model.
Investment beyond
statutory
requirements
See definition for added value
Investment
Any costs associated with delivering a scheme or
undertaking operational activities.
Operating
Technique
Agreed method for how catchments will be
operated through both improved WwTW effluent
quality and catchment solutions as part of a
flexible operating agreement
Environment
Agency’s position
statements
(Catchment
Permitting (October
2018) and
Catchment Nutrient
Balancing (October
2018)
Low technology Soft-engineered technologies (see definition for
green solutions)
Manages risk to the
environment
The company will bear the risk that if a solution
does not deliver costs savings and environmental
risk reduction that they will incur a performance
commitment penalty. The delivery risk of
environmental benefit will be managed by the
water company through, for example, Asset
Standards or EA permitting.
Multiple benefits See added value
Multiple needs See holistic risk assessment
Natural capital See natural capital assets
Natural capital
approaches See natural capital assets
Natural capital
assets
Assets provided by nature with the capacity to
generate ecosystem goods and services. The
elements of
nature that directly or indirectly produce value and
benefit to people, including species; ecological
communities (a group of actually or potentially,
interacting species living in the same place); soils;
NCC (2015) - The
Economic Case for
Investment in
Natural Capital in
England

AMP7 performance commitments and outcome delivery incentives: definition document 124
freshwaters; land; atmosphere; minerals; sub- soil
assets; oceans; coasts.
Natural Capital tools
Industry standard tools used to calculate the
natural capital value.
To measure the value of natural and social
capital created the company will use a tool
called B£ST (Benefits of SuDS Tool). The
B£ST Tool was first created in 2015 through
a project commissioned by CIRIA (the
Construction Industry Research and
Information Association – an independent,
member based, not-for-profit research
organisation). The B£ST tool was developed
through understanding the potential range
of benefits that a SuDS (sustainable
drainage system) could provide. These
benefits were then quantified as a
monetary equivalent value using a range of
potential valuation data sources and
methods.
The company will use the updated 2019 version
for the calculation of its performance
commitment.
Natural Capital
Value
See natural capital assets
Natural Capital
Value
Non-statutory
services
See added value
Non-statutory
services
Nutrient recovery
Extracting nutrients from waste streams which can
be reused rather than being lost. This will reduce
the need for generation and purchase of new
materials
Nutrient recovery
Offsetting
- Delivering elements of environmental
obligations through catchment solutions to
reduce the level of investment required through
green or conventional solutions. These may
include natural capital offsetting where one
ecosystem service is offset with a different one.
Offsetting

AMP7 performance commitments and outcome delivery incentives: definition document 125
Regulatory/statutory
requirements
Improvement and maintenance actions which the
Water Industry is required by law to
deliver/perform.
Water Industry
National
Environment
Programme (WINEP)
Statutory
requirements
(licences, net gain,
etc.)
Siloed investment
Investment which is undertaken from the view of
one stakeholder and does not consider the needs
of the broader catchment
Soft-engineered
asset solutions See green solutions
Totex Total expenditure (opex and capex) within AMP7
WINEP scheme A scheme which is named in the Water Industry
National Environment Programme
Water Industry
National
Environment
Programme (WINEP)

AMP7 performance commitments and outcome delivery incentives: definition document 126
Recycling biosolids (C09-BR)
Purpose of this measure
This performance commitment measures the compliance of the company with the ‘sludge (use in
agriculture) regulations’ as defined by the Environment Agency and the voluntary ‘Biosolids
Assurance Scheme’.
Benefits of this measure
This performance commitment protects the environment by ensuring that biosolids recycled to
agricultural land are compliant with guidelines. Biosolids applied to agricultural land provide
nutrient and soil structure.
Measure description
This measure assesses the successful disposal of treated material containing sewage sludge, known
as biosolids. All biosolids will be compliant with regulatory requirements that apply to each end use
in line with the water industry and Environment Agency agreed definition of satisfactory sludge use
and disposal. As a further requirement, biosolids that are recycled to agriculture must also conform
to the Biosolids Assurance Scheme (a voluntary scheme under the governance of WaterUK). The
scheme incorporates best practice guidance and is independently audited. The total quantity of not
compliant biosolids is divided by the total quantity of sludge which required treatment and disposal
and subtracted from a hundred percent.
Measure definition
This performance commitment is allocated to the bioresources price control and is subject to
outperformance payments and underperformance payments.
In AMP6 we had a measure for ‘satisfactory sludge disposal’ which assessed our performance
against the regulatory requirements and the Safe Sludge Matrix. For AMP7 we have evolved the
‘satisfactory sludge disposal’ in to this measure so that it aligns with the ambition of customers to
see more recycling of biosolids and our stakeholders who want recycling to agriculture to be in line
with the Biosolids Assurance Scheme.
We currently produce approximately 190,000 tonnes of dry solids of sewage sludge each year as a
result of the wastewater treatment process. Tonnes of dry solids is the industry standard
measurement for the quantity of sludge after the water content has been removed. This sludge is
treated either through chemical addition or through a digestion process, which has the benefits of
treating it to a standard that is suitable for use in agriculture and producing biogas which is used to
generate renewable energy. Approximately 100,000 tonnes of dry solids of biosolids remains after
treatment each year. This is either recycled to agriculture as a fertiliser, recycled to restoration sites
or disposed by burning it at an incineration facility with energy recovery. Recycling to agriculture is
currently the lowest cost and most sustainable use of biosolids.
This performance commitment measures how well our sludge treatment and disposal activities are
operating with respect to public health, environmental protection, statutory compliance and best
practice across the water and agricultural sectors. The measure will help to maintain the confidence
of both our regulators and stakeholders in the agricultural sector and wider food chain in the use of
biosolids as an alternative to fertiliser. Maximising this outlet and retaining it over the long term
helps to keep costs low.

AMP7 performance commitments and outcome delivery incentives: definition document 127
Since 2015, the water industry and Environment Agency have agreed a definition and calculation for
biosolids use and disposal which covers the regulatory requirements for all outlets. We have used
this definition as the basis of the measure and included the additional requirements of the Biosolids
Assurance Scheme.
The Environment Agency satisfactory sludge use and disposal definition is:
‘Compliance with the Sludge (Use in Agriculture) Regulations, Environmental Permitting Regulations
in so far as they apply to the recycling and or disposal of sewage sludge containing products and
residual wastes, and compliance with the Safe Sludge Matrix.’
The satisfactory sludge use and disposal calculation assesses the total quantity of successfully used
and disposed biosolids divided by the total quantity of sludge which required treatment and
disposal, with performance expressed as a percentage.
We have used this definition and calculation approach for this measure with an additional step to
account for the inclusion of the Biosolids Assurance Scheme. In line with the Final Determination we
will report against Environment Agency Environmental Performance Assessment (EPA) Methodology
(version 3) and Biosolids Assurance Scheme Issue 4. We will consider reporting against changes to
these requirements only where it is in customers and stakeholders best interest. To be incorporated
within the definition, any updates to these reporting requirements must firstly be endorsed by our
customer challenge group, YourVoice, and then following consultation, approved by Ofwat.
https://www.ofwat.gov.uk/wp-content/uploads/2017/12/WatCoPerfEPAmethodology_v3-Nov-
2017-Final.pdf
The scope of the scheme only applies to biosolids used on agricultural land and covers the entire end
to end process including:
confirming the nature of source materials which in turn form part of sewage sludge,
sludge treatment requirements which ensures a suitable product quality is achieved,
transport, storage and spreading of biosolids in agriculture which ensures plants receive the right amount of nutrients whilst minimising risk of pollution and disturbance to the public.
Conformance with the scheme is demonstrated through a site level audit regime, at least annually,
undertaken by an independent organisation certified by the United Kingdom Accreditation Service
(UKAS). This organisation is the sole national accreditation body recognised by the British
government to assess the competence of organisations that provide certification, testing, and
inspection and calibration services. Failure to comply with the requirements of the scheme can
result in the removal of Certified Biosolids status for a site or sites. Information on which sites have
Certified Biosolids status will be publically available on the Assured Biosolids Limited website. This
ensures transparency and builds trust with stakeholders.
We will encourage the delivery of bioresource services through third parties. Third parties can
contribute to delivering this performance commitment using existing reporting approaches for
satisfactory sludge disposal and the Biosolids Assurance Scheme.
The Environment Agency agreement for satisfactory sludge use and disposal sets out how a service
by a third party is considered. In terms of non-agricultural outlets; material will be deemed
compliant with the measure, if at the point of entry to the non-agricultural outlet, an appropriate
permit, exemption or regulatory position existed, allowing the sludge to be utilised in this manner.

AMP7 performance commitments and outcome delivery incentives: definition document 128
This measure applies the same principle for biosolids used in agriculture. Where we use other
companies to deliver this service; material will be deemed compliant with the measure, if at the
point of entry to a site, the site is identified as conforming to the Biosolids Assurance Scheme.
The measure does not constrain the development of bioresource markets as additional bioresource
material from other producers (water companies and waste producers) can be treated with sewage
sludge. This additional bioresources material will be included in the calculation and will only be
accepted for treatment and disposal if it is in the financial interest of customers.
The formula used for assessing successful biosolids use is:
(1-((A+B)/C))*100
Where:
A is the quantity of biosolids for all non-agricultural use or disposal, confirmed as not being
compliant with satisfactory sludge disposal requirements, reported in thousand tonnes of dry solids
(tTDS).
B is the quantity of biosolids used in agriculture, confirmed as not being compliant with the Biosolids
Assurance Scheme or satisfactory sludge disposal requirements, reported in thousand tonnes of dry
solids (tTDS)*.
C is the total sewage sludge produced by United Utilities Water**, reported in thousand tonnes of
dry solids (tTDS).
This is converted to a percentage by multiplying by 100.
*The worst performance against either Biosolids Assurance Scheme or satisfactory sludge disposal
requirements to agriculture is reported to avoid double counting.
** includes additional bioresources material from other producers
Worked example
Satisfactory Sludge Disposal
Biosolids Assurance Scheme
A Quantity of Biosolids for all non-agricultural use or disposal, confirmed as not being compliant with satisfactory sludge disposal requirements (tTDS)
5 These outlets are not included in the Biosolids
Assurance Scheme
B Quantity of Biosolids used in agriculture, confirmed as not being compliant with the Biosolids Assurance Scheme or satisfactory sludge disposal requirements (tTDS)
10 15
The worst performance against either Biosolids Assurance Scheme or satisfactory sludge disposal requirements to agriculture is reported to avoid double counting. Therefore B is 15tTDS.
C is the total sewage sludge produced by United Utilities Water (tTDS)
200
Using the information in the table, the formula can be populated as follows:

AMP7 performance commitments and outcome delivery incentives: definition document 129
(1-((5+15)/200))*100
(1-(20/200))*100
(1-0.1)*100
0.9*100
90.00%
Measurement units
Satisfactory sludge disposal compliance and Biosolids Assurance Scheme conformance is measured
annually in thousand tonnes of dry solid (tTDS).
For the purpose of this measure tTDS compliance is converted to a percentage and reported to two
decimal places.
Mitigation/exceptions/assumption
We have used the Environment Agency satisfactory sludge use and disposal definition and
calculation approach from 2018 for this measure. The definition includes the following notes on the
reporting requirements.
In terms of non-agricultural outlets; materials are deemed compliant with the measure, if at the
point of entry to the non-agricultural outlet, an appropriate permit, exemption or regulatory
position existed, allowing the sludge to be utilised in this manner.
Solids added during the sludge treatment process, are excluded from the reporting e.g. lime added
during the treatment process will be excluded.
Grit and screenings and water treatment sludge are excluded.
Treatment related breaches that do not result in non-compliant sludges or residual products going
to any outlets are not included.
Incineration is considered an ‘outlet’ for these purposes rather than a treatment.
The Biosolids Assurance Scheme only applies to biosolids used on agricultural land. All other outlets
are out of scope. These outlets are instead included in scope of satisfactory sludge use and disposal.
The mitigations and exceptions which apply to this measure may be reviewed to align with
subsequent revisions to reporting requirements, where it is in the best interest of customers and
stakeholders.
Common performance commitment
This is a bespoke measure.
Incentive type
This measure is subject to outperformance and underperformance payments.
Price control allocation
Water resources
Water network+
Wastewater network+
Bioresources Residential
retail Business
retail Direct
procurement
0% 0% 0% 100% 0% 0% 0%

AMP7 performance commitments and outcome delivery incentives: definition document 130
Performance commitment for AMP7
The graph below highlights our AMP7 performance commitment. We have set our performance
commitment at the highest possible level which requires us to dispose of all our biosolids in line with
the Biosolids Assurance Scheme. This will be further challenged as we will only receive
outperformance payments for multiple consecutive years of 100% compliance.
Figure 23
Deadbands, caps and collars
There are no deadbands, caps or collars for this measure.
Outcome Delivery Incentive
This measure is subject to financial outperformance and underperformance payments which will be
reconciled annually on an in-period basis.
Outperformance / underperformance rate
The incentive rate is £160,000 per % for underperformance. Outperformance can be earned as a
lump sum for any three years consecutive performance at 100% within the 2020-25 period of £1.5m.
A further £1.5m payment can be received for five years performance at 100% performance.
Worked examples
In the theoretical scenario below, we are 100% for satisfactory sludge disposal but fail the Biosolids
Assurance Scheme audit regime and produce biosolids without Certified Biosolids status across the
region for a three month period. At which point we are audited again and successfully restore
Certified Biosolids status for the remainder of the reporting period.
The formula used for assessing successful biosolids use is:
98.00
98.50
99.00
99.50
100.00
2020/21 2021/22 2022/23 2023/24 2024/25
Per
cen
tage
of
sati
sfac
tory
slu
dge
dis
po
sal
com
plia
nce
an
d B
ioso
lidsA
ssu
ran
ce S
chem
e co
nfo
rman
ce
Underperformance Performance commitment
Unit AMP7
2020/21 2021/22 2022/23 2023/24 2024/25
% 100.00 100.00 100.00 100.00 100.00

AMP7 performance commitments and outcome delivery incentives: definition document 131
(1-((A+B)/C))*100 Satisfactory Sludge Disposal
Biosolids Assurance Scheme
A Quantity of Biosolids for all non-agricultural use or disposal, confirmed as not being compliant with satisfactory sludge disposal requirements (tTDS)
Biosolids not compliant to incineration = 0
Biosolids not compliant to restoration = 0
Total = 0
These outlets are not included in the Biosolids
Assurance Scheme
B Quantity of Biosolids used in agriculture, confirmed as not being compliant with the Biosolids Assurance Scheme or satisfactory sludge disposal requirements (tTDS)
Biosolids not compliant to agriculture = 0
Total = 0
Biosolids not compliant to agriculture = 23
Total = 23
The worst performance against either Biosolids Assurance Scheme or satisfactory sludge disposal requirements to agriculture is reported to avoid double counting. Therefore B is 23tTDS.
C is the total sewage sludge produced by United Utilities Water (tTDS)
189
Therefore:
(1-((A+B)/C))*100
(1-((0+23)/189))*100
= 87.83%
The underperformance payment would therefore be 100-87.83 = 12.17*-£160,000 = -£1.947m
Long-term ambition
Our long-term ambition is to provide resilient services at the fairest cost to customers. We will do
this by maximising the use of the lowest sustainable whole life cost outlet for biosolids in order to
keep bills low for customers. Recycling biosolids is in line with customer preferences and the most
economical outlet option for 2020-25. This is expected to continue into later business plan periods.
However, the lowest whole life cost position will be reviewed at each Business Plan submission in
light of changes in drivers including; regulations, costs and innovation in the sector delivering
cheaper technologies or through recovering greater value from nutrients, metals, energy, water or
other recoverable resources all of which will influence and could change the lowest sustainable
whole life cost option.

AMP7 performance commitments and outcome delivery incentives: definition document 132
Better air quality (C10-BR)
Purpose of this measure
This performance commitment incentivises the company to meet and maintain medium combustion
directive nitrous oxide limits by 2020 and across 2020-25.
Benefits of this measure
This performance commitment improves air quality by reducing the nitrous oxide (NOx) emissions
per unit of renewable electricity generated from biosolids activities.
Measure description
This is a new measure aligned to customer ambition for us to improve air quality. It focuses on
reducing the nitrous oxide (NOx) emissions per unit of renewable electricity generated from
bioresources. Sewage sludge from wastewater treatment is treated through digestion processes to a
standard suitable for use in agriculture. This also produces biogas which is burned to generate
renewable energy in combined heat and power engines. When the fuel is burned, waste gases
including NOx are emitted. The measure includes emissions from combined heat and power engines
and sewage sludge incineration. If biogas is supplied to the national gas grid, the electricity that
could have been generated by burning it is included in the measure.
Measure definition
The UK government and local authorities within our region are committed to tackling air pollution
and improving air quality. The impact of nitrous oxides pollution in the UK leads to an estimated
23,500 premature deaths and social cost of £13.3 billion a year. Reducing air pollution is vital for
people’s health and the environment.
We currently comply with local permitting requirements relating to air quality and the Industrial
Emissions Directive for our digested sludge incinerator which requires us to reduce NOx emissions to
air. The Medium Combustion Plant Directive (MCPD) 2018, will further reduce air pollution by
introducing emission controls for combustion plants that will affect all our combined heat and power
(CHP) engines associated with anaerobic digestion. The Directive requires all plants in scope to be
registered or permitted and sets limits on the levels of pollutants that these plants can emit
according to their type, size, age, fuel type and annual operating hours. It also requires operators to
test emissions to demonstrate compliance with emission limits. The Medium Combustion Plant
Directive has been implemented in England and Wales by an amendment to the Environmental
Permitting Regulations.
We have legal obligations under the Medium Combustion Plant Directive to control our NOx
emissions, which requires a change to the combined heat and power technology or abatement to
remove it from combustion gases. We have designed a relative measure rather than an absolute
measure as this enables the Bioresources business to continue to generate more renewable energy
and associated income to keep costs low. The measure aims to reduce the amount of NOx emitted
for every unit of electricity generated.
The measure is based on tonnes of NOx emitted per GWh electricity generated from bioresources.
The scope of the measure includes:

AMP7 performance commitments and outcome delivery incentives: definition document 133
Electricity generation and NOx emissions from the treatment of sewage sludge and the co-
treatment of other organic wastes with sewage sludge from Bioresources combined heat
and power engines and incineration.
Calculated electricity generated values for biogas used in gas to grid schemes that could
otherwise have been used in combined heat and power engines.
The concentration of NOx emissions are currently measured from the gases emitted to atmosphere
by a qualified external contractor at least annually. If an asset has multiple emissions tests within a
fiscal year the average of all the test results is used in the calculation. In the event that modifications
are made to an asset with the purpose of lowering the long-term NOx emissions, a further emissions
test will be carried out upon completion of the modifications. The average NOx emissions pre and
post modifications will then be weighted by the number of days within the fiscal year applicable to
each in order to produce a representative value.
The concentration values are used to calculate the quantity of NOx that would be emitted under
reference conditions for temperature and pressure. Each combined heat and power engine will be
measured and the total tonnes of NOx emissions from each CHP engine for the year is calculated
based on the amount of generation from each engine. These are then summed to provide a regional
total of NOx emissions for the year in tonnes. The same approach is used for incineration gases
(when used by the company). The standard we use for testing the engines to quantify and report the
concentration of NOx emissions is BS EN 14792 Stationary source emissions. Determination of mass
concentration of nitrogen oxides (NOx).
Electricity generated from each CHP engine is measured. The biogas to grid is measured at the point
of injection into the grid and a calculation is used to convert the biogas into electrical energy as
though it had been used in the site CHP engines and this is added to the site total. All of the sites are
added together to give the regional total electricity generated for the year in GWh. All our
operational data relating to energy, electricity generation and biomethane production is compliant
with the international carbon reporting standard (ISO 14064, Part 1) and assured following an audit
by the Certified Emissions Measurement and Reduction Scheme (CEMARS).
We will follow our existing assurance process for reporting performance each year. NOx levels must
be verified by an independent third party engineer. All operational data relating to electricity
generation and biomethane production must be compliant with international carbon reporting
standards and assured via a CEMARS audit.
The scope of the measure is summarised in the following table:
Source Fuel NOx Electricity Generation
Combined heat and power engines
Biogas Measure concentration and convert to tonnes per year.
Total electricity generated from combined heat and power engines per year.
Biomethane Production
Biogas Considered as zero emissions as fuel is used away from the sludge treatment centre.
Biogas quantity and quality is converted to amount of electricity as though it had been used on site in a combined heat and power engine.
Incineration Sludge Measure concentration and convert to tonnes per year.
Total electricity generated from incineration per year.

AMP7 performance commitments and outcome delivery incentives: definition document 134
NOx emissions in tonnes per year is divided by the electricity generation in GWh per year to give a
value in tonnes per GWh. A three year rolling average is used to measure performance due to the
relatively small number of measurements taken.
The formula is A/B, where:
A is the total tonnes of NOx emitted per year (tonnes/year) on a rolling three year average.
B is the total renewable electricity generated per year (GWh/year) on a rolling three year
average.
Measurement units
Measured annually as a ratio based on the quantity of NOx emitted (tonnes) per unit of renewable
electricity generation (Gigawatt Hour, GWh). The measure will be reported to two decimal places.
Mitigation/exceptions/assumptions
None.
Common performance commitment
This is a bespoke measure.
Incentive type
This measure is subject to financial outperformance and underperformance incentive payments.
Price control allocation
Performance commitment for AMP7
The performance commitment is based upon achieving the legal limit set by the Medium
Combustion Plant Directive. Our business plan only includes investment to meet the Medium
Combustion Plant Directive requirements, achievement of this will not result in any incentive.
Maintaining our existing engines will only sustain current performance. Investment over and above
this requirement will be needed to lower emissions.
We can improve our NOx emissions beyond the legal requirement by funding improvements outside
our business plan. These include:
1. Installation of new control modes to existing engines so they burn more cleanly
2. Installing gas clean-up technology after the gases have been burned.
Water resources
Water network+
Wastewater network+
Bioresources Residential
retail Business
retail Direct
procurement
0% 0% 0% 100% 0% 0% 0%
Unit AMP7
2020/21 2021/22 2022/23 2023/24 2024/25
Nitrous Oxide (tonnes) per
unit of renewable electricity
generation (GWh)
1.42 1.42 1.42 1.42 1.42

AMP7 performance commitments and outcome delivery incentives: definition document 135
Performance will be assessed on a rolling three year average. The graph below highlights the
performance commitment that we have made for AMP7. This strives to consistently maintain the
lowest performance that we have ever historically achieved.
Figure 24 Deadbands, caps and collars
There are no deadbands, caps and collars associated with this measure.
Outcome Delivery Incentive
The incentive rate for underperformance and outperformance is £0.0269m.
Worked examples
The table below shows worked examples for underperformance and outperformance scenarios.
0.90
1.00
1.10
1.20
1.30
1.40
1.50
1.60
1.70
1.80
1.90
2.00
2020/21 2021/22 2022/23 2023/24 2024/25
Ton
nes
of
NO
x em
issi
on
s p
er G
Wh
ele
ctri
city
ge
ner
atio
n
Outperformance Underperformance Performance commitment
Underperformance
example
Outperformance
example
A is the total tonnes of NOx emitted per year
(tonnes/year) on a rolling three year average. 200 195
B is the total renewable electricity generated per
year (GWh/year) on a rolling three year average 125 160
A/B (NOx/GWh) 1.60 1.22
Performance Commitment (NOx/GWh) 1.42 1.42
Difference between performance commitment and
actual performance (NOx/GWh) -0.18 0.20

AMP7 performance commitments and outcome delivery incentives: definition document 136
* The 0.01 point conversion is required because the incentive rate is measured in 0.01 NOx/GWh
point values.
Long-term ambition
Our long-term ambition is to maximise energy generation and value from bioresources whilst
maintaining a low level of NOx emissions. Our target is to maintain these at the legal limit that we
are required to as part of the Medium Combustion Plant Directive and where cost beneficial reduce
air emissions lower than the legal limit to the benefit of customers.
0.01 point conversion* -18 20
Incentive Rate
(NOx per 0.01 tonnes per GWh) £26,925 £26,925
Total
(0.01 point conversion x incentive rate) -£484,650.00 £538,500.00

AMP7 performance commitments and outcome delivery incentives: definition document 137
Outcome D – You’re highly satisfied with our service and find it easy
to do business with us
We are committed to delivering the best possible service for customers. We will seek to offer customer the services that they want and value. We will actively promote support for customers in vulnerable circumstances. We will provide assurance that the quality of support for customers in vulnerable circumstances is of a leading standard by achieving and maintaining certification under a British Standards Institution accreditation for inclusive service provision.
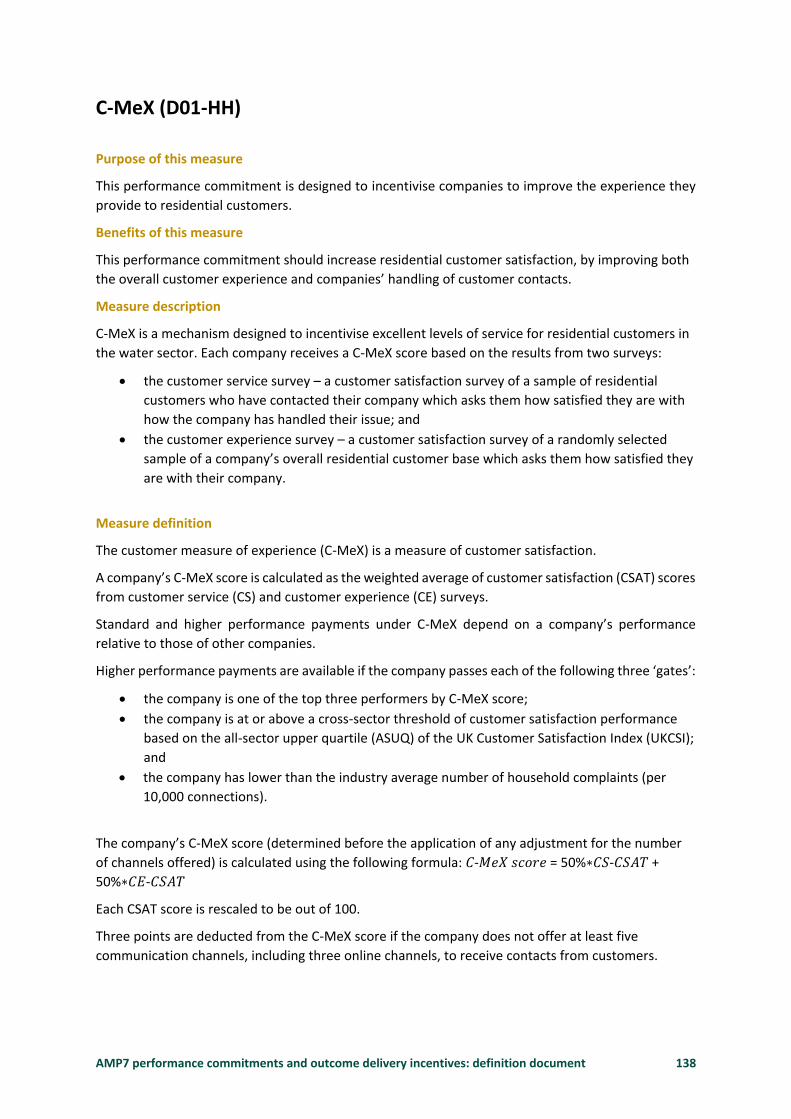
AMP7 performance commitments and outcome delivery incentives: definition document 138
C-MeX (D01-HH)
Purpose of this measure
This performance commitment is designed to incentivise companies to improve the experience they
provide to residential customers.
Benefits of this measure
This performance commitment should increase residential customer satisfaction, by improving both
the overall customer experience and companies’ handling of customer contacts.
Measure description
C-MeX is a mechanism designed to incentivise excellent levels of service for residential customers in
the water sector. Each company receives a C-MeX score based on the results from two surveys:
the customer service survey – a customer satisfaction survey of a sample of residential
customers who have contacted their company which asks them how satisfied they are with
how the company has handled their issue; and
the customer experience survey – a customer satisfaction survey of a randomly selected
sample of a company’s overall residential customer base which asks them how satisfied they
are with their company.
Measure definition
The customer measure of experience (C-MeX) is a measure of customer satisfaction.
A company’s C-MeX score is calculated as the weighted average of customer satisfaction (CSAT) scores
from customer service (CS) and customer experience (CE) surveys.
Standard and higher performance payments under C-MeX depend on a company’s performance
relative to those of other companies.
Higher performance payments are available if the company passes each of the following three ‘gates’:
the company is one of the top three performers by C-MeX score;
the company is at or above a cross-sector threshold of customer satisfaction performance
based on the all-sector upper quartile (ASUQ) of the UK Customer Satisfaction Index (UKCSI);
and
the company has lower than the industry average number of household complaints (per
10,000 connections).
The company’s C-MeX score (determined before the application of any adjustment for the number
of channels offered) is calculated using the following formula: 𝐶-𝑀𝑒𝑋 𝑠𝑐𝑜𝑟𝑒 = 50%∗𝐶𝑆-𝐶𝑆𝐴𝑇 +
50%∗𝐶𝐸-𝐶𝑆𝐴𝑇
Each CSAT score is rescaled to be out of 100.
Three points are deducted from the C-MeX score if the company does not offer at least five
communication channels, including three online channels, to receive contacts from customers.

AMP7 performance commitments and outcome delivery incentives: definition document 139
Standard payments
The company’s C-MeX incentive rate (determined before the application of any higher performance payment for passing the three gates) depends on its C-MeX score relative to those of other companies. Specifically, it depends on the company’s score relative to the median company’s score and either the highest or lowest performing company’s score. This is demonstrated as follows:
𝑖𝑓 𝑠𝑐𝑜𝑟𝑒>𝑚𝑒𝑑𝑖𝑎𝑛∶ (𝑠𝑐𝑜𝑟𝑒−𝑚𝑒𝑑𝑖𝑎𝑛)∗(6%/(𝑚𝑎𝑥𝑖𝑚𝑢𝑚−𝑚𝑒𝑑𝑖𝑎𝑛))
𝑖𝑓 𝑠𝑐𝑜𝑟𝑒<𝑚𝑒𝑑𝑖𝑎𝑛∶ (𝑠𝑐𝑜𝑟𝑒−𝑚𝑒𝑑𝑖𝑎𝑛)∗(12%/(𝑚𝑒𝑑𝑖𝑎𝑛−𝑚𝑖𝑛𝑖𝑚𝑢𝑚))
𝑖𝑓 𝑠𝑐𝑜𝑟𝑒=𝑚𝑒𝑑𝑖𝑎𝑛∶ 0% where:
‘score’ is the company’s C-MeX score in the reporting year;
‘median’ is the median score of all companies’ C-MeX scores in the reporting year;
‘maximum’ is the highest score achieved by a company in the reporting year; and
‘minimum’ is the lowest score achieved by a company in the reporting year.
Higher performance payments
Up to three companies could receive higher performance payments. The company with the highest
score that passes the three gates receives an additional 6% of that year’s annual allowed residential
retail revenue, potentially taking its total outperformance payments to 12%. If a second company
qualifies, it will receive an additional 4% and if a third company qualifies it will receive an additional
2%. For the avoidance of doubt, if only one company passes the three gates it will receive an
additional 6% regardless of whether it is has the highest C-MeX score across all companies.
The ‘C-MeX ASUQ’ threshold referred to in the three gates for higher rewards, above, is calculated
using the following formula:
𝐶-𝑀𝑒𝑋 𝐴𝑆𝑈𝑄 = 𝐶-𝑀𝑒𝑋 𝑀𝑒𝑎𝑛 + (𝑈𝐾𝐶𝑆𝐼 𝐴𝑆𝑈𝑄 − 𝑈𝐾𝐶𝑆𝐼 𝑀𝑒𝑎𝑛) / 𝑈𝐾𝐶𝑆𝐼 𝑆𝐷 ∗ 𝐶-𝑀𝑒𝑋 𝑆𝐷
where:
‘C-MeX Mean’ is the mean average of all water companies’ C-MeX scores;
‘UKCSI ASUQ’ is the upper quartile of the CSI scores of all companies in the UKCSI report
relating to the relevant year (e.g. for C-MeX in 2020/21, the UKCSI ASUQ would be based on
data from the July 2021 UKCSI surveys);
‘UKCSI Mean’ is the mean average score of water companies in the UKCSI report relating to
the relevant year;
‘UKCSI SD’ is the standard deviation of water companies’ scores in the UKCSI report relating
to the relevant year; and
‘C-MeX SD’ is the standard deviation of the C-MeX scores of all water companies.
The underlying methodology for the UKCSI may change during the 2020-25 period. Ofwat will
continue to use future iterations of the UKCSI upper quartile, mean and standard deviation for the
purposes of C-MeX. However, if the UKCSI methodology moves away from a league table approach
such that Ofwat cannot quantify an upper quartile or no longer has a sufficient number of water
companies in its sample, Ofwat will use the last appropriate UKCSI results instead in companies’ in-
period determinations.
Links to relevant external documents: ‘PR19 final determinations – Customer measure of experience
(C-MeX) and developer services measure of experience (DMeX) policy appendix 3’
https://www.ccwater.org.uk/ https://www.instituteofcustomerservice.com/

AMP7 performance commitments and outcome delivery incentives: definition document 140
Measurement units
Score out of 100 to two decimal places.
Mitigation /exceptions / assumptions
None.
Common performance commitment
This is a common performance commitment developed by Ofwat for AMP7.
Incentive type
Financial – Outperformance and underperformance payments.
Price control allocation
Water resources
Water network+
Wastewater network+
Bioresources Residential retail
Business retail
Direct procurement
0% 0% 0% 0% 100% 0% 0%
Performance commitment for AMP7
C-MeX is based upon relative performance between companies.
Outcome Delivery Incentive
C-MeX payments are calculated by multiplying the incentive rate by the company’s annual allowed
residential retail revenue (as described in the United Utilities PR19 final determination ‘Allowed
revenue appendix’ or as updated following any interim determinations or in-period ODI adjustments
in the 2020-25 period).
Outperformance/underperformance incentive rate
The underperformance rates are shown in the table below.
Long-term ambition
Our long-term ambition is to deliver the highest possible level of customer services at the lowest
cost in order to achieve the highest reward possible. We will continue to look at ways to reduce
complaints and improve service.
Incentive type Incentive rate (% of annual actual developer services revenue)
Underperformance payment – standard rate if company’s score < median score
(𝑠𝑐𝑜𝑟𝑒 − 𝑚𝑒𝑑𝑖𝑎𝑛) ∗ (12%/(𝑚𝑒𝑑𝑖𝑎𝑛 − 𝑚𝑖𝑛𝑖𝑚𝑢𝑚))
Deadband If company’s score = median score
O%
Outperformance payment – standard rate if company’s score > median score
(𝑠𝑐𝑜𝑟𝑒 − 𝑚𝑒𝑑𝑖𝑎𝑛) ∗ (6%/(𝑚𝑎𝑥𝑖𝑚𝑢𝑚 − 𝑚𝑒𝑑𝑖𝑎𝑛))
Outperformance payment – higher rate (Applies if meeting the three gates for highest payments and additional to standard incentive rates)
+6% if the company has the highest C-MeX score of companies passing the three gates

AMP7 performance commitments and outcome delivery incentives: definition document 141
D-MeX (D02-CF)
Purpose of this measure
This performance commitment is designed to incentivise companies to improve the experience they
provide to developer services (new connections) customers, including property developers, self-lay
providers and those with new appointments and variations (NAVs).
Benefits of this measure
This performance commitment should increase developer customer satisfaction, by improving the
overall customer experience for all developer services customers.
Measure description
D-MeX is a measure of customer satisfaction. A company’s overall D-MeX score is calculated from
two components that contribute equally:
• Qualitative D-MeX score, based on the ratings provided by developer services customers
who transacted with the company throughout the reporting year to a customer
satisfaction survey; and
• Quantitative D-MeX score, based on the company’s performance against a set of selected
Water UK performance metrics throughout the reporting year.
The survey results which are used to calculate the qualitative component of the company’s D-MeX
score will be supplied by a survey agent appointed by Ofwat. This is supplied out of 100 to form the
score for the qualitative component of D-MeX.
The set of Water UK performance metrics which are used to calculate the quantitative component of
the company’s D-MeX score, in place at the time of PR19 final determinations publication, are set
out in annex 2 of ‘PR19 final determinations: Customer measure of experience (C-MeX) and
developer services measure of experience (D-MeX) policy appendix’. For each metric, a percentage is
reported and a simple average of these metrics is taken. This is rescaled to be out of 100 to form the
score for the quantitative component of D-MeX.
Measure definition
The company’s D-MeX score is calculated using the following formula:
𝐷-𝑀𝑒𝑋 𝑠𝑐𝑜𝑟𝑒 = 50% ∗ 𝑄𝑢𝑎𝑙 + 50% ∗ 𝑄𝑢𝑎nt
where:
‘Qual’ is a simple average of satisfaction scores given by developer customers surveyed in the developer
customer satisfaction survey in the reporting year; and
‘Quant’ is a simple average of the selected Water UK performance metrics which have non-zero
volumes in the reporting year.
The company’s D-MeX incentive rate depends on its D-MeX score relative to those of other companies.
Specifically, it depends on the company’s score relative to the median company’s score and either the
highest or lowest performing company’s score. This is demonstrated as follows:
𝑖𝑓 𝑠𝑐𝑜𝑟𝑒 > 𝑚𝑒𝑑𝑖𝑎𝑛 ∶ (𝑠𝑐𝑜𝑟𝑒 − 𝑚𝑒𝑑𝑖𝑎𝑛) ∗ (6%/(𝑚𝑎𝑥𝑖𝑚𝑢𝑚 − 𝑚𝑒𝑑𝑖𝑎𝑛))
𝑖𝑓 𝑠𝑐𝑜𝑟𝑒 < 𝑚𝑒𝑑𝑖𝑎𝑛 ∶ (𝑠𝑐𝑜𝑟𝑒 − 𝑚𝑒𝑑𝑖𝑎𝑛) ∗ (12%/(𝑚𝑒𝑑𝑖𝑎𝑛 − 𝑚𝑖𝑛𝑖𝑚𝑢𝑚))
𝑖𝑓 𝑠𝑐𝑜𝑟𝑒 = 𝑚𝑒𝑑𝑖𝑎𝑛 ∶ 0%

AMP7 performance commitments and outcome delivery incentives: definition document 142
where:
• ‘score’ is the company’s D-MeX score in the reporting year;
• ‘median’ is the median score of all companies’ D-MeX scores in the reporting year;
• ‘maximum’ is the highest score achieved by a company in the reporting year; and
• ‘minimum’ is the lowest score achieved by a company in the reporting year.
Measurement units
Score out of 100 to two decimal places.
Mitigation/exceptions/assumptions
None.
Common performance commitment
This is a common performance commitment developed by Ofwat for AMP7.
Incentive type
Financial – Outperformance and underperformance payments.
Price control allocation
The allocation between the Water network plus and wastewater network plus both controls will vary
each reporting year based on the relative outturn developer services revenues collected by the
company for water and wastewater services.
Performance commitment for AMP7
D-MeX is based upon relative performance between companies.
Outcome Delivery Incentive
D-MeX payments are calculated by multiplying the incentive rate by the company’s annual actual
developer services revenue as reported for the following components (for each of water and
wastewater):
connection charges;
infrastructure charge receipts – new connections;
requisitioned mains;
requisitioned sewers;
diversions; and
other contributions (price control).
The Water UK metrics that form the basis of the quantitative component of D-MeX may change in the
2020-25 period. The Water UK metrics that contribute to the qualitative survey may change as well.
Water resources
Water network+
Wastewater network+
Bioresources Residential
retail Business
retail Direct
procurement
0% Variable % Variable % 0% 0% 0% 0%

AMP7 performance commitments and outcome delivery incentives: definition document 143
In determining whether to make changes to D-MeX as a performance commitment in light of
changes to the Water UK metrics, Ofwat’s decision will be based on the principles that revisions are
in customer interests, support consistent and fair comparisons between companies and align with
their wider duties. They will consult with stakeholders prior to making any changes.
Outperformance/underperformance incentive rate
The underperformance rates are shown in the table below.
Long-term ambition
Our long-term ambition is to deliver the best possible service to developer services customers,
increasing Developer Services customers’ satisfaction in all aspects of the service we are providing to
them.
Incentive type Incentive rate
(% of annual actual developer services revenue)
Underperformance payment – standard rate if company’s score < median score
(𝑠𝑐𝑜𝑟𝑒 − 𝑚𝑒𝑑𝑖𝑎𝑛) ∗ (12%/(𝑚𝑒𝑑𝑖𝑎𝑛 − 𝑚𝑖𝑛𝑖𝑚𝑢𝑚))
Deadband If company’s score = median score
O%
Outperformance payment – standard rate if company’s score > median score
(𝑠𝑐𝑜𝑟𝑒 − 𝑚𝑒𝑑𝑖𝑎𝑛) ∗ (6%/(𝑚𝑎𝑥𝑖𝑚𝑢𝑚 − 𝑚𝑒𝑑𝑖𝑎𝑛))
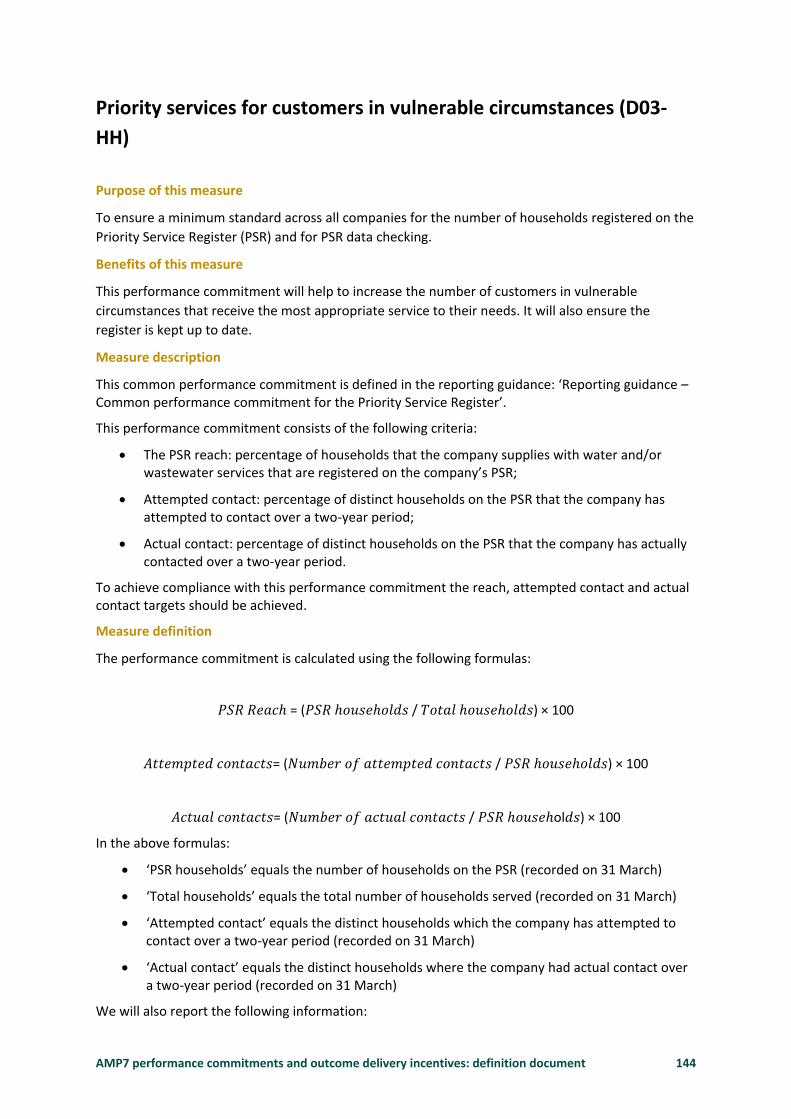
AMP7 performance commitments and outcome delivery incentives: definition document 144
Priority services for customers in vulnerable circumstances (D03-
HH)
Purpose of this measure
To ensure a minimum standard across all companies for the number of households registered on the
Priority Service Register (PSR) and for PSR data checking.
Benefits of this measure
This performance commitment will help to increase the number of customers in vulnerable
circumstances that receive the most appropriate service to their needs. It will also ensure the
register is kept up to date.
Measure description
This common performance commitment is defined in the reporting guidance: ‘Reporting guidance – Common performance commitment for the Priority Service Register’.
This performance commitment consists of the following criteria:
The PSR reach: percentage of households that the company supplies with water and/or wastewater services that are registered on the company’s PSR;
Attempted contact: percentage of distinct households on the PSR that the company has attempted to contact over a two-year period;
Actual contact: percentage of distinct households on the PSR that the company has actually contacted over a two-year period.
To achieve compliance with this performance commitment the reach, attempted contact and actual contact targets should be achieved.
Measure definition
The performance commitment is calculated using the following formulas:
𝑃𝑆𝑅 𝑅𝑒𝑎𝑐ℎ = (𝑃𝑆𝑅 ℎ𝑜𝑢𝑠𝑒ℎ𝑜𝑙𝑑𝑠 / 𝑇𝑜𝑡𝑎𝑙 ℎ𝑜𝑢𝑠𝑒ℎ𝑜𝑙𝑑𝑠) × 100
𝐴𝑡𝑡𝑒𝑚𝑝𝑡𝑒𝑑 𝑐𝑜𝑛𝑡𝑎𝑐𝑡𝑠= (𝑁𝑢𝑚𝑏𝑒𝑟 𝑜𝑓 𝑎𝑡𝑡𝑒𝑚𝑝𝑡𝑒𝑑 𝑐𝑜𝑛𝑡𝑎𝑐𝑡𝑠 / 𝑃𝑆𝑅 ℎ𝑜𝑢𝑠𝑒ℎ𝑜𝑙𝑑𝑠) × 100
𝐴𝑐𝑡𝑢𝑎𝑙 𝑐𝑜𝑛𝑡𝑎𝑐𝑡𝑠= (𝑁𝑢𝑚𝑏𝑒𝑟 𝑜𝑓 𝑎𝑐𝑡𝑢𝑎𝑙 𝑐𝑜𝑛𝑡𝑎𝑐𝑡𝑠 / 𝑃𝑆𝑅 ℎ𝑜𝑢𝑠𝑒ℎol𝑑𝑠) × 100
In the above formulas:
‘PSR households’ equals the number of households on the PSR (recorded on 31 March)
‘Total households’ equals the total number of households served (recorded on 31 March)
‘Attempted contact’ equals the distinct households which the company has attempted to contact over a two-year period (recorded on 31 March)
‘Actual contact’ equals the distinct households where the company had actual contact over a two-year period (recorded on 31 March)
We will also report the following information:

AMP7 performance commitments and outcome delivery incentives: definition document 145
PSR reach: we will present PSR membership by separately reporting forecast annual figures for individuals registered receiving support through PSR services for
a) communication,
b) support with mobility and access restrictions,
c) support with supply interruption,
d) support with security and
e) support with other needs.
PSR data-checking: We will report the number of households added and removed from the PSR if the data is not available to report numbers of individuals. Where possible, we will report the corresponding figure for individuals alongside this.
On PSR data-checking, Ofwat considers it appropriate to exclude households that have been added within the last two years on the company’s PSR. This is because these entries should be up to date and therefore Ofwat would not expect companies to attempt to contact households until after they have been on the PSR for over two years.
A reportable attempt is where we have tried to contact the customer on two occasions.
Regardless of whether an ‘attempted’ contact is undertaken through the company or a third party, we will report all performance as part of the single ‘attempted contact’ measure in our overall performance reporting to Ofwat.
Measurement units
PSR reach: percentage of applicable households, reported to one decimal place.
Actual contacts: percentage of applicable households, reported to one decimal place.
PSR data checking: percentage of applicable households, reported to one decimal place.
Mitigation/exceptions
None.
Common performance commitment
This is a common performance commitment developed by Ofwat for AMP7.
Incentive type
Reputational.
Price control allocation
Although this performance commitment and ODI is 100% allocated to the residential retail price control
delivery of Priority Services support also requires activity and engagement in areas that fall under the Water
Network+ and Wastewater Network+ price controls.
Water resources
Water network+
Wastewater network+
Bioresources Residential
retail Business
retail Direct
procurement
0% 0% 0% 0% 100% 0% 0%

AMP7 performance commitments and outcome delivery incentives: definition document 146
Performance commitment for AMP7
Deadbands, caps and collars
There are no deadbands, caps and collars associated with this measure.
Outcome Delivery Incentive
Not applicable.
Outperformance/underperformance incentive rate
Not applicable.
Long-term ambition
Our Priority Services offer and other support for customers in vulnerable circumstances continues to
develop. In the last few years the level and quality of support has improved substantially both within
UU and across the water and energy sectors. We believe that our current commitments will prove
industry leading for an extended period beyond 2025. Our long-term ambition is therefore to drive a
substantial increase in awareness and Priority Service uptake.
We estimate it will take up to ten years to achieve full community awareness and registration. There
after we anticipate broadly stable registration levels.
Unit
AMP7 2020/21 2021/22 2022/23 2023/24 2024/25
Performance commitment :
Reach
% 4.0 4.8 5.5 6.3 7.0
Performance commitment : Actual contact
% 17.5 35 35 35 35
Performance commitment :
Attempted contact
% 45.0 90 90 90 90

AMP7 performance commitments and outcome delivery incentives: definition document 147
Street works performance (D04-CF)
Purpose of this measure
This performance commitment measures the safety, quality and compliance of the company’s street
works activities in the public highway against the New Roads and Street Works Act (NRSWA) 1991.
Benefits of this measure
This performance commitment will improve the quality of the company’s activities in the public
highway through compliance with the New Roads and Street Works Act (NRSWA) 1991.
Measure description
This measure assesses the successful and safe delivery of our street works activities. It will measure
safety, quality and compliance against the codes of practice currently in place (as at 2018) under the
New Roads and Street Works act (NRSWA) 1991.
Measure definition
The New Roads and Street Works Act 1991 (NRSWA) allows codes of practice to be introduced to set
the standards undertakers are required to work to whilst executing their street works. Failure to
meet the standards causes disruption both during and after works, this can either be through poorly
setup work sites which disrupt road users via taking up excessive road space or causing confusion
resulting in increased congestion. Additionally, there may be a need to occupy the highway further
when we are undertaking remedial works to rectify non-compliant reinstatements. This would mean
we are occupying road space for a second time by setting up signing, lighting and guarding while we
undertake the remedial works.
This measure will report the percentage non-compliance of street works activities undertaken in the
public highway as assessed by our street works audit compliance team. The compliance team audit a
percentage of in-progress excavation work and permanent standard reinstatements to determine
the level of non-compliance against current legislation. They will assess each set of works against the
standards set out in law (Safety at Street Works and Road Works a code of practice (October 2013))
using a standard set of questions that mirror and go beyond the statutory (Category A) inspections
used by highway authorities.
Any non-compliances found are photographed and reported via mobile devices in real time,
notifications are sent to our delivery partners notifying them of the failure to comply and an action
given to them to rectify the non-compliance found. The details are stored on an interactive website
which allows reports to be produced and actions to be closed down with supporting evidence i.e.
team reports showing their actions to fix any issues. When the works have been completed the
excavation is reinstated and the signing, lighting and guarding is removed from site. This then
removes any disruption to pedestrians and road users.
The reinstatement work is also subject to meeting a defined standard. These standards are set out in
the Specification for the Reinstatement of Openings in Highways 3rd edition (SROH), this standard
must be adhered to by all statutory undertakers. The standard allows a reinstatement to be ‘interim’
or ‘permanent’, all interim reinstatements need to be replaced by a permanent standard
reinstatement within six months of the interim reinstatement date. We aim to reinstate all of our
works to permanent standard on the first visit, this means we reinstate using the correct materials,
construction techniques and compaction equipment as per the requirements of the standards.

AMP7 performance commitments and outcome delivery incentives: definition document 148
The standards have three key areas for determining compliance, visual assessment, depth/material
assessment and air void assessment.
Visual assessment takes into account how flat and flush the reinstatement is to the surrounding
area making sure there are no trip hazards, surface depressions, edge cracks etc. The audit
compliance team undertake a percentage of visual assessment audits on permanent reinstatements
on a monthly basis with audits being completed within the same month the reinstatement was
completed. The audit compliance team will assess the reinstatement against the requirements of the
SROH using mobile devices with a question set that mirrors statutory (Category B) inspections used
by highway authorities.
Depth/material assessments look at the materials that have been used for the reinstatement and
also the depth that the materials have been laid. The SROH has absolute minimum depths for
various road and footway types for example, a footway must be a minimum of 60mm deep.
Air void content assessment looks at the amount of air contained within a reinstatement. Too much
air will reduce the life expectancy of the reinstatement by allowing water and air ingress. The SROH
has a minimum and maximum value range for percentage air content depending on material type.
The only way to assess if a reinstatement has the correct depth/material and correct air void content
is to take a section of the reinstatement known as a core sample from a selection of permanent
reinstatements and test them in our United Kingdom Accreditation Services (UKAS) accredited
laboratory
The testing detail will be captured on our audit website and any non-compliances found are
reported via the website in real time, notifications are sent to our delivery partners notifying them of
the failure and an action given to them to rectify the non-compliance. The website allows reports to
be produced and actions to be closed down with supporting evidence i.e. team reports showing their
actions to fix any issues.
The audit compliance team are UKAS assessed every year as part of our independent water quality
laboratory accreditation. All auditors are assessed for competency every year as part of their training
requirements. The audit team are part of an independent proficiency testing scheme where core
samples of an unknown material type are provided to several testing laboratories across Europe. The
results are sent back to the schemes owner who then shares all results to all participants.
The audit compliance team will use the street works noticing system to determine locations suitable
for auditing. The noticing system is used to communicate with highway authorities to agree what
works can be undertaken and when. The system sends electronic notifications to and from the
highway authorities providing updated information as to the works statuses, i.e. in-progress or
permanently reinstated.
All audit data findings are captured and reported monthly and then rolled up into an annual total.
Measurement units
Measured as the percentage (%) non-compliance against the Safety at Street works and Roads
Works Code of Practice and the Specification for the Reinstatement of Openings in Highways (3rd
Edition). This will be reported annually to two decimal places.
Mitigation/exceptions
None.
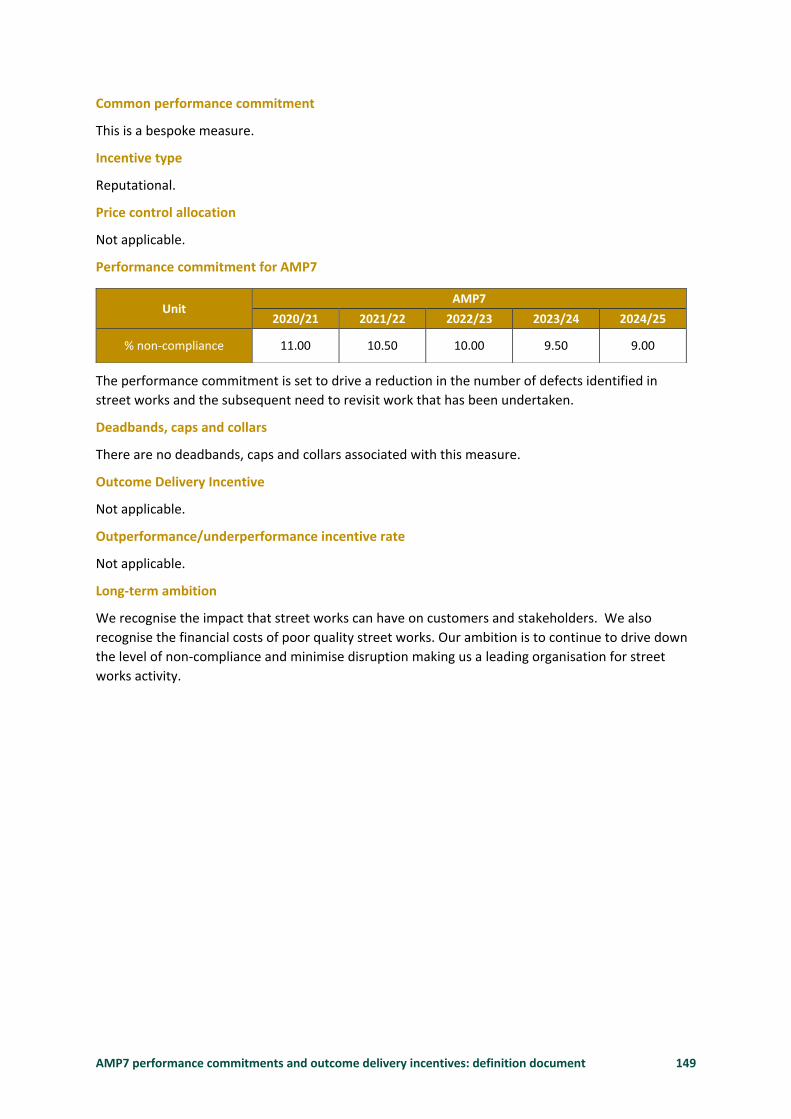
AMP7 performance commitments and outcome delivery incentives: definition document 149
Common performance commitment
This is a bespoke measure.
Incentive type
Reputational.
Price control allocation
Not applicable.
Performance commitment for AMP7
The performance commitment is set to drive a reduction in the number of defects identified in
street works and the subsequent need to revisit work that has been undertaken.
Deadbands, caps and collars
There are no deadbands, caps and collars associated with this measure.
Outcome Delivery Incentive
Not applicable.
Outperformance/underperformance incentive rate
Not applicable.
Long-term ambition
We recognise the impact that street works can have on customers and stakeholders. We also
recognise the financial costs of poor quality street works. Our ambition is to continue to drive down
the level of non-compliance and minimise disruption making us a leading organisation for street
works activity.
Unit AMP7
2020/21 2021/22 2022/23 2023/24 2024/25
% non-compliance 11.00 10.50 10.00 9.50 9.00

AMP7 performance commitments and outcome delivery incentives: definition document 150
Priority services - BSI accreditation (D05-HH)
Purpose of this measure
This measure commits United Utilities to provide assurance that the quality of support for customers
in vulnerable circumstances is of a standard in line with the British Standards Institution (BSI)
inclusive service provision.
Benefits of this measure
This performance commitment will help ensure that the company provides an independently
assured fair, flexible service and transparent service that can be used by all customers equally,
regardless of their health, age or personal circumstances.
Measure Description
This measure assesses the quality of the Priority Services scheme via the British Standard for
Inclusive Service Provision certification BS 18477.
Measure Definition
To meet its targets for this performance commitment the company must achieve the BS 18477 standard in 2020/21 and maintain the standard thereafter. United Utilities meets this performance commitment if it has in place on the 31 March of the reporting year a BSI certification for standard BS 18477. If this certification from BSI is not in place on 31 March of the reporting year, the performance commitment is reported as not achieved or not maintained (depending on prior reporting year performance).
The performance commitment applies each reporting year, and demonstration that the certification is in place must be tested and reported each reporting year. The BS 18477 certification is awarded by BSI Group (also known as the British Standards Institution).
In the event that BSI Group cease providing certification for BS 18477 during the period 2020-25, the company should adopt any standard designed to directly succeed the existing standard. If one is not available, it will assess whether there exists other appropriate standards that can be used as an alternative independently assessed indicator of the quality of support for customers in vulnerable circumstances.
Measurement units
This measure is reported as achieved/maintained or not achieved/not maintained.
Mitigation/exceptions
None.
Common performance commitment
This is a bespoke measure.
Incentive type
Reputational.

AMP7 performance commitments and outcome delivery incentives: definition document 151
Price control allocation
Water resources
Water network+
Wastewater network+
Bioresources Residential retail
Business retail
Direct procurement
0% 0% 0% 0% 100% 0% 0%
Performance commitment for AMP7
Long-term ambition
We intend to maintain the BSI accreditation and provide for the best service possible to our PSR
customers. Maintaining this standard will assist us to continuously improve the service offering.
Unit
AMP7
2020/21 2021/22 2022/23 2023/24 2024/25
Text Achieved Maintained Maintained Maintained Maintained

AMP7 performance commitments and outcome delivery incentives: definition document 152
Outcome E – We will improve the way we work to keep bills down
and improve services
We aim to keep future bills down for customers by helping more people to pay, and seeking to ensure that all those receiving our services are being billed. We will continue to support customers who have affordability issues by ensuring that they are on the most suitable tariff and payment plan for their circumstances and employing other non-financial assistance schemes.

AMP7 performance commitments and outcome delivery incentives: definition document 153
Number of customers lifted out of water poverty (E01-HH)
Purpose of this measure
This performance commitment measures the number of customers lifted out of water poverty
following the implementation of support measures by the company.
Benefits of this measure
This performance commitment will improve the levels of affordability support available to customers
over the 2020-25 period, particularly for those customers that are most in need.
Measure description
This measure commits us to providing additional support to customers in water poverty, primarily
through the effective promotion of discounted social and support tariffs. In addition, it ensures
support is effectively targeted at those most in need by only recognising this support where it acts to
ensure a customer is out of water poverty.
The measure assesses the number of customers who have been lifted out of water poverty each
year due to our actions. The definition for water poverty used for this measure is ‘customers
spending more than 3% of their annual household income, after housing costs, on water and
wastewater services’. We will demonstrate that individual customer financial circumstances have
been assessed when determining whether or not tariff discounts and other interventions have been
sufficient to prevent an individual customer being in water poverty.
This measure is unique in that it seeks to incentivise both the scale and effectiveness of affordability
support by focussing efforts on the core outcome of ‘customers lifted out of water poverty’. This
definition and focus seeks to ensure company effort and resources are focused on customers where
there are clear indications of financial stress, and where water company charges are very likely to be
contributing to that stress. It is also helping focus company efforts on achieving wide ranging,
collaborative solutions to water poverty, ensuring that benefit from the financial support provided
by other customers and the company is utilised to the best possible benefit.
Measure definition
The threshold for water poverty used for this measure is defined as customers spending more than
3% of annual household income, after housing costs, on water and wastewater services. This is
aligned to the UK water poverty benchmark, as set out in the report Water Poverty in England and
Wales, Fitch and Price, Centre for Utility Consumer Law, 2002.
Historically, water companies have sought to encourage customers to apply for financial support
schemes with only a limited understanding of how the support provided is translating into better
outcomes for customers. In particular whilst many industry support schemes use measures of
income or receipt of benefits as a gateway for acceptance onto support schemes there is little or no
assessment of whether company interventions effectively assist in relieving financial stress. This
performance commitment helps address these limitations.
The measure of success will be the number of unique customers lifted out of water poverty as a
result of our action at any point in the year. Evidence for this will be:

AMP7 performance commitments and outcome delivery incentives: definition document 154
The number of unique customers on a qualifying discounted tariff, for example “Help to Pay”
or “Back on Track”, where charges are reduced to a sufficient level to ensure annual charges
are less than 3% of annual income.
The number of unique customers on the Payment Matching scheme where outstanding
customer payments are reduced sufficiently to lift customers out of water poverty
The number of unique customers where a trust fund grant has alleviated their indebtedness
to a sufficient level that outstanding customer payments for the current year are reduced to
less than 3% of annual income.
The number of unique customers where other forms of UU action has enabled them to
reduce current year charges and/or increase income (e.g. via a Town Action Plan visit or a
successful benefit maximisation referral) that results in their being lifted out of water
poverty.
Assessment of household income will be based on, in order of preference:
An income assessment provided directly by the customer;
An income assessment provided on behalf of a customer by a recognised debt advice
partner (including organisations such as Citizen Advice, StepChange, and similar);
An individualised indication of income using a range of third party financial data, for example
Credit Reference Agency insight data, Department for Work and Pensions information on
customer qualification for various forms of state benefits, other third party data provided
through recognised data share and or customer history.
Indications of income that are not specific to an individual, such as street or postcode level customer
segmentation data will not qualify as an income assessment for the purposes of this performance
commitment.
We will retain evidence of the household income level upon which we have based our assessment.
In addition we will carry out a validation process at least every three years after this has been
obtained to check if this income level has changed.
Water companies are currently engaged in discussions to establish a common definition of water
poverty. Once a common definition has been established, we would expect to notify Ofwat, in
accordance with the procedures for changing performance commitments set out in Annex 2 of the
PR19 final documentation: United Utilities - Outcomes performance commitments appendix, with a
view to updating the definition of this performance commitment to align it, as appropriate, with the
common definition.
Measurement units
Number of customers lifted out of water poverty due to our intervention in year, where numbers
lifted out of water poverty is verified by individual customer income assessments. This measure will
be reported to zero decimal places.
Mitigation/exceptions
Indications of income that are not specific to an individual, such as street or postcode level customer
segmentation data do not qualify as an income assessment for the purposes of this performance
commitment.
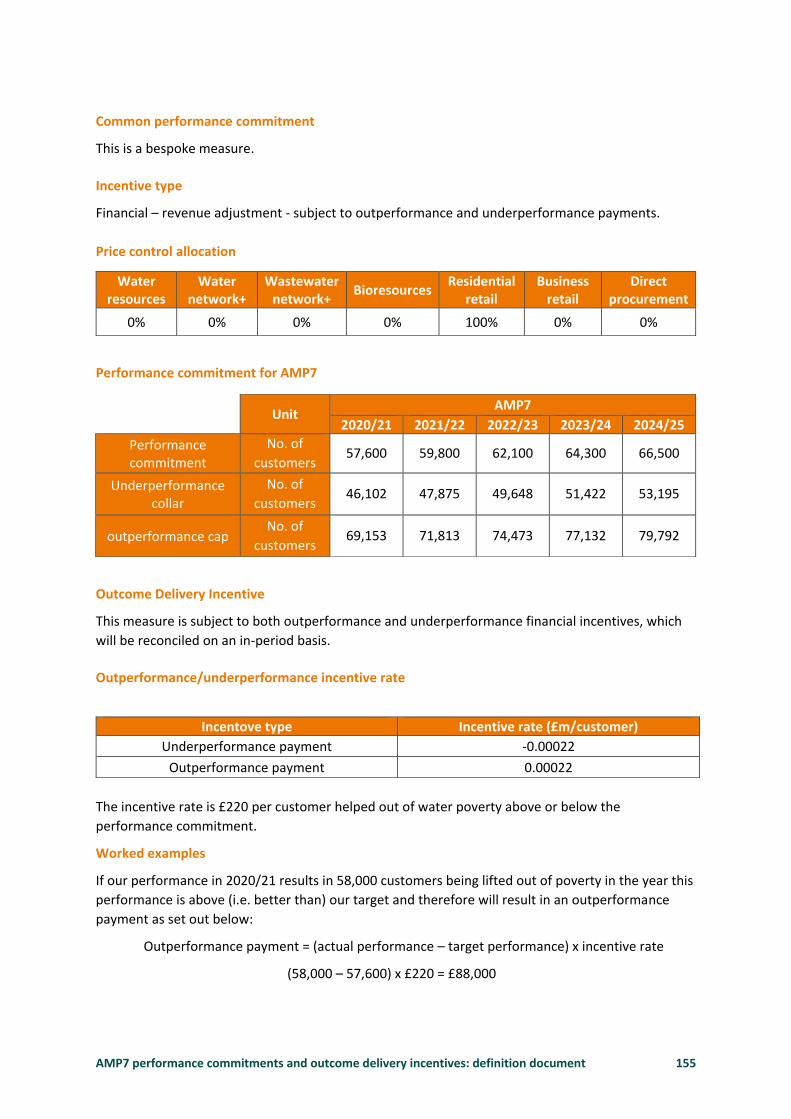
AMP7 performance commitments and outcome delivery incentives: definition document 155
Common performance commitment
This is a bespoke measure.
Incentive type
Financial – revenue adjustment - subject to outperformance and underperformance payments.
Price control allocation
Performance commitment for AMP7
Outcome Delivery Incentive
This measure is subject to both outperformance and underperformance financial incentives, which
will be reconciled on an in-period basis.
Outperformance/underperformance incentive rate
The incentive rate is £220 per customer helped out of water poverty above or below the
performance commitment.
Worked examples
If our performance in 2020/21 results in 58,000 customers being lifted out of poverty in the year this
performance is above (i.e. better than) our target and therefore will result in an outperformance
payment as set out below:
Outperformance payment = (actual performance – target performance) x incentive rate
(58,000 – 57,600) x £220 = £88,000
Water resources
Water network+
Wastewater network+
Bioresources Residential
retail Business
retail Direct
procurement
0% 0% 0% 0% 100% 0% 0%
Unit
AMP7 2020/21 2021/22 2022/23 2023/24 2024/25
Performance commitment
No. of
customers 57,600 59,800 62,100 64,300 66,500
Underperformance collar
No. of
customers 46,102 47,875 49,648 51,422 53,195
outperformance cap No. of
customers 69,153 71,813 74,473 77,132 79,792
Incentove type Incentive rate (£m/customer)
Underperformance payment -0.00022
Outperformance payment 0.00022

AMP7 performance commitments and outcome delivery incentives: definition document 156
If our performance in 2020/21 results in 57,000 customers being lifted out of poverty in the year this
performance is below our target and therefore will result in an underperformance payment as set
out below: -
Underperformance payment = (actual performance – target performance) x incentive rate
(57,000 – 57,600) x £220 = -£132,000
Long-term ambition
We will continue to support customers who have affordability issues by ensuring they are on the
most suitable tariff and payment plan for their circumstances, and employing other non-financial
assistance schemes, such as Payment Breaks. We will also work with community stakeholders,
regulators and government with the aim of introducing new mechanisms for supporting customers
under financial stress.
All long-term targets have been developed based on best available views of future costs, benefits,
and customer expectations. As our understanding of ODI performance and outcomes develops in
coming years we will revisit these long-term performance forecast as a natural part of the business
planning cycle.

AMP7 performance commitments and outcome delivery incentives: definition document 157
Non-household vacancy incentive (E03-CF)
Purpose of this measure
This performance commitment is designed to identify occupied non-household premises that are
showing as vacant and should therefore be billed.
Benefits of this measure
Reducing the number of void properties, which are occupied but not billed, will result in fairer
charges between customers and lower bills for customers already paying.
Measure description
This measure incentivises business retailers who work in our area to identify and change occupied
premises that are showing as vacant within the Central Market Operator System. For charges to be
correct it is essential that the occupancy status of each premises is marked correctly i.e. whether the
premises is ‘occupied’ or ‘vacant’.
On identifying an occupied premises that is showing as vacant within CMOS the retailer will notify us
that they have changed the status to occupied and apply for an incentive payment. The measure
records the number of vacancy incentive payments made to retailers following a successful
application i.e. the occupancy status being corrected within Central Market Operator System.
Controls will need to be in place to limit the opportunities for gaming of the process to occur.
Measure definition
We recognise the important role that effective management of property data has in supporting the
fair billing of all customers. It is in all customers’ interests that do all we can to identify occupiers or
confirm that properties are truly unoccupied. Equally we need to actively ensure that all household
and non-household properties connected for water and wastewater services are registered on billing
systems and appropriately charged.
This is one of two related performance commitments for business customers, which are designed to
ensure that we can recover revenue which is due, keeping bills down for other customers. This
measure (E03-CF) is designed to incentivise retailers to identify sites which are recorded as vacant
but are occupied and should be billed. Measure E04-CF is designed to incentivise retailers to reduce
gap sites.
Vacant premises are shown in the Central Market Operator System by the presence of a ‘Vacancy Flag’ against the relevant non-household premises. This is the system that records all business customers and connects all the wholesalers and retailers in the market. The data is used to calculate the wholesale charges that retailers must pay to wholesalers for the services provided to each premises and is subsequently used to calculate the charges to the end customers
The Market Codes set out the rules of the business retail market and the interactions between the retailers and wholesalers in the market. This includes the rules and responsibilities regarding data ownership, updates and maintenance. The Market Codes state that the retailer is responsible for maintaining the correct occupancy status with the Central Market Operator System. Thus, ‘Vacancy Flag’ is a retail owned data item and only the retailer can change the occupancy status as part of business as usual activity.
The market codes set out the detailed definitions for both ‘occupied’ and ‘vacant’ premises. In summary, an ‘occupied’ premises is one which is in use, either manned or used for storage. A ‘vacant’ premises is one which is not occupied, is not in use and is empty of all equipment and stock.

AMP7 performance commitments and outcome delivery incentives: definition document 158
The market codes allow wholesalers to challenge the occupancy status of a premises where they believe it to be incorrectly market as vacant. This is done by submitting a Vacancy Challenge Application to the Market Operator.
Our proposed incentive scheme will encourage retailers to identify premises that are incorrectly marked as vacant so that the challenge applications can be submitted and thus the occupancy status can be corrected.
Measurement units
Measured as the number of vacancy incentive payments made by us to licenced retailers annually
and reported to zero decimal places.
Mitigation/exceptions/assumptions
None.
Common performance commitment
This is a bespoke measure.
Incentive type
This is outperformance payment only.
Price control allocation
Performance commitment for AMP7
Due to the relative immaturity of the business retail market and the absence to date of a vacancy incentive scheme in England there are a number of risks and issues that have been considered in developing this performance commitment. The performance commitment for this ODI has been set at zero because we are wholly dependent on retailers submitting vacancy incentive applications. Therefore as a wholesaler we cannot control the level of activity in this area. In addition as work continues to minimise the number of incorrectly flagged vacant premises, and it is unclear as to the true scale of the issue it is difficult to know what would be achievable.
In view of the uncertainty about potential numbers, we consider that it is in customers’ interests to have a zero performance commitment and that we recover costs only through the ODI, so that customer bills will only reflect actual payments made.
Deadbands, caps and collars
There are no deadbands, caps or collars associated with this measure.
Water resources
Water network+
Wastewater network+
Bioresources Residential
retail Business
retail Direct
procurement
0% 50% 50% 0% 0% 0% 0%
Unit AMP7
2020/21 2021/22 2022/23 2023/24 2024/25
Number of incentive
payments per annum 0 0 0 0 0

AMP7 performance commitments and outcome delivery incentives: definition document 159
Outcome Delivery Incentive
This measure is subject to outperformance financial incentives only, which will be reconciled on an
annual in-period basis.
Outperformance/underperformance incentive rate
A £136 incentive will be achieved for every successful vacancy incentive application from the retailer
which results in a premises occupancy status being corrected in the Central Market Operator
System. The measure will recover our costs of operating the scheme and the cost of vacancy
incentive payments made to retailers. The incentive is set at half the £273 cost per payment made,
to reflect the totex sharing mechanism.
The £273 cost is made up of two elements:
1. Vacancy incentive payment to retailers: The vacancy incentive payment made to retailers
will be £200 per SPID successfully corrected in the market. This is consistent with the
vacancy incentive payments made by Scottish Water to retailers in Scotland under the
equivalent Scottish Water scheme.
2. Cost to us of administering the successful vacancy incentive application: We have estimated
the administrative cost per successful vacancy incentive application to be £73. This is based
on a 51% application success rate and factors in the costs of dealing with speculative and
unsuccessful applications.
The administration costs include:
Desktop review of application, including processing of the application, and handling disputes and queries.
Processing vacancy challenge application to MOSL.
Monitoring application progress and processing incentive payment.
Worked example
n/a
Long-term ambition
Our long-term ambition is for all cases of incorrect vacancy status to be quickly identified and
corrected in the Central Market Operating System, and that this is managed effectively within the
market as part of business as usual processes. This will help to ensure that revenue is being
recovered fairly for all services provided to premises in our area of appointment and as a result,
ensure that tariffs are kept as low as possible for all customers.
2025/26 2026/27 2027/28 2028/29 2029/30 2030/31 2031/32 2032/33
Incentive
payments per
annum 0 0 0 0 0 0 0 0

AMP7 performance commitments and outcome delivery incentives: definition document 160
2033/34 2034/35 2035/36 2036/37 2037/38 2038/39 2039/40 2044/45
Incentive
payments per
annum 0 0 0 0 0 0 0 0
AMP7 performance commitments and outcome delivery incentives: definition document 161
Gap sites - Wholesale (E04-CF)
Purpose of this measure
This performance commitment measures the number of incentive payments made to retailers for
finding non-household properties where water and/or wastewater services are being used, but the
property is not being billed (‘gap sites’).
Benefits of this measure
Reducing the number of gap sites, which are occupied but not billed, will result in fairer charges
between customers and lower bills for customers already paying.
Measure description
This measure is designed to encourage identification of non-household properties by retailers where
water and/or wastewater services are being used, but the property is not being billed (“gap sites”).
Identifying these sites will bring in more revenue from business customers, so keeping down bills for
other customers. The measure will facilitate incentive payments to retailers who identify customers
who are not being billed or are only being partially billed.
The performance commitment records the number of incentive payments made by UUW to business
retailers who identify non-household premises using water or wastewater services which are not
registered within the Central Market Operator System (CMOS). The CMOS records all business
customers and connects wholesalers and retailers in the market.
Measure definition
This is one of two related performance commitments for business customers, which are designed to
ensure that we can recover revenue which is due, keeping bills down for other customers. This
measure (E04-CF) is designed to incentivise retailers to reduce the number of gap sites. Measure
E03-CF is designed to incentivise retailers to reduce the number of sites recorded as vacant but
which are occupied and should be billed.
Ofwat expects business plans to clearly explain how companies plan to manage gap sites in the
business market.
As part of this, Ofwat has stated that companies should:
Explain how they use internal and external data to inform and validate their approach; and
Consider providing a financial incentive to retailers in the business market to identify gap sites, if they have not already done so.
We recognise the importance of ensuring that all customers are billed appropriately and are, therefore, proposing introduction of a financial incentive.
The incentive payments will provide for costs of administering the incentive and payments to retailers, while still providing a net benefit to customers from the additional revenue gained from billing previously unbilled properties.
It is in the nature of gap sites that it is difficult to establish how many exist. They are likely to require
a combination of desktop studies and site visits to identify them. We do not currently know how
many such sites there are but the incentive will contribute to establishing the extent of the issue.
This performance commitment is cross functional and allocated to the water network plus and
wastewater network plus price controls. The measure is subject to outperformance payments only.

AMP7 performance commitments and outcome delivery incentives: definition document 162
A gap site is any premise which is in receipt of water services and/or sewerage services where no
supply points or insufficient supply points are registered within the CMOS. A supply point is the point
at which water services or sewerage services are provided.
It will be measured as the number of new supply points registered by the wholesaler through the
retailer-identified gap site process. If a premise identified by the retailer is a valid gap site we will
register the supply point into the CMOS and at this point the retailer is eligible for the incentive
payment.
Retailer-identified gap sites are added to the market via an established market process set out in the
Wholesale-Retail Code for enabling wholesalers and retailers to work together effectively (process
C3). The market operator reports on the number of C3 processes completed by each wholesaler.
Any eligible premise that receives both water services and sewerage services should have two supply
points registered. Any eligible premise that receives either water services or sewerage services only
should have one supply point registered, so if the site has a sewerage and water supply point
registered that would be two supply points.
The measure will lead to us incurring additional administrative costs but it could lead to more gap
sites being identified. The incentive is structured to ensure that our additional costs are covered and
the retailer incentive payment is attractive enough to encourage retailers to participate in the
scheme.
Measurement units
This performance commitment records the annual number of gap site incentive payments paid by
UUW to retailers following the successful registration of the supply point in the market. This will be
reported to zero decimal places.
Mitigation/exceptions
If we are already aware of the premises we will not pay the incentive to a retailer. Supply points
being processed through new connections or being processed through the wholesaler identified gap
sites process will not be eligible for an incentive payment.
The incentive scheme is only available to business retailers.
Common performance commitment
This is a bespoke measure.
Incentive type
Financial – outperformance payments only.
Price control allocation
The non-household revenue split between price controls is based on the proposed RCV allocations.
Water resources
Water network+
Wastewater network+
Bioresources Residential
retail Business
retail Direct
procurement
0% 50% 50% 0% 0% 0% 0%

AMP7 performance commitments and outcome delivery incentives: definition document 163
Performance commitment for AMP7
Due to the relative immaturity of the business retail market, the limited experience to date of a gap site incentive scheme in England, a lack of detail across the industry regarding the volume of gap sites and the proactive management approach we have adopted, alongside a number of risks and issues have been considered in developing this performance commitment and incentive proposal (detailed below in a separate section). The number of incentive applications is not within our direct control, it is solely dependent on retailers submitting valid gap site incentive applications.
In view of the uncertainty about potential numbers, we consider that it is in customers’ interests to have a zero performance commitment and that we recover costs only through the ODI, so that customer bills will only reflect actual payments made.
Deadbands, caps and collars
There are no deadbands, caps and collars associated with this measure.
Outcome Delivery Incentive
This measure is structured to cover the cost of the incentive payment to the retailer and to recover
the additional administrative costs borne by the wholesaler, not to deliver any reward to the
wholesaler.
Outperformance/underperformance incentive rate
A £306 outcome delivery incentive will be achieved for every successful gap site application received
from the retailer which results in the registration of a new premise into the Central Market
Operating System (CMOS). The measure will recover our costs of operating the scheme and the cost
of gap site incentive payments made to retailers. This reflects half the cost per incentive payment
made, to allow for the totex sharing mechanism.
The £613 cost is made up of two elements:
1. Gap site incentive payment to retailers: The incentive payment made to retailers will be
£250 per supply point (SPID) successfully registered in the market. Anglian Water currently
has a gap site incentive scheme which pays £350. Whilst our proposed incentive is lower we
have calculated this amount based on cost estimates of a retailer’s activity to identify,
validate and process a gap site, plus an amount which we believe will still make this an
attractive scheme for the retailers.
2. Our cost of administering the successful gap site application. We have estimated the
administrative cost per successful gap site incentive application to be £363. This is based on
a 50% application success rate and factors in the costs of dealing with unsuccessful
applications. We will consider steps to reduce the number of vexatious claims, possibly
through the introduction of an administration charge for incorrect applications.
Unit AMP7
2020/21 2021/22 2022/23 2023/24 2024/25
Number of incentive
payments / additional
sites registered in the
market as a result of
the scheme
0 0 0 0 0

AMP7 performance commitments and outcome delivery incentives: definition document 164
The administration costs include review and processing of the application, site visits, and registering
the site in the market.
Worked example
Not applicable
Long-term ambition
Our long-term ambition is to maintain and continuously improve the accuracy and completeness of
our data. Given the existing activity on gaps we would expect the number of gap sites remaining in
our area to be greatly reduced by 2025 and therefore the potential for further improvement limited.
We would, however, continue to work to identify further sites.
AMP7 performance commitments and outcome delivery incentives: definition document 165
Gap sites – Retail (E05-HH)
Purpose of this measure
This performance commitment measures the number of household properties that are identified
where water and/or wastewater services are being used, but the property is not known to the
company (‘gap sites’).
Benefits of this measure
Reducing the number of gap sites, which are occupied but not billed, will result in fairer charges
between customers and lower bills for customers already paying.
Measure description
The number of connected properties in the company’s supply area which the company identifies as not being billed for water and/or wastewater services each year and are added to the company’s billing system as residential customers.
This performance commitment measures the number of domestic connected properties in our area which we identify as not being billed for water and/or wastewater services each year and add to our billing system. We will use external and internal data sources to verify if we have properties in our region which we have not captured onto our billing system.
This measure has been developed to ensure that we actively manage connected properties within United Utilities service area which are not on the billing system and raise bills wherever possible, thereby supporting the lowest possible bills for all household customers.
As part of our continuous improvement process we have been developing alternative methods for identifying missing properties for some time. We started to develop new techniques, utilising third party data, to identify these properties and also the follow up activity to verify occupancy details. This work has resulted in a number of gap sites, or missing properties, being identified and has helped us to put in place an improved enduring process to address this issue. We believe that on an on-going basis the volume of gap sites is not high but it is in customers’ interest that we have an on-going regular activity to validate our billing records.
Measure definition
This is one of two related performance commitments for residential customers, which are designed to ensure that we can recover revenue which is due, keeping bills down for other customers. This measure (E05-HH) is designed to incentivise identification of unbilled households which are not on the billing system. Measure E02-HH is designed to incentivise identifying sites which are recorded as vacant on the billing system but are actually occupied and should be billed.
We recognise the important role that effective management of property data has in supporting the
fair billing of all customers. It is in all customers’ interests that we do all we can to identify occupiers
or confirm that properties are truly unoccupied. Equally we need to actively ensure that all
household and non-household properties connected for water and wastewater services are
registered on billing systems and appropriately charged.
In recent years we have substantially improved the processes, systems and data used to manage
property and occupier records. The introduction of business retail competition has changed the way
that the industry collectively manages property records, and has helped focus our efforts to identify
and correctly classify household and non-household properties and customers.

AMP7 performance commitments and outcome delivery incentives: definition document 166
The performance commitment measures the number of household property connections in our area
which we identify and verify as not being billed for water and/or wastewater services each year and
add to our billing system.
We will use external and internal data sources to verify if we have properties in our region which we
have not captured onto our billing system.
Properties which are listed on AddressBase Premium or other third party data sets but not already
registered on internal UU billing or geographic information systems will be put forward for
verification.
As part of verification we will conduct manual checks on the properties we believe are missing from
our billing system to ensure we are correct in identifying them as gap sites. This includes checking if
the property is connected for services on the billing system already, potentially with a slightly
different address, or if the property is listed on Council Tax registers or Land Registry.
When we have verified that the property is connected for water and/or wastewater services and is
actually missing from our records we will add an account to our billing system, at which point the
gap will be judged to have been resolved, and be recorded as a resolved gap site for performance
commitment reporting purposes.
A property will not be counted as an identified gap site where a developer, self-lay organisation, or
other organisation involved in new household water connections reports a new connection directly
to United Utilities. Non-household connections will not be counted as part of this ODI.
We will carry out this verification process on a quarterly basis each charging year.
Measurement units
This performance commitment measures the number of household connected properties identified
as not being billed by United Utilities which are subsequently recorded onto our billing system
annually, excluding connections raised by developers through established ‘new connections’
processes. This will be reported to zero decimal places.
Mitigation/exceptions
None.
Common performance commitment
This is a bespoke measure.
Incentive type
Financial, set to recover the marginal costs of identifying, verifying and processing household sites
which are not currently being billed.
Price control allocation
Performance commitments set to zero as the measure has been designed as a cost recovery
mechanism, equalising incentives to investigate household gap sites.
Water resources
Water network+
Wastewater network+
Bioresources Residential
retail Business
retail Direct
procurement
0% 0% 0% 0% 100% 0% 0%
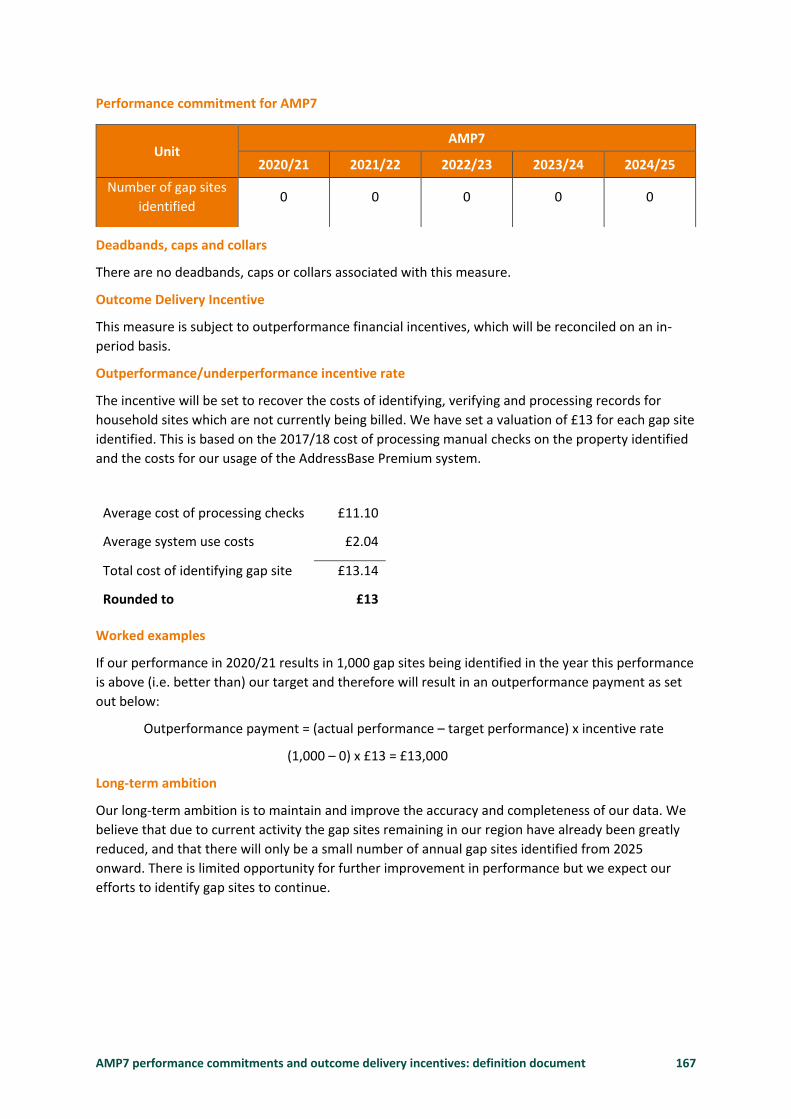
AMP7 performance commitments and outcome delivery incentives: definition document 167
Performance commitment for AMP7
Deadbands, caps and collars
There are no deadbands, caps or collars associated with this measure.
Outcome Delivery Incentive
This measure is subject to outperformance financial incentives, which will be reconciled on an in-
period basis.
Outperformance/underperformance incentive rate
The incentive will be set to recover the costs of identifying, verifying and processing records for
household sites which are not currently being billed. We have set a valuation of £13 for each gap site
identified. This is based on the 2017/18 cost of processing manual checks on the property identified
and the costs for our usage of the AddressBase Premium system.
Average cost of processing checks £11.10
Average system use costs £2.04
Total cost of identifying gap site £13.14
Rounded to £13
Worked examples
If our performance in 2020/21 results in 1,000 gap sites being identified in the year this performance
is above (i.e. better than) our target and therefore will result in an outperformance payment as set
out below:
Outperformance payment = (actual performance – target performance) x incentive rate
(1,000 – 0) x £13 = £13,000
Long-term ambition
Our long-term ambition is to maintain and improve the accuracy and completeness of our data. We
believe that due to current activity the gap sites remaining in our region have already been greatly
reduced, and that there will only be a small number of annual gap sites identified from 2025
onward. There is limited opportunity for further improvement in performance but we expect our
efforts to identify gap sites to continue.
Unit AMP7
2020/21 2021/22 2022/23 2023/24 2024/25
Number of gap sites
identified 0 0 0 0 0

AMP7 performance commitments and outcome delivery incentives: definition document 168
Systems thinking capability (E06-CF)
Purpose of this measure
This performance commitment measures improvement in the company’s ‘Systems Thinking’
maturity. Systems thinking is an approach for day to day business management that involves looking
at your end-to-end system in order to understand interdependencies, predict performance and
therefore optimise business decisions.
Benefits of this measure
Improvements in Systems Thinking maturity enables the company to deliver more efficient
performance and also enables improvements in other key service levels, for example reducing
leakage or reducing pollution incidents.
Measure description
Systems Thinking capability is assessed at a business level against benchmarked ‘maturity levels’
which range from one (the lowest level and therefore least mature) to five (the highest attainable
level and therefore the most mature). The level of maturity refers to the company’s progress in
improving a set of core capabilities, which aim to increase the levels of automation and
connectedness across the business, and therefore embed a systems thinking approach.
The measure tracks the annual year on year movement in maturity levels. The measure is
incremental, not cumulative,
Measure definition
The assessment methodology measures the end to end systems capability with a pass or fail
assessment against a 220 point assessment across 44 questions, grouped into eight areas, each with
a five point maturity scale of assessment.
A third party will make an assessment to ascertain the maturity level on an annual basis.
In order to achieve an improvement in one level of organisational-level capability maturity, UU must
achieve the improvement in capability in all eight capability areas (see below) and against the
requirements of all 44 questions at the appropriate maturity level.
Customer Experience
Work Scheduling
Operational Monitoring
Data and Information Management
Operational Control
Process Excellence
Product Planning & Optimisation
Asset Lifecycle Management
There is no aggregation, offsetting or averaging of different capability attributes in assigning an
overall level of systems thinking maturity; all 44 questions must reach the target maturity level for
the performance commitment, at a company level, to be met.
Capability levels
As a part of our Capability Model, we have defined the characteristics of people, process, and
technology across a five level performance maturity scale. This scale allows the maturity assessment

AMP7 performance commitments and outcome delivery incentives: definition document 169
to identify how ‘mature’ we are as a business from the most basic connections to following a
collaborative approach to technology development, overlaying key emerging technologies and
disruptors and start to exploit the opportunities they bring.
Our system thinking capability is therefore assessed against this single maturity scale from 1 to 5.
Where maturity level 1 is a basic level; demonstrating well established systems, processes and
technologies with traditional organisation structures for delivery in discrete parts and only some
connectivity between business operations. However a level 5 would require significant innovations,
such as new operating models, machine robotics, artificial intelligence and yet to be established
business processes at a system scale.
The figure below illustrates the changes in business capability at each of the 5 levels of maturity.
Figure 25
We have taken this model approach to develop detailed definitions for each level on the maturity
scale. These definitions include the core attributes for systems, people and process which will ensure
innovation is considered in all aspects of the business.
Measurement units
Maturity level, reported as a number to zero decimal places.
Mitigation/exceptions
None.
Common performance commitment
This is a bespoke measure.
Incentive type
Reputational.

AMP7 performance commitments and outcome delivery incentives: definition document 170
Price control allocation
Performance commitment for AMP7
In developing this measure we have identified our target level of maturity based on maintaining the
stretching performance we have already delivered in our systems thinking capability maturity.
Deadbands, caps and collars
Not applicable.
Outcome Delivery Incentive
Not applicable.
Outperformance/underperformance incentive rate
Not applicable.
Worked example
Not applicable
Long-term ambition
We have set an ambitious long term target, which assumes we achieve the stretching
outperformance in AMP7 that is underpinned by this ODI. We then expect to maintain and improve
upon our frontier leading position further into the future.
However we know through working with other sectors and those leading the way with a systems
thinking strategy that the levels of maturity will change over time as technology and industry
capability develops, much in the same way dynamic frontiers operate.
So, whilst the definitions have been fixed and assured for AMP7, a full review will need to be
undertaken to unlock the yet unknown benefits that will come from systems thinking in the next
decade. For example 10 years ago what is today assessed as only a level 1 may have been assessed
as a level 3.
Water resources
Water network+
Wastewater network+
Bioresources Residential
retail Business
retail Direct
procurement
NA NA NA NA NA NA NA
Unit AMP7
2020/21 2021/22 2022/23 2023/24 2024/25
Capability
Maturity
Level
1 2 2 2 2

AMP7 performance commitments and outcome delivery incentives: definition document 171
Successful delivery of direct procurement of Manchester and
Pennine resilience (E07-DP)
Purpose of this measure
This performance commitment measures the progress of United Utilities in implementing the Direct
Procurement for Customers (DPC) process to support the appointment of a competitively appointed
provider (CAP) to design, build, finance and maintain the Haweswater Aqueduct Resilience
Programme (previously referred to as the “Manchester and Pennines Resilience” scheme.)
Progress is measured against the satisfactory delivery of three key DPC control points. These are the
Strategic Outline Case (SOC), the Outline Business Case (OBC) and the Full Business Case (FBC).
These need to be successfully delivered to allow the scheme to progress to the point where a CAP
can be appointed.
Benefits of this measure
This performance commitment incentivises the timely and effective completion of the procurement
process to deliver a scheme to improve resilience of treated water supplies to 2.5 million people and
200,000 businesses customers in Greater Manchester, Cumbria and Lancashire. In doing this under
DPC it is expected to bring financial savings and innovation.
In order for a project to proceed under DPC, Ofwat guidance requires the demonstration that the
project and delivery approach provide best value for money for customers. It is anticipated that
customers will benefit through innovation and lower whole life costs from outsourcing the delivery
of infrastructure projects using DPC.
Measure description
This measure assesses whether United Utilities has been able to utilise a “Direct Procurement for
Customers” approach to procuring a solution for the HARP programme, based on a series of target
dates.
Where United Utilities successfully completes an agreed procurement process and, following
approval by Ofwat, awards the HARP scheme to a competitively appointed provider (CAP) such that
the contract is signed and fully effective in accordance with its terms, it would be entitled to receive
an incentive payment which would reflect the size and complexity of the HARP scheme and the
procurement undertaken.
Measure definition
This performance commitment is designed to generate an outperformance payment of £5.74m
payable if the contract award of the HARP scheme to the CAP, occurs prior to 1 May 2023. The full
value of outperformance payment will be payable if the contract award of the HARP scheme to the
CAP, occurs prior to 1 May 2023. The payment will be zero if the contract is awarded after 1 May
2023.
Where United Utilities will develop and carry out a procurement process as agreed with Ofwat and
award a contract to a CAP to deliver HARP scheme. In general, the process comprises of United
Utilities competitively tendering for a third-party to design, build, finance, and maintain the scheme.
It is anticipated that customers will benefit through innovation and lower whole life costs from
outsourcing the delivery of infrastructure projects using DPC.

AMP7 performance commitments and outcome delivery incentives: definition document 172
Ofwat will, when the Full Business Case (FBC) is formally submitted for approval, assess whether the
scheme meets the qualifying criteria for the procurement of the scheme by way of a direct
procurement for customers process.
At the FBC submission Ofwat shall consider all relevant information. This shall include the ‘Principles
applying to the DPC procurement process’ set out in Ofwat’s publication ‘Delivering Water 2020: Our
methodology for the 2019 price review, Appendix 9: Direct procurement for customers’ and as
maybe revised from time to time.
United Utilities shall not be eligible to receive the incentive payment prior to award of a contract to
a competitively appointed provider.
Further details are provided in PR19 DPC Technical Appendix Delivering Customer value in large
projects https://www.ofwat.gov.uk/publication/pr19-final-determinations-delivering-customer-
value-in-large-projects/
Measurement units
The performance commitment measures whether a competitively appointed provider is appointed
in circumstances where the direct procurement for customers scheme meets the qualifying criteria
(principles).
Achievement will be when a contract is signed and fully effective in accordance with its terms.
Mitigation/exceptions
None.
Common performance commitment
This is a bespoke measure.
Incentive type
Financial – revenue - outperformance payment only.
Price control allocation
Performance commitment for AMP7
We are committed to successfully delivering a direct procurement contract with contract award by
1st May 2023.
Unit AMP7
2020/21 2021/22 2022/23 2023/24 2024/25
Contract award In progress In progress In progress
1st May
2023
contract
award
(signed and
fully
effective)
NA
Water resources
Water network+
Wastewater network+
Bioresources Residential
retail Business
retail Direct
procurement
0% 100% 0% 0% 0% 0% 0%

AMP7 performance commitments and outcome delivery incentives: definition document 173
Deadbands, caps and collars
There are no deadbands, caps, or collars associated with the measure.
Outcome Delivery Incentive
This measure is subject to an outperformance financial incentive, which will be reconciled annually
on an in-period basis.
Outperformance/underperformance incentive rate
The incentive rate for this outcome delivery incentive is £5.740m.
Long-term ambition
This is a bespoke, one-off measure relating to a particular project.

AMP7 performance commitments and outcome delivery incentives: definition document 174
Customers say that we offer value for money (E09-HH)
Purpose of this measure
This performance commitment is designed to incentivise the company to deliver a water and
wastewater service that represents value for money for customers.
Benefits on this measure
Assessing customer views on value for money is an important factor in understanding drivers of
legitimacy with customers and in ensuring that the quality of service provided to customers
continues to improve.
Measure Description
This measure assesses the percentage of household customers that provide a positive response that
United Utilities provides value for money.
Value for money performance is assessed from the results of customer surveys that ask United
Utilities residential customers “How satisfied are you with value for money of water and sewerage
services in your area?”
Positive responses occur if the customer states that United Utilities provides value for money.
Neutral or negative responses will be judged as United Utilities does not provide value for money
these responses do not count towards this measure.
Measure Definition
In implementing the survey, we will:
Align the survey methodology to existing cross sector research conducted by CCWater;
Receive external assurance that the survey methodology is conducted in line with social
research best practice;
Conduct the survey at least annually and report results;
Ensure the survey sample size is sufficiently large to ensure a statistically robust result; and
The methodology is likely to remain unchanged for the duration of the performance commitment,
however if changes in question structure or methodology are required in period, we will consult with
our independent CCG, YourVoice and Ofwat before implementing changes.
The performance commitment figure captures the average of all responses throughout the reporting
year.
Measurement units
Measured annually as the percentage of household customers (as surveyed) reported to zero
decimal places.
Mitigation/exceptions
None – any variations that occur through the process of customer research will be accepted by us as
being within the allowed margins of error.
Common performance commitment
This is a bespoke measure.
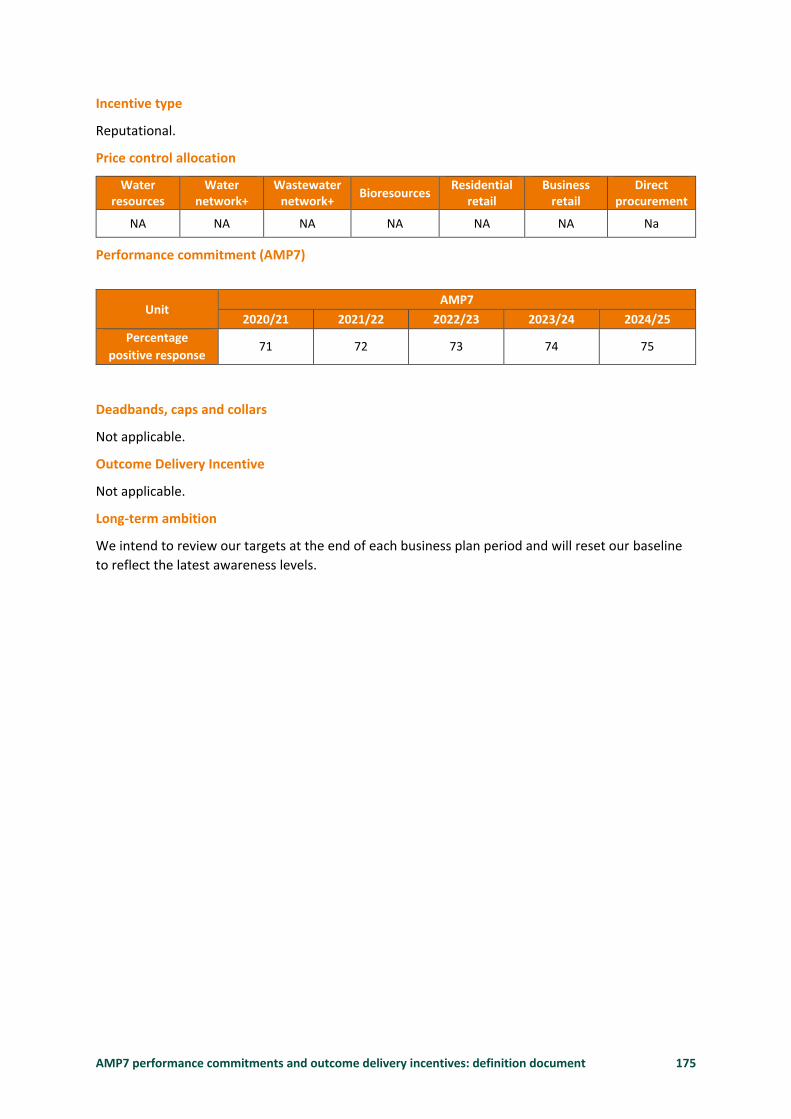
AMP7 performance commitments and outcome delivery incentives: definition document 175
Incentive type
Reputational.
Price control allocation
Water resources
Water network+
Wastewater network+
Bioresources Residential
retail Business
retail Direct
procurement
NA NA NA NA NA NA Na
Performance commitment (AMP7)
Deadbands, caps and collars
Not applicable.
Outcome Delivery Incentive
Not applicable.
Long-term ambition
We intend to review our targets at the end of each business plan period and will reset our baseline
to reflect the latest awareness levels.
Unit AMP7
2020/21 2021/22 2022/23 2023/24 2024/25
Percentage
positive response 71 72 73 74 75

AMP7 performance commitments and outcome delivery incentives: definition document 176
Voids (E010-DP)
Purpose of this measure
This performance commitment is designed to incentivise the company to reduce the number of
residential void properties.
Benefits of this measure
Reducing the number of void properties, which are occupied but not billed, will result in fairer
charges between customers and lower bills for customers already paying.
Measure description
This is the number of household properties classified as void as a percentage of the total number of
household properties served by the company.
Measure definition
Void properties are defined as properties, within the company’s supply area, which are connected
for either a water service only, a wastewater service only or both services but do not receive a
charge, as there are no occupants. Additionally a property connected for both services that is not
occupied, only counts as one void property.
The proportion of void properties will be measured as an average over the year. The same method
to calculate the average will be used each year.
Non-household properties are excluded from this performance commitment.
Measurement units
Percentage household properties classified as void, reported to two decimal places.
Mitigation/exceptions
None.
Common performance commitment
This is a bespoke performance commitment.
Incentive type
Financial – revenue adjustment - subject to outperformance and underperformance payments.
Price control allocation
Water resources
Water network+
Wastewater network+
Bioresources Residential
retail Business
retail Direct
procurement
0% 0% 0% 0% 100% 0% 0%
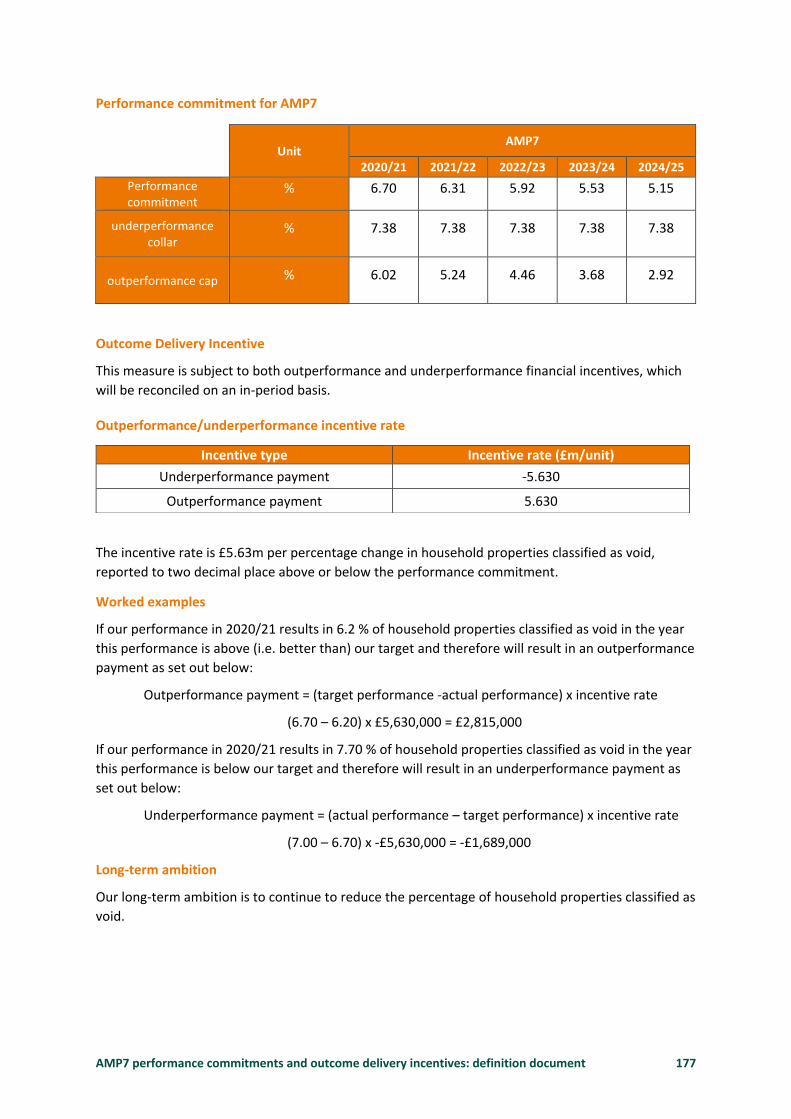
AMP7 performance commitments and outcome delivery incentives: definition document 177
Performance commitment for AMP7
Outcome Delivery Incentive
This measure is subject to both outperformance and underperformance financial incentives, which
will be reconciled on an in-period basis.
Outperformance/underperformance incentive rate
The incentive rate is £5.63m per percentage change in household properties classified as void,
reported to two decimal place above or below the performance commitment.
Worked examples
If our performance in 2020/21 results in 6.2 % of household properties classified as void in the year
this performance is above (i.e. better than) our target and therefore will result in an outperformance
payment as set out below:
Outperformance payment = (target performance -actual performance) x incentive rate
(6.70 – 6.20) x £5,630,000 = £2,815,000
If our performance in 2020/21 results in 7.70 % of household properties classified as void in the year
this performance is below our target and therefore will result in an underperformance payment as
set out below:
Underperformance payment = (actual performance – target performance) x incentive rate
(7.00 – 6.70) x -£5,630,000 = -£1,689,000
Long-term ambition
Our long-term ambition is to continue to reduce the percentage of household properties classified as
void.
Unit
AMP7
2020/21 2021/22 2022/23 2023/24 2024/25
Performance commitment
% 6.70 6.31 5.92 5.53 5.15
underperformance collar
% 7.38 7.38 7.38 7.38 7.38
outperformance cap % 6.02 5.24 4.46 3.68 2.92
Incentive type Incentive rate (£m/unit)
Underperformance payment -5.630
Outperformance payment 5.630

AMP7 performance commitments and outcome delivery incentives: definition document 178
Outcome F – We collect and recycle your wastewater
Customers rightly prioritise the removal of wastewater as a discrete service which should not interfere with their day-to-day lives. Operational issues such as blockages are the principle cause of incidents of surcharging drainage systems, which can lead to flooding and pollution incidents. There is strong customer and stakeholder support for reducing both flooding and pollution incidents which we will achieve through innovative technologies and planned programmes to proactively manage our risks.

AMP7 performance commitments and outcome delivery incentives: definition document 179
Sewer collapses (F01-WWN)
Purpose of this measure
This performance commitment is designed to incentivise that the asset health of the infrastructure,
or below-ground wastewater assets, are being appropriately maintained and improved and that the
company is committed to its asset stewardship responsibility.
Benefits of this measure
This performance commitment helps to ensure that the overall asset health of the below-ground
wastewater assets is maintained and improved for the benefit of current and future generations.
Measure description
This common performance commitment measures the number of sewer collapses per 1,000
kilometres of sewer causing an impact on service to customers or the environment.
This measure is easy for customers and stakeholders to understand enabling them to hold our
performance to account. This is particularly important as collapses are an indicator of asset health.
In AMP6 sewer collapses were measured as one of four elements comprising our network
performance index measure and one of seven elements of the private sewers service index. In AMP7
we are measuring sewer collapses as a stand-alone measure, aligning to Ofwat’s reporting guidance.
Measure definition
This common performance commitment measures the number of sewer collapses per 1,000
kilometres of all sewers causing an impact on service to customers or the environment. The sewer
length that will be applied throughout AMP7 should be based on the latest measurements of the
length, as published in the APR data table.
This measure seeks to reflect failures, due to structural weakness in the asset, causing an impact on
service to customers or the environment.
A sewer collapse is defined as a structural failure to a pipe which results in a loss of flow, causing a
service impact to a customer or the environment where action is taken to replace or restore the pipe
to reinstate normal service. The measure also includes rising mains.
The impact on service to customers is the loss of pass forward flow at the location of the collapse.
Where there has been no impact on a customer but there has been flooding or pollution there will
be deemed to have been an impact on the environment.
This measure includes all public sewer and lateral drains suffering collapses, inclusive of those
incidents that have also been reported as flooding or pollution failures, if the primary cause of the
flooding or pollution was a sewer collapse.
Multiple incidents on the same length of sewer (manhole to manhole/ valve to valve) count as a
single incident if all work is carried out as part of the same repair activity. This assumes that the
locations are in close proximity. This would not be the case if separate locations were more than
25m apart.
In line with the Ofwat guidance for this common measure, the definition is a move away from our
current classification of a collapse which uses a percentage deformation of 25%. This means that the
new measure is no longer directly comparable with the measure used in AMP6.

AMP7 performance commitments and outcome delivery incentives: definition document 180
Measurement units
Total number of sewer collapses per 1,000 kilometres of sewer, per financial year, reported to two
decimal places.
Mitigation/exceptions/assumptions
The primary test for whether a collapse is reportable is whether ‘normal service’ had been ‘reinstated’
before any excavation type repairs, external to any manhole chambers, were carried out and if the
pipework that United Utilities dig down to is actually defective.
As a point of clarity, any investigation showing a restriction of flow is still in situ or a leak from a sewer
pipes is still occurring, are clear demonstrations that normal service had not been reinstated.
The collapse measure is focused on failures of the pipe that cause an impact on customer service, with
the exception of those failures identified as excludable in the Ofwat guidance. These exclusions are
detailed below:
Proactively identified collapses – Should a collapse be found as a result of proactive activity
(survey or proactive sewer maintenance work) on the network unrelated to the reported
reactive activity to restore service then it is excluded. Proactive works in the main include
enhanced targeting, cyclic works (desilting, ancillary inspections etc.), ad hoc inspections,
planned flushing or any other attendance not instigated by a reactive report from
customers.
On some reactive incidents UU proactively CCTV survey sewer lengths upstream of a
blockage etc. to look for secondary blockages and any significant defects. Structural defects
found as part of this proactive activity, despite being found during a reactive attendance, will
be excluded from the measure.
Third party damage – Third party structural damage (including water utility damage) of the
sewer is not an indicator of asset health and hence is excluded. Examples of this type of
damage include third parties putting fence posts or sheet piles through a pipe or concrete
ingress.
Manhole damage, any pipework within a manhole and internal backdrops are excluded.
Where pipework replacement extends beyond internal manhole activity but done in
accordance with civil engineering best practice, such pipework replacement can be
excluded.
Repairs to or replacement of interceptor traps is excluded where the works is within the
manhole.
Displaced joints, cracked or fractured pipes, open joints, intruding connections, minor pipe
breaks and hard blockages do not reflect sufficiently significant structural failure hence are
excluded from the measure.
Where sewer defects can be repaired by no-dig techniques (e.g. sewer lining) these incidents
will be excluded from the measure.
Defects caused by tree root intrusion will be excluded from the measure unless it
necessitates the need for pipe replacement.
Excavation to access pipework to facilitate investigations or blockage removal is excluded.
All of the above shall be recorded as ‘non-reportable collapses’ and, with the exception of excavation to facilitate blockage removal, should not be captured under the blockage performance commitment.

AMP7 performance commitments and outcome delivery incentives: definition document 181
With regard to repeat incidents, if the company records a collapse incident at a specific location, then any subsequent serviceability incidents at the same location must automatically be recorded as a blockage (i.e. a defective pipe can’t collapse twice).
Common performance commitment
This is a common performance commitment developed by Ofwat for AMP7.
Incentive type
Financial – Underperformance payments.
Price control allocation
Performance commitment for AMP7
The graph below highlights the performance level that we have committed to deliver in AMP7.
Figure 26
0.00
5.00
10.00
15.00
20.00
25.00
30.00
35.00
40.00
2020/21 2021/22 2022/23 2023/24 2024/25
Nu
mb
er o
f co
llap
ses
per
10
00
km s
ewer
Underperformance Performance commitment
Water resources
Water network+
Wastewater network+
Bioresources Residential
retail Business
retail Direct
procurement
0% 0% 100% 0% 0% 0% 0%
Unit AMP7
2020/21 2021/22 2022/23 2023/24 2024/25
No. per 1,000 km of
sewer 15.51 14.90 14.29 13.68 13.07
AMP7 performance commitments and outcome delivery incentives: definition document 182
Outcome Delivery Incentive
This measure is subject to underperformance payments only, which will be reconciled annually on an
in-period basis.
Outperformance/underperformance incentive rate
The underperformance rate for this measure is £0.311m per normalised incident.
Worked examples
There are two possible incentive scenarios with this measure. These are an underperformance
payment and no payment. As this measure is set up for in-period payments, the payment is to be
calculated at the end of each year.
In 2022/23 our performance commitment is 14.29 and we actually achieve 16.56 collapses per
1,00km of sewer,
(16.59-14.29)*-£311,000 = -£715,300 underperformance
Long-term ambition
Our long-term ambition is to remove all collapses reported by customers. However, we are also keen
that this improvement should be achieved at the lowest possible cost to customers.
This long-term ambition will also have to consider and accommodate external factors beyond the
company’s control, such as climate change, population growth and changes to the industry &
customer behaviour as a result of the COVID-19 pandemic. We also need to appreciate the influence
of asset deterioration over the longer term and ensure that we adopt the correct delivery strategies
maintain service levels and operational resilience. As our understanding of the influence of these
factors evolves, our ambition may need to adapt, but we will always strive to achieve the best
service outputs for customers and ensure the environment is protected and enhanced.
AMP7 performance commitments and outcome delivery incentives: definition document 183
Sewer blockages (F02-WWN)
Purpose of this measure
The purpose of this performance commitment is to incentivise the company to reduce the number
of sewer blockages, which is a significant contributing factor to sewer flooding.
Benefits of this measure
The performance commitment will help reduce the number of sewer flooding incidents and
pollution incident. It will also improve customer service by reducing disruption.
Measure description
This measure counts the number of sewer blockages that have been reported and cleared.
Blockages are a major cause of flooding and pollution incidents. They are often caused by items
which should not be flushed. As such, it is important that our performance around this area is visible
to customers. Blockages can also be caused by other factors such as tree roots or sewer defects.
Measure definition
This performance commitment is allocated to the wastewater network plus price control and is subject
to outperformance and underperformance payments.
In AMP6 sewer blockages were measured as one of four sub-measures within the network
performance index and one of the sub-measures for the private sewers service index measures. We
recognised that index measures are complex for customers and stakeholders to understand and
therefore in AMP7 sewer blockages are a standalone measure that we have selected from Ofwat’s
the asset health long-list. We have adopted this as it is a leading indicator of sewer network
performance.
In assessing this measure we will use the following definition: -
A blockage is defined as an obstruction in the sewer that has been reported and cleared.
Blockages can be caused by a number of factors, including:
Fats, oils and greases
Siltation
Tree roots
Pipe defects and traps
Soft blockages/wipes
The influence of storm surcharge events and the settlement of solids etc. that they can cause.
This measure includes blockages on both our existing network and the network serving a property
connected to the network before 1st July 2011 (which transferred to UU ownership as part of the
private sewers transfer legislation on 1st October 2011). We will not include any blockages that we
identify through proactive cleaning or which were not reported to us by a customer or stakeholder.
Flooding caused by the blockage or failure of a gully that is shared by two or more properties and
connected to a public sewer shall be excluded. Likewise, the blockage of the gully grating, or the
failure of any pipework above ground.

AMP7 performance commitments and outcome delivery incentives: definition document 184
Blockages will be included which occur on any type of sewer or the on the following sewer apparatus
- combined sewer overflows, traps, flow control devices, manholes, penstocks, pipebridges, rising
mains, manholes, backdrops, rodding eyes, storage tanks and syphons.
Measurement units
Measured annually as the number of sewer blockages that have been reported and cleared. This is
reported to zero decimal places.
Mitigation/exceptions
Notable exclusions from this reporting definition are:
Proactively cleaned silt or other blockages that are removed which are not reported to us by
customers or stakeholders and have no customer impact are excluded from this measure.
Blockages cleared by third party contractors. These shall be assumed to have been on
private drain lines unless demonstrated otherwise and as such are not reportable.
Silt and tree roots removed as part of a customer reported incident, but that did not
constitute a blockage in the sewer.
Blockages caused by upstream defects on private drains that reduce resuspension flow, bulk
convey material (e.g. a private line pipe “belly” that conveys a “rag sausage” or uncapped
road gulleys that convey matter into public sewers) or ground material.
Any pump blockage, as a pump is not an in-line sewer asset/apparatus identified within the
measure definition.
Any FOC blockage that occurs as a direct result of a greater than 1 in 100 year storm event.
These are legitimately recorded as a hydraulic severe weather events, as the likelihood in
such a storm is that the flooding would have occurred anyway, regardless of the presence of
any silt or blockage material. This is because the sewer is not designed to operate with such
volumes of run off.
In line with Ofwat flooding guidance, blockages in shared gulleys serving property built and
connected to the sewer network before 01/07/2011 shall be recorded but are not
reportable.
Incidents caused by systematic repeat customer abuse where those customers have been
continually advised/ warned about their discharge behaviours and the resultant blockage
risk are not included.
Sewer incidents that qualify as “non-reportable” sewer collapses as per the Ofwat collapse
definition as these are not necessarily blockages by default.
Evidence of any exclusions must be stored and saved on to the INS system.
Conversely, notable inclusions are:
Blockages caused by material that we are not bound to receive (e.g. bricks, balls, toys,
rubble, refuse etc.). These must be reported as a blockage where we are unable to apply one
of the exclusions above.
Blockages that are as a result of third party interference unless cause by a wilful or highly
negligent act (e.g. a person deliberately pouring concrete into the sewer). This includes
blockages as a result of breaches of building regulations or the Highways Act and Land
Drainage Act.

AMP7 performance commitments and outcome delivery incentives: definition document 185
With regard to repeat incidents, if the company records a collapse incident at a specific location but
fails to carry out repairs before a subsequent serviceability event occurs, then any subsequent
serviceability incidents at the same location must automatically be recorded as a blockage (i.e. a
defective pipe can’t collapse twice).
Common performance commitment
This is a bespoke measure from the asset health long list.
Incentive type
Financial – outperformance and underperformance payments.
Price control allocation
Performance commitment for AMP7
Our blockage performance over the long term, along with the customer research supporting
improvements in this area, led to us setting a stretching performance commitment for AMP7.
Figure 27
15,000
17,000
19,000
21,000
23,000
25,000
27,000
29,000
31,000
33,000
2020/21 2021/22 2022/23 2023/24 2024/25
Nu
mb
er o
f se
wer
blo
ckag
es t
hat
hav
e b
een
rep
ort
ed a
nd
cle
ared
Underperformance Outperformance Underperformance collar
Performance commitment Outperformance cap
Water resources
Water network+
Wastewater network+
Bioresources Residential
retail Business
retail Direct
procurement
0% 0% 100% 0% 0% 0% 0%
Unit AMP7
2020/21 2021/22 2022/23 2023/24 2024/25
Number 20,664 20,328 19,992 19,656 19,320

AMP7 performance commitments and outcome delivery incentives: definition document 186
Deadbands, caps and collars
Outcome Delivery Incentive
This measure is subject to both outperformance and underperformance payments, which are
reconciled annually on an in-period basis.
Outperformance/underperformance incentive rate
The rate for both out and under performance is £1,400 per blockage.
Worked examples
The incentive rate for this measure is £1,400 per blockage variation from the performance
commitment target and applies equally to both outperformance and underperformance.
Example 1:
The performance commitment for 2020/21 is 20,664 blockages. Should we finish that year on 19,500
blockages, there would be an outperformance payment of £1,629,600. This is calculated as follows:
(Performance commitment – actual performance) x outperformance rate
= (20,664 – 19,500) x £1,400 = £1,629,600
Example 2:
The performance commitment for 2022/23 is 19,992 blockages. Should we finish that year on 20,800
blockages, there would be an underperformance payment of £1,131,000. This is calculated as
follows:
(Actual performance – performance commitment) x underperformance rate
= (20,800 – 19,992) x -£1,400 = -£1,131,200
Long-term ambition
In the long-term, we aim to continue to significantly reduce the number of blockage incidents and
maintain our industry frontier performance position. To achieve this will require significant
innovation and investment, which we plan to manage effectively across the following Business Plan
Periods to ensure it is affordable to customers. It will also require an influence of customer
behaviours, leading to a cultural change in the long term to reduce the risk in an incremental way
over a number of Business Plan Periods. The reduction in blockage incidents is dependent on the
delivery of this investment.
This long term ambition will also have to consider and accommodate external factors beyond the
company’s control, such as climate change, population growth and changes to the industry &
customer behaviour as a result of the COVID-19 pandemic. We also need to appreciate the influence
of asset deterioration over the longer term and ensure that we adopt the correct delivery strategies
maintain service levels and operational resilience. As our understanding of the influence of these
2020/21 2021/22 2022/23 2023/24 2024/25
Outperformance cap Number 17,505 17,220 16,935 16,651 16,366
Underperformance collar
Number 30,996 30,996 30,996 30,996 30,996

AMP7 performance commitments and outcome delivery incentives: definition document 187
factors evolves, our ambition may need to adapt, but we will always strive to achieve the best
service outputs for customers and ensure the environment is protected and enhanced.
If innovations developed through Dynamic Network Management (DNM), such as enhancement
monitoring, “Stop the Block” campaigns and improved hot-spotting yield greater than expected
benefits we hope to outperform our long-term targets. However, there are uncertainties in these
new approaches, and if they turn out to be less successful than we had hoped we may need more
physical interventions over a longer period of time and at higher cost.

AMP7 performance commitments and outcome delivery incentives: definition document 188
Outcome G – The risk of sewer flooding for homes and businesses is
reduced
Sewer flooding is one of the worst service failures that customers can experience and we understand the significant long-term impact flooding can have on customers in the North West. Customers want us to reduce flooding incidents that occur and our long-term aspiration is to eliminate internal flooding incidents.
AMP7 performance commitments and outcome delivery incentives: definition document 189
Risk of sewer flooding in a storm (G01-WWN)
Purpose of this measure
This performance commitment is designed to incentivise companies to reduce the number of
properties at risk of flooding in a storm. The performance commitment is also designed to
encourage companies to develop a better understanding of the flood risks within their regions
through improved quality and coverage of models.
Benefits on this measure
Reduction of flood risk during storm events protects customers and the environment from the
disruption and costs associated with flood events. Improved understanding of the risk of flooding to
our customers will support our long-term drainage planning processes. This will have a positive impact
on the cost of flood resilience for customers through a better understanding of flood risk.
Measure description
The aim of this common measure is to understand the percentage of population at risk of internal
hydraulic sewer flooding in a 1 in 50 year storm. The targeted reduction of percentage at risk across
AMP7 is influenced significantly by population growth and maintaining adequate supply and demand
of the network. There may also be contribution in improved performance via our internal hydraulic
flood risk resilience measure (G05-WWN).
Measure definition
This measure records the percentage of the region’s population at risk from internal hydraulic
flooding from a 1 in 50 year storm, based on modelled predictions. The recording and reporting
methodology developed by the industry offered two modelling methods for calculating the
percentage of population at risk: a one dimensional (1D) or a two dimensional (2D) approach. We
have chosen to utilise our regional and more detailed 2D model coverage that was used to develop
our AMP6 future flood risk measure. This method provides a more accurate projection of areas likely
to flood as it considers the volume of flooding as well as the extent, identifying where flood water is
likely to pool. It is also worth noting that most of our drainage areas, including those that are
relatively small, are predominantly drained by combined systems and therefore qualify for the full
assessment required in the methodology.
There is no specific guidance within the methodology on whether this measure is to include internal,
external or both forms of flooding. We know from our extensive customer research that internal
flooding is one of the worst service failures customers can experience. This research, along with
cross-industry conversations held at the Water UK Sewer Infrastructure Network group, has led us to
prioritise risk from internal flooding only under this measure.
Flood depth was not specified in the methodology to guide when a property would be considered
affected when using the 2D modelling approach. To account for both newer development
regulations for a level door threshold and older developments with a higher threshold as well as
considering the height of airbricks, a 5mm threshold was applied to the modelling results. Following
additional industry guidance we have reduced this figure to a threshold of >0mm.
In summary, our assumptions are:
Properties modelled to be affected by internal flooding are included

AMP7 performance commitments and outcome delivery incentives: definition document 190
A 0mm threshold depth is applied, only when this is exceeded is a property deemed affected
Only buildings classed as a ‘dwelling’ have been included
All properties within a high-rise block are included
As this is a common measure, the model criteria has been defined centrally. The model simulates a 1
in 50 year storm for both summer and winter scenarios under three time durations; 60, 240 and 480
minutes. The percentage of the population at risk will be calculated based on the worst case
modelled results.
A property would be considered affected if modelled flooding from a manhole or gully reaches the
actual property building. An occupancy rate is then applied to the affected property to determine
the population equivalent. Occupancy rates were calculated based on the outputs from the Edge
Analytics report. We commissioned Edge Analytics to provide a long-term population forecast for the
region, allocating households and population data to wastewater treatment works drainage areas up
until 2045. Edge Analytics is a specialist in democratic analysis and forecasting, providing evidence to
support planning and policy development across a range of industry sectors. Occupancy rates are
assessed for each catchment to ensure the variation in our region is accounted for and accurately
assesses the differences in population density. As the calculations which have set the targets for this
measure are based on forecasted population data, the performance for this measure will be
recalculated annually once actual figures are available.
We had to prioritise activities associated with this measure due to the late nature of the guidance.
We focused on applying the 2D modelling approach to a spot sample of catchments which our
engineering experts considered to represent the variation in environmental and social factors across
our region. The outputs have then been extrapolated up to calculate the regional percentage at risk.
Models will be re-run towards the end of AMP7 for the entire region to account for the catchment
vulnerability assessments which have not been applied to the sample set.
https://www.ofwat.gov.uk/wp-content/uploads/2017/12/Developing-and-Trialling-Wastewater-
Resilience-Metrics-Atkins.pdf
Measurement units
This measure is represented as the percentage of the population considered to be at risk from
internal flooding in a 1 in 50 year storm. We calculate and reported this measure on an annual basis
to two decimal places.
Mitigation/exceptions/assumptions
As set out above, on the basis of our customer research we have excluded external flooding in this
measure.
Common performance commitment
This is a common performance commitment developed by Ofwat for AMP7.
Incentive type
This is a reputational measure.
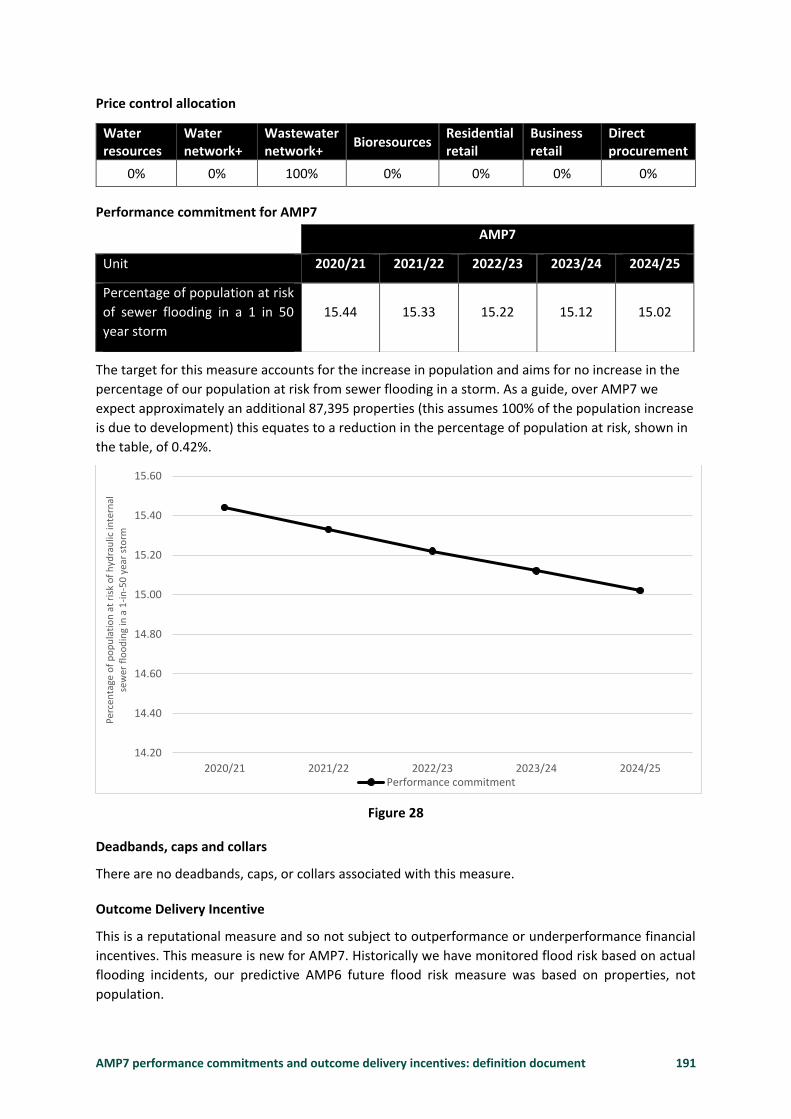
AMP7 performance commitments and outcome delivery incentives: definition document 191
Price control allocation
Performance commitment for AMP7
The target for this measure accounts for the increase in population and aims for no increase in the
percentage of our population at risk from sewer flooding in a storm. As a guide, over AMP7 we
expect approximately an additional 87,395 properties (this assumes 100% of the population increase
is due to development) this equates to a reduction in the percentage of population at risk, shown in
the table, of 0.42%.
Figure 28
Deadbands, caps and collars
There are no deadbands, caps, or collars associated with this measure.
Outcome Delivery Incentive
This is a reputational measure and so not subject to outperformance or underperformance financial
incentives. This measure is new for AMP7. Historically we have monitored flood risk based on actual
flooding incidents, our predictive AMP6 future flood risk measure was based on properties, not
population.
14.20
14.40
14.60
14.80
15.00
15.20
15.40
15.60
2020/21 2021/22 2022/23 2023/24 2024/25
Per
cen
tage
of
po
pu
lati
on
at
risk
of
hyd
rau
lic in
tern
al
sew
er f
loo
din
g in
a 1
-in
-50
yea
r st
orm
Performance commitment
Water resources
Water network+
Wastewater network+
Bioresources Residential retail
Business retail
Direct procurement
0% 0% 100% 0% 0% 0% 0%
AMP7
Unit 2020/21 2021/22 2022/23 2023/24 2024/25
Percentage of population at risk
of sewer flooding in a 1 in 50
year storm
15.44 15.33 15.22 15.12 15.02

AMP7 performance commitments and outcome delivery incentives: definition document 192
Throughout AMP6 we have invested in maintaining and updating our hydraulic sewer models to
ensure that the predictive outputs they produce are verifiable against historical data. We will
continue to update our models throughout AMP7 and will supplement their verification using
historic incident data along with level data from the Dynamic Network Management monitors
(DNM) and the spill information from the event duration monitors (EDM) installed this AMP.
The risk of flooding in a storm measure is part of a wider suite of performance commitments which
monitor flooding performance, with the rest of the measures being financially incentivised. This,
along with the fact that the measure is new for AMP7, demonstrates the appropriateness at this
time of having the measure as reputational.
Outperformance / underperformance incentive rate
This is a reputation only measure.
Worked examples
The example below is based on the methodology being employed following FY20 Reporting. Prior to
this, the updated model outputs were not available and was carried out through an extrapolation.
Following FY20, the method is fully consistent with the Ofwat method. The calculation is based on
running the method shown in the diagram below.

AMP7 performance commitments and outcome delivery incentives: definition document 193
Figure 29

AMP7 performance commitments and outcome delivery incentives: definition document 194
Long-term ambition
We recognise that sewer flooding is a dreadful experience for any customer. Our long-term ambition
is to minimise the risk of hydraulic flooding incidents that impact customer properties. This measure
will be used in conjunction with the other flood measures as a driver to tackle flooding proactively
and consider where flooding is likely to occur even if there is no history. Investing in hydraulic
flooding solutions is expensive and we continue to work with the supply chain to seek more
innovative approaches. These include things like integrated catchment schemes with partnership
organisations and working with developers on sustainable urban drainage schemes (SUDS). That
said, to manage the impact of achieving this long-term ambition we plan to do this at an affordable
rate for customers and so propose to phase the improvements across the next few investment
periods. We plan to achieve this through managing supply and demand on the network as the
region’s population continues to grow and climate change impacts on the frequency of extreme
events
We strive for our models to be as up to date as possible, our ultimate goal is for 100% 2D model
coverage across the region. We will continue to strive for increased accuracy through fully verified
models to ensure model outputs are as representative as possible. As this improves so will the level
of confidence in the outputs produced for the calculation of this measure.
AMP7 performance commitments and outcome delivery incentives: definition document 195
Internal sewer flooding (G02-WWN)
Purpose of this measure
This performance commitment is designed to incentivise companies to reduce the number of
internal sewer flooding incidents.
Benefits of this measure
A reduction in internal sewer flooding, which is one of the worst service failures customers can
experience.
Measure description
The measure aligns to the common measure that was proposed by Ofwat for AMP7, it is a count of
the number of internal flooding incidents to have occurred each financial year, normalised per
10,000 sewer connections.
The measure focusses on the customer priority of internal sewer flooding, we recognise this is an
important issue for customers and we are striving to improve in performance and are actively
exploring new ways to solve sewer flooding incidents.
In AMP6, we measured internal flooding using two measures; the sewer flooding index measure and
the private sewers service index measure. Properties flooded for hydraulic inadequacy, flooding
other causes and repeat incidents were three of the five elements comprising the sewer flooding
index measure that look across our non-transferred asset base. On the transferred network, internal
flooding of properties was measured as part of the private sewers service index measure. In AMP7,
we are measuring all internal flooding incidents (existing and transferred assets), irrespective of
cause, as a single measure. This measure is easy for customers to understand and as a common
industry measure it will be possible to ensure alignment of the measure with the rest of the industry.
However, further work and industry calibration is required to ensure full compliance with the
findings of the Ofwat horizontal audit.
Measure definition
This measure counts the number of internal flooding incidents occurring each financial year. This
includes incidents on both existing and transferred assets from both hydraulic and flooding other
causes.
As set out in the guidance for the common measure, in reporting internal flooding we are using the
following definitions:
Internal flooding is defined as flooding which enters a building or passes below a suspended
floor. In this context, buildings are defined as those normally used for residential, public,
community, commercial, business or industrial purposes.
If a property floods internally and externally, only the internal flooding is counted. This
means that the incident would be included in this measure but the external incident would
not be included in the corresponding external measure (G03-WWN).
This measure is a count of incidents not events, for example, if three properties flood during
one event, this will count as three incidents.
Flooding due to third party actions that cause sewer damage and subsequent flooding are
included in all cases.

AMP7 performance commitments and outcome delivery incentives: definition document 196
Damp patches caused by seepage through walls or floors are excluded, but any area which
has visible standing or running water or which has visible deposits of silt or sewage solids is
included.
Severe weather incidents are included in this measure. This adds a significant level of
volatility to the number of reported incidents.
The industry guidance document which outlines all of these points can be found at:
https://www.ofwat.gov.uk/wp-content/uploads/2018/03/Reporting-guidance-sewer-flooding-
updated-April-2018.pdf
Measurement units
This measure is reported as the number of internal sewer flooding incidents which occur in each
financial year to two decimal places per 10,000 sewer connections. We also report an absolute value
for flooding each financial year in our supporting commentary.
Mitigation/exceptions/assumptions
The measure is intended to be consistent with the industry converged flooding methodology at any
given time of reporting.
Notable exclusions from this measure are:
Damp patches caused by seepage through walls or floors are excluded. However, any area
which has visible standing or running water or which has visible deposits of silt or sewage
solids is included.
Any standing or running water that has been generated through the fully attributable source
of flooding investigation work, such as dye testing.
Incidents where flooded rivers and watercourses etc. inundate the public sewers and cause
internal/external flooding of individual properties. These incidents are legitimately excluded,
as they were caused by fluvial flooding.
Incidents where watercourses are inappropriately connected to the sewer, leading to flow
from the surcharging watercourse entering a combined sewer (effectively acting like a reverse
CSO). In this instance, the water causing/exacerbating the flooding did not originate from a
public sewer.
Incidents where land drainage, or surface water runoff, is found to have overwhelmed the
available headroom in the sewers (that were not designed to deal with the additional water)
resulting in sewer networks surcharging and generating subsequent flooding.
Incidents where burst water mains and private services generate flows that nearby sewers
and drains were not designed to convey, resulting in the sewer network becoming
overwhelmed and generating subsequent flooding.
Flooding caused by upstream defects on private drains that reduce resuspension flow, bulk
convey material (e.g. a private line pipe “belly” that conveys a “rag sausage” or uncapped road
gulleys that convey matter into public sewers) or ground material.
Incidents where unauthorised third party contractors work on private systems or the public
network and their actions result in flooding from a public sewer asset.
Incidents where flooding occurs specifically due to vehicle movements, within the highway,
through sewer flood water and the “bow wave” results in flooding of a property.
Further details of allowable exclusions can be found in the Ofwat guidance note linked above.

AMP7 performance commitments and outcome delivery incentives: definition document 197
Common performance commitment
This is a common performance commitment developed by Ofwat for AMP7.
Incentive type
Financial – outperformance and underperformance payments.
Price control allocation
Performance commitment for AMP7
In line with Ofwat’s PR19 methodology and upper quartile target has been set for each year of the
period, which are outlined in the table below.
Unit
AMP7
2020/21 2021/22 2022/23 2023/24 2024/25
Number 1.69 1.63 1.58 1.44 1.34
The graph below highlights our AMP7 performance commitment for this measure. This measure is
very challenging for us to achieve and will require a step change in performance for us as we are
perceived to be an industry outlier.
Figure 30
0.00
0.50
1.00
1.50
2.00
2.50
3.00
3.50
4.00
4.50
2020/21 2021/22 2022/23 2023/24 2024/25
Nu
mb
er o
f in
tern
al f
loo
din
g in
cid
ents
th
at h
ave
occ
urr
ed in
ea
chfi
nan
cial
yea
r p
er 1
0,0
00
co
nn
ecti
on
s
Outperformance Underperformance
Water resources
Water network+
Wastewater network+
Bioresources Residential
retail Business
retail Direct
procurement
0% 0% 100% 0% 0% 0% 0%
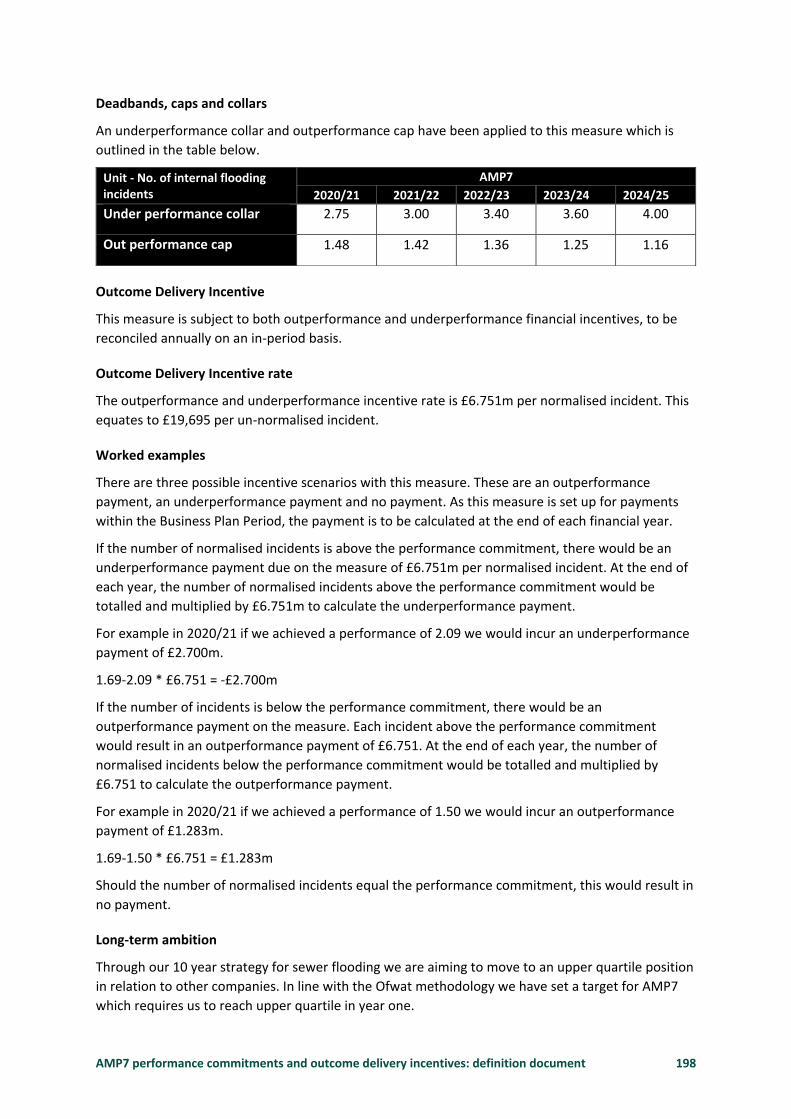
AMP7 performance commitments and outcome delivery incentives: definition document 198
Deadbands, caps and collars
An underperformance collar and outperformance cap have been applied to this measure which is
outlined in the table below.
Outcome Delivery Incentive
This measure is subject to both outperformance and underperformance financial incentives, to be
reconciled annually on an in-period basis.
Outcome Delivery Incentive rate
The outperformance and underperformance incentive rate is £6.751m per normalised incident. This
equates to £19,695 per un-normalised incident.
Worked examples
There are three possible incentive scenarios with this measure. These are an outperformance
payment, an underperformance payment and no payment. As this measure is set up for payments
within the Business Plan Period, the payment is to be calculated at the end of each financial year.
If the number of normalised incidents is above the performance commitment, there would be an
underperformance payment due on the measure of £6.751m per normalised incident. At the end of
each year, the number of normalised incidents above the performance commitment would be
totalled and multiplied by £6.751m to calculate the underperformance payment.
For example in 2020/21 if we achieved a performance of 2.09 we would incur an underperformance
payment of £2.700m.
1.69-2.09 * £6.751 = -£2.700m
If the number of incidents is below the performance commitment, there would be an
outperformance payment on the measure. Each incident above the performance commitment
would result in an outperformance payment of £6.751. At the end of each year, the number of
normalised incidents below the performance commitment would be totalled and multiplied by
£6.751 to calculate the outperformance payment.
For example in 2020/21 if we achieved a performance of 1.50 we would incur an outperformance
payment of £1.283m.
1.69-1.50 * £6.751 = £1.283m
Should the number of normalised incidents equal the performance commitment, this would result in
no payment.
Long-term ambition
Through our 10 year strategy for sewer flooding we are aiming to move to an upper quartile position
in relation to other companies. In line with the Ofwat methodology we have set a target for AMP7
which requires us to reach upper quartile in year one.
Unit - No. of internal flooding incidents
AMP7
2020/21 2021/22 2022/23 2023/24 2024/25
Under performance collar 2.75 3.00 3.40 3.60 4.00
Out performance cap 1.48 1.42 1.36 1.25 1.16

AMP7 performance commitments and outcome delivery incentives: definition document 199
Given the level of reduction required, we recognise that this is extremely stretching and therefore
we are likely to only achieve upper quartile over a 10 year period. However we are striving to
achieve this level of service to customers as soon as possible through innovations set out in the 10
year plan.
In the longer term, we aim to prevent all internal flooding incidents, within our control, i.e. due to
operational causes. Additionally it is our aspiration to create sufficient network capacity, through
storage provision and SW discharge reduction, to reduce the risk of flooding posed by severe
weather. To achieve this will require significant innovation and investment, which we plan to
manage effectively across the following Business Plan Periods to ensure it is affordable to customers.
It will also require an influence of customer behaviours, leading to a cultural change in the long term
to reduce the risk in an incremental way over a number of Business Plan periods. The reduction in
flooding incidents is dependent on the delivery of this investment.
We will also continue to work with Ofwat on improving common definitions and promoting further
consistency of reporting. Both of these will benefit activities will benefit customers over the longer
term.

AMP7 performance commitments and outcome delivery incentives: definition document 200
External sewer flooding incidents (G03-WWN)
Purpose of this measure
This performance commitment is designed to incentivise companies to reduce the number of
external sewer flooding events.
Benefits of this measure
A reduction in the number of external sewer flooding incidents reduces disruption and other
negative social impacts for customers.
Measure description
This measure counts the number of external flooding incidents, which occur each financial year. An
external flooding incident is defined as flooding within the curtilage of a building normally used for
residential, public, community or business purposes. It includes any buildings in those curtilages
which do not comply with the definition for internal flooding e.g. sheds, detached garages or
attached garages with no door access to the living accommodation. A flooding incident is defined as
an event of external flooding from a public or transferred sewer (whether foul, combined or surface
water).
Measure definition
This performance commitment is allocated to the wastewater network plus price control and is
subject to outperformance and underperformance payments.
In AMP6 we monitored external flooding as a sub-measure within our sewer flooding index. We
recognised that index measures can be complex for customers and stakeholders to understand.
Therefore in AMP7 we are measuring external flooding as a standalone measure that we have
selected from Ofwat’s asset health long list.
In assessing this measure we define external flooding as flooding within the curtilage of a building
that is normally used for residential, public, community or business purposes. It includes buildings in
those curtilages which do not comply with the definition for internal flooding e.g. sheds, detached
garages or attached garages with no door access to the living accommodation.
A flooding incident is defined as an event of external flooding from a public or transferred sewer
(whether foul, combined or surface water). The following areas are included in the reported
numbers for external flooding:
Buildings where the prime purpose is not habitation or occupied business premises
Farms, golf clubs etc.
Flooding of the immediate curtilage of the main buildings (gardens, patios etc.)
The following areas are excluded from the reported numbers for external flooding:
Highways – including footpaths
Public open spaces - agricultural land, car parks.
Below are some examples to show how we will count external flooding incidents:
In the case of a flooding event affecting an area in the same ownership, such as an industrial
park, retail park, hospital site, university site etc., this will be counted as one incident.

AMP7 performance commitments and outcome delivery incentives: definition document 201
Where a property floods both internally and externally during the same event it is only
recorded as an internal flooding incident.
Flooding due to third party actions that cause sewer damage and subsequent flooding are
included in all cases. However, flooding as direct result of inundation will be excluded.
Damp patches caused by seepage through walls or floors is excluded, but any area which has
visible standing or running water or which has visible deposits of silt or sewage solids is
included.
In the example below a street has been affected by a flooding event.
Figure 31 - Example of internal and external flooding event scenario
One property has flooded externally only within the curtilage of the property.
One property has flooded externally within the curtilage of the property and internally.
The road has flooded.
This event counts as one external flooding incident. This is because the property that has flooded
both internally and externally would be counted as an internal flooding incident and contribute
towards the separate internal flooding measure, the highway flooding on the road is excluded as this
doesn’t count towards either the internal or the external measure. Therefore, only property one
contributes towards this external flooding measure.
Following the recent industry horizontal audit, we consider that there remains inconsistency across
water companies in terms of the levels of investigation applied to establish the true extent of any
individual flood event. From this process we believe that our methodology is robust however we
know there are inconsistencies in reporting approach across the industry. Examples of this include
differing operating models/contractor usage and the approach companies adopt to reactively
identify flooded properties (i.e. those in neighbouring properties, as opposed to the properties
proactively identified by the customer contact). However, we are committed to industry workshops
that were recommended from the horizontal audit carried out early 2018.
Currently comparison of flooding incident performance across the industry is difficult due to
companies using differing methodologies, definitions and measurement metrics. We will continue to
work with Ofwat and across the industry to ensure that the performance data that we report is as
comparable as possible with that provided by other companies. The current industry guidance on
external flooding can be found at the link below.

AMP7 performance commitments and outcome delivery incentives: definition document 202
https://www.ofwat.gov.uk/wp-content/uploads/2018/03/Reporting-guidance-sewer-flooding-
updated-April-2018.pdf
Our sewer flooding process has developed over a number of years from lessons learned and is under
continual review to confirm it remains up to date, customer focused and robust to ensure flooding
incidents are accurately recorded. We believe this is an industry leading process and we will
continue to investigate and report to this methodology in AMP7.
Measurement units
Measured as the number of external flooding incidents that have occurred in each financial year,
reported to zero decimal places.
Mitigation/exceptions/ assumptions
Notable exclusions from this measure are:
Flooding of external spaces not within the curtilage of a property are excluded i.e. roads,
fields.
Flooding caused by the failure of equipment (i.e. a citiflex unit) after the sewage has already
exited the network system.
Damp patches caused by seepage through walls or floors are excluded. However, any area
which has visible standing or running water or which has visible deposits of silt or sewage
solids is included.
Any standing or running water that has been generated through the fully attributable source
of flooding investigation work, such as dye testing.
Incidents where flooded rivers and watercourses etc. inundate the public sewers and cause
internal/external flooding of individual properties. These incidents are legitimately excluded,
as they were caused by fluvial flooding.
Incidents where watercourses are inappropriately connected to the sewer, leading to flow
from the surcharging watercourse entering a combined sewer (effectively acting like a
reverse CSO). In this instance, the water causing/exacerbating the flooding did not originate
from a public sewer.
Incidents where land drainage, or surface water runoff, is found to have overwhelmed the
available headroom in the sewers (that were not designed to deal with the additional water)
resulting in sewer networks surcharging and generating subsequent flooding.
Incidents where burst water mains and private services generate flows that nearby sewers
and drains were not designed to convey, resulting in the sewer network becoming
overwhelmed and generating subsequent flooding.
Flooding caused by upstream defects on private drains that reduce resuspension flow, bulk
convey material (e.g. a private line pipe ‘belly’ that conveys a ‘rag sausage’ or uncapped road
gulleys that convey matter into public sewers) or ground material.
Incidents where unauthorised third party contractors work on private systems or the public
network and their actions result in flooding from a public sewer asset.
Incidents where flooding occurs specifically due to vehicle movements, within the highway,
through sewer flood water and the ‘bow wave’ results in flooding of a property.
Common performance commitment
This is a bespoke measure which we have selected from Ofwat’s asset health long-list.

AMP7 performance commitments and outcome delivery incentives: definition document 203
Incentive type
Financial – outperformance and underperformance payments.
Price control allocation
Performance commitment for AMP7
The performance commitment for Business Plan Period 2020 - 2025 is to achieve upper quartile
performance by the first year of the period. This is an area of positive performance for us and we are
seeing the benefits of innovations tested as part of our Wastewater Network Management
programme. We forecast that as we roll these new techniques and ways of working out across the
region we will continue to improve, achieve and maintain upper quartile status.
The graph below shows the performance level that we have committed to achieve in AMP7.
Figure 32
4000
5000
6000
7000
8000
9000
10000
11000
2020/21 2021/22 2022/23 2023/24 2024/25Nu
mb
er o
f ex
tern
al f
loo
din
g in
cid
ents
th
at h
ave
occ
urr
ed
in e
ach
fin
anci
al y
ear
Outperformance Underperformance Performance commitment
Underperformance collar Outperformance cap
Water resources
Water network+
Wastewater network+
Bioresources Residential
retail Business
retail Direct
procurement
0% 0% 100% 0% 0% 0% 0%
Unit AMP7
2020/21 2021/22 2022/23 2023/24 2024/25
No. of external
flooding incidents 6,845 6,599 6,352 6,106 5,859

AMP7 performance commitments and outcome delivery incentives: definition document 204
Deadbands, caps and collars
An underperformance collar and outperformance cap have been applied to this measure which is
outlined in the table below.
Outcome Delivery Incentive
This measure is subject to both underperformance and outperformance financial incentives, which
will be reconciled annually on an in-period basis.
Outperformance/underperformance incentive rate
The underperformance incentive rate is £0.00644m and the outperformance incentive rate is
£0.00537m.
Worked examples
There are three possible scenarios for the application of the incentive rate associated with this
measure.
Example 1 – Outperformance
For example:
In the year 2020/21, the target level is 6,845 incidents.
If performance in that year was 6,839 this would be an outperformance of 6 incidents (6,845 -
6,839).
This would lead to an outperformance payment of £0.032m (6 x £0.00537).
Example 2 – Underperformance
In any given year, if the number of incidents is above the performance commitment, this would
result in an underperformance payment of £0.00644 per incident. This will then be reconciled on an
in-period basis.
For example:
In the year 2022/23, the target level is 6,352 incidents.
If performance in that year was 6,500 this would be an underperformance of 148 incidents (6,500 –
6,352).
This would lead to an underperformance payment of -£0.953 (148 x £0.00644).
Should the number of incidents be exactly the same as the performance commitment, this would
result in no underperformance or outperformance payment.
Long-term ambition
In the long term we aim to achieve and maintain an upper quartile position for external flooding.
Unit - No. of internal flooding incidents
AMP7
2020/21 2021/22 2022/23 2023/24 2024/25
Under performance collar 10,268 10,268 10,268 10,268 10,268
Out performance cap 6,221 6,017 5,843 5,662 5,576

AMP7 performance commitments and outcome delivery incentives: definition document 205
Through our 10 year strategy that is targeting a step change for internal flooding we will also see
improvements to all our wastewater network processes and innovations that will see improvements
for external incidents too. We have set a target for AMP7 that challenges us to reach upper quartile
in year one and maintain this. This includes an uplift for our FEA process which continues through
the long-term targets.
If innovations developed through Dynamic Network Management (DNM), such as enhancement
monitoring, ‘Stop the Block’ campaigns and improved hot-spotting yield greater than expected
benefits we hope to outperform the long-term targets. However, there are uncertainties in these
new approaches, and if they turn out to be less successful than we had hoped we may need more
physical interventions over a longer period of time and at higher cost.
In the long-term, we aim to prevent all flooding incidents. To achieve this will require significant
innovation and investment, which we plan to manage effectively across the following Business Plan
Periods to ensure it is affordable to customers. It will also require an influence of customer
behaviours, leading to a cultural change in the long term to reduce the risk in an incremental way
over a number of Business Plan Periods. The reduction in flooding incidents is dependent on the
delivery of this investment.
This long-term ambition will also have to consider and accommodate external factors beyond the
company’s control, such as climate change, population growth and changes to the industry &
customer behaviour as a result of the COVID-19 pandemic. We also need to appreciate the influence
of asset deterioration over the longer term and ensure that we adopt the correct delivery strategies
maintain service levels and operational resilience. As our understanding of the influence of these
factors evolves, our ambition may need to adapt, but we will always strive to achieve the best
service outputs for customers and ensure the environment is protected and enhanced.

AMP7 performance commitments and outcome delivery incentives: definition document 206
Raising customer awareness to reduce the risk of flooding (G04-
WWN)
Purpose of this measure
This performance commitment measures the percentage improvement in customer awareness of
what not to flush down the toilet and what should not be poured down the drain in order to
improve sewer performance and customer experience.
Benefits of this measure
Increasing customer understanding of what should and shouldn’t be disposed of down drains and
toilets will lead to improved customer experience and performance of the wastewater network.
Measure Description
This measure assesses delivery of a change in customer awareness aimed at changing behaviour on
items that should not be flushed down the toilet and not poured down the drain. The baseline
awareness will be set using Brand Tracker which is a comprehensive, qualitative online survey. The
questions have been co-designed and the survey will be conducted by a 3rd party customer research
company. From the baseline we will seek to improve awareness which we believe will lead to a
behavioural change subsequently reducing the number of blockages and improving overall
performance of the wastewater network.
We will work with partner organisations to explore, develop and implement co-creation and co-
delivery opportunities. Performance through the period 2020 to 2025 will be tracked by engaging
with an independent customer research organisation to repeat the survey annually to track changes
in awareness.
Measure Definition
This performance commitment is allocated to the wastewater network plus price control and is
subject to outperformance payments and underperformance penalties.
Changing behaviours is notoriously challenging, as people can see change as a loss to them and we
have a natural aversion to losses. Furthermore, we all demonstrate a comfort in the status quo and
making changes can require significant and sustained effort to overcome this inertia. Because of
these challenges we believe this is an exceptionally stretching measure.
In the Business Plan period 2015-2020 we engaged with customers on a number of occasions to
raise awareness of the impact of items being flushed. As well as broad campaigns we have specific
follow up leafletting processes following each blockage incident. We carry out a Christmas time
campaign to raise awareness of the impact of fats oils and grease being washed down the drain. We
will also continue to utilise, as appropriate, the expertise of the WaterTalk customer panel to assess
best methods of communication with customers.
For the Business Plan period 2020-2025 we are looking to deploy a region wide campaign to seek to
make a step change in flushing culture.
We have investigated a range of options to measure awareness, behaviour and cultural change. We
have also engaged with behavioural economists and customer research organisations to see how
this measure could be calculated. Measurements can become complex and also highly variable in

AMP7 performance commitments and outcome delivery incentives: definition document 207
practise. As a result we have selected a relatively simple calculation metric of % of the population
aware each year beyond the baseline set in 2018.
There is research which indicates that being aware of what not to flush does link to conforming
behaviour. Therefore the measure is valid in linking to the outcome of improved sewer performance
for customers.
We have engaged an independent researcher, who run Brand Tracker, to design and set a
questionnaire aimed at understanding customer knowledge of what to put down the toilet/sinks and
the underlying customer behaviour. The survey will include open ended questions to gain greater
understanding of the behaviours observed. Each time we run the survey we will collect some basic
demographical data i.e. age, gender and customer segmentation.
The Brand Tracker is a quantitative online survey that is conducted three times a year with around
1,000 residential customers from our region. The survey covers customer awareness and perception
of the UU brand and its activities over the previous three to four months. Customers are a
representative mix of age, gender, region, metered / unmetered customers and urban / suburban
customers. This volume allows a statistically significant movement in measures to be recorded. The
Brand Tracker has been conducted at regular intervals since 2014.
The results from the three surveys conducted each year will be averaged for the purposes of this
performance commitment.
Baseline and awareness measurement methodology
We will calculate our customer awareness baseline utilising a representative survey of 1,000
customers or more – which is currently deployed via our Brand Tracker survey.
We will calculate awareness change to one decimal place using a yearly average based on
three surveys taken periodically throughout the year.
Results will be based on an even average across two questions (outlined in the diagram
below), one question will refer to general customer awareness of what not to flush or pour,
and the second shall refer to specific customer awareness of United Utilities messaging
around this topic.
The question related to general awareness of what not to flush and what not to pour shall
be sub-divided equally – as demonstrated in the diagram below.
To establish the baseline, in accordance with how the methodology shall be conducted
through the AMP, one year’s worth of data (results from three surveys) has been used for
the question related to customer awareness of United Utilities communications.
Baseline Calculation Worked example
The calculations for the measure are as follows: 1. The results of the three questions (below) come from the brand tracker survey. In each year
there are three waves. In the case of the baseline, these are Waves 36, 37 and 28.
2. Each question is averaged over three waves as required by the Final Determination (FD)
Q1a
Q1b
Q2
Have you seen or heard any information about what you should not flush
Have you seen or heard any information about what you should not put down drains
Q.Do you recall seeing the following advertising:

AMP7 performance commitments and outcome delivery incentives: definition document 208
3. Q1a and Q1b (what not to flush and what not to pour) are added together and divided by 2. This creates a single result for question 1.
4.
5. Q1 (from point 2 above) and Q2 (awareness of our campaign) are added together and divided by 2.
6.
The result is rounded to 1DP.
Measurement units
Measured annually as the percentage of customers (as surveyed) above or below the 2018/19
baseline that are aware of the campaign to reduce flooding and reported to one decimal place.
Mitigation/exceptions
None – any variations that occur through the process of customer research will be accepted by us as
being within the allowed margins of error.
Common performance commitment
This is a bespoke measure.
Incentive type
Financial – subject to underperformance payments and outperformance incentives.
Price control allocation
Water resources
Water network+
Wastewater network+
Bioresources Residential
retail Business
retail Direct
procurement
0% 0% 100% 0% 0% 0% 0%
Performance commitment for AMP7
We have completed a baseline survey in 2018 to identify that the baseline level of customer
awareness on what not to flush and what not to pour is 25.2%. We will conduct the Brand Tracker
survey three times per annum using a sample of at least 1,000 customers - selected from within our
region. The three results will be averaged for the year and reported for this performance
26 27 28 Average
Q1a Actual 41 40 33 38.0
Q1b Actual 30 29 23 27.3
Q2 Actual 18 18 17 17.7
26 27 28 Average Added
Q1a Actual 41 40 33 38.0
Q1b Actual 30 29 23 27.3
Q2 Actual 18 18 17 17.7 17.7
32.7
26 27 28 Average Added Result
Q1a Actual 41 40 33 38.0
Q1b Actual 30 29 23 27.3
Q2 Actual 18 18 17 17.7 17.7
32.725.2

AMP7 performance commitments and outcome delivery incentives: definition document 209
commitment. The survey covers a representative mix of age, gender, region, metered / unmetered
customers and urban/suburban customers. This will allow statistically significant measures to be
recorded and will also allow data to be trended throughout the year so that we can continually
monitor our performance as well as measure any changes against the 2018 baseline response levels.
Increases in responses will confirm the success of our communications which will run throughout
AMP7 and will look to increase customer awareness of the actions that customers can take to
reduce their impact on the performance of the wastewater network.
Our communications will be reviewed and revised continuously and we will continue to use the
support of our WaterTalk customer panel as advisors where necessary to help shape our
communication strategies. Our target is to increase awareness beyond the baseline in increments of
2% each year. This would achieve a cumulative increase in awareness from our baseline of 10%
across the AMP7 period.
Deadbands, caps and collars
None.
Outcome Delivery Incentive
This measure is subject to both outperformance and underperformance financial payment
incentives, which will be reconciled annually on an in-period basis.
Worked examples
As in the baseline and worked example above, the results of the three waves in each year are follow
the same method as the baseline.
To calculate the under or over performance payments, the result of step 3 is compared to the
performance commitment. The difference is then multiplied by the incentive rate.
Waves 29 30 31 Average Added Result
Q1a Actual 47 43 49 46.3
Q1b Actual 36 34 42 37.3
Q2 Actual 11 15 24 16.7 16.7
41.829.3
Performance Commitment (PC) 27.2
Example Result 29.3
Difference (Result - PC) 2.1
Incentive Rate (IR) (£m) 0.086
ODI Value (£m) (Diff * IR) 0.1806
Unit AMP7
2020/21 2021/22 2022/23 2023/24 2024/25
Increase in
awareness from
baseline
(cumulative)
2.0% 4.0% 6.0% 8.0% 10.0%

AMP7 performance commitments and outcome delivery incentives: definition document 210
Long-term ambition
We are seeking to embark on a cultural change for the way that people dispose of material down the
drain. We hope to see a shift in in behaviour amongst the population of the North West that is
sustainable and can be passed down the generations.
We intend to review our targets at the end of each business plan period and will reset our baseline
to reflect the latest awareness levels. As this is a new measure for AMP7 we are unsure how
successful the measure will be and if there will be customer support for this to continue into future
AMPs. Our ambition is to maintain the stretching 2% increase in awareness (continuing from our
AMP7 performance commitment) per year, reaching 30% additional awareness from our baseline by
2034/35. Given our baseline of 25.2% this would see overall awareness at 35.2%.
AMP7 performance commitments and outcome delivery incentives: definition document 211
Hydraulic internal flood risk resilience (G05-WWN)
Purpose of this measure
This is a bespoke performance commitment designed to incentivise the provision of permanent
solutions to reduce the risk of internal flooding at properties that have experienced flooding more
than once.
Benefits of this measure
This measure will reduce the risk of customers that have repeated experience of internal flooding
being flooded again.
Measure description
The aim of this measure is to reduce the flood risk to customers from internal hydraulic flooding and
particularly those that are impacted by repeat incidents. It will measure modelled flooding incident
reduction at known flooding properties following the provision of permanent solutions that will
improve the resilience of the drainage system serving the customers of the North West.
Measure definition
This measure relates to hydraulic (flooding due to the overloading of sewers) internal flooding only, it does not include flooding due to other causes such as blockages and collapses.
In setting the measure we are assessing those properties most at risk of hydraulic flooding.
Therefore we have assessed the risk of properties repeat flooding in the event of storms with less
than a 1 in 20 return period.
This measure is records modelled internal hydraulic flood risk throughout the period 2020 and 2025
at known repeat flooding properties. ‘Baseline’ flood are defined as the annualised modelled risk as
at 2018/19. Risk levels will only be updated where the modelled risk changes solely due to a
permanent intervention being carried out in the period.
The list of properties and associated modelled flood risk (represented as an annualised incident
forecast) includes all properties to have flooded at least twice over the six year period 2012/13 to
2017/18. This list, along with the associated modelled flood frequency risk levels, was set in 2018/19
and inform the ‘baseline’ regional risk level.
Rather than using the ‘repeat flooding’ definition that was used for the business plan period 2015 to
2020 (which counts second time incidents to have occurred in a 10 year period) we have used a list
of properties which have flooded over the six year period 2012/13 to 2017/18 as the repeat flooding
list. Many of the properties that flooded prior to this period have since received permanent
solutions or mitigation measures. Using the updated definition will therefore avoid counting already
resolved issues and provide focus at the properties and customers that continue to experience
hydraulic flooding issues.
We also have an external hydraulic flood risk resilience measure. Where properties and areas are
affected by a combination of repeat internal and external flooding incidents they will be captured on
both ‘baseline’ regional risk level lists.
Where the modelled frequency is greater than the reported frequency, the reported frequency for
the six year period 2012/13 to 2017/18 will be used instead of modelled risk. This will ensure that

AMP7 performance commitments and outcome delivery incentives: definition document 212
the benefit claimed once a solution is developed is not higher than has been previously experienced
by the affected customers.
With the intention of providing or freeing up additional hydraulic capacity, ‘permanent’
interventions include: -
sewer upsizing
online or offline storage
flow transfer
surface water removal including green infrastructure solutions
physical disconnection from a surcharging sewer
Interventions previously regarded as ‘mitigation’ measures will continue to be provided wherever
feasible, but will not be counted in the risk reduction applied to this measure.
The detail of the definition will ensure that the reduction in risk claimed is less than or equal to the
modelled risk reduction achieved, making the proposed target even more stretching. Additionally a
minimum of a 50% reduction in modelled flood risk frequency will be provided to properties which
makes the proposed performance target more difficult to achieve. Whilst these aspects add a level
of complexity to the measure definition, we feel that the following rules are necessary in order to
maximise resilience and provide the greatest possible benefit to customers:
Baseline risk will be capped at the reported risk over the six year period 2012/13 to
2017/18. The risk reduction achieved will only reflect permanent interventions.
Solutions will be designed for a 2040 design horizon, including climate change, proposed
development and creep. We will claim the difference between the remaining 2040 risk
following an intervention, and the baseline risk levels. With subsequently larger “future-
proofed” solutions being constructed, this will mean that the risk reduction achieved in the
period 2020-2025 will be greater than that claimed against our measure.
Modelled risk will only relate to properties that have reported repeat flooding over the six
year period 2012/13 to 2017/18, meaning that the modelled risk reduction achieved will be
greater than that claimed against our measure (i.e. for properties at risk but which have
not yet flooded or repeat flooded in this period). This reduction in risk will be reflected in
our resilience measure, which is included as a reputational measure for business plan
period 2020 to 2025.
Where properties are not already on the list and are impacted by a repeat flood during the
remainder of AMP6 and AMP7, they will be added to the measure using a consistent
method with those currently included.
Baseline
We have set a baseline which is capped at the recorded level of risk over the six year period up to
2017/18. Should future modelling be completed which increases the modelled risk to a level in
excess of that observed in historic incidents, the modelled risk will be capped at the historic baseline
level.
Each new financial year any new repeat arisals will be assessed and added to the baseline list.
Previous projects and AMP6 projects still to be completed
The modelling used in this measure includes some properties where projects have already been
completed but they were impacted by repeat flooding during the period. We are not reporting any
outperformance relating to properties that have had previously completed schemes unless an

AMP7 performance commitments and outcome delivery incentives: definition document 213
intervention is deployed that creates additional sewer capacity beyond that provided by the original
project therefore providing an additional modelled flood risk benefit.
Projects that are in progress but not are yet complete are also included in the modelled data. We
will not report any outperformance relating to these locations where work is already underway.
Only projects which are complete after July 2019 will be used to reduce the risk of flooding against
the baseline.
Modelled Risk
The measure is based on modelled risk. Our risk assessment is based on two stages. In the first
instance, design rainfall has been simulated across the region for rainfall events from 1 in 1, up to 1
in 50 and across the full range of durations. The lowest return period to show a flood risk is used to
understand the flooding frequency. For example, if a property is shown as flooding in a 1 in 10 event
but not in a 1 in 5, 1 in 10 is taken as the flood frequency. In terms of annualised risk, flooding on a 1
in 1 event would equal 1 annualised incident while flooding on a 1 in 10 event would be equivalent
to 0.1 annualised incidents.
For properties with the greatest predicted volumes in the 1 in 1 year design event, we have used
historic rainfall series (reflecting actual rainfall to have been recorded in each area) to simulate
flooding over that period, resulting in a corresponding modelled prediction of flooding.
Depending on the level of modelled detail in the vicinity of each property, thresholds in terms of
flooding volume (e.g. for overland flooding mechanisms) and top water levels (e.g. for cellar
flooding) have been set and adopted consistently to assign modelled risk across the full list of
properties.
Modelled representation of the sewerage system and associated verification of models have been
carried out in line with the CIWEM UDG (2017) Code of Practice for the Hydraulic Modelling of Urban
Drainage Systems13 and, for the representation of antecedent conditions, the CIWEM UDG (2016)
Rainfall Guide. The methods detailed in sections 3.3 and 3.4 (antecedent conditions for design
rainfall) and 4.3.5 (antecedent conditions for time series rainfall) have been applied in all cases.
Model maintenance is updated, run and managed using this guidance (and will be until it is
superseded). As part of the development of this measure, we have undertaken localised checks of
quality to ensure that the model is of an appropriate standard at the property being considered. This
largely comprises ensuring that the model prediction is in line with our historic view.
Internal and external flooding
The model risk will be determined based on 1D modelling (for example, a manhole flooding with
10m3 if it is in the highway would be considered enough to enter the property boundary). As this
would not have the detail required to differentiate between internal and external flooding, the
recorded historic flooding is used to allocate the model risk to either this measure or the equivalent
external measure (G06-WWN). This approach allows us to focus our resources on the highest risk
properties from a larger overall list rather than using more resource intensive 2D modelling for all
properties when there are some that may not have cost beneficial solutions. This applies to all arisals
up to FY20. Following the 2020 model runs for DWMP and Risk of flooding in a storm however, we
are using the 2D outputs in determining the level of flood risk from FY20 onwards.
13 https://www.ciwem.org/groups/udg/

AMP7 performance commitments and outcome delivery incentives: definition document 214
Modelled risk application
Key principles:
Where there is only recorded historic internal flooding, the property is allocated to this
measure.
Where there is recorded historic external flooding, the property is allocated to the external
measure (G06-WWN).
Where there are separate recorded instances of historic internal and external flooding, the
property will be included in this measure and the external measure.
The recorded historic flooding is based on our current flooding reporting methodology and
industry best practice. This only includes the worst effect so if there is both internal and
external flooding during the same incident, it will be recorded as an internal flooding
incident.
The above classification means that the benefit from the scheme is limited to the worst case
customer impact and there is no ability to claim multiple benefits on the same project.
Where the modelled risk exceeds the historic risk, then the modelled risk will be capped at
the historic risk.
Application example 1:
Flooding originates from a manhole and enters the property
through overland flow.
This is a property that has flooded internally six times in
six years (6/6). This equates to a historic risk of one
annualised incident.
As the historic data is used to allocate the flooding (and
this is based on worst effect) this is recorded as internal
flooding only.
The modelled risk at the property is flooding twice per year. As the historic incidents are
internal, the model risk is allocated to the internal measure.
As the historic flooding is one incident per year and the modelled incidents are two per year,
the model risk is capped at one incident per year.
This would mean our intervention would reduce the risk at this property by an additional
one incident per year.
Application example 2:
Flooding enters the property through the cellar with no
associated external flooding.
This is a property that has flooded internally six times in
six years (6/6). This equates to a historic risk of one
annualised incident.
As the historic incidents are internal, the model risk is
allocated to the internal measure.
The modelled risk at the property is flooding on a 1 in 2
event, equivalent to 0.5 incidents per year.
As the historic flooding is one incident per year and the modelled incidents are 0.5 per year,
the risk level for the property is the model risk at 0.5 incidents per year.
Figure 33
Figure 34

AMP7 performance commitments and outcome delivery incentives: definition document 215
As the model risk does not exceed the historic cap, the model risk does not have to be
This would mean our intervention would reduce the risk at this property by an additional
0.5 incidents per year.
Application example 3:
Flooding originates from a manhole and enters the property
through overland flow for each of the three internal incidents.
There are also three recorded external flooding incidents. The
same flooding pathway occurs but it does not enter the
property. Because there are separate external historic flooding
events, the impact is also included on the external measure
This is a property that has flooded internally three times
in six years and externally three times in six years. This equates to a historic risk of 0.5
internal annualised incidents (as on average the flooding has occurred every two years) and
0.5 external annualised incidents.
The modelled risk at the property is flooding once per year. As the historic incidents are
internal and external, the model risk is allocated to the internal measure and external
measure. The historic internal flooding is 0.5 incidents per year and the external flooding is
0.5 incidents per year.
As the model risk exceeds the separate internal and external values, both are limited to the
historic values of 0.5. This means that the total combined risk for both is one per year,
effectively splitting the model risk (which does not distinguish between internal and external
flooding) between the two measures.
This would mean our intervention would reduce the risk at this property by an additional
0.5 incidents per year on the internal measure and 0.5 incidents per year on the external
measure.
Measurement units
Measured as the number of modelled flooding incidents as predicted by the hydraulic model.
Reported annually to two decimal places.
Flood risk will be defined as the total number of modelled flooding incidents predicted each year.
This relates to properties which have, historically, repeat flooded internally due to hydraulic
overloading of the sewer over the six year period 2012/13 to 2017/18. The modelled risk will be as
calculated in 2018/19.
Throughout the business plan period 2020 to 2025, risk values will be updated for each listed property
where a permanent intervention is carried out.
Mitigation/exceptions/assumptions
None.
Common performance commitment
This is a bespoke measure.
Figure 35

AMP7 performance commitments and outcome delivery incentives: definition document 216
Incentive type
Financial – outperformance and underperformance payments.
Price control allocation
Performance commitment for AMP7
Our performance commitment is to reduce the overall modelled risk by five incidents at properties
that have experenced repeat flooding from FY13. This will significantly improve the risk level at
twelve individual properties. This measure is modelled risk, measured in annualised incidents and
will be reported to two decimal places. For example, if we reduce the risk level at a property with an
annualised risk of 1 incident down to 0.1 annualised incidents, this would mean that the property
would now be predicted to flood once in ten years compared to once per year before the solution.
The graph below highlights the performance commitment that we have signed up to deliver in
AMP7. In order to achieve this level of performance we will need to deliver a sustained step change
in performance.
Water resources
Water network+
Wastewater network+
Bioresources Residential
retail Business
retail Direct
procurement
0% 0% 100% 0% 0% 0% 0%
AMP7
Unit 2020/21 2021/22 2022/23 2023/24 2024/25
Annual number
of modelled
incidents at
high risk
properties
60.04 59.04 58.04 57.04 56.04

AMP7 performance commitments and outcome delivery incentives: definition document 217
Figure 36
Deadbands, caps and collars
An underperformance collar and outperformance cap have been applied to this measure which is
outlined in the table below.
Outcome Delivery Incentive
This measure is subject to both underperformance and outperformance payment incentives, which
will be reconciled annually on an in-period basis.
Outperformance/underperformance incentive rate
The incentive rate for outperformance and underperformance is £0.415m.
Worked examples
The baseline level of risk was set in FY19 at 61.04 modelled incidents. From the baseline level of risk,
the measure can change by:
Additions – Risk associated with new properties being added due to repeat hydraulic flooding that meets the criteria described above.
Removals – Risk reduced on properties through the provision of permanent solutions.
30.00
40.00
50.00
60.00
70.00
80.00
90.00
2020/21 2021/22 2022/23 2023/24 2024/25
The
nu
mb
er o
f m
od
elle
d in
tern
al f
loo
din
g in
cid
ents
Underperformance Outperformance Outperformance cap
Underperformance collar Performance commitment Outperformance cap
Unit - No. of internal flooding incidents
AMP7
2020/21 2021/22 2022/23 2023/24 2024/25
Underperformance collar 78.04 78.54 79.04 79.54 80.04
Outperformance cap 37.90 36.90 35.90 34.90 33.90

AMP7 performance commitments and outcome delivery incentives: definition document 218
Additions
In this example, there have been new properties added since the baseline with a total level of risk of
5.79 modelled incidents
Removals
In this example, there have been permanent solutions that reduced the risk at properties by 24.98
modelled incidents
Total Risk
The original baseline level of risk following FY19 was 61.04. With the additional risk, this goes up to
66.83. With the projects delivered, the risk reduces from that point to 41.84.
This new level of risk is compared to the performance commitment for that year, this example is
year one of AMP7 and the difference is multiplied by the incentive rate. This example assumes the
remaining risk level does not reach a cap or collar.
Performance Commitment (FY21) – Remaining risk = Difference
60.04 – 41.84 = 18.2
Difference x Incentive Rate = Outperformance financial value in that Year
18.2 x £0.415m = £7.55m
Long-term ambition
We recognise that flooding a customer is one of the worst things we can do, so our long-term
ambition is to prevent all internal flooding incidents within our control i.e. due to operational causes.
This would be accomplished through the development of permanent solutions, better risk
management through our dynamic network management approach and mitigation of risk wherever
possible. It should be noted that there will still be instances of severe weather that are beyond the
design standard of the network that would cause flooding. This is a very stretching aim considering
the scale of the issue and investment required, particularly with catchment changes, such as climate
change or urban creep, taken in to account. Investing in permanent solutions is expensive compared
to cleaning and we continue to work with the supply chain to seek greater efficiencies. That said, to
manage the impact of achieving this long-term ambition we plan to do this at an affordable rate for
customers and therefore propose to phase the improvements across the next few investment
periods. Exploring the increased use of surface water removal schemes and green solutions is key to
our long term ambition.
In AMP8 we anticipate a requirement to focus on significant increases in network capacity in order
to reduce pollution, improve water quality and to continue to address sewer flooding. We therefore
intend to explore opportunities to expand the scope of our methodology in line with the “risk of
flooding in a storm” measure (G01-WWN).

AMP7 performance commitments and outcome delivery incentives: definition document 219
Hydraulic external flood risk resilience (G06-WWN)
Purpose of this measure
This is a bespoke performance commitment designed to incentivise the provision of permanent
solutions to reduce the risk of external flooding at properties that have experienced flooding more
than once.
Benefits of this measure
This measure will reduce the risk of flooding of customers that have repeated experience of external
flooding being flooded again.
Measure description
The aim of this measure is to reduce the flood risk to customers from external hydraulic flooding and
particularly those that are impacted by repeat incidents. It will measure modelled flooding incident
reduction at known flooding properties following the repeat of permanent solutions that will
improve the resilience of the drainage system serving the customers of the North West.
Measure definition
This measure relates to hydraulic (flooding due to the overloading of sewers) external flooding only, it does not include flooding due to other causes such as blockages and collapses.
In setting the measure we are assessing those areas most at risk of hydraulic flooding. Therefore we
have assessed the risk of areas flooding in the event of storms with less than a 1 in 20 return period.
The measure records modelled external hydraulic flood risk throughout the period between 2020
and 2025 at known repeat flooding properties. ‘Baseline’ flood risk will be defined as the annualised
modelled risk as of 2018/19. Risk levels will only be updated where the modelled risk changes solely
due to a permanent intervention being carried out in the period.
The list of areas and associated modelled flood risk (represented as an annualised incident forecast)
includes all areas to have flooded at least twice over the six year period 2012/13 to 2017/18. This
list, along with the associated modelled flood frequency risk levels, was set in 2018/19 and inform
the ‘baseline’ regional risk level.
Rather than using the ‘repeat flooding’ definition that was used for the business plan period 2015 to
2020 (which counts second time incidents to have occurred in a 10 year period) we have used a list
of areas which have flooded over the six year period 2012/13 to 2017/18 as the repeat flooding list.
Many of the areas that flooded prior to this period have since received permanent solutions or
mitigation measures. Using the updated definition will therefore avoid counting already resolved
issues and provide focus at the areas and customers that continue to experience hydraulic flooding
issues.
We also have an internal hydraulic flood risk resilience measure. Where properties and areas are
affected by a combination of repeat internal and external flooding incidents they will be captured on
both ‘baseline’ regional risk level lists.
Where modelled frequency is greater than the reported frequency, the reported frequency for the
six year period 2012/13 to 2017/18 will be used instead of modelled risk. This will ensure that the
benefit claimed once a solution is developed is not higher than has been previously experienced by
affected customers.

AMP7 performance commitments and outcome delivery incentives: definition document 220
With the intention of providing or freeing up additional hydraulic capacity, ‘permanent’
interventions include: -
sewer upsizing
online or offline storage
flow transfer
surface water removal including green infrastructure solutions
physical disconnection from a surcharging sewer
Interventions previously regarded as ‘mitigation’ measures will continue to be provided wherever
feasible, but will not be counted in the risk reduction applied to this measure.
The detail of the definition will ensure that the reduction in risk claimed is less than or equal to the
modelled risk reduction achieved, making the proposed target even more stretching. Additionally a
minimum of a 50% reduction in modelled flood risk frequency will be provided to areas which places
a further stretch on the proposed performance target. Whilst these aspects add a level of complexity
to the measure definition, we feel that the following rules are necessary in order to maximise
resilience and provide the greatest possible benefit to customers: -
Baseline risk is be capped at the reported risk over the six year period 2012/13 to 2017/18.
The risk reduction achieved will only reflect permanent interventions (i.e. mitigation would
not be included).
Solutions are designed for a 2040 design horizon, including climate change, proposed
development and creep. We are claiming the difference between the remaining 2040 risk
following an intervention, and the baseline risk levels. With subsequently larger “future
proofed” solutions being constructed, this will mean that the risk reduction achieved in the
period 2020-2025 will be greater than that claimed against our measure.
Modelled risk will only relate to areas that have reported repeat flooding over the six year
period 2012/13 to 2017/18, meaning that the modelled risk reduction achieved will be
greater than that claimed against our measure (i.e. for areas at risk but which have not yet
flooded or repeat flooded in this period). This reduction in risk will be reflected in our
resilience measure, which is included as a reputational measure for business plan period
2020 to 2025.
Where areas are not already on the list repeat flood for the rest of AMP6 and AMP7, they
will be added to the measure using a consistent method with those currently included.
Baseline
We have set a baseline which is capped at the recorded level of risk over the six year period up to
2017/18. Should future modelling be completed which increases the modelled risk to a level in
excess of that observed in historic incidents, the modelled risk will be capped at the historic baseline
level.
Each new financial year any new repeat arisals will be assessed and added to the baseline list.
Previous projects and AMP6 projects still to be completed
The modelling used in this measure includes some areas with projects that that have already been
completed but they were impacted by repeat flooding during the period. We will not report any
outperformance related to areas that have had previously completed schemes unless an
intervention is deployed that creates additional sewer capacity beyond that provided by the original
scheme and therefore provides an additional modelled flood risk benefit.
AMP7 performance commitments and outcome delivery incentives: definition document 221
Projects that are in progress but not are yet complete are also included in the modelled data. We
will not report any outperformance relating to these locations where work is already underway.
Only projects which are complete after July 2019 will be used to reduce the risk of flooding against
the baseline.
Modelled Risk
The measure is based on modelled risk. Our risk assessment is based on two stages. In the first
instance, design rainfall has been simulated across the region for rainfall events from 1 in 1, up to 1
in 50 and across the full range of durations. The lowest return period to show a flood risk is used to
understand the flooding frequency. For example, if an area is shown as flooding in a 1 in 10 event
but not in a 1 in 5, 1 in 10 is taken as the flood frequency. In terms of annualised risk, flooding on a 1
in 1 event would equal 1 annualised incident while flooding on a 1 in 10 event would be equivalent
to 0.1 annualised incidents.
Where this has shown a greater than one year frequency of flooding, we have used historic rainfall
series (reflecting actual rainfall to have been recorded in each area) to simulate flooding over that
period, resulting in a modelled prediction of flooding over that period.
Depending on the level of modelled detail in the vicinity of each area, thresholds in terms of flooding
volume (e.g. for overland flooding mechanisms) and top water levels (e.g. for cellar flooding) have
been set and adopted consistently to assign modelled risk across the full list of areas.
Modelled representation of the sewerage system and associated verification of models have been
carried out in line with the CIWEM UDG (2017) Code of Practice for the Hydraulic Modelling of Urban
Drainage Systems14 and, for the representation of antecedent conditions, the CIWEM UDG (2016)
Rainfall Guide. The methods detailed in sections 3.3 and 3.4 (antecedent conditions for design
rainfall) and 4.3.5 (antecedent conditions for time series rainfall) have been applied in all cases.
Future maintenance of models will also be updated, run and managed using this guidance until it is
superseded. As part of the development of this measure, we have undertaken localised checks of
quality to ensure that the model is of an appropriate standard at the property or area being
considered. This largely comprises ensuring that the model prediction is in line with our historic
view.
Internal and external flooding
The model risk will be determined based on 1D modelling (for example, a manhole flooding with
10m3 if it is in the highway would be considered enough to enter the property boundary). As this
would not have the detail required to differentiate between internal and external flooding, the
recorded historic flooding is used to allocate the model risk to either this measure or the equivalent
internal measure (G05-WWN). This approach allows us to focus our resources on the highest risk
properties from a larger overall list rather than using more resource intensive 2D modelling for all
properties when there are some that may not have cost beneficial solutions. This applies to all arisals
up to FY20. Following the 2020 model runs for DWMP and Risk of flooding in a storm however, we
are using the 2D outputs in determining the level of flood risk from FY20 onwards.
Modelled risk application
Key principles:
Where there is only recorded historic external flooding, the property is allocated to this
measure.
14 https://www.ciwem.org/groups/udg/

AMP7 performance commitments and outcome delivery incentives: definition document 222
Where there is recorded historic internal flooding, the property is allocated to the internal
measure (G05-WWN).
Where there are separate recorded instances of historic internal and external flooding, the
property will be included in this measure and the external measure.
The recorded historic flooding is based on our current flooding reporting methodology and
industry best practice. This only includes the worst effect so if there is both internal and
external flooding during the same incident, it will be recorded as an internal flooding
incident.
The above classification means that the benefit from the scheme is limited to the worst case
customer impact and there is no ability to claim multiple benefits on the same project.
Where the modelled risk exceeds the historic risk, then the modelled risk will be capped at
the historic risk.
Application example 1:
Flooding originates from a manhole and enters the property
through overland flow.
This is a property that has flooded internally six times in
six years (6/6). This equates to a historic risk of one
annualised incident.
As the historic data is used to allocate the flooding (and
this is based on worst effect) this is recorded as internal
flooding only.
The modelled risk at the property is flooding twice per year. As the historic incidents are
internal, the model risk is allocated to the internal measure.
As the historic flooding is one incident per year and the modelled incidents are two per year,
the model risk is capped at one incident per year.
This would mean our intervention would reduce the risk at this property by an additional
one incident per year.
Application example 2:
The flooding originates from the manhole and enters the
curtilage of the property, but not the property itself, through
overland flow.
This is a property that has flooded externally six times in
six years. This equates to a historic risk of one annualised
incident (6/6).
As the historic data is used to allocate the flooding (and
this is based on worst effect) this is recorded as external
flooding only.
The modelled risk at the property is flooding once per year. As the historic incidents are
external, the model risk is allocated to the external measure.
As the model risk does not exceed the historic cap, the model risk does not have to be
limited.
This would mean our intervention would reduce the risk at this property by an additional
one incident per year
Figure 37
Figure 38

AMP7 performance commitments and outcome delivery incentives: definition document 223
Application example 3:
Flooding originates from a manhole and enters the property
through overland flow for each of the three internal incidents.
There are also three recorded external flooding incidents. The
same flooding pathway occurs but it does not enter the
property. Because there are separate external historic flooding
events, the impact is also included on the external measure
This is a property that has flooded internally three times
in six years and externally three times in six years. This equates to a historic risk of 0.5
internal annualised incidents (as on average the flooding has occurred every two years) and
0.5 external annualised incidents.
The modelled risk at the property is flooding once per year. As the historic incidents are
internal and external, the model risk is allocated to the internal measure and external
measure. The historic internal flooding is 0.5 incidents per year and the external flooding is
0.5 incidents per year.
As the model risk exceeds the separate internal and external values, both are limited to the
historic values of 0.5. This means that the total combined risk for both is one per year,
effectively splitting the model risk (which does not distinguish between internal and external
flooding) between the two measures.
This would mean our intervention would reduce the risk at this property by an additional
0.5 incidents per year on the internal measure and 0.5 incidents per year on the external
measure.
Measurement units
Measured as the reduction of modelled incidents as predicted by the hydraulic model. Reported
annually to two decimal places.
Flood risk will be defined as the total number of modelled flooding incidents predicted each year.
This relates to properties which have, historically, repeat flooded externally due to hydraulic
overloading of the sewer over the six year period 2012/13 to 2017/18. The modelled risk will be as
calculated in 2018/19.
Throughout the business plan period 2020 to 2025, risk values will be updated for each listed property,
changing only where a permanent intervention is carried out.
Mitigation/exceptions/assumptions
None.
Common performance commitment
This is a bespoke measure.
Incentive type
Financial – outperformance and underperformance payments.
Figure 39
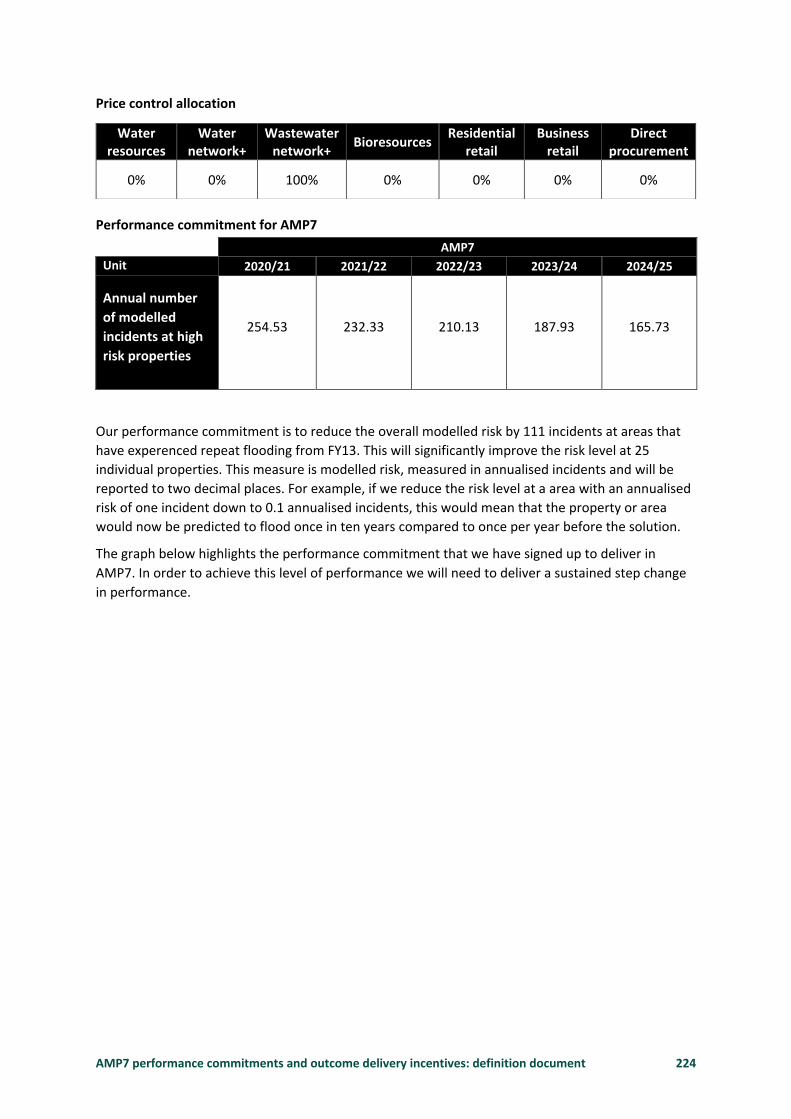
AMP7 performance commitments and outcome delivery incentives: definition document 224
Price control allocation
Performance commitment for AMP7
Our performance commitment is to reduce the overall modelled risk by 111 incidents at areas that
have experenced repeat flooding from FY13. This will significantly improve the risk level at 25
individual properties. This measure is modelled risk, measured in annualised incidents and will be
reported to two decimal places. For example, if we reduce the risk level at a area with an annualised
risk of one incident down to 0.1 annualised incidents, this would mean that the property or area
would now be predicted to flood once in ten years compared to once per year before the solution.
The graph below highlights the performance commitment that we have signed up to deliver in
AMP7. In order to achieve this level of performance we will need to deliver a sustained step change
in performance.
Water resources
Water network+
Wastewater network+
Bioresources Residential
retail Business
retail Direct
procurement
0% 0% 100% 0% 0% 0% 0%
AMP7
Unit 2020/21 2021/22 2022/23 2023/24 2024/25
Annual number
of modelled
incidents at high
risk properties
254.53 232.33 210.13 187.93 165.73

AMP7 performance commitments and outcome delivery incentives: definition document 225
Figure 40
Deadbands, caps and collars
Outcome Delivery Incentive
This measure is subject to both outperformance and underperformance financial incentives, which
will be reconciled annually on an in-period basis.
This measure will be subject to a cap and collar.
Outperformance / underperformance incentive rate
0.00
50.00
100.00
150.00
200.00
250.00
300.00
350.00
2020/21 2021/22 2022/23 2023/24 2024/25
The
nu
mb
er
of
mo
del
led
ext
ern
al f
loo
din
g in
cid
en
ts
Outperformance Underperformance Performance commitment
Underperformance collar Outperformance cap
AMP7
Unit 2020/21 2021/22 2022/23 2023/24 2024/25
Underperformance collar
Annual number
of modelled
incidents at
high risk
properties
289.78 301.88 312.98 323.23 334.33
Outperformance cap
Annual number
of modelled
incidents at
high risk
properties
154.43 131.23 109.03 86.83 64.63

AMP7 performance commitments and outcome delivery incentives: definition document 226
The incentive rate for outperformance and underperformance for this commitment is £42,000 per
incident.
Worked examples
The baseline level of risk was set in FY19 at 276.06 modelled incidents. From the baseline level of
risk, the measure can change by:
Additions – Risk associated with new properties being added due to repeat hydraulic flooding that meets the criteria described above.
Removals – Risk reduced on properties through the provision of permanent solutions.
Additions
In this example, there have been new properties added since the baseline with a total level of risk of
15.40 modelled incidents.
Removals
In this example, there have been permanent solutions that reduced the risk at properties by 111.62
modelled incidents.
Total Risk
The original baseline level of risk following FY19 was 276.06. With the additional risk, this goes up to
291.46. With the projects delivered, the risk reduces from that point to 179.84.
This new level of risk is compared to the performance commitment for that year, this example is
year one of AMP7 and the difference is multiplied by the incentive rate. This example assumes the
remaining risk level does not reach a cap or collar.
Performance Commitment (FY21) – Remaining risk = Difference
254.53 – 179.84 = 74.69
Difference x Incentive Rate = Outperformance financial value in that Year
74.69 x £0.042m = £3.14m
Long-term ambition
We recognise that flooding a customer is one of the worst things we can do, so our long-term
ambition is to prevent all flooding incidents within our control i.e. due to operational causes. This
would be accomplished through the development of permanent solutions, better risk management
through our dynamic network management approach and mitigation of risk wherever possible. It
should be noted that there will still be instances of severe weather that are beyond the design
standard of the network that would cause flooding. This is a very stretching aim considering the
scale of the issue and investment required, particularly with catchment changes, such as climate
change or urban creep, taken in to account. Investing in permanent solutions is expensive compared
to cleaning and we continue to work with the supply chain to seek greater efficiencies. That said, to
manage the impact of achieving this long-term ambition we plan to do this at an affordable rate for
customers and therefore propose to phase the improvements across the next few investment
periods. Exploring the increased use of surface water removal schemes and green solutions is key to
our long term ambition.

AMP7 performance commitments and outcome delivery incentives: definition document 227
In AMP8 we anticipate a requirement to focus on significant increases in network capacity in order
to reduce pollution, improve water quality and to continue to address sewer flooding. We therefore
intend to explore opportunities to expand the scope of our methodology in line with the “risk of
flooding in a storm” measure (G01-WWN).

United Utilities Water LimitedHaweswater HouseLingley Mere Business ParkLingley Green AvenueGreat Sankey WarringtonWA5 3LP
unitedutilities.com


