1
Agricultural Cooperatives in Africa
Report on the mapping data of CDOs and their projects
Project team: Cecilia Navarra, Barbara Franchini, Federica Tolotti (Euricse), Paul Hazen, Emile G.
Nadeau, Kristen Scott Kennedy (OCDC).
Partner: International Cooperative Research Group, a division of the US Overseas Cooperative
Development Council (OCDC).
2
Agricultural Cooperatives in Africa
Report on the mapping data of CDOs and their projects
Cecilia Navarra
Barbara Franchini
EURICSE
Contents
1. Purpose of the research .............................................................................................................. 3
2. Background literature ................................................................................................................ 4
3. Methodology ................................................................................................................................ 5
3.1 Selection of CDOs ...................................................................................................................... 5
3.2 Questionnaire.............................................................................................................................. 6
3.3 Questionnaire collection and methodological notes in dealing with missing information ........ 8
4. Data overview .............................................................................................................................. 9
5. Summary statistics at the CDO level ...................................................................................... 11
6. Summary statistics at the country level .................................................................................. 15
7. Summary statistics at the project level ................................................................................... 20
8. Selected countries ...................................................................................................................... 27
9. Concluding summary ............................................................................................................... 30
References ......................................................................................................................................... 32
3
1. Purpose of the research
This report is the first outcome of a joint project by the International Cooperative Research Group, a
division of the US Overseas Cooperative Development Council (OCDC), and the European Research
Institute on Cooperatives and Social Enterprises (EURICSE). The purpose of the research is to
provide an analysis of the legal, economic, and policy environments in which cooperatives operate in
four African countries. The final research report will also look at the challenges and opportunities
facing 16 selected cooperative development programs. The overall aim of the research is to support
the creation of cooperatives and the scaling up of strategies in the agricultural sector of sub-Saharan
Africa.
The research is focused on cooperative development programs conducted in the agrarian sector of the
African countries by cooperative enterprises, as well as by cooperative development organizations
(CDOs) linked to the North American and European cooperative movements.
In cooperative development, it is important to keep in mind not only the advantages that cooperatives
can bring, but also the problems that can arise in trying to create them. The goal of this project is that,
by developing a better understanding of the context of cooperatives in a variety of countries and the
effectiveness of different cooperative projects, CDOs in North America and Europe will be able to
improve the effectiveness of their co-op development strategies.
This work is the first phase of a wider research agenda, guided by the following research questions:
1. What is the national context for cooperatives in the selected African countries in terms of the
economic environment and legal frameworks?
2. What is the history of the selected cooperative projects in each of these countries? What
characterizes their membership and their relationship with foreign partners? What are the different
strategies used by co-op development organizations to provide technical and financial assistance
to these cooperatives? How do they interact with other actors in the value chain in which they are
embedded? What benefits do they produce for their members? How are these benefits distributed?
How are these benefits perceived?
3. What management strategies and public policies can maximize the advantages that cooperatives
bring to a community and minimize potential problems?
The current phase of the research consists of developing a preliminary desk study that has the potential
to lead to an in-depth field study of a selected number of cases. This first study is divided into two
main tasks:
Mapping existing projects implemented by the selected sample of CDOs.
Selecting four countries and a number of projects in each country from this group.
Subsequently, an exploratory study will be conducted, with the aim of investigating regulatory
frameworks, legal backgrounds of the selected countries, and the main features of selected
cooperative development projects to identify a set of hypotheses concerning project outcomes.
This report gives an overview resulting from the mapping of recent projects in the selected area of
study.

4
2. Background literature
Cooperatives and producer organizations can play an important role in poverty reduction and
increased wellbeing in rural areas, which is the reason they are supported as a crucial tool in
development programs.
In most sub-Saharan African countries, agrarian cooperatives have a complex history. The “western”
notion of cooperative enterprise was introduced by a colonial power, but often it became a tool used
by the decolonization governments to promote development in rural areas. In most countries the
cooperative movement declined between the 1980s and the 1990s for two main reasons (Develtere,
Pollet and Wanyama, 2008):
It became a top-down tool, where cooperatives became more akin to State enterprises, as
happened, e.g., in Mozambique in the early 1980s.
Structural adjustment policies negatively affected the development of cooperatives, has
happened, e.g., in Zambia (or in Mozambique in later years).
However, many traditional forms of cooperation have survived the impact of colonialism and the
adverse consequences of the structural adjustment policies. In n some instances, these organizations
have paved the way for the emergence of modern unions and federations, resulting into the structural
reorganizations of the cooperative movement (Borzaga and Galera, 2014). Today, we observe a
renewed interest in cooperatives by international agencies, civil society organizations, and farmers’
movements in most African countries. Cooperative enterprises can play an important role in
economies where the agribusiness model is widely expanding and important issues are being tackled.
Among these issues are the limited bargaining power of smallholders with respect to “big” buyers
and the selection of large-scale growers into contract-farming arrangements. In both cases, lower
transaction costs can result in a pattern of exclusion. Cooperatives can intervene by organizing the
supply side, which counterbalances buyers’ market power.
The plurality of ownership structures and organizational goals also helps to prevent the formation of
monopolies, provides opportunities for innovation, and limits information asymmetries (Borzaga and
Galera, 2012). Cooperatives can facilitate the introduction of agricultural production innovations
where producers would not receive the necessary push from market forces alone (Logue and Yates,
2005). For example, sources of information may not be available or suitable for the smallholders’
needs, while cooperatives can provide them.
Cooperatives can also play a role in mitigating the risk embedded in the production process by means
of loss-sharing mechanisms. They serve this function through different tools: by transferring the risks
from the individuals to the organization, by allowing for a more diversified range of activities, or by
providing social security arrangements, reducing both idiosyncratic and collective risks (Birchall,
2003).
Nevertheless, in cooperative development projects, several problems may arise. Problems common
to all interventions are, for example, promoting participation (Mansuri and Rao, 2013) and triggering
bottom-up processes. Moreover, cooperatives rely crucially on regulatory frameworks that recognize
their specificity and set the rules for their functioning. The absence or incompleteness of these legal
instruments may affect the effectiveness and sustainability of cooperative enterprises.
5
3. Methodology
During August and September 2015, a selected sample of CDOs was invited to participate in a survey
about their recent cooperative development projects in the agricultural sector in Africa. Selected
CDOs provided information on 186 projects in 30 different countries. In this report, some descriptive
figures of the resulting dataset are presented, disaggregated at the CDO, country, and project levels.
3.1 Selection of CDOs
The first step was the selection of 15 CDOs, which were chosen for their proximity to the North
American and European cooperative movements.
CDOs are defined as organizations providing “technical assistance for the formation of cooperatives
in the operation of established cooperatives. CDOs can be non-profit organizations, co-ops, for-profit
entities, or government agencies,” (Nadeau and Scott Kennedy, 2015: 4). This broad definition
includes several types of organizations; nevertheless, a narrower range of CDOs was selected.
All selected CDOs are characterized by their proximity to the European, US, and Canadian
cooperative movements, but they have different legal structures. Three types of CDOs are present in
the selected sample: cooperative enterprises (or federations of cooperatives), non-profit organizations
(NPOs) created by cooperative organizations for the promotion of the cooperative model in
developing countries, and research institutions. These different organizational types will be addressed
in the data analysis section devoted to CDOs.
The 15 selected organizations included the following:
Six organizations headquartered in the US: Agricultural Cooperative Development
International & Volunteers in Overseas Cooperative Assistance1 (ACDI/VOCA), Cooperative
Resources International2 (CRI); Global Communities3; Land O’Lakes Inc.4, World Council
of Credit Unions5 (WOCCU); and the National Cooperative Business Association CLUSA
International6 (NCBA-CLUSA).
Two organizations based in Canada: Société de Coopération pour le Développement
International7 (SOCODEVI) and the Canadian Cooperative Association8 (CCA).
Seven organizations headquartered in different European countries: The Co-operative
College9 (UK); Coopermondo10 and Legacoop11(Italy); German Cooperative and Raiffeisen
Confederation12 (DGRV, Germany), European Community of Consumer Cooperatives13
1 http://acdivoca.org 2 http://cri.crinet.com 3 http://www.globalcommunities.org 4 http://www.landolakesinc.com 5 http://www.woccu.org 6 https://www.ncba.coop 7 http://socodevi.org 8 http://www.coopscanada.coop 9 http://www.co-op.ac.uk 10 http://www.coopermondo.it 11 http://www.legacoop.coop/ 12 https://www.dgrv.de/en/home.html 13 http://www.eurocoop.org
6
(EuroCoop, Belgium), Fédération Nationale des Coopératives d'Utilisation de Matériel
Agricole14 (FNCUMA, France); We Effect15 (Sweden).
The selection was voluntarily non-random, as the research targets a specific type of CDO, those linked
to the cooperative movement. The US-based organizations are members of OCDC16, while the
European ones are members of Cooperatives Europe and part of the initiative “Cooperatives in
Development”17.
An important caveat has to be made: these are non-exhaustive data on cooperative development in
Africa, and the figures that are presented in this report should not be considered an exhaustive picture
of cooperative development projects.
3.2 Questionnaire
Selected CDOs were asked to provide a list of their agricultural cooperative development projects
initiated or completed in the past 5 years (2010–2015) in African countries, along with some
information on each of them.
The questionnaire was composed of five sections:
Basic information: project title, country(ies), start and end years of activity
Funding: funding sources, organization names and types, project budget
Partnerships: name, type and country of each partner, identification of the lead organization
Activities: list of types of activities implemented
Availability of post-study or project evaluation material
The types of funding organizations, lead organizations, partners, and activities had been coded in
advance.
In regards to funding, the allowed options are listed in Table 1. The first two options include the
CDO’s own funds, while the others imply that the CDO applied for external funding, to public
national agencies (e.g., USAID), multilateral agencies (e.g., UNDP), private donors (e.g., the Bill and
Melinda Gates Foundation), or umbrella organizations of the cooperative movement (e.g., the
International Cooperative Alliance, or national organizations such as Legacoop in Italy).
Table 1: Types of donors
1. CDO’s own funds from members
2. CDO’s own funds from fundraising
3. Public national donor
4. Public multilateral donor
5. Private donor/foundation
6. National federation of co-ops
14 http://www.cuma.fr 15 http://www.weeffect.org 16 http://www.ocdc.coop/our_members.html 17 https://coopseurope.coop/development/

7
To identify the type of partnership that was formed, we provided a detailed list of lead and partner
organization types (illustrated in Table 2).
Table 2: Types of partner organizations
1. National cooperative federation (multi-sector or sectors other than agriculture)
2. Regional cooperative federation (multi-sector or sectors other than agriculture)
3. National cooperative federation (agricultural sector)
4. Regional cooperative federation (agricultural sector)
5. Other national federation of farmers
6. Other regional federation of farmers
7. First-level agricultural cooperative or farmers’ organization
8. National government or local administration
9. Civil society organization or NGO based in the beneficiary country (local organization)
10. International civil society organization or NGO (including branches in the beneficiary country)
11. International multilateral/governmental organization (including branches in the beneficiary country)
12. For-profit company
13. Research institution
14. First-level cooperative, different from agrarian co-op
Options 1 and 2, as well as option 14 represent cooperative organizations that are not specifically
agrarian; the first two options identify umbrella organizations, while the latter identifies first-level
organizations. The same distinction applies to categories 3, 4, and 7, which are meant to identify
agrarian cooperatives. Categories 5 and 6 identify organizations that represent farmers without being
cooperatives themselves.
Categories 9 and 10 include non-profit organizations (NPOs), distinguished between international
organizations (organizations based in Europe and North America) and local organizations (based in
African countries). For the sake of clarity, it is worth noting that while in Europe cooperatives are
generally considered part of the non-profit sector, in the US they are considered for-profit enterprises.
Therefore, to avoid problems with overlapping categories or different organizational
conceptualizations, a clear distinction has been made between first-level cooperative enterprises
(category 7), NPOs (categories 9 and 10), and for-profit companies, intended as capital-managed
firms (category 12). Categories 9 and 10 include civil society organizations, advocacy and faith based
organizations, as well as development NGOs. Most of the selected CDOs (10 out of 15) belong to
category 10, as they are NPOs created by the cooperative movement with the aim of promoting
cooperation, farmers’ organizations, or financial inclusion in developing countries, based on the
experience of cooperative movements in their home country.
The coding of the different types of activities conducted by selected CDOs (listed in Table 3) was
inspired by the classification used by the Cooperatives Europe initiative “Cooperatives in
Development”. The use of the same classification has been considered convenient for data
comparison and analysis.

8
Table 3: Types of activities
1. Training & capacity building
2. Consulting
3. Institutional building
4. Financial support & investment
5. Network building & strengthening
6. Technology & knowledge exchange
7. Trading
8. Legal framework & policy reform
9. Budget support & donations
10. Social integration
3.3 Questionnaire collection and methodology notes for dealing with missing information
Completion of the questionnaire was done in three steps:
The research team developed the questionnaire and contacted the CDOs to let them know
about the research and ask for their contribution. In a few cases, the CDOs directly completed
the questionnaire, while in most cases, they provided the information and material needed to
fill the questionnaire (web sites, project fiches, etc.).
The research team completed the questionnaires with all the information available. With
regard to the European organizations, the research team drew upon the “Cooperatives in
Development” platform18.
Subsequently, the research team asked the CDOs to check and complete the questionnaires.
The overall response of the selected CDOs was positive. Only one out of 15 CDOs never replied to
the invitation to participate in the research. However, as pointed out later in this report, not all sections
of the questionnaire have been exhaustively answered by the CDOs. In particular, budget information
on the implemented projects was most frequently missing. In these cases, the following general rules
were applied:
With regard to multi-country projects, in some cases CDOs provided a unified budget. In these
cases the overall budget has been divided by the number of countries, making the assumption
that the budget was distributed equally among them.
When the budget information was missing, but the CDOs provided information on a budget
range, the average value of the range was used, except for budget range 7 (see Table 4), where
we used the lower value US$10 million.
18 See https://coopseurope.coop/development/
9
Table 4: Budget range of implemented projects
1. < 5,000 US$
2. 5,000–100,000 US$
3. 100,000–500,000 US$
4. 500,000–1 million US$
5. 1–5 million US$
6. 5–10 million US$
7. > 10 million US$
4. Data overview
A total of 186 projects in 30 countries have been identified, almost entirely in sub-Saharan Africa19.
From North Africa, only Morocco and Tunisia are present, with two projects each. This is probably
due to the fact that, in the activities of CDOs, North Africa is typically considered a separate region,
considered a part of the Middle East in the MENA region.
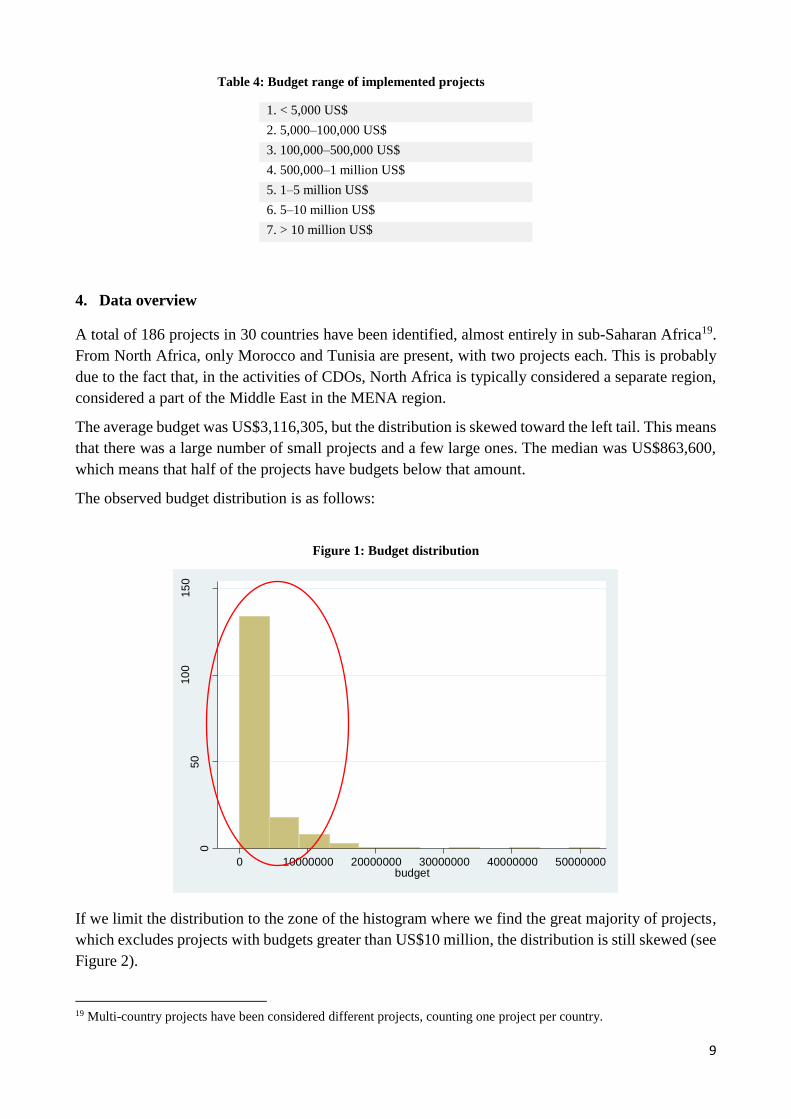
The average budget was US$3,116,305, but the distribution is skewed toward the left tail. This means
that there was a large number of small projects and a few large ones. The median was US$863,600,
which means that half of the projects have budgets below that amount.
The observed budget distribution is as follows:
Figure 1: Budget distribution
If we limit the distribution to the zone of the histogram where we find the great majority of projects,
which excludes projects with budgets greater than US$10 million, the distribution is still skewed (see
Figure 2).
19 Multi-country projects have been considered different projects, counting one project per country.
050
10
015
0
Fre
qu
en
cy
0 10000000 20000000 30000000 40000000 50000000budget

10
It should be noted that we only had budget information on 168 projects out of the total 186. The
remaining 15 projects are not considered when discussing budget-related issues.
Concerning their status, 74 out of 186 projects are ongoing, while 104 are closed. Information on the
current status of the remaining eight projects is not available.
The average duration of a project is almost 4 years (3.93 years), but 50% of projects last for 3 years
or less. A few projects cover a much longer span of time: 5 projects last 10 years or more. The mode
is 2 years, which is to say that this is the project duration that appears more frequently (in 41 cases
over the 175 that provide information on start and end year). The distribution of projects according
with their duration is depicted in Figure 3.
Figure 2: Budget distribution for projects below US$10 million
Figure 3: Frequency of projects duration
05
10
15
20
25
30
35
40
Fre
qu
en
cy
0 5 10 15 20 25 30duration

11
5. Summary statistics at the CDO level
In the classification of organizations shown in Table 2, among the selected CDOs it was possible to
identify two national (multisector) federations of cooperatives, two national federations of
agricultural cooperatives, one first-level cooperative, and one research institution, while the
remaining nine organizations are NPOs supported by the cooperative movement for advocacy
purposes and the promotion of cooperation around the world. These distinctions can be quite blurred,
and in some cases, they can overlap. The main example is the Cooperative College, which is both an
NPO linked to the cooperative movement and a research institution.
Dividing the CDO sample into two main groups according to the organization type highlighted some
interesting differences. One group is made up of CDOs that are non-profit organizations (10,
including the aforementioned, plus the Cooperative College), while a second one is made up of
cooperative enterprises or cooperative federations (five organizations). The former group implements
the great majority of projects (156), while the second carries on 30 projects.
It should be underlined that in a noticeable number of cases (59 out of 18620), the CDO was not the
project’s lead organization, but participated in a partnership led by another organization. This was a
more-frequent option in the case of CDOs that are cooperatives or cooperative federations, where
40% of projects have a lead organization different from the CDO. This was the case for 24.3% of
projects among CDOs that are NPOs.
Figure 4: Number of projects by CDOs
Concerning budget size, non-profit CDOs had, on average, larger projects (US$3.8 million),
compared to US$2.7 million, but the difference was not statistically significant. Taking a closer look
at each CDO, we obtain a different picture based on the project size. The organization that
20 The information on the lead organization is missing for 25 projects.
ACDI-VOCA; 17CCA; 10 Cooperative College; 9
Coopermondo; 10 CRI; 1
DGRV; 3
EuroCoop; 6
FNCUMA; 2
Global Communities; 4
Legacoop; 9
LOL; 15NCBA - CLUSA; 13
SOCODEVI; 27
We Effect; 58
WOCCU; 2

12
implemented the greatest number of projects was the Swedish CDO, We Effect, with 58 projects,
almost one-third of the whole sample. Following We Effect were SOCODEVI (Canada) and three
US-based CDOs (ACDI/VOCA, Land O’Lakes Inc., and NCBA-CLUSA).
Comparing this picture to the distribution of the total budget across CDOs showed some important
differences. More than 70% of the total budget in the sample (the sum of all 186 projects) was
managed by the three bigger US-based organizations: ACDI/VOCA, Land O’Lakes, Inc., and NCBA-
CLUSA21. The differences between each CDO in terms of the number of projects and share of the
total budget revealed differences in the project size and, probably, in intervention strategies.
Some organizations opted for a model based on a large number of relatively small projects, while
others relied on a smaller number of larger projects. Figure 5 shows the average project size of each
CDO, matched with the number of projects. Three main groups of CDOs can be identified according
to these factors. In addition to the largest group in the bottom left corner, there are two organizations
with a large number of projects, each with a relatively low budget, and six CDOs with relatively high
budgets concentrated on a smaller number of projects.
Figure 5: Scatterplot of the number of projects and project size
Note: Each dot is a CDO. No budget information is available for one of the selected CDOs, therefore only 14 CDOs are represented in
the graphic.
In terms of sources of funding, the research team wondered whether the CDOs rely on different
donors and fundraising strategies. All selected CDOs apply for external funds (public or private), and
the great majority of projects are funded by public national agencies. A comparison between the two
main types of CDOs (Figures 6 and 7) showed some differences in funding sources:
21 The data for one CDO, Euro Coop, are missing, as any budget information was provided.
0
2000000
4000000
6000000
8000000
10000000
12000000
0 10 20 30 40 50 60 70
aver
age
pro
ject
bu
dge
t
number of projects
13
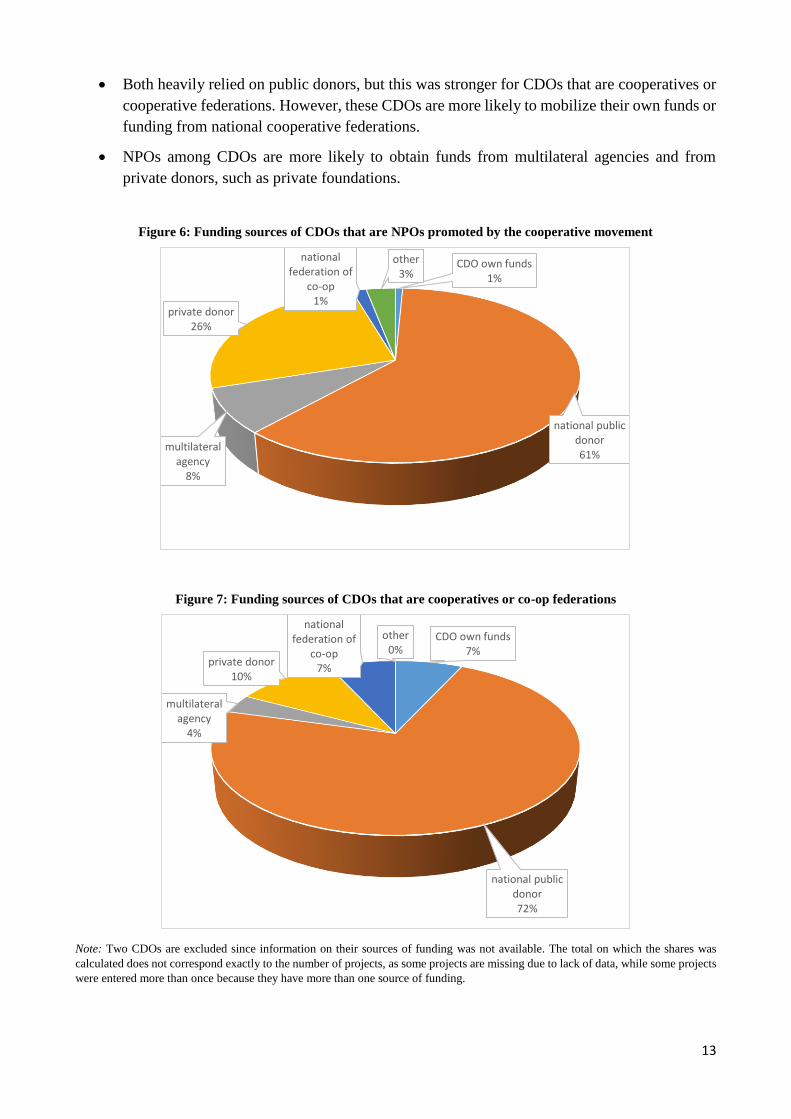
Both heavily relied on public donors, but this was stronger for CDOs that are cooperatives or
cooperative federations. However, these CDOs are more likely to mobilize their own funds or
funding from national cooperative federations.
NPOs among CDOs are more likely to obtain funds from multilateral agencies and from
private donors, such as private foundations.
Figure 6: Funding sources of CDOs that are NPOs promoted by the cooperative movement
Figure 7: Funding sources of CDOs that are cooperatives or co-op federations
Note: Two CDOs are excluded since information on their sources of funding was not available. The total on which the shares was
calculated does not correspond exactly to the number of projects, as some projects are missing due to lack of data, while some projects
were entered more than once because they have more than one source of funding.
CDO own funds1%
national public donor61%
multilateral agency
8%
private donor26%
national federation of
co-op1%
other3%
CDO own funds7%
national public donor72%
multilateral agency
4%
private donor10%
national federation of
co-op7%
other0%

14
Figure 8: Partnerships of CDOs that are NPOs promoted by the cooperative movement
Figure 9: Partnerships of CDOs that are cooperatives or co-op federations
The same comparison can be done on the type of other partners involved in the projects. Figures 8
and 9 represent the share of times a type of organization appeared in a partnership with the two main
types of CDOs. A single project may have been counted more than once, as it may have involved
more than one partner. It seemed more likely that a non-profit CDO had a partnership with another
NPO, while a co-op-CDO was more likely to have a partnership with a first-level cooperative firm.
federation of co-op8% 1st level co-op
3%
farmers' federation18%
1st level farmers' organization
2%
government3%
non-profit organization
46%
multilateral organization
2%
for profit company10%
research institution7%
other1%
federation of co-op12% 1st level co-op
2%
farmers' federation5%
1st level farmers' organization
29%
government7%
non-profit organization
29%
multilateral organization
0%
for profit company5%
research institution2%
other9%

15
This was likely driven by the fact that CDOs usually are considered partners themselves22, and
therefore were counted in the graph. It is worth to note that cases where an NPO-CDO engaged in a
partnership with a first-level cooperative were rare, while it was more likely that they entered into a
partnership with a farmers’ federation. Co-op CDOs were more likely to enter into partnerships with
governments and local administrations. It was also more likely that NPOs jointly worked with private
for-profit companies and research institutions.
Concerning project duration, we can see that projects carried out by first-level cooperatives or
farmers’ organizations are a bit above the average.
Table 5: Average project duration by type of CDO
Type of CDO Average duration
National cooperative federation (multi-sector or sectors other than agriculture) 3,8
First-level agricultural cooperative or farmers’ organization 4,6
International civil society organization or NGO (including branches in the beneficiary
country)
3,9
Research institution 2,5
6. Summary statistics at the country level
Information collected shows that projects were quite concentrated in a small number of countries,
mainly in eastern and southern Africa, with the first 10 countries hosting 132 projects out of 186—
more than 70%. Among these 10 countries, the only West African countries were Senegal and Mali;
the latter was mainly a focus of one CDO, the Canada-based SOCODEVI.
Figure 10: Number of projects by country
22 This is not always the case, as some CDOs simply add supporting agencies for their members, which is often the case
for the Italian Legacoop.
24
18
17
13
13
12
11
10
10
9
5 5 5
4 4
3 3 3 3
2 2 2
1 1 1 1 1 1 1 1

16
The countries that host the most projects were Kenya (24), Tanzania (18) and Uganda (17), followed
by Ethiopia and Rwanda (13), Zambia (12), Malawi (11), Mali and Mozambique (10), and Senegal
(9).
Figure 11: Share of projects according to country distribution
The distribution of the project status in each country is illustrated in Figure 12.
Figure 12: Number of projects by country and status
Kenya13%
Tanzania10%
Uganda9%
Ethiopia7%
Rwanda7%Zambia
7%
Malawi6%
Mali5%
Mozambique5%
Senegal5%
others26%
0
5
10
15
20
25
30
Ken
ya
Tan
zan
ia
Uga
nd
a
Eth
iop
ia
Rw
and
a
Zam
bia
Mal
awi
Mal
i
Mo
zam
biq
ue
Sen
ega
l
Gh
ana
Lib
eri
a
Zim
bab
we
Ivo
ry C
oas
t
Mad
agas
car
Cam
ero
on
Nig
eria
Sier
ra L
eon
e
Sou
th A
fric
a
Mo
rocc
o
Nig
er
Tun
isia
Ben
in
Bu
rkin
a Fa
so
Leso
tho
Nam
ibia
Sou
th S
ud
an
Swaz
ilan
d
Tch
ad
Togo
Tito
lo a
sse
Titolo asse
ongoing projects closed projects no data

17
A single CDO, We Effect (Sweden), carried out about one-third of the projects—17 of 24 in Kenya,
nine of 18 in Tanzania, and 12 of 16 in Uganda. The number of donors active in a specific country
varied. As mentioned before about Mali, some countries were the focus of one or a few CDOs. In
other countries, we observed the presence of a greater number of donors. This meant that the donors’
scope in each country was quite variable. This is captured in Figure 13, which plots the number of
projects and CDOs in each country.
Figure 13: Number of projects and CDOs
Figure 13 identifies a group of countries (upper-right part of the scatterplot) that had both a large
number of projects and high diversification among the CDOs involved: Kenya, Tanzania, Uganda,
Rwanda, Mozambique, and Ethiopia.
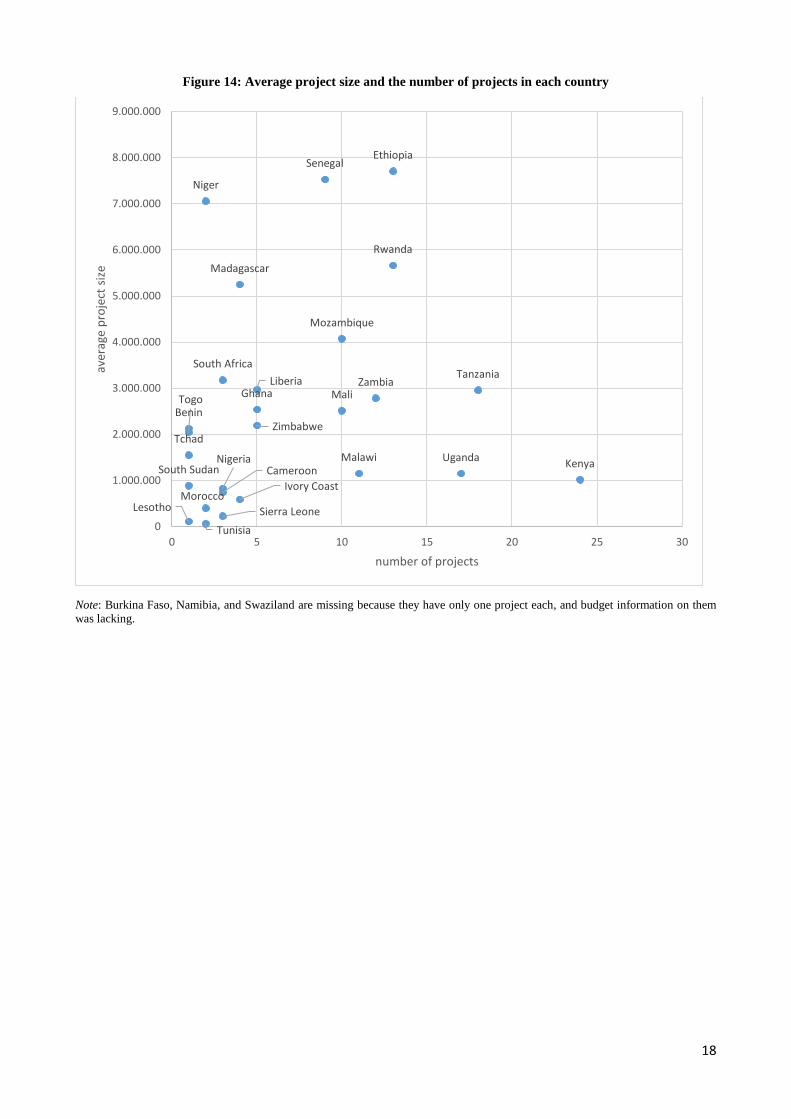
At the country level, an important information is the average size of projects or the ratio between the
overall resource allocation and the number of projects implemented. Countries where a greater budget
overall (US$50–100 million) was disbursed were Ethiopia, Rwanda, Senegal, and Tanzania. The
ranking only partially overlapped with the rank based on the number of projects where the top
countries were Kenya, Tanzania, Ethiopia, and Rwanda. Figure 14 shows where the largest projects
in terms of budget were located: Ethiopia, Senegal, and Niger, followed by Rwanda, Madagascar,
and Mozambique.
South Africa; 3; 3
Morocco; 2; 2
Madagascar; 3; 2
Mozambique; 10; 6
Ghana; 5; 3
Senegal; 8; 4
Niger; 2; 1
Tunisia; 2; 1
Ethiopia; 13; 6
Malawi; 10; 4
Liberia; 5; 2
Zimbabwe; 5; 2
Rwanda; 13; 5
Zambia; 12; 4
Cameroon; 3; 1 Nigeria; 3; 1
Sierra Leone; 3; 1
Uganda; 17; 5Tanzania; 18; 5
Kenya; 24; 6
Ivory Coast; 4; 1
Mali; 10; 2
0
1
2
3
4
5
6
7
0 5 10 15 20 25 30
nu
mb
er o
f n
ort
her
n C
DO
s
number of projects
18
Figure 14: Average project size and the number of projects in each country
Note: Burkina Faso, Namibia, and Swaziland are missing because they have only one project each, and budget information on them
was lacking.
Ethiopia
Rwanda
Senegal
TanzaniaZambia
Mozambique
Mali
UgandaKenya
Madagascar
Liberia
Niger
Malawi
Zimbabwe
Ghana
South Africa
Nigeria
Ivory Coast
BeninTogo
Tchad
CameroonSouth Sudan
Sierra Leone
MoroccoLesotho
Tunisia0
1.000.000
2.000.000
3.000.000
4.000.000
5.000.000
6.000.000
7.000.000
8.000.000
9.000.000
0 5 10 15 20 25 30
aver
age
pro
ject
siz
e
number of projects

19
Table 6 summarizes the size of the projects’ budgets and the total budget disbursed in each country.
Table 6: Number of projects, average project size, and total budget per country
Country Number of projects Average budget
(US$)
Total budget
disbursed
(US$)
Ethiopia 13 7,705,422 100,170,488
Rwanda 13 5,663,204 73,621,648
Senegal 9 7,529,865 67,768,784
Tanzania 18 2,955,723 53,203,008
Zambia 12 2,782,878 33,394,534
Mozambique 10 4,070,906 32,567,248
Mali 10 2,511,156 25,111,554
Uganda 17 1,149,161 18,386,576
Kenya 24 1,015,899 18,286,188
Madagascar 4 5,247,900 15,743,700
Liberia 5 2,963,926 14,819,630
Niger 2 7,058,608 14,117,215
Malawi 11 1,151,961 11,519,614
Zimbabwe 5 2,192,435 10,962,176
Ghana 5 2,537,592 10,150,368
South Africa 3 3,179,973 9,539,920
Nigeria 3 825,175 2,475,527
Ivory Coast 4 590,327 2,361,310
Benin 1 2,125,000 2,125,000
Togo 1 2,045,763 2,045,763
Tchad 1 1,550,747 1,550,747
Cameroon 3 737,968 1,475,936
South Sudan 1 885,074 885,074
Sierra Leone 3 228,750 686,252
Morocco 2 399,996 399,996
Lesotho 1 110,465 110,465
Tunisia 2 60,554 60,554
Total 183 2,565,794 523,478,721
Note: When data on projects were missing, an interpolation was made, using the average budget size of each country. This also explains
the difference between the total average and the total average discussed in the previous pages. Burkina Faso, Namibia, and Swaziland
are missing because they had only one project each, and budget information was not provided.
20
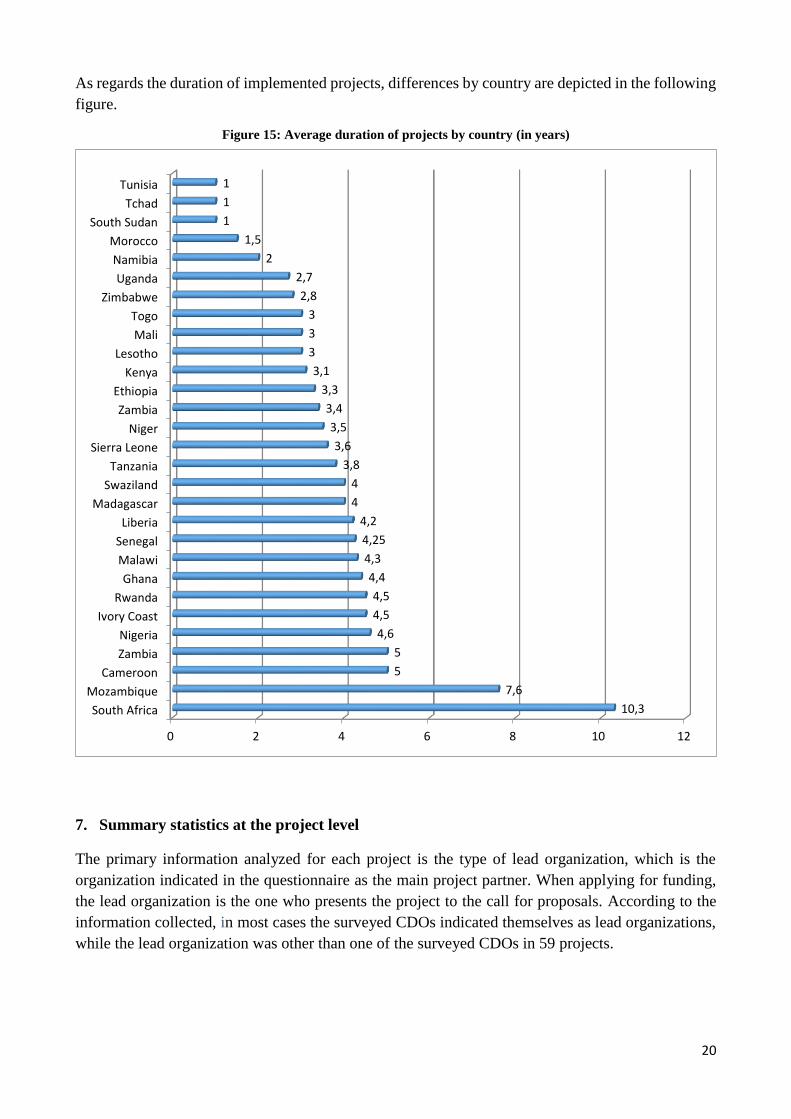
As regards the duration of implemented projects, differences by country are depicted in the following
figure.
Figure 15: Average duration of projects by country (in years)
7. Summary statistics at the project level
The primary information analyzed for each project is the type of lead organization, which is the
organization indicated in the questionnaire as the main project partner. When applying for funding,
the lead organization is the one who presents the project to the call for proposals. According to the
information collected, in most cases the surveyed CDOs indicated themselves as lead organizations,
while the lead organization was other than one of the surveyed CDOs in 59 projects.
0 2 4 6 8 10 12
South Africa
Mozambique
Cameroon
Zambia
Nigeria
Ivory Coast
Rwanda
Ghana
Malawi
Senegal
Liberia
Madagascar
Swaziland
Tanzania
Sierra Leone
Niger
Zambia
Ethiopia
Kenya
Lesotho
Mali
Togo
Zimbabwe
Uganda
Namibia
Morocco
South Sudan
Tchad
Tunisia
10,3
7,6
5
5
4,6
4,5
4,5
4,4
4,3
4,25
4,2
4
4
3,8
3,6
3,5
3,4
3,3
3,1
3
3
3
2,8
2,7
2
1,5
1
1
1

21
As shown in Table 7, the majority of projects were led by NPOs based in the donor countries. In most
cases, these were the CDOs themselves, but they could also be international development NGOs. In
28 cases, the leading organization was a cooperative enterprise or second-level organization.
Table 7: Frequency table of lead organization types
Lead organization Frequency
1. National cooperative federation (multisector or sectors other than agriculture) 9
3. National cooperative federation (agricultural sector) 1
4. Regional cooperative federation (agricultural sector) 1
6. Other regional federation of farmers 1
7. First-level agricultural cooperative or farmers’ organization 15
8. National government or local administration 2
9. Civil society organization or NGO based in the beneficiary country (local organization) 1
10. International civil society organization or NGO (including branches in the beneficiary country) 121
12. For-profit company 3
13. Research institution 6
14. First-level cooperative, different from agricultural co-op 1
Note: Twenty-five projects are missing from the count because information on the lead organization was not available.
Table 8 shows who was leading the partnership when the CDO was not the leading organization. This
picture is similar to the overall one, as NPOs were the most-frequent option. However, in this
subsample a greater role is played by national multisector cooperative federations.
Table 8: Frequency table of lead organization types when CDO is not the leading organization
Lead organization Frequency
1. National cooperative federation (multisector or sectors other than agriculture) 6
4. Regional cooperative federation (agricultural sector) 1
6. Other regional federation of farmers 1
7. First-level agricultural cooperative or farmers’ organization 1
8. National government or local administration 2
9. Civil society organization or NGO based in the beneficiary country (local organization) 1
10. International civil society organization or NGO (including branches in the beneficiary’s country) 18
12. For profit company 3
14. First-level cooperative, different from agricultural co-op 1
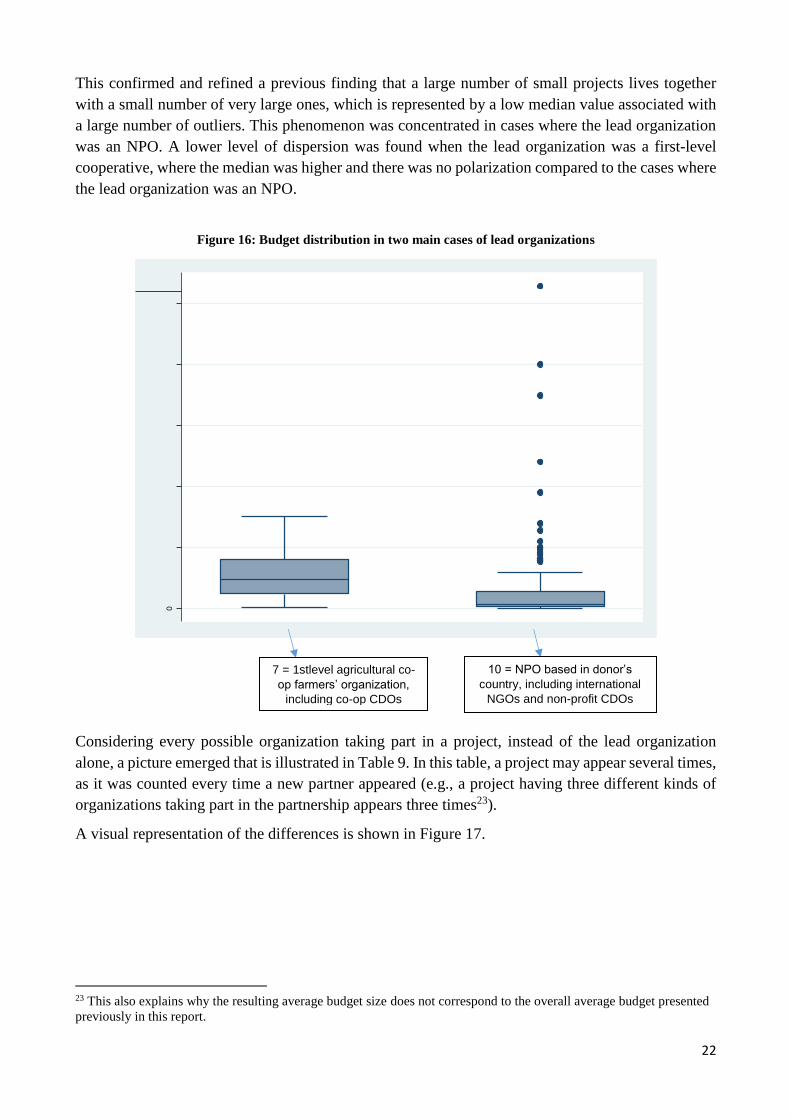
The comparison between the two main types of lead organizations in terms of budget size showed the
huge dispersion of projects led by an NPO. Figure 16 summarizes the budget distribution for the main
types of lead organizations. The limits of the box are the 25th and the 75th quartiles (the interquartile
range), while the line inside the box is the median, which is the value that divides the distribution in
a half (leaving 50% of observations below it). The “whiskers” represent 1.5 x (interquartile range);
the values left out are considered outliers. The plot on the right represents a situation in which a large
number of projects is above the limit that defines the outliers.
22
This confirmed and refined a previous finding that a large number of small projects lives together
with a small number of very large ones, which is represented by a low median value associated with
a large number of outliers. This phenomenon was concentrated in cases where the lead organization
was an NPO. A lower level of dispersion was found when the lead organization was a first-level
cooperative, where the median was higher and there was no polarization compared to the cases where
the lead organization was an NPO.
Figure 16: Budget distribution in two main cases of lead organizations
Considering every possible organization taking part in a project, instead of the lead organization
alone, a picture emerged that is illustrated in Table 9. In this table, a project may appear several times,
as it was counted every time a new partner appeared (e.g., a project having three different kinds of
organizations taking part in the partnership appears three times23).
A visual representation of the differences is shown in Figure 17.
23 This also explains why the resulting average budget size does not correspond to the overall average budget presented
previously in this report.
0
10
00
00
00
20
00
00
00
30
00
00
00
40
00
00
00
50
00
00
00
bu
dg
et
7 = 1stlevel agricultural co-
op farmers’ organization,
including co-op CDOs
10 = NPO based in donor’s
country, including international
NGOs and non-profit CDOs

23
Table 9: Number of projects and average budget per project
identified by different kinds of partners
Type of organization included in the partnership Number of
projects
Average budget
(US$)
Cooperative federation (not specifically agricultural) 29 1,552,096
First-level co-op (not specifically agricultural) 9 2,522,298
Farmers' federation 50 1,411,857
Farmers' first-level organization 21 4,760,770
Government or local administration 11 1,594,939
NPO 138 3,368,443
Multilateral organization 6 22,327,168
For-profit company 29 10,515,518
Research institution 19 2,680,197
Other organizations 7 3,124,331
Figure 17: Budget size and frequencies of different partnerships
In Figure 17, the x-axis shows the frequency of projects that involved at least one partner of the
corresponding type, while the y-axis shows the average budget for each type. If a project had more
than one type of partner, it was counted more than one time in the plot. This graph illustrates that
projects involving multilateral organizations are much larger than the others, but they are relatively
infrequent. NPOs are the most frequent partners and appear in the majority of projects, while their
budgets are below the average. Projects involving a cooperative or farmers’ federation had, on
average, the smallest budgets.
cooperative federation
first level coop
farmers' federation
farmers' first level org
government or local administration
NPO
multilateral org
for profit company
research instit
0
5.000.000
10.000.000
15.000.000
20.000.000
25.000.000
0 20 40 60 80 100 120 140 160
aver
age
bu
dge
t fo
r p
roje
cts
wit
h t
his
kin
d o
f p
artn
er
number of projects that have this type of partner
24
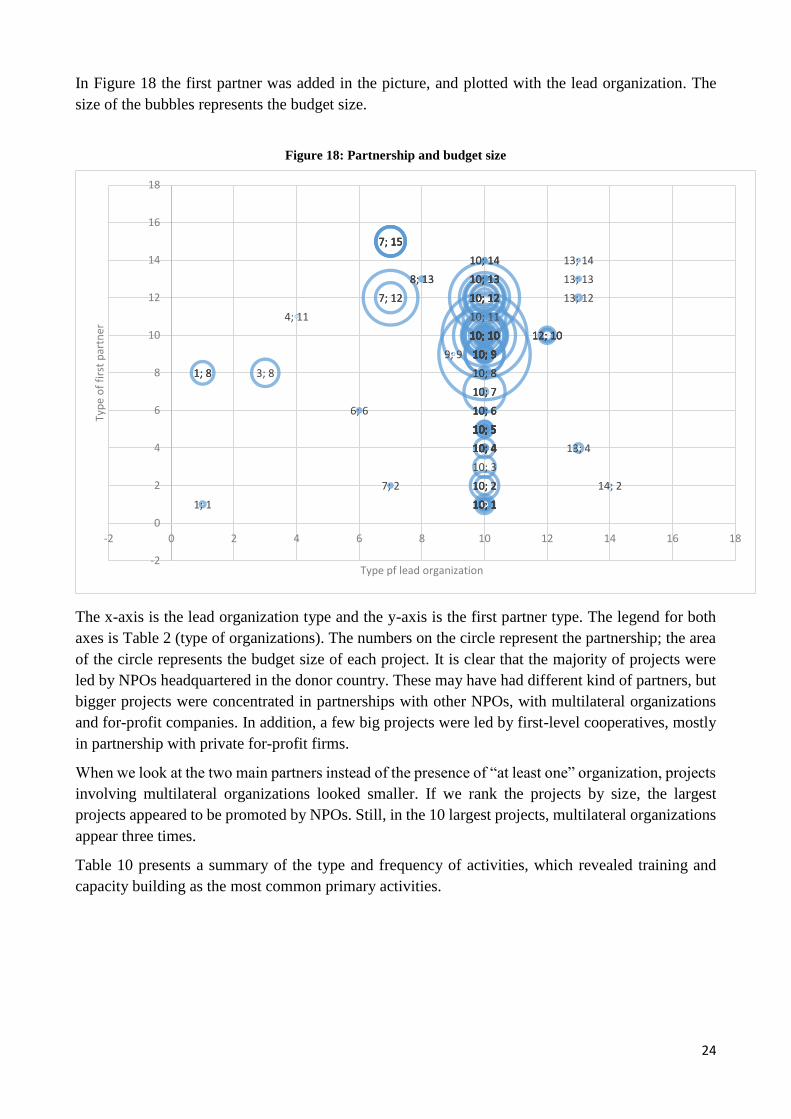
In Figure 18 the first partner was added in the picture, and plotted with the lead organization. The
size of the bubbles represents the budget size.
Figure 18: Partnership and budget size
The x-axis is the lead organization type and the y-axis is the first partner type. The legend for both
axes is Table 2 (type of organizations). The numbers on the circle represent the partnership; the area
of the circle represents the budget size of each project. It is clear that the majority of projects were
led by NPOs headquartered in the donor country. These may have had different kind of partners, but
bigger projects were concentrated in partnerships with other NPOs, with multilateral organizations
and for-profit companies. In addition, a few big projects were led by first-level cooperatives, mostly
in partnership with private for-profit firms.
When we look at the two main partners instead of the presence of “at least one” organization, projects
involving multilateral organizations looked smaller. If we rank the projects by size, the largest
projects appeared to be promoted by NPOs. Still, in the 10 largest projects, multilateral organizations
appear three times.
Table 10 presents a summary of the type and frequency of activities, which revealed training and
capacity building as the most common primary activities.
10; 10
10; 12
10; 10
10; 12
10; 1010; 10 12; 1010; 10 12; 1012; 10
10; 110; 110; 1
10; 9
10; 2
10; 9
10; 1
10; 8
10; 9
10; 1310; 1310; 1310; 13
13; 4
10; 10
13; 12
8; 13 13; 13
13; 14
8; 13
10; 2
10; 910; 910; 910; 910; 9
7; 2
9; 9
4; 11
14; 2
3; 81; 8
1; 1
1; 8
10; 1
6; 6
10; 1010; 1010; 10
10; 9
10; 2
10; 7
7; 12
10; 7
7; 12
7; 157; 157; 157; 15
10; 9
10; 12
10; 11
10; 12
10; 9
10; 1210; 1210; 12
10; 9
10; 8
10; 1010; 1010; 1010; 1010; 1010; 1010; 10
10; 3
10; 4
10; 1010; 1010; 1010; 10
10; 510; 510; 510; 510; 510; 510; 510; 510; 5
10; 7
10; 410; 4
10; 510; 5
10; 9
10; 510; 5
10; 4
10; 510; 5
10; 6
10; 5
10; 1010; 1010; 1010; 10
10; 4
10; 6
10; 5
10; 4
10; 14
10; 6
10; 4
10; 5
10; 14
10; 4
10; 5
10; 9
10; 4
10; 1
10; 6
10; 510; 510; 5
10; 10
10; 12
-2
0
2
4
6
8
10
12
14
16
18
-2 0 2 4 6 8 10 12 14 16 18
Typ
e o
f fi
rst
par
tner
Type pf lead organization

25
Table 10: Type and frequency of activities
Type of activity Primary activity Secondary activity
1. Training & capacity building 123 16
2. Consulting 13 27
3. Institution building 2 21
4. Financial support & investment 6 24
5. Network building & strengthening 6 15
6. Technology & knowledge exchange 2 15
7. Trading 4 10
8. Legal framework & policy reform 1 1
9. Budget support & donations 6
10. Social integration 5 2
Not only the majority of projects, but also the majority of funds went to capacity-building activities,
as shown in Figure 19. Middle-level budgets were disbursed for other kinds of activities, such as
financial support and investment, trading, legal and policy reform, and network building.
Figure 19: Lead organization, primary activity, and budget size
Note: The x-axis shows the types of lead organizations, and the y-axis shows the types of activities. The size of the bubbles represents
the budget size. For cases where the lead organization was a national federation of cooperatives (1) and the activity was budget support
(9), budget data were missing.
10; 110; 1
10; 4
10; 110; 110; 110; 110; 110; 110; 1
12; 210; 2
12; 112; 110; 110; 110; 1
10; 4
10; 10
10; 6
10; 4
10; 110; 1
10; 7
10; 1010; 1010; 10
10; 110; 110; 110; 110; 17; 1
9; 4
4; 1 14; 13; 1
1; 21; 21; 2
1; 91; 91; 91; 91; 91; 9
10; 16; 1 10; 110; 110; 110; 1
10; 6
10; 110; 110; 110; 110; 110; 17; 17; 17; 1 10; 17; 1
7; 5
7; 17; 1
7; 57; 5
7; 4
7; 5
7; 3
7; 17; 1 10; 110; 1
10; 7
10; 4
10; 8
10; 3
10; 10
10; 1
10; 510; 5
10; 7
10; 2
10; 110; 110; 110; 110; 110; 110; 110; 110; 110; 110; 110; 110; 110; 110; 1
10; 2
10; 110; 110; 1
10; 2
10; 110; 1
10; 2
10; 7
10; 110; 110; 110; 110; 110; 1
10; 2
10; 110; 110; 110; 110; 110; 110; 110; 110; 110; 110; 110; 110; 110; 1
10; 2
10; 110; 1
10; 2
10; 110; 110; 1
10; 2
10; 110; 110; 110; 110; 110; 110; 110; 110; 110; 1
-2
0
2
4
6
8
10
12
-2 0 2 4 6 8 10 12 14 16 18
Pri
mar
y ac
tivi
ty t
ype
Lead organization type
1. Training & capacity building
26
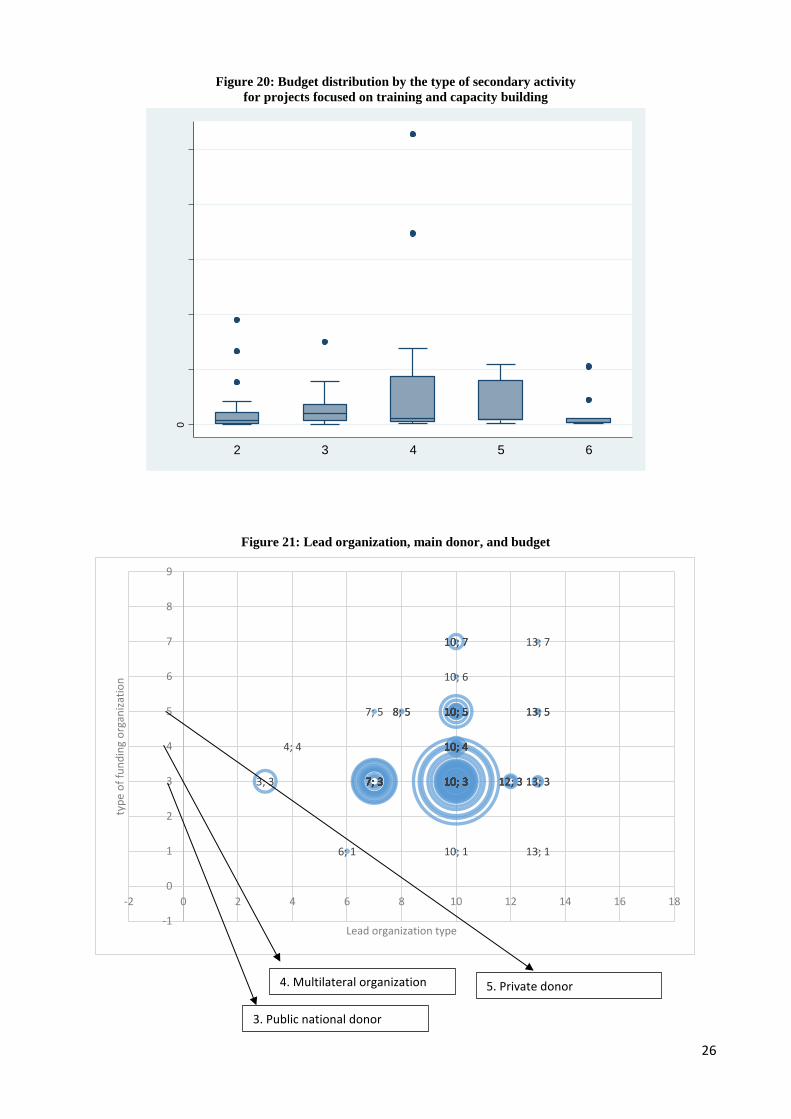
Figure 20: Budget distribution by the type of secondary activity
for projects focused on training and capacity building
Figure 21: Lead organization, main donor, and budget
0
10
00
00
00
20
00
00
00
30
00
00
00
40
00
00
00
50
00
00
00
bu
dg
et
2 3 4 5 6
10; 310; 310; 310; 310; 310; 310; 310; 310; 310; 3 12; 310; 3 12; 312; 310; 310; 310; 3
10; 510; 510; 510; 5
10; 4
10; 510; 510; 5
10; 6
10; 7
13; 313; 3
13; 58; 5 13; 5
13; 1
8; 5
13; 710; 7
10; 5
10; 410; 4
10; 510; 57; 5
4; 4
3; 3 10; 3
6; 1
10; 310; 310; 310; 3
10; 5
10; 3
10; 1
7; 37; 37; 3 10; 37; 37; 37; 37; 37; 37; 37; 37; 37; 37; 37; 3 10; 310; 310; 310; 310; 310; 310; 310; 310; 310; 310; 310; 310; 310; 310; 3
10; 410; 410; 410; 410; 4
10; 310; 310; 310; 310; 310; 310; 310; 310; 310; 310; 310; 310; 310; 310; 310; 310; 310; 310; 310; 3
-1
0
1
2
3
4
5
6
7
8
9
-2 0 2 4 6 8 10 12 14 16 18
typ
e o
f fu
nd
ing
org
aniz
atio
n
Lead organization type
3. Public national donor
4. Multilateral organization 5. Private donor
27
Figure 20 shows the distribution of budgets for secondary activities for projects that had training and
capacity building as their primary activities. Projects that also did institution-building activities had
a higher median, while projects focusing on financial support and investment were more dispersed
and had higher budgets.
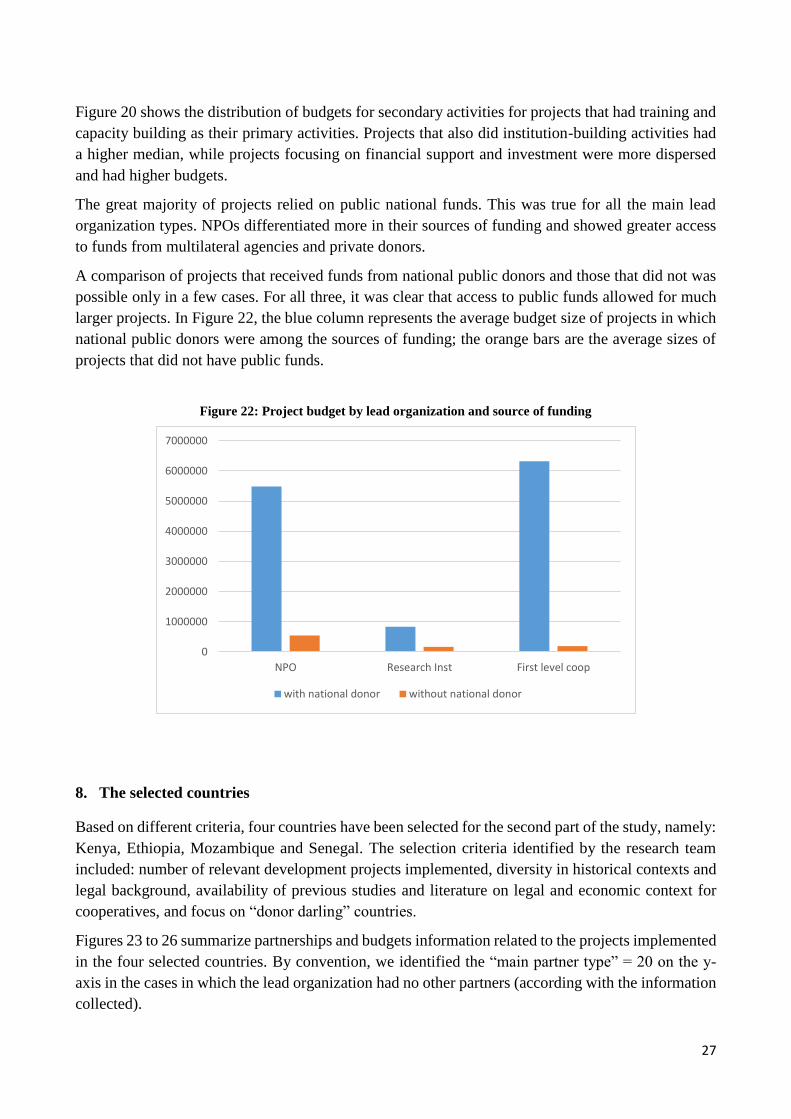
The great majority of projects relied on public national funds. This was true for all the main lead
organization types. NPOs differentiated more in their sources of funding and showed greater access
to funds from multilateral agencies and private donors.
A comparison of projects that received funds from national public donors and those that did not was
possible only in a few cases. For all three, it was clear that access to public funds allowed for much
larger projects. In Figure 22, the blue column represents the average budget size of projects in which
national public donors were among the sources of funding; the orange bars are the average sizes of
projects that did not have public funds.
Figure 22: Project budget by lead organization and source of funding
8. The selected countries
Based on different criteria, four countries have been selected for the second part of the study, namely:
Kenya, Ethiopia, Mozambique and Senegal. The selection criteria identified by the research team
included: number of relevant development projects implemented, diversity in historical contexts and
legal background, availability of previous studies and literature on legal and economic context for
cooperatives, and focus on “donor darling” countries.
Figures 23 to 26 summarize partnerships and budgets information related to the projects implemented
in the four selected countries. By convention, we identified the “main partner type” = 20 on the y-
axis in the cases in which the lead organization had no other partners (according with the information
collected).
0
1000000
2000000
3000000
4000000
5000000
6000000
7000000
NPO Research Inst First level coop
with national donor without national donor

28
Figure 23: Kenya - partnership and budget size
The main element of the Kenyan picture is the polarization between two large projects and a large
number of small projects led by international NPOs with different kinds of partners. The two large
projects were led by an NPO-for profit partnership and a first-level co-op organization.
Figure 24: Ethiopia - partnership and budget size
10; 10; 1.222.127
10; 1; 863.600
7; 15; 4.790.300
10; 8; 1.032.656
10; 10; 2.017.815
10; 20; 1.583.410
10; 20; 726.968
10; 10; 234.802
10; 6; 198.422
10; 4; 191.657
10; 14; 191.657
10; 6; 180.383
10; 5; 169.109
10; 14; 157.835
10; 5; 135.254
10; 5; 45.09610; 5; 45.096
10; 12; 4.500.000
-5
0
5
10
15
20
25
-2 0 2 4 6 8 10 12
Mai
n p
artn
er
typ
e
Lead organization type
10; 20; 52.785.43610; 20; 13.902.560
10; 20; 5.923.522
10; 1; 863.600
10; 9; 2.100.000
10; 8; 500.000
10; 10; 554.720
8; 13; 250.506
8; 13; 48.205
1; 8; 52.500
7; 20; 10.599.136
7; 15; 4.790.30010; 10; 7.800.000
-5
0
5
10
15
20
25
-2 0 2 4 6 8 10 12
Mai
n p
artn
er
typ
e
Lead organization type

29
In the Ethiopian case, one project attracted the lion’s share of funds and involved an international
NPO. Between this and a large number of very small projects, it was possible to identify two mid-
range projects led by an NPO and a first-level cooperative.
Figure 25: Mozambique - partnership and budget size
In Mozambique, larger projects were promoted by first-level cooperatives and NPOs. More
frequently than in other countries, we found farmers’ federations as partners, although on smaller
projects in terms of budget.
Figure 26: Senegal - partnership and budget size
In Senegal a smaller number of projects was observed, almost all led by NPOs, but quite differentiated in size:
one very large project with an NGO partnership and three medium-sized ones.
1; 1; 300.000
7; 20; 13.375.226
10; 9; 7.839.977
10; 20; 4.379.194
10; 20; 3.696.075
10; 20; 1.184.202
10; 5; 1.510.160
10; 5; 282.413
-5
0
5
10
15
20
25
-2 0 2 4 6 8 10 12
Mai
n p
artn
er
typ
e
Lead organization type
10; 10; 7.973.741
6; 6; 195.000
10; 7; 40.000
10; 9; 39.999.066
10; 11; 9.579.255
10; 12; 3.787.585
10; 10; 4.970.570
-2
0
2
4
6
8
10
12
14
0 2 4 6 8 10 12
Mai
n p
artn
er
typ
e
Lead organization type

30
9. Concluding summary
This report drew upon a brief survey of 15 CDOs headquartered in the US, Canada, and Europe,
conducted between August and September 2015. The CDOs were selected for being closely related
to the cooperative movement of the countries in which they are based. They were mainly
cooperatives, cooperative federations, or non-profit organizations set up by the cooperative
movement to promote cooperation in developing countries. The survey specifically targeted projects
that these CDOs conducted in Africa in the agricultural sector over the past five years (2010-2015)
and included both concluded and ongoing activities.
The selected sample of CDOs was non-random and should not to be considered representative of the
universe of initiatives aimed at promoting cooperative creation in rural Africa. However, the selected
CDOs are all relevant actors in the field and represent a significant portion of this universe.
The results of the survey were characterized by several missing values, which affected the number of
observations that could be used for the analysis. To partially address this issue, the project team filled
in some of the missing information by systematizing the materials collected with the CDOs’ help, as
well as through information available on the Internet. The missing information was still a major
concern, which significantly reduced the number of observations illustrating budget data or project
partners.
Despite these caveats, the data showed an interesting and quite diverse picture.
Overview
The survey mapped 186 distinct projects in 30 countries, counting a multi-country project as different
projects, one per country. The average project budget was about US$3 million, but the distribution
was skewed toward the left tail, which includes a large number of small projects and a few large ones.
More than half of the projects had a budget lower than US$900,000.
Out of the total, 74 projects are currently ongoing (end after 2015), while 104 are finalized (the status
of the remaining eight projects is unknown). The average duration of projects is 3.9 years, but 50%
of projects last 3 years or less. Only 5 projects last for 10 years or more.
The analysis was conducted on three levels: CDO, country, and project.
CDO-level analysis
The selected sample included CDOs with different organizational forms: two national (multisector)
federations of cooperatives, two national federations of agricultural cooperatives, one first-level
cooperative, one research institution. The remaining nine organizations were NPOs created by the
cooperative movement for advocacy purposes and the development of cooperation around the world.
The CDO sample was split into two main groups, according to the organization type: NPOs and
cooperative enterprises/cooperative federations (5). The former group implemented the majority of
projects (156), while the second conducted 30 projects.
In terms of funding sources, both heavily relied on public donors. This was stronger for CDOs that
are cooperatives or cooperative federations. Among the CDOs, NPOs were more likely to obtain
funds from multilateral agencies and private donors, while cooperative enterprises/cooperative
federations were more likely to mobilize cooperative movement internal funds. These two macro
types of CDOs were also likely to enter into different kinds of partnerships. The CDOs displayed

31
different strategies with respect to the number of projects and their size. The analysis identified three
main groups. Most CDOs had less than 10 projects and a budget below the average, while fewer
CDOs pursued a strategy of implementing a few large projects, or chose to spread a large budget over
a large number of relatively small projects.
Country-level analysis
The analysis at the country level revealed that the projects were quite concentrated in a small number
of countries, mainly in eastern and southern Africa. The top 10 countries in terms of their number of
projects hosted more than 70% of all projects. Within this group, the only western African countries
were Senegal and Mali. The countries that hosted the most projects were Kenya, Tanzania, and
Uganda, followed by Zambia, Ethiopia, Rwanda, Malawi, Mali, Mozambique, and Senegal. This
ranking only partially overlapped with the ranking based on budget allocation, where the top
recipients were Ethiopia, Rwanda, Senegal, and Tanzania. The largest projects in terms of allocated
budget were implemented in Ethiopia, Senegal, and Niger, followed by Rwanda, Madagascar, and
Mozambique. Some countries were the target of a specific CDO, while others attracted projects from
different organizations. For example, Mozambique hosted fewer than the half the projects hosted by
Kenya, but they were implemented by the same number of donors.
Partnerships
The great majority of projects (121) were led by NPOs based in the donor countries. In most cases
leading organizations were the CDOs themselves, but in other cases they were international
development NGOs. In 28 cases, the leading organization was a cooperative enterprise or a second-
level cooperative organization. Project led by NPOs displayed a much greater variation in terms of
budget: they had a relatively low median budget (indicative of many small projects), but some
significant outliers.
The partnership analysis was conducted in two ways:
Characterizing each project by the presence of different organizations among the partners,
regardless of the position
Analyzing the match between the lead organization and the first partner
The first part of the analysis showed that projects involving multilateral organizations were much
larger than the others, but they were relatively a small number. NPOs were the most frequent partners,
appeared in the majority of projects, and had average budget sizes just below the average. Projects
involving cooperatives or farmers’ federations had, on average, the smallest budgets.
The second part showed that the great majority of projects were led by NPOs based in the donor
country. These may have had different kind of partners, but larger projects were concentrated in
partnerships with other NPOs, multilateral organizations, and for-profit companies. In addition, a few
large projects were led by first-level cooperatives, mostly in partnership with private, for-profit firms.
Activities
As regards the activities performed by the CDOs within the cooperative development projects
implemented, there was a clear prevalence of training and capacity-building activities, both in terms
of the number of projects and allocated budget. Mid-level budgets were disbursed for other kinds of

32
activities, such as financial support and investment, trading, legal and policy reform, and network
building.
Funding
The great majority of projects relied on public national funds. This was true for all the main lead
organization types, although NPOs seem to differentiate more in terms of funding sources and
demonstrated greater access to funds from multilateral agencies and private donors. Having access to
public funds significantly increased the size of the project budget.
Although conclusions need to be drawn with caution, this analysis highlighted that the overall picture
is quite polarized in terms of budget size, with several small projects and a small group of very large
ones. There seemed to be a tendency for CDOs to concentrate in a small number of countries, while
some countries were targeted by many CDOs. What clearly emerged was the importance of public
funds, which seemed to play a crucial role in cooperative development projects.
References
Birchall, J. (2003). Rediscovering the Cooperative Advantage. Poverty Reduction through Self-help. Geneva:
International Labour Organization (ILO), Cooperative Branch.
Borzaga, C. & Galera, G. (2012). Promoting the Understanding of Cooperatives for a Better World. Euricse
contribution to the International Year of Cooperatives. Trento: Euricse.
Borzaga, C. & Galera, G. (2014). The Potential of the Social Economy for Local Development in Africa: An
Exploratory Report. European Union, Policy Department DG External Policies, DOI: 10.2861/59977.
2014.
Develtere, P., I. Pollet, & Wanyama, F. (2008). Cooperating Out of Poverty: The Renaissance of the African
Cooperative Movement. Geneva: International Labour Organization (ILO). Available at:
http://www.ilo.org/public/english/employment/ent/coop/africa/index.htm
Logue, J. & Yates, J. (2005). Productivity in Cooperatives and Worker-Owned Enterprises: Ownership and
Participation make a Difference! Geneva: International Labour Organization (ILO).
Mansuri, G. & Rao, V. (2013). Localizing development. Does participation work?” World Bank Policy
Research Report, Washington D.C.: The World Bank.
Nadeau, E. & Scott Kennedy, K. (2015). Measuring Cooperative Performance in Developing Countries: A
Proposed Methodology for Linking Applied Research and Cooperative Development. Paper presented
at the ICA Research International Conference “Future of the cooperative model: creativity, innovation
and research”, Paris, 27-30 May 2015.


