
Ref: TN-RF-003 V2.4
www.beanair.com
TECHNICAL NOTE Aggregation capacity of wireless sensor networks

“Rethinking sensing technology” Document version : 2.2
Aggregation capacity of wireless sensor Networks Document Type : Technical Note
Please consider the environnement before printing this document.
Page : 1 / 24
DOCUMENT
Document number RF_TN_003 V2.2 Version V2.2
External Reference Publication date 21/01/2013
Author Jules SACHOT - Christophe DONTEGREUIL
Internal Reference Project Code N.A.
Document Name Capacity of wireless sensor network
VALIDATION
Function Recipients For
Validation For
information
Reader Loïc PENELON X
Author X
MAILING LIST
Function Recipients For action For Info
Staffer 1 Christophe DONTEGREUIL X
Staffer 2 Philippe FROMON X
Updates
Version Date Author Evolution & Status
1.0 15/12/2010 Christophe
DONTEGREUIL Document Creation, Document Update
2.0 21/12/2011 Christophe
DONTEGREUIL Document Update – Addition of new tests
2.1 02/07/2012 Christophe
DONTEGREUIL Test Updates
2.2 21/01/2013 Maxime Obr. Document Update – New page settings
2.3 10/03/2015 Maxime Obr. Multi-WSN architecture added
2.4 29/09/2016 Salah Riahi Streaming Mode test results suppressed How to decrease Data loss?

“Rethinking sensing technology” Document version : 2.2
Aggregation capacity of wireless sensor Networks Document Type : Technical Note
Please consider the environnement before printing this document.
Page : 2 / 24
1. TECHNICAL SUPPORT ............................................................................................................................. 6
2. VISUAL SYMBOLS DEFINITION ............................................................................................................... 7
3. ACRONYMS AND ABBREVIATIONS ........................................................................................................ 8
4. RELATED DOCUMENTS & VIDEOS ......................................................................................................... 9
4.1 Applications Notes .............................................................................................................................. 9
4.2 Technical Notes ................................................................................................................................ 10
4.3 Related Videos ................................................................................................................................. 11
5. AIM OF THE DOCUMENT ....................................................................................................................... 12
6. WSN MODELING ..................................................................................................................................... 13
7. COEXISTENCE AND INTERFERENCE WITH WIFI NETWORK ............................................................ 14
8. RELATIONSHIP BETWEEN RF PARAMETERS ..................................................................................... 15
9. TEST BED SETUP & METHODOLOGY .................................................................................................. 16
9.1 Test equipment description .............................................................................................................. 16
9.2 Methodology ..................................................................................................................................... 17
10. TEST RESULTS WITH STREAMING PACKET MODE ........................................................................... 18
10.1 WSN with three BeanDevice® AX-3D .............................................................................................. 18
10.2 WSN with five BeanDevice® AX-3D ................................................................................................ 18
10.3 WSN with five BeanDevice® AN420 ................................................................................................ 19
10.4 WSN with two BeanDevice® AX-3D and three BeanDevice® AN420 with the same sampling rate 19
10.5 Tests summary ................................................................................................................................. 20
11. MULTI-WSN ARCHITECTURE ................................................................................................................ 21
Contents

“Rethinking sensing technology” Document version : 2.2
Aggregation capacity of wireless sensor Networks Document Type : Technical Note
Please consider the environnement before printing this document.
Page : 3 / 24
12. OVERALL CONCLUSION ........................................................................................................................ 22
13. HOW TO DECREASE DATA LOSS? ....................................................................................................... 23
13.1 Reduce sampling rate ...................................................................................................................... 23
13.2 use wsn configuration ....................................................................................................................... 23
13.3 Use “Tx & Log” or “Log only” ............................................................................................................ 23

“Rethinking sensing technology” Document version : 2.2
Aggregation capacity of wireless sensor Networks Document Type : Technical Note
Please consider the environnement before printing this document.
Page : 4 / 24
Figure 1: Wifi and IEEE802.15.4 spectrum ..................................................................................................... 14 Figure 2: Wifi and IEEE802.15.4 frequency offsets ......................................................................................... 14 Figure 3: Network deployment presentation .................................................................................................... 17 Figure 4: Multi-WSN Architecture .................................................................................................................... 21 Figure 5: Decrease your sampling rate ........................................................................................................... 23
Table 1 : Test equipment list ............................................................................. Error! Bookmark not defined.
List of figures
List of Tables

“Rethinking sensing technology” Document version : 2.2
Aggregation capacity of wireless sensor Networks Document Type : Technical Note
Please consider the environnement before printing this document.
Page : 5 / 24
Disclaimer
The information contained in this document is the proprietary information of BeanAir. The contents are confidential and any disclosure to persons other than the officers, employees, agents or subcontractors of the owner or licensee of this document, without the prior written consent of BeanAir GmbH, is strictly prohibited. BeanAir makes every effort to ensure the quality of the information it makes available. Notwithstanding the foregoing, BeanAir does not make any warranty as to the information contained herein, and does not accept any liability for any injury, loss or damage of any kind incurred by use of or reliance upon the information. BeanAir disclaims any and all responsibility for the application of the devices characterized in this document, and notes that the application of the device must comply with the safety standards of the applicable country, and where applicable, with the relevant wiring rules. BeanAir reserves the right to make modifications, additions and deletions to this document due to typographical errors, inaccurate information, or improvements to programs and/or equipment at any time and without notice. Such changes will, nevertheless be incorporated into new editions of this document. Copyright: Transmittal, reproduction, dissemination and/or editing of this document as well as utilization of its contents and communication thereof to others without express authorization are prohibited. Offenders will be held liable for payment of damages. All rights are reserved.
Copyright © BeanAir GmbH 2015

“Rethinking sensing technology” Document version : 2.2
Aggregation capacity of wireless sensor Networks Document Type : Technical Note
Please consider the environnement before printing this document.
Page : 6 / 24
1. TECHNICAL SUPPORT
For general contact, technical support, to report documentation errors and to order manuals, contact BeanAir Technical Support Center (BTSC) at: [email protected] For detailed information about where you can buy the BeanAir equipment/software or for recommendations on accessories and components visit: www.beanair.com To register for product news and announcements or for product questions contact BeanAir’s Technical Support Center (BTSC). Our aim is to make this user manual as helpful as possible. Keep us informed of your comments and suggestions for improvements. BeanAir appreciates feedback from the users of our information.

“Rethinking sensing technology” Document version : 2.2
Aggregation capacity of wireless sensor Networks Document Type : Technical Note
Please consider the environnement before printing this document.
Page : 7 / 24
2. VISUAL SYMBOLS DEFINITION
Symbols Definition
Caution or Warning – Alerts the user with important information about BeanAir wireless sensor networks (WSN), if this information is not followed, the equipment /software may fail or malfunction.
Danger – This information MUST be followed if not you may damage the equipment permanently or bodily injury may occur.
Tip or Information – Provides advice and suggestions that may be useful when installing BeanAir Wireless Sensor Networks.

“Rethinking sensing technology” Document version : 2.2
Aggregation capacity of wireless sensor Networks Document Type : Technical Note
Please consider the environnement before printing this document.
Page : 8 / 24
3. ACRONYMS AND ABBREVIATIONS
LQI Link quality indicator
PER Packet error rate
WLAN A wireless local area network links two or more devices over a short distance using a wireless distribution method.
WSN Wireless Sensor Network
LOS Line-of-sight
Mb Mega-Bytes
Mbps Mega-Bytes per second
RF Radio Frequency
Prf Radio Power. (Unit : dBm)
dBm It’s an abbreviation for the power ratio in decibels (dB) of the measured power referenced to 1 milliwatt (mW): 18 dBm = 63 mW.
FTP File Transfer Protocol is a standard network protocol used to transfer files from one host to another host over a TCP-based network.
TCP The Transmission Control Protocol is one of the core protocols of the Internet Protocol Suite.
m Meter(s)
RSSI Received Signal Strength Indication
SSD System Shock Detect
“Rethinking sensing technology” Document version : 2.2
Aggregation capacity of wireless sensor Networks Document Type : Technical Note
Please consider the environnement before printing this document.
Page : 9 / 24
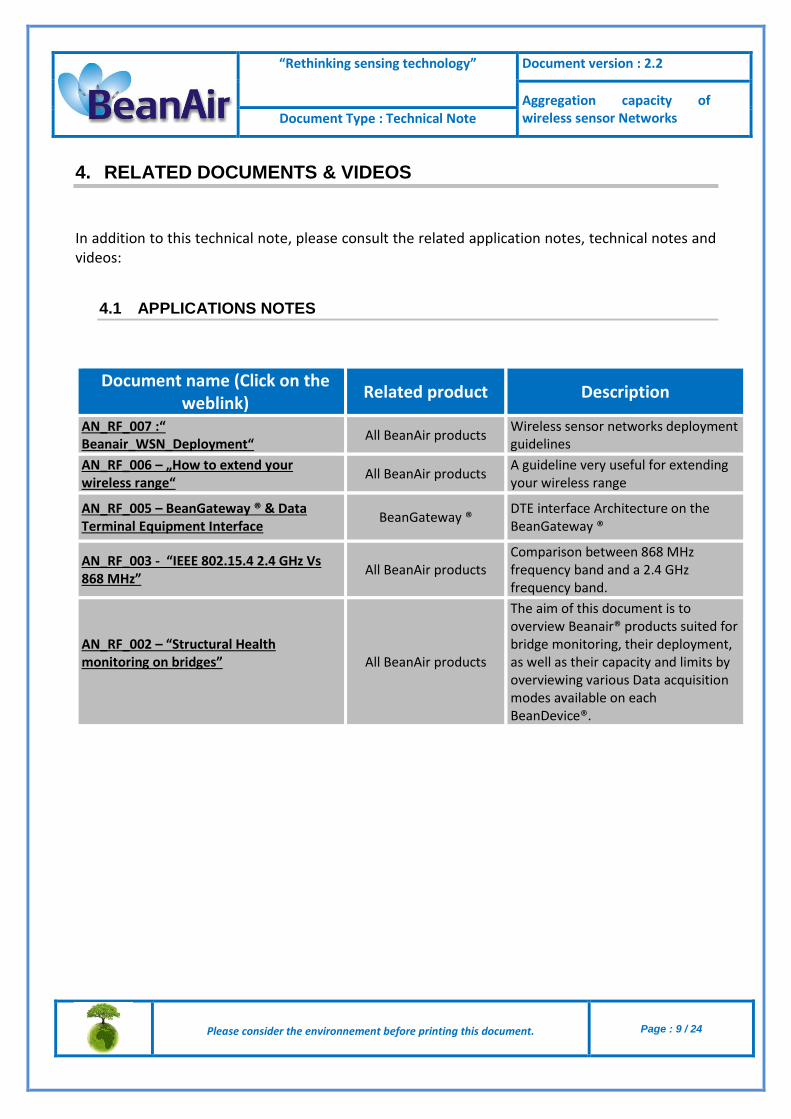
4. RELATED DOCUMENTS & VIDEOS
In addition to this technical note, please consult the related application notes, technical notes and videos:
4.1 APPLICATIONS NOTES
Document name (Click on the weblink)
Related product Description
AN_RF_007 :“ Beanair_WSN_Deployment“
All BeanAir products Wireless sensor networks deployment guidelines
AN_RF_006 – „How to extend your wireless range“
All BeanAir products A guideline very useful for extending your wireless range
AN_RF_005 – BeanGateway ® & Data Terminal Equipment Interface
BeanGateway ® DTE interface Architecture on the BeanGateway ®
AN_RF_003 - “IEEE 802.15.4 2.4 GHz Vs 868 MHz”
All BeanAir products Comparison between 868 MHz frequency band and a 2.4 GHz frequency band.
AN_RF_002 – “Structural Health monitoring on bridges”
All BeanAir products
The aim of this document is to overview Beanair® products suited for bridge monitoring, their deployment, as well as their capacity and limits by overviewing various Data acquisition modes available on each BeanDevice®.

“Rethinking sensing technology” Document version : 2.2
Aggregation capacity of wireless sensor Networks Document Type : Technical Note
Please consider the environnement before printing this document.
Page : 10 / 24
4.2 TECHNICAL NOTES
Document name (Click on the weblink)
Related product Description
TN_RF_013 – « OPC configuration » BeanScape® Premium+ The aim of this document is to help deploying the OPC DA and all associated services.
TN_RF_012– « BeanDevice® battery life in streaming mode »
All the products
The aim of this document is to describe the autonomy performance of the BeanDevice® SmartSensor® and ProcessSensor® product line in streaming and streaming packet mode.
TN_RF_011 – « Coexistence of Beanair WSN at 2.4GHz »
All the products
This document aims to highlight the issues affecting co-existence of Beanair WSN (IEEE 802.15.4) in the presence of interference.
TN_RF_010 – « BeanDevice® Power Management »
All the BeanDevice® This technical note describes the sleeping & active power mode on the BeanDevice®.
TN_RF_009 – « BeanGateway ® management on LAN infrastructure »
BeanGateway ® BeanGateway ® integration on a LAN infrastructure
TN_RF_008 – “Data acquisition modes available on the BeanDevice®”
All the BeanDevice® Data acquisition modes available on the BeanDevice®
TN_RF_007 – “BeanDevice® DataLogger User Guide ”
All the BeanDevice® This document presents the DataLogger feature on the BeanDevice®
TN_RF_006 – “WSN Association process”
All the BeanDevice®
Description of the BeanDevice® network association
TN_RF_005 – “Pulse counter & binary Data acquisition on the BeanDevice® SUN-BN”
BeanDevice® SUN-BN
This document presents Pulse counter (ex: energy metering application) and binary Data acquisition features on the BeanDevice® SUN-BN.
RF_TN_003- “Aggregation capacity of wireless sensor networks”
All the products Network capacity characterization of Beanair Wireless Sensor Networks
RF_TN_002 V1.0 - Current consumption in active & sleeping mode
BeanDevice® Current consumption estimation of the BeanDevice in active and sleeping mode
RF_TN_001 V1.0- Wireless range benchmarking
BeanDevice® Wireless range benchmarking of the BeanDevice®

“Rethinking sensing technology” Document version : 2.2
Aggregation capacity of wireless sensor Networks Document Type : Technical Note
Please consider the environnement before printing this document.
Page : 11 / 24
4.3 RELATED VIDEOS
All the videos are available on our Youtube channel
Beanair video link (Youtube) Related products
Company Presentation All
BeanGateway ® - Ethernet Outdoor version introduction
BeanGateway ® - Ethernet Outdoor version introduction
BeanGateway ® – Ethernet Indoor version presentation BeanGateway ® Ethernet Indoor version
BeanDevice® AN-XX wireless range demonstration BeanDevice® AN-XX & BeanDevice® AN-XX Extender
BeanDevice® AN-XX presentation BeanDevice® AN-XX & BeanDevice® AN-XX Extender
BeanDevice® AX-3D presentation BeanDevice® AX-3D
BeanDevice® HI-INC presentation BeanDevice® HI-INC
BeanDevice® AX-3DS presentation BeanDevice® AX-3DS
BeanScape® – WSN supervision software BeanScape®
BeanGateway ® Ethernet/LAN Configuration, directly connected to the Laptop/PC
BeanGateway ®
Wireless sensors profile deletion from the BeanGateway ® Database
All

“Rethinking sensing technology” Document version : 2.2
Aggregation capacity of wireless sensor Networks Document Type : Technical Note
Please consider the environnement before printing this document.
Page : 12 / 24
5. AIM OF THE DOCUMENT
Like a highway that is tightly tucked between a mountain cliff and a lake or an ocean, WSN (Wireless Sensor
Networks) are subject to limitations due to a similar lack of a physical resource –namely wireless bandwidth.
Like congested road systems in highly populated metropolitan areas, WSN are unequally solicited by a various
type of wireless sensors (temperature, tilt, vibration…). One way or another, we need to share the wireless
bandwidth, just as we share the public road and highway systems.
The aim of this document is to characterize the aggregation capacity of Beanair WSN.
This document is not intended to study radio interferences on the 2.4 GHz Band, but it helps the end user to
determine the network bandwidth on a WSN by stochastic calculus.
“Streaming packet” data acquisition mode was used during these tests. Please note that these computed values will change, depending heavily on the environment.

“Rethinking sensing technology” Document version : 2.2
Aggregation capacity of wireless sensor Networks Document Type : Technical Note
Please consider the environnement before printing this document.
Page : 13 / 24
6. WSN MODELING
Aggregation capacity of WSN includes the amount of data packets transmitted, received or lost during a short period. The capacity of WSN can be modeled by the following parameters:
LQI Link Quality Indicator
LQI is equivalent to Received Signal Strength Indication (RSSI). The LQI value is between 0 and 255. As close to 255 is the LQI, higher is the received signal power.
PER Abslute Packet Error Rate = ∑Packets Lost(n)
Packets Sent
𝑛
𝑘=0
(e.g.: 3 of 1000 Packets lost on the network/on a device)
Bandwidth Bandwitdh = ∑ BeanDevicen ∗ Sampling Raten𝑛𝑘=0

“Rethinking sensing technology” Document version : 2.2
Aggregation capacity of wireless sensor Networks Document Type : Technical Note
Please consider the environnement before printing this document.
Page : 14 / 24
7. COEXISTENCE AND INTERFERENCE WITH WIFI NETWORK
Figure 1: Wifi and IEEE802.15.4 spectrum
Figure 2: Wifi and IEEE802.15.4 frequency offsets
For further information, please read the following technical note:
TN_RF_011 – “Co-existence of Beanair WSN at 2.4 GHz”

“Rethinking sensing technology” Document version : 2.2
Aggregation capacity of wireless sensor Networks Document Type : Technical Note
Please consider the environnement before printing this document.
Page : 15 / 24
8. RELATIONSHIP BETWEEN RF PARAMETERS
There is no standard formula to compute the LQI, which depends on chipmakers.
In a quiet environment, PER will decrease as LQI decreases, however, if there is any
interference, the PER can decrease with no significant changes observed on the LQI.
RSSI is an indication of the power level being received by the antenna. Generally, the higher
the RSSI level is the stronger the signal.
During the test procedures, we admit:
One RF channel is selected
Network and PAN addresses are static.
RSSI value is high
Aggregation capacity of a WSN depends on the following influence factors:
Wireless Range
RF Transmission Power
Obstacles (Water, Metal, …)
WSN density (number of BeanDevice® on the same network)
Sampling Rate per BeanDevice® (0 to 3kHz)
Number of sensor channel on the same BeanDevice® (1 to 4)
Antenna (type, length, …)
Interference Source (Wi-Fi, Bluetooth….)

“Rethinking sensing technology” Document version : 2.2
Aggregation capacity of wireless sensor Networks Document Type : Technical Note
Please consider the environnement before printing this document.
Page : 16 / 24
9. TEST BED SETUP & METHODOLOGY
9.1 TEST EQUIPMENT DESCRIPTION
The test bed consisted of the following devices under test (DUT):
A BeanGateway® Indoor Ethernet Version:
o Powered by the external power supply o A 5.5 dBi antenna was used
BeanDevice® AX-3D (+/- 2g)
o Powered by internal battery
BeanDevice® HI-INC (15° et 30° Monoaxis and Biaxis)
o Powered by internal battery
BeanDevice® AN420
o Powered by its own battery o A 2dBi Antenna was used
Laptop with the BeanScape® software installed
Type Product Type Quantity
Number of sensor
channels Soft Version
Protocol Stack IEEE 802.15.4 /
Topology Star Network /
BeanGateway® BeanGateway® Ethernet 1 / V2.0
BeanDevice®
BeanDevice® AN-420 6 4 v2.5
BeanDevice® HI-INC 1 2 v2.5
BeanDevice® AX-3D 5 3 V2.5
BeanScape® BeanScape® 1 / 1.24.1777.15
Table 1: Test Equipment List

“Rethinking sensing technology” Document version : 2.2
Aggregation capacity of wireless sensor Networks Document Type : Technical Note
Please consider the environnement before printing this document.
Page : 17 / 24
9.2 METHODOLOGY
“Streaming packet” mode function is evaluated during these tests plan.
Network behavior will be studied with different sampling frequency.
Each test iteration was run with a 10 minutes duration, and each test repeated three times to ensure repeatability of results;
The distance observed between the BeanDevice® and the BeanGateway® is 1 meter.
Figure 3: Network deployment presentation
For further information about the streaming packet mode, please read the technical note:
TN_RF_008 – “Data acquisition modes available on the BeanDevice®”
“Rethinking sensing technology” Document version : 2.2
Aggregation capacity of wireless sensor Networks Document Type : Technical Note
Please consider the environnement before printing this document.
Page : 18 / 24
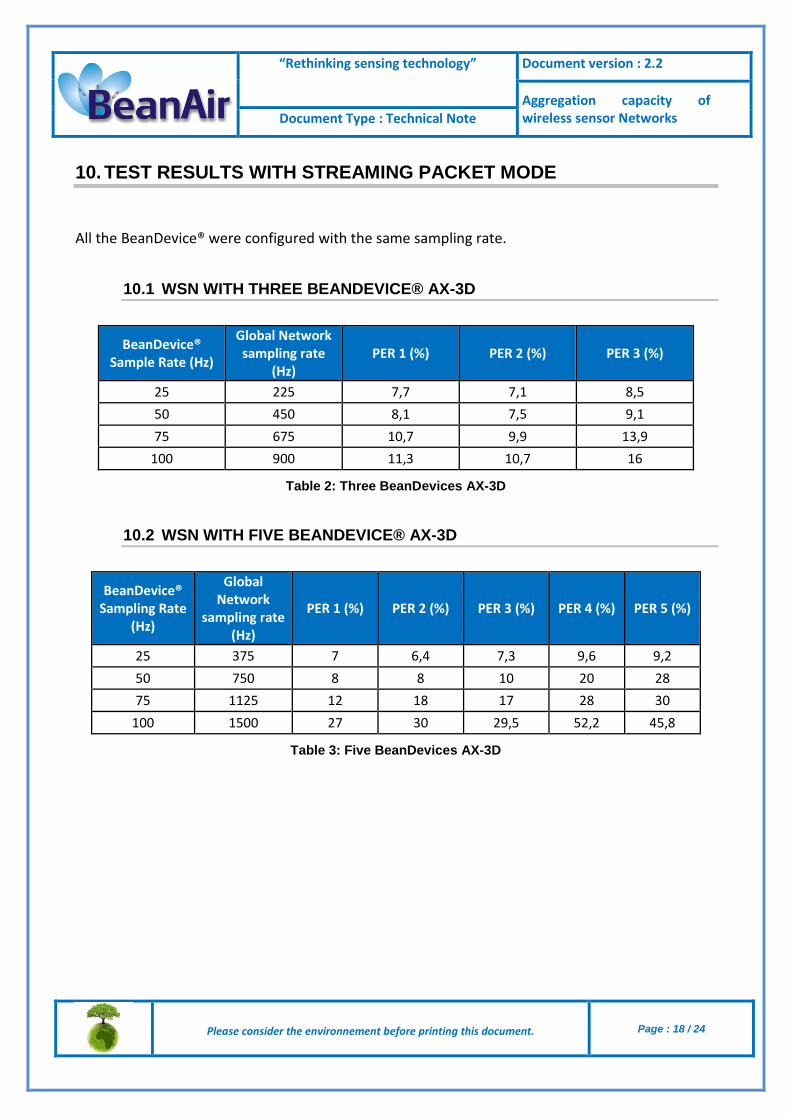
10. TEST RESULTS WITH STREAMING PACKET MODE
All the BeanDevice® were configured with the same sampling rate.
10.1 WSN WITH THREE BEANDEVICE® AX-3D
BeanDevice® Sample Rate (Hz)
Global Network sampling rate
(Hz) PER 1 (%) PER 2 (%) PER 3 (%)
25 225 7,7 7,1 8,5
50 450 8,1 7,5 9,1
75 675 10,7 9,9 13,9
100 900 11,3 10,7 16
Table 2: Three BeanDevices AX-3D
10.2 WSN WITH FIVE BEANDEVICE® AX-3D
BeanDevice® Sampling Rate
(Hz)
Global Network
sampling rate (Hz)
PER 1 (%) PER 2 (%) PER 3 (%) PER 4 (%) PER 5 (%)
25 375 7 6,4 7,3 9,6 9,2
50 750 8 8 10 20 28
75 1125 12 18 17 28 30
100 1500 27 30 29,5 52,2 45,8
Table 3: Five BeanDevices AX-3D

“Rethinking sensing technology” Document version : 2.2
Aggregation capacity of wireless sensor Networks Document Type : Technical Note
Please consider the environnement before printing this document.
Page : 19 / 24
10.3 WSN WITH FIVE BEANDEVICE® AN420
BeanDevice® Sampling Rate
(Hz)
Global Network
sampling rate (Hz)
PER 1 (%) PER 2 (%) PER 3 (%) PER 4 (%) PER 5 (%)
25 500 21 18 26 10 24
50 1000 38 15 37 8 20
75 1500 15 22 32 22 34
100 2000 43 38 42 19 28
Table 4: Five BeanDevices AN-420
10.4 WSN WITH TWO BEANDEVICE® AX-3D AND THREE BEANDEVICE® AN420 WITH THE SAME SAMPLING RATE
BeanDevice® Sampling Rate
(Hz)
Global Network
sampling rate (Hz)
AX3D PER 1 (%)
AX3D PER 2 (%)
ANXX PER 3 (%)
ANXX PER 4 (%)
ANXX PER 5 (%)
25 450 4 7 15 16 14.5
50 900 8.5 15.5 25 24 29
75 1375 28 22 20 19 23
100 1800 34 43 17.5 22 36
Table 5: Two BeanDevices AX-3D & Three BeanDevices AN-420

“Rethinking sensing technology” Document version : 2.2
Aggregation capacity of wireless sensor Networks Document Type : Technical Note
Please consider the environnement before printing this document.
Page : 20 / 24
10.5 TESTS SUMMARY
• PER on each BeanDevice® is increasing regarding to the global bandwidth.
• PER on each BeanDevice® is not necessary increasing proportionaly while the global bandwidth increases.
• A BeanDevice® can have a higher PER value even if its sample rate is lower.
PER
“Rethinking sensing technology” Document version : 2.2
Aggregation capacity of wireless sensor Networks Document Type : Technical Note
Please consider the environnement before printing this document.
Page : 21 / 24
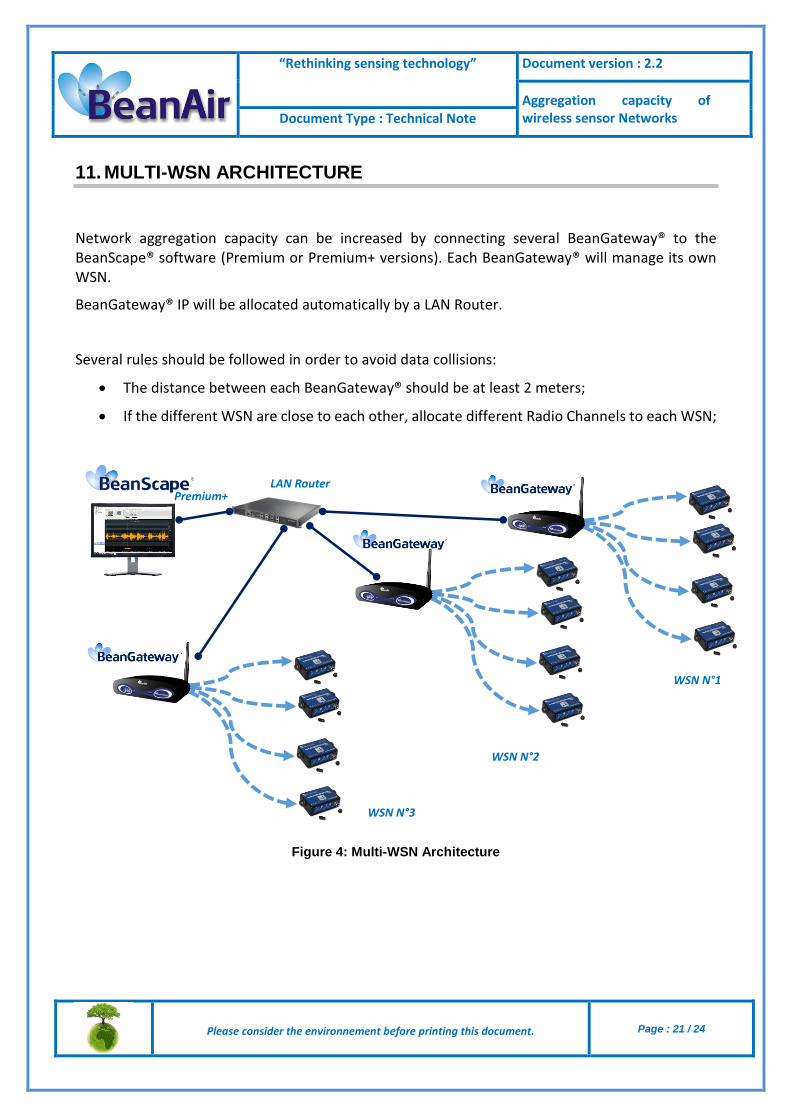
11. MULTI-WSN ARCHITECTURE
Network aggregation capacity can be increased by connecting several BeanGateway® to the BeanScape® software (Premium or Premium+ versions). Each BeanGateway® will manage its own WSN.
BeanGateway® IP will be allocated automatically by a LAN Router.
Several rules should be followed in order to avoid data collisions:
The distance between each BeanGateway® should be at least 2 meters;
If the different WSN are close to each other, allocate different Radio Channels to each WSN;
Figure 4: Multi-WSN Architecture
WSN N°1
WSN N°2
WSN N°3
LAN RouterPremium+

“Rethinking sensing technology” Document version : 2.2
Aggregation capacity of wireless sensor Networks Document Type : Technical Note
Please consider the environnement before printing this document.
Page : 22 / 24
12. OVERALL CONCLUSION
• A combination of different technologies of BeanDevices® does not influence the PER value
• The number of BeanDevices® influence the global network bandwidth
• Your environment influence highly the aggregation capacity of WSN:
• Antennas characteristics
• Antennas orientations
• Network area positioning
• Network density
Heterogenous WSN ?
• Higher is the BeanGateway® antenna's gain, lower is the PER.
• If your BeanGateway® is located at the center of your wireless network, an omnidirectional antenna will be recommended.
• A directional antenna is highly recommended for extending your wireless range;
BeanGateway® Antenna
influence

“Rethinking sensing technology” Document version : 2.2
Aggregation capacity of wireless sensor Networks Document Type : Technical Note
Please consider the environnement before printing this document.
Page : 23 / 24
13. HOW TO DECREASE DATA LOSS?
13.1 REDUCE SAMPLING RATE
As shown in Section 10, your WSN could be exposed to network saturation as much as your sampling rate is higher. This problem could be multiplied if you are running too much BeanDevices.
Figure 5: Decrease your sampling rate
13.2 USE WSN CONFIGURATION
The architecture described in Section 11 is your best solution when you have too many BeanDevices especially with high sampling rates. In fact, each group of BeanDevices would be using a different radio channel and therefore avoid overloading the network.
13.3 USE “TX & LOG” OR “LOG ONLY”
The BeanDevices integrate an internal Datalogger on which samples could be stores and then downloaded through the BeanGateway.
When operating with the Datalogger, there is no Data transmitted from BeanDevice to BeanGateway. So, the user should not be afraid about any data loss through radio transmission.
In the Tx&Log mode, the Datalogger is enabled at the same with the radio transmission as a backup to store Data when there is an issue with the network such as Network cut or saturation.
For further information about the Datalogger, please read the technical note:
”TN-RF-007-BeanDevice-wireless-sensor-DataLogger-User-Guide”


