Download - Advanced Lean Forms

Contents
Sheets1 5S Check List2 5S Evaluation3 Actin Plan & Report - Individual4 Cause & Effect Diagram5 Cause & Effect Diagram Example6 Design Of Experiment Grid7 Is-Is Not page 18 Is-Is Not page 29 Kanban Worksheet
10 Lean Assessment11 Lean Evaluation Radar Chart12 Lean Project Tracking Sheet13 Meeting Agenda Blank14 Metrics Sheet & Example15 OEE Worksheet16 PDCA Sheet17 Problem Solving Worksheets18 Rapid Improvement Event (REI) Agendas19 Rapid Improvement Event (REI) Worksheets20 Rapid Improvement Event Before & After Worksheet21 Six Sigma Summary Sheet22 Standardized Work Chart23 Standardized Work Breakdown Sheet24 Standard Work Combination Sheet25 Time Observation Sheet26 Value Added (VA) versus Non Value Added (NVA) Worksheet27 Visual Controls Check Sheet28 Value Stream Map (VSM) Action Planning Sheet & Example


Network Path: Fileserver1\CE\Corp\Quality\WI\Trim\Forms\All Trim Groups
TR09-04-01aLast Revised: 9/20/99
5 - S EvaluationAREA EVALUATED: SHIFT: 1 2 3SUPERVISOR:
RATING SCALE: 0-5 (POOR=0, EXCELLENT=5)
ITEM NUMBER ITEM SCOREAND DESCRIPTION ( 0 - 5)1. REMOVING UNNECESSARY ITEMS ALL ITEMS NOT NECESSARY FOR PERFORMING WORK ARE
REMOVED FROM THE WORKPLACE.
2. STORAGE OF CLEANING EQUIPMENT ALL CLEANING EQUIPMENT IS STORED IN A NEAT MANNER.
HANDY AND EASILY AVAILABLE AS NEEDED.
3. FLOOR CLEANING ALL FLOORS ARE CLEAN AND FREE OF DEBRIS, OIL AND DIRT.
CLEANING OF FLOORS IS DONE ROUTINELY - DAILY @ MINIMUM.
4. BULLETIN BOARD NO OUTDATED, TORN OR SOILED ANNOUNCEMENTS ARE DISPLAYED.
ALL BULLETINS ARE ARRANGED IN A STRAIGHT/NEAT MANNER.
5. EMERGENCY ACCESS FIRE HOSES AND EXTINGUISHERS ARE UNOBSTRUCTED AND STORED
IN AN EASY-TO-LOCATE MANNER. E-STOPS ARE COLOR CODED.
6. ITEMS ON THE FLOOR WIP, TOOLS AND OTHER MATERIAL ARE NOT LEFT SITTING ON THE
FLOOR. ITEMS ARE POSITIONED ON THE FLOOR IN CLEARLY
MARKED AREAS, BOXED WITH CE's COLOR-CODED SYSTEM
7. AISLEWAYS - MARKINGS AISLES AND WALKWAYS ARE CLEARLY LINED AND IDENTIFIABLE.
PAINT OR TAPE IS IN GOOD CONDITION AND NEAT.
8. AISLEWAYS - MAINTENANCE AISLES ARE ALWAYS FREE OF MATERIAL AND OBSTRUCTIONS.
NOTHING IS PLACED ON THE LINES, AND OBJECTS ARE ALWAYS @
RIGHT ANGLES TO THE AISLEWAYS.
9. STORAGE AND ARRANGEMENT STORAGE OF BOXES, CONTAINERS AND MATERIAL IS ALWAYS NEAT
AND AT RIGHT ANGLES.
10. EQUIPMENT - PAINTING ALL MACHINES AND EQUIPMENT ARE NEATLY PAINTED. NO PLACES
IN THE AREA LESS THAN 2 METERS HIGH ARE UNPAINTED.
11. EQUIPMENT - CLEANLINESS ALL MACHINES AND EQUIPMENT ARE KEPT CLEAN AND UNSOILED BY
DAILY CARE. GLASS(WINDOWS) AND WORK SURFACES ARE CLEAN
AND POLISHED. TABLE TOP SURFACES ARE CHANGED IF NEEDED.
12. EQUIPMENT - MAINTENANCE CONTROLS OF MACHINES ARE PROPERLY LABELED AND CRITICAL
POINTS FOR DAILY MAINTENANCE CHECKS (i.e.. FLUID AND LUBE
LEVELS) ARE CLEARLY MARKED. EQUIPMENT CHECK SHEETS ARE
NEATLY DISPLAYED AND KEPT CLEAN AND UPDATED.
13. EQUIPMENT STORAGE NOTHING IS PLACED ON TOP OF MACHINES, TOOLS OR CABINETS.
NOTHING LEANS AGAINST WALLS OR COLUMNS. GUARDS OR DEFLECT-
TORS ARE USED TO KEEP WASTE FROM FALLING TO THE FLOOR.
14. DOCUMENTS - STORAGE ONLY DOCUMENTS NECESSARY TO THE WORK ARE STORED AT
WORK STATIONS. DOCUMENTS ARE STORED IN A NEAT MANNER.
15. DOCUMENTS - CONTROL ALL DOCUMENTS ARE LABELED CLEARLY AS TO THE CONTENTS
AND RESPONSIBILITY FOR CONTROL AND REVISION. NO UNLABELED
BINDERS / DOCUMENTS ARE PRESENT. OBSOLETE OR UNUSED
DOCUMENTS ARE ROUTINELY PURGED.
16. TOOLS / GAUGES CONTROL TOOLS, JIGS AND FIXTURES ARE ARRANGED NEATLY AND STORED
IN A WAY THAT THEY ARE KEPT CLEAN AND FREE OF ANY RISK OF
DAMAGE.
17. TOOLS / GAUGES CONVENIENCE TOOLS, JIGS AND FIXTURES ARE ARRANGED SO THEY CAN BE EASILY
ACCESSED WHEN CHANGE-OVERS OR SET-UPS ARE MADE, THUS
INCREASING PRODUCTIVITY. THE SAME FOR GAUGES AND MEASURING
EQUIPMENT USED FOR QUALITY.
18. SHELVES, BENCHES AND DESKS THESE ARE ARRANGED, DIVIDED AND CLEARLY LABELED SUCH
ARRANGEMENT THAT IT IS OBVIOUS WHERE THINGS ARE STORED AND WHERE
THEY SHOULD BE RETURNED.
19. SHELVES, BENCHES AND DESKS THESE ARE KEPT FREE OF UNUSED OBJECTS, INCLUDING FILES AND
CONTROL DOCUMENTS. TOOLS OR ANY PIECES OF EQUIPMENT ARE CLEANED
BEFORE BEING REPLACED TO PROPER POSITION.
20. 5S CONTROL AND MAINTENANCE THERE IS A DISCIPLINED SYSTEM OF CONTROL AND MAINTENANCE
TO ENSURE THAT ALL OF THE ABOVE MENTIONED ITEMS ARE
MAINTAINED AT THE HIGHEST POSSIBLE LEVEL. IT IS THE RESPON-
SIBILITY OF MANAGEMENT TO MAINTAIN THIS SYSTEM.
TOTAL =
/20 =THIS EVALUATION IS TO BE COMPLETED EACH SHIFT BY EACH SUPERVISOR. IT IS TO EVALUATE THE
PRIOR SHIFTS PERFORMANCE ON 5S ISSUES. DROP THE EVALUATION IN THE 5S DROP BOX WHEN COMPLETED.
PLEASE PLACE COMMENTS FOR SCORES OR SUGGESTIONS FOR IMPROVEMENTS ON THE BACKSIDE OF THE SHEET.

1
2
3
4
5

Action Plan & Report After completing each training section provide a completed copy of this form to your trainer and/or mentor.
Signature: _____________________________________________________________________________ Date: ______________
High - Medium - Low (Cirle one)
Three key points from this training are:
What three things do I already do well regarding this training and topic?
What three things will I try to do to improve?
How and when will I measure my improvement?
I completed _________________________training on / / , and my current level of confidence with this topic and material is:
1.
2.
3.
1.
2.
3.
1.
2.
3.

Prepared by Rob Ptacek 04/22/2023 Page 10
Cause & Effect Diagram: List "Effect"
List "Effect" or outcome
KEY VARIABLES>
Other Concerns> >
Mother Nature MeasuresMaterials
Manpower MachinesMethods

Prepared by Rob Ptacek 04/22/2023 Page 11
Cause & Effect Diagram: EXAMPLE Schedule Attainment
Schedule Attainment below Goal
KEY VARIABLES> Drop in orders> Schedule Changes> Order size> Lack of materials> Trainees on site
Other Concerns>
Manpower> New people> Poor skills & slow> Trainees to Trainer ratio>>>
Machines> Lack of good tools> No enough tools> Not enough assy stations>>
Measures> Over capacity bookings> Capacity planning> order size impact on throughput>>
Mother Nature> Lack of space > Lack of assy stations> Poor faclities layout?>
Methods> No clear work instructions> OJT training techniques effectiveness> No tools storage standards> Poor connection to std work & goals> Capacity planning> Rush orders> Not running one piece flow> Big batches
Materials> Missing or lost> Late from supplier> Taking from one oredr to use on another>

Prepared by Rob Ptacek 04/22/2023 Page 12
KEY VARIABLES> Drop in orders> Schedule Changes> Order size> Lack of materials> Trainees on site
Other Concerns>
Methods> No clear work instructions> OJT training techniques effectiveness> No tools storage standards> Poor connection to std work & goals> Capacity planning> Rush orders> Not running one piece flow> Big batches

Design of Experiment Title:
Variable 1 High Low Comments , Findings, and Conclusions:
Varable 2 Big Small Big Small
Variable A Variable B Variable C Variable 3 High Medium Low High Medium Low High Medium Low High Meduium Low
High
Big
High
Medium
Low
Small
High
Medium
Low
Low
Big
High
Medium
Low
Small
High
Medium
Low
Design of Experiment Grid

document.xls
Confidential 04/22/2023 Page 14
Is/ Is Not
Date: Completed By:
Problem Description:
Is/ Is Not Questions Is Is NotDeductions about facts & other information. Direction / Priority Setting
Differences Changes & dates Most Likely Causes & Proposed DOE'sWhat Object?
Defect?
Where On object?
Geographically?
When First Seen?
Else seen?
In process seen?
How
What Is the trend?
Symtom:
Many objects have defects?
Many defects per object?

document.xls
Is-Is Not p2
(Determine Cause & Corrective Action for both how the failure occurred, and how it escaped your systems.)
Ask “Why” to the potential causes.
Is / Is Not Solution(s) Implementation & Tracking of Permanent Resolution(s):
OCCUR: How did the failure occur? ESCAPE: How did the failure escape our systems?Verify Root Cause(s): Combine problem description with changes to determine most probable root cause(s). Eliminate all but one root cause by verification through making the “failure” come & go.
Corrective Action & Decision Making: Evaluate corrective actions against time, cost & customer satisfaction.
Verify Corrective Action selected by testing failure. (Do not create another undesirable effect.)
Implement Corrective Action and make Permanent: Establish an audit or other guarantee that the corrective action stays in place.

Kanban Implementation Worksheet
Team: Area: Date:
Proposal Kanban System:
Current State: Future State:
Effect or Watse Reduction: Future Actions:

Effect or Watse Reduction: Future Actions:

Kanban Implementation Worksheet
Date:
Proposal Kanban System:
Future State:
Future Actions:
KanbanWithdrawal or Move Signal or Production
Shelf No.
Item No.
Item Name
Car Type
Preceding Process
Next Process
Item Back No.
STORE
Box Count Box Size Issue No.
Kanban
Signal or Supplier -Produce Batch Signal
Batch Size Part Name Reorder Point
WIP Container Size Pallet No.Part No.
Where Used
Store
Tag No.

Future Actions:

KanbanWithdrawal or Move Signal or Production
Shelf No.
Item No.
Item Name
Car Type
Preceding Process
Next Process
Item Back No.
STORE
Box Count Box Size Issue No.
Kanban
Signal or Supplier -Produce Batch Signal
Batch Size Part Name Reorder Point
WIP Container Size Pallet No.Part No.
Where Used
Store
Tag No.
PULL SYSTEMS
Supplying Process
Customer Process
FG Supermarket
21
Withdraw ProductNew Product
“WITHDRAWAL” Kanban
“PRODUCTION” Kanban
1. Customer process goes to supermarket and withdraws what it needs when it needs it
2. Supplying process produces to replenish what was withdrawn
• A way to control production between flows
• Controls production at supplying process without trying to schedule
[An example is a shipping label that serves as an indicator of consumption.]
[An example is a production tag that serves as an indicator of the pull.]
SUPERMARKETS or Inventory?
Supplying Process
Customer Process
FG Supermarket
21
Withdraw ProductNew Product
“WITHDRAWAL” Kanban
“PRODUCTION” Kanban
• A way to control production between flows
• Controls production at supplying process without trying to schedule
[An example is a shipping label that serves as an indicator of consumption.]
[An example is a production tag that serves as an indicator of the pull.]
1. Fixed container size and quantity
2. Always in the same location
3. Controlled by Kanbans Examples?

LEAN TRANSFORMATION ASSESSMENT & RECOMMENDATIONS
Facility: Process:
Assessor: Date:
Distribution: ScoresCriteria Max Area
1(Evaluates material(s) and information flow form customer order entry through manufacturing to suppliers)
(a) A current state Value Stream Map does not exist for product or product families 0(b) A current and future state Value Stream Map exists for product or product families 5(c) A strategic implementation plan for future state exists and is being executed 10
2(Calculates and synchronizes rate of production to rate of sales)
(a) The rate of production is not paced to Takt Time or rate of sales. 0(b) Takt time has been determined for product(s) but is seldom followed. 5(c) Takt time exists for product(s) and is strictly used to pace production. 10
3(Creates production flow of one piece at a time passed immediately to next process step)
(a) There is no standard work defined for process. Pieces are batched between process steps. 0(b) Standard is sometimes followed and supported by 5s some visual controls and materials 5(c) Standard work strictly followed and supported by 5s, visual controls, materials and TPM 10
4(For non-continuous flow operations creates production on demand without routine scheduling)(a) Non-continuous flow operations are scheduled. Production is not paced by customer demand. 0(b) Kanban supermarkets for withdrawal and production exists but are not strictly maintained. 5(c) Kanban supermarkets for withdrawal and production are strictly maintained. 10
5(Maintains demand-pull by scheduling only the process controlled by the outside customer's orders)
(a) For each product(s), separate schedules are set for major processes. No pacemaker process. 0(b) For each produce(s), only the pacemaker process is scheduled at least 50% of the time. 5(c) For each product(s), the pacemaker process is strictly scheduled to drive production flow. 10
6(Distributes the production of different products evenly over time at the pacemaker process)
(a) No mixed production exists for product families. Multiple lines or individual runs used. 0(b) Mixed production consists of 2 or more units back-to-back for each product family on one line. 5(c) Mixed production consists of only one unit back-to-back for each product family on one line. 10
7(Creates a "pull" by releasing and withdrawing small, consistent increments of work at pacemaker process)
(a) Production schedule is released in large inconsistent increments of 24 hours or more. 0(b) Production schedule is released in small, consistent increments of 8 to 24 hours. 5(c) Production schedule is released in small, consistent increments of 2 hours or less. 10
8(Establishes small daily lot sizes for high volume parts in non-continuous flow processes (Fabrication, etc)
(a) No lot sizes are defined for high volume part numbers. Maximum runtime is preferred. 0(b) Large lot sizes have been defined. High volume parts are run in lost sizes of 2 or more days 5(c) Small lot sizes have been defined. High volume parts are run daily lot sizes or less. 10
9(Drives planning and execution of lean manufacturing transformation)
(a) Management is not trained, but supports lean effort with a dedicated workforce of 1% or less. 0(b) Management is trained and supports lean effort with a dedicated workforce of 1% to 2%. 5(c) Management is trained and supports lean effort with a dedicated workforce of 2% or more. 10
###(Ties current lean manufacturing strategy consistently with future investments)
(a) No formal process exists for a "lean" review of capital investments and new products/processes. 0(b) "Lean" review process for capital investments, new products/processes is sometimes followed. 5(c) "Lean" review process for capital investments, new product/processes is strictly followed. 10
Maximum Lean Transformation Points 100Actual Lean Transformation Points 0
VALUE STREAM MAP (Why?: Using data, visually drives flow production, short lead time, quality improvement, lowest cost production)
TAKT TIME (Why?: Provides fast response to problems, drives elimination of causes of unplanned downtime, forces changeover)
CONTINUOUS FLOW (ONE-PIECE FLOW) (Why?: Drives process reliability, reduction of changeover time and unplanned downtime)
DEMAND-PULL (Why?: Drives accurate control of production between flows without MRP and the reduction of inventory)
SCHEDULE ONE PRODUCTION PROCESS (Why?: Drives inventory reduction and improves capacity utilization)
LEVELED PRODUCTION MIX (Why?: Reduces lead time to fill fluctuating customer demand, reduction of inventory levels)
LEVELED PRODUCTION VOLUME (Why?: Drive reliability by promptly highlighting problems for corrective action improvements)
SMALL LOT PRODUCTION (Why?: Drives reliability through reduction in set-up time, lead time to respond to fluctuations in customer demand)
DEDICATED CI RESOURCES (Why?: Improves daily reliability by driving change velocity through training and application of lean principles)
RETURN ON INVESTMENT (Why?: Drives Economic Value Added - EVA)

Team Radar Chart Measures Scores5-S 1Quality Process 2Work Cells / PC's 2Visual Controls 2Standard Work 3TPM 2Continuous Flow 1Pull Systems 1Leveling 2Quick Changeovers 2Training 3.5Supplier / Customer Alliances 3
5-SQuality Process
Work Cells / PC's
Visual Controls
Standard Work
TPMContinuous Flow
Pull Systems
Leveling
Quick Changeovers
Training
Supplier / Customer Alliances
0
2
4
Radar Chart

5-SQuality Process
Work Cells / PC's
Visual Controls
Standard Work
TPMContinuous Flow
Pull Systems
Leveling
Quick Changeovers
Training
Supplier / Customer Alliances
0
2
4
Radar Chart

LEAN IMPROVEMENT TRACKING SHEET
Group: Complete:Plant Manager: On Schedule:
Date: Over Due:
Kaizen or Six Sigma Project Investment Due
Target Area ResultsRequired Date
Project Leader
Value Stream Key Objective & Results to Date
Map Ref: #
Current State Measures
Future State Targets
Customer Impact

ATTENDENCE:
Conveyance Correction Overproduction Motion Waiting Inventory Processes
AREA: DATE:
AGENDA
1.
2.
3.
4.
5.
6.
7.
8.
ACTION ITEMS: Who, What, When
1.
2.
3.
4.
5.
6.
7.
8.
STOP TIME:START TIME:
MEETING WORKSHEET
NEXT MEETING: OTHER OUTCOMES:
MEETING TOPIC:

Metrics Sheet: Key Performance IndicatorsWeek 2005 2004 2003 2002
Mtd. Actual Mtd. Projected Mtd. Target Ytd. Actual Total Weekly Avg Weekly Avg Weekly Avg Weekly Avg
Category KPI Frequency Responsibility Goal2/1/2005 2/2/2005 2/3/2005
Customer
Daily GM GM 0 0 0 0Weekly JH 1.5 ope 1.6 1.6 1.4
Jobs per Day Daily JH 35 jpd 37 37 32Pieces per day GM 1500 /d 1806 1099 1238
Daily Job traveler GM 100% 100% 100% 100%Scrap Pieces Daily GM < 40 ppd 54 52 22
Delivery Daily AM 1 100 100 98Lead-time (weeks) Weekly Back log TC 1 Week 1 1 1Backlog (weeks) Weekly TC 3 Weeks 2.4 2.4 2.4
People Loss Time Daily Call in list BH < 0.5 hrs 0.25 0 0Housekeeping Daily TBD AM 100% 70% 70% 70%
Daily Call in list BH 0 0 0 0
Below Goal =
At Goal =
Data Source
Data Presentation
Satisfaction: Complaints Productivity, Cost
& QualityValue Added (orders per production employee)
Job travelers per week / 23
Job traveler
First Pass Approval %
Product Inquiry Report
On Time In Full (OTIF %)
Follow Up Sheet
Back log $ / 125$
Loss Time Injuries (LTI)

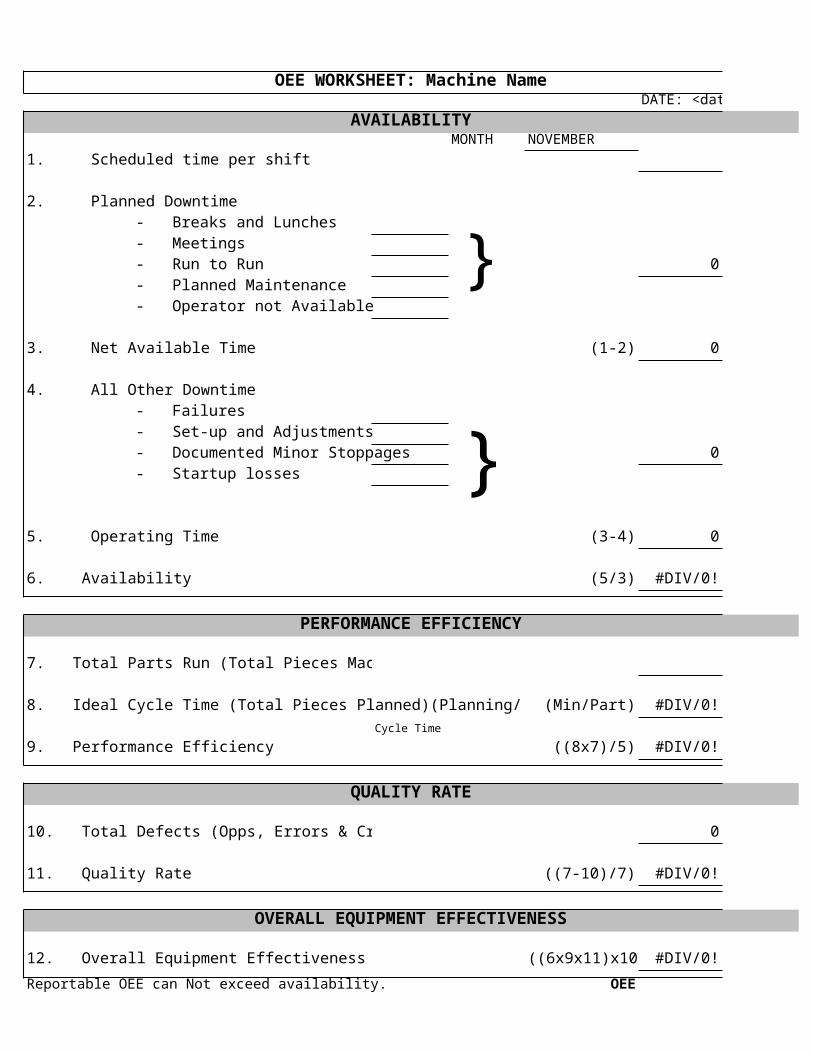
OEE WORKSHEET: Machine NameDATE: <date>
AVAILABILITYMONTH NOVEMBER
1. Scheduled time per shift Minutes
2. Planned Downtime- Breaks and Lunches- Meetings- Run to Run 0 Minutes- Planned Maintenance- Operator not Available
3. Net Available Time (1-2) 0 Minutes
4. All Other Downtime- Failures- Set-up and Adjustments- Documented Minor Stoppages 0 Minutes- Startup losses
5. Operating Time (3-4) 0 Minutes
6. Availability (5/3) #DIV/0! %
PERFORMANCE EFFICIENCY
7. Total Parts Run (Total Pieces Machined) Parts
8. Ideal Cycle Time (Total Pieces Planned)(Planning/NcProgram) (Min/Part) #DIV/0! Minutes
Cycle Time
9. Performance Efficiency ((8x7)/5) #DIV/0!
QUALITY RATE
10. Total Defects (Opps, Errors & Crash) 0 Parts
11. Quality Rate ((7-10)/7) #DIV/0!
OVERALL EQUIPMENT EFFECTIVENESS
12. Overall Equipment Effectiveness ((6x9x11)x100) #DIV/0! %
Reportable OEE can Not exceed availability. OEE
}
}

PDCA PLANNING WORKSHEETPart / Series / Subject Date Last Modified:
Status / Legend
PROBLEM STATEMENT:
Plant: Department: Completed by:
PLANDO CHECK MEASUREMENT
(CHECK)Schedule Task Timing Reviewed by: Projected
Yes NoStatus Item Initiative Task Responsibility START FINISH
Who Date
Base Improvement Actual
No. DURATION Date Date Time/$
Team Members: (Innovation Leader)
ACTIONS EFFECTIVE? (see Note below)
= Behind= O.K.= Completed

Problem Solving Worksheet
Author: Team: Date:
4. Root Cause Determination Data Collection & Analysis
5. Develop & Test Possible Solutions
6. Define & Implement Corrective Action
8. Address the System, Prevent Recurrence & make Permanent
1. Define the Problem (Note all symtoms & use the Is-Is Not form)
2. Describe Containment Actions (Who, What, When, Where, How, etc)
3. Describe Possible Causes (Use the Is-Is Not form)
7. Verify & Test the Corrective Action (Can the problem be turned "ON' & "OFF" )


Team Area Date
Improvement Proposal:
Current state Future State
Effect or Watse Reduction Future Actions
Rapid Improvement Event Before and After Implementation Worksheet

Effect or Watse Reduction Future Actions

Date
Improvement Proposal:
Future State
Future Actions
Rapid Improvement Event Before and After Implementation Worksheet

Future Actions

Six Sigma Summary Sheet
Team Member’s Names:Project Details
Company or area addressed:
Dates of project:
Include project goals, charter, business case, flow diagram, CTQ charts, etc.
Include system measures, key performance indicators, data collection plan, MSA, data display methods, etc.
Include Cause & Effect diagram, and other data analysis tools used to prove cause.(DOE etc.)Data ANALYSIS
Describe specific improvements implemented, cost benefits, risk analysis, pilot results, before & after sketches, implementation plan & dates, etc.
Include control methods, appropriate documentation & standards, follow up plan and dates, as well as reaction plan.
DEFINE the project
Project MEASURES
IMPROVEMENTS Implemented
Methods of CONTROL & follow- up

o:Manufacturing/DPS/Forms/StandardizedWork/DPS101StdWorkChart.xlsRev. 10/01/01
Standardized Work ChartArea: Hardware OP of
Process: Stud Assembler PG 1 of 1
Plant: Product: sec.Cycle
sec.Time
Major Operational Steps
Last Updated By: Cindy Bos Date: / /
Approved By (G.L.): Date: / /
Checked By (M.E.): Date: / /
1
2
3
4
5
6
6
7
SWIP Critical SafetyWorking Sequence
Walking
0 0 0 Return to Start
Takt Time
Seq. No.
Q.C. Check
MAN
TI
ME
AUTO
TI
ME
WAIT
TI
ME
WA L K
TI
ME
Safety Precaution
C S

JOB BREAKDOWN SHEET
PARTS: U137 Flip Qtr
MAJOR STEP KEY POINTS REASONSInclude main steps that advance the job. Make or break a job—
QualitySafety
Ease of Operation
1. Inspect PET ring frame
2. Place on stud table 2.1.1 Standardization
3. Load pal nut in press nest
4. Inspect stud
5. Load stud into PET frame pocket
6. Align stud head
7. Activate press
8. Repeat steps for 14 more studs
9. Place on staging rack
OPERATION: Stud assembly
TOOLS & MATERIALS: PET ring frame, stud, pal nut, stud press
SAFETY EQUIPMENT: 2 finger switches, safety glass
Describe why the job is done in the particular way described in the
Key Point.
1.1 Inspect for cracks, short shots, flash, contamination
1.1.1 Per customer requirement
2.1 Start on side of frame with 1 stud in middle
3.1 Pal nut must be loaded with teeth down to hold stud securely
3.1.1 To ensure proper assembly
4.1 Stud must threaded with no damage to threads
4.1.1 Per customer requirement
5.1 Stud must lay completely in rectangle pocket
5.1.1. To ensure proper assembly
6.1 Stud must align under press head
6.1.1 To ensure proper assembly
7.1 Hold both finger switches at the same time
7.1.1 To safely activate press
8.1 There are 15 studs on each part
8.1.1 Per customer requirement
9.1 To stage for priming operation

document.xls
Rob Ptacek Page 44 04/22/2023
Standard Work Combnation Sheet
Part # Date Demand / Shift Operation Number
wwwwwwwww
Process Name Dept. TAKT Time Prepared by
Step # Description of OperationTime Operation Time (in Seconds)
Manual Auto Walk Wait 5 s 10 s 15 s 20 s 25 s 30 s 35 s 40 s 45 s 50 s 55 s 60 s 65 s 70 s 75 s 80 s 85 s 90 s 95 s 100s 105 s 110 s 115 s 120 s
Totals5 s 10 s 15 s 20 s 25 s 30 s 35 s 40 s 45 s 50 s 55 s 60 s 65 s 70 s 75 s 80 s 85 s 90 s 95 s 100 s 105 s 110 s 115 s 120 s
Manual = Walking =
Automatic =

AUTODIEINTERNATIONAL
PROCESS TIMINGOBSERVATION SHEET
Process:TIME OBSERVATION SHEET
Date: OBV:
Time: OBV:Step Component Task VA NVA 1 2 3 4 5 TASK TIME Notes
1
2
3
4
5
6
7
8
9
10
11
12
13
14
15
TIME FOR ONE CYCLE

Type Begin Time
1 Answer Phone Process 0:00 0:00:25
2 Process 0:00 0:00:40
3 Process 0:01 0:00:05
4 Transport 0:01 0:01:15
5 Process 0:02 0:00:20
6 Process 0:02 0:03:45
7 Delay 0:06 0:06:05
8 Approved? Decision 0:12 0:00:00
9 Process 0:12 0:00:40
10 Process 0:13 0:00:05
11 Process 0:13 0:01:30
12 Process 0:14 0:00:15
13 Process 0:15 0:00:10
14 Process 0:15 0:00:05
15 Process 0:15 0:00:00
16 Process 0:15 0:07:35
17 Process 0:22 0:00:0018 Place Order Process 0:22 0:01:45
19 Inspect 0:24 0:00:3020 Thank Customer Process 0:25 0:00:10
Process Step
Process Name
Operation time
Ask for Customer Information
Does Customer Have Account
Place on Hold and Forward
Ask for Customer Information
Take information for Credit App
Wait for Credit Approval
Ask for Customer Information
Does Customer Have Account
Determine Product Needs
Is Product On Hand?
Check System for Lead Time
Quote Lead Time to Customer
Is Lead Time Acceptable?
Contact Manufacturing for LT Information
Is Lead Time Acceptable?
Validate Customer Ship
Info
0 0.2 0.4 0.6 0.8 1 1.2
0.671052631578947 0.328947368421053% Non Value Add
% Value Add

0 0.2 0.4 0.6 0.8 1 1.2
0.671052631578947 0.328947368421053% Non Value Add
% Value Add

End Time Value add?
0:00:25 Yes 0:00:25 Summary
0:01:05 Yes 0:01:05 0:08:20
0:01:10 Yes 0:01:10 Total Time 0:25:20
0:02:25 No 0:01:10 67%
0:02:45 No 0:01:10% Value Add
33%
0:06:30 Yes 0:04:55
0:12:35 No 0:04:55 Process Type Breakdown
0:12:35 Yes 0:04:55 Process Time 0:17:30
0:13:15 No 0:04:55 Delay Time 0:06:05
0:13:20 No 0:04:55 0:01:15
0:14:50 Yes 0:06:25 0:00:30
0:15:05 No 0:06:25
0:15:15 No 0:06:25
0:15:20 No 0:06:25
0:15:20 No 0:06:25
0:22:55 No 0:06:25
0:22:55 No 0:06:250:24:40 Yes 0:08:10
0:25:10 No 0:08:100:25:20 Yes 0:08:20
Value Add Total
Value Added Time
% Non Value Add
Transport Time
Inspection Time
0 0.2 0.4 0.6 0.8 1 1.2
0.671052631578947 0.328947368421053% Non Value Add
% Value Add
0
0.002
0.004
0.006
0.008
0.01
0.012
0.014
Process Time
Delay Time
Transport Time
Inspection Time

0 0.2 0.4 0.6 0.8 1 1.2
0.671052631578947 0.328947368421053% Non Value Add
% Value Add
0
0.002
0.004
0.006
0.008
0.01
0.012
0.014
Process Time
Delay Time
Transport Time
Inspection Time

Max 0.002604
Min -0.000868
Range 0.003472
Units -20
0.00026
0
0.002
0.004
0.006
0.008
0.01
0.012
0.014
Process Time
Delay Time
Transport Time
Inspection Time

0
0.002
0.004
0.006
0.008
0.01
0.012
0.014
Process Time
Delay Time
Transport Time
Inspection Time

Plot Width
0.00
0.00
0.00
0.00
0.00
0.01
0.02
0.00
0.00
0.00

Page 1 of 2
- At the SPEED of SIGHT
- At the SPEED of SIGHT

Page 2 of 2
- At the SPEED of SIGHT
- At the SPEED of SIGHT

VSM Action Plan Example
Confidential 04/22/2023 Page 55
Value Stream Map Action Item List Example
# Item Activity Who When Progress Comments
1 Attack all inventory watse TBD
2 TBD
3 Investigate HIP process TBD
4 TBD
5 TBD
6 TBD
7 TBD
8 TBD
9
10
.
Use supermarket concepts throughout the organization. Create flw.
JW & RP
Review & Map the planning & scheduling processes
Look for waste and develop ways to use Kanban sstems to reduce & expose the waste.
JW & RP
JW & RP
Attack Finishing issues with 6-Sigma approach
JW & RP
Help the FE VSM team dramatically reduce L/T
JW & RP
Loop segments o the business to create flow. See FS-VSM
JW & RP
Begin to organize around value streams or flows
JW & RP
Work with the customer to level flow, and to use Kanban signals to reduce inventory waste.
JW & RP


