
- 1 -
Adapting and validating diabetes simulation models across
settings: Accounting for mortality differences using
administrative data
Alison J Hayes BSc PhD1 Wendy Davis MPH PhD2 Timothy Davis FRACP DPhil
(Oxon) 2 and Philip M Clarke BEcon. PhD3
1. Sydney School of Public Health, University of Sydney, Sydney NSW 2006,
Australia.
2. School of Medicine and Pharmacology, The University of Western
Australia, Crawley, Western Australia 6009, Australia .
3. School of Population Health, University of Melbourne, Melbourne VIC
3010, Australia.
Corresponding Author: Alison J Hayes ; email: [email protected]
Grant support: AJH was funded though NHMRC grants 571372 and 512463.
PMC was supported by an Australian NHMRC Career Development Award
571122 and NIH Grant 5R01DK090435-02. TD was funded through a NHMRC
Practitioner Fellowship.

- 2 -
Abstract
Aims. To develop age and sex-specific risk equations for predicting mortality
following major complications of diabetes, using a large linked administrative
dataset from Western Australia (WA) and to incorporate these into an existing
diabetes simulation model..
Methods: The study uses linked hospital and mortality records on 13,884 patients
following a major diabetes-related complication with a mean (SD) duration of 2.62
(2.25) years. Risk equations for predicting mortality were derived and integrated
into the UKPDS Outcomes Model. Estimates of life expectancy and incremental
QALYs gained as a result of two theoretical therapies (a reduction of HbA1c of
1%, and reduction of systolic blood pressure of 10mmHg) were determined using
the original and adapted models.
Results: The two versions of the model generated differences in life expectancy
following specific events; however there was little impact of using alternative
mortality equations on incremental QALYs gained as a result of reducing HbA1c
or systolic blood pressure, or on outcomes of life expectancy for a cohort initially
free of complications.
Conclusions: Mortality following complications varies across diabetic populations
and can impact on estimates of life expectancy, but appears to have less impact
on incremental benefits of interventions that are commonly used in
pharmoeconomic analyses.

- 3 -
Keywords: type 2 diabetes; mortality; complications, simulation
model;administrative data.

- 4 -
Introduction
Diabetes simulation models are increasingly being used to inform economic
evaluations, particularly in the context of theraputic reimbusment decisions (The
Mount Hood 4 Modeling Group; 2007) . A key issue often referred to as external
validation is to test their applicability in populations that were not used in their
construction (American Diabetes Association Consensus Panel,2004; Sargent,
2005), an example being the validation of the Framingham risk score in different
ethnic groups (D'Agostino et al, 2001) . When systematic differences arise,
attempts are usually made to calibrate the model to the new setting. There is no
agreement as to how calibration should be carried out, but it usually involves
examination of some aggregate output of the model in the new population (Kopec
et al., 2010; Weinstein et al., 2001) and if differences arise, adjustments of
intercept and slope of risk model equations are made so that the model predicts
appropriate levels of risk (Abbasi et al., 2012).
The difference in mortality associated with diabetes complications is a source of
variation that needs to be examined when adapting diabetes simulation models
across settings. Such differences may arise over time and between different
settings, due to factors such as the intensity and availibility of health care
interventions to treat patients’ post-event risk. A pertinent issue in health
economic simulation modelling is that there are a limited number of data sources
with which to construct models of diseases processes. This is particularly the
case in diabetes where data from long-term studies conducted in one or two
- 5 -
countries are often used by researchers worldwide. While there is a need to
examine existing diabetes simulation models’ ability to predict mortality, this issue
has received much less attention than the degree to which they are able to
predict absolute event rates of major complications such as myocardial infarction
(The Mount Hood 4 Modeling Group; 2007).
A plausible explanation for a lack of post-event mortality validation studies is a
lack of existing data sets that follow people with diabetes after experiencing
complications. A potential source of information on mortality following
complications is linked administrative data that include records both of
hospitalisations and deaths. Our primary objectives in this study were to use
such an administrative dataset from Western Australia (WA) (Hayes et al., 2011)
to estimate age and sex-specific risk equations for predicting mortality following
major complications of diabetes and to incorporate these into the UKPDS
Outcomes Model (Clarke et al., 2004), a well known type 2 diabetes simulation
model. Whilst ‘stand alone’ models that estimate life expectancy post event have
been derived from the WA dataset (Hayes et al., 2011) they cannot easily be
integrated into the more complex simulation model which requires annually
updated information on complication status in order to predict mortality.
A second aim of the present study is to examine the broader issue of how taking
into account rates of mortality in different diabetes populations may impact on
overall outcomes such as life expectancy and quality adjusted life expectancy.
- 6 -
This involved comparing estimates of life expectancy using the orginal UKPDS
Outcomes Model and a model in which post-event mortality is determined from
the Western Australian population. Finally, we examine differences in estimates
of life expectancy and QALYs for a representative patient under a series of
hypothetical interventions that alter classical risk factors (e.g. HbA1c). This
addresses whether decision analytic aspects of the model are affected by the use
of Australian-specifc mortality equations.
Materials and Methods
Estimation of Australian mortality equations
The UKPDS Outcomes Model includes three equations for estimating mortality.
The first equation estimates risk of death from causes unrelated to diabetes while
the second two equations estimate the increased risk of death associated with
major complications (Clarke et al., 2004),. In this study we replace the latter by
estimating two new equations using Australian data to represent all cause
mortality following any of six complications.
We used an administrative health service dataset from WA over a ten year period
from 1 January 1990 to 31 December 1999, which has been described previously
[8]. The dataset contains de-identified information from four separate sources: 1)
insurance claims for medical and diagnostic charges; 2) information on

- 7 -
dispensed prescriptions for pharmaceuticals for those holding Government
concession and health care cards; 3) hospital records of inpatient episodes
(including day-only admissions) for public and private hospitals; and 4) WA state
death records. These data were confidentially linked at the individual patient level
through a collaborative project undertaken by Commonwealth Health and Aging,
the WA Department of Health, The University of WA, the Australian Institute of
Health and Welfare, and the Health Insurance Commission. The data linkage
was conducted using a protocol to ensure that the individuals privacy is protected
(Boyko et al., 1996). The study was approved by the Commonwealth Department
of Health and Ageing Departmental Ethics Committee.
Identification of people with diabetes was based on several criteria: use of
diabetes specific medications; use of HbA1c tests; hospital admissions or
discharges with diagnostic code(s) indicating diabetes (i.e. ICD9 code 250 or
ICD10 codes E10-14 ), or diabetes listed as a cause of death on death
certificates. Around 70,000 people over the age of 35 years were identified as
having diabetes by fulfilling at least one of these criteria. Of those identified with
diabetes, patients were further classified as having type 1 diabetes if indicated on
one or more hospital records or if there was evidence of use of insulin but not of
use of oral anti-diabetic agents. This is a wider definition of type 1 diabetes than
used in a previous study using the same administrative dataset (Hayes et al.,
2011). We supplemented the previous dataset with up to six additional months of
follow-up data in which complications were coded according to ICD10

- 8 -
classifcations. This increased the number of focal events by around 10 percent
for each type of complication. We also included foot ulcer as an additional
complication as patients with this complication have been shown to have
increased risk of mortality (Nelson et al., 2008).
The population used in this analysis was individuals with either type 1 or type 2
diabetes who had any one of six complications defined using the following
diagnostic, procedural, or cause of death codes:
1. myocardial infarction (MI) -either non-fatal myocardial infarction (ICD-9
code 410), or fatal cardiac event (ICD-9 code ≥ 410 and ≤414.9, or ≥ 428
and ≤ 428.9, or sudden death (ICD-9 code ≥ 798 and ≤ 798.9; ICD10
R96); or ICD-10 I21; ICD-10 code ≥ I20 and ≤I 25) or ICD10 R96
2. stroke -(ICD-9 code ≥430 and ≤434.9, or 436) or fatal stroke (ICD-9 code
≥ 430 and ≤ 438.9) or any fatal cebrovascular disease ICD-10 ≥ I60 and ≤
I69.
3. heart failure -ICD9 Codes 428 to 428.1, or ICD-10 I50
4. amputation of digit or limb using hospital procedure codes ≥84.10 to
≤84.17.
5. ulcer ICD-9 707.1 and non-pressure chronic ulcer of skin ICD-10 L97 and
L98.4
6. End stage renal disease ICD-9 V45.1; V56 or ICD-9 55.69, or ICD10
N18.0 and renal failure N19 and an encounter for care involving renal
dialysis Z49

- 9 -
Statistical analysis
The outcome modelled was death following one of the six specified
complications. Time to death was measured in months, the shortest unit of time
available in the administrative data. Patients were censored at the end of the
study period, or if there was evidence of emigration to another Australian state or
country (indicated by the pattern of health care use). The date of diabetes
ascertainment was determined as the earliest recorded use of diabetes-specific
medications, HbA1c tests or hospital admissions involving diabetes. We
classified the first complication after the individual was identified as having
diabetes, as the focal event. Individuals were considered to have prior
comorbidity if they had hospital records for any of the six specified complications
before their date of diabetes ascertainment.
To account for the high initial mortality following complications,and to maintain
consistency with the original UKPDS model, we derived a logistic regression
model for survival within the same year as the event, followed by a Gompertz
model for survival in subsequent years. This division allowed the mortality
equations to be integrated into the structure of the UKPDS simulation model that
uses annual cycles.
- 10 -
A multivariate logistic regression model was estimated for the probability of death
in the same calendar year as the focal event. Covariates in the model included
the type of focal event (MI, stroke, heart failure, amputation, renal failure,
ischaemic heart disease or ulcer), age (continuous), sex, type 1 diabetes and
prior comorbidities existing before the date of diabetes ascertainment.
Interaction terms for the type of event with age, sex and type 1 diabetes were
also investigated. Covariates were dropped through stepwise backwards
elimination if their odds ratios were not significantly different from unity at the 5%
level.
A Gompertz model, for the the hazard of death in years beyond the year of the
focal event was estimated as a function of a patient’s current age, in order to
allow extrapolation beyond the observed follow-up period (Nelson et al., 2008).
Hence the shape function of the Gompertz depends on current age and the linear
covariates were the type of focal event, prior comorbidities and time varying
covariates for future events as patients are still vulnerable to further
complications in years beyond the year of the focal event. Covariates were
dropped through stepwise backwards elimination if they did not achieve
significance at the 5% level. The proportional hazards assumption was tested
using Schoenfeld residuals (Schoenfeld,1982) in an equivalent Cox model and by
examination of Cox–Snell residual plots. Where proportional hazards problems
were found they were resolved by using age interacted covariates.

- 11 -
Simulation Modeling
The logistic and Gompertz mortality equations estimated from the Western
Australian population were coded into the simulation model. Then using
representative input data and clinical risk factors for patients from the Fremantle
Diabetes Study (FDS) (Davis et al., 2000) and using the UKPDS Outcomes
model with either the existing UK mortality equations or the WA mortality
equations, we simulated post-event survival following each of five major
complications of diabetes: myocardial infarction, stroke, heart failure, amputation
and renal failure (foot ulcer is not presently an outcome in the current UKPDS
outcomes model). The input cohort comprised patients aged 74 years with
diabetes duration 13 years, equal numbers of men and women, 14% smokers,
HbA1c of 7.9%, systolic blood pressure 157 mmHg, BMI 29 kg/m2 and total:HDL
cholesterol 5.2, representing the summary statistics of patients in the FDS close
to the time of their complication.
We then derived life expectancies and quality adjusted life expectancies following
each event from the two different versions of the simulation model. Secondly we
estimated outcomes for the same cohort of patients, initially free of complications.
Simulations were run for a maximum of 26 years to age 100 years and remaining
life expectancy and quality adjusted life expectancy were determined. In order to
minimize Monte Carlo (1st order) uncertainty arising due to the probabilistic
nature of simulations, we carried out 200 replications of a 1000 person dataset to

- 12 -
derive each life expectancy. Parameter (2nd order) uncertainty was evaluated
using 1000 bootstrapped coefficients of all model risk equations including the
new logistic and Gompertz models, which permitted calculation of 95%
confidence intervals for all life expectancy predictions. Finally we examined
incremental QALYs gained as a result of two theoretical therapies: a reduction of
HbA1c of 1%, and reduction of systolic blood pressure of 10mmHg. We compared
these effects using both UK and Australian versions of the simulation model.
Results
Australian mortality equations
The sub-group of patients who experienced at least one of the six selected
complications comprised 13,844 patients: 7,673 men and 6,211 women.
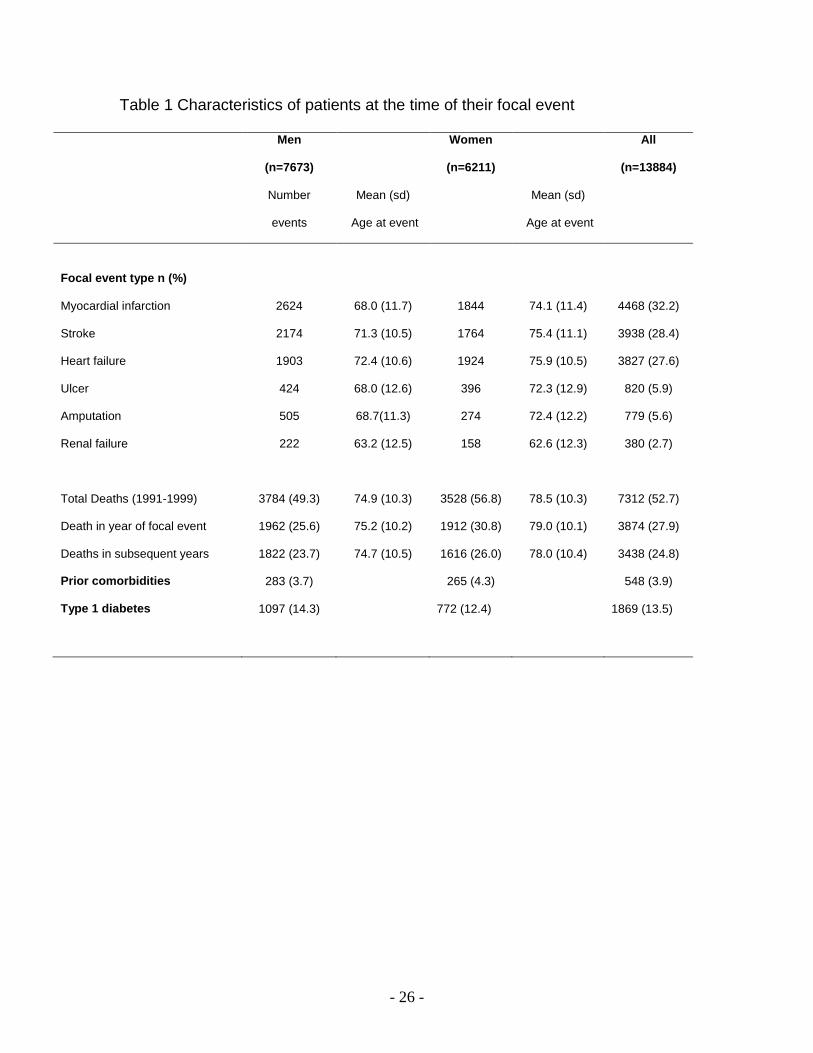
Summary statistics of the frequency of different focal events and death,
associated age at event, prior co-morbidities and type 1 diabetes are provided in
table 1. The most common complications for patients in our dataset were MI,
stroke and heart failure with approximately 88% of patients having one of these
as their focal event. Amputation, renal failure and foot ulcer together comprised
the remaining 12% of first events occurring during the observation period. With
the exception of renal failure, women were on average 4-6 years older than men
at the time of their first event (mean (SD) age women: 73.9 (11.4) years; men:
69.3 (11.4) years). The average age for renal failure was 62.6 (12.3) years for
women and 63.2 (12.5) years for men. The mean (SD) duration of follow-up was

- 13 -
2.62 (2.25) years. Approximately half of the cohort died during this period and
approximately one tenth of the cohort had prior co-morbidities at the time of
diabetes ascertainment.
Statistical analysis
Parameters and estimated odds ratios from the logistic regression model for
death within the same year as the focal complication are presented in table 2. All
events apart from heart failure had lower initial mortality than MI which was the
referent in the model. The risk of mortality increased by about 6% for every year
of age (p<0.001) for MI, amputation and foot ulcer but the interactions terms
indicated differences in age-dependency for stroke and heart failure. Death in the
year of renal failure was much more strongly age-dependent, increasing by about
11% for every year of age. The probability of dying was between 2 and 2.5 times
higher for patients who had co-morbidities (prior stroke (p=0.004), heart failure
(p<0.001), or amputation (p=0.03)).
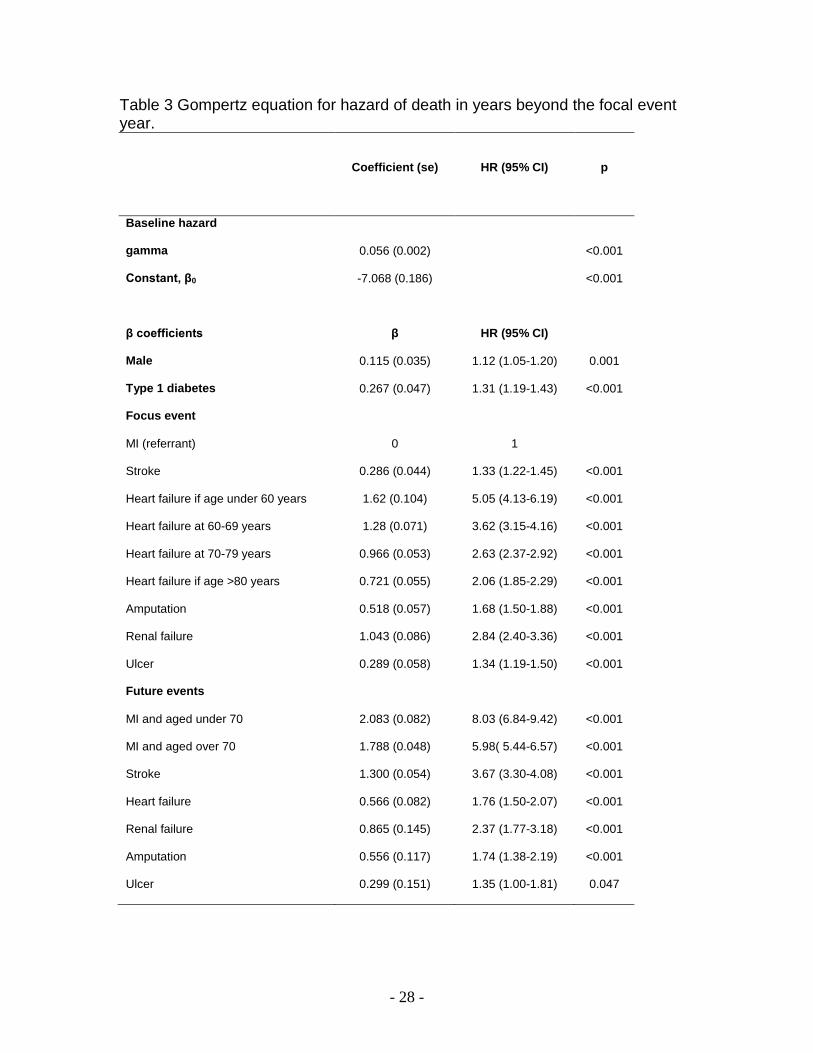
The Gompertz model for mortality in years beyond the year of the complication is
shown in table 3. Similarly to the logistic model, every year increase in age
resulted in an approximate 6% increase in risk of death. Compared with MI as the
referent, all other complications examined conferred higher long term mortality
risk (all hazard ratios >1). For example, someone with renal failure and who

- 14 -
survives till the end of that year is three times more likely to die in the following
year than someone who survived a MI.
Simulation modeling
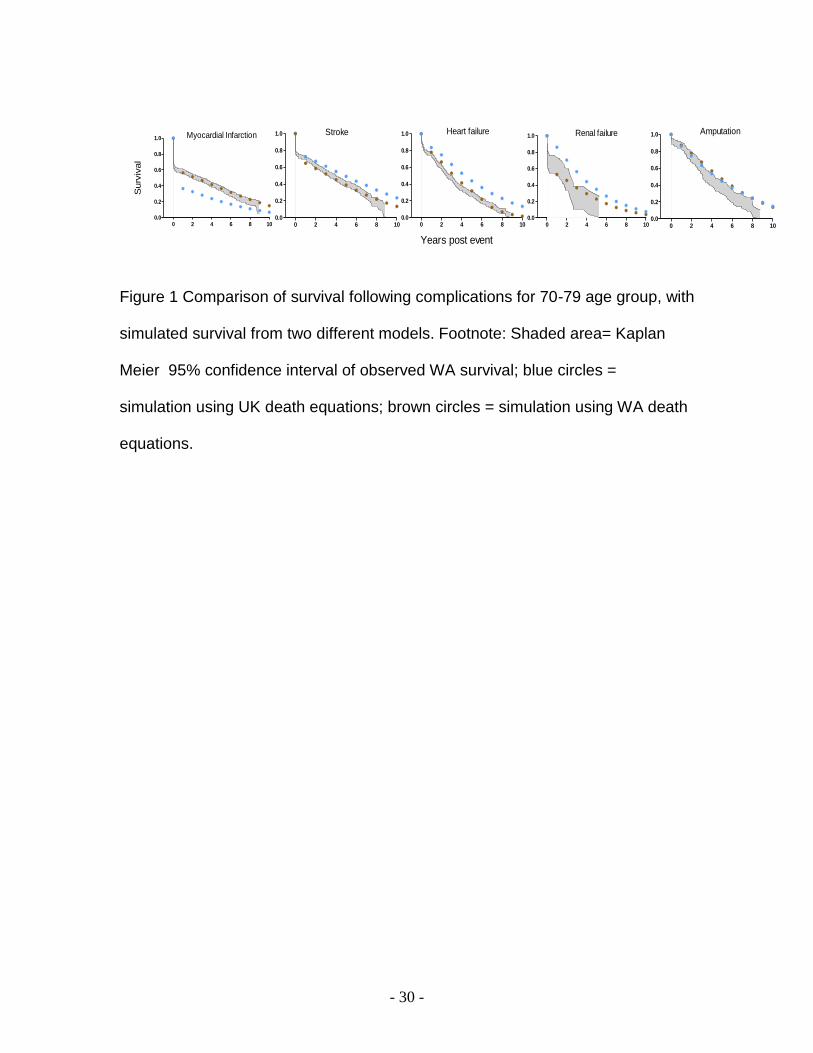
Figure 1 shows the observed Kaplan Meier survival of men and women 70-79
years, following each of 5 complications, compared with the simulated survival
from the original UKPDS model and the Australian version of the model.
Simulations using WA equations were closer to the observed survival in all
cases, with simulated survival falling within the 95% confidence interval of the
data. Simulations using UK mortality equations generally fell outside of the 95%
confidence interval with survival post MI being under predicted and survival
following stroke, heart failure and renal failure being over predicted.
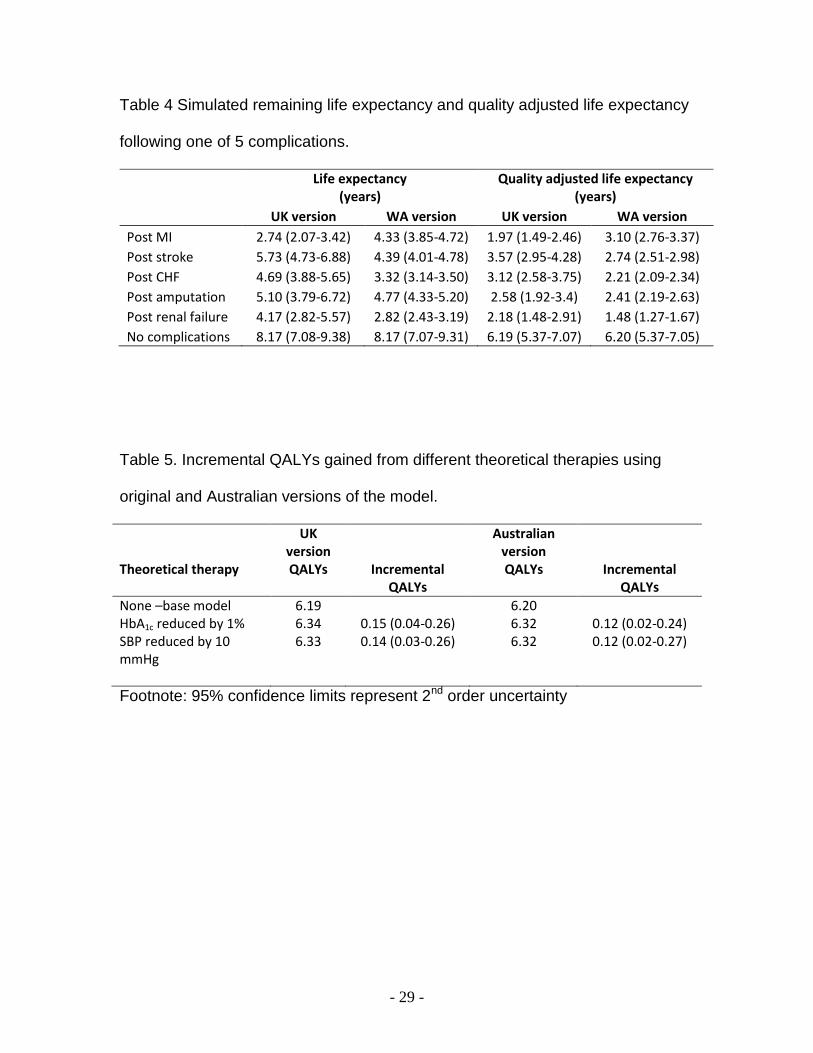
Simulated life expectancies and quality adjusted life expectancies following
events derived from both versions of the simulation model are shown in table 4.
Point estimates of life expectancy using the Australian version of the model were
shorter following heart failure, stroke and renal failure, longer following MI. Life
expectancies following amputation were similar regardless of whether UK or WA
death equations were used. However, 95% confidence intervals were overlapped
for UK and Australian predictions following most events except MI and heart
failure. The Australian version of the model predicted shorter life expectancy
following heart failure (approximately 1.4 years or 1 QALY) than the original
- 15 -
UKPDS model and longer life expectancy following MI of about 1.2 years or 0.9
QALYs. Also notable is that 95% confidence intervals of life expectancies (which
take into account parameter uncertainty) derived from the Australian version of
the simulation model were much narrower than from the UK version. This relates
directly to the greater parameter uncertainty of the coefficients in the UK mortality
equations.
Whilst differences in life expectancy of up to 1.5 years were simulated from the
two versions of the model following specific events, overall life expectancy for this
FDS cohort assumed free of complications at baseline was similar from both
simulation models (table 4).
The incremental quality adjusted life years gained under scenarios of changes in
risk factors from both original and Australian specific versions of the UKPDS
Outcomes model are shown in table 5. Point estimates for incremental QALYs
gained as a result of reducing systolic blood pressure of the patient cohort from
157 to 147 mmHg and as a result of reducing HbA1c by 1% were slightly greater
for the UK model, but when 2nd order uncertainty was incorporated, 95%
confidence limits of all incremental QALY estimates were overlapped.
Discussion
In this study, we have derived mortality risk equations to estimate survival
following major complications of diabetes based on a large linked administrative

- 16 -
healthcare data set from Australia. Not only did this enable us to adapt the
UKPDS outcomes model to another setting (Australia), it also allowed us to
examine the impact of using different mortality equations on outcomes such as
QALYs and life expectancy that are typically used by health economists when
modeling chronic diseases. This is a form of model uncertainly which is often
difficult to examine when models are developed from a single population, or
synthesized from a limited number of published sources.
Simulations using the Australian and UK models resulted in different predictions
of post event survival and life expectancy, particularly following MI and heart
failure. These suggest substantial differences in mortality risk between the two
populations. The higher survival following MI in the Australian population may be
due to differences across time as the original UKPDS equations were based on
data from 1977–1997, whilst the Australian equations were based on data from
1990 until 1999. This is consistent with the declining trend in MI case fatality
observed in other studies (Smolina et al., 2010) and, in this particular case, may
largely reflect the fact that the UKPDS was conducted before statin therapy was
available as a risk modifying strategy. Indeed, <2% of UKPDS patients received
lipid-modifying therapy during the study. The mortality discrepancy may also
represent differences across settings which may be related to health system
performance, or other factors such as socio-economic differences. The poorer
survival after heart failure predicted by the Australian–specific model is a little
harder to explain, but could be due to non-proportional effects using the models

- 17 -
from the UKPDS which had limited data on older patients. These differences may
also reflect the better initial clinical state and management of patients who are
part of a clinical trial over that of community dwelling patients with type 2
diabetes.
Whilst the original and the Australian version of the outcomes model generated
differences in point estimates of life expectancy following MI, stroke, heart failure
and renal failure, there were only small differences in aggregate outcomes of
average life expectancy for a cohort initially free of complications. To some extent
this is due to the fact that the over predictions of mortality from the UKPSD model
following some events are cancelled out by under predictions of mortality
following other events. Additionally, only a proportion of this cohort would
experience complications over their lifetime (e.g. in 25 years of simulation around
25% of the cohort are predicted to have an MI and only 14% a stroke) and so the
effect of mortality differences are diluted.
External validation of models is uncommon (Altman at al., 2009) and there has
been discussion as to whether it is required before a model is used for decision
analysis (Kopec et al., 2010; Weinstein et al., 2001). We are aware of only one
previous validation of a diabetes simulation model that specific focuses on
mortality as an outcome (Song et al., 2011). Here we have been able to examine
external validity at two levels, for specific patient subgroups that have
experienced a particular complication, and at the aggregate level of a patient
- 18 -
cohort. The predictive validity of the original UKPDS Outcomes model was
relatively poor in examining post–event survival among these specific patient
subgroups in Australia. We also examined whether decision analytic validity of
the model might change depending on the source of the mortality risk equations.
Incremental QALYs predicted from a reduction in systolic blood pressure of 10
mmHg or a reduction in HbA1c of 1%, were similar irrespective of the source of
mortality risk equations.
The question of whether the original outcomes model is valid in the Australian
setting depends on how it will be used. Applications of the UKPDS Outcomes
model to date include cost effectiveness analysis (Clarke et al., 2006, O’Reilly et
al., 2007), prediction of life expectancies (Leal et al.,2009) and prediction of the
incidence of cardiovascular complications (Reynoso-Noverón, 2011). On the
basis of the results in this study, we would conclude that the calibration by direct
estimation of mortality risk appropriate to Australia was necessary to have
confidence in predictions of life expectancy following specific events, but that
incremental outcomes of simulations such as used in economic evaluation were
robust to the data source of the equations for death following events.
There are some limitations to our research. There were no records of clinical risk
factors in the administrative dataset, hence the Australian mortality equations do
not discriminate between people of high or low clinical risk. Additionally, there
could be incorrect assignment of type 1 and type 2 status, but the overall
- 19 -
proportion of type 1 patients in the administrative dataset (13.5%) was similar to
that reported in national statistics (AIHW 2011). Finally, the Australian mortality
equations were based on 10 years of data prior to 2000 so would not reflect any
more recent improvements in survival following complications that may have
occurred in the last decade.
The uncertainty surrounding the estimates of life expectancy was much greater
using the UK than the Australian version of the model, which is consistent with
the larger number of events used to derive mortality equations. For example
there were a total of 13884 events in the Australian data whereas the original
UKPDS mortality equations were based on only 717 patients with events.
Record linked data are increasingly being used in epidemiological studies (Hayes
et al., 2011; Smolina et al., 2012) and their large size makes them particularly
useful for estimating mortality equations. When collected in countries such as
Australia which has a system of universal health care, such data also have the
advantage that they cover the entire population. The use of these data facilitates
the estimation of mortality risks based on a large number of patients and avoids
the selection issues that are often a source of criticism of comparable data from
clinical studies. Furthermore administrative data sets tend to capture more events
than clinicial trials. These advantages suggest they are likely to become
increasingly used in health economic simulation modelling.
Acknowledgements

- 20 -
We are grateful to Dr. John Bass and Richard Solon who were instrumental in
performing the data linkage, also to the Department of Health and Aging, the WA
Department of Health, The University of WA, the Australian Institute of Health
and Welfare, and the Health Insurance Commission, all of whom were
signatories to this unique collaborative project between the Commonwealth and
the State of WA.
- 21 -
References
Abbasi A., Corpeleijn E., Peelen L.M., Gannsevoort R.T., de Jong P.E., Gans
R.O.B. et al. (2012) External validation of the KORA S4/F4 prediction models
for the risk of developing type 2 diabetes in older adults: the PREVEND study.
European Journal of Epidemiology, 27,47-52.
Altman DG, Vergouwe Y, Royston P, Moions, K.G.M. (2009) Prognosis and
prognostic research: validating a prognostic model. BMJ,338:b605.
American Diabetes Association Consensus Panel. (2004) “Guidelines for
Computer Modeling of Diabetes and its Complications”. Diabetes Care,
27,2262-2265.
Australian Institute of Health and Welfare (2011), Diabetes prevalence in
Australia: detailed estimates for 2007-08. Diabetes series no. 17. Cat. no.
CVD 56. Canberra: AIHW. Viewed 3 December 2012
<http://www.aihw.gov.au/publication-detail/?id=10737419311>.
D'Agostino R.B. Sr, Grundy S., Sullivan L.M., Wilson P., CHD Risk Prediction
Group (2001). Validation of the Framingham coronary heart disease prediction
scores: results of a multiple ethnic groups investigation. JAMA , 286(2),180-7.
Boyko E.J., Ahroni J.H., Smith D.G. Davignon D. (1996) Increased mortality
associated with diabetic foot ulcer. Diabetic Medicine,13,967-72.
Clarke P.M., Gray A.M., Briggs A., Farmer A., Fenn P., Stevens R. et al
(2004) A model to estimate the lifetime health outcomes of patients with Type
- 22 -
2 diabetes: the United Kingdom Prospective Diabetes Study (UKPDS 68)
Outcomes Model. Diabetologia,47,1747–1759.
Clarke P.M., Gray A.M., Briggs A., Stevens R.J., Matthews D.R., Holman
R.R.(2005) Cost–utility analyses of intensive blood glucose and tight blood
pressure control in Type 2 diabetes (UKPDS 72). Diabetologia, 48, 868–877.
Davis T.M., Zimmet P., Davis W.A., Bruce D.G., Fida S., Mackay I.R.(2000)
Autoantibodies to glutamic acid decarboxylase in diabetic patients from a
multi-ethnic urban Australian community: The Fremantle Diabetes Study.
Diabetic Medicine, 2000,17,667-674.
Hayes A.J., Leal J., Kelman C. Clarke P.M. (2011). Risk equations to predict
life expectancy of people with type 2 diabetes mellitus following major
complications: a study from Western Australia. Diabetic Medicine, 28, 428–
435.
Kelman CW, Bass AJ, Holman CD.(2002)“Research use of linked health data-
-a best practice protocol” Australian & N Z Journal of Public Health, 26(3),
251-5.
Kopec J.A., Finès P., Manuel D.G. et al. Validation of population-based
disease simulation models: a review of concepts and methods. BMC Public
Health 2010; 10: 710.
Leal J., Gray A.M., Clarke P.M.(2009) Development of life-expectancy tables
for people with type 2 diabetes. European Heart Journal, 30, 834-839.
- 23 -
The Mount Hood 4 Modeling Group (2007). Computer Modeling of Diabetes
and its Complications A report on the Fourth Mount Hood Challenge Meeting”,
Diabetes Care, 30, 1638-1646.
Nelson C.L., Sun J.L., Tsiatis A.A., Mark D.B. (2008) Empirical estimation of
life expectancy from large clinical trials: Use of left-truncated, right-censored
survival analysis methodology. Statistics in Medicine, 27, 5525–5555.
O’Reilly D., Hopkins R., Blackhouse G., Clarke P., Hux J., Tarride J.E. et al.
(2007) Long-term cost–utility analysis of a multidisciplinary primary care
diabetes management program in Ontario. Canadian Journal of Diabetes, 31,
205–214.
Reynoso-Noverón N., Mehta R., Almeda-Valdes P., Rojas-Martinez R,
Villalpando S, Hernández-Ávila M, et al. (2011) Estimated incidence of
cardiovascular complications related to type 2 diabetes in Mexico using the
UKPDS outcome model and a population-based survey. Cardiovascular
Diabetology,10, 1- 9.
Sargent R.G. (2005). Verification and validation of simulation models. In: Kuhl
ME, Steiger NM, Armstrong FB, Joines JA .Proceedings of the 2005 Winter
Simulation Conference, 130-143.
Schoenfeld D.(1982) Partial residuals for the proportional hazards regression
model. Biometrika, 69, 239-241.
- 24 -
Smolina K., Wright F.L., Rayner M., Goldacre M.J. (2012) Incidence and 30-day
case fatality for acute myocardial infarction in England in 2010: national-linked
database study. European Journal of Public Health. Jan 11. [Epub ahead of print]
Song M., Alexander C.M., Mavros P., Lopez V.A., Malik S., Phatak H.M. et
al.(2011) Use of the UKPDS Outcomes Model to predict all-cause mortality in
U.S. adults with type 2 diabetes mellitus: comparison of predicted versus
observed mortality. Diabetes Research and Clinical Practise, 91(1),121-6.
Weinstein M.C, Toy L.E., Sandberg A.E. Neumann P.J., Evans J.S., Kuntz
K.M.et al. (2001) Modeling for Health Care and Other Policy Decisions: Uses,
Roles, and Validity. Value in Health, 4, 348-361.
.

- 25 -
Figure Legends
Figure 1 Comparison of survival following complications for 70-79 age group, with
simulated survival from two different models.
Footnote: Shaded area= Kaplan Meier 95% confidence interval of observed WA
survival; blue circles = simulation using UK death equations; brown circles =
simulation using WA death equations.
Tables
Table 1 Characteristics of patients at the time of their focal event
Table 2 Logistic Model for death within same calendar year as the focal event
Table 3 Gompertz equation for hazard of death in years beyond the focal event
year.
Table 4 Simulated remaining life expectancy and quality adjusted life expectancy
following one of 5 complications and with no complications.
Footnote: Men and women aged 74 years with average clinical risk factors. 95%
confidence intervals determined through use of bootstrapped coefficients.
Table 5. Incremental QALYs gained from different theoretical therapies using
original and Australian versions of the model.
Footnote: 95% confidence limits represent 2nd order uncertainty
- 26 -
Table 1 Characteristics of patients at the time of their focal event
Men
(n=7673)
Women
(n=6211)
All
(n=13884)
Number
events
Mean (sd)
Age at event
Mean (sd)
Age at event
Focal event type n (%)
Myocardial infarction 2624 68.0 (11.7) 1844 74.1 (11.4) 4468 (32.2)
Stroke 2174 71.3 (10.5) 1764 75.4 (11.1) 3938 (28.4)
Heart failure 1903 72.4 (10.6) 1924 75.9 (10.5) 3827 (27.6)
Ulcer 424 68.0 (12.6) 396 72.3 (12.9) 820 (5.9)
Amputation 505 68.7(11.3) 274 72.4 (12.2) 779 (5.6)
Renal failure 222 63.2 (12.5) 158 62.6 (12.3) 380 (2.7)
Total Deaths (1991-1999) 3784 (49.3) 74.9 (10.3) 3528 (56.8) 78.5 (10.3) 7312 (52.7)
Death in year of focal event 1962 (25.6) 75.2 (10.2) 1912 (30.8) 79.0 (10.1) 3874 (27.9)
Deaths in subsequent years 1822 (23.7) 74.7 (10.5) 1616 (26.0) 78.0 (10.4) 3438 (24.8)
Prior comorbidities 283 (3.7) 265 (4.3) 548 (3.9)
Type 1 diabetes 1097 (14.3) 772 (12.4)
1869 (13.5)

- 27 -
Table 2 Logistic Model for death within same calendar year as the focal event
Coefficient (se)
Odds ratio (95% CI)
p
β0
Constant -5.019 (0.189)
β
Male -0.195 (0.049) 0.82 (0.75-0.91) <0.001
Age at time of event (years) 0.0629 (0.003) 1.065 (1.060-1.070) <0.001
Focus event
MI (base case) 0 1
Stroke -1.659 (0.357) 0.190 (0.094-0.383) <0.001
Heart failure 0 1
Amputation -1.435 (0.179) 0.238 (0.168-0.338) <0.001
Renal failure -3.711 (0.986) 0.024 (0.004 – 0.169) <0.001
Ulcer -1.538 (0.129) 0.215 (0.167-0.276) <0.001
Age and event interactions
Stroke*age 0.017 (0.005) 1.017 (1.008-1.027) <0.001
Heart failure*age -0.016 (0.001) 0.984 (0.982- 0.986) <0.001
Renal *age 0.051 (0.014) 1.052 (1.024-1.081) <0.001
Sex and event interactions
Heart failure * male 0.519 (0.088) 1.681 (1.413- 1.998) <0.001
Amputation * male 0.563 (0.218) 1.756 (1.145-2.693) 0.01
Type 1 event interactions
Heart failure * type 1 0.477 (0.103) 1.612 (1.316-1.974) <0.001
Ulcer * type 1 0.856 (0.242) 2.354 (1.464-3.784) <0.001
History of events
Prior Stroke 0.638 (0.224) 1.893 (1.220-2.937) 0.004
Prior Heart failure 0.972 (0.144) 2.643 (1.991-3.508) <0.001
Prior amputation 0.638 (0.295) 1.893 (1.063-3.372) 0.03
- 28 -
Table 3 Gompertz equation for hazard of death in years beyond the focal event year.
Coefficient (se)
HR (95% CI)
p
Baseline hazard
gamma 0.056 (0.002) <0.001
Constant, β0 -7.068 (0.186) <0.001
β coefficients β
HR (95% CI)
Male 0.115 (0.035) 1.12 (1.05-1.20) 0.001
Type 1 diabetes 0.267 (0.047) 1.31 (1.19-1.43) <0.001
Focus event
MI (referrant) 0 1
Stroke 0.286 (0.044) 1.33 (1.22-1.45) <0.001
Heart failure if age under 60 years 1.62 (0.104) 5.05 (4.13-6.19) <0.001
Heart failure at 60-69 years 1.28 (0.071) 3.62 (3.15-4.16) <0.001
Heart failure at 70-79 years 0.966 (0.053) 2.63 (2.37-2.92) <0.001
Heart failure if age >80 years 0.721 (0.055) 2.06 (1.85-2.29) <0.001
Amputation 0.518 (0.057) 1.68 (1.50-1.88) <0.001
Renal failure 1.043 (0.086) 2.84 (2.40-3.36) <0.001
Ulcer 0.289 (0.058) 1.34 (1.19-1.50) <0.001
Future events
MI and aged under 70 2.083 (0.082) 8.03 (6.84-9.42) <0.001
MI and aged over 70 1.788 (0.048) 5.98( 5.44-6.57) <0.001
Stroke 1.300 (0.054) 3.67 (3.30-4.08) <0.001
Heart failure 0.566 (0.082) 1.76 (1.50-2.07) <0.001
Renal failure 0.865 (0.145) 2.37 (1.77-3.18) <0.001
Amputation 0.556 (0.117) 1.74 (1.38-2.19) <0.001
Ulcer 0.299 (0.151) 1.35 (1.00-1.81) 0.047
- 29 -
Table 4 Simulated remaining life expectancy and quality adjusted life expectancy
following one of 5 complications.
Life expectancy (years)
Quality adjusted life expectancy (years)
UK version WA version UK version WA version
Post MI 2.74 (2.07-3.42) 4.33 (3.85-4.72) 1.97 (1.49-2.46) 3.10 (2.76-3.37) Post stroke 5.73 (4.73-6.88) 4.39 (4.01-4.78) 3.57 (2.95-4.28) 2.74 (2.51-2.98) Post CHF 4.69 (3.88-5.65) 3.32 (3.14-3.50) 3.12 (2.58-3.75) 2.21 (2.09-2.34)
Post amputation 5.10 (3.79-6.72) 4.77 (4.33-5.20) 2.58 (1.92-3.4) 2.41 (2.19-2.63) Post renal failure 4.17 (2.82-5.57) 2.82 (2.43-3.19) 2.18 (1.48-2.91) 1.48 (1.27-1.67) No complications 8.17 (7.08-9.38) 8.17 (7.07-9.31) 6.19 (5.37-7.07) 6.20 (5.37-7.05)
Table 5. Incremental QALYs gained from different theoretical therapies using
original and Australian versions of the model.
UK version
Australian version
Theoretical therapy QALYs Incremental QALYs
QALYs Incremental QALYs
None –base model 6.19 6.20 HbA1c reduced by 1% 6.34 0.15 (0.04-0.26) 6.32 0.12 (0.02-0.24) SBP reduced by 10 mmHg
6.33 0.14 (0.03-0.26) 6.32 0.12 (0.02-0.27)
Footnote: 95% confidence limits represent 2nd order uncertainty
- 30 -
0 2 4 6 8 100.0
0.2
0.4
0.6
0.8
1.0 Myocardial InfarctionS
urv
ival
0 2 4 6 8 100.0
0.2
0.4
0.6
0.8
1.0 Stroke
0 2 4 6 8 100.0
0.2
0.4
0.6
0.8
1.0 Heart failure
0 2 4 6 8 100.0
0.2
0.4
0.6
0.8
1.0 Renal failure
0 2 4 6 8 100.0
0.2
0.4
0.6
0.8
1.0 Amputation
Years post event
Figure 1 Comparison of survival following complications for 70-79 age group, with
simulated survival from two different models. Footnote: Shaded area= Kaplan
Meier 95% confidence interval of observed WA survival; blue circles =
simulation using UK death equations; brown circles = simulation using WA death
equations.


