
Volume 20, Number 1 Print ISSN: 1096-3685
Online ISSN: 1528-2635
ACADEMY OF ACCOUNTING
AND FINANCIAL STUDIES
JOURNAL
Marianne James
California State University, Los Angeles
Editor
The Academy of Accounting and Financial Studies Journal is owned and published by Jordan
Whitney Enterprises, Inc. Editorial content is under the control of the Allied Academies, Inc., a
non-profit association of scholars, whose purpose is to support and encourage research and the
sharing and exchange of ideas and insights throughout the world.
Authors execute a publication permission agreement and assume all liabilities. Neither
Jordan Whitney Enterprises nor Allied Academies is responsible for the content of the
individual manuscripts. Any omissions or errors are the sole responsibility of the
authors. The Editorial Board is responsible for the selection of manuscripts for
publication from among those submitted for consideration. The Publishers accept
final manuscripts in digital form and make adjustments solely for the purposes of
pagination and organization.
The Academy of Accounting and Financial Studies Journal is owned and
published by Jordan Whitney Enterprises, Inc., PO Box 1032, Weaverville, NC
28787 USA. Those interested in communicating with the Journal, should contact
the Executive Director of the Allied Academies at [email protected].
Copyright 2016 by Jordan Whitney Enterprises, Inc., Weaverville, NC, USA

EDITORIAL REVIEW BOARD MEMBERS
Robert Marley
University of Tampa
Liang Song
Michigan Technological University
Robert Graber
University of Arkansas – Monticello
Steve Moss
Georgia Southern University
Michael Grayson
Brooklyn College
Chris Harris
Elon University
Sudip Ghosh
Pennn State University, Berks campus
Atul K. Saxena
Georgia Gwinnett College
Rufo R. Mendoza
Certified Public Accountant
Anthony Yanxiang Gu
State University of New York
Alkali Yusuf
Universiti Utara Malaysia
Hema Rao
SUNY Osweg
Junaid M. Shaikh
Curtin University of Technology
Marek Gruszczynski
Warsaw School of Economics Douglass
Linda Bressler
University of Houston Downtown
Natalie Tatiana Churyk
Northern Illinois University
Suzanne Pinac Ward
University of Louisiana at Lafayette
Dan Ward
University of Louisiana at Lafayette
Eugene Calvasina
Southern University
Ron Stunda
Valdosta State University
P.N. Saksena
Indiana University South Bend
Martha Sale
Sam Houston State University
Askar Choudhury
Illinois State University
Rafik Z. Elias
California State University, Los Angeles
Harold Little
Western Kentucky University
Dawn Mead Hukai
University of Wisconsin, River Falls
James A. DiGabriele
Montclair State University
Desti Kannaiah
Middlesex University London, Dubai Campus
Philip H. Siegel
Augusta State University
Treba Marsh
Stephen F. Austin State University
Frank Plewa
Idaho State University
Mukunthan Santhanakrishnan
Idaho State University
Jan L. Williams Martha G. Suez-Sales University of Baltimore University of Guam
Thomas G. E. Williams
Fayetteville State University

TABLE OF CONTENTS
ISLAMIC INTERNAL CONTROL IN NON-ISLAMIC ENVIRONMENT: A NECESSITY FOR JAPANESE
COMPANIES…………………………………………………………………………………………………………..1
Mehriban Ahmadova, Nagoya University
AN EXAMINATION OF THE EFFECT OF DEMOGRAPHIC VARIABLES AND PERSONALITY TRAITS ON
STUDENTS’ VALUATIONS OF JOB CHARACTERISTICS...................................................................................18
Kella Kicklighter Bell, BYRT CPAs, LLC
Tanya M. Lee, Valdosta State University
Sanjay Gupta, Valdosta State University
DISENTANGLING THE IFRS 1 DISCLOSURE: OBSERVATIONS FROM THE EARLY ADOPTION OF IFRS
IN CANADA……………………………………………………………………………………………………….....35
Theresa DiPonio, Robert Morris University
THE PROBLEM OF LIMITED SCOPE AUDITS…………………………………………………………….……..47
Theresa Hrncir, Southeastern Oklahoma State University
STUDY OF THE FORECASTING PERFORMANCE OF CHINA STOCKS’ PRICES USING BUSINESS
INTELLIGENCE (BI): COMPARISON BETWEEN NORMALIZED AND DENORMALIZED
DATA…………………………………………………………………………………………………………….…...53
Ojoung Kwon, Craig School of Business
Zijian Wu, Craig School of Business
Long Zhang, Craig School of Business
A CANONICAL RANKING OF THE DETERMINANTS OF SHARE PRICE LIQUIDITY……………………...70
Bruce C. Payne, Barry University
Jana Rutherford, Barry University
Anthony Sadler, Barry University
THE FRAUD TRIANGLE AS A PREDICTOR OF CORPORATE FRAUD……………………………………….80
Dianne M. Roden, Indiana University Kokomo
Steven R. Cox, Indiana University Kokomo
Joung Yeon Kim, Indiana University Kokomo
A RISK RETURN PROFILE AND RANKING OF THE DETERMINANTS OF THE ENTERPRISE
MULTIPLE………………………………………………………………………………………………….………..93
Anthony Sadler, Barry University
Adnan Daghestani, Barry University
Bruce C. Payne, Barry University
ANALYZING COST BEHAVIOR OF PHILIPPINE INDUSTRIAL FIRMS……………………………………..103
Arnel Onesimo O. Uy, De La Salle University
AUDITOR QUALITY AND IFRS INFORMATION COMPARABILITY………………………………………..114
Zhemin Wang, Nanfang College, University of Wisconsin-Parkside
Jinsong Tan, Sun Yat-sen University
Zhijun Lin, Macau University of Science and Technology
Chengjie Dong, Nanfang College
Academy of Accounting and Financial Studies Journal Volume 20, Number 1, 2016
1
ISLAMIC INTERNAL CONTROL IN NON-ISLAMIC
ENVIRONMENT: A NECESSITY FOR JAPANESE
COMPANIES
Mehriban Ahmadova, Nagoya University
ABSTRACT
In 2001 a Japanese foreign subsidiary failed to follow Islamic rule despite labeling the
opposite, which damaged the reputation of the subsidiary company and negatively affected the
share prices of the parent company. Since Islamic finance started its rapid growth as a global
alternative financing, Japanese companies have also demonstrated a strong interest in
investment into Islamic finance. The purpose of this study is to describe arguments, which will
explain the necessity of conducting Islamic internal control in overseas subsidiaries involved in
Islamic finance by Japanese parent companies. As a result of literature review and historical
and international comparison followings were found: (1) internal control is an important tool for
managing risks of the company. Furthermore, risks are higher because chances for misconduct
increase when subsidiaries are maintained abroad; (2) Islamic internal control is going through
a formation phase, when it is facing several challenges. These challenges are significant
obstacles for building strong and well-developed Islamic internal control. And the companies
involved in Islamic finance should be more caution because any Sharia non-compliance may
seriously affect the whole business; (3) overall uniqueness of Islamic finance in a non-Islamic
environment creates additional risks for business. Based on these findings I conclude that
Islamic internal control is a necessary measure for prevention of misconduct in Japanese
subsidiaries involved in Islamic finance.
INTRODUCTION
Islamic finance is a term used to describe financial services mainly implemented in
accordance with Islamic law or Sharia. Sharia consists of many rules and principles that will be
briefly discussed in the next chapter. Not without purpose in the West Islamic finance usually is
referred to as an “alternative” financial industry, which means that, unless Islamic Financial
Institutions (IFIs) strictly follow Sharia rules and guidelines, there is no reason for existence of
Islamic financial industry. The core of Islamic finance is Sharia. To ensure complete Sharia
compliance, IFIs conduct Islamic internal control or Sharia audit, which can be done by both
internal and external auditors and supervised by a Sharia Supervisory Board (SSB).
Halal certification in Indonesia is the process conducted by Majelis Ulama Indonesia
(MUI; Indonesian Council of Ulama). By issuing this certificate MUI grants its approval of the
product’s complete permissibility from the religious point of view. Considering that Indonesia
has the world’s largest Muslim population (BBC, 2014), which amounts to 204,847,000 people
as of 2010 (Rogers, 2011) that is approximately 88% of the overall population of Indonesia, halal
certification plays an important role. Producers can apply to receive halal certificate voluntarily.
Japanese-owned PT Ajinomoto Indonesia received its first halal certificate in 1998. However,
since the certificate is valid only for two years, in 2000 the company had to reapply. As a result
of an investigation conducted by MUI it had been clarified that one of the ingredients had been

Academy of Accounting and Financial Studies Journal Volume 20, Number 1, 2016
2
changed without MUI’s awareness. After detailed study of this new ingredient, Bactosoytone,
MUI found that a pig pancreas was used in its manufacturing (Kobayashi, 2002).
Consequently, in January 2001 Ajinomoto Indonesia seasoning product was banned from
sale by Indonesian Department of Health. Ajinomoto-Indonesia had acknowledged that enzyme
extracted from pork has been used in the manufacturing of its seasoning product, but denied that
the end product contained material prohibited by Islam. A chemistry professor at Gadjah Mada
University, Umar Anggoro Jenie, criticized MUI’s fatwa (Islamic legal opinion): “Bactosoytone
is not an active material. So Ajinomoto is not a haram item” (haram – forbidden or proscribed by
Islamic law). According to some scholars, this situation could have been included in the category
of khilafiyah, an issue on which different opinions are legitimately possible (Kobayashi, 2002).
The case of Ajinomoto was not an Islamic finance related one. The company only labeled
its product Islamic permissible. Nevertheless the consequences of this mistake had a high price.
Ajinomoto Indonesia had announced plans to buy back about 3,000 tons of its seasoning
products worth Rp30 billion (US$3.35 million). Moreover, on January 9, 2001 share prices of the
Ajinomoto Co. declined by their daily limit of 200 yen at the Tokyo Stock Exchange (Ando,
2001) (Graph 1).
Graph 1
Source:http://finance.yahoo.co.jp/
Strong internal control process should have foreseen the possibility of this situation.
However insufficient knowledge about Islamic rules and principles caused such inadvertence.
The parent company has been affected equally as the subsidiary.
The question that comes to mind is how different would have been an effect of this
situation if the company was actually involved in Islamic finance? The existence of Islamic
1433
1394
1194
1270
1303 1310 1305 1292 1287
1255
1208
1229
1257 1246
1233 1215
1234 1227 1225
4-J
an-0
1
5-J
an-0
1
6-J
an-0
1
7-J
an-0
1
8-J
an-0
1
9-J
an-0
1
10
-Jan
-01
11
-Jan
-01
12
-Jan
-01
13
-Jan
-01
14
-Jan
-01
15
-Jan
-01
16
-Jan
-01
17
-Jan
-01
18
-Jan
-01
19
-Jan
-01
20
-Jan
-01
21
-Jan
-01
22
-Jan
-01
23
-Jan
-01
24
-Jan
-01
25
-Jan
-01
26
-Jan
-01
27
-Jan
-01
28
-Jan
-01
29
-Jan
-01
30
-Jan
-01
31
-Jan
-01
AJINOMOTO CO., INC.
Closing Share Prices

Academy of Accounting and Financial Studies Journal Volume 20, Number 1, 2016
3
finance is based on its differences from conventional finance. If companies will fail to follow
principles of Islamic finance, they may as well lose investors’ confidence. Therefore, Islamic
internal control conducted by Japanese parent company is a necessary measure for prevention of
misconduct in subsidiaries involved in Islamic finance.
The purpose of this paper is to describe a necessity of conducting additional Islamic
internal control in Japanese subsidiaries by their parent companies based on a literature review
and historical and international comparison.
The results of this paper will clarify potential challenges of Japanese parent companies
controlling their subsidiaries involved in Islamic finance, thereby reducing risks of misconduct
or Sharia non-compliance. Although this work is the first step in researching Islamic internal
control of Japanese companies, it will be a useful reference for corporate governance sector of
interested companies. Unfortunately, there is a significant lack of literature about Islamic internal
control. Moreover, academic research papers covering this topic related directly to the Japanese
market are even less abundant. Therefore, this work will also contribute to the literature of
Islamic internal control in the Japanese market. Prior research works have described the
importance of Islamic internal control in companies involved in Islamic finance; however, this
paper aims to describe the importance of conducting Islamic internal control by parent
companies in their subsidiaries.
RESEARCH BACKGROUND
Development of Islamic Finance
During the events of 2008 when the global financial markets were struggling against the
crisis, the world started asking questions about the fundamental structure of the conventional
financial system (Rarick & Han, 2010). Investors and others in search for the answers realized
the existence of an alternative system, - Islamic finance, which is built around certain principles
and rules. One of the major ones is the prohibition of receiving or paying interest.
The beginning of Islamic finance goes back to the 6th
century when Islam as a religion
took its start. The first Islamic financial instruments were most efficient during the era known as
“Islamic civilization” (VI - XI centuries). During this period the main guiding law of Islam –
Sharia was introduced (Schoon, 2008). Sharia is derived from the Qur’an (word of God) and
Sunnah (the sayings of Prophet Muhammad (s.a.s.)). Even though originally Islamic finance has
a long history, the world became acquainted with it only in the 20th
century. Although rapid
development of Islamic finance in recent history began in the middle of the 1980s, the first
Islamic financial company of the 20th
century was established in 1963 with the Mit Ghamr Local
Savings Bank in Egypt (Schoon, 2008). The project was abandoned for political reasons,
however it is still considered to be the first Islamic financial institution, which gave a start to a
modern Islamic banking/finance (Botish, 2013).
Islamic finance is a fast-growing source of finance for Muslim and non-Muslim investors
around the world. In recent years, Islamic Finance has grown rapidly across the world
conservatively estimated at 15-20% (Hancock, 2013; Ernst & Young, 2013; MIFC, 2013). The
followings are the key findings of the World Islamic Banking Competitiveness Report 2013-14
by Ernst & Young: (1) compared to the conventional average of 15%, the average return on
equity for the top 20 Islamic banks is 12.6%; (2) Islamic banking assets with commercial banks
globally are estimated to reach US$1.7t in 2013; (3) 38 million customers globally. The global
Islamic financial services market has demonstrated rapid growth between 2010 and 2012 by

Academy of Accounting and Financial Studies Journal Volume 20, Number 1, 2016
4
approximately 33%. Currently it represents about 1% of the worldwide financial services
industry (Clifford Chance, 2013).
There are several reasons for the rapid expansion of the Islamic financial system. First of
all, Islamic and conventional finance can coexist, and financially developed countries like the
UK would like to create an alternative financial system in order to expand customer and investor
variety. Secondly, Gulf countries, the population of which mainly consists of Muslims, are rich
with oil and gas. The more Sharia compliant product emerges the more Gulf wealth will flow
into Islamic financial products. Thirdly, the Muslim population of the world, which is growing
nearly twice as fast as the non-Muslim population, wants and needs Sharia compliant products.
Moreover, non-Muslim investors are interested in it as much as Muslim investors are. Fourth,
socially responsible investing is thriving, and socially responsible investors look for something
that Islamic finance already offers. Finally, globalization is inevitable. At present, companies
seek for customers all over the globe, and many of those customers are Muslims.
The basic framework of providing Islamic financial services is based on the following
principles (HM Treasury, 2008, 7):
“Prohibition of the payment or receipt of interest (riba): money itself is considered to have no intrinsic
value – it is merely a store of wealth and medium of exchange;
Prohibition of uncertainty (gharar) or speculation (masir): everybody participating in a financial transaction
must be adequately informed and not cheated or misled;
Prohibition of financing certain economic sectors: investment is forbidden in what are considered to be
socially detrimental activities. These include gambling, pornography, alcohol and armaments;
Importance of profit and loss sharing: the investor and investee must share the risk of all financial
transactions; and
Asset-backing principle: financial transactions should be underpinned by an identifiable and tangible
underlying asset.”
As Islamic finance continues to grow, many governments have taken, or are taking, steps
to accommodate the asset based nature of Islamic finance to ensure equal treatment, particularly
from a tax perspective, between Islamic and conventional forms of finance. For example, the UK
aimed to attract Islamic finance to London, to one of the biggest financial centers of the world
and to name London “an unrivalled western center for Islamic finance” (Osborne, 2013). One of
the main tasks standing in front of the UK government was to maintain balance between Islamic
and conventional finance by regulating the legislation. As a result of those legislative changes
tax barriers for Islamic finance were reduced and Islamic financing arrangements (in UK
legislative acts – “alternative financing arrangements”) were considered as “loan relationships”
(Clifford Chance, 2013). Currently, the UK has become the leading center of Islamic finance in
the west.
In spite of the UK being in the list of top countries implementing Islamic finance, an
environment (Islamic or non-Islamic) under which Islamic finance is implemented has a great
importance. In other words, the implementation of Islamic finance industry will certainly have
more obstacles, for example, in the UK than compared to Saudi Arabia or Malaysia.
Hasan (2009) named three main jurisdiction models of the Sharia governance system:
mixed legal jurisdiction, Islamic and mixed legal environment, and non-Islamic legal
environment. Countries representing these models in his study, respectively, are Malaysia, GCC,
and the UK.

Academy of Accounting and Financial Studies Journal Volume 20, Number 1, 2016
5
Development of Islamic finance in Japan
In 2013 Hirofumi Tanada from the Faculty of Human Sciences at Waseda University
conducted a research estimating Muslim population of the world and Japan based on various
materials including “Register of Foreign Residents in Japan” as of 2011 (Table 1). It was found
that the total population of Muslims in Japan as of 2011 was 105,565.
Compared to the Muslim population of UK, which was 2,786,635 only in 2011, a
population of 105,565 Muslims in Japan is not a significant number. And here could be asked a
question: why does Japan need Islamic finance if there is almost no demand from the
population? The speech given by the Governor of the Bank of Japan Toshihiko Fukui at the
Nikkei Islamic Symposium 2008: “Islamic Finance: Constant Evolution and Emerging
Opportunities” could be used to answer this question: “… The development of Islamic finance
brings diversity to financial markets and financial transactions. ...To date, Islamic finance
institutions have provided many products that replicate those of conventional finance while
respecting Islamic values, where interest, or riba, is prohibited. In other words, Islamic financial
institutions have successfully provided conventional intermediary functions by utilizing the latest
financial technology…”
Table 1
MUSLIM POPULATION OF JAPAN AS OF 2011
TYPE OF POPULATION POPULATION
Foreign Muslim Residents 91,744
Japanese Muslims 11,189
Other Muslims 2,632
TOTAL 105,565
Islamic finance found its way into the Japanese market only in the beginning of the
21st century (Table 2). However it is not commonly known that, according to Al-Omar &
Abdel-Haq (1996), the Industrial Bank of Japan was involved in trading based on Islamic
finance in London already in the 1980s.
Despite recent developments in Islamic finance in Japan (Table 2), compared to the
UK the current situation of the Japanese legal system is less Islamic finance attractive.
Japanese banks are only permitted to conduct the activities that are listed in the banking law
and the ancillary activities to such listed activities. For example, the banking law of Japan
does not permit banks to buy products. Under this condition banks cannot participate in
Murabaha and Ijara transactions. Furthermore, in Japan banks are allowed to invest in
securities (e.g. Mudaraba and Musharaka), only if they are considered to be pure investors
(Saito & Yoshimine, 2008).
The proposal to permit bank’s subsidiaries to deal with Islamic financial products
came from Japanese Financial Services Agency in 2007, and already in 2008 the amendment
was enacted (the Amendment to the Ordinance on the Enforcement of Banking Act).
The enactment of Article 17-3.2 (ii)-2 allowed subsidiaries of Japanese banks to
conduct “lending” type Islamic finance transactions. The amendment stipulated that
subsidiaries can handle such business if the transaction satisfies the following three
conditions: (1) the transaction is “deemed equal to money lending”, although not money
lending itself; (2) no interest should be charged because it is prohibited by religious discipline;
(3) the board, members of which have professional knowledge of the religious discipline of

Academy of Accounting and Financial Studies Journal Volume 20, Number 1, 2016
6
such non-lending transactions, support these transactions (Saito & Yoshimine, 2008; Saito &
Igarashi, 2010).
Table 2
CHRONOLOGICAL DEVELOPMENT OF ISLAMIC FINANCE RELATED ACTIVITIES IN JAPAN
YEAR COMPANY CONTENT SOURCES
2001 Tokio Marine Launched takaful business in Saudi Arabia Tokio Marine
2004 Tokio Marine Set up Retakaful company in Singapore Angelo (2006)
2004 Tokio Marine Started takaful business in Indonesia Lai (2010)
2005 JBIC Co-finance with Islamic finance to Bahrain Etsuaki (2007)
2005 ARCAPITA Set up Islamic Fund for Japanese properties REDmoney (2014)
2005 Tokyo Commodity Exchange Signed MOU with BMA for Islamic trades REDmoney (2014)
2006 JBIC Established Sharia Advisory Group Etsuaki (2007)
2006 JBIC Established study groups with Japanese banks Etsuaki (2007)
2006 Tokio Marine Established takaful company in Malaysia REDmoney (2014)
2007 JBIC Co-hosted a seminar in Tokyo with IFSB Etsuaki (2007)
2007 JBIC Joined IFSB as a first Japanese institution Etsuaki (2007)
2007 JBIC Signed MOU with Bank Negara Malaysia Etsuaki (2007)
2007 Aeon Credit Issued sukuk in Malaysia REDmoney (2014)
2008 Tokio Marine Takaful license was given in Egypt REDmoney (2014)
2008 Toyota Issued sukuk in Malaysia REDmoney (2014)
2008 Nikkei Held Islamic finance seminar REDmoney (2014)
2008 Financial Services Agency Changed the banking regulation REDmoney (2014)
2009 SMBC/BTMU Set up Islamic Banking teams in Malaysia REDmoney (2014)
2010 Nomura Announced issue of $100m. sukuk in
Malaysia
REDmoney (2014)
2010 Tokio Marine Launched takaful operations in Egypt Lai (2010)
2014 Tokyo Mitsubishi UFJ Set sukuk program in Malaysia Hamzah (2014)
“The enactment of this article was a monumental step because it was the first law which
was intended to directly target and hope to further promote the development of Islamic finance in
Japan.” (Saito & Yoshimine, 2008, 2).
In addition to this amendment also several tax reforms took place. As a result of these
reforms, (1) a foreign partner may invest in an Investment LPS without being regarded as
owning a Japanese PE, subject to certain conditions including that the foreign partner owes
limited liability and is not involved in the management of the Investment LPS, and that the
foreign partner’s investment ratio in the Investment LPS is less than 25%; (2) application of the
25/5% rule has been relaxed, and the 25% threshold may be applied at the individual foreign
partner’s level, instead of the whole foreign fund level, subject to certain conditions. (Saito &
Igarashi, 2009).
Under the scope of the amendments of the Japanese Asset Securitization Law in 2011 the
nature of sukuk has been reviewed. After this reform tax exemption was given to foreign
investors who purchase "Bond-Type Beneficial Interests" which are quasi-bond beneficial
interests of a "Specified Purpose Trust" (SPT) established under the Asset Securitization Law,
which will be the basis for the issuance of sukuk in Japan. (Clifford Chance, 2011).
By enacting these amendments and reforms the Japanese government was aiming to
remove the obstacles for development of Islamic finance in Japan.

Academy of Accounting and Financial Studies Journal Volume 20, Number 1, 2016
7
LITERATURE REVIEW
Internal Control of Parent Companies and their Subsidiaries
The importance of internal control has been highlighted during the late 1990s and early
2000s. “Major reasons for corporate governance being in the spotlight are unexpected
bankruptcies, fraud and mismanagements” (Hayes et al., 2005, 598). The most noticeable
examples are Enron, WorldCom, Maxwell, Daiwa, etc. After the financial world witnessed
failures in 2001 and 2002, the US Congress passed a new law (commonly known as the
Sarbanes-Oxley Act or SOX) in 2002. This act, which is considered to be the most significant
corporate regulation since the Securities Act of 1933 and the Securities Exchange Act of 1934, is
known as the Public Company Accounting Reform and Investor Protection Act, in the Senate,
and the Corporate and Auditing Accountability and Responsibility Act, in the House. Directly
related to the internal control section 404 (Management Assessment of Internal Controls)
“requires the senior management of U.S public companies to issue a report assessing the
effectiveness of the company’s internal control over financial reporting”. Moreover, the
independent auditors of U.S. public companies are required to testify the effectiveness of internal
control (Calderon et al., 2012, 20). Thus, the main objective of SOX was to improve the quality
of financial reporting and strengthen investor confidence.
Some evidences suggest about the effectiveness of SOX however there are some that are
not so confident. For instance, a definite statement about decreased number of frauds since SOX
was enacted cannot be made “because the data might be the result of fluctuating media and SEC
attention as the 2007-2008 financial crisis shifted focus away from financial reporting and fraud”
(Willits & Nicholls, 2014, 43).
The enactment of SOX was triggered by the fraudulent cases mainly in the headquarters
of the corporations. However, “multinationals are particularly vulnerable to fraudulent activity,
as opportunities for abuse can increase when subsidiaries are maintained abroad” (Genaldi, 2002,
62). Ishijima (2014) described fraudulent cases involving subsidiary companies of JVC
Kenwood Holdings (JK) and OkiDenki. There were several causes identified for fraudulent
activities. Some of them are: underdeveloped internal audit and insufficiency of unified
accounting treatment and monitoring. Ishijima concluded that the companies should improve the
following points of internal control procedure: compliance system, operational procedures and
business system, monitoring, improvement of human resources management.
In 2005 the Company Law provided new regulations concerning internal control
conducted in corporate groups (article 330). In 2012 it was proposed to impose supervision
obligation over subsidiaries by parent companies (Takahashi, 2013). In July 27, 2014 this
regulation was seen into the Company Law. Currently, according to the Company Law of Japan
(article 362/4/6) in order to ensure healthy business condition board of directors should take the
responsibility for actions of its subsidiaries and establish internal control system and conduct it in
the company including subsidiary companies as a tool for fulfilling supervision duties.
Sharia Compliant Internal Control
Looking back to the prior studies we can see that many researchers in one way or another
have claimed and are claiming that conventional financial auditing is insufficient to fulfill the
needs of the stakeholders of IFIs (Haniffa, 2010, Yaacob, 2012, Abdel-Karim, 1999, Kasim,
2013, etc.). That is because the main difference between conventional and Islamic financial

Academy of Accounting and Financial Studies Journal Volume 20, Number 1, 2016
8
institutions is that the Islamic financial institutions must abide Sharia law. Sultan (2007) has also
stated that the Sharia audit shares similar functions to the company audit, however they are
focused more on the compliance of IFIs with Sharia principles and requirements. This means that
the financial accounting and reporting conducted by IFIs should be developed and practiced in
accordance with Sharia principles. This is a challenge for the accounting academics and
practitioners, who are usually familiar only with Western theories and practices (Abdel-Karim,
1999).
Currently, “there is no mention of the appointment and responsibilities of a Sharia auditor
per se, nor a specific definition of a Sharia audit, in any related acts or regulations” (Kasim &
Sanusi, 2013, 11). Nevertheless, Yaacob (2012) defined Sharia audit in a following way:
“Shari’ah [Sharia] audit is the examination of an IFIs compliance with the shari’ah, in all of its
activities, particularly the financial statements and other operational components of the IFIs that
are subjected to the risk of compliance including but not limited to products, technology
supporting the operations, operational processes, the people involved in the key areas of risk,
documentations and contracts, policies and procedures and other activities that require adherence
to shari’ah principles”. The objective of the Sharia audit given by AAOIFI (2010) is “to enable
the auditors to express an opinion as to whether the financial statements are prepared, in all
material aspects, in accordance with the fatwas, ruling, guidelines issued by the Sharia
Supervisory Board of the Islamic financial institutions, the accounting standards of AAOIFI,
international and national accounting standards and practices, and relevant legislation and
regulations applied in the country where the Islamic financial institutions operates”. Considering
all of the above, the ultimate goal of the Sharia auditors is to ensure sound and effective internal
control system, which follows the Sharia in a strict manner.
There are four key players in the process of internal control of IFIs:
1. The Audit and Governance Committee of the IFIs or simply Audit Committee plays a
significant role in the process of achievement of fundamental objectives of the IFIs, enhance
greater transparency and disclosure in financial report and to gain the public’s confidence of the
IFIs regarding the application of Sharia rules and principles. The followings are the
responsibilities of Audit & Governance Committee listed by Kasim, et al. (2013): (1) preserving
the integrity of the financial reporting process, (2) safeguarding the interest of shareholders,
investors and other corporate stakeholders, (3) providing additional assurance on the reliability
of financial information presented to the board of directors, (4) acting as an independent link
between the IFIs’ management and its stakeholders, (5) comprehending the major risks to which
the business is exposed, (6) monitoring management’s control consciousness as it relates to the
significance attached to controlling the IFI’s policies, procedures and methods, (7) reviewing
resources and skills, scope of responsibilities, overall work program and reporting lines of
internal audit, (8) reviewing the findings of central bank inspection and other regulatory bodies
together with management responses and ensuring that appropriate actions have been taken to
comply with the central banks inspector’s requirements, (9) reviewing the IFI code of ethics and
effectiveness with which it is implemented.
2. Every IFI has to have Sharia Supervisory Board (SSB) (the only exceptions are IFIs of
Iran, where Sharia compliance is controlled by the central bank) (Grais & Pellegrini, 2006). SSB
is the most important governance structure which ensure compliance with Sharia. “In principle,
the role of the SSB covers five main areas: certifying permissible financial instruments through
fatwas (ex-ante shariah audit), verifying that transactions comply with issued fatwas (ex-post
shariah audit), calculating and paying Zakat, disposing of non-shariah compliant earnings, and

Academy of Accounting and Financial Studies Journal Volume 20, Number 1, 2016
9
advising on the distribution of income or expenses among shareholders and investment account
holders” (Grais & Pellegrini, 2006). The main role of the SSB is to formulate fatwas and review
process aiming to provide a common position in economics, finance and banking (Hamza, 2013).
3. Internal auditors conduct internal audit and ensure that IFI comply with Sharia and all
transactions and that contracts are executed within the Sharia framework.
4. External auditors give opinions whether the transactions and contracts are within the
Sharia policies, rulings and guidelines.
Being a relatively young system the Sharia audit is facing a number of challenges. Kasim,
et al. (2009) have researched and found that there is a significant gap between the “desired” and
the “actual” practice of Sharia auditing in IFIs in Malaysia. The authors have questioned a group
of people directly or indirectly involved in Sharia audit. It was stated that: (1) although AAOIFI
and IFSB are working on constructing Sharia auditing standards, there is still a great lack of
standards and guidelines; (2) the scope of Sharia audit is limited to conventional financial audit;
(3) professionals tend to have knowledge only in one of the two required qualifications; (4) there
is a heavy dependence of Sharia auditors on the management of the Sharia unit.
And so, according to prior studies, there are four major issues and challenges concerning
Sharia audit (Kasim, et al. 2009, Kasim & Sanusi, 2013, Yaacob & Donglah, 2012, Yaacob,
2012, Uddin, et al. 2013):
Framework of Sharia audit
Unregulated accounting policies for Islamic financial institutions resulted in development
of various accounting policies by almost every IFIs. Variation in accounting policies across IFIs
can create obstacles for comparison of the financial statements and weaken credibility of the IFIs
in the eyes of international market players (Abdel-Karim, 1999). The traditional auditing theory
and practice is ingrained in the Western secular capitalist framework. Although there is no doubt
that techniques of secular capitalist systems would be used in Islamic economic system, existing
fundamental differences between these two systems demand capitalist system techniques in
Islamic approach to undergo a “basic metamorphosis”.
Multiple authors researching Islamic finance claim that there is a vital necessity in well-
established international standards for Islamic financial industry. Currently, Islamic finance is
going through period of formation when the lack of standardization is one of the major
challenges.
“Standardization means establishing universal Shari’ah [Sharia] standards possibly
through a ‘flexible “codification” of the Shair’ah principles and precepts” as suggested by
McMillen (2010), which would eliminate the need for individual decisions by Shari’ah scholars,
thus reducing the problems of the shortage of Shari’ah scholars and the divergence of Shari’ah
interpretation” (Ghoul, 2011, 2).
The community of Islamic banks started an intensification of the standardization process
of regulation and control. The Islamic development bank played a leading role in designing
acceptable international standards and procedures. A list of other international organizations such
as the Accounting and Auditing Organization for Islamic Financial Institutions (AAOIFI), the
Islamic Financial Services Board (IFSB), the International Islamic Financial Market (IIFM), as
well as the Islamic International Rating Agency (IIRA) are also working on establishment of
Sharia compliant standards and harmonizing them among the countries (El Corchi, 2005).
One of the leading organizations designing standards for Islamic financial institutions
was established in 1991 as the Financial Accounting organization for Islamic Banks and

Academy of Accounting and Financial Studies Journal Volume 20, Number 1, 2016
10
Financial Institutions (FAOIBFI) and renamed to the Accounting and Auditing Organization for
Islamic Financial Institutions (AAOIFI) in 1995. The motivation behind the establishment of
AAOIFI was driven by demand for financial reporting that would be in accordance with Islamic
finance rules and requirements. The AAOIFI’s standards are designed to be applied for financial
transactions of Islamic financial institutions and to bring clarity to accounting and auditing
treatments of these transactions. AAOIFI has already achieved certain expertise in developing
accounting and auditing standards, nevertheless it has no power de jure. This means that
standards cannot be enforced. The countries should adopt them by will. “With its voluntary
adoption ethic, AAOIFI still faces a challenge to convince jurisdictions.” (Alim, 2014, 169).
Countries where AAOIFI standards have already been accepted as mandatory or desirable are:
Bahrain, Malaysia, UAE, Saudi Arabia, Lebanon, Syria, Sudan and Jordan (El Corchi, 2005).
The IFSB was established in Kuala Lumpur in 2002 “in response to the growing
significance of the Islamic financial services industry in many countries, and with the purpose of
promoting, disseminating, and harmonizing best practices in the regulation and supervision of
this industry…” (IMF news brief No. 02/41). The raison d'être of IFSB is similar to AAOIFI’s –
to build a stable Islamic financial industry by designing Sharia compliant standards. The
difference between these two organizations is that “IFSB is the international standard-setting
body of regulatory and supervisory agencies whereas AAOIFI’s standards serve the needs of
market players, such as Islamic banks and other financial institutions.” (Alim, 2014, 174).
Scope of Sharia audit
The scope of auditing in the Islamic framework is much larger as compared to the scope
of traditional auditing, and the expanded role of the Islamic auditor is derived from the basic
values of the Islamic society. The Sharia audit scope should cover ““social behavior” and
performance of organizations including their relationship with all the stakeholders” (Yaacob &
Donglah, 2012, 225). Inaction and pliancy of the IFIs nourish a slowdown in standards setters’
and regulatory bodies’ performances. Currently, there is a “lack of expertise, specification and
definition on the scope of shari’ah auditing practice” (Kasim, et al. 2009, 133), and the scope is
depending solely on Sharia advisors and SSB (Yaacob & Donglah, 2012).
Qualification of Sharia auditors
“The Shariah [Sharia] Audit function is to be performed by internal auditors who have
adequate Shariah-related knowledge and skills. Their ultimate goal is to ensure a sound and
effective internal control system for Shariah [Sharia] compliance” (PWC, 2011, 10).
Nevertheless, research conducted by Kasim, et al. (2009) have shown that there is a considerable
gap in the knowledge about accounting science of those with Sharia qualification and vice versa.
Another words, those with accounting qualifications usually do not have or have weak Sharia
qualifications, and those with Sharia qualifications usually do not have or have weak accounting
qualifications. Research conducted by Kasim & Sanusi (2013) also confirmed this statement.
According to Yaacob (2012) this issue has been discussed since the early 70s. A number of
researchers claim that to be able to audit and fully understand the activities of IFIs a good
knowledge of Sharia and accounting is crucial for the Sharia auditor (Uddin, et al. 2013; Khan,
1985; Yaacob, 2012; Kasim & Sanusi, 2013). Khan (1985) stated that there are certain
requirements for Sharia auditors: (1) accounting, business organization and finance; (2) theory
and practice of management; (3) Islamic fiqh (Islamic jurisprudence) and usul al-fiqh (Islamic

Academy of Accounting and Financial Studies Journal Volume 20, Number 1, 2016
11
legal theory), at least, those portions of fiqh dealing with business and commerce; (4) auditing,
theory and practice. Yaacob (2012) added to this list also a strong Arabic and English fluency.
Independence of Sharia auditors
There are three major factors that significantly contribute to the degree of auditor
independence: (a) clarity of definition of the auditor’s responsibilities, (b) the position of the
auditor within the organizational structure of the institution, and (c) the reporting authority for
audit results (Grais & Pellegrini, 2006). Similarly, the only way to achieve faithful, unbiased
Sharia audit reports is to provide and protect total independence of Sharia auditors. Currently, it
is common for auditors to follow the guidance of, for example, SSB, which many researchers
find unacceptable (Uddin, 2013; Kasim & Sanusi, 2013; Yaacob, 2012, etc.). It also should be
noted that SSB members are also under the pressure of the IFIs and at the same time they long
for maintaining their reputation. Kasim & Sanusi (2013) think that to solve this problem IFIs
must draw a clear line of responsibilities among key players in the internal control process. This
would help “to avoid the misperception of the stakeholders on the SSB and/or Sharia auditors’
independence” (Kasim & Sanusi, 2013, 15).
“Noncompliance with shariah [Sharia] principles is an area of risk for IFIs that could
translate into legal, image, and reputational risks, which would have far-reaching consequences
not only for the individual IFI but also for the entire Islamic financial system” (Haniffa, 2010, 1-
2).
Uniqueness of Islamic Finance in Non-Islamic Environment
“The prerequisite for an effective Shari’ah [Sharia] audit is a well thought-out Shari’ah
[Sharia] review process” (Hussan, et al. 2013, 132), which is incomplete due to various reasons.
One of those reasons, specific risk for Islamic financial industry, namely Sharia non-compliance
risk, has already been discussed. Nonetheless there is a unique risk related only to Islamic
finance called risk of non-compatibility of Islamic doctrines in IFIs. This section is dedicated to
this risk.
It is generally accepted that in the Islamic financial system unified rules are extremely
hard to achieve, because “the differences are not just between regulators but also between
practitioners” (Pasha & Y-Sing, 2010). According to Ayub (2007), although, a large number of
experts consider that different Sharia interpretation is a major issue impeding the development of
Islamic finance, the major Sharia related issues have been clarified by the jurists. However this
does not mean that certain Sharia interpretation issues are no longer present. “Diversity of
opinions among the Sharia scholars that compose the religious councils could be one of the
greatest challenges to be raised by Islamic finance” (Hamza, 2013, 230).
The source of dynamism and innovations in Islamic financial industry is the flexibility of
fiqh opinions. Nonetheless, Sharia interpretations by various independent scholars causes
inconsistencies in fatwas issued by SSBs. Sharia is defined as a “revealed divine law in Qur’an
and Sunna” (El-Gamal, 2006). However, Sharia is also a subject to various interpretations
depending on the context in which it is applied. Every IFI has its own Sharia board, members of
which may attend several IFIs. However, despite this fact, there is a strong inconsistency among
them. Different schools of thought (the Shiah branch and the Sunni branch, which includes the
Madhahib, Shafie, Hanafi, Hanbali, and Maliki schools) possess different points of view on the
same subjects. Variations of opinions of Sharia board members can be linked to differences of

Academy of Accounting and Financial Studies Journal Volume 20, Number 1, 2016
12
schools of jurisprudence, national and cultural environments of the members. “The diversity of
backgrounds and the different schools of jurisprudence of SB (shari’ah board) members as well
as the regional context and national regulatory environment in which the members of the SBs
function can create inconsistency in the interpretation of shari’ah [Sharia] and may thus prevent
the harmonization of product and financial operations” (Hamza, 2013, 227).
Grais & Pellegrini (2006) have identified five issues of corporate governance related to
operational activities of SSB: independence, confidentiality, competence, consistency, and
disclosure. The contents of “consistency” issues are directly related to the Sharia interpretation
for uniformity concerns. Essentially, the functions of SSBs are to construct a jurisprudence by
the interpretation of Islamic legal sources. SSB is not a single international board. As it was
mentioned before, SSBs exist in every IFI. Logically, there are various conflicting opinions
about certain Islamic financial transactions and instruments.
DISCUSSION
The Ajinomoto Indonesia case presented in the introduction part of this paper is not
directly, however, closely related to Islamic finance. That is because the company produced
goods which were meant to be Sharia compliant. Unfortunately, overlooking only one of the
ingredients caused large losses for both subsidiary and parent companies. This case demonstrated
two things: how performances of subsidiaries may affect parent companies and risks associated
with Sharia compliant products. Assuming if this misconduct occurs in a subsidiary involved in
Islamic finance, the consequences would be even more devastating.
This paper addresses the problem of the internal control of the Japanese subsidiary
companies involved in Islamic finance. Based on the evidences from previous researches this
paper builds an argument promoting the necessity of conducting such kind of internal control,
the purpose of which is to minimize the risks of non-compliance with Sharia.
In support for this argument the following major points have been researched in this
paper: growth of Islamic finance, development of Islamic finance in Japan, problems of internal
control, internal control of subsidiary companies, Sharia compliant internal control, and unique
risk of Islamic finance.
Japan is the country showing a strong interest in Islamic financial industry. However,
since the Muslim population of Japan is very insignificant, the development of Islamic finance
domestically is a matter of a long term. Moreover, the Japanese banking regulation forbids banks
to buy products, which disturbs development of Islamic finance in Japan. Nevertheless, by
enacting an Amendment on the Enforcement of Banking Act, currently, only subsidiaries of
Japanese banks can provide Islamic financial services.
In view of this to clearly understand risks of subsidiary companies and parent-subsidiary
relationships, the internal control of subsidiaries has been reviewed. It has been found that the
internal control of subsidiaries demands more attention per se. Why? Because subsidiaries of
multinational companies are more exposed to such risks like fraudulent activities and
misconducts, simply owing to the fact that the there is a distance between the parent company
and subsidiary. Moreover, the effectiveness of SOX, the act passed after a number of fraud
scandals, is still under question. In connection with the mentioned above in Japan parent
companies are required to perform the role of supervisors by conducting an internal control in
subsidiary companies.
However, it should not be forgotten that Islamic finance differs from conventional
finance. There is a number of differences, which could be combined into one, - Sharia

Academy of Accounting and Financial Studies Journal Volume 20, Number 1, 2016
13
compliance stipulation peculiar only for IFIs or companies involved in Islamic finance. The
internal control known for conventional financial system does not inspect Sharia compliance of
financial transactions or products. Consequently, even if Japanese parent companies are to
conduct an internal control in their subsidiaries, the results of such control in subsidiaries
involved in Islamic finance will have no solid power. Therefore the Islamic internal control or
Sharia audit is being conducted in IFIs.
Nevertheless, as it has been cleared in the literature review section of this paper, that
Sharia audit being part of a newly emerging financial industry in the global scale has to face
many challenges. Despite the fact that only four challenges have been identified by many
researchers, they are covering a wide range of issues, causing considerable gap between the
“desired” and the “actual” practice of Sharia auditing. Furthermore, the conditions for an
effective internal control described by COSO demands all seventeen principles of internal
control to function in an integrated manner. In the current state of Sharia audit certain principles
are not fully followed. For example, the fifth principle of the first component, control
environment, states: “the organization holds individuals accountable for their internal control
responsibilities in the pursuit of objectives”. Unfortunately, responsibilities of the key players of
Sharia internal control are still not well defined. This leads to dysfunction of the fifth principle of
control environment component.
In addition, Islamic finance, which as a definition itself differs from conventional
finance, has a certain peculiarity. This peculiarity is based on the fact that the foundation of
Islamic finance is a religion, Islam. Islam just as any other religion has various schools of
thought. Major schools of thought possess distinctive authority active for their followers.
Scholars of these schools give interpretations of Sharia, which do not always coincide one with
another. In account of this it might be impossible to completely unify Sharia standards. In other
words, discussions about Sharia interpretations will be present regardless of standardization
progresses.
All countries aim for unification of standards through an active work of international
organizations. Nevertheless, countries with an Islamic background are more prepared for this
feature of Islamic financial industry whereas countries with a non-Islamic environment are not in
the favor of flexibilities, which cause inconsistency in applications.
Finally, Islamic finance is rapidly growing in the world as well as in Japan. Building an
effective Islamic internal control system for Japanese companies now will become a strong
foundation of the industry in the future.
CONCLUSION
In this work, I have investigated the necessity of an Islamic internal control in Japanese
subsidiaries by parent companies. This study examined the related literature review and found
that traditional internal control as we know it is not sufficient for examination and justification of
Islamic financial transactions.
After an overview of the purpose, motivation and contribution in Chapter One and
examination of the brief history and development of Islamic finance in the world and in Japan in
Chapter Two, Chapter Three examined internal control and differences between conventional
and Islamic finances.
In more details, section 2.1 examined how fast Islamic finance as a global industry is
growing and its perspectives. Section 2.2 investigated development of Islamic finance in Japan, it
was discovered that there are certain complications for its development domestically. However,
Academy of Accounting and Financial Studies Journal Volume 20, Number 1, 2016
14
demand by Japanese companies triggered certain legal amendments allowing investments in
Islamic financial transaction by Japanese banks’ subsidiaries.
Section 3.1 discussed about the internal control, companies with fraudulent activities,
measurements taken to decrease fraud and mismanagements (SOX) and doubts about
effectiveness of these measurements. It has been found that controlling subsidiaries is more
onerous because of the distance from the headquarters. In this section it specified that Japanese
parent companies are required to conduct internal control in their subsidiaries thereby performing
the role of supervisors.
Section 3.2 examined features and thereby differences of Islamic internal control or
Sharia audit from conventional. This section described reasons why in addition to commonly
known internal control there is a necessity to conduct Sharia audit.
Section 3.3 researched another feature of Islamic finance and how different its
acceptability can be in a non-Islamic environment. Various interpretations of different schools of
thought in Islamic finance are not a novation for the Islamic world, however conventional
society will not accept inconsistencies such as that.
As it was observed from this research, Japanese companies hold a significant interest in
developing and implementing Islamic finance, which due to legal issues can only be
implemented by subsidiaries, however considering that internal control of subsidiaries demands
more attention, and Japanese parent companies are required to supervise their subsidiaries, on
top of that Islamic financial transactions cannot be audited by simple audit system, I conclude
that Japanese parent companies should conduct an Islamic internal control in their subsidiaries
which are performing Islamic financial transactions in order to minimize the risks of Sharia non-
compliance.
A major limitation of this research work is the lack of literature. In Japan Islamic finance
started developing only at the beginning of the XXI century. Legal amendments allowing
subsidiaries to deal with Islamic products were enacted in 2008. Naturally, not many research
papers have been written about this topic during such a short period of time. Additionally, a
motivation for this study is the case of Ajinomoto Indonesia, which is not Islamic finance
related. The thesis statement was constructed around of an assumption starting with “what if”:
what if a situation similar to Ajinomoto Indonesia would have occurred in a subsidiary with
Islamic finance involvement?
Much research also remains to be done on estimating the cost of implementation of such
internal control by Japanese parent companies and identifying challenges and issues of Islamic
internal control process specific for Japanese companies.
REFERENCES
Abdel-Karim, R. A (1999). Accounting and Auditing Standards for Islamic Financial Institutions. Proceedings of
the Second Harvard University Forum on Islamic Finance: Islamic Finance into the 21st Century Cambridge,
Massachusetts. Center for Middle Eastern Studies, Harvard University, 239-241.
Alim, E. A. (2014). Global Leaders in Islamic Finance. John Wiley & Sons Singapore Pte. Ltd.
Al-Omar, F., & Abdel-Haq, M. (1996). Islamic Banking: theory, practice & challenges. Zed Books.
Ando, M. (2001). Seasoning Scandal Hits Ajinomoto. CBS Market Watch, January 9, 2001. Retrieved from
http://www.marketwatch.com/story/seasoning-scandal-hits-ajinomoto-shares
Angelo, M. V. (2006). Islamic Banking and Finance in South-East Asia: It’s Development and Future. Asia-Pacific
Business Series, World Scientific Publishing Company, 2nd edition.
Ayub, M. (2007). Understanding Islamic Finance. Wiley Finance.
BBC. (2014). Indonesia Profile. Retrieved from http://www.bbc.com/news/world-asia-pacific-14921238

Academy of Accounting and Financial Studies Journal Volume 20, Number 1, 2016
15
Botish, S. (2013). Shari’ah Concepts in Islamic Banking. Bulletin of the Transylvania University of Brashov, Series
V: Economics Sciences, 6(2), 139-146. Retrieved from
http://search.proquest.com/docview/1510289070?accountid=12653
Calderon, T. G., Wang, L., & Conrad, E. J. (2012). Material Internal Control Weakness Reporting Since the
Sarbanes-Oxley Act. The CPA Journal, 82 (8), 20-25. Retrieved from
http://search.proquest.com/docview/1055683095
Clifford Chance. (2013). Introduction to Islamic Finance. Retrieved from
http://www.cliffordchance.com/briefings/2013/04/introduction_to_islamicfinance.html
Clifford Chance. (2011). Islamic Finance – Japanese Law Reforms. Retrieved from
http://www.cliffordchance.com/briefings/2011/12/islamic_finance_-japaneselawreforms.html
COSO (The Committee of Sponsoring Organizations of the Treadway Commission). (2013). Internal Control –
Integrated Framework: Executive Summary, Framework and Appendices, and Illustrative Tools for
Assessing Effectiveness of a System of Internal Control (3 Volume set).
D’Aquila, J. (2013). COSO’s Internal Control – Integrated Framework. Updating the Original Concepts for Today’s
Environment. The CPA Journal, 83(10), 22-29. Retrieved from
http://search.proquest.com/docview/1468440142?accountid=12653
El-Gamal, M. A. (2013). Islamic Finance: Law, Economics, and Practice. Cambridge University Press.
El-Corchi, M. (2005). Islamskaya Finansovaya Sistema Nabirayet Oboroti [Islamic Financial System Gainin
Momentum]. Journal IMF “Finance & Development”, Issue 42. Retrieved from
https://www.imf.org/external/pubs/ft/fandd/rus/2005/12/pdf/qorchi.pdf
Ernst & Young. (2013). World Islamic Banking Competitiveness Report 2013-14. Ernst & Young Publication.
Retrieved from
http://www.ey.com/Publication/vwLUAssets/World_Islamic_Banking_Competitiveness_Report_2013-
14/$FILE/World%20Islamic%20Banking%20Competitiveness%20Report%202013-14.pdf
Etsuaki, Y. (2007). Islamic Finance and Asia: Leveraging Japan’s Emerging Role. JBIC, Sukuk Summit, June 20,
2007.
Fukui, T. (2008). Toshihiko Fukui: Islamic Finance – Development, Diversity and Challenges. Nikkei Islamic
Finance Symposium 2008: “Islamic Finance: Constant Evolution and Emerging Opportunities” Tokyo,
February 23, 2008. Retrieved from https://www.boj.or.jp/en/announcements/press/koen_2008/ko0802d.htm/
Genaldi, A. J. (2002). Fraud in Foreign Operations. The Internal Auditor, 59(4), 61-65. Retrieved from
http://search.proquest.com/docview/202744823?accountid=12653
Ghoul, W. A. (2011). The Standardization Debate in Islamic Finance: A Case Study. 8th
International Conference
on Islamic Economics and Finance, Doha, Qatar, Retrieved from http://www.iefpedia.com/english/wp-
content/uploads/2012/01/Wafica.Ali_.pdf
Grais, W., & Pellegrini, M. (2006). Corporate Governance and Shariah Compliance in Institutions Offering Islamic
Financial Services. World Bank Policy Research Working Paper 4054. Retrieved from
http://elibrary.worldbank.org/doi/pdf/10.1596/1813-9450-4054
Hamza, H. (2013). Sharia Governance in Islamic Banks: Effectiveness and Supervision Model. International
Journal of Islamic and Middle Eastern Finance and Management, 6(3), 226-237. Retrieved from
http://search.proquest.com/docview/1425414674?accountid=12653
Hamzah, A. A., & Vizcaino, B. (2014, June). Bank of Tokyo-Mitsubishi UFJ Sets up $500mln Sukuk Programme in
Malaysia. Reuters. Retrieved from http://www.reuters.com/article/2014/06/05/bankoftokyomitsubishi-sukuk-
idUSL3N0OM20120140605
Hancock, M. (2013, March). Islamic Finance in 2013: Beyond the Growth. The Banker. Retrieved from
http://www.thebanker.com/Markets/Islamic-Finance/Islamic-finance-in-2013-beyond-the-growth?ct=true
Haniffa, R. (2010). Auditing Islamic Financial Institutions. Bloomsbury Publishing. Retrieved from
http://www.financepractitioner.com/auditing-best-practice/auditing-islamic-financial-institutions?page=1
Hayes, R., Dassen, R., Schilder, A., & Wallage, P. (2005). Principles of Auditing. Introduction to International
Standards of Auditing (Second Edition), Ed. Pearson Education.
Hasan, Z. (2009). Regulatory Framework of Shari’ah Governance System in Malaysia, GCC Countries and the UK.
Kyoto Bulletin of Islamic Area Studies, 3(2), 82-115. Retrieved from http://www.asafas.kyoto-
u.ac.jp/kias/1st_period/contents/pdf/kb3_2/07zulkifli.pdf (last accessed December 1, 2014).
HM Treasury. (2008). The Development of Islamic Finance in UK: the Government’s Perspective. Bank of
England, London.
Academy of Accounting and Financial Studies Journal Volume 20, Number 1, 2016
16
Hussan, S. B. M., Karim, F. M. A., & Manap, A. N. B. (2013). Instituting Shari’ah Audit in Malaysian Islamic
Financial Institutions. ISRA International Journal of Islamic Finance, 5(2), 127-137,177,179. Retrieved from
http://search.proquest.com/docview/1504813968?accountid=12653
IMF. (2002). IMF Facilitates Establishment of Islamic Financial Services Board. International Monetary Fund
News Brief No. 02/41. Retrieved from https://www.imf.org/external/np/sec/nb/2002/nb0241.htm
Ishijima, T. (2014). Kaigai Kogaisha ni okeru Fuseikaikei ni Taiousuru Naibutousei [Internal Control of Overseas
Subsidiary Companies Involved in Accounting Fraud]. Internal Control, No. 6.
Kasim, N. B., Ibrahim, S. H. M., & Sulaiman, M. (2009). Shariah Auditing in Islamic Financial Institutions:
Exploring the Gap Between the “Desired” and the “Actual”. Global Economy & Finance Journal, 2(2),127-
137. Retrieved from http://irep.iium.edu.my/13560/1/6[1].-Nawal_latest.pdf
Kasim, N. B., Nuhtay, S. N., & Salman, S. A. (2013). Comparative Analysis on AAOIFI, IFSB and BNM Shari’ah
Governance Guidelines. International Journal of Business and Social Science, 4(15), Special Issue. Retrieved
from http://ijbssnet.com/journals/Vol_4_No_15_Special_Issue_November_2013/28.pdf
Kasim, N. B., & Sanusi, Z. M. (2013). Emerging Issues for Auditing in Islamic Financial Institutions: Empirical
Evidence from Malaysia. IOSR Journal of Business and Management, 8(5), 10-17. Retrieved from
http://iosrjournals.org/iosr-jbm/papers/Vol8-issue5/B0851017.pdf
Khan, M. A. (1985). Role of the Auditor in an Islamic Economy. Journal of research in Islamic economics, 3(1),
31-42. Retrieved from http://www.kau.edu.sa/Files/320/Researches/37099_17.pdf
Kobayashi, Y. (2002). Ajinomoto Indonesia: Haram or Halal? ISIM Newsletter, Leiden, 9(1), 32. Retrieved from
https://openaccess.leidenuniv.nl/bitstream/handle/1887/17540/ISIM_9_Ajinomoto_Indonesia_Haram_or_Hal
al.pdf?sequence=1
Lai, I. (2010). Tokio Marine Launches Takaful Operations in Egypt. Retrieved from
http://insurancenewsnet.com/oarticle/2010/01/29/tokio-marine-launches-takaful-operations-in-egypt-a-
156567.html
MIFC (Malaysia International Islamic Financial Centre). (2013). Islamic Finance Industry Outperforms in 2013.
Bank Negara Malaysia. Retrieved from
http://www.mifc.com/index.php?ch=28&pg=72&ac=62&bb=uploadpdf
McMillen, M. J. T. (2011). Islamic Capital Markets: Market Development and Conceptual Evolution in the First
Thirteen Years. Social Science Research Network. Retrieved from doi:http://dx.doi.org/10.2139/ssrn.1781112
Osborne, G. (2013, October). London Can Lead the World as an Islamic Finance Hub. Financial Times. Retrieved
from http://www.ft.com/cms/s/0/42766334-3fc2-11e3-a890-00144feabdc0.html
Pasha, S., & Y-Sing, L. (2010, May). Absence of Global Standardization Hobbles Islamic Finance Industry. The
Daily Star. Retrieved from http://search.proquest.com/docview/275937036?accountid=12653
PWC. (2011). Shariah Audit: Industry Insights. PWC Publications. Retrieved from
http://www.pwc.com/en_MY/my/assets/publications/Shariah-Audit(Secured).pdf
Rarick, C. A., & Han, T. (2010). Islamic Finance: Panacea for the Global Financial System? The Journal of
Applied Business and Economics, 11(3), 27-32. Retrieved from
http://search.proquest.com/docview/767545101?accountid=12653
REDmoney. (2014). The Islamic Finance Handbook: A Practitioner’s Guide to the Global Markets. Wiley Finance
Series.
Rogers, S. (2011, January). Muslim Populations by Country: How Big Will Each Muslim Population be by 2030?
The Guardian. Retrieved from http://www.theguardian.com/news/datablog/2011/jan/28/muslim-population-
country-projection-2030
Saito, S., & Igarashi, C. (2010, March). Islamic Finance in Japan. Islamic Finance News Guide. Retrieved from
https://www.jurists.co.jp/en/publication/tractate/docs/IslamicFinanceinJapan_100408.pdf
Saito, S., & Yoshimine, R. (2008, November). Recent Changes to the Japanese Banking Regulations on Islamic
Finance. Complinet. Retrieved from
https://www.jurists.co.jp/en/publication/tractate/docs/200811_saito_yoshimine.pdf
Schoon, N. (2008). Islamic Finance – An Overview. European Business Organization Law Review, 9(4), 621-635.
Retrieved from doi:http://dx.doi.org/10.1017/S1566752908006216
Sultan, S. A. M. (2007). A Mini Guide to Shari'ah Audit for Islamic Financial Institutions - A Primer. CERT
Publications Sdn Bhd.
Takahashi, E. (2013). Kigyoushudan ni okeru Naibutousei [Internal Control Conducted in Corporate Groups]. Jurist,
No. 1452.

Academy of Accounting and Financial Studies Journal Volume 20, Number 1, 2016
17
Tanada, H. (2013). Muslim Population in the World and Japan 2011. Human Sciences Research, 26(1), 29-39.
Retrieved from
https://dspace.wul.waseda.ac.jp/dspace/bitstream/2065/39421/1/NingenKagakuKenkyu_26_1_Tanada.pdf
Tokio Marine. (2013). Acquisition of the Shares of Nile General Takaful Company and Nile Family Takaful
Company in Egypt. Tokio Marine Holdings, Inc. Retrieved from
http://ir.tokiomarinehd.com/en/Topics/Topics-6699264907349411872/TopLink/RedirectFile/20130426_e.pdf
Uddin, M. H., Ullah, M. H., & Hossain, M. M. (2013). An Overview on the Basics of Islamic Audit. European
Journal of Business and Management, 5(28), 9-17. Retrieved from
www.iiste.org/Journals/index.php/EJBM/article/download/8713/8999
Willits, S. D., & Curits, D. N. (2014). Is the Sarbanes-Oxley Act Working? The CPA Journal, 84(4), 38-43.
Retrieved from http://search.proquest.com/docview/1534116100
Yaacob, H. (2012). Issues and Challenges of Shari’ah Audit in Islamic Financial Institutions: A Contemporary
View. 3rd
International Conference on Business and Economic Research Proceeding. Retrieved from
http://papers.ssrn.com/sol3/papers.cfm?abstract_id=2175700
Yaacob, H., & Donglah, N. K. (2012). Shari’ah Audit in Islamic Financial Institutions: The Postgraduates’
Perspective. International Journal of Economics and Finance, 4(12), 224.

Academy of Accounting and Financial Studies Journal Volume 20, Number 1, 2016
18
AN EXAMINATION OF THE EFFECT OF
DEMOGRAPHIC VARIABLES AND PERSONALITY
TRAITS ON STUDENTS’ VALUATIONS OF JOB
CHARACTERISTICS
Kella Kicklighter Bell, BYRT CPAs, LLC
Tanya M. Lee, Valdosta State University
Sanjay Gupta, Valdosta State University
ABSTRACT
One of the important duties of faculty is advising students on courses and careers.
Undergraduate students often have little information on what factors they might consider in
selecting a career or how they might weight these factors. This paper reports the results of a
survey of undergraduate students on their preferences with respect to job characteristics and
analyses the relationships between student preferences and their demographics and personality
traits. This information can be useful to faculty and students during advising on career planning.
INTRODUCTION
The AICPA predicts record demand for accounting graduates (Schiavone 2013). The
Bureau of Labor Statistics (Bureau of Labor Statistics 2016a) predicts an 11% annual growth rate
in accounting jobs over the period 2014 to 2024, faster than the average for all types of positions.
The unemployment rate for those with a BA in general was only 2.5 % in December 2015
(Bureau of Labor Statistics 2016b). Jobs are and should continue to be available to accounting
graduates. Thus graduates need not take the first job they can find, but can try to match job
characteristics to personal needs and desires. How can students determine what type of position
would best suit them? Some students will have had an internship before graduation, but many
will not (Fesler & Caldwell 2000). Additionally, an internship provides limited information on
the range of positions possible for graduates. If the internship is in public accounting, students
will not be well versed in the characteristics of a position in industry. If the internship is in a
small firm, characteristics will differ from those in a large firm. If in a stable industry
characteristics may well differ from those in a growth industry. Even within a firm, job
requirements can vary from reporting numbers and performing analyses to dealing with ad hoc
problems. What should students use to differentiate among jobs? Those without an internship
experience may only have experience in a retail or restaurant job. According to some research
(Billiot, et al. 2004; Laufer & Crosser, 2004), one reason students do not choose accounting is a
lack of knowledge about the nature of the work. Laufer & Crosser (2004) found that accounting
students in general lack knowledge of how to make basic career decisions. Most had limited or
inaccurate knowledge about different accounting careers available to them. Laufer & Crosser
(2004) charge faculty with not only teaching basic accounting skills, but also with the
responsibility of helping inform accounting students of their career options. Other studies also
indicate a lack of knowledge about careers on the part of accounting students (Violette & Chene
2012; Simons, et al. 2003; Kaye, 2014). The AECC Issues Statement No. 5 (AECC 1993b)
Academy of Accounting and Financial Studies Journal Volume 20, Number 1, 2016
19
suggests that faculty should communicate information about the “conditions of practice” to
students as part of guidance and advising.
Thus, faculty responsibility for advising includes not just advising for class schedules, but
also advising for career planning. With limited experience and knowledge it may be difficult for
students to determine how to choose a career path. Faculty can play a role in helping students
recognize what factors they might consider and what best fits their personal goals and
preferences. Faculty is likely to have useful knowledge in this area due to their work in teaching
and their maintenance of professional credentials. Faculty, in maintaining professional
qualifications such as a CPA, a CMA or a CIA, are required to invest in continuing professional
education (AICPA 2001; IMA 2013; IIA 2015). This can involve courses offered by the
professional organizations, sessions in professional meetings and academic conferences, or
university training and courses. Faculty is also called upon to develop their knowledge of their
profession for academic accreditation of their respective schools (e.g., AACSB 2013; SACSCOC
2006, 2012) through attending similar meetings/conferences and/or publishing in their field.
Faculty may also participate in an accounting or business advisory board that helps their school
remain professionally informed, and consequently meet and talk with those currently employed
in the accounting profession. The Accounting Education Change Commission (AECC) of the
American Accounting Association recommends that faculty members develop a “high level of
knowledge about both practice issues and the nonacademic accountant’s workplace”, “interact
with practicing accountants” and “communicate knowledge about the conditions of practice to
students.” (AECC 1993a). These, as well as prior employment in the area or current consulting
engagements, can all provide knowledge and experience relevant to career advising.
This study examines the effect of demographic and personality traits on students’
valuation of job characteristics. The objective of this research is to help faculty advice students
on career planning by demonstrating links between student characteristics, which faculty
advisors may know firsthand from the classroom or can try to determine in discussion with
advisees, and the range of job characteristics these advisees might consider in their job search.
BACKGROUND
Is a high salary or a flexible schedule more preferable? What is more important, a 401(k)
plan or a pleasant work environment? These are some questions accounting students could
consider. Faculty experience and education can play a role in helping students prioritize job
characteristics. There is some information on accounting student job preferences. Phillips &
Phillips (2006) conducted a survey of accounting students to determine what they found
important in a job search. Job security and advancement opportunities were ranked as the top two
choices, while day care and gym facilities were the least desired. A more recent study (Bagley et
al 2013) found that there were differences in the importance of job characteristics when students
were grouped by those seeking jobs with Big Four firms and those seeking jobs with non-Big
Four firms. One difference the authors found was that those seeking a job with a Big Four firm
ranked salary as the most desired factor and tone of the firm as the least desired factor. Students
preferring a job at a non-Big Four firm ranked work-life balance as the most desired factor and
recognition of working for a prestigious firm as the least desired factor. Bagley, et al. (2013)
provides information that can help faculty in this process. They found that current accounting
professionals felt the advantages of working in a Big Four accounting firm were prestige, larger
clients, networking/future job opportunities, compensation, and better resources/training. These
professionals identified the advantages of working at a non-Big Four accounting firm as a more

Academy of Accounting and Financial Studies Journal Volume 20, Number 1, 2016
20
comfortable work environment, more diverse experience, fewer hours, less travel, and closer
client relationships. The authors note that faculty can provide valuable information to students in
deciding what factors are most important in their career planning.
However, there isn’t much information on how personality characteristics affect
preferences for job characteristics. This led to the current study. It investigates links between
what is most important to students as they prepare to enter the workforce and student
demographics and personality characteristics. The goal is to help faculty understand how student
traits may affect what is attractive in a job.
Faculty Advising
Faculty can have an impact on a student’s decision to major in accounting and the
particular type of career that student chooses. Past research has shown that a student’s experience
in the first accounting course has a significant effect on the perceived benefits of an accounting
career (Chen 2008), and that business students in general have a high demand for career
counseling (Lin and Chang 2007). Faculty can offer guidance to students in determining what
factors are important when identifying a career. This study is from a student perspective rather
than from an accounting professional’s perspective, and can aid faculty in discussing a range of
factors that may be important to students seeking employment so they can properly identify their
preferences when making career decisions.
For respondents in this study, it appears that (see Table 1) faculty influence on the
selection of accounting as a major is fairly small. The current study allowed students to mark all
factors that influenced their choice of major, but only a small percentage indicated faculty as an
influence. Given faculty experience and skills, this may indicate an opportunity for faculty to
help students recognize a career in accounting as a possible choice.
Table 1
INFLUENCES ON CHOICE OF ACCOUNTING AS A MAJOR
Influences: Choose all that
apply
Regional University
(% of Regional
Students)
IMA’s Student Leadership
Conference (% of IMA
Conference Students)
Total Number
of Students
Faculty encouragement 9 (10%) 33 (21%) 42
Interest in the nature of the work 52 (55%) 101 (63%) 153
Likelihood of finding a job 48 (51%) 96 (60%) 144
Parent or peer influences 22 (23%) 38 (24%) 60
Potential for advancement 25 (27%) 76 (48%) 101
Potential salary 46 (49%) 88 (55%) 134
Total number of Students 94 160 254
RESEARCH DESIGN
Demographics
This study involved two groups of students, accounting majors at a regional AACSB
accredited university and attendees at the IMA Student Leadership Conference.
Past research suggests that different demographic groups have different preferences when
it comes to job characteristics. A study of Canadian graduates found that men tend to put more

Academy of Accounting and Financial Studies Journal Volume 20, Number 1, 2016
21
emphasis on initial earnings while women care more about long-term earning potential
(Boudarbat & Montmarquette 2009). Another study found that older accounting professionals
tend to find their jobs more fulfilling than their younger counterparts (Moyes, et al. 2006).
For these reasons we decided to not only report students’ desired job characteristics as a
whole, but also examine different demographic subsets to see if certain types of students desire
some characteristics more or less than other types. We divided the students into basic
demographic groups (gender, age, financial dependents, etc.) to see if the groups differed in their
ratings of job characteristics. To help faculty in advising and recruiters in attracting desirable
candidates, we also divided the group by high/low GPA and asked basic personality questions to
see whether these traits affected these preferences.
Personality
The personality questions were developed using the MBTI types (intuition/sensing,
introversion/extroversion, feeling/thinking, perception/judging). The authors developed
questions (statements with which to agree or disagree) in each category using phraseology
related to business as much as possible. The resulting data was analyzed to find sets that varied
together to form factors that could be described with a word related to a business career. The
analysis found two distinct personality types (see Appendix A for the questions themselves). One
was the entrepreneurial personality. We defined this personality as one who likes to try out new
ideas, adapts to change quickly, likes to look at the big picture, and tends to focus on what is
happening around them. The second was the analytical personality. This type of personality is
one who likes to think in concrete terms, uses their head to make decisions, plans in advance, and
likes to be in control of the situation.
DATA
Survey
We developed a survey to help us determine the factors that accounting student’s value in
a new job. The survey was piloted, with about a half dozen graduate students, to ensure clarity
and to test the time required for the survey. It was given in class at the regional university, was
voluntary for both groups of respondents, and also short to encourage students to complete it.
The results of the pilot resulted in minor changes to the wording of the questions.
The first section of the survey elicited basic demographic information. Respondents were
asked for their gender, age, and GPA. Respondents were also asked why they chose accounting
as their major, their number of financial dependents, and if they were the first person in their
family to attend college.
The next section of the survey had students indicate, on a ten-point Likert scale, how
important certain job characteristics would be in their job choices. Zero was not at all important
and ten was extremely important. The demographic information is presented in Table 2 below.
The job characteristics listed were, in alphabetical order: benefits (e.g. health, life insurance,
retirement plans), geographical location, job security/stability, long-term growth opportunities,
nature of work (e.g. interesting, stimulating, challenging), salary, and work environment (e.g.
culture, flexibility). These variables (mean, median) are presented in Table 3 below.
The final section was a personality assessment in which we listed fifteen basic
personality statements and had respondents mark, on a ten-point Likert scale, how much they

Academy of Accounting and Financial Studies Journal Volume 20, Number 1, 2016
22
agreed or disagreed with the statement (Exhibit A). Zero was strongly disagree and ten was
strongly agree. An example of a personality statement is “I like to make my plans in advance
rather than ‘going with the flow.’” These responses were grouped, using factor analysis, and
investigated as personality types. The factor analysis provided two clusters of questions, only
related to an entrepreneurial style and one to an analytical style. Students were scored on both
types, and the resulting variables used in the analyses.
The survey was given to students in upper-level accounting classes at a regional
university and to students at an Institute of Management Accountants (IMA)’s Student
Leadership Conference. This conference has many of the best accounting students from all
across the U.S.
Regional University
The regional university is AACSB accredited. The survey was given to students in senior
level classes (Auditing, Accounting Information Systems, and External Reporting) and to
students in graduate level Masters of Accountancy classes (Advanced Accounting Information
Systems and Accounting Theory). A member of the research team went to the classroom and
gave a paper copy of the survey to each student. It was explained to the students that all results
were anonymous and that participation was voluntary. Virtually all students filled out the survey
and very few questions were left blank.
IMA’s Student Leadership Conference
With respect to the students from the IMA Leadership Conference, of the 153 student
chapters, 82 are at AACSB accredited universities. Most of the students at the conference were
members of an IMA Student Chapter. This survey was the same as the one given at the regional
university with one additional question added to determine the academic status of the respondent
(e.g., junior, senior). This question was added to filter out lower-level accounting students and
those who had already graduated. This left us with only upper-level and graduate accounting
students, comparable to the group from the regional university. Each student at the conference
received a copy of the survey in their registration packet with instructions on how to complete
and return it.
The following (Table 2) shows the demographic information for the two groups. In order
to ensure that the responses collected at the regional university and at IMA’s Student Leadership
Conference could be combined for analysis, we compared results for the two groups for each
demographic question asked. The two groups were significantly different only in salary.
However, there was a marginally greater percentage (p<0.054) of the students at the IMA
conference with a high GPA than at the regional university.

Academy of Accounting and Financial Studies Journal Volume 20, Number 1, 2016
23
Table 2
DEMOGRAPHICS
Demographic Regional
University
IMA’s Student Leadership
Conference
Total Number
of Students
Females 49 96 145
Males 45 64 109
Total 94 160 254
Traditional (up to age 24) 74 121 195
Non-Traditional (over age 24) 18 35 53
Total 92 156 248
High GPA (>3.5) 35 79 114
Low GPA 59 81 140
Total 94 160 254
Any Financial Dependents 16 27 43
No Financial Dependents 78 134 212
Total 94 161 255
First Generation College 24 42 66
Not First Generation College 70 119 189
Total 94 161 255
DIFFERENCES BETWEEN GROUPS
The ratings of job characteristics (Table 3) were not statistically different for any job
characteristics except salary, which was only marginally higher for the regional university
(p<0.08). Personality factors were the only variables where there were significant differences
between the two groups. There were significantly (p<0.002) more entrepreneurial personality
types at the IMA’s Student Leadership Conference than at the regional university. A possible
explanation could be that a person who has an entrepreneurial personality type (likes to try new
things, look at the big pictures, & focuses on what is happening around them) could be more
likely to attend the IMA’s Student Leadership Conference. Given this, all analyses were based on
the combined data except for the analyses using the entrepreneurial personality type.
Table 3
RATINGS OF THE IMPORTANCE OF JOB CHARACTERISTICS
Median (mean) values of
responses (Maximum value of 10)
Regional
University
IMA’s Student Leadership
Conference
All Students
Benefits (e.g., Health/Life Insurance,
Retirement Plans)
8.2
(8.5)
8.0
(8.0)
8.1
(8.0)
Geographical location 6.2
(6.0)
6.5
(7.0)
6.4
(7.0)
Job Security/Stability 8.7
(9.0)
8.6
(9.0)
8.6
(9.0)
Long-Term Growth Opportunities 8.7
(9.0)
8.5
(9.0)
8.6
(9.0)
Nature of Work (e.g., Interesting,
Stimulating, Challenging)
8.1
(8.4)
8.3
(8.5)
8.2
(8.5)
Salary 8.3
(8.5)
8.0
(8.0)
8.1
(8.0)
Work Environment (e.g., Culture,
Flexibility)
8.4
(8.5)
8.6
(8.8)
8.5
(8.6)

Academy of Accounting and Financial Studies Journal Volume 20, Number 1, 2016
24
RESULTS & ANALYSIS
Job Characteristics
While one might think that salary would be the deciding factor for most students seeking
employment, our survey shows (Figure 1) that upper-level and graduate accounting students’ top
two most desired characteristics are job security (mean 8.63) and long-term growth opportunities
(mean 8.61). The three least desired characteristics are benefits (mean 8.09), salary (mean 8.07),
and geography (mean 6.39).
When comparing salary to the other job characteristics, salary was valued significantly
lower than work environment (p<0.0001), long-term growth (p<0.0001), and job security
(p<0.0001). Salary was no differently valued than the nature of the work or benefits, but was
valued significantly higher than geography. It appears that students are thinking long-term, and
are concerned with job stability and advancement potential. Quantitative factors, such as salary
and benefits, are not among the top priorities for these students.
Personality Type
When we examined the data by personality type, we found that those with a high
entrepreneurial personality score rated several job characteristics significantly higher than those
with a low entrepreneurial personality score. These were nature of work (p<0.010), work
environment (p<0.013), and long-term growth opportunities (p<0.027). Salary was rated
marginally higher (p<0.065). We also found that those who with a high analytical personality
score rated several job characteristics significantly higher than those with a low analytical
personality score. These were salary (p<0.001), work environment (p<0.005), job security
(p<0.008), and long-term growth opportunities (p<0.017).
0
2
4
6
8
10
Mea
n I
mp
ort
ance
Figure 1
Mean Ratings of Job Characteristics

Academy of Accounting and Financial Studies Journal Volume 20, Number 1, 2016
25
The entrepreneurial personality type included significantly more men while the analytical
personality type did not differ by gender. Respondents from the IMA Student Leadership
Conference with a high entrepreneurial personality score have significantly higher ratings for
salary (p<0.008), nature of work (p<0.029), and long-term growth opportunities (p<0.035).
Respondents from the regional university with a high entrepreneurial personality score are not
significantly different in their ratings of these characteristics from those with a low
entrepreneurial personality score, but rated work environment marginally higher (p<0.068).
Gender & GPA
Our study showed that women rated the importance of all job characteristics higher than
men. However, the only significant difference was for benefits (p<0.014). Women ranked job
security (p<0.052) and geography (p<0.0997) marginally higher than their male counterparts.
However, when isolating by high GPAs (greater than 3.5), female students’ ratings were
significantly higher for benefits (p<0.004), nature of work (p<0.015), job security (p<0.035),
geography (p<0.037), and work environment (p<0.041) as compared to male students with a
high GPA.
Table 4
MEAN RATINGS OF JOB CHARACTERISTICS BY GENDER (1-10 SCALE)
Job Characteristics Female
(145 Respondents)
Male
(109 Respondents)
Job Security 8.73 8.51
Long-Term Growth Opportunities 8.63 8.61
Work Environment 8.58 8.36
Nature of Work 8.36 8.06
Benefits 8.35 7.74
Salary 8.16 7.97
Geography 6.63 6.06
Traditional/Non-traditional
We grouped respondents as traditional and non-traditional students. Students aged 25 and
under were categorized as traditional and those older than 25 as non-traditional. Traditional
students rated job security significantly higher (p<0.02) than non-traditional students. Non-
traditional students rated geography (p<0.06) and nature of work (p<0.09) marginally higher
than traditional students. Thus it appears that traditional students are more concerned with the
stability of their job. This may be the result of current economic conditions: non-traditional
students have seen favorable and unfavorable economic conditions during their lifetimes, while
traditional students have only seen difficult times. Therefore, stability may be less of a priority
for the non-traditional students. Non-traditional students care more about geography, perhaps
because they are likely to have family-ties to their current location. A possible explanation for
why non-traditional students rate nature of work higher is that they probably have more
experience working and may have put more thought into the decision to come back to school and
select a major they enjoy and are passionate about.

Academy of Accounting and Financial Studies Journal Volume 20, Number 1, 2016
26
Financial Dependents
Respondents were asked to indicate their total number of financial dependents. The data
showed that if a respondent had any financial dependents, all job characteristics were rated
higher. Nature of work was rated significantly higher (p<0.002). Long-term growth opportunities
(p<0.054), benefits (p<0.065), work environment (p<0.08), and job security (p<0.09), were rated
marginally higher.
First Generation College Students
Our results showed that there were no significant differences in the rating of job
characteristics by those who were first generation college students and those who were not.
Reasons for Selecting Accounting
The survey asked respondents what made them choose accounting as their major. The
order of most to least selected answers were: interest in the nature of the work; likelihood of
finding a job; potential for salary; potential for advancement; aptitude in the subject; parent/peer
influence and faculty encouragement. This indicates that faculty encouragement is currently not
a significant factor in student career choice.
IMPLICATIONS
For Faculty
Faculty can have a lasting impact on accounting students both inside and outside the
classroom. Faculty is in a unique position to help students make career decisions that can
significantly and positively affect their future. When advising, it is important that faculty initiate
a discussion on what job characteristics are important to a student. Our research can help initiate
that discussion. Faculty can also use our research to predict what characteristics might be most
important given their knowledge of a student’s personality and demographics. Knowing which
job characteristics are important to a student can help faculty recommend a type of job that might
best suit that student.
Students who value long-term growth opportunities and salary could be encouraged to
look into employment with a large firm, while advisees valuing the work environment or
geography might prefer a smaller firm. Students with an entrepreneurial personality find long-
term growth opportunities, nature of work, and salary to be more important than other factors.
Those with an analytical personality find long-term growth opportunities, work environment, job
security and salary to be more important. Traditional students value job security more than non-
traditional, while non-traditional students value geography and nature of work more. These
preferences can be used while advising students on career paths.
In our study we found that faculty encouragement was the least chosen reason for
students selecting accounting as their major. This is disconcerting and is something faculty can
perhaps change, by discussing, both during advising and in the classroom, the many benefits an
accounting career could offer a student and how different accounting careers have different
characteristics.

Academy of Accounting and Financial Studies Journal Volume 20, Number 1, 2016
27
For Employers
Finding and recruiting staff is important to accounting practices, and has been since 1997,
according to the AICPA. The enactment of Sarbanes Oxley in 2002 has only further increased
the need for qualified accounting staff (Finning 2006). Past research has found that campus
recruiters are becoming an important factor in finding and attracting new accounting staff. The
top three qualities recruiters look for are leadership potential, strong communication skills, and
enthusiasm/motivation for the company (Violette & Chene 2008). A study by Van Hoye and
Saks (2011) found that an employee’s opinion of the attractiveness of a firm is affected by both
instrumental factors (pay, job security, etc.) and symbolic factors (prestige, sincerity, etc.). It is
important that firms consider how to attract the best candidate as they compete for talent.
Knowing what characteristics students with an entrepreneurial or an analytical personality value
could allow firms to emphasize the most appealing characteristics of their open positions. For
those with an entrepreneurial bias, a firm could emphasize the increasing decision making
freedom allowed as one progresses in one’s career or the exposure to higher levels of
management which can help an employee develops a broad view of the firm and its goals. For
those with a more analytical preference, the recruiter could emphasize the scope of the data
available for analysis, the provision of tools and reports for control purposes, and the expectation
of a rational and well-supported approach to problem solving.
We found, through our literature review and discussions with accounting professionals,
that hiring quality employees is a challenge. Since companies certainly want to hire the best
candidates, they must keep in mind how to make the job appealing to those candidates. Our
research provides information to help companies understand which job characteristics to
emphasize to attract their top candidates. Knowing what job characteristics to emphasize during
the hiring process will improve a company’s chances of attracting and hiring the best candidate.
Contrary to popular belief, salary is not necessarily the most important job characteristic to
emphasize. Job security and long-term growth opportunities were found to be the most important
job characteristics for many of our respondents. Discussing employee retention rates or the
typical career path for employees can emphasize the job security and long-term growth
opportunities of a career at a company.
Our results indicate that students looking for a job are more likely to be attracted to a
company they believe to be a secure and stable place to work, that provides long-term growth
opportunities and that has a positive work environment. While a company may have a standard
offer for a specific position, knowing what organizational characteristics to emphasize can make
a significant difference in its attractiveness to a particular candidate.
With respect to demographic characteristics, we found that females find the benefits a
company offers more important than males. Females with high GPAs are more concerned with
job security, nature of work, and benefits when looking for a job. With respect to age, if the ideal
candidate is a traditional student, putting extra emphasis on the job security and stability of the
company could be beneficial. Non-traditional students could be attracted by focusing on the
specific work they would be doing and the amount of travel required.
LIMITATIONS & FUTURE RESEARCH
One limitation is that the job characteristics listed are very broad and may have different
connotations for different students. Additionally, the personality factors were based on only a
few basic questions and not on an extensive personality test.

Academy of Accounting and Financial Studies Journal Volume 20, Number 1, 2016
28
Some interesting future research could be a comparison between how students in lower
level classes and those in upper level classes value different job characteristics. One could also
compare the ratings of job characteristics by students with that of current accounting
professional, to determine if experience changes the ranking of the characteristics. Research
could be done in different geographical areas or larger universities to see if different job
characteristics are valued in different locations.
REFERENCES
AACSB (2013). Standard 15 under Faculty Qualifications and Engagement. Retrieved February 8, 2016, from
http://www.aacsb.edu/accreditation/standards/2013-
business/Academic%20and%20Professional%20Engagement%20Standards/standard15.aspx
AECC (1993a). Position and Issues Statements of the Accounting Education Change Commission, Issues Statement
Number 4: Improving the Early Employment Experience of Accountants. Retrieved February 8, 2016, from
https://www2.aaahq.org/AECC/PositionsandIssues/issues4.htm#faculty
AECC (1993b). Accounting Education Change Commission Issues Statement No. 5: Evaluating and Rewarding
Effective Teaching. Retrieved February 8, 2016, from
http://www2.aaahq.org/AECC/PositionsandIssues/issues5.htm
AICPA (2001). AICPA Membership CPE Requirements. Available at
http://www.aicpa.org/Membership/Requirements/Pages/membership-CPE-requirements.aspx
Bagley, P., D. Dalton & M. Ortegren (2013). Targeted Recruiting and Retention. CPA Journal, 83(5), 63-65.
Billiot, M., S. Glandon & R. McFerron (2004). Factors Affecting the Supply of Accounting Graduates. Issues in
Accounting Education 19 (4): 443-467.
Boudarbat, B. & C. Montmarquette (2009). Choice of fields of study of university Canadian graduates: the role of
gender and their parents' education. Education Economics. (June), 17(2), 185-213.
Bureau of Labor Statistics (2016a). Occupational Outlook Handbook, Accountants and Auditors. Retrieved February
8, 2016, from http://www.bls.gov/ooh/business-and-financial/accountants-and-auditors.htm
Bureau of Labor Statistics (2016b). Table A4: Employment Status of the civilian population 25 years and over by
educational attainment. Retrieved February 8, 2016, from http://www.bls.gov/news.release/empsit.t04.htm
Chen, C. (2008). Analyzing the Factors Relevant to Students' Estimations of the Benefits and Costs of Pursuing an
Accounting Career. Accounting Education, 17(3), 313-326.
Fesler, R.D. & C.W. Caldwell (2000). The Accounting Internship: Reasons and Advice. New Accountant 16.1 (Sep
2000): 7-10.
Finning, J. T. (2006). Top Five Issues In Practice Management. Sum News, 17(5), 4-5.
IIA (2015). Administrative Directive Number 4 Professional Education and Continuing Professional Development
Requirements for all Certification and Qualification Programs. Retrieved February 8, 2016, from
https://na.theiia.org/certification/Public%20Documents/Administrative%20Directive%20No%204.pdf
IMA (2013). Institute of Certified Management Accountants Continuing Education Requirements and Rules.
Retrieved February 8, 2016, from http://www.imanet.org/docs/default-source/cma-lib/continuing-
education-requirements-and-rules.pdf?sfvrsn=2
Kaye, J.I. (2014). How Much Does an Accounting Professor Influence a Student’s Career Path? NJCPA. Retrieved
February 8, 2016, from https://njcpa.org/stay-informed/topics/article/2014/11/04/how-much-does-an-
accounting-professor-influence-a-student-s-career-path-
Laufer, D. & R.L. Crosser (2004). Career Information: Helping Accounting Majors Understand Their Options.
Journal of Accounting & Finance Research, 12(2), 112-118.
Lin, C. & S. Chang (2007). A study on needs of career counseling for business college students in Taiwan. Journal
of Accounting, Finance & Management Strategy, 3(2), 59-74. Retrieved February 8, 2016, from
http://search.proquest.com/docview/1014189908?accountid=14800.
Moyes, G. D., P.A. Williams & B. Koch (2006). The effects of age and gender upon the perceptions of accounting
professionals concerning their job satisfaction and work-related attributes. Managerial Auditing Journal,
21(5), 536-561.
Phillips, C.R. & A.S. Phillips (2006). Factors Used by Accounting Students in Differentiating Among Prospective
Employers. College Student Journal, 01463934, (Mar.) 40(1), XXXXX

Academy of Accounting and Financial Studies Journal Volume 20, Number 1, 2016
29
SACSCOC (2006). Faculty Credentials Guidelines. Retrieved February 8, 2016, from
http://www.sacscoc.org/pdf/081705/faculty%20credentials.pdf
SACSCOC (2012). The Principles of Accreditation: Foundations for Quality Enhancement. Retrieved February 8,
2016, from http://www.sacscoc.org/pdf/2012PrinciplesOfAcreditation.pdf (page 30).
Schiavone, J. (2013). Accounting Graduates and Enrollments at Historic Levels, Continuing Upward Trend. AICPA
Website. Retrieved February 8, 2016, from http://www.aicpa.org/Press/PressReleases/2013/Pages/Record-
Setting-Demand-for-Accounting-Graduates-AICPA.aspx
Simons, K., D.R. Lowe & D. Stout (2003). Comprehensive Literature Review: Factors Influencing Choice of
Accounting as a Major. Academy of Business Education Proceedings, 2003. 1-18.
Van Hoye, G. & A.M. Saks (2011). The Instrumental-Symbolic Framework: Organisational Image and
Attractiveness of Potential Applicants and their Companions at a Job Fair. Applied Psychology: An
International Review, (April) 60(2), 311-335.
Violette, G. & D. Chene (2008). Campus Recruiting: What Local and Regional Accounting Firms Look for in New
Hires. CPA Journal, 78(12), 66-68.
Violette, G. & D. Chene (2012). Factors Influencing Students’ Choice of the Accounting Major. CPA Journal, 89
(9). 73-74.

Academy of Accounting and Financial Studies Journal Volume 20, Number 1, 2016
30
Appendix A
This survey should take about 5 minutes, and will be used only for academic research. The
responses are anonymous and you will not be identified in any way. Please answer these
questions to the best of your ability.
Thank you so much for taking the time to complete our survey.
1.) Gender
a. Male
b. Female
2.) Age ________
3.) Cumulative GPA
a. Less than 2.49
b. 2.5 to 2.99
c. 3.00 to 3.49
d. 3.5 to 3.75
e. Greater than 3.75
4.) Number of people, other than yourself, who are financially dependent on you:
a. 0
b. 1
c. 2
d. 3
e. More than 3
5.) What made you choose accounting as your major? – Check all that apply
a. Aptitude in the subject
b. Faculty encouragement
c. Interested in the nature of the work
d. Likelihood of finding a job
e. Parent or peer influences
f. Potential for advancement
g. Potential salary
h. Other: Please specify ________________
6.) Are you the first person to attend college in your immediate family?
a. Yes
b. No

Academy of Accounting and Financial Studies Journal Volume 20, Number 1, 2016
31
Place an X anywhere on the number line that expresses your opinion of the importance of
each of the following factors for your job choice:
Benefits (e.g. Health/
Life Insurance,
Retirement Plans)
Geographical
Location
Job Security/
Stability
Long-Term
Growth
Opportunities
Nature of Work
(e.g. Interesting,
Stimulating,
Challenging)
Salary
Work Environment,
(e.g. Culture,
Flexibility)

Academy of Accounting and Financial Studies Journal Volume 20, Number 1, 2016
32
Place an X anywhere on the line where you feel best answers the question.
I like to look at the
big picture rather
than at the details.
I like to make my
plans in advance
rather than “going
with the flow.”
I tend to describe the
world in imaginative
rather than
scientific terms.
I prefer to have a few
deep friendships rather
than having many
casual friends.
I prefer to have a method
provided to me rather
than having to create
a new method.

Academy of Accounting and Financial Studies Journal Volume 20, Number 1, 2016
33
Place an X anywhere on the line where you feel best answers the question.
I prefer to use charts and
graphs rather than read
essays to understand
information.
I prefer a job that has
assigned hours rather
than one where working
extra hours is desired.
I prefer to use my
head rather than
my heart to
make decisions.
I like to try out new ideas
rather than doing things
the established way.
I like to be in control of
making decisions rather
than letting things
simply happen.

Academy of Accounting and Financial Studies Journal Volume 20, Number 1, 2016
34
Place an X anywhere on the line where you feel best answers the question.
I adapt to change quickly
rather than needing time
to adjust.
I look for opportunities
to be ‘in-charge’ rather
than let others take
the lead.
I tend to focus on
what is happening
around me rather
than on what I am
thinking.
I like to think in
concrete terms rather
than abstract terms.
I prefer to spend time
alone rather than
spending time with
others.

Academy of Accounting and Financial Studies Journal Volume 20, Number 1, 2016
35
DISENTANGLING THE IFRS 1 DISCLOSURE:
OBSERVATIONS FROM THE EARLY ADOPTION OF
IFRS IN CANADA
Theresa DiPonio, Robert Morris University
ABSTRACT
The objective of this study is to investigate whether the method employed to analyze the
implementation of International Financial Reporting Standards (IFRS) is consequential as to our
ability to evaluate IFRS as a financial reporting vehicle. In this study, IFRS 1 reconciliations are
deconstructed to exhibit the financial magnitude of optional exemption choices permitted under
IFRS 1, standard-to-standard differences, and equity component switching. Findings from this
study demonstrate that optional exemption choices and equity component switching comprise the
larger part of the financial magnitude of IFRS adoption. Evidence from this study should prompt
standard setters, regulators, practitioners, investors, and researchers to carefully consider how
IFRS is being applied and the extent to which it is being adopted when assessing the standards for
any attainment of relevance, quality, and comparability.
INTRODUCTION
Studies of International Financial Reporting Standards (IFRS) adoption have demonstrated
an increase in accounting quality (Ball, Robin, Wu 2003; Capkun, Cazavan-Jeny, Jeanjean, Weiss
2008; Gassen and Sellhorn 2006). High quality financial reporting has demonstrated a reduction
in information asymmetries for investors (Street and Bryant 2000; Tarca 2004; Ashbaugh and
Pincus 2001; Gordon, Jorgensen, and Linthicum 2010). The International Accounting Standards
Board (IASB) has designed standards intended to reduce information asymmetries amongst
external users of the financial statements, primarily investors (Haller, Ernstberger, and
Froschhammer 2009) and more broadly amongst countries (Barth, Landsman, and Lang 2008).
However, any assessment of IFRS as a reporting vehicle should consider how the standards are
applied (Kvaal and Nobes 2010; Schipper 2005) and the extent to which IFRS is adopted.
The research objective of this study is to employ disaggregation methods to investigate the
implementation of IFRS. IFRS adoption is not a monolithic event. The implementation of IFRS
entails management choices permitted under in IFRS 1 First Time Adoption of International
Financial Reporting Standards, remeasurement of all accounts in accordance with IFRS, and
material reclassifications (equity component switching) of accounts within the statement of
financial position. The transition to IFRS is a significant disclosure-enhancing event (Cormier
2013; Fifield, Finningham, Fox, Power, and Veneziani 2011; Karamanou and Nishiotis 2009) and
as such any evaluation by standard setters, regulatory agencies, practitioners, and researchers of
the IFRS global framework should carefully consider management discretionary choices as well
as pronouncement differences upon transition to IFRS. Due to the complexity of disentangling
the IFRS 1 disclosure, the current body of literature is limited as to studies which disaggregate the
IFRS transition by IFRS 1 choices, standard-to-standard differences, and equity component
switching (material reclassifications).

Academy of Accounting and Financial Studies Journal Volume 20, Number 1, 2016
36
This study examines the transition to IFRS by voluntary adopters in Canada. Canada
provides an interesting platform for the study. Effective January 1, 2011, the Canadian Accounting
Standards Board (AcSB) required all Canadian Publicly Accountable Enterprises (PAE) to adopt
IFRS for financial reporting. With the 9th largest economy based on Gross Domestic Product (GDP)
(Economy Watch, 2012), Canada is a formidable economic force and presents an opportunity to
examine the implementation of IFRS in a large market-oriented economy. Canada also provides an
optimal setting to examine a country with long-term convergence efforts as a precursor to the
transition. Prior research has investigated country contexts which are divergent from IFRS
(Cormier, Demaria, Lapointe-Antunes, and Teller 2009; Hung and Subramanyam 2007; Lantto and
Sahlström 2009). Finally, the Canadian transition to IFRS is of vital importance to the Financial
Accounting Standards Board (FASB), the Securities Exchange Commission (SEC), and U.S.
constituents as Canadian GAAP was closely aligned with U.S. GAAP.
Empirics are presented which disentangle the financial magnitude of implementation
choices, GAAP-to-GAAP differences, and equity component switching. Data hand-collected from
IFRS 1 reconciliations reveal business combinations, share-based payments, and cumulative
translation differences as the optional exemption choices most frequently exercised by sample
firms. The financial effect of the cumulative translation difference resulted in an overall decrease to
retained earnings of $13.4 million for firms in the sample. (All amounts are reported in Canadian
dollars.) In sample, firms experienced an average decrease to retained earnings of $1.2 million per
firm. The analysis of pronouncement differences revealed IFRS 2 Share-Based Payments and IAS
12 Income Taxes as the standards having the most frequent effect on sample firms. The largest re-
measurement effect on total stockholders’ equity was a result of the application of IAS 16 Property,
Plant, and Equipment, IAS 40 Investment Property, and IAS 12 Income Taxes at an increase of
$19.6 million, an increase of $4.9 million, and a decrease of $6.7 million, respectively. For all
sample firms, the change in total stockholders’ equity as reported totaled $16.4 million. However,
disaggregation methods revealed that $13.6 million of the total adjustment to stockholders’ equity
was attributed to equity component switching which decreased retained earnings and bypassed the
income statement.
In Henry’s 2009 study of SFAS 159 The Fair Value Option of Financial Assets and
Liabilities, firms avoided recognition of realized security losses on the income statement by using
the adoption of the provision to report the re-measurement to fair value as an adjustment to the
opening balance of retained earnings. Employing this finding analogously for the transition to
IFRS coupled with the evidence provided in the present study, these findings may alert standard
setters and regulators as to opportunistic equity component switching under the veil of IFRS
adoption.
As evidenced by the present study, optional exemption choices and equity component
switching comprise the larger part of the financial magnitude of IFRS adoption. Evidence provided
in this study demonstrates how optional exemption choices selected by first-time IFRS adopters
conceals the impact of IFRS which may compromise the comparability objective of the IFRS
Conceptual Framework (IASB 2010). Disaggregating the implementation of IFRS should be of
interest to standard setters and regulators as a critical technique to assess how IFRS is being applied
and which aspect of the implementation of IFRS – IFRS 1 optional exemption choices, standard-to-
standard differences, or equity component switching bears the greatest financial impact of IFRS
adoption. Understanding the true effects of IFRS are crucial as standard setters, practitioners and
firms weigh the benefits of IFRS against the costs of adoption.

Academy of Accounting and Financial Studies Journal Volume 20, Number 1, 2016
37
The remainder of this study is organized as follows. The next section discusses IFRS 1.
The following section describes the data collection and sample. The following section presents
analyses of equity components. The last section concludes the study.
IFRS 1
Authoritative Guidance
IFRS 1 First Time Adoption of International Financial Reporting Standards sets the
precedent for financial reporting under IFRS, overrides transitional provisions included in other
IFRS, and prescribes detailed disclosures. The IFRS 1 disclosure entails detailed reconciliations
and explanations of the transitory financial effects from Canadian GAAP (CA GAAP) to IFRS.
IFRS 1.39 requires the first IFRS financial statements to include a reconciliation of equity
reported under national GAAP to equity under IFRS at the date of transition to IFRS and at the end
of the latest period for comparative information presented in the first IFRS financial statements. For
this study, the reconciliation of equity is of particular interest. According to IFRS 1.40, the
reconciliations have to be sufficiently detailed in order to enable users to understand the material
adjustments to the balance sheet and income statement.
IFRS 1 requires entities to apply, retrospectively, all IFRS standards effective at the end of
their first IFRS reporting period. The standard requires the opening presentation of IFRS
statement of financial position and the comparative financial statements be prepared in accordance
with the recognition, measurement, presentation and disclosure requirements of these standards.
The Canadian Securities Administrators (CSA) requires the presentation of an opening IFRS
statement of financial position in the first IFRS interim financial report. In the opening statement of
financial position, a Canadian company must:
• Recognize all assets and liabilities required by IFRS
• Derecognize all assets and liabilities not permitted by IFRS
• Classify all assets, liabilities and components of equity in accordance with IFRS; and
• Measure all assets and liabilities in accordance with IFRS
All adjustments, when applicable, should be recognized through retained earnings, or other
equity items, at the transition date (CICA 2011).
IFRS 1 also establishes two categories of exceptions to the retrospective rule: mandatory
and optional exemptions. Mandatory exemptions prohibit retrospective application of IFRS due to
insufficient measurement reliability.Optional exemptions grant relief from IFRS requirements in
which the costs of compliance exceed the benefits to the users of the financial statements. The
optional exemptions represent choices of accounting policies under IFRS which may have
significant impact on an entity’s future financial results (Jermakowicz and Gornik-Tomaszewski
2006).

Academy of Accounting and Financial Studies Journal Volume 20, Number 1, 2016
38
Optional Exemption Choices
As previously mentioned, firms adopting IFRS must comply with IFRS 1. IFRS 1 permits
the election of exemption choices in specific areas where the cost of complying with IFRS 1 may
exceed the benefit to financial reporting or where retrospective application is impractical. For
example, at the transition date to IFRS, IFRS 1 permits firms to elect to maintain assets at historical
cost, a previous GAAP valuation, or remeasure assets to fair value. If a firm exercises the option to
remeasure a property, plant, or equipment asset to fair value, the fair value would surrogate for the
historical or depreciated cost of the asset as the deemed cost at the transition date. These
exemption choices represent compromises of the IFRS measurement system upon adoption. Any
compromises of the IFRS system upon adoption should be of concern to both regulators and
investors (Capkun, Cazavan-Jeny, Jeanjean, and Weiss 2011). In a 2007 report on the European
Union implementation of IFRS, the Institute of Chartered Accountants in England and Wales
(ICAEW) noted comparability was impeded among and between first-time adopters. The report
also stated that these implementation differences will have an effect on future periods of financial
reporting (ICAEW, 2007).
Table 1 presents the optional exemption choices by entity count extracted from the
disclosures. The optional exemption choices which were most frequently exercised by sample
firms were business combinations, share-based payments, and cumulative translation differences.
On average, firms exercised 2.72 optional exemptions. The choices selected as well as the number
of choices exercised bring into question the extent to which a firm adopts IFRS.
Table 1
OPTIONAL EXEMPTION CHOICE S
Optiona l Exe mptions Firm Count
Business combinations 25
Share-based payment transactions 25
Fair value or revaluation as deemed cost 7
Deemed cost of oil and gas assets 2
Leases 1
Employee Benefits 5
Cumulative translation differences 19
Investment in subsidiaries, jointly controlled entities, and associates 1
Compound financial instruments 1
Designation of previously recognized financial instruments 1
Decommissioning liabilities 5
Service concession arrangements 1
Borrowing costs 10
Total Number of Optional Exemption Choices made by Sample Firms 103

Academy of Accounting and Financial Studies Journal Volume 20, Number 1, 2016
39
DATA COLLECTION AND SAMPLE
IFRS was mandated effective January 1, 2011. However, early adoption was permitted
subject to approval of the CSA. Quarterly financial statements, management discussion and
analysis reports, and annual financial statements were obtained from company websites, SEDAR,
EDGAR, and the TMX website. The audit opinion letter, accounting policy disclosure, and
required IFRS 1 disclosure were reviewed for explicit language regarding early adoption.
Reconciliation data for this study was hand-collected.
The sample consists of 39 Canadian PAEs deemed “pure” early adopters from a population
of 69 PAEs which sought early adoption of IFRS. “Pure” early adopters are defined as those
companies which met the following criteria:
• Audit opinion letter stated presentation, “in accordance with International Financial Reporting Standards.”
• Financial statement note on “Basis of presentation” cited compliance and conversion to International Financial
Reporting Standards as issued by International Accounting Standards Board as well as the entity’s transition date.
• Financial statement note disclosure on adoption of International Financial Reporting Standards contained
reconciliation from Canadian GAAP to IFRS of the statement of financial position at the transition date.
Although PAEs opting for early adoption were required to seek CSA permission, there were
no additional reporting requirements for early adopter firms. The process and reporting
requirements, for example adherence to IFRS 1, were the same for early adopter and compulsory
complaint firms.
The firms presented in this study were regulated by five provincial regulators: Alberta,
British Columbia, Ontario, Quebec, and Saskatchewan. Sample firms were overwhelmingly
represented by the mining industry which is consistent with prior literature on Canadian early
adopters (Blanchette, Racicot, and Girard 2011). The industry classifications represented in the
sample were: Mining (n=28), Utilities (n=2), Manufacturing (n=5), Information (n=1), Real Estate,
Rental, and Leasing (n=2), and Professional, Scientific, and Technical Services (n=1).
ANALYSES OF EQUITY COMPONENTS
The majority of research has examined IFRS by comparing national GAAPs to IFRS
through various analyses primarily examining earnings through comparability indices (Fifield, et
al. 2011; Haller, et al. 2009) and key financial ratios (Lantto and Sahlström 2009, Blanchette, et al.
2011). A growing body of literature has also tested the value relevance of accounting information
delivered by the IFRS reporting system (Horton and Serafeim 2010; Christensen, Lee, and Walker
2009, Schadewitz and Vieru 2007; Gjerde, Knivsflå, and Sættem 2008). However, the true market
valuation of the earnings and book value reconciliations are observable only in the year of transition
when financial statements are prepared both under local GAAP and IFRS. These differences are
reported in aggregate in the change in total stockholders’ equity (Hung and Subramanyam 2007).
Without a complete deconstruction of the how IFRS is being applied, evidence from the present
study brings into question our ability to evaluate earnings as reported under the IFRS system or
interpret results from tests of market reaction.

Academy of Accounting and Financial Studies Journal Volume 20, Number 1, 2016
40
Decomposition of Equity Adjustments
Table 2 presents the decomposition of reported adjustments to equity by IFRS standard.
The standard affecting the most firms in the sample (n=20) was IFRS 2 Share-Based Payments.
This standard had a magnitude effect on the adjustment to contributed capital of $41 million and
a corresponding effect of -$41 million to the adjustment to retained earnings. The primary
difference between IFRS 2 and CA GAAP 3870 was the way in which these options are measured.
CA GAAP required the entire award of options to be measured at the intrinsic value whereas IFRS
subjects these options to separate value tranches measured at fair value using an option price
model. However, the true effect of the standard-to-standard difference is altered by an optional
exemption permitted by IFRS 1 which allows the first-time adopter to not apply IFRS 2 to equity
instruments granted after November 7, 2002 that vested before transition to IFRS. If a company
applies the exemption, a reclassification adjustment is recorded which transfers the amount out of
contributed capital into retained earnings. As demonstrated by this example, these equity
components are not only affected by pronouncement differences, but choices made at adoption
and switching among equity components.
IAS 12 Income Taxes, IAS 16 Property, Plant, and Equipment, IAS 40 Investment
Property, and IFRS 1 Cumulative Translation Differences represent the standards with the largest
magnitude effect on the retained earnings adjustment at -$6,898 billion, $19,580 billion, $4,930
billion, and -$13,428 billion, respectively. The negative tax effect is consistent with evidence from
a study by Fifield et al. conducted in 2011 which examined IFRS reconciliations in the context of
the U.K., Italy, and Ireland. IFRS 1 Cumulative Translation Differences represents the standard
with the largest magnitude effect on the adjustment to accumulate other comprehensive income at
$13,426 billion.

Academy of Accounting and Financial Studies Journal Volume 20, Number 1, 2016
41
Table 2
DECOMPOS ITION OF REPORTED ADJUS TMENT TO EQUITY COMPONENTS BY STANDARDS \
Standard affecting reported adjus tment to contributed capital
Effect by
Standard
(in millions )
Count of firms
affected by
s tandard
Average adjus tment by
firms affected by s tandard
(in millions )
IFRS 2 Share-bas ed Payment 41.129 19 2.165
Total reported adjus tment to contributed capital 41.129
Standards affecting reported adjus tment to retained earnings
IFRS 2 Share-bas ed Payment -41.464 20 -2.073
IFRS 6 Exploration for and Evaluation of Mineral As s ets 32.427 3 10.809
IAS 11 Cons truction Contracts -150.809 2 -75.405
IAS 12 Income Taxes -6,898.00 8 -862.25
IAS 16 Property, Plant, and Equipment 19,580.47 3 6,526.82
IAS 17 Leas es -263.282 1 -263.282
IAS 18 Revenue Recognition -793.503 3 -264.501
IAS 19 Employee Benefits -834.64 4 -208.66
IAS 21 Foreign Exchange Rates -36.161 4 -9.04
IAS 23 Borrowing Cos ts -14.729 1 -14.729
IAS 36 Impairment of As s ets -29.345 3 -9.782
IAS 37 Provis ions , Contingent As s ets and Liabilities -307.746 5 -61.549
IAS 38 Intangible As s ets 7.318 1 7.318
IAS 39 Financial Ins truments 234.533 5 46.907
IAS 40 Inves tment Property 4,930.44 2 2,465.22
IAS 41 Agriculture 288.879 1 288.879
IFRS 1 Deemed Cos t 507.884 3 169.295
IFRS 1 Decommis s ioning Liabilities -0.003 1 -0.003
IFRS 1 Cumulative Trans lation Differences -13,428.06 11 -1,220.73
IFRS 1 Bus ines s Combinations 32.194 8 4.024
Total reported adjus tment to retained earnings 2,816.40
Standards affecting reported adjus tment to accumulated other comprehens ive income
IAS 12 Income Taxes 156.755 1 156.755
IAS 21 Foreign Exchange Rates -13.618 1 -13.618
IAS 39 Financial Ins truments -29.816 5 -5.963
IFRS 1 Cumulative Trans lation Differences 13,426.33 11 1,220.58
IFRS 1 Bus ines s Combinations -7.554 1 -7.554
Total reported adjus tment to accumulated other comprehens ive income 13,532.10
The Effect of Equity Component Switching
Table 3 eliminates the effect of equity reclassifications and presents the decomposition of
the adjustments to equity components without component switching. In comparing Tables 2 and
3, continuing with the example of IFRS 2 Share-based Payments, the number of firms affected by
the standard decreased from 20 to 2. After eliminating the switching effect, the magnitude effect
on the adjustment to contributed capital decreased from $41 million to -$2 million and the
cumulative adjustment to retained earnings increased from -41.464 million to 2.074 million.
Removing the equity component switching effect divulges the true standard-to-standard financial
effect.

Academy of Accounting and Financial Studies Journal Volume 20, Number 1, 2016
42
IAS 12 Income Taxes, IAS 16 Property, Plant, and Equipment, and IAS 40 Investment
Property continued to represent the standards demonstrating the largest magnitude effect on the
retained earnings adjustment at -$6,741 billion, $19,580 billion, and $4,930 billion, respectively.
Analysis of the adjustment to accumulate other comprehensive income after eliminating the
switching effect revealed a decrease in the magnitude adjustment from $13,532 billion to -$7
million. This observation should put regulators, standard setters, practitioners, and researchers on
notice that the way in which we analyze and measure equity components could be consequential to
our ability to evaluate a GAAP change.
Table 3
DECOMPOS ITION OF ADJUS TMENT TO EQUITY COMPONENTS BY STANDARDS WITHOUT SWITCHING
Standard affecting reported adjus tment to contributed capital
Sum of
Effect by
Standard
(in millions )
Count of
firms
affected by
s tandard
Average adjus
tment by firms
affected by s
tandard
(in millions )
IFRS 2 Share-bas ed Payment -2.409 2 -1.205
Total reported adjus tment to contributed capital -2.409
Standards affecting reported adjus tment to retained earnings
IFRS 2 Share-bas ed Payment 2.074 2 1.037
IFRS 6 Exploration for and Evaluation of Mineral As s ets 32.427 3 10.809
IAS 11 Cons truction Contracts -150.809 2 -75.405
IAS 12 Income Taxes -6,741.25 8 -842.656
IAS 16 Property, Plant, and Equipment 19,580.47 3 6,526.82
IAS 17 Leas es -263.282 1 -263.282
IAS 18 Revenue Recognition -793.503 3 -264.501
IAS 19 Employee Benefits -834.64 4 -208.66
IAS 21 Foreign Exchange Rates -49.779 4 -12.445
IAS 23 Borrowing Cos ts -14.729 1 -14.729
IAS 36 Impairment of As s ets -29.345 3 -9.782
IAS 37 Provis ions , Contingent As s ets and Liabilities -307.746 5 -61.549
IAS 38 Intangible As s ets 7.318 1 7.318
IAS 39 Financial Ins truments 210.206 3 70.069
IAS 40 Inves tment Property 4,930.44 2 2,465.22
IAS 41 Agriculture 288.879 1 288.879
IFRS 1 Deemed Cos t 507.884 3 169.295
IFRS 1 Decommis s ioning Liabilities -0.003 1 -0.003
IFRS 1 Cumulative Trans lation Differences 0 0 0
IFRS 1 Bus ines s Combinations 24.64 8 3.08
Total reported adjus tment to retained earnings 16,399.25
Standards affecting reported adjus tment to accumulated other comprehensive income
IAS 12 Income Taxes 0 0 0
IAS 21 Foreign Exchange Rates 0 0 0
IAS 39 Financial Ins truments -5.489 4 -1.372
IFRS 1 Cumulative Trans lation Differences -1.73 1 -1.73
IFRS 1 Bus ines s Combinations 0 0 0
Total reported adjus tment to accumulated other comprehens ive income -7.219

Academy of Accounting and Financial Studies Journal Volume 20, Number 1, 2016
43
Summarizing the Switching Effect
Table 4 summarizes the switching effect. The largest switching effect was within the
adjustment to retained earnings at $13,582 billion. Of this amount, $13,428 billion (Table 2)
related to cumulative translation differences, an optional exemption choice exercised under IFRS
1. This exemption permits firms to zero out balances of cumulative translation differences for all
foreign operations at the transition date. Under Canadian GAAP, these differences were
recorded in accumulated other comprehensive income as unrealized gains and losses. Upon
transitioning to IFRS, the majority of the firms (n=16), in sample, elected to reclassify
aggregated unrealized gains and losses to retained earnings, an earned capital account. More
specifically, for the firms represented in the population of early adopters, $13,428 billion
(Table 2) of unrealized translation differences bypassed the income statement and were
reclassified to retained earnings.
Table 4
VARIATIONS OF ADJUS TMENT TO EQUITY COMPONENTS AND SWITCHING EFFECT
Without
As
Reported
(in millions )
Component
Switching
(in millions )
Switching Effect
(in millions )
Adjus tment to contributed capital 41.129 -2.409 -43.538
Adjus tment to retained earnings 2,816.40 16,399.25 13,582.86
Adjus tment to accumulated other comprehens ive income 13,532.10 -7.219 -13,539.32
Change in equity 16,389.62 16,389.62 0
Summary of Standard Effects on all Components of Equity as Reported
Table 5 presents a summary of the magnitude adjustments to the components of equity as
reported disaggregated by the IFRS standard effect. Table 5 combines the financial magnitude
adjustments by standard from Table 2 and reconciles these adjustments to the financial magnitude
on total stockholders’ equity. IAS 16 Property, Plant, and Equipment demonstrated the largest
percentage of change in total stockholders’ equity at 119 percent of the overall change in
stockholders’ equity. IAS 16 permits the revaluation of property, plant, and equipment to fair value
which explains the positive adjustment of re-measurement of $19,580 billion to total stockholders’
equity.
As discussed in section titled, summarizing the Switching Effect, the IFRS 1 election for
cumulative translation differences increases accumulated other comprehensive income by $13,426
billion and decreases retained earnings by $13,428 billion. However, upon examination of the
effect of this standard on the adjustment to total stockholders’ equity, the remeasurement effect is
relatively minimal at a decrease of $1.7 million resulting in an overall decrease to total
stockholders’ equity of .01056 percent. More specifically, the real effect of transition is obscured at
the stockholder’s equity level of analysis.

Academy of Accounting and Financial Studies Journal Volume 20, Number 1, 2016
44
CONCLUSION
The preceding deconstruction of the implementation of IFRS exhibits the complexity of
adopting IFRS. The decomposition of equity components provides an opportunity to observe
adoption effects concealed at aggregated stockholders’ equity. Magnitude adjustments
disaggregated by pronouncement differences permits a more comprehensive understanding of the
particular standards which are associated with the adjustments to equity components. Further, only
when equity components are decomposed can reclassifications (component switching) among the
components be observed. Component switching reveals the implementation effects of IFRS on
equity. As demonstrated in the study, underlying the switching effect (implementation choices) are
the true GAAP-to-GAAP differences which can only be observed upon disaggregation.
An examination of the exercised optional exemptions brings into question the extent to
which IFRS is adopted. The extent to which IFRS is adopted is crucial to the larger assessment of
whether the IFRS reporting system reduces information asymmetry and increases accounting
quality. Consideration of the modifications and limitations of the implementation of IFRS has great
bearing on our ability to measure any improvement IFRS may contribute to financial reporting.
By examining the IFRS transition in a comparable country context to the United States, this
study provides preliminary evidence which compels attention from standard setters and regulators
as to how IFRS is being applied. If the magnitude of the IFRS transition is primarily comprised of
management choices and equity component switching as the evidence from this study suggests,
standard setters and regulators may want to investigate this trend further as they weigh the costs of
adopting IFRS versus the benefits the IFRS reporting system. At a minimum, findings from this
study should prompt standard setters, regulators, practitioners, investors, and researchers to carefully
consider how IFRS is being applied and the extent to which it is being adopted when assessing the
standards for any attainment of relevance, quality, and comparability.

Academy of Accounting and Financial Studies Journal Volume 20, Number 1, 2016
45
IAS 12 Income Taxes - -6,898.00 156.755 -6,741.25 -41.13%
IAS 16 Property, Plant, and Equipment - 19,580.47 - 19,580.47 119.47%
IAS 17 Leas es - -263.282 -263.282 -1.61%
IAS 18 Revenue Recognition -793.503 -793.503 -4.84%
IAS 19 Employee Benefits - -834.64 - -834.64 -5.09%
IAS 21 Foreign Exchange Rates - -36.161 -13.618 -49.779 -0.30%
IAS 23 Borrowing Cos ts - -14.729 -14.729 -0.09%
IAS 36 Impairment of As s ets - -29.345 - -29.345 -0.18%
IAS 37 Provis ions , Contingent As s ets and Liabilities - -307.746 - -307.746 -1.88%
IAS 38 Intangible As s ets - 7.318 - 7.318 0.04%
IAS 39 Financial Ins truments - 234.533 -29.816 204.716 1.25%
IAS 40 Inves tment Property - 4,930.44 - 4,930.44 30.08%
IAS 41 Agriculture - 288.879 - 288.879 1.76%
IFRS 1 Deemed Cos t - 507.884 - 507.884 3.10%
IFRS 1 Decommis s ioning Liabilities - -0.003 - -0.003 0.00%
IFRS 1 Cumulative Trans lation Differences - -13,428.06 13,426.33 -1.73 -0.01%
IFRS 1 Bus ines s Combinations - 32.194 -7.554 24.64 0.15%
Total Adjus tments to Equity Components 41.129 2,816.40 13,532.10 16,389.62 100.00%
Table 5 SUMMARY OF STANDARD EFFECT ON ADJUS TMENTS TO EQUITY COMPONENTS
Adjus tment to Equity Components as Reported (in millions )
Contributed
capital
Retained
earnings
Accumulated other
comprehens ive
income
Total
Stockholders '
Equity
Percentage of
Change in Equity
by Standard
IFRS 2 Share-bas ed Payment 41.129 -41.464 - -0.336 0.00%
IFRS 6 Exploration for and Evaluation of Mineral As s ets - 32.427 - 32.427 0.20%
IAS 11 Cons truction Contracts - -150.809 - -150.809 -0.92%
REFERENCES
Accounting Standards Board (AcSB). (2005). Accounting Standards in Canada: Building on New Directions.
Ashbaugh, H., and M. Pincus. (2001). Domestic accounting standards, international accounting standards, and the
predictability of earnings. Journal of Accounting Research 39(3), 417–34. Ball, R., A. Robin, and J. Wu. (2003). Incentives versus standards: Properties of accounting income in four East Asian
countries and implications for the acceptance of IAS. Journal of Accounting and Economics 36(1–3), 235–
270. Barth, M., W. Landsman, and M. Lang. (2008). International accounting standards and accounting quality. Journal of
Accounting Research 46(3), 467–98.
Blanchette, M., F.-É. Racicot, and J.-Y Girard. (2011). The Effects of IFRS on Financial Ratios: Early Evidence in
Canada. Certified General Accountants Association of Canada.
Capkun, V., A. Cazavan-Jeny, T. Jeanjean, and L. A. Weiss. (2008). Earnings Management and Value Relevance
During the Mandatory Transition from Local GAAPs to IFRS in Europe. Working paper, available at SSRN
eLibrary. doi: 10.2139/ssrn.1125716.
Capkun, V., Cazavan-Jeny, T. Jeanjean, and L. A. Weiss. (2011). Setting the Bar: Earnings Management During a
Change in Accounting Standards. Working paper, available at SSRN eLibrary. doi: 10.2139/ssrn.1870007.
Canadian Institute of Chartered Accountants (CICA). (2011). Financial Reporting in Canada under IFRS.
Christensen, H. B., E. Lee, and M. Walker. (2009). Do IFRS Reconciliations Convey Information? The Effect of Debt
Contracting. Journal of Accounting Research, 47(5), 1167-1199.
Cormier, D. (2013). Relevance of Financial Reporting and Disclosure for Financial Markets under IFRS: Some
Canadian Evidence. Cahier de recherche, 04.

Academy of Accounting and Financial Studies Journal Volume 20, Number 1, 2016
46
Cormier, D., S. Demaria, P. Lapointe-Antunes, and R. Teller. (2009). First-Time Adoption of IFRS, Managerial
Incentives, and Value-Relevance: Some French Evidence. Journal of International Accounting Research, 8(2),
1-22.
Economy Watch (2012) accessed at http://www.economywatch.com/worldeconomy/canada
Fifield, S., G. Finningham, A. Fox, D. Power, and M. Veneziani. (2011). A cross-country analysis of IFRS
reconciliation statements. Journal of Applied Accounting Research, 12(1), 26-42.
Gassen, J., and T. Sellhorn. (2006). Applying IFRS in Germany-determinants and consequences.
Betriebswirtschaftliche Forschung und Praxis, 4, 365.
Gjerde, Ø., K. Knivsflå, and F. Sættem. (2008). The value-relevance of adopting IFRS: Evidence from 145 NGAAP
restatements. Journal of International Accounting, Auditing and Taxation, 17(2), 92-112.
Gordon, E., B. Jorgensen, and C. Linthicum. (2010). Could IFRS replace US GAAP? A comparison of earnings
attributes and informativeness in the US market. UTSA College of Business, Working paper, No. 0028.
Haller, A., J. Ernstberger, and M. Froschhammer. (2009). Implications of the mandatory transition from national GAAP
to IFRS — Empirical evidence from Germany. Advances in Accounting 25(2), 226-236.
Henry, E. (2009). Early Adoption of SFAS No. 159: Lessons from Games (Almost) Played. Accounting Horizons,
23(2), 181-199.
Horton, J., and G. Serafeim. (2010). Market reaction to and valuation of IFRS reconciliation adjustments: First evidence
from the UK. Review of Accounting Studies 15(4), 725–51.
Hung, M., and K. R. Subramanyam. (2007). Financial statement effects of adopting international accounting standards:
the case of Germany. Review of Accounting Studies 12(4), 623-657.
Institute of Chartered Accountants in England and Wales (ICAEW). (2007). EU Implementation of the IFRS and the
fair value directive, report to the European Commission.
International Accounting Standards Board (IASB). (2010). Conceptual Framework for the Preparation and
Presentation of Financial Statements.
International Accounting Standards Board (IASB). (2003). First-Time Adoption of IFRS. IFRS 1. London, U.K.
Jermakowicz, E. K. and S. Gornik-Tomaszewski. (2006). Implementing IFRS from the perspective of EU publicly
traded companies. Journal of International Accounting, Auditing and Taxation, 15(2), 170-196.
Karamanou, I., and G. P. Nishiotis, (2009). ‘Disclosure and the cost of capital: evidence from the
market's reaction to firm voluntary adoption of IAS’, Journal of Business Finance & Accounting, 36(7‐
8),793-821.
Kvaal, E., and C. W. Nobes. (2010). International differences in IFRS policy choice. Accounting and Business
Research,40(2), 173–87.
Lantto, A.-M., and P. Sahlström. (2009). Impact of International Financial Reporting Standard adoption on key financial
ratios. Accounting & Finance, 49(2), 341-361.
Schadewitz, H. and M. Vieru. (2007). How markets valuate and response to IFRS reconciliations adjustments in
Finland. Available at SSRN 1005601.
Schipper, K. (2005). The introduction of International Accounting Standards in Europe: Implications for international
convergence. European Accounting Review, 14(1), 101–6.
Street, D.L. and S.M. Bryant. (2000). Disclosure level and compliance with IASs: a comparison of companies with and
without US listings and filings. The International Journal of Accounting, 35(3), 305–329.
Tarca, A. (2004). International Convergence of Accounting Practices: Choosing between IAS and US GAAP. Journal
of International Financial Management & Accounting, 15(1), 60-91.

Academy of Accounting and Financial Studies Journal Volume 20, Number 1, 2016
47
THE PROBLEM OF LIMITED SCOPE AUDITS
Theresa Hrncir, Southeastern Oklahoma State University
ABSTRACT
In May 2015, the Department of Labor (DOL) released a report of its findings from
statistically sampling 400 audits reports. With an alarming 39 percent of the audited reports
containing one or more significant violations of Generally Accepted Auditing Standards (GAAS)
there is cause for concern and need for change.
The study, the fourth such one undertaken since enactment of the Employee Retirement
Income Securities Act of 1974 (ERISA), was conducted as part of the DOL’s periodic monitoring
of the quality of the audit reports. These audit reports were chosen from reports prepared by the
more than 7,000 Certified Public Accountant (CPA) firms that audit the 81,162 filings of Form
5500 Annual Return/Reporting (Form 5500) for pension funds. The violations of these auditing
standards could lead to rejection of Form 5500 for the fund, and as written in the DOL report
such mistakes risked the assets of 22.5 million plan participants and beneficiaries for the $653
billion of assets in those funds.
While briefly addressing other aspects of the DOL report, and providing a historical view
of the studies to put the problem into prospective, this paper focuses on a feature unique to
pension plan audits and only to pension audit plans, the limited scope audit. Since 1978, the
American Institute of Accountants and others have periodically called for elimination of the
limited scope audit. In 2011, the year of the study, 80 percent of all pension fund audits were
conducted under the scope limitation audit. The paper provides support to the argument that the
controversial limited scope option should be eliminated because it is associated with a
significantly greater likelihood of information not fairly-stated.
INTRODUCTION
In May 2015, the Department of Labor (DOL) released a report of its findings from
statistically sampling 400 audits reports. With an alarming 39 percent of the audited reports
containing one or more significant violations of Generally Accepted Auditing Standards (GAAS)
there is cause for concern and need for change.
The study, the fourth such one undertaken since enactment of the Employee Retirement
Income Securities Act of 1974 (ERISA), was conducted as part of the DOL’s periodic
monitoring of the quality of the audit reports. These audit reports were chosen from reports
prepared by the more than 7,000 Certified Public Accountant (CPA) firms that audit the 81,162
filings of Form 5500 Annual Return/Reporting (Form 5500) for pension funds. The violations of
these auditing standards could lead to rejection of Form 5500 for the fund, and as written in the
DOL report such mistakes risked the assets of 22.5 million plan participants and beneficiaries for
the $653 billion of assets in those funds.
While briefly addressing other aspects of the DOL report, and providing a historical view
of the studies to put the problem into prospective, this paper focuses on a feature unique to
pension plan audits and only to pension audit plans, the limited scope audit. In 2011, the year of
the study, 80 percent of all pension fund audits were conducted under scope limitation. Use of
the limited scope option is permitted for pension fund report by choice of the fund administrator.

Academy of Accounting and Financial Studies Journal Volume 20, Number 1, 2016
48
The DOL’s comprehensive report contains eleven recommendations collected into three
groupings labeled: enforcement, regulatory/legislative, and outreach. Four enforcement
recommendations target existing problem areas of collecting increased fines and imposing
sanctions on those CPAs performing nonstandard work that leads to audit deficiencies. Four
recommendations labeled as outreach to state boards of accountancy and plan administrators
target limiting or precluding some CPAs from performing pension fund audits. Primarily these
recommendations if endorsed might preclude new CPAs or small practice CPA firms from
conduction pension fund audits. Finally, the three regulatory/legislative recommendations
contain two which support giving accounting/auditing rule making power to the Secretary of
Labor and one recommendation to repeal the limited scope audit. This paper focuses on the last
recommendation repeal of the limited scope audit.
BRIEF HISTORY AND THE PROBLEM OF LIMITED SCOPE AUDITS
In 1974, Congress passed the Employee Retirement Income Security Act (ERISA).
ERISA was unique compared to earlier pension regulation/law. ERISA was passed to protect the
information integrity and to safeguard interests of participants and others expected beneficiaries
of covered pension plans. From the beginning, this law, ERISA required filing of an annual
report within 210 days after the end of the plan year and this report, Form 5500, must be audited.
While prior laws existed for pension plans, no audit was required until ERISA was passed.
Furthermore, Section 103 of ERISA required that both accounting practices and audit work must
meet professional accounting and auditing standards.
The passage of ERISA marked the beginning of a requirement for an unbiased opinion on
the fairness of the information contained in the pension report submitted to the DOL. This law
also included the fund administrator’s choice for a limited scope audit which was and is very
unique to audit standards and practices. By limiting the scope, the auditor is not required
(allowed) to test certain information that would normally be tested (Wood, 1995). The idea
behind limiting scope would be the elimination of a duplication of effort because funds held with
certain financial institutions should be reviewed by the institution’s regulators. Plans with more
than 100 eligible participants categorized as a funded, qualified retirement plan or other ERISA
benefit plan are required to file the Form 5500 Annual Return/Report and thus to be audited by
an independent qualified public accountant.
By auditing standards, the auditor must gather, study, inspect, test, etc. sufficient
evidence upon which to issue an opinion on the engagement. This action is referred to as the
scope of the audit engagement. By ERISA law, the fund administrator chooses whether to
engage an auditor for a full audit or limited scope audit. The auditor may accept or decline the
engagement. However, in the usual audit situation, after acceptance of the engagement, when
management or the plan administrator limits access to information the auditor either gives a
qualified opinion or disclaims an opinion on what cannot be examined. The auditor’s guidelines
for which opinion to offer depends up the materiality of what is not examined compared to the
entity as a whole. For a pension fund, a scope limitation on the funds within the pension plans
would surely be a material item and lead to disclaiming an opinion in any circumstance other the
limited scope audit created by ERISA law.
Periodically, The Employee Benefits Security Administration (EBSA) formed in 1988
conducted studies for the DOL. The studies the agency conducted as statistical study addressed
the quality of audit work done by CPAs for pension plans. Table 1 shows the results of all four
studies of the quality of audit reports.
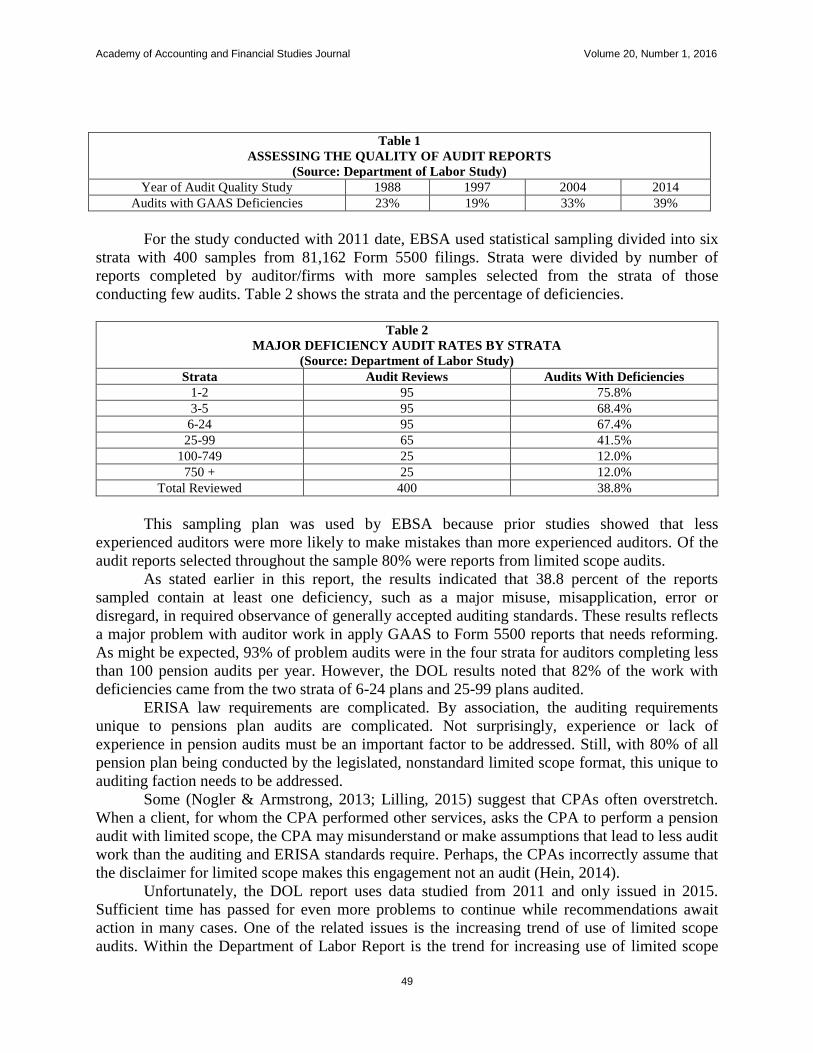
Academy of Accounting and Financial Studies Journal Volume 20, Number 1, 2016
49
Table 1
ASSESSING THE QUALITY OF AUDIT REPORTS
(Source: Department of Labor Study)
Year of Audit Quality Study 1988 1997 2004 2014
Audits with GAAS Deficiencies 23% 19% 33% 39%
For the study conducted with 2011 date, EBSA used statistical sampling divided into six
strata with 400 samples from 81,162 Form 5500 filings. Strata were divided by number of
reports completed by auditor/firms with more samples selected from the strata of those
conducting few audits. Table 2 shows the strata and the percentage of deficiencies.
Table 2
MAJOR DEFICIENCY AUDIT RATES BY STRATA
(Source: Department of Labor Study)
Strata Audit Reviews Audits With Deficiencies
1-2 95 75.8%
3-5 95 68.4%
6-24 95 67.4%
25-99 65 41.5%
100-749 25 12.0%
750 + 25 12.0%
Total Reviewed 400 38.8%
This sampling plan was used by EBSA because prior studies showed that less
experienced auditors were more likely to make mistakes than more experienced auditors. Of the
audit reports selected throughout the sample 80% were reports from limited scope audits.
As stated earlier in this report, the results indicated that 38.8 percent of the reports
sampled contain at least one deficiency, such as a major misuse, misapplication, error or
disregard, in required observance of generally accepted auditing standards. These results reflects
a major problem with auditor work in apply GAAS to Form 5500 reports that needs reforming.
As might be expected, 93% of problem audits were in the four strata for auditors completing less
than 100 pension audits per year. However, the DOL results noted that 82% of the work with
deficiencies came from the two strata of 6-24 plans and 25-99 plans audited.
ERISA law requirements are complicated. By association, the auditing requirements
unique to pensions plan audits are complicated. Not surprisingly, experience or lack of
experience in pension audits must be an important factor to be addressed. Still, with 80% of all
pension plan being conducted by the legislated, nonstandard limited scope format, this unique to
auditing faction needs to be addressed.
Some (Nogler & Armstrong, 2013; Lilling, 2015) suggest that CPAs often overstretch.
When a client, for whom the CPA performed other services, asks the CPA to perform a pension
audit with limited scope, the CPA may misunderstand or make assumptions that lead to less audit
work than the auditing and ERISA standards require. Perhaps, the CPAs incorrectly assume that
the disclaimer for limited scope makes this engagement not an audit (Hein, 2014).
Unfortunately, the DOL report uses data studied from 2011 and only issued in 2015.
Sufficient time has passed for even more problems to continue while recommendations await
action in many cases. One of the related issues is the increasing trend of use of limited scope
audits. Within the Department of Labor Report is the trend for increasing use of limited scope

Academy of Accounting and Financial Studies Journal Volume 20, Number 1, 2016
50
audit by pension plan administrators. The upward trend for limited scope audits for pension plans
reached 80% in the year of study and 83% in 2013, the last year report. Table 3 repeats these
statistics from the report.
Table 3
LIMITED SCOPE AUDIT TREND
(Source: Department of Labor)
2001 2002 2003 2004 2005 2006 2007 2008 2009 2010 2011 2012 2013
48% 51% 56% 59% 62% 62% 65% 67% 78% 79% 80% 81% 83%
As stated previously, the fund administrator chooses whether or not to limit scope for
these audits. MacKay (401(k) Advisor, Part I, 2008) states that the plan administrator may elect
the limited scope audit. To qualify for this election, the trustee or custodian of the plan must
provide a certification which states that the plan financial information is complete and accurate.
A bank or other qualifying organization must provide this certification. Additional work is
required of the auditor even under limited scope conditions which include planning and review
of necessary controls on the plan, and supplemental information. MacKay (401(k) Advisor, Part
II, 2008) continues by stating that new accounting changes require the auditor to evaluate risk
assessment as to whether fraud or unintentional errors may be present even in the limited scope
audit situation.
ARGUMENTS FOR ELIMINATION OF LIMITED SCOPE AUDITS
None of the results sited from any of the four of the prior studies conducted by the EBSA
for the DOL are impressive. At best over the decades, one in five reports may contain at least one
deficiency in GAAS that could lead to rejection of the Form 5500. At worst, the results from the
most recent report show double that rejection rate. With higher deficiencies being found in
reports and with greater use of the limited scope audit, logic would suggest that there would be a
tie between problems of audit reports and the use of limited scope. The use of limited scope
audits may not be in the best interest of plan participants not in the best interest of auditors.
Limited scope audit is a legal exception to normal accounting and auditing practices for a very
complicated report. The DOL study only sampled 400 reports from 81,162. How many reports
slipped through the review process with deficiencies that led to losses for the 22.5 million plan
participants and beneficiaries?
Over the years since enactment of ERISA, the Limited Scope Audit continues to be a
controversial option. The American Institute and many others (Henry, 2014; Hughes, 2013;
Lilling, 2015; Tysiac, 2015; Walker, 1996; Wood, 1995) state the problems, misunderstandings,
and misinterpretations of the limit scope audit. Inexperienced auditors may lack skill to catch
these problems, misunderstandings and misinterpretations and experienced auditors may do so
too. Some plan administrators lack the skills to understand potential problems with the use of
limited scope. And plan administrator may misuse this legal loop hole to commit fraud. When
the financial institution hold the plan’s investments makes a mistake in certification or does not
meet certain qualifications, the auditor must catch the problem even though scope is limited
(Journal of Accountancy, 2014) and experienced auditors may not do so.
The limited scope audit was included in ERISA by what might be surmised as an attempt
to make the additional requirement of an audit more acceptable and cost benefit arguments
continue. The employing organization that offers a qualifying pension plan must file Form 5500
and Form 5500 requires an annual audit. For smaller employers, the cost of a full audit may

Academy of Accounting and Financial Studies Journal Volume 20, Number 1, 2016
51
exceed the benefit of assurance of correct information (Langbert, 2001). Yet, what are the costs
of errors to pension fund participants, DOL and related regulators and CPAs from the continued
use of a much misunderstood or less than effective limited scope audit?
As early as 1978 the AICPA publicly pushed for full-scope audits (Journal of
Accountancy, September 1992). Among the concerns expressed then and now is that fraud,
misunderstanding or weaknesses in plans (CPA Journal, 1993; Czarnecki, 1996) and serious
ERISA violations may not be caught with limited scope audits.
Two prior attempts to repeal the Limited-scope audit failed. The Labor Law Journal
(1990) notes in its miscellany column that Secretary Elizabeth Dole recommended legislative
changes to ERISA including the repeals of the limited scope audit exception and to use a single
audit approach. Senator Robert Dole and House Minority Leader Robert H. Michel introduced a
bill in 1990 seeking repeal of the limited scope audit. The bill failed. Again in 1996, a bill to end
limited scope audit failed even though it was strongly supported by the American Institute of
Certified Public Accountants (Journal of Accountancy, 1996). These bills coincided with the first
two DOL studies conducted by the EBSA.
Recommendations to repeal the limited score opinion continue (Halonen, 2010; Hughes,
2013; Walker, 1996; Wood, 1995). In 2011 the ERISA Council continued to support the limited
scope audit in the face of continued concerns about problems (Wilson, 2011). The reason for the
continuation - cost/benefit. The council’s reason for its continued support was that benefits from
elimination of the limited scope audit would not exceed the costs. In an about face, the next year,
Etheridge (2011) writes that the DOL is seriously considering revoking the limited scope audit.
Yet, the limited scope option still remains and is still listed as an item of consideration for the
DOL study.
CONCLUSIONS, RECOMMENDATIONS AND FUTURE RESEARCH
Plan administrator selection of limited scope audits continues to increase at an increasing
rate as stated in the DOL study. Some plan administrators chose this option to reduce costs of the
audit and by law the auditor must comply with this request or decline the engagement. Yet, the
statistical results from the DOL’s most recent study show that this option, limited scope audit
may not be in the best interest of anyone, given the complicated ERISA law and related
complicated auditing standards.
Numerous authors, the AICPA and even the DOL in its most recently released study
make an argument for finally eliminating the limited scope audit as an option for pension fund
reports. As the DOL study documented hundreds of billions of dollars are at risk for millions of
people who count on fairly-stated information in their pension funds. The limited scope audit
should be eliminated because it is associated with a significantly greater chance for information
that is not fairly-stated.
Cost issues are and have always been part of the argument on pension fund audits.
However, the argument might be made not for cost vs. benefit but rather who, how, or when the
cost will be absorbed. While the DOL sided with the idea of reducing costs by allowing the
limited scope audit, its own study points to significant problems with the option. Ultimately,
pension plan participants and recipients will bear the cost of deficient reports from auditor or
plan administrator actions should fraud or reporting deficiencies lead to losses. In the face of
continuing problems those auditors who audit funds with limited scope will likely need to
increase audit fees to cover the potential problems that may come with the continued use of this

Academy of Accounting and Financial Studies Journal Volume 20, Number 1, 2016
52
unique option, the limited scope. This too is a potential cost the pension plan participants and
recipients will bear albeit indirectly.
As with the three prior studies, this highly confidential information is accessible to the
DOL, and related government agencies. When submitted by the CPA through the peer review
process, at least some of these reports should be reviewed by other CPAs. While not the focus of
this paper, an additional concern of the DOL report is that the supposed checks and balances of
peer review process for CPA work have not been effective. The AICPA has been working with
the DOL to provide improved monitoring of auditor work through the peer review process and
also adding learning opportunities for CPAs who accept pension fund audits.
Nevertheless, the DOL study and related report list eleven recommendations that contain
many opportunities for future study. The issue of deficiencies in audit reports and the related
study point to many issues needing future research. This paper only addressed one of the eleven
recommendations contained in the study. The cost/benefit issues, the potential legislation, the
peer review process which this paper does not address are some areas deserving further study.
REFERENCES
Assessing the Quality of Employee Benefit Plan Audits, May, 2015 retrieved from
http://www.dol.gov/ebsa/pdf/2014AuditReport.pdf
Bills Would Alter ERISA Audit Requirements. (1992) Journal of Accountancy, 174(3), 17.
Congress does not repeal Limited-scope pension audits. (1996) Journal of Accountancy, 186(6), 16-17.
CPA audit reports on plan financial statements: An ever-complex process (Part I of a two-part series). (2008). 401K
Advisor, 15(8), 4-9.
CPA audit reports on plans: An ever-complex process (Part II of a two-part series). (2008). 401K Advisor, 15(9), 4-
9.
Czarnecki, J. A. (1996). Plan audits can make or break 401(k)s. National Underwriter / Life & Health Financial
Services, 100(41), 7.
DeVon Deppe, E., & Mano, R. M. (1995). Retirement Plans in Bankruptcy-- Who Gets the Assets. Benefits
Quarterly, 11(3), 90-95.
Etheridge, C.E. (2012). Audit 101: A Guide to Employee Benefit Plan Audits Audit. Journal of Pension Benefits:
Issues in Administration, 19(2), 86-88.
GAO issues audit report on PBGC 1992 and 1991 financials. (1993). CPA Journal, 63(12), 10.
Halonen, D. (2010). Accountants group urges DOL to drop audit exemption. Pensions & Investments, 38(18), 3.
Hein, M. (2014). Finding Failures. California CPA, 83(2), 14-15.
Henry, A. M. (2014). Peer Review: A Pillar of Protecting Public Interest - Don't Let It Collapse. Pennsylvania CPA
Journal, 85(3), 25-28.
Hughes, J. C. (2013). Form 5500 Season and the DOL Report Recommending Changes to the Audit Process. (cover
story). 401K Advisor, 20(4), 1-8.
Langbert, M. (2001). The Costs and Benefits of the Form 5500 Annual Report. Benefits Quarterly, 17(1), 54-65.
Lessons learned: Practical tips to help avoid common EBP audit and reporting errors. (2014). Journal of
Accountancy, 217(2), 1-2.
Lilling, A. S. (2015). Employee Benefit Plans and Audit Quality. CPA Journal, 85(7), 54-55.
Miscellany (1990) Labor Law Journal, 41(4), 256.
Nogler, G., & Armstrong, J. (2013). How Auditors Get Into Trouble-and How to Avoid It. Journal of Corporate
Accounting & Finance (Wiley), 24(4), 5-10. doi:10.1002/jcaf.21854
Tysiac, K. (2015). How to perform high-quality EBP audits. Journal of Accountancy, 220(3), 61-64.
Walker, D. M. (1996). A Warning to CPAs on Employee Benefit Plan Audits. Journal of Accountancy, 181(6), 55-
57.
Wilson, S. (2011). ERISA Council Backs Limited Scope Audits. Fund Action. 14.
Wood, James O. (1995). Why we need pension reform. Benefits Quarterly, 11(3), 85-89.

Academy of Accounting and Financial Studies Journal Volume 20, Number 1, 2016
53
STUDY OF THE FORECASTING PERFORMANCE OF
CHINA STOCKS’ PRICES USING BUSINESS
INTELLIGENCE (BI): COMPARISON BETWEEN
NORMALIZED AND DENORMALIZED DATA
Ojoung Kwon, Craig School of Business
Zijian Wu, Craig School of Business
Long Zhang, Craig School of Business
ABSTRACT
It is widely acknowledged that the impacts of various kinds of information on stock prices
are extremely difficult, if not impossible, to measure in terms of duration and significance.
During 2002 and 2012, the high fluctuations in China’s stock markets made price prediction
challenging to perform. Historical events that occurred both domestically and internationally,
such as the dot-com bubble, the outbreak of SARS, party leadership transitions, the global
financial crisis and resulting economic recession, the Wenchuan earthquake, and the Beijing
Olympic Games further served to prove this point. The objectives of this study are to therefore
explore critical indicators in stock price forecasting in order to increase accuracy for
professionals in the market. This will be done by comparing the forecasting performances of the
Normalized Data (ND) versus the Denormalized Data (DD) to measure how accurate our
Neural Network (NN) models are. The results demonstrate that using ND and DD produce
identical results, which means we do not need to spend time on repeating the data
denormalization process in future researches.
Keywords: Business Intelligence, Financial Forecasting, Investment Strategies,
Behavioral Finance, Momentum and Reversal, Overreaction and Underreaction, Technical
Analysis, Data Mining, Data Normalization, Denormalization, Forecasting Techniques, Neural
Networks, and Artificial Intelligence
INTRODUCTION
Business Intelligence (BI) represents a powerful technique for extracting meaningful
information from vast amounts of raw data, interpreting inherited relationships among the data,
and eventually facilitating the decision making process.
Stock markets, located throughout the world, generate numerous data covering various
aspects on a daily basis. Investors who expect to make profits by forecasting stock market prices
are confused by easily accessed but overwhelming information. A wide array of factors, such as
the fluctuations in major global stock indices, competitors, investors’ sentiments, and
political elections make the prediction of stock prices even more complicated.
The stock market in China, one of the largest markets in the world, has its own unique
characteristics. It has been more than 30 years since economic reform was launched in China but
it is still considered young and state-controlled with a high degree of corruption. A study of the
distinct differences between the stock markets in China and the markets in developed countries
would yield compelling results.

Academy of Accounting and Financial Studies Journal Volume 20, Number 1, 2016
54
The authors have been conducting research in predicting stock prices utilizing Business
Intelligence (BI) for several years. Kwon, Tjung, and Tseng (2012) indicated that the Neural
Network (NN) model, using a financial data mining technique, performs better in forecasting stock
prices than the Ordinary Least Squares (OLS) model does in US stock markets. The forecasting
accuracy is measured in terms of the significant percentage forecasting error of the mean and
standard error. For the NN model, means vary from 2.1% to 12.31% and standard deviations
change from 2.11% to 14.92%. The OLS model has means from 1.93% to 24.8% and standard
deviations from 2.15% to 12.3%. In addition, the NN model provides more insights in identifying
critical predictors which would increase forecasting accuracy in stock market analysis. The study
considers eight indicators which are macroeconomic indicators, microeconomic indicators, market
indicators, market sentiments, institutional investors, political indicators, business cycles, and
calendar anomalies. Furthermore, as a linear model, OLS has limited capacity and inconsistent
performance in stock market prediction.
In this study, the NN model is applied to predict the price fluctuations in China’s stock markets. The sample period ranges from 2002 to 2012 covering the dot-com bubble in late 2002,
2003’s outbreak of SARS, party leadership transitions in 2002 and 2012, the global financial crisis
and economic recession since 2007, and lastly the Wenchuan earthquake and the Beijing Olympic
Games of 2008. In addition, 25 indicators, including macroeconomic indicators, market sentiment indicators, institutional investors, and microeconomic indicators, were added as independent
variables to better predict the stock price changes in China. National holidays were also taken into
consideration in the forecasting model. In our previous study, we received criticism that the results
would lose physical meaning as stock prices after multiple steps of data manipulation. Thus, in this study, we de-normalized the predicted results and compared them with the original stock
prices. The new generated dataset will be more compelling in explaining the forecasting accuracy
of the BI approach.
LITERATURE REVIEW
Business Intelligence in Stock Price Forecasting
Business intelligence has been widely researched in stock market prediction in recent years.
The NN model will be the primary form of business intelligence techniques in this study. In
recent years, several studies have been conducted to compare the different versions of NN models
regarding the productivity of China’s stock markets. Dai, Wu & Lu (2012) proved that the
combination of nonlinear independent component analysis (NLICA) and neural network has higher
accuracy in forecasting Shanghai B shares than other NN models, including LICA-BPN, PCA
BPN, and single BPN. Liu and Wang (2011) demonstrated that the combination of independent
component analysis (ICA) of fluctuations’ statistical behaviors in the Chinese stock markets and
NN model (ICA-BP) outperforms both the common BP model with principal component analysis
(PCA-BP) and the single BP model in forecasting the fluctuations of China’s stock markets. Cao,
Han, and Lam (2013) found that the back propagation network is slightly better than the radial
basis function network in terms of measuring the productivity of the Chinese stock price
trends. The NN model can also be applied in other areas related to Chinese stock markets. Meng
(2008) successfully applied the NN models in forecasting IPO return in the Chinese stock markets.
Wang, Pan, and Liu (2012) applied a jump time effective neural network to forecast the
fluctuations in the Chinese stock markets and Chinese crude oil price index.

Academy of Accounting and Financial Studies Journal Volume 20, Number 1, 2016
55
There are previous researches that compare the NN models with other traditional finance
models in forecasting. For instance, Cao, Parry, and Leggio (2011) compared the artificial NN
models with a dynamic single-factor CAPM-based model. Fama’s (1970) three-factor model in
forecasting the Chinese stock markets concluded that the artificial NN models outperformed the
other two linear models.
Additionally, previous research compared performances of the NN models in different
countries. Liu and Wang (2012) found that a combined time strength function will increase the
accuracy of the Legendre neural network in stock market movement prediction based on the data
from Shanghai A share and B share, the Industrial Average Index, and the Nasdaq Composite
Index. The study also suggests that the Chinese stock markets experience sharper fluctuations.
Government Regulations
China’s government plays an important role in its economic and financial sectors. Chan,
Fung, and Thapa (2007) indicated that imperfection and incompleteness are the apparent characters
of an emerging financial market and that government regulations on transparency and fairness are
critical factors in such a market. The economic, institutional, and market microstructures in China
are different from those in the U.S., which is probably caused by the Chinese government
regulations. Segmentation in the financial market, which would potentially lead to mispricing, can
also be created by government policies. Sun, Tong, and Tong (2002) proposed that the optimum
level of government control can improve privatized firms’ performances, particularly in the fields
of profitability, sales, and employees’ productivity. However, over-control has a negative effect
on the firms’ performances, while under-control show the lack of political support from the
government.
In 2002, 80% of the public companies listed in China’s stock markets were owned by the
government (SSNSIC, 2003). A series of studies conducted by Xu and Wang (1999), Varela and
Wei (2002), and Sun and Tong (2003) proposed that the participation of non-financial institutional
investors tended to improve the companies’ performances whereas the state-owned enterprises
(SOEs) were inefficient since they lacked governance. Vickers and Yarrow (1988) argued that
“monopoly of information”, caused by the dominant public sector, made it hard to evaluate the
SOEs’ performances. Putterman (1993) proposed that since government officials are not under the
surveillance of the public in a socialist market economy, they are not fully functional in
monitoring the dominant public sectors. Shleifer and Vishny (1994) argued that politicians and
enterprise managers/shareholders in control of the SOEs preferred to maximize their private
utilities rather than maximize social welfares. Zhang (2004) indicated that the effectiveness of
monitoring of the SOEs is diminished when the public sector is dominant in the market. The study
explained reasons for the relative ineffectiveness of Chinese corporatization where weak
surveillance and inefficiency were caused by the unwillingness of the state to give up the control
of the SOEs. In addition, enterprise managers did not take control of the companies through
corporatization so the implementation of revenue-generating activities was restricted.
Yao and Yueh (2009) found that China’s stock market was one of the largest when it
came to market capitalization in Asia in 2004. The fluctuation in market returns was high,
because the price of each type of share, such as individual, government, A, B, and H, was
prescribed and different types of share had unique trading regulations. Riedel, Jin and Gao
(2007) indicated that the share values were designated, instead of determined, by the market
since the percentage of non-tradable shares of 1,400 public companies in China’s stock exchange
were found to be as high as 69%.

Academy of Accounting and Financial Studies Journal Volume 20, Number 1, 2016
56
Gordon and Li (2003) argued that China’s government generated revenue from both foreign
and domestic investors by choosing unusual regulations in the financial markets and that these
regulations lead to a maximized, standard type of social welfare function. The study also indicated
that because of the pressure imposed by the government the Chinese banking system has to lend
money to state-owned enterprises regardless of the firms’ financial performances.
Corruption
According to He (2000), the situation of corruption in China is even worse during the
economic reformation period. Because of the high degree of corruption, market competition and
economic conditions are manipulated. Corrupt authority allocates resources according to bribes
instead of market efficiency. In order to make unjust profits, many businesspersons bribe the
officials to avoid government regulations.
Watanabe (2002) indicated that there is an increasing likelihood of a significant amount
of money being expropriated from minority stockholders to major shareholders under the weak
legal protection in China. Knight and Yueh (2008) argued that entrepreneurs in China may take
advantage of interpersonal relationships, a long-held tradition in Chinese culture and history, to
exploit the imperfect legal system.
Tondkar, Peng, and Hodgon (2003) argued that the Chinese Securities Regulatory
Commission (CSRC) is far less advanced than the U.S. Securities and Exchange Commission
(SEC) in terms of regulation, information transparency and investor protection. The study also
indicates that the Chinese government makes the decision about which companies may be listed
on the stock markets according to a governmental quota-based system. The purpose of this
unique domestic listing requirement, established by the CSRC, is to allow only a few companies
with sound financial performances to be approved. Under the circumstances, the government
prefers State-Owned Enterprises (SOEs) rather than private companies even though the private
sector usually creates more profits. To make matters worse, uninformed investors may be misled
by the government’s favor of SOEs and make irrational investment decisions. Individual investors
are only able to obtain partial financial information of the public companies since the CSRC does
not require transparent financial reporting. This also significantly affects investors’ judgment.
Firth, Rui, and Wu (2009) argued that the CSRC takes on a bureaucratic style of regulation and
disseminates Sanction and Enforcement Information (SEI) to the public with more than 15 days of
delay. On the other hand, timely disclosing of the SEI to keep the public completely informed is
extremely important in countries with matured stock markets. Therefore, investors in China are
less confident because they only have access to substandard information which is a result of lagged
disclosure of the SEI.
Fan, Wong, and Zhang (2007) found that it was a trend to have politically connected
CEOs, who were current or former government officials and lacked relevant professional
experience in public companies in China. The stock returns of such firms were lower than those
of politically unconnected competitors.
Predictability
Previous researches show that the predictability of China’s stock markets is weaker than
that of the U.S. markets. Chin and Wang (2004) found evidence supporting the return predictability
in China’s stock markets. Chen, et al. (2010) reported that the predictability for China’s stock
markets is relatively weak compared to the U.S. markets, which may be caused by less
heterogeneously distributed return predictors and less informative stock prices in China. Su (1998)

Academy of Accounting and Financial Studies Journal Volume 20, Number 1, 2016
57
studied matured stock markets in developed countries and finds that China’s stock markets had a
low risk adjusted return but very high volatility of returns. According to Zhang, Wei and Huang
(2014), individual stocks in China’s markets were more difficult to predict than those of the U.S.
markets, mainly depending on the comparison of stocks between the S&P 500 and the Shanghai
composite index. Li and Zhang (2013) pointed out that there is a strong return relationship existing
between China and the U.S. stock markets with cojump effects and short- term spillover effects.
The study of Lee and Rui (2000) showed that the Chinese stock market returns cannot be predicted
by trading volume while partially affected by the U.S. returns. The study also suggests that
Chinese stock returns do not follow a random walk.
In China’s stock markets, industry concentration and market capitalization can explain
the predictability of returns in different industries and sectors. Stock portfolios in finance,
insurance, services, and real estate industries have the highest predictability and the lowest
ownership concentration while stock portfolios of small capitalization firms were partly predictable
(Jiang, 2011).
Efficiency
The literature suggests mixed results on stock market efficiency in China. In early studies
around 2000, Ma and Barnes (2001) argued that China’s stock market was not a weak-form
efficient. Li (2003) pointed out that China’s stock market is still developing with a trend to be
efficient. Groenewold, Tang, and Wu (2003) found that market efficiency was averse to the banks’
exclusion. Recently, Kang, Cheong, and Yoon (2010) found that the Chinese stock market goes
against the market efficiency theory whereas Lim, et al. (2013) indicated that the Chinese stock
market is weak efficient.
Investors’ Behavior
Investors’ behavior is another vital factor in China’s stock markets and previous research
has discovered several special investors’ behaviors related to various areas in Chinese stock
markets. For instance, both too high and too low Corporate Social Responsibility (CSR)
performances may result in investors’ undesirable reactions (Wang, Qiu & Kong, 2011). Wu
(2013) found that price under-reaction related to trading information existed in Chinese stock
markets because the public was unable to completely capture the trading information in order
flows and information availability delayed different investors groups from the lead-lag effect.
According to Lu (2004), Chinese investors showed a strong disposition effect in stock markets and
were more willing to keep stocks under deep loss or gain.
In addition, there is a higher threshold that tends to govern momentum behaviors in the
Shanghai stock market than in mature markets, like the ones of Japan, Hong Kong, and the US
(Wei, Huang, and Hui, 2013). The authors also point out that higher opportunities for using
momentum strategies in the Shanghai market were consistent with the inefficiency in the emerging
market.
Furthermore, an argument came up amongst previous studies about herding behavior in
China’s stock markets. Demirer and Kutan (2006) found that there was no obvious herd formation
in Shanghai and Shenzhen stock markets whereas Chiang, Li and Tan (2010) found the contrary
- the herding effect existed in both Shanghai and Shenzhen A- share markets but not in the B -
share markets. Yao, Ma, and He (2014) proposed that investors’ herding behavior exists and is
prevalent in the B-share markets, especially in the stocks of the largest and the smallest companies.
Academy of Accounting and Financial Studies Journal Volume 20, Number 1, 2016
58
Investor sentiment is another investors’ behavior that has been widely researched in
China’s stock markets. Li (2014) conducted a sentiment index with good productivity on China’s
stock markets. Chi, Zhuang, and Song (2012) indicated that investor sentiment has relatively
strong effects on stock market returns.
The research of Sanddorf-Kohle and Friedmann (2002) showed that “bad news” had
more of an impact on the A-share indices than “good news” yet Lee and Yeh (2000) found that
“good news” had larger impact on expected volatility on China’s stock markets than “bad news”.
Conclusion of Literature Review
China’s stock markets are still developing with imperfect regulations and high levels of
government intervention. The predictability also varied in previous researches and studies. There
are several research papers that used the neural network models to forecast China’s stock markets.
Some have normalized their data for analysis, including Liu and Wang (2012), Liu and Wang
(2011), and Wang, Pan and Liu (2012). Yet another research paper used Alyuda NeuroIntelligence
to forecast stock price fluctuations in the U.S. stock markets with data normalization (Tjung, Kwon
and Tseng, 2012). However, none of them have tested the forecasting estimation back to real
price changes (denormalized). Previous papers focusing on China’s stock markets used a limited
number of companies and only the major indices from China’s markets. For the U.S. stock
markets, however, Tjung, Kwon and Tseng (2012) forecast the price fluctuations of 37 stocks with
a larger data input, including 267 companies’ stocks. Hence, we are going to compare the
performance between Normalized and Denormalized data on neural networks with large
companies and indices data.
HYPOTHESES
In our previous paper (Kwon, Tjung, and Tseng, 2013), normalized data was utilized to
predict stock performance. First, we calculated the daily changes of the stock prices (Ci = Pi - Pi-
1), shifted all data to positive numbers by adding maximum change + 0.1 (added 0.1 to avoid a zero value), used this normalized data to train the NN models, then compared the NN output (estimated stock price daily changes in normalized data) to the actual stock price daily changes
in the normalized data. Finally, we calculated the differences of these two numbers (errors in
normalized data) as the performance measures.
However, further concerns were raised that measuring the difference of differences in
normalized data lost any physical meaning in stock prices; hence, our analysis did not have any
basis on statistical significance. Currently, there is a lack of existing literature regarding how to
address this issue. In this paper, we tried to denormalize our NN outputs and reverse the
normalization process we used. The mission is to demonstrate that the forecasting performance
using the Normalized Data (ND) and the Denormalized Data (DD) should produce the same result.
In order to make our job easier, we manually extracted 5% of the data for testing from the original
dataset before importing it to NeuroIntelligence. In this way, we did not have to hunt down each
row from the huge main dataset. If this hypothesis proved to be true, we would not have to does
this time-consuming denormalization process again in future research.
Academy of Accounting and Financial Studies Journal Volume 20, Number 1, 2016
59
Hypothesis
H
0 Forecasting performance using Normalized Data (ND) and Denormalized Data (DD) produce the
same result.
HA Forecasting performance using Normalized Data (ND) and Denormalized Data (DD) produce
different results.
METHODOLOGY
Data
The time period of this study ranges from the beginning of 2002 to the end of 2012 which
was considered a high volatile period. During this period, the dot-com bubble in late 2002, the
outbreak of SARS in 2003, the party leadership transitions in 2002 and 2012, global financial
crisis and economic recession since 2007, the Wenchuan earthquake and the Beijing Olympic
Games in 2008, all occurred. These historical events would inevitably have influences on the stock
markets in China and create difficulties for market performance forecasting. 18 companies were
selected as target companies from A-share of the Shanghai Stock Exchange. These companies
were distributed among 9 industry sectors, such as basic materials, conglomerates, consumer
goods, financial, healthcare, industrial goods, services, technology, and utilities. A total of 154
companies from A-share of the Shanghai Stock Exchange were downloaded from Yahoo Finance.
A data file containing 2,664 observations was generated to record the daily close prices of these
154 companies. Additionally, 25 indicators consisting of macroeconomic indicators, market
sentiment indicators, institutional investors, and microeconomic indicators were employed as
independent variables to forecast the stock price changes in China’s markets. One day before and
one day after national holidays in China were coded as dummy variables in training the forecasting
models. Data was collected through Yahoo Finance. (Refer to the Appendix for the full list of
indicators.)
NN Model
One of the most significant advantages of Neural Networks (NN) lies in its ability to
handle very large number of observations and variables. In this study we use five major
indicators: Aggregate indicators such as global market indices, individual competitors, US and
world market indices, market sentiment indicators, and institutional investors (Franklin
Resources). Data were collected from National Bureau of Economic Research, Yahoo Finance,
the Federal Reserve Banks, Market Vane, NYSE, and FXStreet. Altogether there are 181
variables and the detail can be found from the appendix.

Academy of Accounting and Financial Studies Journal Volume 20, Number 1, 2016
60
Figure 1
BASIC NEURAL NETWORK MODEL
a0 wj0
a1 wj1
a2 wj2 j Xj
wj3
a3
... … an wjn
n
S j ai w ji i 0
where:
wji = the weight associated with the connection to
processing unit j from processing unit i
ai = the value output by input unit i.
Output of j = Xj 0 if Sj ≤ 0 and 1 if Sj >0
Source: Dayhoff, J. (1990) Neural Network Architectures, New York: Van Nostrand Reinhold
A basic NN model’s framework is shown in Figure 1 above. Input neurons (1 to n) are connected to an output neuron j and each connection has an assigned weight (wjo to wjn). In this
example the output of j becomes 1 (activated) when the sum of the total stimulus (Sj) becomes great
than 0 (zero). The activation function in this example used a simple unit function (0 or 1), but other functions such as Gaussian, exponential, sigmoid, or hyperbolic functions can be used for complex networks.
Backpropagation is one of the most popular learning algorithms in NN and is derived to
minimize the error using the following formula:
E = 0.5 (p k
(tpk-opk)2)
where: p = the pattern i
k = the output unit
tpk = the target value of output unit k for patter p
Opk = the actual output value of output layer unit k for patter p.
Genetic Algorithm (GA) has the capabilities in pattern recognition, categorization, and
association and therefore it has been widely applied in NN. Turban (1992) has shown that a genetic
algorithm enables NN to learn and adapt to changes through machine learning for automatically
solving complex problems based on a set of repeated instructions. GA enables NN to produce
improved solutions by selecting input variables with higher fitness ratings. Alyuda
NeuroIntelligence enables us to retain the best network.
Variables Used
This research applied the BI software to forecast the fluctuations in China’s stock markets.
154 stocks were selected from 9 major sectors in China’s market. 18 companies were picked from the
154 companies as training targets for the BI software. For each training and forecasting, one of the
18 target companies would be treated as the dependent variable for the model training. The rest of the
153 companies, as well as the 25 indicators, would become independent variables as the input for
the BI software. In order to improve the accuracy of the NN models, the days pre-holiday and post-
holiday were added as dummy variables, which were categorical data as an input of the model
training. This research applied Alyuda NeuroIntelligence software to build the NN and forecasting
models.

Academy of Accounting and Financial Studies Journal Volume 20, Number 1, 2016
61
Table 1
LIST OF TERMS AND ABBREVIATIONS
Terms and Abbreviations Descriptions
Training Set The normalized data used for NeuroIntelligence to find the best architecture
then to optimize the model including training and validation.
Query Set The normalized data (5% manually extracted and separated) used for
NeuroIntelligence to calculate the estimated price changes.
Actual Price Change (APC) The daily changes of the stock prices (Ci = Pi - Pi-1) in Chinese currency
(Yuan)
Normalized Actual Price Change
(NAPC)
The normalized APC used for NeuroIntelligence to train the NN models
Normalized Estimated Price
Change (NEPC)
The query output from NeuroIntelligence on testing data; The testing data is
normalized so as the output.
Estimated Price Change (EPC) Denormalized the NEPC to calculate the Estimated Price Change in Chinese
currency (Yuan)
Error_DD The errors of Estimation using the actual data (APC - EPC)
Error_ND The errors of Estimation using the normalized data (NAPC - NEPC)
Training, Validation, and Testing Process
As this study focuses on comparing the differences of forecasting performance between the
normalized data and the denormalized data, the daily changes of actual stock prices were separated
into two data sets, including the Training set and the Query set. The original data was composed of
daily changes of the 154 companies’ stock prices and 25 indicators from 2002 to 2012. The
Query set contained 5% of the total data. More specifically, for every 20 days in the main data set,
the data of the 20th day was chosen as Query set data. The rest of the data would be the training
data in Training data set. The Training set was imported into the Alyuda NeuroIntelligence
software for the training of the NN models and to build a suitable model for the stock price
change forecasting. The Query set was used for testing the performance of the trained NN
models. Data from both the Training and the Query sets was normalized in the same method that
Tjung, Kwon and Tseng (2012) did in previous research on the U.S. stock markets. After the
processing and training of the Training set data in Alyuda NeuroIntelligence, the Query set data
would be put into the program to generate estimated results for forecasting. Finally, the estimated
results from the Query set would be denormalized for comparison.
Normalization and Denormalization Process
Since the real stock price differences could be either positive or negative, all numbers were
shifted to positive numbers to gain a better forecasting performance. The normalization method in
this study was based upon the previous research conducted by Tjung, Kwon and Tseng
(2012), which analyzed the forecasting performance of NN models on the U.S stock markets and
also applied Alyuda NeuroIntelligence as the media for processing. Furthermore, Tjung, Kwon

Academy of Accounting and Financial Studies Journal Volume 20, Number 1, 2016
62
and Tseng (2012) pointed out that the NN models generate a lower standard deviation than
traditional regression analysis do; meanwhile, the normalized data provided a better performance
than the non-normalized data in terms of NN models learning and forecasting.
For the process of normalization, we located the minimum value (Min) of each
company’s daily stock price changes, took its absolute value (ABS), and then added 0.1 to avoid a
zero value in the dataset. Hence the normalization value would be ((ABS (Min)) + 0.1). For
instance, if Company A’s minimum daily stock change is -3.4, the normalization value of
Company A’s data will be (ABS(-3.4) + 0.1) = 3.5. Then 3.5 would be added to all data from
Company A.
After the Normalized Estimated Price Change (NEPC) was generated from the Query
data set, the normalization value should be subtracted from NEPC to calculate the denormalized
value, and finally got the Estimated Price Change (EPC).
Model Training
We used the Alyuda NeuroIntelligence software to build the NN models and forecast the
fluctuations in China’s stock markets. Alyuda NeuroIntelligence can find the best architecture
for training through architecture searching function. We chose the best architecture (236-49-1)
with the highest fitness when the Stock 600000 was the training target. This architecture contained
236 input neurons, 49 hidden neurons and 1 output neuron, and it was applied to the analysis of the
other 17 target companies. Figure 2 below shows the best architecture with the highest fitness.
Figure 2
THE BEST ARCHITECTURE WITH THE HIGHEST FITNESS
We set 80% of the data for training and 20% for validation when training the network.
Each of the target companies trained twice with 1000 iterations in each training to find the best
model. After training was finished, the forecasting was performed for the same target company
in the Training data set. To calculate the performance of the trained NN models, we imported the

Academy of Accounting and Financial Studies Journal Volume 20, Number 1, 2016
63
Query data set into NeuroIntelligence; it then generated the Normalized Estimated Price Change
(NEPC) of the target company. A training result of a company 600009 after 2000 iterations is
shown in Figure 3 below. Due to the page limit, we removed the screen shots of training results for
all other companies.
Figure 3
TRAINING RESULT OF A COMPANY 600009 AFTER 2000 ITERATIONS

Academy of Accounting and Financial Studies Journal Volume 20, Number 1, 2016
64
ANALYSIS AND RESULTS
To test whether performance differences existed between the normalized data and the
denormalized data, we used the paired t-test on the Error of Estimation (Error_DD) and the Error
of Estimation using the normalized data (Error_ND). If the correlation between Error_DD and
Error_ND is equal to 1, we should not reject H0 in Hypothesis at any significant level. The
forecasting performance on the normalization data turned out to be exactly the same as the
forecasting performance on the actual price changing. The mean values and the variances are all
the same for Error_DD and Error_ND. Moreover, all correlation values are equal to 1, which
means that Error_ND and Error_DD are identical. Therefore, we could not reject HO in Hypothesis
at any significant level.
CONCLUSION AND FUTURE DIRECTION
During 2002 and 2012, the stock market in China showed high fluctuations and was
difficult to predict. Major events happened both domestically and internationally, such as the
dot-com bubble, the outbreak of SARS, the party leadership transitions, global financial crisis
and economic recession, the Wenchuan earthquake and the Beijing Olympic Games. It is widely
acknowledged that the influences of various pieces of information on stock prices are difficult to
measure in terms of duration and significance.
We are very glad that our mission of the paper was achieved successfully. The Mean of
Error_ND and the Mean of Error_DD for all 18 companies came out to be exactly the same
numbers. Since the Error_ND is the error of Estimation using normalized data (NAPC - NEPC)
and Error_DD is the error of Estimation (APC - EPC), we will get exactly the same results using
either the normalized data or denormalized data (in actual money value). This means that we do
not have to do the time consuming denormalization process for our estimated output generated
by the NeuroIntelligence models in future research. We also plan to expand our research to include
more techniques to build the best models for stock market forecasting.
REFERENCES
Cao, Q., Parry, M., & Leggio, K. (2011). The three-factor model and artificial neural networks: Predicting stock price
movement in China. Annals of Operations Research, 185(1), 25-44.
Cao, W., Han, Y., & Lam, S. (2013). Short-term stock price trend prediction of an emerging market using neural
networks. IIE Annual Conference. Proceedings, 50.
Chan, K., Fung, H., & Thapa, S. (2007). China financial research: A review and synthesis. International Review of
Economics & Finance, 16(3), 416-428.
Chen, X., Kim, K., Yao, T., & Yu, T. (2010). On the predictability of Chinese stock returns. Pacific-Basin Finance
Journal, 18(4), 403-425.
Chi, L., Zhuang, X., & Song, D. (2012). Investor sentiment in the Chinese stock market: an empirical analysis. Applied
Economics Letters, 19(4), 345-348.
Chiang, T., Li, J., & Tan, L. (2010). Empirical investigation of herding behavior in Chinese stock markets: Evidence
from quantile regression analysis. Global Finance Journal, 21(1), 111-124.
Chin, S., & Wang, C. (2004). Profitability of return and volume-based investment strategies in China's stock market.
Pacific-Basin Finance Journal, 12(5), 541−564.
Dai, W., Wu, J., & Lu, C. (2012). Combining nonlinear independent component analysis and neural network for the
prediction of Asian stock market indexes. Expert Systems with Applications, 39(4), 4444-4452.
Demirer, R., & Kutan, A. (2006). Does herding behavior exist in Chinese stock markets? Journal of International
Financial Markets, Institutions and Money, 16(2), 123-142.
Fama, E. (1970). Efficient Capital Market: A Review of Theory and Empirical Work. Journal of Finance, 25, 383-
417.

Academy of Accounting and Financial Studies Journal Volume 20, Number 1, 2016
65
Fan, J., Wong, T., & Zhang, T. (2007). Politically connected CEOs, corporate governance, and post-IPO performance
of China’s newly partially privatized firms. Journal of Financial Economics, 84(2), 330-357.
Firth, M., Rui, O., & Wu, X. (2009). The timeliness and consequences of disseminating public information by
regulators. Journal of Accounting and Public Policy, 28(2), 118-132.
Gordon, R., & Li, W. (2003). Government as a discriminating monopolist in the financial market: The case of China.
Journal of Public Economics, 87(2), 283-312.
Groenewold, N., Tang, S., & Wu, Y. (2003). The efficiency of the Chinese stock market and the role of the banks.
Journal of Asian Economics, 14(4), 593-609.
He, Z. (2000). Corruption and anti-corruption in reform China. Communist and Post-Communist Studies, 33(2), 243-
270.
Jiang, F. (2011). How predictable is the Chinese stock market?. n.p.: ProQuest, UMI Dissertations Publishing. Kang,
S., Cheong, C., & Yoon, S. (2010). Long memory volatility in Chinese stock markets. Physica A: Statistical
Mechanics and Its Applications, 389(7), 1425-1433.
Knight, J., & Yueh, L. (2008). The role of social capital in China’s urban labour market. Economics of Transition,
16(3), 389–414.
Kwon, O.; Tjung, L.; and Tseng, K. (2013) “Comparison Study of the Forecasting Performance of China and USA
Stocks’ Prices using Business Intelligence (BI),” the Proceedings of the 2013 Trilateral Conference, Seoul,
Korea, October 16-18, 2013, pp. 183-216.
Lee, C., & Rui, O. (2000). Does trading volume contain information to predict stock returns? evidence from China's
stock markets. Review of Quantitative Finance and Accounting, 14(4), 341−360.
Lee, T., & Yeh, Y. (2000). The Interaction and volatility asymmetry of unexpected returns in the greater China stock
markets. Global Finance Journal, 11(1/2), 129−149.
Li, B. (2014). Does investor sentiment predict stock returns? The evidence from Chinese stock market. Journal of
Systems Science and Complexity, 27(1), 130-143.
Li, X. (2003). China: Further evidence on the evolution of stock markets in transition economies. Scottish Journal of
Political Economy, 50(3), 341-358.
Li, X., & Zhang, B. (2013). Spillover and cojumps between the U.S. and Chinese stock markets. Emerging Markets
Finance & Trade, 49, 23-42.
Lim, T., Huang, W., Yun, J., & Zhao, D. (2013). Has stock market efficiency improved? evidence from China. Journal
of Finance & Economics, 1(1), 1-9.
Liu, F., & Wang, J. (2012). Fluctuation prediction of stock market index by legendre neural network with random time
strength function. Neurocomputing, 83, 12-21.
Liu, H., & Wang, Jun. (2011). Integrating independent component analysis and principal component analysis with
neural network to predict Chinese stock market. Mathematical Problems in Engineering, 2011.
Lu, L. (2004). What motivate investors to sell? Evidence from China’s stock market. n.p.: ProQuest, UMI Dissertations
Publishing.
Ma, S., & Barnes, M. (2001). Are China’s stock markets really weak-form efficient? Centre for International Economic
Studies, Discussion paper, No. 0119.
Meng, D. (2008) A neural network model to predict initial return of Chinese SMEs stock market initial public offerings.
2008 IEEE International Conference on Networking, Sensing and Control, 394-398.
Putterman, L. (1993). Incentive problems favoring noncentralised investment fund ownership. In P. K. Bardhan & J. E.
Roemer (Eds.), Market socialism (pp. 156–168). New York: Oxford University Press.
Riedel, J., Jin, J., & Gao, J. (2007). How China grows: Investment, finance, and reform. Princeton, N.J.: Princeton
University Press.
Sanddorf-Köhle, W., & Friedmann, R. (2002). Volatility clustering and nontrading days in Chinese stock markets.
Journal of Economics and Business, 54, 193−217.
Shanghai Securities News and State Information Centre (SSNSIC) (2003). 2002 annual report of listed companies.
Available from http://www.cnstock.com/ssnews/2003-5-26/default.htm [in Chinese].
Shleifer, A., & Vishny, R. (1994). Politicians and firms. The Quarterly Journal of Economics, 109(1), 995–1025.
Su, D. (1998). Risk, return and regulation in Chinese stock markets. Journal of Economics and Business, 50(3),
239−256.
Sun, Q., & Tong, W. (2003). China share issue privatization: The extent of its success. Journal of Financial
Economics, 70(2), 183−222.
Tjung, L. C., Kwon, O., & Tseng, K.C. (2012). Comparison study on neural network and ordinary least squares model
to stocks’ prices forecasting. Academy of Information and management Sciences Journal, 15 (1), 1-35.

Academy of Accounting and Financial Studies Journal Volume 20, Number 1, 2016
66
FTSE 100 FTSE Index Price
HIS Hang Seng Index
IPC (MXX) Mexico Index
JKSE Jakarta Stock Exchange Index
KLSE FTSE Bursa Malaysia Klci
KOSPI Kospi Composite Index
MERV Merval Buenos Aires Index
N225 Nikkei 225
BSE Sensex Bombay Stock Exchange Sensex
SMI Swiss Market Index
STI Straits Times Index Singapore
TSEC Taiwan Weighted Index
Tondkar, R., Peng, S., & Hodgdon, C. (2003). The Chinese securities regulatory commission and the regulation of
capital markets in China. Advances in International Accounting, 16(1), 153-174. Varela, O., & Wei, Z. (2002). Ownership and performance in Chinese manufacturing industry. Journal of Multinational
Financial Management, 12(1), 61−78.
Vickers, J., & Yarrow, G. (1988). Privatization: An economic analysis. Cambridge, MA: The MIT Press.
Wang, J., Pan, H., & Liu, F. (2012). Forecasting crude oil price and stock price by jump stochastic time effective neural
network model. Journal of Applied mathematics, 2012.
Wang, M., Qiu, C., & Kong, D. (2011). Corporate social responsibility, investor behaviors, and stock market returns:
Evidence from a natural experiment in China. Journal of Business Ethics, 101(1), 127-141.
Watanabe, M. (2002). Holding company risk in China: A final step of state-owned enterprises reform and an emerging
problem of corporate governance. China Economic Review, 13(1), 373 −381.
Wei, J., Huang, J., & Hui, P. (2013). An agent-based model of stock markets incorporating momentum investors.
Physica A-Statistical Mechanics and Its Applications, 392(12), 2728-2735.
Wu, F. (2013). Do stock prices underreact to information conveyed by investors’ trades? Evidence from China. Asia-
Pacific Journal of Financial Studies, 42(3), 442-466.
Xu, X., & Wang, Y. (1999). Ownership structure and corporate governance in Chinese stock companies. China
Economic Review, 10(1), 75−98.
Yao, J., Ma, C., & He, W. (2014). Investor herding behavior of Chinese stock market. International Review of
Economics & Finance, 29, 12-29.
Yao, Y., & Yueh, L. (2009). Law, finance, and economic growth in China: an introduction. World Development [H.W.
Wilson – SSA], 37(4), 753.
Zhang, H., Wei, J., & Huang, J. (2014). Scaling and predictability in stock markets: A comparative study. PloS One,
9(3), e91707-e91704.
Zhang, L. (2004). The roles of corporatization and stock market listing in reforming China’s state industry. World
Development, 32(12), 2031-2047.
Table A.1. Macroeconomic Indicators
Source: YahooFinance
APPENDIX
000001.ss SSE Composite Index
Shenzhen-A Shenzhen Index A
Shenzhen-B Shenzhen Index B
S&P 500 Standard & Poor’s 500
DIA Dow Jones Industrial Average ETF
AEX Amsterdam Price
ATX Vienna Stock Exchange
BSVP Bovespa-Brazillian Index
CAC 40 Paris Price
DAX German Index

Academy of Accounting and Financial Studies Journal Volume 20, Number 1, 2016
67
600230 Hebei Cangzhou Dahua Co.,Ltd
600231 Lingyuan Iron & Steel Co., Ltd
600255 Anhui Xinke New Materials Co., Ltd.
600256 Xinjiang Guanghui Industry Co., Ltd.
600281 Taiyuan Chemical Industry Co., Ltd
600282 Nanjing Iron & Steel Co.,Ltd.
600291 Xishui Strong Year Co.Ltd Inner Mongolia
600293 Hubei Sanxia New Building Materials Co.,
600301 Nanning Chemical Industry Co., Ltd
600307 Gansu Jiu Steel Group Hongxing Iron
600311 Gansu Ronghua Industry Group Co., Ltd.
600318 Anhui Chaodong Cement Co., Ltd
600319 Weifang Yaxing Chemical Co., Ltd.
600331 Sichuan Hongda Co., Ltd
600333 Changchun Gas Co., Ltd
600339 Xinjiang Dushanzi Tian Li High & New Tech Co
600367 Guizhou Redstar Developing Co., Ltd
600378 Sichuan Tianyi Science & Tech. Co., Ltd
600381 Qinghai Sunshiny Mining Co., Ltd.
600390 Kingray New Materials Science & Tech Co
600395 Guizhou Panjiang Refined Coal Co., Ltd
600399 Fushun Special Steel Co., Ltd.
CONGLOMERATES
600149 C & T Technology Development Co. Ltd
600200 Jiangsu Wuzhong Industrial Co., Ltd
600212 Shandong Jiangquan Industry Co., Ltd
600260 Kaile Science and Tech. Co.,Ltd. Hubei
CONSUMER GOODS
600006 Dongfeng Automobile Co., Ltd
600073 Shanghai Mailing Aquarius Co., Ltd
Table A.2. Market Sentiment Indicators
Source: Yahoo Finance
VIX CBOE Volatility Index
VXO CBOE OEX Volatility Index
Table A.3. Institutional Investor
Source: Yahoo Finance
BEN Franklin Resources Inc.
Table A.4. Microeconomic Indicators
Source: Yahoo Finance
Symbol X Variables – Company name
BASIC MATERIALS
600019 Baoshan Iron & Steel Co., Ltd.
600028 China Petroleum & Chemical Corporation
600075 Xinjiang Tianye Co.,Ltd
600078 Jiangsu Chengxing Phosph-Chemicals Co.
600091 Baotou Tomorrow Technology Co., Ltd
600111 Inner Mongolia Baotou Steel Rare-Earth
600117 Xining Special Steel Co.,Ltd
600123 Shanxi Lanhua Sci-Tech Venture Co Ltd
600139 Sichuan Western Resources Hld Co., Ltd
600165 Ning Xia Heng Li Steel Wire Rope Co.Ltd
600172 Henan Huanghe Whirlwind Co., Ltd.
600176 China Fiberglass Co., Ltd.
600179 HeiLongJiang HeiHua Co., Ltd.
600188 Yanzhou Coal Mining Company Limited
600219 Shandong Nanshan Aluminum Co., Ltd.

Academy of Accounting and Financial Studies Journal Volume 20, Number 1, 2016
68
600365 Tonghua Grape Wine Co., Ltd
600400 Jiangsu Hongdou Industry Co.,Ltd
600419 Xinjiang Tianhong Papermaking Co., Ltd.
FINANCIAL
600000 Shanghai Pudong Development Bank Co. Ltd
600007 China World Trade Center Co. Ltd.
600016 China Minsheng Banking Corporation Ltd.
600052 Zhejiang Guangsha Co., Ltd.
600061 Sinotex Investment & Development Co.
600109 Sinolink Securities Co., Ltd.
600162 Shenzhen Heungkong Holding Co., Ltd.
600193 Xiamen Prosolar Realestate Co.,Ltd
600215 Changchunjingkai (Group) Co., Ltd.
600223 Lushang Property Co., Ltd.
600239 YunNan Metropolitan Real Estate Devel Co
600240 Beijing Huaye Real Estate Co., Ltd
600275 Hubei Wuchangyu Co., Ltd
600322 Tianjin Realty Development (Group)Co Ltd
HEALTHCARE
600055 Beijing Wandong Medical Equipment Co Ltd
600062 Beijing Double-Crane Pharmaceutical Co.
600079 Wuhan Humanwell Hi-tech Ind. Co., Ltd.
600080 Ginwa Enterprise (Group) Inc.
600085 Beijing Tongrentang Co., Ltd.
600195 China Animal Husbandry Industry Co., Ltd
600201 Inner Mongolia Jinyu Group Co Ltd
600211 Tibet Rhodiola Pharmaceutical Holding Co
600216 Zhejiang Medicine Co., Ltd.
600267 Zhejiang Hisun Pharmaceutical Co., Ltd.
600297 Merro Pharmaceutical Co.,Ltd.
600074 Jiangsu Zhongda New Material Grp Co Ltd
600084 Citic Guoan Vine Co.,Ltd.
600086 Hubei Eastern Gold Jade Co., Ltd.
600090 Xin Jiang Hops Co., Ltd.
600093 Sichuan Hejia Co., Ltd
600097 ShangHai Kaichuang Marine Int'l Co.,Ltd
600103 Fujian Qingshan Paper Industry Co., Ltd
600108 Gansu Yasheng Industrial (Group) Co. Ltd
600127 Hunan Jinjian Cereals Industry Co., Ltd.
600132 Chongqing Brewery Co., Ltd
600156 Hunan Huasheng Co., Ltd.
600166 Beiqi Foton Motor Company Limited
600177 Youngor Group Co., Ltd.
600182 Giti Tire Corporation
600186 Henan Lotus Gourmet Powder Inc.
600191 Baotou Huazi Industry Co., Ltd
600197 Xinjiang Yilite Industry Co., Ltd.
600202 Harbin Air Conditioning Co Ltd
600220 Jiangsu Sunshine Co., Ltd
600232 Zhejiang Golden Eagle Co., Ltd
600233 Dalian Dayang Trands Co., Ltd
600257 Dahu Aquaculture Co.,Ltd.
600261 Zhejiang Yankon Group Co., Ltd.
600265 Yunnan Jinggu Forestry Co., Ltd.
600298 Angel Yeast Co., Ltd.
600300 V V Food & Beverage Co., Ltd
600303 Liaoning SG Automotive Group Co., Ltd.
600308 Shandong Huatai Paper Company Limited
600337 Markor International Furniture Co., Ltd.
600356 Mudanjiang Hengfeng Paper Co., Ltd

Academy of Accounting and Financial Studies Journal Volume 20, Number 1, 2016
69
600270 Sinotrans Air Transportation Devel. Co
600272 Shanghai Kai kai Industrial Company Ltd.
600278 Orient International Enterprise, Ltd.
600279 Chongqing Gangjiu Co., Ltd
600306 Shenyang Commercial City Co. Ltd
600361 Beijing Hualian Hypermarket Co., Ltd.
600382 Guangdong Mingzhu Group Co., Ltd.
TECHNOLOGY
600100 Tsinghua Tongfang Co., Ltd
600130 Ningbo Bird Co. , Ltd .
600151 Shanghai Aero Auto Electromechanical
600185 Xi' An Seastar Modern-Tech Co., Ltd.
600198 Datang Telecom Technology Co., Ltd
600288 Daheng New Epoch Technology, Inc.
600330 TDG Holding Co., Ltd.
600345 Wuhan Yangtze Communication Industry
600360 Jilin Sino-Microelectronics Co., Ltd
600366 Ningbo Yunsheng Co., Ltd.
600498 Fiberhome Telecommunication Tech. Co. Ltd
UTILITIES
600101 Sichuan Mingxing Electric Power Co., Ltd
600168 Wuhan Sanzhen Industry Holding Co., Ltd
600207 Henan Ancai Hi-tech Co., Ltd
600283 Qian Jiang Water Resources Development
600292 Chongqing Jiulong Electric Power Co. Ltd
600310 Guangxi Guidong Electric Power Co., Ltd
600396 Shenyang Jinshan Energy Co., Ltd
600380 Joincare Pharmaceutical Group Ind. Co.
600385 Shandong Jintai Group Co.,Ltd.
600466 Sichuan Di Kang Sci&Tech Pharm. Ind. Co.
600488 Tianjin Tianyao Pharmaceutical Co., Ltd
INDUSTRIAL GOODS
600089 TBEA Co., Ltd
600150 China CSSC Holdings Limited
600169 Taiyuan Heavy Industry Co., Ltd.
600243 QingHai HuaDing Industrial Co., Ltd.
600290 Huayi Electric Co., Ltd.
600302 Xi'an Typical Industries Co.,Ltd.
600320 Shanghai Zhenhua Heavy Industry Co.,Ltd
600335 Dingsheng Tiangong Const. Mach. Co., Ltd
600388 Fujian Longking Co., Ltd
SERVICES
600009 Shanghai International Airport Co., Ltd.
600051 Ningbo United Group Co. , Ltd.
600054 Huangshan Tourism Development Co., Ltd
600115 China Eastern Airlines Corporation Ltd.
600122 Jiangsu Hongtu High Technology Co., Ltd.
600125 China Railway Tielong Container Log. Co.
600136 Wuhan Double Co.,Ltd
600138 China CYTS Tours Holding Co., Ltd
600190 Jinzhou Port Co., Ltd.
600203 Fujian Furi Electronics Co., Ltd.
600221 Hainan Airlines Co., Ltd.
600241 Liaoning Shidai Wanheng Co.Ltd
600242 Guangdong Hualong Groups Ltd. Co.
600250 Nanjing Textiles Import & Export Corp.
600258 Beijing Capital Tourism Co., Ltd

Academy of Accounting and Financial Studies Journal Volume 20, Number 1, 2016
70
A CANONICAL RANKING OF THE DETERMINANTS OF
SHARE PRICE LIQUIDITY
Bruce C. Payne, Barry University
Jana Rutherford, Barry University
Anthony Sadler, Barry University
ABSTRACT
Share price liquidity has been a favored topic in financial research and business journals
for years. Many previous studies have been concerned with the speed and sureness with which a
share of common stock can be turned into cash. Most investors, and surely the less sophisticated
investors, feel the need to abandon a stock position when the market or the value of that security
falls. Thus, the liquidity of their holdings is paramount to some investors. However, more often than
not, the abandonment of a stock position when the value of the security falls is too late. If indeed the
security was a good investment when it was purchased, many investors will stay with the security
expecting recovery. Institutional investors are less concerned with liquidity and have more patience
with small fluctuations in price. Regardless, no investor, including institutional investors, will buy
any security unless they have assurance that if the need arises, they can sell those securities.
Companies experience different demand for their equity shares and thus different levels of liquidity.
That demand is a function of the perception of investors who are willing and able to buy. Those
investors trade off basic measures of risk and return to establish that demand. The purpose of this
study is to create a financial risk-return profile of those firms with the highest share price liquidity,
to compare that profile with companies selected at random, and to rank those factors that influence
share price liquidity. As in previous studies of this nature those factors are analyzed using multiple
discriminant analysis, and ranked with canonical correlation.
INTRODUCTION
A major purpose of all secondary markets is to provide liquidity for the securities traded on
those markets. Thus, organized exchanges add efficiency to the market, and they add to the level of
liquidity for shares traded on those markets. There have been many studies on the subject of share
price liquidity. Kemp (2014) explained clearly how share price liquidity (SPL) would be of
paramount importance to traders, but of less importance to “true investors.” In addition, he
provided alternative methods of computing SPL and raised the question: Do illiquid stocks
typically trade at lower prices? His finding was that while it appears that such discounts do exist,
quantifying them is difficult. Amihud, et al. (2005) reviewed the theories on how liquidity affects
the required returns of capital assets, and the empirical studies that test those theories. The
authors found that theory predicts that the level of liquidity is priced, and further that the results
of empirical studies found that the effects of liquidity on asset prices to be statistically significant
and economically important (Amihud, et al. (2005). It would not be difficult to argue that no
investor, including institutional investors, will buy any security unless they have assurance that if
the need arises, they can sell those securities.
The metric used in this study to measure share price liquidity is the share turnover ratio
(STR). It may be defined as:

Academy of Accounting and Financial Studies Journal Volume 20, Number 1, 2016
71
STR = The Average Daily Trading Volume / The total number of outstanding shares minus those
shares owned by insiders and treasury stock retained by the company (Kemp 2014). (1)
Where:
The average trading volume can be the average for the past 30 days or the past 10 days.
Both averages are given by Yahoo Finance.
Issuing companies experience different levels of demand for their equity shares and thus
different levels of liquidity. That demand is a function of the perception of investors at the
margin (those who are willing and able to buy). Those investors trade off basic measures of risk
and return to establish that demand.
The purpose of this study is to establish a financial profile of those firms identified as
having the highest share turnover ratios in the database of over 5000 firms created by
(Damodaran 2014) from Bloomberg, Morningstar and Compustat. Specifically, the analysis will
test for significant differences in the financial profiles of firms with the highest share turnover
ratios and to compare those profiles with companies selected at random. If the two groups of
firms have unique financial profiles, and the model can be validated without bias, it suggests that
the profile may be used as a tool to forecast companies that will maintain high STR in future
periods. The use of such a new tool to forecast higher levels of liquidity would have implications
for investors, managers, lenders, investment counselors, and academicians.
METHODOLOGY
The issues to be resolved are first, classification or prediction, and then evaluation of the
accuracy of that classification. More specifically, can firms be assigned, on the basis of selected
financial variables, to one of two groups: (1) firms that were identified as having the highest
share turnover ratios in their database simply referred to here as highest (HSTR) or, Firms
Randomly Chosen (FRC)? That is, the firms with the very highest ratios in the database were
compared firms that were randomly chosen from that same database that did not qualify for the
HSTR group.
Multiple Discriminant Analysis (MDA) provides a procedure for assigning firms to
predetermined groupings based on variables or attributes whose values may depend on the group
to which the firm actually belongs, and canonical correlation ranks those variables in order of
their weighted effects on the results of the analysis. If the purpose of the study were simply to
establish a financial profile of each group of firms, simple ratios would be adequate. However, as
early as 1968, in a seminal paper on the use of MDA in finance, Altman showed that sets of
variables used in multivariate analysis were better descriptors of the firms, and had more
predictive power than individual variables used in univariate tests.
The use of MDA in the social sciences for the purpose of classification is well known.
MDA is appropriate when the dependent variables are nominally or ordinally measured and the
predictive variables are metrically measured. In addition to its use in the Altman study to predict
corporate bankruptcy, other early studies used MDA to predict financially distressed property-
liability insurance firms (Trieschmann and Pinches 1973), to determine value (Payne 2010), and
the failure of small businesses (Edmister 1982). This study also employs nominally measured
dependent variables and metrically measured predictive variables. The nominally measured
dependent variables are the group of high HSTR firms and the group of FRC firms. The
computer program used to perform the analysis is SPSS 21.0 Discriminant Analysis (SPSS Inc.

Academy of Accounting and Financial Studies Journal Volume 20, Number 1, 2016
72
2012). Since the objective of the analysis is to determine the discriminating capabilities of the
entire set of variables without regard to the impact of individual variables, all variables were
entered into the model simultaneously. This method is appropriate since the purpose of the study
was not to identify the predictive power of any one variable, but instead the predictive power of
the entire set of independent variables (Hair, et al. 1992).
SELECTION OF SAMPLE AND INDEPENDENT VARIABLES
Given the conclusions of Kemp (2014), (Amihud, et al. (2005) and others, that the results
of empirical studies found that the effects of liquidity on risk and asset prices to be statistically
significant and economically important, the share price liquidity is used here as a subject of this
study.
All data used in the analysis were gathered from Domodaran’s 2014 set. The sample
selected for this study consists of two groups. The high stock turnover ratio group contains 1016
observations and the FRC group has 603 observations. The sample is large enough that as long as
the variance covariance matrices are equal, it renders the difference in the size of the groups
insignificant, and of course, the sample gathered simply exhausted Domodaran’s database in the
HSTR category.
Previous studies using this and other statistical methods have chosen explanatory variables
by various methods and logical arguments. In this study the group of explanatory variables chosen
for analysis includes one measure of size, one measure of how the company may be perceived by
investors at the margin, two measures of return, or potential return on investment and finally three
measures of risk. An evaluation of those measures is needed to accomplish the purpose of this
study. A basic tenet of this study is that all investors “trade off” indicators of risk and return to
establish the value of the firms.
Following are the seven explanatory variables:
X1 Investors may perceive that the larger the firm, the more well-known it would be, and thus the more liquid
the shares. However, the greater the number of outstanding shares, the greater will be the number of
investors required to maintain the intrinsic value in share price. Given the efficiency of today’s markets,
and the speed with which good and bad news is absorbed into the market, large firms may not have a share
liquidity advantage over small and mid-sized firms. There is very little literature regarding size effects on
share price liquidity. However, there is an aprori expectation that larger firms will experience greater
share price liquidity. The measure of size used in this study is the market capitalization.
X2 The enterprise value multiple is included here as a measure of how investors in the market perceive the
firm. It has been described as how much an acquiring from would have to pay to take over a company, and
that number is divided by the company’s latest earnings before interest and taxes plus depreciation and
amortization (EBITDA). It is more commonly referred to as the enterprise value multiple, and it is said to
be roughly analogous to the payback period. Reese (2013) offered the opinion that the significance of the
enterprise value multiple (EVM) lies in its ability to compare companies with different capital structures,
and that by using the EVM instead of market capitalization to look at the value of a company, investors get
a more accurate sense of whether or not a company is truly valued.
X3 One measure of return is return to total capital. Return to total capital includes a return to creditors as
well as owners, and recognizes that value is affected by the cost of debt. A measure of return to equity
could be used, but it would ignore the cost of debt and the fact that debt as well as equity is used to finance
assets. This is consistent with the use of the debt to total capital ratio as a measure of financial leverage.

Academy of Accounting and Financial Studies Journal Volume 20, Number 1, 2016
73
X4 Growth may also be regarded as a return on capital, and indeed growth has been of interest to financial
investors for years, and all investors as well as financial managers value expected growth more than historical
growth. In this study Damodaran’s (2014) expected five-year change in earnings per share was used.
X5 There is in any company both financial risk (financial leverage) and operating risk (operating leverage).
Sharpe’s beta coefficients contain the effects of both operating and financial risk. It is customary in modern
research to separate the two types of risk to identify and compare the sources of risk. The separation is
accomplished by using Hamada’s (1972) equation to “unlever” the published betas. Damodran (2014)
used that equation to unlever the “bottom up” sector betas. Those betas are used here as a measure of
operating leverages (operating risk that results from fixed operating costs).
X6 Financial leverage (financial risk resulting from fixed finance costs) is measured here by use of the long
term debt to total invested capital ratio (DTC). That ratio is used here as a measure of financial leverage.
There are other ratios that measure financial risk very well, but the long-term debt to total capital ratio
again recognizes that the firm is financed by creditors as well as owners.
X7 The seventh explanatory variable is the coefficient of variation in earnings before interest and taxes (EBIT).
The coefficient of variation (CV) standardizes the relative variance in EBIT among companies, and allows
comparison of those variances in relation to the expected value of EBIT for each company in the dataset. The
greater the CV, the greater is the risk in relation to the expected EBIT. Thus, it is included here as a measure of
a different type of risk than indicated by the above two leverage ratios.
In sum, there are seven explanatory variables in the multiple discriminant model. They are as
follows:
X1 - Market Capitalization (Size)
X2 - The Enterprise Value Multiple
X3 - Return on Total Capital
X4 - The Five Expected Year Growth Rate
X5 - The Bottom Up Unlevered Sector Beta (Operating Risk)
X6 - Long Term Debt to Total Capital (Financial Risk)
X7 - The Coefficient of Variation in EBIT
The explanatory variable profile contains basic measures of common financial variables.
They were chosen, as in any experimental design, because of their consistency with theory,
adequacy in measurement, the extent to which they have been used in previous studies, and their
availability from a reputable source. Other explanatory variables could have been added, however
their contributions to the accomplishment of the stated purpose of the study would have been
negligible. When there are a large number of potential independent variables that can be used, the
general approach is to use the fewest number of explanatory variables that accounts for a
sufficiently large portion of the discrimination procedure (Zaiontz 2014). The more accepted
practice is to use only the variables that logically contribute to the accomplishment of the study’s
purpose (Suozzo 2001). This study is consistent with both references.
TESTS AND RESULTS
The discriminant function used has the form:
Zj = V1X1j+V2X2j+..…+VnX nj (2)

Academy of Accounting and Financial Studies Journal Volume 20, Number 1, 2016
74
Where:
Xij is the firm’s value for the ith independent variable.
Vi is the discriminant coefficient for the firm’s jith variable.
Zj is the jth individual’s discriminant score.
The function derived from the data in this study and substituted in equation 1 is:
Zj = - 2.319 + .0001X1 + .0001X2 + .0073 + .031X4 + 2.552X5 + .005X6 - 13.675X7 (3)
Classification of firms is relatively simple. The values of the seven variables for each
firm are substituted into equation (5). Thus, each firm in both groups receives a Z score. If a
firm’s Z score is greater than a critical value, the firm is classified in group one high (HSTR).
Conversely, a Z score less than the critical value will place the firm in group two (FRC). Since
the two groups are heterogeneous, the expectation is that HSTR firms will fall into one group
and the FRC firms will fall into the other. Interpretation of the results of discriminant analysis is
usually accomplished by addressing four basic questions:
1. Is there a significant difference between the mean vectors of explanatory variables for the two groups of firms?
2. How well did the discriminant function perform?
3. How well did the independent variables perform?
4. Will this function discriminate as well on any random sample of firms as it did on the original sample?
To answer the first question, SPSS provides a Wilk’s Lamda – Chi Square transformation
(Sharma 1996). The calculated value of Chi-Square is 17.78. That exceeds the critical value of Chi-
Square 14.067 at the five percent level of significance with 7 degrees of freedom. The null
hypothesis that there is no significant difference between the financial profiles of the two groups is
therefore rejected, and the first conclusion drawn from the analysis is that the two groups have
significantly different financial characteristics. This result was of course, expected since one group
of firms experienced very high free cash flow yields and the other group was chosen randomly. The
discriminant function thus has the power to separate the two groups. However, this does not mean
that it will in fact separate them. The ultimate value of a discriminant model depends on the results
obtained. That is what percentage of firms was classified correctly and is that percentage
significant?
To answer the second question a test of proportions is needed. The firms that were
classified correctly are shown on the diagonal in Table I. Of the total of 1,619 firms in the dataset
1,016 or 62.8 percent were classified correctly.
Table 1
CLASSIFICATION RESULTS
Predicted Results
HSTR - FRC Classification
Actual Results HSTR FRC
HSTR 974 574
FRC 29 42

Academy of Accounting and Financial Studies Journal Volume 20, Number 1, 2016
75
To determine whether 62.8 percent is statistically significant, formal research requires
the proof of a statistical test. In this case, the Press’s Q test is appropriate (Hair, et al. 1992, 106).
Press’s Q is a Chi-square random variable:
Press’s Q = [N-(n x k)]2 / N(k-1) (4)
where:
N = Total sample size
n = Number of cases correctly classified
k = Number of groups
In this case:
Press’s Q = [1619 - (1016 x 2)]2
/ [1619 (2-1)] = 105.35 > 2.05 3.84 with one d. f. (5)
Thus, the null hypothesis that the percentage classified correctly is not significantly different
from what would be classified correctly by chance is rejected. The evidence suggests that the
discriminant function performed very well in separating the two groups. Again, given the disparity
of the two groups, and the sample size, it is not surprising that the function classified 62.8 percent
correctly.
The arithmetic signs of the adjusted coefficients in Table 2 are important to answer question
number three. Normally, a positive sign indicates that the greater a firm’s value for the variable, the
more likely it will be in group one, the HSTR group. On the other hand, a negative sign for an
adjusted coefficient signifies that the greater a firm’s value for that variable, the more likely it will
be classified in group two, the FRC group. Thus, according to Table 2, the greater the following
variables: The size of the firm, The return to total capital, the degree of operating risk, the five year
expected growth rate, and the enterprise value multiple, the more likely the firm would have
achieved a higher level of share price liquidity. Conversely, the greater the variance in EBIT, and
the greater the level of financial leverage less likely the firm would have achieved a high level of
share price liquidity.
The relative contribution of each variable to the total discriminating power of the
function is indicated by the discriminant loadings, referred to by SPSS as the pooled within-
groups correlations between discriminating variables and canonical function coefficients, or
more simply their structure matrix. Those structure correlations are indicated by canonical
correlation coefficients that measure the simple correlation between each independent variable
and the Z scores calculated by the discriminant function. The value of each canonical coefficient
will lie between +1 and -1. Multicollinearity has little effect on the stability of canonical
correlation coefficients, in contrast to the discriminant function coefficients where it can cause
the measures to become unstable. (Sharma 1996, 254). The closer the absolute value of the
loading to 1, the stronger the relationship between the discriminating variable and the
discriminant function These discriminant loadings are given in the output of the SPSS 21.0
program, and shown here with their ranking in Table 2.

Academy of Accounting and Financial Studies Journal Volume 20, Number 1, 2016
76
Table 2
RELATIVE CONTRIBUTION OF THE VARIABLES
Discriminant Variables Coefficient Rank
Market Capitalization (Size) .518 1
Return on Total Capital .493 2
The Unlevered Sector Beta (Operating Risk) .447 3
The Coefficient of Variation in EBIT -.408 4
The Five Year Expected Growth Rate -.287 5
Long Term Debt to Total Capital (Financial Risk) -.179 6
The Enterprise Value Multiple
.093 7
Table 2 reveals that market capitalization, the measure for size made the greatest
contribution to the overall discriminating function. It is followed respectively by the measure return
to total capital, the measure of operating risk, the coefficient of variation for EBIT, the five year
expected growth rate, the measure for financial leverage, and finally the enterprise value multiple.
Some multicollinearity may exist between the predictive variables in the discriminant function,
since both return and risk could be reflected in the institutional investors buying activity. Hair, et al.
(1992) wrote that this consideration becomes critical in stepwise analysis and may be the factor
determining whether a variable should be entered into a model. However, when all variables are
entered into the model simultaneously, the discriminatory power of the model is a function of the
variables evaluated as a set and multicollinearity becomes less important. More importantly, the
rankings of explanatory variables in this study were made by the canonical correlation coefficients
shown in Table 2. As discussed the previous paragraph, those coefficients are unaffected by
multicollinearity (Sharma, 1996).
VALIDATION OF THE MODEL
Before any general conclusions can be drawn, a determination must be made on whether
the model will yield valid results for any group of randomly drawn firms. The procedure used
here for validation is referred to as the Lachenbruch or, more informally, the “jackknife” method.
In this method, the discriminant function is fitted to repeatedly drawn samples of the original
sample. The procedure estimates (k – 1) samples, and eliminates one case at a time from the
original sample of “k” cases (Hair, et al. 1992). The expectation is that the proportion of firms
classified correctly by the jackknife method would be less than that in the original sample due to
the systematic bias associated with sampling errors. In this study there was a difference of only
two firms. At first glance a reader might conclude that it is unusual to complete an analysis of
this size and have a difference of only eight firms between the two groups. However, with a very
large sample such as the 1619 companies used in this study, the differences seem to diminish.
The major issue is whether the proportion classified correctly by the validation test differs
significantly from the 62.8 percent classified correctly in the original test. That is, is the
difference in the two proportions classified correctly by the two tests due to bias, and if so is that
bias significant? Of course, it may be obvious that a difference of only eight cases will not be
significant with a sample of 1619 companies. However, as in the aforementioned case of the
Press’s Q test of proportions, formal research requires the proof of a statistical test. The jackknife
validation resulted in the correct classification of 62.3 percent of the firms. Since there are only
two samples for analysis the binomial test is appropriate:

Academy of Accounting and Financial Studies Journal Volume 20, Number 1, 2016
77
t = r – n p / [n p q] 1/2
(6)
Where:
t is the calculated t statistic
r is the number of cases classified correctly in the validation test.
n is the sample size.
p is the probability of a company being classified correctly in the original test.
q is the probability that a firm would be misclassified in the original test.
In this case: 1008 - 1619 (.628) / [1619 (.628) (.372)] ½ = - .045 is less than t05 1.645. (7)
Thus, the null hypothesis that there is no significant difference between the proportion of
firms classified correctly in the original test and the proportion classified correctly in the validation
test cannot be rejected. Therefore, it can be concluded that while there may be some bias in the
original analysis, it is not significant and it is concluded that the procedure will classify new firms as
well as it did in the original analysis.
In addition to the validation procedure, researchers usually address the question of the
equality of matrices. This is especially important in studies such as this where there is disparity
in the size of the groups. One of the assumptions in using MDA is that the variance-covariance
matrices of the two groups are equal. The SPSS program tests for equality of matrices by means
of Box’s M statistic. In this study Box’s M transformed to the more familiar F statistic of 25.95
resulted in a zero level of significance. Thus, the null hypothesis that the two matrices are equal
cannot be rejected.
SUMMARY AND CONCLUSIONS
The purpose of this study was to establish a financial profile of those firms identified as
having the highest share price liquidity in the database of 1619 firms created by (Damodaran
2014). Specifically, the analysis tested for significant differences in the financial profiles of firms
with the highest share turnover ratios and to compare those profiles with companies selected at
random. In this study the group of explanatory variables chosen for analysis includes one measure
of size, one measure of how the company may be perceived by investors at the margin, two
measures of return, or potential return on investment and finally three measures of risk. Investors at
the margin “trade off” these and other indicators of risk and return to buy and sell securities. It is the
buying and selling of those investors that establish the market value of both equity and debt.
The results of the statistical analysis indicated first, that there was a significant difference in
the financial profiles of the two groups of firms. The fact that the discriminant function separated
two heterogeneous groups, and classified a significant proportion correctly is no surprise. In fact, the
two groups of firms were so diverse in the matter of achieving share price liquidity that it would
certainly have been a surprise if the discriminant function had not been so efficient.
Table 2 reveals that the greater the following variables: The size of the firm, The return to
total capital, the degree of operating risk, the five year expected growth rate, and the enterprise
value multiple, the more likely the firm would have achieved a higher level of share price liquidity.
Conversely, the greater the variance in EBIT, and the greater the level of financial leverage the less
likely the firm would have achieved a high level of share price liquidity. Explanations as to why the

Academy of Accounting and Financial Studies Journal Volume 20, Number 1, 2016
78
variables are associated with one group or the other are beyond the scope of this study. However, a
few comments on the findings may be in order. Five of these of these results may have been
expected, one variable had no apriori expectation (The relationship was simply not known), and one
was a surprise. Greater size, greater returns to total capital, greater rates of growth, less variance in
EBIT, and less financial leverage could all have intuitive aprori expectations of association with
greater share price liquidity. The fact that greater operating leverage was associated with greater
share price liquidity was simply not known beforehand. It may be suggested that higher operating
leverage (fixed operating costs) is associated with greater size, and size was the highest ranking
discriminating variable in the model. There are exceptions of course, but larger firms usually have
larger corporate bureaucracies and other fixed operating costs and that adds to operating leverage
(operating risk).
The study resulted in one surprise. The enterprise value multiple was expected to have a
negative association with share price liquidity. The numerator in the multiple is enterprise value and
that of course contains debt and minority interests as well as market capitalization. That number is
divided by the company’s latest earnings before interest and taxes plus depreciation and
amortization. Enterprise value has been described as how much an acquiring from would have to
pay to take over a company, When divided by EBITDA it is said to be roughly analogous to the
payback period. Thus, the smaller the denominator (EBITDA), the greater the enterprise value
multiple. The value of the firm is a partial function of EBITDA, and it is seemingly not
reasonable that smaller values of EBITDA can be associated with share price liquidity. This
finding is consistent with previous research (Wong, Castater, and Payne 2015). No explanation of
this empirical result can be offered here, and it may indeed defy logic. However, that finding as well
as the other conclusions of the study is rich in content for needed further research.
This study has resulted in a contribution toward the construction of a theory that describes
the risk-return, size and market perception characteristics of firms that have achieved the highest
levels of share price liquidity It is further suggested that since the model was validated without bias,
it can be used to predict firms that may achieve high levels of share price liquidity in the future. In
order to make a more complete contribution to the theory, the aforementioned further research is
needed. The evolution and appearance of a complete theory would aid managers, investors,
academicians, and investment counselors by providing greater of knowledge on which to base
financial decisions.
REFERENCES
Altman, Edward I. (1968). Financial Ratios, Discriminant Analysis and the Prediction of Corporate Bankruptcy.
Journal of Finance, 23(4): 589-609.
Amihud, Yakov, Haim Mendelson, and Lasse H. Pedersen (2005). Liquidity and Asset Prices. Foundations and
Trends in Finance, Stern School of Business, New York University.
http://www.investopedia.com/ask/answers/138.asp#ixzz3iFM7zoc6
Damodaran, Aswath. (2014). http://people.stern.nyu.edu/adamodar/New_Home_Page/data.html.
Damodaran, Aswath. (2002). Investment Valuation: Tools and Techniques for Determining the Value of any Asset:
New York: John Wiley and Sons.
Edmister, Robert O. (1982). An Empirical Test of Financial Ratio Analysis for Small Business Failure Prediction.
Journal of Financial and Quantitative Analysis, 7, 1477-1492.
Hair, Joseph F., Rolph E. Anderson, Ronald L. Tatham, and William C. Black. (1992). Multivariate Data Analysis. New
York: Macmillian.

Academy of Accounting and Financial Studies Journal Volume 20, Number 1, 2016
79
Hamada, Robert S. (1972). The Effect of Firm’s Capital Structure on the Systematic Risk of Common Stocks.
Journal of Finance, (May), 435-452.
Kemp, Michael (2014). Why Share Liquidity is so Important. ASX Investor Update.
http://www.asx.com.au/education/investor-update-newsletter/201405-why-share-liquidity-is-so-
important.html.
Payne, Bruce C. (2010). An Analysis of the Financial Variables that Determine the Value of Firms Identified as
Institutional Favorites in a Period of Economic Recession and Slow Recovery. Advances in Investment
Analysis and Portfolio Management, 4, 27-47.
Reese, John P. (2013). Four Free Cash Flow Yield All-Stars. http://www.forbes.com/sites/investor/2013/08/08/four-free-
cash-flow-yield-all-stars/
Sharma, Subhash. (1996). Applied Multivariate Techniques. Hoboken, New Jersey: John Wiley and Sons.
Suozzo, Peter. (2001). Global Equities Research. Stern School of Business.
http://pages.stern.nyu.edu/~ekerschn/pdfs/readingsemk/EMK%20NYU%20S07%20Global%20Tech%20Strate
gy%20Valuation%20Multiples%20Primer.pdf.
Treschmann, James S, and George E. Pinches. (1973). A Multivariate Model for Predicting Financially Distressed
Property-Liability Insurers. Journal of Risk and Insurance, 40(3), 27-333.
Wong, Roman, Nichole Castater, and Bruce C. Payne. (2015). A Canonical Correlation Approach to Investigate the
Determinants of Investment Safety. Southwestern Economic Review, 42(1), 29–43.
Zaiontz, Charles. (2014). Real Statistics Using Excel. http://www.real-statistics.com/multiple-regression/testing-
significance-extra-variables-regression-model/.

Academy of Accounting and Financial Studies Journal Volume 20, Number 1, 2016
80
THE FRAUD TRIANGLE AS A PREDICTOR OF
CORPORATE FRAUD
Dianne M. Roden, Indiana University Kokomo
Steven R. Cox, Indiana University Kokomo
Joung Yeon Kim, Indiana University Kokomo
ABSTRACT
We test whether proxies for elements of the fraud triangle are related to fraudulent
corporate behavior. We use Accounting and Auditing Enforcement Releases from 2003 through
2010 to form a sample of 103 firms with violations and compare their characteristics to a
matched sample of control firms. We find significant explanatory variables representing all three
sides of the fraud triangle; including opportunity, pressure and rationalization. SEC violations
are more likely when the board of directors has fewer women, longer tenure, more insiders, and
the CEO is also the chairperson. Fraud is also more likely when managers and directors are
compensated with stock options and when there has been a recent auditor change.
INTRODUCTION
Despite extensive accounting reforms, investors’ faith in the integrity of corporate
executives and the accuracy of their financial reports remains compromised. In 2014, the
American Institute of Certified Public Accountants (AICPA) redrafted a clarified Statement of
Auditing Standards AU-C 240, “Consideration of Fraud in a Financial Statement Audit”. The
goal of AU-C 240 is to increase the effectiveness of auditors in detecting fraud through the
assessment of firms’ fraud risk factors based on Cressey’s (1953) fraud risk theory. While
Cressey’s framework is widely accepted by accounting professionals, academics, and various
regulatory agencies, there is limited empirical evidence linking Cressey’s theory to financial
statement fraud in a corporate setting.
Cressey concluded that three conditions (opportunity, pressure, and rationalization) are
always present when embezzlement occurs. We empirically test the effectiveness of his fraud
risk factor framework adopted in AU-C 240 by developing variables that serve as proxy
measures for opportunity, pressure, and rationalization.
Our comprehensive study is based on the Accounting and Auditing Enforcement Releases
(AAERs) issued by the Securities and Exchange Commission (SEC) from 2003 through 2010.
Characteristics of 103 firms with fraud violations are compared to those of a matched sample of
103 control firms. The paper contributes to the existing literature by extending Cressey’s theory
on embezzlement by individuals to corporate fraud that often involves collaboration. Our study
examines fraud by U.S. firms in the post-Sarbanes-Oxley period, while most research has been
based on non U.S. firms or earlier periods. In addition, our sample is based on all types of SEC
violations, compared to other studies that looked at samples of firms with selected violations or
financial restatements not necessarily associated with fraud.
We find significant explanatory variables representing all three sides of the fraud triangle;
including opportunity, pressure and rationalization. SEC violations are more likely when the
board of directors has fewer women, longer tenure, more insiders, and the CEO is also the
chairperson. Fraud is also more likely when managers and directors are compensated with stock

Academy of Accounting and Financial Studies Journal Volume 20, Number 1, 2016
81
options and when there has been a recent auditor change. These results are consistent with the
fraud triangle and have important policy implications.
The next section of this paper reviews the relevant literature. Section 3 describes our data
and model development, Section 4 presents our results, and Section 5 includes a summary and
policy implications.
LITERATURE REVIEW
Cressey’s (1953) fraud risk factor theory concluded that fraudulent actions share three
common traits. First the “trust violator” has the opportunity to commit fraud, typically due to
absent or ineffective controls. Second there is a perceived financial need or pressure providing
motivation to commit fraud. Finally, those involved have the ability to rationalize that the
fraudulent act is justified and consistent with their values. The Statement of Auditing Standards
AU-C 240 provides a framework to position previous research in the context of all three sides of
the fraud triangle (opportunity, pressure, and rationalization).
Opportunity
AU-C 240 Appendix A provides examples of opportunities to commit fraud, such as
ineffective monitoring of managers by an ineffective board of directors, high turnover rates, and
the domination of management by a single person.
Segregation of the Board Chair and CEO Positions
The board of directors’ monitoring role can be hindered when the CEO serves as board
chair (Beasley & Salterio, 2001). Jensen (1993) argued that it is important to separate the chair
and CEO positions to have an effective board. Dechow, et al. (1996) provided evidence of
association between earnings management and the CEO simultaneously serving as chair. Beasley
and Salterio (2001) showed firms that separate the chair and CEO positions are more likely to
voluntarily improve the quality of their audit committees by including more outsiders. On the
other hand, Ghosh, Mara, and Moon (2010) and Lou and Wang (2009) found no relationship
between earnings management and separation of the chair and CEO positions.
Director Length of Tenure
The literature presents two conflicting views on the relationship between director tenure
length and the effectiveness of boards. More experienced directors who have served longer on
the board can provide better knowledge about the firm and be more efficient in decision making
(Libit & Freier, 2015). Ghosh, et al. (2010) analyzed the post-Sarbanes-Oxley years and reported
a negative relationship between the average tenure of audit committee directors and discretionary
accruals. This suggests that audit committee directors with longer tenure are more effective in
mitigating earnings management. On the other hand, more seasoned directors have been shown
to lose their independence over time and favor management’s interests over shareholders’
(Vafeas, 2005). Directors who have served for an extended time are also likely to befriend
management (Vafeas, 2003).

Academy of Accounting and Financial Studies Journal Volume 20, Number 1, 2016
82
Women on the Board
A growing body of literature focuses on the role of female directors in board
effectiveness. Gavious, Segev, and Yosef (2012) found a negative relationship between the
presence of female directors and earnings management. They argued that aggressive accounting
decisions are mitigated in proportion to the number of women on the board of directors and the
audit committee. Srinidhi, Gul, and Tsui (2011) showed that female board participation is
associated with higher quality of reported earnings. Adams and Ferreira (2009) found that female
directors have significant positive impact on board performance through better attendance
records and by being more likely to join monitoring committees charged with transparent
reporting. Other studies also showed that the presence of women improves both board
effectiveness and firm performance (Huse & Solberg, 2006; Campbell & Minguez-Vera, 2008;
Kim, Roden & Cox, 2013).
On the other hand, several researchers found no gender differences in ethical judgments
among business practitioners (Shafer, Morris, & Ketchand, 2001; Abdolmohammadi, Read &
Scarbrough, 2003; Ballantine, 2011).
Financial Pressure or Need
AU-C 240 Appendix A provides examples of fraud risk factors relating to financial
pressure or need. These financial motivators include poor financial performance, excessive
pressure to meet targets, rapid growth, and significant performance-based compensation.
Poor Financial Performance
Beneish (1997) developed a model to detect earnings management and GAAP violations
among firms experiencing extreme financial performance, and found that total accruals, sales
growth, and leverage are useful in predicting violators. Skousen, Smith and Wright (2009) found
that increased cash needs and external financing are positively related to the likelihood of fraud.
Lou and Wang (2009) and Aghghaleh, Iskander, and Mohamed (2014) find leverage positively
related to fraud in studies of Taiwanese and Malaysian firms respectively.
Rapid Asset Growth
Rapid growth or unusual profitability can lead to financial pressure. Skousen, Smith and
Wright (2009), and Summers and Sweeney (1998) both found that rapid asset growth is
positively related to the likelihood of fraud.
Stock Option Compensation
Proponents of stock option compensation argue that it aligns shareholders’ and managers’
interests, thereby motivating behavior to enhance the firm’s stock price. However, a growing
body of literature indicates that stock option compensation also encourages earnings
management and other fraudulent activities.
Cullinan, et al. (2008) found that companies’ independent directors who are compensated
with options are more likely to misstate revenues. Archambeault, et al. (2008) also found a
positive relationship between stock option compensation for audit committee members and the
incidence of financial restatement due to fraud or error. Boumosleh (2009) and Persons (2012)
Academy of Accounting and Financial Studies Journal Volume 20, Number 1, 2016
83
both found director stock options positively associated with earnings management and concluded
that option compensation provides incentives for directors to fail to diligently monitor the
financial reporting process.
Rationalization
AU-C 240 Appendix A provides examples of rationalization of fraudulent behavior,
including nonfinancial management’s participation in selection of accounting principles,
aggressive or unrealistic forecasts, and strained relationship with the current or predecessor
auditor.
Nonfinancial Management’s Participation
Managers are more likely to rationalize that fraudulent acts are justified if financial
forecasts are unrealistic or nonfinancial managers are excessively participating in the selection of
accounting principles or determining estimates. Skousen and Wright (2008) found that fraud is
more likely when the board of directors lacks financial expertise. Kim, Roden and Cox (2013)
found that SEC violations are more likely when the board of directors has fewer financial
experts.
Board Independence
Prior research documents that a higher proportion of outside directors is associated with a
higher quality of reported earnings due to the enhanced independence of boards (Beasley, 1996;
Dechow, Sloan & Sweeney, 1996; Klein, 2002; Vafeas, 2005). Outside directors have strong
incentives to perform their monitoring duties diligently to protect their reputation in the external
directorship markets (Summers & Sweeney, 1998; Beasley & Salterio, 2001). While inside
directors provide valuable knowledge about corporate operations to the board discussions, they
have incentive to inflate financial performance measures in order to secure their jobs and related
compensation. Their insider knowledge and full-time status can potentially transform the board
of directors into an instrument of management at the expense of shareholder interests
(Williamson, 1984).
Auditor Change
Managers are more likely to rationalize that a fraudulent act is justified if there is a
strained relationship with the current or predecessor auditor. Lou and Wang (2009) found auditor
change positively related to the likelihood of fraud. Stice (1991) found that the incidence of audit
failures and litigation increases immediately after a change in auditor. Kluger and Shields (1989)
found that auditor changes before bankruptcy may be partially due to lack of success at
suppressing information with the current auditor.
DATA AND MODEL DEVELOPMENT
Sample of Fraud Firms and Matched Control Firms
We formed a sample of firms by reviewing all of the AAERs reported by the SEC from
2003 through 2010. We identified the company name, type of violation, and the relevant years

Academy of Accounting and Financial Studies Journal Volume 20, Number 1, 2016
84
involved. There were 211 firms with at least one federal securities violation during this post-
Sarbanes-Oxley period.
There were five main types of AAER violations in the sample. By far the most common
violation was earnings management. Often revenues were inflated or expenses were understated
in an effort to meet analysts’ estimates. Many cases involved “prematurely recognizing revenue,”
while others involved complex schemes to “fraudulently inflate reported revenue by creating
fictitious customers” or “bogus sales orders and phony revenue.” The second most common type
of violation was a failure to disclose material information, such as the riskiness of loans or
mortgages. Typical AAERs included firms that “failed to disclose related-party transactions” and
firms that “deliberately misled investors about significant risks being taken.” There were also
cases of bribing foreign officials, including reports of “deliveries of cash-filled briefcases to
government officials to win sales contracts.” There were less frequent incidents of firms
backdating stock options. A typical enforcement release described “backdated documents to
conceal they were using in-the-money option grants and providing executives with undisclosed
compensation.” Finally, the fewest number of firms were charged with embezzlement, where
managers directly misappropriated funds for their personal benefit. Just over 10% of the firms
had multiple violations, typically involving earnings manipulations combined with another
infraction. Note that the vast majority of infractions are not embezzlement (typically by one
person as studied by Cressey), but are instead frauds conducted at the top corporate level, often
in collaboration.
For each sample firm with a securities violation, we searched the SEC EDGAR web site
for a proxy statement from the first fraudulent year. If a proxy statement was not available during
the first fraudulent year, then the proxy statement from the next available year during the firm’s
violation period was substituted. There were 67 firms without available proxy statements,
typically because they were foreign entities or very small. There were 27 firms without financial
data on COMPUSTAT and another 14 firms without a matching control firm (discussed below),
resulting in a final sample of 103 fraud firms. The percentages of each type of violation in the
final sample are similar to those in the original sample. Table 1 summarizes this information.
Table 1
TYPES OF AAER VIOLATIONS IN THE ORIGINAL AND FINAL SAMPLES
Type of Accounting and Auditing Enforcement
Release Violation
Firms in
Original
Sample
Percentage in
Original
Sample
Firms in
Final
Sample
Percentage
in Final
Sample
Total Number of Fraud Companies 211 100.0 103 100.0
Earnings Manipulation 110 52.1 64 62.1
Failure to Disclose Material Information 50 23.7 11 10.7
Bribing Foreign Officials 30 14.2 14 13.6
Backdating Stock Options 22 10.4 16 15.5
Embezzlement 21 10.0 8 7.8
Firms with Double Violations 22 10.4 10 9.7
Following the methodology of Beasley (1996), we created a control sample of firms
without AAER violations designed to match the size and the industry of the fraud firm in the
year prior to the first year of the financial statement fraud. A step-wise process was used to
identify matching firms by satisfying the following conditions:

Academy of Accounting and Financial Studies Journal Volume 20, Number 1, 2016
85
1) The firm was not reported in AAER for violating financial reporting regulations from 2003
through 2010.
2) The firm’s financial data was available in COMPUSTAT for the year prior to the first year of the
fraud firm’s violations reported in AAER.
3) The firm was classified in the same four-digit SIC code as the fraud company.
4) The firm’s market value of common equity was the closest to that of the given fraud firm among
the no-fraud firms satisfying the first three conditions. The size of the matched control firm was
required to be within 30% of the size of the fraud firm.
5) If no matching firm was found in condition 4, we modified Condition 3 by using a two-digit SIC
code instead of the four-digit code. Conditions 1 through 4 were then repeated with modified
Condition 3. This allowed a larger pool by broadening the industry classification.
6) If a matching firm was still not found, we modified Condition 4 by replacing market value of
equity with net assets and repeated Conditions 1 through 5. Most cases in this category were due
to missing parameters necessary for computing the market value of equity, which made the
original Condition 4 infeasible.
Data Collection
Data regarding the board of directors for all firms was collected from the proxy
statements, reflecting the characteristics of the violating and matched firms in the year prior to
the first violation. Data included the number of board members, their independence, the number
of years on the board, gender, financial and accounting expertise, and whether the CEO was also
chair. The proxy statements also provided information about the compensation to the firm’s
senior executives and directors, including whether they received stock options.
Financial information used to construct the matched sample and to calculate financial
distress and asset growth was collected from COMPUSTAT from the year preceding the first
year of violation. Any data not found on COMPUSTAT was collected from individual financial
statements found on the SEC EDGAR site.
Variable Measurements and Predicted Relationships
We select a number of explanatory variables that proxy for fraud risk factors reflected by
the fraud triangle components. The model is tested using logistic regressions where the
dependent variable equals one if a firm committed an SEC violation and zero if a firm is a
matched control. This model is represented by equation 1 below:
( ) (1)
Opportunity Variables
To measure the impact of a firm combining its top two leadership positions, we created a
dummy variable set to one if the chair was also the firm’s CEO, and zero otherwise. While there
are potential profit motivations for combining these positions, the oversight function of the board
may be compromised. Based on the potential conflicts of interest between the two positions, we
expect a positive relationship between this dummy variable and the likelihood of fraud.
Tenure is measured as the mean number of years served by the board members at the
time of the proxy statement. While experienced directors may gain firm and industry knowledge,
seasoned directors may lose their independence over time and favor management’s interests over

Academy of Accounting and Financial Studies Journal Volume 20, Number 1, 2016
86
shareholders’. Therefore, we predict a positive relationship between the average number of years
on the board and the likelihood of a violation.
We also measure the percentages of men and women on the board. Women offer diverse
experiences that broaden the perspective of the board and help to modify board behavior. The
presence of females may also serve as a proxy for open-minded, less entrenched boards of
directors. As a result, we expect a positive relationship between the percentage of males and the
likelihood of fraud.
Pressure Variables
Altman (1968) developed a widely accepted z-score for measuring financial distress and
predicting bankruptcy. We use his revised, more generalized model that is a linear combination
of four common business ratios. We predict that this measure of financial distress will be
positively related to the incidence of fraud. Since rapid growth can also lead to financial
pressure, we measure the percent growth in total assets in the year prior to the fraud. We expect a
positive relationship between this measure of growth and fraud.
The literature provides strong evidence that stock option compensation encourages short-
term manipulation of earnings and weakens independent oversight. We use a dummy variable
equal to one if senior executives and directors are compensated with stock options, and zero
otherwise. In all sample firms, stock option compensation was offered to both groups or not
offered at all. We expect a positive relationship between stock option compensation and the
likelihood of fraud.
Rationalization Variables
Previous research has shown that board member independence is linked to higher quality
financial reporting and more effective governance. We measure independence as the percentage
of independent board members as declared in the proxy statement and expect to find a positive
relationship between the percentage of insiders and the likelihood of fraud. We also measure the
percentage of accounting/finance experts on the board and expect a negative relationship with
the likelihood of fraud. The Sarbanes-Oxley Act, which requires all audit committee members to
be independent and at least one member to be a financial expert, supports the above predictions.
We use a dummy variable equal to one if there was a change in auditor in the two years
prior to the first year of fraud, and zero otherwise. Because a change in auditor reflects a likely
strained relationship, we predict a positive correlation between a change in auditor and
subsequent fraud.
Control Variables
Our model controls for size, leverage, and profitability. Size is measured as the log of
total assets expressed in thousands of dollars. Leverage is measured as total debt divided by total
assets. Profitability is measured by Return on Assets (ROA) computed as EBIT divided by total
assets. Because the control firms are matched to violator firms based on size and industry, which
should proxy for profitability and leverage, we do not expect a significant relationship between
these variables and the likelihood of fraud.
We were careful to avoid the potential threats to the validity of using non-random
matched samples that were identified by Cram, Karan and Stuart (2009). First, as discussed

Academy of Accounting and Financial Studies Journal Volume 20, Number 1, 2016
87
above, our model includes the appropriate control variables related to the size and industry
parameters that we used to create our matched sample. Second, we were careful to minimize
imperfect matching by following the process that we described above. Finally, because we are
using only logistic regression, concerns about need for reweighting techniques were avoided.
RESULTS
Mean Results
Table 2 shows mean values of selected variables for the samples of fraud and control
firms. As expected, control variables are not significantly different between the samples. Debt
ratios are relatively high (above 50%) and mean ROA is under 3% for fraud firms and close to
zero for the control sample. These results may reflect firms and industries under financial
pressure with greater concerns about investor expectations.
Table 2
MEAN RESULTS BY CATEGORY
Fraud Firms’ Mean
(n=103)
Control Firms’ Mean
(n=103)
t-value
Control Variables
Total Assets (000) $2,405,533 $2,468,393 -0.08
Debt Ratio (Total Liabilities/Total Assets) 52.42% 54.74% -0.47
Return on Assets (EBIT/Total Assets) 2.75% -0.01% 0.75
Opportunity Variables
Average Number of Years on the Board 6.78 5.72 2.53
CEOs Also the Chair of the Board 48.54% 34.95% 1.99
Men on the Board 93.61% 88.12% 4.12
Pressure Variables
Stock Options Are Paid 79.61% 49.51% 4.73
Altman’s Z 12.62 13.93 -0.45
One Year Change in Assets 0.82% 0.50% 1.09
Rationalization Variables
Insider Members on the Board 29.13% 25.03% 2.94
Non-Finance/Accounting Experts on the
Board
57.11% 54.74% 1.11
Auditor Change 33.01% 16.50% 2.78
With regard to the opportunity variables, violator firms have board members with
significantly longer tenure, a greater percentage of men on the board, and they are more likely to
have the CEO in the position of chair. In fact, the control firms have almost twice as many
women directors (11.9% versus 6.4%), and while 49% of violator firms have CEOs that also
serve as chair, only 35% of control firms utilize CEOs in that dual role.
In terms of financial pressure variables, the proportion of fraud firms with executive
stock option compensation (80%) is higher than the proportion of control firms (50%). There is
not a statistically significant difference in the measure of financial distress (Altman’s Z) or in
asset growth between the two groups.

Academy of Accounting and Financial Studies Journal Volume 20, Number 1, 2016
88
The variables representing rationalization are all higher in the fraud firms compared to
the control firms. The percentage of insiders on the board is significantly higher in the fraud
firms and auditor change is more than twice as likely for violator firms.
Logistic Regressions
Table 3 shows the results from five logistic regressions with the dependent variable equal
to one if the firm is from the fraud sample and zero if the firm is from the control sample. In the
first regression only control variables are included to confirm that the matched control sample is
valid. The regression is not significant overall and none of the total variability is explained. As
predicted, total assets are not significant because the control firms were matched to the fraud
firms based on size. Return on assets and the debt ratio are not significant because the control
firms were matched to the fraud firms based on industry.
The second regression includes the control variables and opportunity variables. A
significant positive coefficient is found based on the average length of service on the board. This
is consistent with entrenched boards being more likely to commit or tolerate fraud. In results not
shown in tables, we substituted elected term length in place of average length of service. This
variable was not significant indicating that shorter terms may not be effective in reducing
entrenchment. A significant positive coefficient is also found on the dummy variable indicating
firms where the CEO is also chair, reflecting possible conflicts of interest. When these two
positions are combined, fraud is more likely. Finally, a significantly positive coefficient is found
on the percentage of men on the board. The presence of women may prevent an otherwise
entrenched board from acting unilaterally. This regression based on opportunity has significant
explanatory power (pseudo R2 of 0.13 to 0.18).
The third regression includes control variables and pressure variables. This regression has
significant explanatory power (pseudo R2 of 0.11 to 0.14). The coefficient on the stock option
compensation variable is significantly positive. The literature provides strong evidence that stock
option compensation encourages short-term manipulation of earnings and weakens independent
oversight. However, the coefficient on the variables for financial distress (Altman’s Z) and asset
growth are not statistically significant. In results not shown in tables, we used market adjusted
stock returns as an alternative measure of financial distress, but found no significant relationship
to incidents of fraud.
The fourth regression includes the control and rationalization variables. The percentage
of insiders has a significantly positive coefficient. The importance of outside directors is well
established in the literature. The percentage of finance/accounting experts on the board was not
significant. A significantly positive coefficient is found on the dummy variable representing an
auditor change within two years of the fraud. Managers are more likely to rationalize that the
fraudulent act is justified if there is a strained relationship with their auditor. This regression
based on rationalization also has significant explanatory power (pseudo R2 of 0.08 to 0.10).
The final regression includes control, as well as opportunity, pressure and rationalization
variables together. The regression has significant ability to predict fraud firms (pseudo R2 of 0.25
to 0.33). These results are robust, as all variables that were significant in the previous regressions
have the same sign and remain significant with the exception of the number of years on the
board, which has the same sign but is no longer significant.

Academy of Accounting and Financial Studies Journal Volume 20, Number 1, 2016
89
Table 3
LOGISTIC REGRESSIONS USING THE FRAUD TRIANGLE TO EXPLAIN FRAUDULENT
BEHAVIOR
Expected
Sign
Control
Variables
Opportunity Pressure Rationaliza-
tion
All
Variables
ln (Total Assets) n/a 0.122
(.119) 0.122
(.090)
0.072
(.336)
0.081
(.288) 0.222
(.017) Return on Assets n/a -0.238
(.694)
0.056
(.900)
0.280
(.666)
0.173
(.776)
-0.464
(.511)
Debt Ratio n/a -0.073
(.871)
0.118
(.803)
-0.716
(.229)
-0.283
(.523)
-0.298
(.653)
Average Number of Years on
Board
+ 0.104
(.056)
0.083
(.161)
CEO is Also Chair of Board
(0,1)
+ 0.622
(.046)
0.661
(.058)
% of Men on Board + 7.559
(.000)
7.102
(.001)
Stock Options Are Paid (0,1) + 1.346
(.000)
1.246
(.001)
Altman’s Z + -0.015
(.212) -0.006
(.600)
One Year Percent Change in
Assets
+ 0.109
(.210) 0.111
(.268)
% of Insider Members on
Board
+ 3.442
(.013)
3.517
(.030)
% of Non-Fin./Acct.
Professionals on Board
+ 0.714
(.469)
0.939
(.418)
Auditor Change (0,1) + 0.848
(.015)
1.059
(.008)
Constant n/a -0.044
(.923) -8.471
(.000)
-0.827
(.219) -1.856
(.033)
-10.990
(.000)
# of Observations 206 206 206 206 206
Chi-squared significance .799 .000 .001 .014 .000
Cox & Snell R2 .005 .134 .108 .075 .250
Nagelkerke R2 .007 .178 .144 .100 .334
(Coefficient results for each independent variable are followed by p-values below.)
With regard to opportunity, corporate fraud is more likely with an entrenched board and
with the CEO serving as chair. Including more women on the board appears to reduce
entrenchment. These results contrast with earlier studies with ambiguous or mixed results with
these variables.
With regard to financial pressure, interestingly, we do not find a link between financial
performance and fraud. Instead, fraud is more likely at firms that offer senior executives and
directors incentive-based compensation, such as stock options. In this sample, it seems that fraud
is driven more by greed and the expectation of more compensation rather than the fear of
penalties due to poor performance.
With regard to rationalization, fraud is more likely with a higher percentage of insiders
and when there was a recent auditor change. Both of these factors allow managers to justify their
fraudulent behavior, and these results are consistent with previous literature.

Academy of Accounting and Financial Studies Journal Volume 20, Number 1, 2016
90
DISCUSSION
We test whether variables that proxy for each element of the fraud triangle are related to
fraudulent corporate behavior. Significant explanatory variables are found for opportunity,
pressure, and rationalization. We find that SEC violations are more likely with an entrenched
board with fewer women, more insiders, and the CEO serving as the chair. Fraud is also more
likely when stock option compensation is used and when there has been a recent auditor change.
The fraud triangle results mentioned above are not only statistically significant; they have
clear policy implications that could substantially reduce the likelihood of fraud. The coefficients
from our logistic regressions can be transformed into an odds ratio by raising the constant e to
the power of the logistic coefficient.
( ) ( ) (2)
This transformation was used in the following discussion of the impact of our
explanatory variables. Of course, in the general population of firms the likelihood of fraud is
much less than 50%, so the impact of incremental changes will be less dramatic than shown
below.
Our regression results show that if the chair was also the firm’s CEO, the potential
conflicts of interest increased the odds ratio by 93.6%. This means that, in our matched sample,
the probability of fraud increases from an initial 50% (half of our sample was fraud firms) to
66.0% when these two positions are combined.
Each percentage change in the proportion of females on the board reduced the odds ratio
by eight percent. With the addition of one female on a typical board with ten directors, the
enhanced diverse perspectives and reduced entrenchment translates to reducing the probability of
fraud from 50% to 30.4%. The presence of a female director appears to have a significant impact
on modifying the board’s behavior and improving its oversight function.
Assuming a typical board size of ten members, the addition of one more outside director
reduced the odds ratio by 48.0%. This enhanced independence translates to reducing the
probability of fraud from 50% to 34.2%. Similarly, when stock option compensation was used
for senior executives and directors, the probability of fraud increased from 50% to 77.7%. The
use of options appears to compromise director independence and impairs their ability to provide
objective oversight.
This study suggests clear policies to reduce the likelihood of fraud. Particular attention
should be paid to the structure of the board of directors. It is important to have an independent
board with regular turnover and gender diversity. The CEO should not be the chairperson.
Incentive-based compensation should be avoided or carefully constructed. Long-term stock
compensation should be considered as an alternative to options. Finally, conflict with auditors is
a warning sign of pending fraud.

Academy of Accounting and Financial Studies Journal Volume 20, Number 1, 2016
91
REFERENCES
Aghghaleh, S.F., Iskandar, T.M., & Mohamed, Z.M. (2014). Fraud risk factors of fraud triangle and the likelihood of
fraud occurrence: Evidence from Malaysia. Information Management and Business Review, 6(1), 1-7.
Abdolmohammadi, M. J.,Read, W. J., & Scarbrough, D. P. (2003). Does selection-socialization help to explain
accountants’ weak ethical reasoning? Journal of Business Ethics, 42(1), 71–81.
Adams, R. B., & Ferreira, D. (2009). Women in the boardroom and their impact on governance and performance,
Journal of Financial Economics, 94(2), 291-309.
Altman, E.I. (1968). Financial ratios, discriminant analysis and the prediction of corporate bankruptcy. Journal of
Finance (September), 189-209.
Archambeault, D., DeZoort, F. T., & Hermanson, D. R. (2008). Audit committee incentive compensation and
accounting restatements. Contemporary Accounting Research, 25 (4), 965-992.
Ballantine, J. (2011). The Impact of Ethical Orientation and Gender on Final Year Undergraduate Auditing Students'
Ethical Judgments. Accounting Education, 20(2), 187-201.
Beasley, M. S. (1996). An empirical analysis of the relation between the board of director composition and financial
statement fraud. Accounting Review, 71(4), 443-465.
Beasley, M. S., & Salterio, S. E. (2001). The relationship between board characteristics and voluntary improvements
in audit committee composition and experience. Contemporary Accounting Research, 18(4), 539-570.
Beneish, M. (1997). Incentives and penalties related to earnings overstatements that violate GAAP. The Accounting
Review, 74(4), 425-457.
Boumosleh, A. (2009). Director compensation and the reliability of accounting information. The Financial Review,
44, 525-539.
Campbell, K., & Minguez-Vera, A. (2008). Gender diversity in the boardroom and firm financial performance,
Journal of Business Ethics, 83, 435-51.
Cram, D.P., Karan, V., & Stuart, I. (2009). Three threats to validity of choice-based and matched-sample studies in
accounting research. Contemporary Accounting Research, 26(2), 477-516.
Cressey, D. (1953). Other people’s money; a study in the social psychology of embezzlement. Glencoe, IL, Free
Press.
Cullinan, C.P., Du, H., & Wright, G.B. (2008). Is there an association between director option compensation and the
likelihood of misstatement? Advances in Accounting, 24(1), 16-23.
Dechow, P. M., Sloan, R. G., & Sweeney, A. P. (1996). Causes and consequences of earnings manipulation: an
analysis of firms subject to enforcement actions by the sec. Contemporary Accounting Research, 13(1), 1-
36.
Gavious, I., Segev, E., & Yosef, R. (2012). Female directors and earnings management in high-technology
firms. Pacific Accounting Review, 24(1), 4-32.
Ghosh, A., Marra, A., & Moon, D. (2010). Corporate boards, audit committees, and earnings management: pre- and
post-sox evidence. Journal of Business Finance & Accounting, 37(9/10), 1145-1176.
Huse, M., & Solberg, A. (2006). Gender-related boardroom dynamics: how Scandinavian women make and can
make contributions on corporate boards. Women in Management Review, 21, 113-30.
Jensen, M. C. (1993). The modern industrial revolution, exit, and the failure of internal control systems. Journal of
Finance, 48(3), 831-880.
Kim, J.Y., Roden, D.M., & Cox, S.R. (2013). The composition and compensation of the board of directors as
predictors of corporate fraud. Accounting and Finance Research, 2(3), 142-154.
Klein, A. (2002). Audit committee, board of director characteristics, and earnings management. Journal of
Accounting and Economics, 33(3), 375-400.
Kluger, B.D., & Shields, D. (1989). Auditor changes, information quality and bankruptcy prediction. Managerial
and Decision Economics, 10(4), 275-282.
Libit, W.M., & Freier, T.E. (2015). Is 75 the new 68? Director tenure, mandatory director retirement and related
issues. Corporate & Securities Law Advisor, 29(3), 2-11.
Lou, Y., & Wang, M. (2009). Fraud risk factor of the fraud triangle assessing the likelihood of fraudulent financial
reporting. Journal of Business & Economics Research, 7(2), 61-78.
Persons, O. S. (2012). Stock option and cash compensation of independent directors and likelihood of fraudulent
financial reporting. Journal of Business & Economic Studies, 18(1), 54-74.
Shafer, W. E., Morris, R. E., & Ketchand, A.A. (2001). Effects of personal values on auditors’ ethical decisions.
Accounting, Auditing & Accountability Journal, 14(3), 254–277.

Academy of Accounting and Financial Studies Journal Volume 20, Number 1, 2016
92
Skousen, C. J., Smith, K. R., & Wright, C. J. (2009). Detecting and predicting financial statement fraud: The
effectiveness of the fraud triangle and SAS no. 99. SSRN Working Paper Series, Feb.
Skousen, C. J., & Wright, C.J. (2008). Contemporaneous risk factors and the prediction of financial statement fraud.
Journal of Forensic Accounting IX: 37-62.
Srinidhi, B., Gul, F. A., & Tsui, J. (2011). Female directors and earnings quality. Contemporary Accounting
Research, 28(5), 1610-1644.
Stice, J. (1991). Using financial and market information to identify pre-engagement factors associated with lawsuits
against auditors. The Accounting Review 66(3), 516-533.
Summers, S., & Sweeney, J. (1998) Fraudulently misstated financial statements and insider trading: An empirical
analysis. The Accounting Review 73(1), 131-146.
Vafeas, N. (2003). Length of board tenure and outside director independence. Journal of Business Finance &
Accounting, 30(7/8), 1043-1064.
Vafeas, N. (2005). Audit committees, boards, and the quality of reported earnings. Contemporary Accounting
Research, 22(4), 1093-1122.
Williamson, O.E., (1984). Corporate governance. The Yale Law Journal, 93, 1197-1230.

Academy of Accounting and Financial Studies Journal Volume 20, Number 1, 2016
93
A RISK RETURN PROFILE AND RANKING OF THE
DETERMINANTS OF THE ENTERPRISE MULTIPLE
Anthony Sadler, Barry University
Adnan Daghestani, Barry University
Bruce C. Payne, Barry University
ABSTRACT
Investors at the margin use, among other data, ratios of valuation to aid in determining the
value of firms that they may perceive as potentially good investments. The valuation ratios are also
used in identifying “takeover targets” for acquiring firms. Some of the more familiar valuation
ratios are the price earnings multiple, the market value to book value ratio, Tobin’s Q, and the price
earnings growth ratio. If those tools have a common fault, it is that they value a company at one
point in time, and their reliability may be questioned when comparing companies with different
capital structures, or in different industries. Although the price earnings multiple continues to be the
method most used by investors and others, the ratio of enterprise value to earnings before interest,
depreciation, taxes, depreciation and amortization has for the past three decades grown in use more
extensively. The enterprise value multiple has the advantage of measuring the value of the firm as
an on-going entity, and the ability to compare companies with different capital structures. The
purpose of this study is to create a financial risk-return profile of those firms with the highest
enterprise value multiples, to compare that profile with companies selected at random, and to rank
those factors that influence the enterprise multiple. As in previous studies of this nature those
factors are analyzed using multiple discriminant analysis, and ranked with canonical correlation.
INTRODUCTION
The market value of all publicly traded firms whether that value is measured by equity
prices, price earnings multiples, market capitalization, or the present value of invested capital is
established in the marketplace for the most part by the actions of corporate financial managers
and the reactions of investors at the margin (those willing and able to buy) who trade off proxies
for risk and return to establish market value. There exists many tools, including financial
valuation ratios, that are used by investors and acquiring firms to estimate the intrinsic value of
firms. Some of the more familiar valuation ratios are the price earnings multiple, the market value
to book value ratio, Tobin’s Q, and the price earnings growth ratio. If those tools have a common
fault, it is that they value a company at one point in time, and their reliability may be questioned
when comparing companies with different capital structures, or in different industries. Forbes
(2012) offered the opinion that the significance of the enterprise value multiple (EVM) lies in its
ability to compare companies with different capital structures, and that by using the EVM instead
of market capitalization to look at the value of a company, investors get a more accurate sense of
whether or not a company is truly valued. Although the price earnings multiple appears to continue
to be the most popular, and most used tool by investors and others for valuation, the EVM has for
the past three decades grown in use more extensively (O’Shaughnessy 2011). The EVM has the
advantage of measuring the value of the firm as an on-going entity, and the ability to compare
companies with different capital structures and in different industries. Zucchi (2013) found that high
payout ratios indicate the firm is returning cash to the shareholder in the form of dividends,

Academy of Accounting and Financial Studies Journal Volume 20, Number 1, 2016
94
rather than re-investing the profits in the company, and that strong yields, determine the return to
the shareholder after all the expenses for operating a business and investment in capital
expenditures are spent. Accordingly, both high payout ratios and strong yields may have
negative consequences. The author concluded that enterprise value per share is the most
encompassing and generally considered the most useful in analyzing the current valuation of a
stock (Zucchi 2013). However, the denominator in Zucchi’s ratio neglected to account for
earnings, and like the Zucci study, the O’Shaughnessy that study suffered from the fact that only
the numerator in the enterprise value multiple was assessed and earnings were neglected, and the
effects of the denominator were not addressed. Thus, companies of different size, different
industries, or different capital structures could not be compared.
The enterprise multiple takes into account a company's debt and cash levels in addition to
its stock price and relates that value to the firm's cash profitability. It is defined as:
Enterprise Value Multiple = EV / EBITDA (1)
If EBITDA is relatively stable, this measurement allows investors to assess a company on
the same basis as would an acquirer or other buyer. Thus, the multiple is roughly analogous to
the familiar payback period. Regardless of the growing interest and apparent advantages of using
the EVM to the estimate intrinsic value of firms, there have been no studies that have
determined, or established an association, between the effects of traditional measures of risk and
return on the enterprise multiple.
The purpose of this study is to establish a financial profile of those firms identified as
having the highest enterprise multiples in the database of over 5000 firms created by
(Damodaran 2014) from Bloomberg, Morningstar and Compustat. Specifically, the analysis will
test for significant differences in the financial profiles of firms with the highest enterprise
multiples and to compare those profiles with companies selected at random. The financial
profiles simply consist of common risk-return variables, and two indicators that may reflect how
the market views the intrinsic value of the firm, If the two groups of firms have unique financial
profiles, and the model can be validated without bias, it suggests that the unique profile may be
used as a tool to forecast companies that will maintain high EVM in future periods. The use of
such a new tool to forecast higher positions of value would have implications for investors,
managers, lenders, investment counselors, and academicians.
METHODOLOGY
The issues to be resolved are first, classification or prediction, and then evaluation of the
accuracy of that classification. More specifically, can firms be assigned, on the basis of selected
financial variables, to one of two groups: (1) firms that were identified as having the highest
enterprise value multiples in their database simply referred to here as Highest Enterprise Value
Multiples (HEVM) or, Firms Randomly Chosen (FRC)?
Multiple Discriminant Analysis (MDA) provides a procedure for assigning firms to
predetermined groupings based on variables or attributes whose values may depend on the group
to which the firm actually belongs, and canonical correlation ranks those variables in order of
their weighted effects on the results of the analysis. If the purpose of the study were simply to
establish a financial profile of each group of firms, simple ratios would be adequate. However, as
early as 1968, in a seminal paper on the use of MDA in finance, Altman showed that sets of
variables used in multivariate analysis were better descriptors of the firms, and had more
predictive power than individual variables used in univariate tests.

Academy of Accounting and Financial Studies Journal Volume 20, Number 1, 2016
95
The use of MDA in the social sciences for the purpose of classification is well known.
MDA is appropriate when the dependent variables are nominally or ordinally measured and the
predictive variables are metrically measured. In addition to its use in the Altman study to predict
corporate bankruptcy, other early studies used MDA to predict financially distressed property-
liability insurance firms (Trieschmann and Pinches 1973), to determine value (Payne 2010), and
the failure of small businesses (Edmister 1982). This study also employs nominally measured
dependent variables and metrically measured predictive variables. The nominally measured
dependent variables are the group of HEVM firms and the group of FRC firms. The computer
program used to perform the analysis is SPSS 19.0 Discriminant Analysis (SPSS Inc. 2010).
Since the objective of the analysis is to determine the discriminating capabilities of the entire set
of variables without regard to the impact of individual variables, all variables were entered into
the model simultaneously. This method is appropriate since the purpose of the study was not to
identify the predictive power of any one variable, but instead the predictive power of the entire
set of independent variables (Hair, et al. 1992).
SELECTION OF SAMPLE AND INDEPENDENT VARIABLES
Inasmuch as the EVM has the advantage of measuring the value of the firm as an on-going
entity, and the ability to compare companies with different capital structures and in different
industries, and further, as previously stated, has for the past three decades grown in use more
extensively than of other measures (O’Shaughnessy, 2011), it is used here as the subject of study.
All data used in the analysis were gathered from Domodaran’s 2014 set. The sample
selected for this study consists of two groups. The HEVM group contains 2143 observations and the
FRC group has 288 observations. The sample is so large that as long as the variance covariance
matrices are equal, it renders the size of the groups insignificant, and of course, the use of that much
data exhausted Domodaran’s database. The first group was identified by Damodaran as the group in
that database having the highest EVM. The second group was randomly selected from the
remaining firms in that database.
Previous studies using this and other statistical methods have chosen explanatory variables
by various methods and logical arguments. In this study the group of explanatory variables chosen
for analysis includes two measures of return on investment, two measures of risk, one measure of
how the firm may be investing for the future, and finally one measure of how the company may be
perceived by investors at the margin. It is the buying and selling of those investors that establish the
market value of both equity and debt. An evaluation of those measures is needed to accomplish the
purpose of this study. A basic tenet of this study is that all investors “trade off” indicators of risk and
return to establish the value of the firms. Following are the seven explanatory variables:
X1 One measure of return is return to total capital. Return to total capital includes a return to creditors as
well as owners, and recognizes that value is affected by the cost of debt. A measure of return to equity
could be used, but it would ignore the cost of debt and the fact that debt as well as equity is used to finance
assets. This is consistent with the use of the debt to total capital ratio as a measure of financial leverage.
X2 Growth may also be regarded as a return on capital, and indeed growth has been of interest to financial
investors for years. In this study Damodaran’s five-year change in sales was used. Changes in revenue,
cash flow, earnings and dividends are also given, but those variables are a long-term function of sales.
X3 There is in any company both financial risk (financial leverage) and operating risk (operating leverage).
Sharpe’s beta coefficients contain the effects of both operating and financial risk. It is customary in modern
research to separate the two types of risk to identify and compare the sources of risk. The separation is
accomplished by using Hamada’s (1972) equation to “unlever” the published betas. “The unlevered beta

Academy of Accounting and Financial Studies Journal Volume 20, Number 1, 2016
96
resulting from Hamada’s equation is used as a measure of operating or business risk that results from fixed
operating costs.
X4 Long Term Debt to Total Capital (DTC) is used here as a measure of financial risk (financial leverage).
There are other ratios that measure financial risk very well, but the long-term debt to total capital ratio
again recognizes that the firm is financed by creditors as well as owners.
X5 The fifth explanatory variable is Capital Spending Per Share. The data gathered from this study were
gathered from the year 2014, the fifth year of economic recovery from the economic downturn of 2008. It is
expected that in periods of economic recover all firms would increase capital expenditures. It will be
informative to determine whether or not firms that have created high enterprise value multiples have
increased their capital spending beyond that of firms selected randomly. It has been said that while the
price earnings multiple is a rough measure of the value as a function of past earnings, the capital spending
to earnings ratio may be regarded as an indicator of future value (Payne 2010).
X6 The activity of institutional investors has long been a favored topic in financial literature. The daily trading
of such investors varies between 50 and 70 percent of all daily trading on the New York Stock Exchange
(Brancato and Rabimov 2007). We include the buying activity of institutional investors simply as an
indicator of how the market or at least a significant.
In sum, there are six explanatory variables in the multiple discriminant model. They are as
follows:
X1 - Return on Total Capital
X2 - The Five Year Growth Rate
X3 - Hamada’s Unlevered Beta (Operating Risk)
X4 - Long Term Debt to Total Capital (Financial Risk)
X5 - Capital Spending Per Share
X6 - Institutional Investor Buying Activity
The explanatory variable profile contains basic measures of common financial variables.
They were chosen, as in any experimental design, because of their consistency with theory,
adequacy in measurement, the extent to which they have been used in previous studies, and their
availability from a reputable source. Other explanatory variables such as the dividend payout ratio
and free cash flows could have been added, however their contributions to the accomplishment of
the stated purpose of the study would have been negligible. When there are a large number of
potential independent variables that can be used, the general approach is to use the fewest
number of independent variables that accounts for a sufficiently large portion of the
discrimination procedure (Zaiontz 2014). The more accepted practice is to use only the variables
that logically contribute the accomplishment of the study’s purpose (Suozzo 2001). This study is
consistent with both references.
TESTS AND RESULTS
The discriminant function used has the form:
Zj = V1X1j+V2X2j+..…+VnX nj (4)
Where:
Xij is the firm’s value for the ith independent variable.
Vi is the discriminant coefficient for the firm’s jith variable.
Zj is the jth individual’s discriminant score.

Academy of Accounting and Financial Studies Journal Volume 20, Number 1, 2016
97
The function derived from the data in this study and substituted in equation 1 is:
Zj = - 3.874 - .001X1 + .784X2 + 3.783X3 - .631X4 + .000X5 + 1.156X6 (5)
Classification of firms is relatively simple. The values of the seven variables for each firm
are substituted into equation (5). Thus, each firm in both groups receives a Z score. If a firm’s Z
score is greater than a critical value, the firm is classified in group one (HEVM). Conversely, a Z
score less than the critical value will place the firm in group two (FRC). Since the two groups are
heterogeneous, the expectation is that HEVM firms will fall into one group and the FRC firms
will fall into the other. Interpretation of the results of discriminant analysis is usually
accomplished by addressing four basic questions:
1. Is there a significant difference between the mean vectors of explanatory variables for the two groups of firms?
2. How well did the discriminant function perform?
3. How well did the independent variables perform?
4. Will this function discriminate as well on any random sample of firms as it did on the original sample?
To answer the first question, SPSS provides a Wilk’s Lamda – Chi Square transformation
(Sharma 1996). The calculated value of Chi-Square is 830.66. That far exceeds the critical value of
Chi-Square 12.592 at the five percent level of significance with 6 degrees of freedom. The null
hypothesis that there is no significant difference between the financial profiles of the two groups is
therefore rejected, and the first conclusion drawn from the analysis is that the two groups have
significantly different financial characteristics. This result was of course, expected since one group
of firms experienced very high enterprise value multiples and the other group was chosen randomly.
The discriminant function thus has the power to separate the two groups. However, this does not
mean that it will in fact separate them. The ultimate value of a discriminant model depends on the
results obtained. That is what percentage of firms was classified correctly and is that percentage
significant?
To answer the second question a test of proportions is needed. Of the 2143 firms in the
HEVM group, 1800 were classified correctly. Of the 288 firms in the FRC group, 242 were
classified correctly. That is, 2042 of the total of 2431 in the total sample or 84.0 percent were
classified correctly. The results are shown in Table 1.
Table 1
CLASSIFICATION RESULTS
Predicted Results
HEVM - FRC Classification
Actual Results HEVM FRC
HEVM 1800 343
FRC 46 242
Of course, it is obvious that 84 percent is significant, but formal research requires the
proof of a statistical test. To test whether or not an 84 percent correct classification rate is
statistically significant, the Press’s Q test is appropriate (Hair et al. 1992). Press’s Q is a Chi-
square random variable:

Academy of Accounting and Financial Studies Journal Volume 20, Number 1, 2016
98
Press’s Q = [N-(n x k)]2 / N(k-1) (6)
where:
N = Total sample size
n = Number of cases correctly classified
k = Number of groups
In this case:
Press’s Q = [2431 - (2042 x 2)]2
/ [2431 (2-1)] = 6859 > 2.05 3.84 with one d. f. (7)
Thus, the null hypothesis that the percentage classified correctly is not significantly different
from what would be classified correctly by chance is rejected. The evidence suggests that the
discriminant function performed very well in separating the two groups. Again, given the disparity
of the two groups, and the sample size, it is not surprising that the function classified 84 percent
correctly.
The arithmetic signs of the adjusted coefficients in Table 2 are important to answer question
number three. Normally, a positive sign indicates that the greater a firm’s value for the variable, the
more likely it will be in group one, the HEVM group. On the other hand, a negative sign for an
adjusted coefficient signifies that the greater a firm’s value for that variable, the more likely it will
be classified in group two, the FRC group. Thus, according to Table 2, the greater the following
variables: The five year growth rate, capital expenditures per share, and institutional investor buying
activity, the more likely the firm would have achieved a high EV/CSO ratio. Conversely, the greater
the levels of both operating leverage and financial leverage, the return on invested capital, and the
price – earnings - growth ratio, the less likely the firm would have achieved high EV/CSO levels.
The relative contribution of each variable to the total discriminating power of the
function is indicated by the discriminant loadings, referred to by SPSS as the pooled within-
groups correlations between discriminating variables and canonical function coefficients, or
more simply their structure matrix. Those structure correlations are indicated by canonical
correlation coefficients that measure the simple correlation between each independent variable
and the Z scores calculated by the discriminant function. The value of each canonical coefficient
will lie between +1 and -1. Multicollinearity has little effect on the stability of canonical
correlation coefficients, in contrast to the discriminant function coefficients where it can cause
the measures to become unstable. (Sharma 1996). The closer the absolute value of the loading to
1, the stronger the relationship between the discriminating variable and the discriminant function
These discriminant loadings are given in the output of the SPSS 19.0 program, and shown here
with their ranking in Table 2.

Academy of Accounting and Financial Studies Journal Volume 20, Number 1, 2016
99
Table 2
RELATIVE CONTRIBUTION OF THE VARIABLES
Discriminant Variables Coefficient Rank
Hamada’s Unlevered Beta (Operating Risk) .952 1
Long Term Debt to Total Capital (Financial Risk -.443 2
Institutional Buying Activity .311 3
The Five Year Growth Rate .195 4
Capital Spending Per Share -.139 5
Return on Total Capital -.002 6
Table 2 reveals that the measure of operating risk (leverage) made the greatest contribution
to the overall discriminating function. It is followed respectively by the measure of financial risk
(leverage), institutional investors buying activity, growth, capital spending, and finally return to total
capital.
Some multicollinearity may exist between the predictive variables in the discriminant
function, since both return and risk could be reflected in the institutional investors buying activity.
Hair, et al. (1992) wrote that this consideration becomes critical in stepwise analysis and may be the
factor determining whether a variable should be entered into a model. However, when all variables
are entered into the model simultaneously, the discriminatory power of the model is a function of
the variables evaluated as a set and multicollinearity becomes less important. More importantly, the
rankings of explanatory variables in this study were made by the canonical correlation coefficients
shown in Table 2. As discussed the previous paragraph, those coefficients are unaffected by
multicollinearity (Sharma, 1996).
VALIDATION OF THE MODEL
Before any general conclusions can be drawn, a determination must be made on whether
the model will yield valid results for any group of randomly drawn firms. The procedure used
here for validation is referred to as the Lachenbruch or, more informally, the “jackknife” method.
In this method, the discriminant function is fitted to repeatedly drawn samples of the original
sample. The procedure estimates (k – 1) samples, and eliminates one case at a time from the
original sample of “k” cases (Hair et al. 1992). The expectation is that the proportion of firms
classified correctly by the jackknife method would be less than that in the original sample due to
the systematic bias associated with sampling errors. In this study there was a difference of only
two firms. At first glance a reader might conclude that it is unusual to complete an analysis of
this size and have a difference of only two firms between the two groups. However, with a very
large sample such as the 2431 companies used in this study, the differences seem to diminish.
The major issue is whether the proportion classified correctly by the validation test differs
significantly from the 84 percent classified correctly in the original test. That is, is the difference
in the two proportions classified correctly by the two tests due to bias, and if so is that bias
significant? Of course, it may be obvious that a difference of only two cases will not be
significant with a sample of 2431 companies. However, as in the aforementioned case of the
Press’s Q test of proportions, formal research requires the proof of a statistical test. The jackknife
validation resulted in the correct classification of 83.9 percent of the firms. Since there are only
two samples for analysis the binomial test is appropriate:

Academy of Accounting and Financial Studies Journal Volume 20, Number 1, 2016
100
t = r – n p / [n p q] 1/2
(8)
Where:
t is the calculated t statistic
r is the number of cases classified correctly in the validation test.
n is the sample size.
p is the probability of a company being classified correctly in the original test.
q is the probability that a firm would be misclassified in the original test.
In this case: 2040 - 2431 (.84) / [2431 (.80) (.20)] ½ = - .111 is less than t05 1.645. ( 9)
Thus, the null hypothesis that there is no significant difference between the proportion of
firms classified correctly in the original test and the proportion classified correctly in the validation
test cannot be rejected. Therefore, it can be concluded that while there may be some bias in the
original analysis, it is not significant and it is concluded that the procedure will classify new firms as
well as it did in the original analysis.
In addition to the validation procedure, researchers usually address the question of the
equality of matrices. This is especially important in studies such as this where there is disparity
in the size of the groups. One of the assumptions in using MDA is that the variance-covariance
matrices of the two groups are equal. The SPSS program tests for equality of matrices by means
of Box’s M statistic. In this study Box’s M transformed to the more familiar F statistic of 256.03
resulted in a zero level of significance. Thus, the null hypothesis that the two matrices are equal
cannot be rejected.
SUMMARY AND CONCLUSIONS
The purpose of this study was to establish a financial profile of those firms identified as
having the highest enterprise multiples in the database of over 5000 firms created by
(Damodaran 2014). Specifically, the analysis tested for significant differences in the financial
profiles of firms with the highest enterprise multiples and to compare those profiles with
companies selected at random. The financial profiles simply consist of common risk-return
variables, a measure of how the firm may be investing for the future, and finally one measure of
how the company may be perceived by investors at the margin. A unique set of explanatory
variables was found for those firms with high enterprise value multiples, and since the model
was validated without bias, it is suggested that the profile may be used to identify firms that will
maintain those high multiples in the future.
The results of the statistical analysis indicated first, that there was a significant difference in
the financial profiles of the two groups of firms. The fact that the discriminant function separated
two heterogeneous groups, and classified a significant proportion correctly is no surprise. In fact, the
two groups of firms were so diverse in the matter of achieving high multiples that it would certainly
have been a surprise if the discriminant function had not been so efficient.
Table 2 reveals that the measure of operating risk (leverage) made the greatest contribution
to the overall discriminating function. It is followed respectively by the measure of financial risk
(leverage), institutional investors buying activity, growth, capital spending, and finally return to total
capital. The greater the values for operating leverage, institutional buying activity, and sustained
growth, the more likely the firm has a high enterprise value multiple. Conversely, the greater the
Academy of Accounting and Financial Studies Journal Volume 20, Number 1, 2016
101
values for financial leverage, capital spending, and return to total capital, the less likely the firm
would have a high enterprise value multiple.
Four of these of these results may have been expected, one had no apriori expectation and,
one was simply a surprise. Explanations as to why the variables are associated with one group or the
other are beyond the scope of this study. However, a few comments on the findings may be in order.
It was expected that since high growth rates, and heavy institutional investor buying add to
market capitalization and since market capitalization is normally the largest factor in the numerator
of the enterprise value multiple, then the high growth rates and heavy institutional buying would be
associated with the firms with higher multiples. It also may have been expected that a high level of
operating leverage would be associated with high multiples. The larger the factors in the numerator,
the larger will be the company in size. Large companies have greater fixed operating cost and thus,
higher operating leverage. The exceptional factor in the numerator is of course cash. However, the
cash balance is normally relatively small compared to market capitalization, debt, and preferred
stock. Further, it may have been expected that capital spending was not associated with high
enterprise multiples. Capital spending is a factor in the denominator of the enterprise value multiple
and thus, the higher the level of capital spending, the lower will be the multiple. There were no
aprori expectations for the ratio of debt to total capital (financial leverage). It was simply not
known. The higher the level of debt, the higher will be the enterprise value multiple, but in this
study the debt to total capital ratio instead of total debt was used to compute financial leverage.
The study resulted in one surprise. The return on total on total assets variable was not
characteristic of firms that achieved high levels of enterprise value. This finding is consistent with
previous research. As stated earlier however that study did not include earnings. Value is established
in the market place where return on invested capital is a highly regarded characteristic of any firm.
No explanation of this empirical result can be offered here, and it may indeed defy logic. However,
that finding as well as the other conclusions of the study is rich in content for needed further
research.
This study has resulted in a contribution toward the construction of a theory that describes
the risk-return and market perception characteristics of firms that have achieved the highest
enterprise value multiples. It is further suggested that since the model was validated without bias, it
can be used to predict firms that may again achieve high of enterprise value multiples in the future.
In order to make a more complete contribution to the theory, the aforementioned further research is
needed. The construction of a complete theory would aid managers, investors, academicians, and
investment counselors by providing greater of knowledge on which to base financial decisions.
REFERENCES
Altman, Edward I. (1968). Financial Ratios, Discriminant Analysis and the Prediction of Corporate
Bankruptcy.Journal of Finance, 23(4), 589-609.
Brancato, Carolyn and Stephan Rabimov. (2010). The 2007 Institutional Investor Report. Reprinted in The
Conference Board Report, number R-1400-07. Damodaran, Aswath. (2014). http://people.stern.nyu.edu/adamodar/New_Home_Page/data.html.
Damodaran, Aswath. (2002). Investment Valuation: Tools and Techniques for Determining the Value of any Asset:
New York: John Wiley and Sons.
Edmister, Robert O. (1982). An Empirical Test of Financial Ratio Analysis for Small Business Failure Prediction.
Journal of Financial and Quantitative Analysis 7, 1477-1492.
Forbes. (2012). http://www.forbes.com/sites/investopedia/2012/11/15/using-enterprise-value-to-compare-companies/.
Hair, Joseph F., Rolph E. Anderson, Ronald L. Tatham, and William C. Black. (1992). Multivariate Data Analysis. New
York: Macmillian.

Academy of Accounting and Financial Studies Journal Volume 20, Number 1, 2016
102
Hamada, Robert S. (1972). The Effect of Firm’s Capital Structure on the Systematic Risk of Common Stocks.
Journal of Finance, (May), 435-452.
O’Shaughnessy, James P. (2011). What Works on Wall Street, Fourth Edition. New York City: McGraw-Hill.
Payne, Bruce C. (1993). A Multiple Discriminant Investigation Into the Financial Characteristics of High Growth Firms.
Advances In Quantitative Analysis of Finance and Accounting, 2, 19-33.
Payne, Bruce C. (2010). An Analysis of the Financial Variables that Determine the Value of Firms Identified as
Institutional Favorites in a Period of Economic Recession and Slow Recovery. Advances in Investment
Analysis and Portfolio Management, 4, 27-47.
Sharma, Subhash. (1996). Applied Multivariate Techniques. Hoboken, New Jersey: John Wiley and Sons.
Suozzo, Peter. (2001). Global Equities Research. Stern School of Business.
http://pages.stern.nyu.edu/~ekerschn/pdfs/readingsemk/EMK%20NYU%20S07%20Global%20Tech%20Strate
gy%20Valuation%20Multiples%20Primer.pdf.
Treschmann, James S,, and George E. Pinches. (1973). A Multivariate Model for Predicting Financially Distressed
Property-Liability Insurers. Journal of Risk and Insurance. 40(3), 27-333.
Zaiontz, Charles. (2014). Real Statistics Using Excel. http://www.real-statistics.com/multiple-regression/testing-
significance-extra-variables-regression-model/.
Zucchi, Kristina (2013), Investing in Health Care Facilities.
http://www.forbes.com/sites/investopedia/2013/10/03/investing/healthcarefacilities/2/

Academy of Accounting and Financial Studies Journal Volume 20, Number 1, 2016
103
ANALYZING COST BEHAVIOR OF PHILIPPINE
INDUSTRIAL FIRMS
Arnel Onesimo O. Uy, De La Salle University
ABSTRACT
Recent studies find that cost behave asymmetrically with changes in activity levels which
challenges the traditional view that cost behaves either symmetrically with volume (variable) or
remains the same (fixed). Philippine industrial firms exhibit this cost behavior using
discretionary costs such as sales, general and administrative expenses (SGA). However, the
question remains whether they exhibit the same behavior for other types of costs such as cost of
goods sold, investment costs and total operating costs. This study shows that Philippine
industrial firms adjust their cost structures whether it be their cost of goods sold, investment
costs or total operaring costs with changes in demand conditions using the empirical model of
ABJ (2003).
Key Words: Sticky costs, cost behavior, asymmetric cost behaviour
INTRODUCTION
The path to achieving sustainable competitiveness advantage has not been easy for firms.
With fiercer and more global competition, companies have embarked on a journey to constantly
and continuously re-engineer and innovate their products, processes and systems in order to stay
ahead. In monitoring their progress as a result of these operational and strategic adjustments,
firms use performance frameworks such as the Balanced Scorecard. Through the use of such
multi-dimensional scorecards, firms realize the importance of strategic dimensions of traditional
accounting and financial constructs such as cost. Therefore, studies on how different cost behave
are more valuable during these times.
COST BEHAVIOR
Cost behavior has been widely studied in literature and normally associated it with
respect to volume. Most management and cost accounting textbooks would describe and view
cost behaving either as variable or fixed, the former changing proportionally to changes in
business activity level. It is generally assumed that variable costs change proportionately with
changes in activity drivers (Noreen, 1991). Fixed costs, on the other hand, remain invariable in
the short-run but are also related with activity in the long term.
This traditional cost behavior models assume that the direction of change is symmetrical
during both economic downturns (i.e. period of economic crisis, cost reduction programs) and
upturns (i.e. period of economic growth, expansion). This implies that the magnitude of change
of costs depends only on the extent of a change in level of activity, and not on the direction of
change. However, this assumption has been challenged in recent studies by Cooper and Kaplan
(1998) and Noreen and Soderstrom (1994 and 1997). They posit that overhead costs rise more
with increases in activity volume than they fall with decreases. Anderson, Banker and
Janakiraman (2003), or ABJ, found evidence that discretionary costs (i.e. sales, general, and
administrative or SG&A) do not behave symmetrically with activity, which implies that the

Academy of Accounting and Financial Studies Journal Volume 20, Number 1, 2016
104
magnitude of the increase in costs associated with an increase in activity driver or volume is
greater than the magnitude of the decrease in costs associated with an equivalent decrease in
volume.
The introduction of the ABC concept led to more studies about cost behavior. Recent
management accounting literature has argued that the ABC model of cost behavior is
inconsistent with the way managers actually make decisions and manages costs. Cooper and
Kaplan (1998), and Noreen and Soderstrom (1997) posit that overhead costs raise more with
increases in activity volume than they fall with decreases. A central component of cost
management is the manager’s response to exogenous shocks to output demand. Exogenous
shocks are hypothesized to cause managers to revisit the relationship between activity and input
levels, and between revenues and costs, and to evaluate costly adjustments as compared to the
status quo. Adjustment costs are typically ignored in traditional cost accounting. Cooper and
Kaplan (1998) further argued that cost management renders the traditional model of fixed and
variable cost behavior obsolete.
Traditionally, cost behavior is based on a microeconomic distinction of costs as fixed
versus variable with respect to activity volume. In this setting, the total variable costs’ behavior
is contemporaneous, linear and symmetric to sales volume movements. The magnitude of
changes of variable costs is independent of activity volume of prior periods. Managers, in this
environment, do not play an explicit role in how cost behaves.
The ABJ study in 2003 presented an alternative pattern of asymmetrical behavior of costs
with respect to its upward versus downward activity driver. This phenomenon is popularly called
cost stickiness and the cost behavior, sticky costs.
STICKY COSTS
Sticky costs occur because there are asymmetric frictions in making resource adjustments
attributed to deliberate managerial action in response to different factors such as demand
condition changes, hiring practices and even managerial empire-building tendencies. There are
forces acting to restrain or slow the downward adjustment process more than the upward
adjustment process. Thus, cost stickiness is more consistent with this cost behavior model.
In other words, when volume falls, managers are expected to decide whether to maintain
committed resources and bear the cost of operating excess capacity or reduce committed
resources and incur adjustment costs of retrenching. They claim that cost stickiness occurs
because managers do not make decisions to remove resources that are not utilized when activity
level falls. Increasing quality of decision-making would likely reduce the level of stickiness.
Better information would entail optimal decisions, while the lack or poor quality of information
would not allow appropriate ones. On the other hand, when activity increases, uninformed
decisions would instigate less-adjusted investment decisions. When activity decreases, well-
informed decisions would likely allow faster and better-fitted resource adjustments.
The question of whether the traditional model of fixed and variable (with volume) cost is
a sufficiently accurate representation of production economics as a basis for management
decisions has led to an increased interest in the sticky cost behavior. (Cooper and Kaplan, 1998).
In 1997, Noreen and Soderstrom tested the predictive accuracy of the traditional
cost model, they documented a curious pattern – some cost accounts exhibited a lower response
to volume decreases than to volume increases. This discovery was consistent with assertions in
the ABC literature about how managers adjust costly resources in response to exogenous demand
shifts (Cooper and Kaplan, 1998). This led the study of ABJ (2003) to argue that if managers

Academy of Accounting and Financial Studies Journal Volume 20, Number 1, 2016
105
deliberately adjust resources committed to activities, then the direction of volume changes will
affect actual costs and the traditional model of fixed and variable costs do not hold. Their
empirical test contrasts the two models of cost behavior. While efficient production specifies that
the optimal combination of inputs for a given level of output, several factors may intervene to
preclude or limit resource adjustments. These factors are hypothesized to lead to “sticky” cost
behavior in which cost adjust asymmetrically; more quickly for upward than for downward
demand shifts.
ABJ (2003) reiterates that this model likewise distinguishes between costs that move
mechanically with changes in volume and those that are determined by the resources committed
by managers. When volume falls, managers must decide whether to maintain committed
resources and bear the costs of operating with utilized capacity or reduce committed resources
and incur adjustment costs of retrenching and if volume is restored, replacing committed
resources at a later date.
Calleja, et al. (2006) extended ABJ’s (2003) study by comparing cost behavior of
publicly listed firms in the UK, US, France and Germany. Their study showed that costs are
sticky across all firms and countries. However, French and German firms exhibit higher level of
stickiness attributing it to the different governance systems in their respective countries. De
Madeiros and Costa (2004) used Brazilian firms as samples and found that cost stickiness is
“significantly more intense than in American firms”. They ascribe this to the less stable economy
of Brazil claiming that because of this, managers find it difficult to predict if the decrease in
revenues is permanent or only temporary. Using Philippine firms as samples, Uy (2014) found
that cost stickiness is also prevalent. This may be an indicator that economic and legal structure
as well as cultural factors influences adjustment costs and cost stickiness.
In another study, Balakrishnan and Gruca (2008) examined the relationship between cost
stickiness and a firm’s core competency. Instead of using a firm level data, they used data from
different departments within hospitals. Their study concluded that cost at the firm level generally
exhibits stickiness which is consistent with ABJ’s (2003) study. However, within the firm, costs
that relate to core activities (e.g. direct patient care) are relatively stickier compared to support
activities. This implies that costs connected to core competency are likely to exhibit higher
degree of stickiness.
The industry effect on cost stickiness was made by Subramaniam and Weidenmier
(2003). In their study, manufacturing firms exhibited the highest level of stickiness, while
merchandising firms the lowest.
Chen, Lu and Sougiannis (2012) provided arguments that cost stickiness is directly
related to a manager’s empire-building incentives and is negatively related to corporate
governance. This is more evident among firms that are more vulnerable to managerial empire-
building.
Moreover, Weiss (2010) and Homburg and Nasev (2008) claim that cost stickiness does
not only affect effective cost management but is costly for firms because of its impact on
earnings and profit asymmetric timeliness. Cost stickiness is associated with cash flow
uncertainty which they claim impact the conditional conservatism of firms. This implies that
earnings are less timely when the magnitude of cost stickiness is higher. Thus, managers see this
information asymmetry between them and the external users as an incentive to overstate
financial performance since future positive net present values are unverifiable. This provides
justification to why conditional conservatism distinguishes efficient from inefficient cost sticky
firms should offset the incentive by limiting management’s discretion. Efficient cost sticky firms

Academy of Accounting and Financial Studies Journal Volume 20, Number 1, 2016
106
are characterized by declining current sales and rebounding expected sales while inefficient cost
sticky firms are projected to have a permanent decline in sales. Interestingly, Weiss (2010) also
found that cost stickiness leads to an average of 25% poorer earnings forecast than firms with
anti-sticky cost behavior.
ABJ’s (2003) cost stickiness model is not without critic. Anderson and Lanen (2007 and
2009) challenged their conclusions. They raised the possibility that this phenomenon may be
produced by a “mechanical” cost relation associated with technical and engineering production
specifications. Balakrishnan and Gruca (2008) attempted to address this critique by examining
situations with predictable variations in cost stickiness due to expected variations in adjustment
costs. They concluded that overall evidence from archival data is not robust. This suggests that
“we need finer tests to gain more insights into how managerial incentives affect cost
management”.
It is then very evident that knowing how costs behave provides insight to how firms
behave in general and managers construct the firm’s resource infrastructure in particular.
FRAMEWORK AND EMPIRICAL MODEL
Theoretical Framework
The concept of cost stickiness was inspired by the economics’ price stickiness model
which describes that firms do not immediately change their prices to adjust to changes in
demand. In the same manner, sales revenues and operating costs do not move proportionately
because managers do not immediately change committed resources particularly when demand
shifts.
According to the deliberate decision theory (Yusukata and Kajiwara, 2009), cost
stickiness occurs because managers do not make decisions to remove resources that are not
utilized when activity level falls. Increasing quality of decision-making would likely reduce the
level of stickiness. Better information would entail optimal decisions, while the lack or poor
quality of information would not allow appropriate ones. On the other hand, when activity
increases, uninformed decisions would instigate less-adjusted investment decisions. When
activity decreases, well-informed decisions would likely allow faster and better-fitted resource
adjustments.
The cost adjustment delay theory articulates that costs become sticky as a result of cost
adjustments being unable to keep up with the speed of sales decline (Yusukata and Kajiwara,
2009).
Operational Framework
Traditional model of cost behavior recognizes that sales activities affect costs. In
particular, variable costs move proportionately with changes in sales activity. The traditional
model of costs views changes in variable costs as strictly proportional to changes in sales
activity. For instance, a 1% increase in sales activity increases costs also by 1% and vice versa.
Hence, this study will also use the same relationship between costs and activities (i.e. change in
SG&A costs is a function of changes in sales activity). In equation form,
Δ SG&A Costs = f (ΔSales Activity) (1)

Academy of Accounting and Financial Studies Journal Volume 20, Number 1, 2016
107
However, as ABJ (2003) found empirical support that costs increase more in response to
activity increases than they decrease in response to activity decreases, this equation will be
modified to take into account the direction of the changes which the traditional cost behavior
model does not consider.
Empirical Model
To test the sticky cost hypothesis, this study used a log-log model derived from the cost
function based on the Cobb-Douglas production function. The empirical model is derived by Uy
(2011) is presented in Equation (2).
(2)
where Dt=1 if Δyi,t<0 and Dt=0 if Δyi,t>0
Equation (3) presents the empirical model using the measurement choices of ABJ and
relevant cost proxies.
(3)
where Dt=1 if ΔRevi,t<0 and Dt=0 if ΔRevi,t>0
This empirical model examined the response of the various costs at time t to a same
period change in sales revenues. It used ratio and log forms to improve variable comparability
and to minimize the heteroskedasticity problem resulting from large variations in firm sizes.
This log-log model interpreted the estimated coefficients using percentage. In this basic
model, when Dt is zero, implying a positive change between two periods, the parameter β1 would
indicate the percentage change in SG&A expenditures when sales revenue increases by one
percent. On the other hand, if the change is negative, Dt has a value of one and the percentage
change in SG&A costs with a one percent decrease in sales revenue is captured by the sum of β1
and β2. Moreover, β1 and β2 are expected to have positive and negative values respectively. If the
value of β2 is zero, then cost stickiness is non-evident because the magnitudes of SG&A costs’
increase and decrease are the same (β1= β1+ β2). On the other hand, if β2< 0, then the degree of
increase in SG&A due to an increase in sales level is greater than the degree of decrease due to a
decrease in sales activities (β1> β1+ β2), signifying the presence of costs’ sticky behavior.
In summary, the coefficient β1 measures the percentage increase in SG&A costs with a
1% increase in sales, while the combined coefficients, β1+ β2 measures the percentage decrease in
SG&A costs with a 1% decrease in sales. In the traditional fixed- and variable-cost model, it
proposes that total cost changes are invariant to the direction of the change in activity, which
means that β2=0.

Academy of Accounting and Financial Studies Journal Volume 20, Number 1, 2016
108
PROBLEM STATEMENT AND HYPOTHESES
In a previous study (Uy, 2014), it was shown that Philippine industrial firms exhibit cost
stickiness when discretionary costs (i.e. SG&A) was used. this study aims to extend the analysis
of cost behavior exhibited by Philippine industrial firms in adjusting for demand condition
changes using other types of costs – cost of goods sold, investment costs (or capital
expenditures), and operating costs (or operating expenditures).
We test for sticky cost behavior by comparing the variation of cost of goods sold,
operating costs and investment costs with sales revenue in periods when revenue increases with
the variation of such costs with sales revenue in periods when revenue decreases.
H1: The relative magnitude of an increase in cost of good sold for an increase in sales
revenue is greater than the relative magnitude of a decrease in cost of goods sold
for a decrease in sales revenue.
H2: The relative magnitude of an increase in total operating costs an increase in sales
revenue is greater than the relative magnitude of a decrease in total operating
costs for a decrease in sales revenue.
H3: The relative magnitude of an increase in investment costs for an increase in sales
revenue is greater than the relative magnitude of a decrease in investment costs
for a decrease in sales revenue.
SCOPE AND LIMITATION
The study is limited to the testing of the cost stickiness empirical model using selected
Philippines industrial firms listed in the Philippine Stock Exchange (PSE) for the period 2000-
2012. The study is likewise limited to the examination of the relationship of the movement of
sales as proxy for output or activity level, and the different costs presented in the financial
statements of the respective company and not the total economic cost of the firm. Furthermore,
the study did not attempt to take into account the specific agreements and contracts entered by
firms but rather it considered the collective effects of these agreements and contracts as reported
in their respective financial statements.
METHODOLOGY
A traditional panel analysis was utilized to determine the cost stickiness of firms in the
Philippines. The advantages of conducting a panel analysis include an increased sample size, the
ability to study repeated cross-section observations, and more complicated behavioral models
(Gujarati, 2003). By combining time series and cross-section data, panel data gives us more
informative data, more variability, less collinearity among variables, more degrees of freedom,
and more efficiency. Heterogeneity will be taken into account by allowing for individual-specific
variables.
A panel regression has different variation examples, which include the Fixed Effects
Model (FEM) and Random Effects Model (REM). Before estimating the FEM, a simple OLS
regression of the naïve or pooled model will be estimated.

Academy of Accounting and Financial Studies Journal Volume 20, Number 1, 2016
109
Fixed Effects (FE) models are designed to isolate the individual impacts of an entity or
individual on the regressand. FE estimation explores the relationship between the dependent and
independent variables within an entity (country, person, or company). Each entity has its own
individual characteristics that may or may not influence the dependent variable. When using FE
estimation, we assume that something within the entity may impact the dependent or independent
variables and we need to control for this. This is the rationale behind the assumption of the
correlation between the entity’s error term and the independent variables. FE estimation removes
the effect of those time-invariant characteristics from the independent variables so we can assess
the independent variables’ net effect. Another important assumption of the FE model is that
those time-invariant characteristics are unique to the individual and should not be correlated with
other individual characteristics. Each entity is different; thus, the entity’s error term and the
constant (which captures individual characteristics) should not be correlated with the others. If
the unobserved variables or individual characteristics do not change over time, then any changes
in the dependent variable must be due to influences other than these fixed characteristics.
On the other hand, unlike FEM, the variation across entities of a REM is assumed to be
random and uncorrelated with the independent variables included in the model. It allows us to
check if the differences across entities have some influence on the dependent variable, and it
assumes that the entity’s error term is not correlated with the independent variables. This allows
for time-invariant variables to play a role as explanatory variables.
The Hausman test was used to determine the most appropriate panel data model (the
FEM or the REM) to use. This test determines whether or not the unmeasured factors are
correlated with the regressors. If the test statistic is less than 0.05, the null hypothesis will be
rejected. This means that the unique errors are correlated; therefore, the appropriate model to be
used is the fixed effect model. On the other hand, if the test statistic is greater than 0.05, there is
not enough reason to reject the null hypothesis. This means the unique errors are not correlated;
thus, making the appropriate model to be used is the random effects model.
RESULTS AND DISCUSSION
Descriptive Statistics
The dataset used in the study was constructed using the Osiris database. For the period
2000-2012, the study selected 76 firms and 912 firm-years. Table 1 shows the description of the
sample firms used in the study.
Table 1
DESCRIPTIVE STATISTICS
All reported numbers are in PhP’000,000 except the percentages
(PhP’000,000) Mean
Standard
Deviation Median
% of firm-years
with negative %
change
Sales revenues 14,646.56 41,361.63 1,871.14 32.53%
Cost of goods sold 9,281.12 32,456.34 1,146.45 33.04%
Operating costs 3,512.73 11,555.37 348.45 33.77%
Investing costs (1,694.01) 8,037.03 (103.42) 59.61
No. of firms 76
No. of firm-years 912

Academy of Accounting and Financial Studies Journal Volume 20, Number 1, 2016
110
Estimation Results
The results of the Hausman tests show that the fixed effect model is the preferred model
for testing the stickiness of cost of goods sold (H1) and total operating costs (H2) while the
random effects model for investment costs (H3).
Figure 1
HAUSMAN TEST (COST OF GOODS SOLD)
Since the Prob>chi2 is 0.00, there is enough reason to reject the null hypothesis.
Therefore, the fixed effects model will be used for cost of goods sold.
Figure 2
HAUSMAN TEST (OPERATING COSTS)
Since the Prob>chi2 is 0.0004, there is enough reason to reject the null hypothesis.
Therefore, the fixed effects model will be used for operating expense.

Academy of Accounting and Financial Studies Journal Volume 20, Number 1, 2016
111
Figure 3
HAUSMAN TEST (INVESTING COSTS)
Since the Prob>chi2 is 0.9155, there is no enough reason to reject the null hypothesis.
Therefore, the random effects model will be used for investment cash flow.
Using a panel structure, the final estimation results for testing our three hypotheses are
summarized in Table 2.
TABLE 2
ESTIMATION RESULTS
Coefficient Estimates
(p-value)
H1 Model
Cost of Goods Sold
H2 Model
Operating Costs
H3 Model
Investing Costs
β0 0.0556
(0.259)
0.0136
(0.055)
0.0130
(0.670)
β1 0.4178
(0.000)
0.2675
(0.000)
0.0609
(0.768)
β2 - 0.4031
(0.000)
- 0.1619
(0.001)
0.0822
(0.774)
Adjusted R2 0.2129 0.0776 -0.0568
Model FE FE RE
Based on the above results, the final model would show that we accept our alternative
hypotheses (H1 and H2) that the magnitude of cost of goods sold and the total operating costs
increase as a function of an increase in revenues is greater than the magnitude of cost reduction
as a function of an equivalent reduction in revenues. In other words, these two costs behave
asymmetrically for listed industrial Philippine firms. Thus, we confirm the prevalence of sticky
behavior for the cost of goods sold and total operating costs.
Using the costs of goods sold as proxies for our dependent variable, the β1 has an
estimated value of 0.4178 while β2, -0.4031. This can be interpreted that for every 1% increase in
revenues, there is a corresponding 0.42% increase in the cost of goods sold, but for every 1%
decrease in revenues, there is only a 0.0147% decline in the cost of goods sold. This finding
supports the study of Weidenmier and Subramaniam (2003) using data from the United States for
the period 1979-2000.
Interestingly, the same results have been observed when we use operating costs as
dependent variable. The β1 has an estimated value of 0.2675 while β2, -0.1619. This can be
interpreted that for every 1% increase in revenues, there is a corresponding 0.27% increase in the
operating costs, but for every 1% decrease in revenues, there is only a 0.11% decline in the

Academy of Accounting and Financial Studies Journal Volume 20, Number 1, 2016
112
operating costs. The implication of this asymmetric behavior can be explained by the non-
discretionary and oftentimes contractual obligations classified as operating costs, such as rental
and utilities. Managers cannot easily discontinue these costs given their nature.
However, we accept our null hypothesis (H3) that the relative magnitude of an increase in
investment costs for an increase in sales revenue is not greater than the relative magnitude of a
decrease in investment costs for a decrease in sales revenue. The high p-values of β1 and β2
indicate that the coefficients are not significant even at 90% significance level. The symmetric
behavior of investment costs or capital expenditures with changes in sales indicates that
Philippine firms adjust their long-term investment expenditures with changes in sales. This
implies a non-strategic or optimistic perspective of managers in making these long-term
investments.
CONCLUSIONS
Over the past decade after the publication of ABJ’s seminal work on the cost stickiness
phenomenon, the work has grown as it expanded the understanding of asymmetric cost behavior.
The concept of asymmetric cost behavior is much broader than the naïve prediction that “costs
are sticky” on the average. This has constituted a new way of thinking about costs and by natural
extension, earnings/profitability/firm performance. While the traditional view of cost behavior
adopts a more mechanistic relationship between cost and concurrent activity (“fixed” and
“variable”), this new approach is based on the primitives of cost behavior – resource adjustment
costs and resource commitment decisions by managers (Banker and Byzalov, 2014).
In the Philippine context, past studies have shown that sticky behavior is prevalent using
discretionary costs (Uy, 2011 and 2014). In this study, we have also shown that this cost
behavior pattern is not always present in all types of costs. The nature and type of costs matter as
only cost of goods sold and operating costs demonstrate this, while investment costs do not.
While there are already a lot of studies conducted in the last decade on the symmetric
cost behavior, there are still several unresolved issues in exsiting research and perhaps potential
applications of asymmetric behavior. For instance, it would be important to develop empirical
tests that can discriminate between efficient and excessive cost stickiness, and to identify
performance methods and incentive systems that would discourage “bad” stickiness but do not
deter “good” stickiness. Additionally, there is a need to incorporate the concept of cost
asymmetry to traditional accounting practices and systems such as budgeting, standard costing,
and even pricing decisions.
REFERENCES
Anderson, M., Banker, R. D.and Janakiraman, S. (2003). Are Selling, General and Administrative Costs ‘Sticky?
Journal of Accounting Research 41(1), 47-64.
Anderson, S., & Lanen, W. (2007). Understanding cost management: What can we learn from the evidence on
“sticky costs”? Working Paper: The University of Michigan.
Anderson, S., & Lanen, W. (2009). Understanding cost management: what can we learn from the empirical evidence
on “sticky costs?” Retrieved May 19, 2009 from
http://www.mbs.ac.uk/research/accountingfinance/documents/UnderstandingCostManagementWhatCanWeLearnfro
mtheEmpiricalEvidenceonStickyCosts.pdf.
Balakrishnan, R., & Gruca, T. S. (2008). Cost Stickiness And Core Competency: A Note. Contemporary Accounting
Research, 25(4), 993-1006.

Academy of Accounting and Financial Studies Journal Volume 20, Number 1, 2016
113
Banker, R. D., & Chen, L. (. (2006). Predicting Earnings Using A Model Based On Cost Variability And Cost
Stickiness. Accounting Review, 81(2), 285-307.
Banker, R. D., & Byzalov, D. (2014). Asymmetric Cost Behavior. Journal Of Management Accounting Research,
26(2), 43-79. doi:10.2308/jmar-50846
Calleja, K., Steliaros, M., & Thomas, D. C. (2006). A Note On Cost Stickiness: Some International comparisons.
Management Accounting Research, 17(2), 127-140. doi:10.1016/j.mar.2006.02.001
Chen, C. X., Lu, H., & Sougiannis, T. (2012). The Agency Problem, Corporate Governance, And The Asymmetrical
Behavior Of Selling, General, And Administrative Costs. Contemporary Accounting Research, 29(1), 252-
282. Doi:10.1111/J.1911-3846.2011.01094.X
Cooper, R. and R. S. Kaplan. (1998), The Design of Cost Management Systems: Text, Cases and Readings (2nd
Edition) Prentice Hall, Upper Saddle River, N.J.
de Medeiros, O.R., and Costa, P. (2004). Cost stickiness in Brazilian firms. San Paulo, Brazil: 4th
USP Congress of
Managerial Control and Accounting.
Homburg C. and Nasev. J. (2008). How timely are earnings when costs are sticky? Implications for the link between
conditional conservatism and cost stickiness. Retrieved May 19, 2009 from
http://marriottschool.byu.edu/emp/tc259/accframework/viewArticle.cfm?id=1692&sourceID=117
Noreen, E. (1991). Condition under which activity-based cost systems provide relevant costs. Journal of
Management Accounting Research, 3, 159-168.
Noreen, E., and Soderstrom, N. (1994). Are overhead costs strictly proportional to activity? Evidence from hospital
service departments. Journal of Accounting and Economics, 17, 255-278.
Noreen, E., and Soderstrom, N. (1997). The accuracy of proportional cost models: Evidence from hospital service
departments. Review of Accounting Studies, 2(1), 89-114.
Subramaniam, C., & Weidenmier, M. (2003). Additional evidence on the sticky behavior of costs. Working Paper:
Texas Christian University.
Uy, A. O. (2011). Modeling Cost Behavior: Linear Models For Cost Stickiness. Academy Of Accounting &
Financial Studies Journal, 25-34.
__ (2014). The Dynamics Of Firm Competitiveness: Evidence From Cost Behavior Of Filipino Firms. Academy Of
Accounting & Financial Studies Journal, 18(4), 84-94.
Weiss, D. (2010). Cost behavior and analysts’ earning forecasts. The Accounting Review, 86(4), 1441-1471.
Yusukata, K. and Kajiwara, T. (2009). Are “Sticky Costs” the result of deliberate decisions of Managers? (August 6,
2009). Retrieved from http://ssrn.com/abstract=1444746

Academy of Accounting and Financial Studies Journal Volume 20, Number 1, 2016
114
AUDITOR QUALITY AND IFRS INFORMATION
COMPARABILITY
Zhemin Wang, Nanfang College, University of Wisconsin-Parkside
Jinsong Tan, Sun Yat-sen University
Zhijun Lin, Macau University of Science and Technology
Chengjie Dong, Nanfang College
ABSTRACT
This study examines the difference in audit quality between Big 4 and non-Big 4 firms
and how such difference is affected by the adoption of IFRS in China, a developing economy
with low litigation risk. We measure audit quality using client financial statement comparability,
a basic property of useful information emphasized by both IASB and FASB. We choose
comparability as a proxy for audit quality because it can detect “within GAAP” earning
manipulations and its continuous nature captures audit quality variations across all companies.
Our findings indicate that financial statement comparability of Big 4 clients is higher than that
of non-Big 4 clients. Furthermore, the higher comparability of Big 4 clients persists under both
Chinese local accounting standards and IFRS. Finally, the audit quality gap between Big 4 and
non-Big 4 firms remains relatively stable over the pre- and post-IFRS periods.
INTRODUCTION
This study examines the difference in audit quality between Big 4 and non-Big 4
auditors. The issue of whether Big4 firms provide higher quality audit service is important for
accounting researchers who often rely on the Big 4 versus non-Big 4 dichotomy as a proxy for
audit quality (Beatty, 1989; Gul et al. 2009). The issue also has significant practical ramifications
in the selection of auditors by audit committees (CFA Institute Center, 2009; Moizer, 1997) and
in loan and underwriting agreements (De Angelo, 1981).
A large body of research has examined the issue of Big 4 versus non-Big 4 audit quality
(DeAngelo, 1981; Dopuch & Simunic, 1980; Khurana & Raman, 2004; Behn et al. 2008; Francis
& Yu, 2009). Abnormal accruals, benchmark beating, timely loss recognition, analyst forecast
accuracy, audit opinions, and litigation against auditors have been used as audit quality proxies
in the literature (Becker et al. 1998; Krishnan, 2003; Behn et al. 2008; Lawrence et al. 2011;
DeFond & Lennox, 2011). This study extends the research on audit quality by exploring a
different audit quality matrix: the comparability of clients’ audited financial statements.
Comparable information enables financial statement users to evaluate the merits of
alternative investment opportunities for efficient capital allocation (SEC, 2000). Making
financial information comparable was cited by the Financial Accounting Standard Board (FASB)
as the primary reason for developing accounting standards (FASB 1980, par. 112). Reducing the
divergence in accounting standards across countries in order to enhance the cross-country
comparability of accounting information was also cited as the primary reason for the creation of
International Accounting Standards Committee (IASC), the predecessor of the International
Accounting Standards Board (IASB) (Camfferman and Zeff, 2007). While the widespread
adoption of International Financial Reporting Standards (IFRS) has undoubtedly reduced the

Academy of Accounting and Financial Studies Journal Volume 20, Number 1, 2016
115
divergence in accounting standards across countries, increased standard comparability alone
would not lead to information comparability because information comparability is also affected
by institutional environment, management reporting incentives, and audit quality. Particularly,
given the numerous accounting choices under IFRS and the significant variations in enforcement
infrastructure across countries, auditors play a critical role in the rigorous interpretation and
consistent application of IFRS to produce comparable financial information (Ball, 2006).
Consequently, for similar economic events, clients of high quality auditors should report more
comparable accounting amounts, other things being equal. However, until recently, the literature
has not examined the comparability of audited financial statements in audit quality studies1. This
study attempts to bring the audit quality research and comparability studies together by
examining audit quality of Big 4 versus non-Big 4 firms based on the cross-country
comparability of clients’ IFRS-based financial statements. Specifically, we investigate the
difference in audit quality between Big 4 and non-Big 4 firms and how such difference is
affected by the adoption of IFRS in China. We choose China for our study for two major
reasons: (1) there are contradicting predictions and mixed evidence regarding Big 4 versus non-
Big 4 audit quality in developing economies with weak institutional environment and low
litigation risk, and (2) many of IASB’s constituent countries are developing economies with
weak institutional environment and low litigation risks.
Litigation risk avoidance and reputation protection are the two primary motivations cited
in the audit literature for high quality audit service. Both motivations would yield the same
prediction for developed economies with strong investor protection and high litigation risk.
However, the two motivations provide very different predictions for developing economies with
code law legal origins and low litigation risk. Specifically, given the weak institutions and very
low litigation risk in most developing economies, the litigation risk avoidance theory would
suggest no strong motivation for Big 4 firms to provide higher quality audit service. On the other
hand, since Big 4 firms in low litigation environment still have a motivation to protect its
reputation, the reputation protection theory would predict higher quality audit service by Big 4
firms.
The comparability measure used in this study was developed by De Franco, Kothari, and
Verdi (2011) and was subsequently used in several comparability studies (Barth et al. 2012; Yip
& Young, 2012). Following the procedures in De Franco, Kothari, & Verdi (2011), we compute
comparability scores between Chinese and Hong Kong companies matched by industry and firm
size. We then divide the observations into two subsamples based on whether the Chinese
companies are audited by Big 4 or non-Big 4 firms. Using a sample of 40,426 observations for
the period of 2006 and 2010-2012, we find that the overall cross-country comparability of Big 4
clients is higher than that of non-Big 4 clients. Furthermore, the higher comparability of Big 4
clients persists for both the pre- and post-IFRS periods. Finally, the comparability gap between
Big 4 and non-Big 4 firms in the post-IFRS period was not significantly different from that in the
pre-IFRS period, suggesting that the audit quality gap as measured by the cross-country
comparability of clients’ financial statements remains relatively stable over the pre- and post-
IFRS periods. Taken together, our findings suggest that for similar economic events, Big 4
clients on average report more comparable accounting amounts. The results don’t support the
litigation avoidance theory, which predicts no difference in audit quality in China’s low litigation
risk environment. Instead, the findings are more consistent with the reputation protection theory,
which predicts higher quality audit service by Big 4 firms in order to protect their reputation
(Palmrose, 1988; Becker et al. 1998; Khurana & Raman, 2004; Behn et al. 2008).

Academy of Accounting and Financial Studies Journal Volume 20, Number 1, 2016
116
Lawrence et al. (2011) report that differences in three widely used audit quality proxies in
the literature largely reflects client characteristics (client size in particular). To ensure that our
results are not driven by client characteristics, we included extensive controls for firm-level
characteristics in our regressions. In addition, we use Petersen’s two-way clustered analysis to
correct for correlation across firms and over time in our panel data and a two-stage regression
approach to control for potential self-selection bias. Therefore, our results are unlikely to be
driven by client characteristics, correlation in the panel data, or self-selection bias.
This study contributes to both the IFRS comparability literature and the audit quality
literature. The widespread adoption of IFRS by over 130 countries and all major stock exchanges
in the world has stirred up research interest in cross-country comparability of IFRS-based
financial statements. These studies generally focus on the improvement in cross-country
comparability upon IFRS adoption and the impact of legal origins and other institutional
environment on comparability (Barth et al. 2012; Yip & Young, 2012). To the best of our
knowledge, we are the first to investigate the relationship between IFRS information
comparability and audit quality. We document empirical evidence indicating a systematic
difference in cross-country comparability of IFRS-based financial statements between Big 4 and
non-Big 4 clients.
We also contribute to the audit quality literature. While both FASB and IASB emphasize
comparability as a basic property of useful financial information, comparability has not been
used as a proxy for audit quality in the literature. Francis et al.’s auditor style paper (2014) was
the first study attempting to bring audit research and comparability studies together. However,
their focus was on the relationship between comparability and auditor style by examining the
within-country comparability of firm-pairs audited by the same Big 4 auditor versus different
Big 4 auditors based on U.S. firms’ GAAP-based financial statements. In contrast, our research
focuses on the differences in cross-country comparability of IFRS-based financial statements of
Big 4 versus non-Big 4 clients. Furthermore, our sample firms are from a developing economy
with a weak institutional environment and low litigation risk. Given the widespread adoption of
IFRS and many of IASB’s constituents are developing economies with weak institutional
environment and low litigation risks, our findings should be of interest to international
accounting standards setting bodies, securities regulators, and investors.
The remainder of the study is organized as follows. Section 2 reviews the literature and
develops the model. Section 3 describes sample selection procedures and the data. Section 4
presents empirical tests and results. The last section summarizes and concludes the paper.
LITERATURE REVIEW AND MODEL DEVELOPMENT
Numerous studies have examined the issue of audit quality of Big 4 versus non-Big 4
firms (DeAngelo, 1981; Dopuch & Simunic, 1980; Khurana & Raman, 2004; Behn et al. 2008;
Francis & Yu, 2009). These studies used a variety of audit quality proxies, such as discretionary
accruals, timely loss recognition; analyst forecast accuracy, and litigations against auditors.
While comparability is one of the qualitative characteristics of useful accounting information and
is the primary reason for the creation of accounting principles, it has not been used as a proxy for
audit quality. In a recent study, Francis et al. (2014) attempt to bring the audit research and
comparability studies together in their auditor style paper. Based on U.S. firms’ GAAP-based
financial statements, they find two firms audited by the same Big 4 auditor have more
comparable earnings than two firms audited by two different Big 4 firms, and attribute the
difference to auditor style (Francis et al. 2014).

Academy of Accounting and Financial Studies Journal Volume 20, Number 1, 2016
117
We extend Francis et al.’s study by examining the difference in cross-country
comparability of IFRS-based financial statements of Big 4 versus non-Big 4 clients in China, a
developing economy with a weak institutional environment and low litigation risk. Instead of
focusing on the difference in comparability between the same Big 4 firms versus different Big 4
firms, we focus on the difference between Big 4 and non-Big4 firms because the literature often
relies on the Big 4 versus non-Big 4 dichotomy as a proxy for audit quality (Beatty, 1989;
Mitton, 2002; Smart & Zutter, 2003; Gul et al., 2009). Furthermore, instead of the within-country
comparability of GAAP-based financial statements, we choose to study the cross-country
comparability of IFRS-based financial statements because over 130 countries and all major stock
exchanges in the world have either adopted or permitted the use of IFRS. The Securities
Exchange Commission (SEC) is currently also considering whether U.S. firms should be allowed
to use IFRS for financial reporting. We focus on a developing economy with a weak institutional
environment and low litigation risk because many of IASB’s constituents are developing
economies with weak institutional environment and low litigation risks. Finally, we choose a
single-country setting to avoid the potential confounding effect of institutional differences in
cross-country studies.
IFRS was created to reduce the diversity in accounting standards across countries and to
enhance the cross-country comparability of reported financial information (Camfferman & Zeff,
2007). However, comparable accounting standards alone do not result in comparable financial
information; its consistent interpretation and rigorous application as well as audit quality and
legal enforcement also play an important role (Street & Gray, 2001; Ball et al. 2003; Ball, 2006;
Cairns, 1999). Given that IFRS is “principle-based” and that many of IASB’s constituents lack
the infrastructure to rigorously enforce the application of IFRS (Ball et al. 2003; Leuz et al.
2003), auditors are expected to play an important role in the consistent interpretation and
rigorous application of IFRS. Accounting, in essence, is the mapping of economic events into
financial statements (De Franco, Kothari, and Verdi 2011). For similar economic events, clients
of high quality auditors should report more comparable accounting amounts (i.e., have similar
mappings), other things being equal. Thus, we contend that the differences in cross-country
comparability of client IFRS-based financial statements can be used as a proxy for audit quality.
To the best of our knowledge, we are the first to use the cross-country comparability of client
IFRS-based financial statements as a proxy for audit quality.
Comparability studies generally use either input-based measures or output-based
measures in assessing accounting information comparability (De Franco, Kothari & Verdi, 2011;
Bradshaw & Miller, 2008; Bradshaw, Miller & Serafeim, 2009). When input-based
comparability measures such as accounting methods are used, researchers must decide which
accounting choices to use, how to weigh them, and how to account for variations in their
implementation. To avoid such challenges, this study adopts the output-based comparability
metrics, which was developed by De Franco, Kothari, and Verdi (2011) and was subsequently
used by several comparability studies (Barth et al. 2012; Yip & Young, 2012).
Following De Franco, Kothari, and Verdi (2011), accounting is essentially a mapping of
economic transactions to financial statements. That is,
Financial Statementsi = fi (Economic Transactionsi) (1)
Where fi () represents the accounting system of firm i. Equation 1 states that a firm’s
financial statements are a function of both the underlying economic transactions and how these
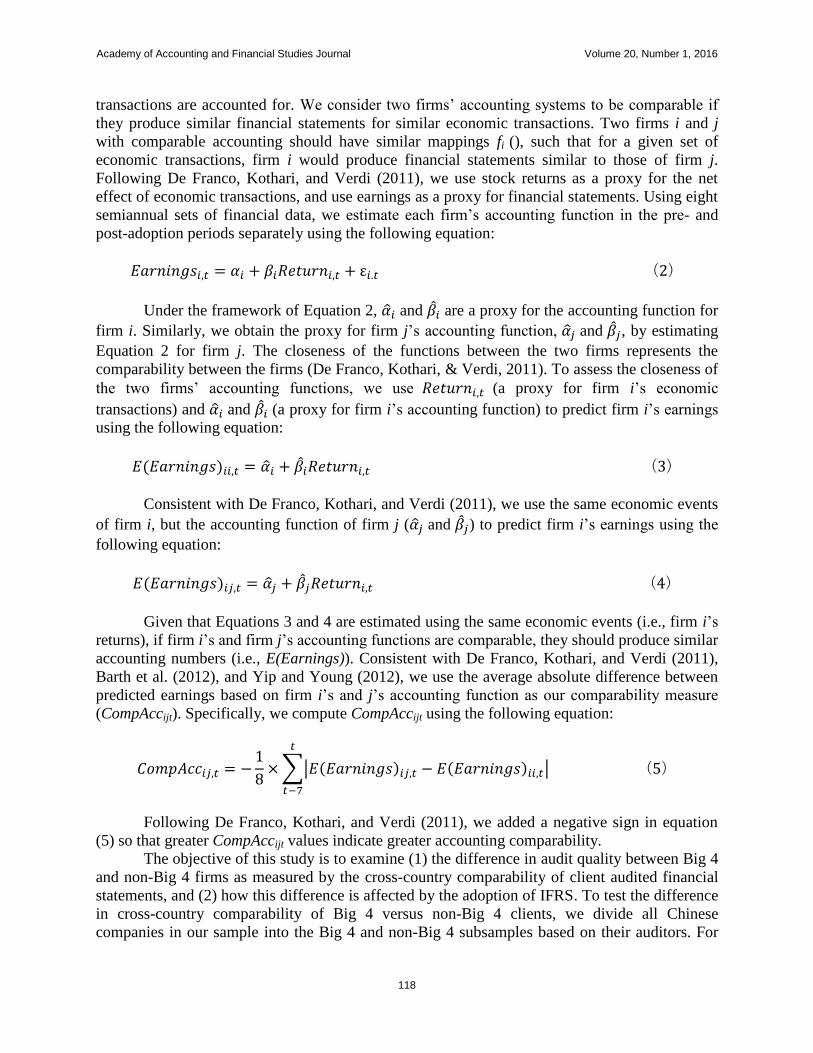
Academy of Accounting and Financial Studies Journal Volume 20, Number 1, 2016
118
transactions are accounted for. We consider two firms’ accounting systems to be comparable if
they produce similar financial statements for similar economic transactions. Two firms i and j
with comparable accounting should have similar mappings fi (), such that for a given set of
economic transactions, firm i would produce financial statements similar to those of firm j.
Following De Franco, Kothari, and Verdi (2011), we use stock returns as a proxy for the net
effect of economic transactions, and use earnings as a proxy for financial statements. Using eight
semiannual sets of financial data, we estimate each firm’s accounting function in the pre- and
post-adoption periods separately using the following equation:
Under the framework of Equation 2, and are a proxy for the accounting function for
firm i. Similarly, we obtain the proxy for firm j’s accounting function, and , by estimating
Equation 2 for firm j. The closeness of the functions between the two firms represents the
comparability between the firms (De Franco, Kothari, & Verdi, 2011). To assess the closeness of
the two firms’ accounting functions, we use (a proxy for firm i’s economic
transactions) and and (a proxy for firm i’s accounting function) to predict firm i’s earnings
using the following equation:
Consistent with De Franco, Kothari, and Verdi (2011), we use the same economic events
of firm i, but the accounting function of firm j ( and ) to predict firm i’s earnings using the
following equation:
Given that Equations 3 and 4 are estimated using the same economic events (i.e., firm i’s
returns), if firm i’s and firm j’s accounting functions are comparable, they should produce similar
accounting numbers (i.e., E(Earnings)). Consistent with De Franco, Kothari, and Verdi (2011),
Barth et al. (2012), and Yip and Young (2012), we use the average absolute difference between
predicted earnings based on firm i’s and j’s accounting function as our comparability measure
(CompAccijt). Specifically, we compute CompAccijt using the following equation:
∑| |
Following De Franco, Kothari, and Verdi (2011), we added a negative sign in equation
(5) so that greater CompAccijt values indicate greater accounting comparability.
The objective of this study is to examine (1) the difference in audit quality between Big 4
and non-Big 4 firms as measured by the cross-country comparability of client audited financial
statements, and (2) how this difference is affected by the adoption of IFRS. To test the difference
in cross-country comparability of Big 4 versus non-Big 4 clients, we divide all Chinese
companies in our sample into the Big 4 and non-Big 4 subsamples based on their auditors. For

Academy of Accounting and Financial Studies Journal Volume 20, Number 1, 2016
119
each subsample, we form firm-pairs of Chinese companies with Hong Kong companies matched
by industry (the two-digit SIC code) and firm size.2 We then compute the comparability scores,
CompAccij,t, for each firm-pair using the method described above. The mean and median
comparability scores for the Big 4 and non-Big 4 subsamples are compared to see if there are any
significant differences.
Studies on audit quality of Big 4 versus non-Big 4 firms using U.S. data generally find
that Big 4 firms provide higher quality audit services than non-Big 4 firms using a variety of
audit quality measures (DeAngelo, 1981; Dopuch & Simunic, 1980; Khurana & Raman, 2004;
Behn et al., 2008; Francis & Yu, 2009). However, some recent studies find either no difference
in actual audit quality between Big 4 and non-Big 4 firms (Boone et al. 2010) or the reported
audit quality differences simply reflect clients’ characteristics (Lawrence et al. 2011). The issue
of audit quality of Big 4 versus non-Big 4 firms in developing economies with code law legal
origins and low litigation risk also remains open with conflicting predictions and mixed evidence
(Francis et al. 2003; Fan & Wong 2005; Li et al. 2008, Lin et al. 2009). Two motivations for high
quality audit are cited in the literature: litigation risk avoidance and reputation protection. The
litigation risk avoidance motivation has different implications in code law jurisdictions with low
litigation risk (such as China) and common law jurisdictions where litigation risk is high (such as
the U.S.). Specifically, even though in theory investors in China can sue corporations, their
officers, and auditors when fraud occurs, there is generally a lack of judicial enforcement. There
is a huge gap between theory and actual practice (Ball et al. 2003). Despite the numerous fraud
and large numbers of lawsuits from Chinese investors, there have been no payments by auditors
from court actions (Hutchens, 2003). Given the low litigation risk and weak investor protection
in China, the litigation risk avoidance theory would suggest no strong incentives for Big 4 firms
to exert greater efforts to reduce litigation risk, and therefore predicts no significant differences
in audit quality between Big 4 and non-Big 4 firms. On the other hand, since Big 4 firms in
China, as their counterparts elsewhere in the world, have a reputation to protect, the reputation
protection theory would suggest that Big 4 firms are motivated to develop better in-house rules
and to exert greater efforts in order to protect its reputation, and thus predicts higher audit quality
for Big 4 firms. Since there is a lack of evidence in the literature regarding whether the
reputation protection incentive alone is adequate to motivate higher quality audit service, we
make no predictions and view this as an empirical issue.
The IFRS literature suggests that certain firm-level characteristics may affect financial
statement comparability. The audit quality literature also suggests that client characteristics may
affect certain audit quality proxies (Lawrence et al. 2011). To ensure that the difference in
comparability between the Big 4 and non-Big 4 subsamples are not driven by client
characteristics, we use the following regression equation to control for firm-level characteristics
in assessing the effect of Big 4 versus non-Big 4 on comparability:
Auditorij,t is a dummy variable which equals to one if the auditor is a Big 4 firm and zero
otherwise. The other variables in the equation attempt to control for firm-level differences in
firm size, leverage, market value to book value ratio, loss probability, sales, growth, and cash
flows from operations. Our primary interest is the coefficient estimate for the auditor dummy

Academy of Accounting and Financial Studies Journal Volume 20, Number 1, 2016
120
variable, β1. A significantly positive β1 value would indicate that financial statements are more
comparable if audited by a Big 4 firm.
Next, we investigate how the adoption of IFRS in China affects audit quality by
examining the differences in cross-country comparability between Big 4 and non-Big 4 clients
for the pre- and post-IFRS periods, respectively. To test this, we further divide the Big 4 and
non-Big 4 subsamples into pre- and post-adoption subsamples. We then collate the comparability
scores between Big 4 and non-Big 4 clients for the pre- and post-IFRS periods. If Big4 firms
provide higher quality audit service in terms of ensuring clients’ rigorous and consistent
interpretation of accounting standards and limiting clients’ opportunistic reporting behavior, the
comparability scores of Big 4 clients should be higher than that of non-Big 4 clients for both the
pre- and post-IFRS adoption periods.
The observed difference in comparability for the pre- and post-IFRS periods can be
affected by factors other than audit quality, such as the differences in standards quality (i.e.,
Chinese local standards versus IFRS) and firm-level characteristics. To isolate the effect of audit
quality on comparability over the pre- and post-IFRS periods, we introduce two more
independent variables into our regression: an accounting standard dummy variable and an
interaction term of the standard and auditor dummy variables. Specifically, we use the following
regression equation to assess changes in audit quality gap in the pre- and post-IFRS periods after
controlling for differences in standard quality and firm-level characteristics:
Where is an accounting standard dummy variable which equals to one for
post-IFRS period and zero otherwise. is the interaction term of the
auditor and standard dummy variables. The rest of the variables are defined the same as the
above.
The coefficient estimate for the standard dummy variable, β1, captures the effect of IFRS
adoption on comparability. Since Chinese companies and Hong Kong companies use different
accounting standards in the pre-IFRS period (Chinese local standards versus IFRS) and use the
same standards in the post-IFRS period, one would naturally expect the cross-country
comparability to improve in the post-IFRS period. However, if IFRS offers more reporting
latitude than local standards and therefore provides more opportunities for managers to behave
opportunistically, the adoption of IFRS may adversely affect financial statement comparability.
While the net effect of these counteracting forces is unclear, given the findings of prior
comparability studies that IFRS adoption generally improves comparability, we expect β1 to be
positive.
Our primary interest is in the coefficient estimates for the auditor dummy variable (β2)
and the interaction term (β3). In the context of Equation 7, β2 represents the audit quality gap in
the pre-IFRS period while β3 captures the difference in audit quality gap between the pre- and
post-IFRS periods. Since the auditor dummy variable is defined as one if it is a Big 4 client and
zero otherwise, a significantly positive coefficient estimate for the interaction term would
indicate that the audit quality gap as measured by client financial statement comparability has
widened in the post-IFRS periods. There are conflicting predictions in the literature regarding the

Academy of Accounting and Financial Studies Journal Volume 20, Number 1, 2016
121
sign of the interaction term. Some researchers suggest that as Big 4 firms continue to gain in size
and dominance, their sheer size can support greater in-house training programs (Francis & Yu,
2009). In addition, the growing complexity of accounting standards over time (particularly after
the adoption of IFRS) increases Big 4 auditors’ potential to add value (DeFond & Zhang, 2014;
Magnan, 2008; Kim et al. 2012; DeGeorge et al. 2013). Consequently, a larger quality gap is
predicted. However, others would argue that the frequent transfer of CPAs between Big 4 and
non-Big 4 firms and the ensuing spillover in knowledge transfers would reduce the quality
difference of in-house training programs between Big 4 and non-Big 4 firms over time, and
therefore would reduce the audit quality gap (Lawrence et al. 2011). Consequently, we make no
predictions regarding the sign of the interaction term and view it also as an empirical issue.
SAMPLE SELECTIONS AND THE DATA
Our initial sample is obtained from the China Securities Market and Accounting
(CSMAR) database. The sample period is from 2003 to 2012. Semiannual data from 2003 to
2006 and from 2007 to 2012 were used to estimate CompAccij,t measures for 2006 (pre-IFRS
period) and 2010 to 2012 (post-IFRS period), respectively. Since Hong Kong adopted the IFRS
in 2005, the above test periods allow us to keep the accounting standard variable in Hong Kong
constant over the sample period. We exclude financial and insurance firms from the sample
because they have special operating characteristics and are subject to special accounting rules
and additional regulations. We also exclude Chinese firms that are listed in international
exchanges because these firms face different legal and enforcement environments. Finally, we
exclude firms that are cross-listed in China and Hong Kong because the two sets of financial
statements prepared by these firms are substantially the same. This procedure yields 40,426 pairs
of CompAccij,t scores. Sample distribution by auditor and year is reported in Table 1.
Table 1
SAMPLE DISTRIBUTION
Year
Big 4
Non-Big 4
Total
2006
665
9,462
10,127
2010
879
9,848
10,727
2011 880 9,136 10,016
2012
820
8,736
9,556
Total
3,244
37,182
40,426
To mitigate the influence of outliers, all regression variables in our final sample were
winsorized at 1% and 99% levels. Though not reported, our conclusions are substantially the
same when the variables were winsorized at 5% and 95% levels. Sample descriptive statistics of
all regression variables are presented in Table 2.
Though we did not report them, the parameter estimates of accounting functions from
estimating Equation 2 are substantially similar to those in De Franco, Kothari, and Verdi (2011),
validating both our sample selection procedures and comparability score estimation.

Academy of Accounting and Financial Studies Journal Volume 20, Number 1, 2016
122
Table 2
DESCRIPTIVE STATISTICS
Big 4
(N=3,244)
Non-Big 4
(N=31,782)
Variables Mean Std. Dev. Mean Std. Dev.
Sizeij,t 2.19 1.49
1.66 1.27
Leverageij,t 0.38 0.20
0.37 0.21
MKTBVij,t 2.44 6.43
3.35 8.22
CFOij,t 0.11 0.12
0.11 0.11
LossProbij,t 0.26 0.30
0.28 0.28
Salesij,t 0.18 0.20
0.19 0.25
Growthij,t 5.27 32.52
5.63 32.58
This table presents descriptive statistics of control variables used in all regressions.
Variable Definitions:
Sizeij,t = firm size equals natural logarithm of total assets;
Leverageij,t = leverage ratio equals total liability divided by total assets;
MKTBVij,t = market value to book value ratio equals market value of equity divided by book value of equity;
CFOij,t = cash flow ratio equals cash flows from operations scaled by total assets;
LossProbij,t = loss probability is the proportion of quarters the firm reports a negative quarterly income before
extraordinary items in the past eight semi-annual periods;
Salesij,t = standard deviation of sales is calculated over the preceding eight semi-annual periods;
Growthij,t = standard deviation of sales growth is calculated over the preceding eight semi-annual periods.
EMPIRICAL TESTS AND RESULTS
First, we examine the difference in cross-country comparability between Big 4 and non-
Big 4 clients by comparing the mean and median comparability scores of the two subsamples.
The mean and median comparability scores of the Big 4 and non-Big 4 subsamples are reported
in Table 3. The mean comparability score for Big 4 clients (-0.067) is higher than that for non-
Big 4 clients (-0.074), and the difference is statistically significant, suggesting that for similar
economic events, Big 4 clients report more comparable accounting amounts. The results don’t
support the litigation risk avoidance theory, which predicts no significant differences in audit
quality between Big 4 and non-Big 4 firms. Instead, the findings are consistent with the
reputation protection theory, which suggests Big 4 firms exert greater efforts to provide higher
quality audit service to protect their reputation (Palmrose, 1988; Becker et al. 1998; Khurana &
Raman, 2004; Behn et al. 2008).
Lawrence et al. (2011) report that the differences in certain widely used audit quality
proxies in the literature largely reflect client characteristics such as firm size. To ensure that the
difference in comparability scores between Big 4 and non-Big 4 clients reported in Table 3 is not
driven by firm-level characteristics, we estimated Equation 6 developed in Section 2 to control
for firm size and other firm-level characteristics. The regression results are reported in Table 4,
Column A. The results are consistent with those reported in Table 3. The coefficient estimate for
the auditor dummy variable is positive and statistically significant, indicating that financial
statements of Big 4 clients are more comparable than those of non-Big 4 clients after controlling
for firm specific characteristics.

Academy of Accounting and Financial Studies Journal Volume 20, Number 1, 2016
123
Table 3
COMPARABILITY SCORES OF BIG 4 VERSUS NON-BIG 4 CLIENTS
CompAccij,t
Mean
Median
Big 4 clients
(N=3,244) -0.081
-0.053
Non-Big 4 clients
(N=37,182) -0.091
-0.061
Difference in comparability scores
0.010***
0.008***
(T-Value/Wilcoxon Z-Value)
(10.99)
(12.76)
*, **, *** Denotes statistical significance at the 10%, 5%, and 1% levels, respectively.
Differences in means (medians) are assessed using a t-test (Wilcoxon rank sum test).
Table 4
REGRESSION RESULTS
Variables
Panel A
OLS Regression
Panel B
Two-way Clustered
Intercept
-0.090***
-0.090***
(-8.85)
(-2.93)
Auditorij,t 0.008***
0.008**
(6.33)
(2.58)
Sizeij,t 0.000
0.000
(0.063)
(0.18)
Leverageij,t -0.014***
-0.014
(-3.41)
(-0.83)
MKTBVij,t 0.003***
0.003***
(16.98)
(5.53)
CFOij,t -0.018***
-0.018*
(-3.44)
(-1.72)
LossProbij,t -0.101***
-0.101***
(-27.62)
(-8.84)
Salesij,t -0.020***
-0.020***
(-4.17)
(2.82)
Growthij,t 0.000***
0.000***
(13.97)
(4.05)
Observations
40,426
40,426
Adjusted R2
0.113
0.113
*, **, *** Denotes statistical significance at the 10%, 5%, and 1% levels, respectively, two-tailed.
Column A presents regression results using OLS regression. Column B presents regression results using
Petersen’s (2009) two-way clustered method.

Academy of Accounting and Financial Studies Journal Volume 20, Number 1, 2016
124
The results reported in Tables 4, Column A are from ordinary least squares (OLS)
regression using panel data pooled across firms and over time. Standard errors from OLS will be
consistent as long as the regression residuals are uncorrelated across firms and over time.
However such uncorrelatedness is unlikely to hold in our research context because of both
market-wide shocks that induce correlation among firms and persistent firm-specific shocks that
induce correlation over time (Thompson, 2011). To correct for simultaneous correlation along
these two dimensions, we adjust standard errors for the correlation across firms and over time by
clustering two-way (firm and time) using Petersen’s two-way clustered method. We compute
covariance estimator by adding the estimator that clusters by firms to the estimator that clusters
by time and subtracting the usual heteroskedasticity-robust OLS covariance matrix. Results from
the two-way clustered analysis using Equations 6 are reported in Table 4, Columns B. The
regression results from Petersen’s two-way clustered analysis reported in Column B are
substantially the same as those reported in Column A, suggesting that our results are not driven
by the correlation across firms and over time in our panel data. Taken together, the results in
Tables 3 and 4 suggest that the cross-country comparability of Big 4 clients is higher than that of
non-Big 4 clients after controlling for firm-specific characteristics and the correlation across
firms and over time in the panel data.
Next, we investigate the effect of IFRS adoption on comparability by examining the
differences in cross-country comparability of Big 4 and non-Big 4 clients for the pre- and post-
IFRS periods. Comparability scores for the pre- and post-IFRS periods are reported in Table 5,
Panels A and B, respectively.
Table 5
COMPARABILITY SCORES OF BIG 4 VERSUS NON-BIG 4 CLIENTS
FOR PRE- AND POST-IFRS PERIODS
Panel A: Pre-IFRS Period CompAccij,t
Mean
Median
Big 4 clients
(N=665) -0.070
-0.048
Non-Big 4 clients
(N=9,462) -0.077
-0.055
Difference in comparability scores
0.007***
0.007***
(T-Value/Wilcoxon Z-Value)
(2.77)
(8.58)
Panel B: Post-IFRS Period CompAccij,t
Mean
Median
Big 4 clients
(N=2,579) -0.066
-0.045
Non-Big 4 clients
(N=27,720) -0.072
-0.049
Difference in comparability scores
0.006**
0.004***
(T-Value/Wilcoxon Z-Value)
(2.36)
(6.13)
*, **, *** Denotes statistical significance at the 10%, 5%, and 1% levels, respectively.
Differences in means (medians) are assessed using a t-test (Wilcoxon rank sum test).

Academy of Accounting and Financial Studies Journal Volume 20, Number 1, 2016
125
Panel A reports comparability scores for Big 4 and non-Big 4 clients for the pre-IFRS
period. The mean comparability score of Big 4 clients is -0.070, which is significantly higher
than that of non-Big 4 clients, -0.077. The result suggests that financial statements of Big 4
clients are more comparable than those of non-Big 4 clients under the Chinese local accounting
standards.
Panel B of Table 5 reports comparability scores for the post-IFRS period. Note that
comparability scores for both Big 4 and non-Big 4 clients reported in Panel B are higher than
those reported in Panel A, suggesting that the adoption of IFRS in China improved the cross-
country comparability of Chinese companies, which is consistent with the findings in prior
comparability studies. More importantly, the mean comparability score of Big 4 clients (-0.066)
remains significantly higher than that of non-Big 4 clients (-0.072). In summary, the results in
Table 5 suggest that the adoption of IFRS in China improved the cross-country comparability of
both Big 4 and non-Big 4 clients. Furthermore, the comparability of Big 4 clients is higher than
that of non-Big 4 clients under both the local accounting standards and the IFRS. The results
reported in Table 5 are consistent with the extant audit literature, which generally finds that Big
4 firms provide higher quality audit services (Palmrose, 1988; Becker et al. 1998; Khurana &
Raman, 2004; Behn et al. 2008).
Finally, we examine changes in the audit quality gap between Big 4 and non-Big 4 firms
upon the adoption of IFRS in China by estimating Equation 7 developed in Section 2. In addition
to the auditor dummy variable and control variables for firm-level characteristics used in
Equation 6, we add an accounting standard dummy variable and an interaction term of the
auditor and standard dummy variables in Equation 7. The additional independent variables allow
us to assess the audit quality gap for the pre- and post-IFRS periods after controlling for the
differences in accounting standard quality as well as firm-level characteristics. Our primary
interest is the coefficient estimate for the interaction term of the auditor and standard dummy
variables, β3. In the context of Equation 7, β3 captures the change in audit quality gap between
pre- and post-IFRS periods whereas β2 represents the audit quality gap for the pre-IFRS period.
A significantly positive (negative) coefficient estimate for the interaction term (β3) would
suggest that the audit quality gap has widened (narrowed) in the post-IFRS period over the pre-
IFRS period. The regression results using OLS regression and Petersen’s two-way clustered
analysis are reported in Table 6, Panel A and Panel B, respectively.
The coefficient estimate for the accounting standard dummy variable, β1, reported in
Panel A is positive and statistically significant, indicating that the adoption of IFRS in China has
improved financial statement comparability in general. This result is consistent with findings in
prior IFRS comparability studies. The coefficient estimate for the auditor dummy variable, β2,
which captures the difference in comparability between Big 4 and non-Big 4 firms in the pre-
IFRS period, is also positive and statistically significant. This result is consistent with that
reported in Panel A of Table 5, suggesting that the comparability of Big 4 clients is significantly
higher than that of non-Big 4 clients in the pre-IFRS period (i.e., under Chinese accounting
standards). More importantly, the coefficient estimate for the interaction term, β3, is not
significantly different from zero, suggesting no significant changes in comparability gap upon
the adoption of IFRS in China. The results reported in Panel B using Petersen’s two-way
clustered method are substantially the same as those reported in Panel A. Although not reported,
our conclusions are unaltered after controlling for potential clients’ self-selection bias using a
two-stage approach.

Academy of Accounting and Financial Studies Journal Volume 20, Number 1, 2016
126
Table 6
REGRESSION RESULTS
Variables
Panel A
OLS Regression
Panel B
Two-way Clustered
Intercept
-0.071***
-0.071***
(-6.56)
(-3.59)
Standardij,t 0.007***
0.007**
(7.58)
(2.21)
Auditorij,t 0.007*** 0.007***
(2.59) (3.78)
Auditorij,t* Standardij,t 0.002 0.002
(0.63) (0.98)
Sizeij,t -0.001*
0.001
(-1.71)
(0.81)
Leverageij,t -0.011**
-0.011
(-2.44)
(-0.67)
MKTBVij,t 0.003***
0.003***
(16.73)
(5.45)
CFOij,t -0.011**
-0.011
(-2.18)
(-1.10)
LossProbij,t -0.104***
-0.104***
(-28.08)
(-8.14)
Salesij,t -0.020***
-0.020***
(-4.15)
(2.85)
Growthij,t 0.000***
0.000***
(13.84)
(4.02)
Observations
40,426
40,426
Adjusted R2
0.115
0.113
*, **, *** Denotes statistical significance at the 10%, 5%, and 1% levels, respectively, two-tailed.
Column A presents regression results using OLS regression. Column B presents regression results using
Petersen’s (2009) two-way clustered method.
Variables definitions:
Standard = accounting standard dummy variable equals one for post-IFRS period and zero otherwise;
Auditor = auditor dummy variable equals one if the Chinese company is a Big 4 client, and zero
otherwise;
Auditor*Standard = an interaction term of the auditor and standard dummy variables.
All control variables are defined in Table 2.
In summary, the empirical results of this study indicate that for similar economic events,
Big 4 clients report on average more comparable accounting amounts than non-big 4 clients.

Academy of Accounting and Financial Studies Journal Volume 20, Number 1, 2016
127
The difference in comparability between Big 4 and non-Big 4 clients persists across the pre- and
post-adoption periods, and remains relatively stable. The results are unlikely to be driven by
firm-specific characteristics, the correlation across firms and over time of the panel data, or
clients’ self-selection bias.
CONCLUSIONS
This study examines the differences in audit quality between Big 4 and non-Big 4 firms
and the effect of IFRS adoption on audit quality gap. Differing from prior audit quality studies,
we measure audit quality by the cross-country comparability of client IFRS-based financial
statements. Using a sample of Chinese companies for the period of 2006 and 2010-2012, we find
that cross-country comparability of Big 4 clients is generally higher than that of non-Big 4
clients. Furthermore, the higher comparability of Big 4 clients persists across both the pre- and
post-IFRS periods. Finally, the audit quality gap between Big 4 and non-Big 4 firms, as
measured by the cross-country comparability of client financial statements, remains relatively
stable over the pre- and post-IFRS periods.
This study employed the comparability measure developed by De Franco, Kothari, and
Verdi (2011), who use earnings as the summary measure of accounting information. While
earnings are arguably the most important summary measure of accounting performance, it
captures only one financial statement dimension. Future studies may explore multidimensional
measures of financial statement comparability that combine both the income statement and the
balance sheet perspectives.
ENDNOTES
1 Francis et al. (2014) attempt to bring the audit research and comparability studies together in their study of
auditor style. Using U.S. data, they find that financial statements audited by the same Big 4 firm are more
comparable that those audited by different Big 4 firms, and attribute such difference to auditor style. Our
study differs from Francis et al.’s study in two major aspects. First, Francis et al. focus on the relationship
between auditor style and comparability by examining firm-pairs audited by the same Big 4 firm versus
different Big 4 firms whereas our study investigates differences in comparability between Big 4 versus non-
Big 4 clients. Second, Francis et al. focus on within-country comparability of U.S. firms’ GAAP-based
financial statements whereas our study focuses on the cross-country comparability of Chinese companies’
IFRS-based financial statements.
2 We choose Chinese and Hong Kong companies to form our firm-pairs because while Mainland China and
Hong Kong are one country, they have difference economic systems, legal origins, levels of investor
protection and litigation risks. This unique institutional setting allows us to investigate IFRS-based
financial statement comparability across different legal origins and litigation risks without some of the
confounding factors in cross-country studies.
ACKNOWLEDGEMENT
Capable research assistance from Yang Yi in data collection and analysis and helpful comments from
participants of 2015 European Accounting Association Annual Congress in Glasgow and American Accounting
Association Annual Meeting in Chicago are gratefully acknowledged. Jinsong Tan acknowledges the financial
support from China National Natural Science Foundation (Grant No. 71272196 and 71572206), Guangdong Key
Research Institute of Humanities and Social Sciences (Grant No.2012JDXM-0002), and China Ministry of Finance’s
Project to Support Accounting Masters. Zhemin Wang acknowledges the financial support from Nanfang College.

Academy of Accounting and Financial Studies Journal Volume 20, Number 1, 2016
128
REFERENCES
Ball, R. (2006). International financial reporting standards (IFRS): Pros and cons for investors. Accounting and
Business Research, 36(1), 5-27.
Ball, R., A. Robin & J.S. Wu (2003). Incentives versus standards: properties of accounting income in four East
Asian countries. Journal of Accounting and Economics, 36, 235-270.
Barth, M. E., W. R. Landsman, M. H. Lang & C. Williams (2012). Are IFRS-based and US GAAP-based
accounting amounts comparable? Journal of Accounting and Economics, 54(1), 68-93.
Beatty, R. (1989). Auditor reputation and the pricing of initial public offerings. The Accounting Review, 64(4), 693-
709.
Becker, C., M., DeFond, J.Jiambalvo & K. R. Subramanyam (1998). The effect of audit quality on earnings
management. Contemporary Accounting Research, 15(1), 1-24.
Behn, B., J. H. Choi & T. Kang (2008). Audit quality and properties of analyst earnings forecasts. The Accounting
Review, 83(2), 327-359.
Boone, J., I. Khurana & K. Raman (2010). Do the Big 4 and the second-tier firms provide audits of similar quality?
Journal of Accounting and Public Policy, 29(4), 330-352.
Bradshaw, M. T., & G. S. Miller (2008). Will harmonizing accounting standards really harmonize accounting?
Evidence from non-U.S. Firms adopting U.S. GAAP. Journal of Accounting, Auditing & Finance, 23(2),
233-264.
Bradshaw, M. T., G. S. Miller & G. Serafeim (2009). Accounting method heterogeneity and analysts’ forecasts.
(Working paper). The University of Chicago, University of Michigan, & Harvard University.
CFA Institute Center (2009). DG MARKT: Consultation on control structures in audit firms and their consequences
on the audit market. Working paper, CFA Institute.
Cairns, D. (1999). Degree of compliance. Accountancy International, September, pp. 68-69.
Camfferman, K. & S. Zeff (2007). Financial Reporting and Global Capital Markets. A History of the IASC, 1973-
2000, Oxford University Press.
DeAngelo, L. (1981). Auditor size and audit quality. Journal of Accounting and Economics, 3(3), 183-199.
DeFond, M. & C. Lennox (2011). The effect of SOX on small auditor exits and audit quality. Journal of Accounting
& Economics, 52(1), 21-40.
Defond, M. & J. Zhang (2014). A review of archival auditing research. Journal of Accounting and Economics.
58(2-3), 275-326.
DeGeorge, E.T., C.B. Ferguson & N.A. Spear (2013). How much does IFRS cost? IFRS adoption and audit fees.
The accounting Review, 88(2), 429-462.
Dopuch, N. & D. Simunic (1980). The nature of competition in the auditing profession: a descriptive and normative
view. In Regulation and the Accounting Profession edited by J. Buckley and F. Weston, Belmont, CA:
Lifetime Learning Publications. 34(2), 283-289.
De Franco, G., S. P. Kothari & R. S. Verdi (2011). The benefits of financial statement comparability. Journal of
Accounting Research, 49(4), 895-931.
Fan, G. & T. J. Wong (2005). Do external auditors perform a corporate governance role in emerging markets?
Evidence from East Asia. Journal of Accounting Research, 43(1), 35-72.
Financial Accounting Standards Board (FASB) (1980). Qualitative Characteristics of Accounting Information.
Concepts Statement No. 2. Norwalk, CT, FASB.
Francis, J. R. & M. D. Yu (2009). Big 4 office size and audit quality. The Accounting Review, 84(5), 1521-1552.
Francis, J. R., I. Khurana & M. Pereira (2003). Role of accounting and auditing in corporate governance, and the
development of financial markets around the world. Asia Pacific Journal of Accounting and Economics,
June, 1-30.
Francis, J. R., M. Pinnuck & O. Watanabe (2014). Auditor Style and Financial Statement Comparability. The
Accounting Review, 89(2), 605-633.
Gul, R., K. J. Kim & A. Qiu (2009). Ownership concentration, foreign shareholding, audit quality, and stock price
synchronicity: Evidence from China. Journal of Financial Economics, 95(3), 425-442.
Hutchens, W. (2003). Private securities litigation in the People’s Republic of China: material disclosure about
China’s legal system. University of Pennsylvania Journal of International Economics Law, 24(3), 599-689.
Khurana, I. & K. Raman (2004). Litigation risk and the financial reporting credibility of Big 4 versus non-Big 4
audits: Evidence from Anglo-American countries. The Accounting Review, 79(2), 473-495.
Kim, J.B., X.H. Liu & L. Zheng (2012). The impact of mandatory IFRS adoption on audit fees: Theory and
evidence. The Accounting Review, 87(6), 2061-2094.

Academy of Accounting and Financial Studies Journal Volume 20, Number 1, 2016
129
Krishman, G. (2003). Audit quality and the pricing of discretionary accruals. Auditing: A Journal of Practice &
Theory, 22(1), 109-126.
Lawrence, A., M. Minutti-Meza & P. Zhang (2011). Can Big 4 versus non-Big 4 differences in audit quality proxies
be attributed to client characteristics? The Accounting Review, 86(1), 259-286.
Leuz, C. (2003). IAS versus US GAAP: information asymmetry-based evidence from Germany’s New Market.
Journal of Accounting Research, Vol. 41, 445-472.
Li, C., F. Song & S. M. Wong (2008). A continuous relation between audit firm size and audit opinions: evidence
from China. International Journal of Auditing, 12(2), 111-127.
Lin, Z. J., M. Liu & Z. Wang (2009). Market implications of the audit quality and auditor switches: evidence from
China. Journal of International Financial Management & Accounting, 20(1), 35-78.
Magnan, M.L. (2008). Discussion of “Audit pricing, legal liability regimes, and Big 4 premiums: Theory and cross-
country evidence”. Contemporary Accounting Research, 25(1), 101-108.
Mitton, T. (2002). A cross-firm analysis of the impact of corporate governance on the East Asian financial crisis.
Journal of Financial Economics, 64(2), 215-241.
Moizer, P. (1997). Auditor reputation: the international empirical evidence. International Journal of Auditing, 1(1),
61-74.
Palmrose, Z. V. (1998). An analysis of auditor litigation and audit service quality. The Accounting Review, 63(1),
55-73.
Securities and Exchange Commission (SEC). (2000). SEC Concept Release: International Accounting Standards.
Available at http://sec.gov/rules/concept/34-42430.htm.
Smart, S. & C. Zutter (2003). Control as a motivation for under pricing: A comparison of dual and single-class IPOs.
Journal of Financial Economics, 69(1), 85-110.
Street, D. & S. Gray (2001). Observance of international accounting standards: factors explaining non-compliance.
ACCA Research Report No 74.
Thompson, S.B. (2011). Simple formulas for standard errors that cluster by both firm and time. Journal of Financial
Economics, 99(1), 1-10.
Yip, R. W. Y. & D. Young (2012). Does mandatory IFRS adoption improve information comparability? The
Accounting Review, 87(5), 1767-1789.


