
[2]
A Technical Appraisal of the Auki Water Supply System
Malaita Island, Solomon Islands
by Harald Schölzel
June 1998 Technical Report 261
Funded by the Government of Taiwan and the United Nations Development Programme
[TR261 - Schölzel]
[3]
TABLE OF CONTENTS
1. INTRODUCTION.................................................................................................................................. 5
1.1. GENERAL ......................................................................................................................................... 51.2. SCOPE OF THE TRIP AND THE REPORT ................................................................................................ 6
2. ACKNOWLEDGEMENT...................................................................................................................... 7
3. SUMMARY............................................................................................................................................ 8
4. DESCRIPTION AND ANALYSIS OF THE AUKI WATER SUPPLY SYSTEM ............................... 9
4.1. DISTRIBUTION SYSTEM ..................................................................................................................... 94.2. WATER SOURCES............................................................................................................................ 11
4.2.1. Main Source (Kwaibala Source)................................................................................................. 114.2.2. Gallery Source........................................................................................................................... 13
4.3. PUMPS AND STORAGE TANKS .......................................................................................................... 134.3.1. Main Source Pumps and Storage Tanks...................................................................................... 134.3.2. Gallery Pumps and Storage Tanks ............................................................................................. 15
4.4. CONCLUSIONS ................................................................................................................................ 17
5. RECOMMENDATIONS...................................................................................................................... 17
5.1. GENERAL ....................................................................................................................................... 175.2. MAIN SOURCE ................................................................................................................................ 185.3. KWAIBALA SOURCE PUMPS AND MAINS .......................................................................................... 195.4. GALLERY PUMPS ............................................................................................................................ 205.5. DISTRIBUTION NETWORK ................................................................................................................ 20
APPENDIX 1: KWAIBALA WATER SOURCE (MAIN SOURCE).......................................................... 21
APPENDIX 2: KWAIBALA SOURCE PUMPS.......................................................................................... 25
APPENDIX 3: GALLERY PUMPS ............................................................................................................. 36
APPENDIX 4: RECOMMENDATIONS ..................................................................................................... 43

[TR261 - Schölzel]
[4]
TABLE OF FIGURES
FIGURE 1: LOCATION OF MALAITA ISLAND IN THE SOLOMON ISLANDS GROUP .................................................... 5FIGURE 2: SCHEMATIC DRAWING OF THE PRESENT AUKI WATER SUPPLY SYSTEM WITH ITS MAJOR COMPONENTS. 10FIGURE 3: SKETCH OF THE MAIN SOURCE FOR THE AUKI WATER SUPPLY SYSTEM ............................................... 12FIGURE 4: SCHEMATIC DRAWING OF THE PUMPING ARRANGEMENTS FROM THE MAIN SOURCE ............................ 14FIGURE 5: SCHEMATIC DRAWING OF THE PUMPING ARRANGEMENTS AT THE GALLERY SOURCE (BOLD FIGURES
INDICATE PUMPING DIRECTLY INTO THE DISTRIBUTION SYSTEM) ............................................................... 16FIGURE 6: PROPOSED REHABILITATION MEASURE FOR THE KWAIBALA SOURCE ................................................. 19
TABLES
TABLE 1: ASSET DESCRIPTION AND THEIR OPERATION FOR THE AUKI WATER SUPPLY SYSTEM............................. 9TABLE 2: MAJOR ELEVATIONS, DISTANCES AND PIPE SPECIFICATIONS FOR THE AUKI WATER SUPPLY SYSTEM.... 11TABLE 3: SUMMARY OF THE MEASUREMENTS FOR THE PUMPING ARRANGEMENT AT THE MAIN SOURCE .............. 14
[TR261 - Schölzel]
[5]
1. Introduction
1.1. General
Auki is a township in the Malaita Province of the Solomon Islands with a population of about4,000 people. It is the seat of the administration for the Malaita Province and the only majorsettlement on the island. Water supply problems were and are very common in Auki andsome efforts have been made to improve the situation. Though water hours are still imposedin Auki the situation has been substantially improved when the Solomon Islands WaterAuthority assumed responsibility for the water supply from the province government.
Figure 1 gives an overview on the location of Malaita Island.
Figure 1: Location of Malaita Island in the Solomon Islands Group
Malaita
Guadalcanal
San Christobal
Santa Isabel
Florida Islands
Auki

[TR261 - Schölzel]
[6]
1.2. Scope of the Trip and the Report
This report is part of SOPAC's technical assistance to the Solomon Islands, in this particularcase to the Solomon Islands Water Authority (SIWA). All relevant data was collected during afield trip to the Solomon Islands from the 19th to 30th of May 1998. The author together withMr Lemuel Siosi, Design and Planning Engineer for SIWA visited Malaita Province on 27th
and 28th May.
The scope of this report is to describe and analyse the Auki water supply system andrecommend improvements to the current operation as well as rehabilitation measures. It willbe used as basis for a broader analysis of the water supply system applying distributionnetwork modelling. It is also meant to provide some examples and training on how analysisof small water-distribution systems can be carried out.
The trip provided on-site training for SIWA staff in pipe-flow measurements, to be followed upby a four-week attachment of SIWA's Design and Planning Engineer, Lemuel Siosi, toSOPAC Water Resources Unit to further investigate the Auki water supply system anddevelop a strategy for its rehabilitation.

[TR261 - Schölzel]
[7]
2. Acknowledgement
The author wishes to thank SIWA staff for their strong commitment to the project and inparticular, Donald Makini, General Manager and John Waki, Operations and MaintenanceEngineer. Mr Lemuel Siosi deserves special thanks for his dedication to the work during thefield trip to Auki.
The Government of Taiwan, the United Nations Development Programme and SOPAC,through its regular budget, funded this project.

[TR261 - Schölzel]
[8]
3. Summary
The Auki Water Supply System was investigated for SIWA on the 27th and 28th of May.Significant data was gathered by using a portable flowmeter and questioning the systemoperator. However, data such as the number of people served and diurnal consumptionpatterns could not be collected due to time constraints.
The existing water supply system is divided into two pressure zones with it’s majorcomponents given in Table 1.
Analysis carried out by comparing pump performance curves and pipe resistance curvesconfirmed that the installed pumps and rising mains are undersized. Investigations carriedout at the main source show that only a portion of the available water is being captured. Theloss through leakage at the intake is of the same magnitude as the current abstraction rate of7 l/s showing the potential for future upgrading of the source. However, at present theinstalled pump capacity and rising mains impede higher abstraction and supply rates.
Rehabilitation of the scheme is imminent but should be subject to a broader analysis bymodelling the entire distribution system. This investigation should be carried out as a trainingproject for SIWA's Design and Planning Engineer under the supervision of SOPAC.Nevertheless, some features which should be considered for the rehabilitation are recorded.
Table 1: Asset description and their operation for the Auki Water Supply System
Item Flow or Volume Description/ OperationKwaibala Spring
Source7 l/s
Spring source ,source captured through a box allowingsignificant leakage, sustainable flow rate > 12 l/s
11 kW Pump 4.9 l/sSouthern Cross, unknown model, operated 24 hours a
day
Kw
aiba
laS
ourc
e
7.5 kW Pump 5.5 l/s
Bot
h pu
mps
para
llel 7
l/s
Southern Cross, Impeller 192mm, 2900 rpm, operated 24hours a day
Gallery Source max 4.8 l/s unsustainable flow rate, operated at irregular intervals
Inflow VolumeStorage Tank
2.5 l/s 180 m3
Circular metal construction, d = 9.8 m, h = 2.4 m, feedinglow-level distribution system at a rate of 6 l/s during water
hours
Storage Tank 4.5 l/s - 180 m3 Circular metal construction, d = 9.8 m, h = 2.4 m, usedexclusively as intermediate storage for the high-level tank
11 kW Pump 4.8 l/sSouthern Cross, Impeller 215mm, 2900 rpm, operated at
irregular intervals
Gal
lery
15 kW Pump 6.7 l/s
Bot
h pu
mps
para
llel 7
l/s
Southern Cross, operated at regular intervals approx. 16hours per day
Inflow Volume
Hig
hLe
vel
Storage Tank6.7 l/s - 180 m3
Circular metal construction, d = 9.8 m, h = 2.4 m, feedinglow-level distribution system at a rate of 6 l/s during water
hours

[TR261 - Schölzel]
[9]
4. Description and Analysis of the Auki Water Supply System
4.1. Distribution System
The Auki water supply system distributes untreated water to about 4,000 people from a mainspring source located approximately one kilometre southwards from the main centre. ThePacific Island Handbook (1992) describes Auki as "a township with modern offices andhousing, a district hospital, schools, a shopping centre, harbour facilities for coastal ships,yards for boat building etc." From the point of view of a water supplier it is important to statethat houses are scattered over a wide area which requires relatively long mains anddistribution pipes considering the number of people supplied with water.
SIWA assumed responsibility for the Auki water supply system from the ProvinceAdministration in 1995 and since then the water supply has been gradually improved toprovide a reliable supply. However, the poor status of the distribution system and limitedfinancial and management resources constrain the water supply to 10 hours per day.
The entire system has been mapped and the information on hardware such as pipediameters, fitting, tank location and pump location have been entered into a GeographicalInformation System (GIS). The data stored is partly erroneous and has not been kept up todate. All information gathered during the field trip to Auki has been used to update thedatabase.
By using a portable ultrasonic flowmeter1 and reading in-line meter records the abstractionrate at the main source could be determined to be about 7 l/s. The central accounting systemin Honiara lists 333 connections out of 269 as domestic (184 metered, 85 un-metered) out ofone serves over 1000 people through associated standpipes and 64 as commercial (21metered, 43 un-metered) connections. This is inconsistent with the information obtained inAuki stating that over 400 official connections exist . However, assuming a population servedof about 4,000 people the daily consumption rate would be about 150 litres per day perperson (l/p/d); for a population of 5,000 would still yield 120 l/p/d. Both values aresignificantly less than the design consumption rate of 215 l/p/d SIWA which usually applies tothe design of urban water supply systems.
Figure 2 shows a schematic drawing of the Auki water supply system. The majorcomponents are the main source with its two associated 7.5 kW and 11 kW pumps and two80 mm supply mains pumping into the two low-level tanks. Parts of the two mains weresupposed to have been replaced by a new 100 mm PVC main laid in 1995. However, due tothe poor quality of the work, the new main could never be commissioned.
1 All measurements were taken using a Portaflow 300 ultrasonic flowmeter with a 2 MHz sensor manufactured byMICRONICS Ltd., UK.

[TR261 - Schölzel]
[10]
Distribution Area
180 m3 Storage Tank
Water Source
11 kW Pump11
180
180 180
180
117.5
11
15
?
Gov.House
Main Source
Gallery Source
Gallery Source Pumps
Main Source Pumps
Low-level Tanks
High-level Tank
10 l/s
6 l/s
Figure 2: Schematic drawing of the present Auki water supply system with its majorcomponents
The interconnection between both pipes and the connection of the Province Governor'shouse was determined through pipe flow measurements at the low-level tanks and the mainsource. The original plan doesn't contain this information.
At the gallery two tanks are being filled from the main source, but only one delivers water tothe low-level distribution system at a constant flow rate of about 6 l/s. The other tank is usedas an intermediate reservoir to pump water into the high-level tank. The interconnectingvalve between the two tanks is normally closed. The operator decides on the basis of hispersonal "as matters stand assessment" whether to open it or not.
From the second gallery tank (intermediate tank) water is pumped using a 15 kW pump intothe high level tank from where the water is reticulated into the system at a constant flow rateof about 10 l/s. The second 11 kW pump at the gallery operates on stand-by and pumpswater from the gallery source into the high-level tank. Both pumps sometimes pump directlyinto the high-level distribution system depending on the operator's assessment of thesituation. summarises the major elevations, distances and pipe specifications for the AukiWater Supply System.
? Unconfirmed Connection
[TR261 - Schölzel]
[11]
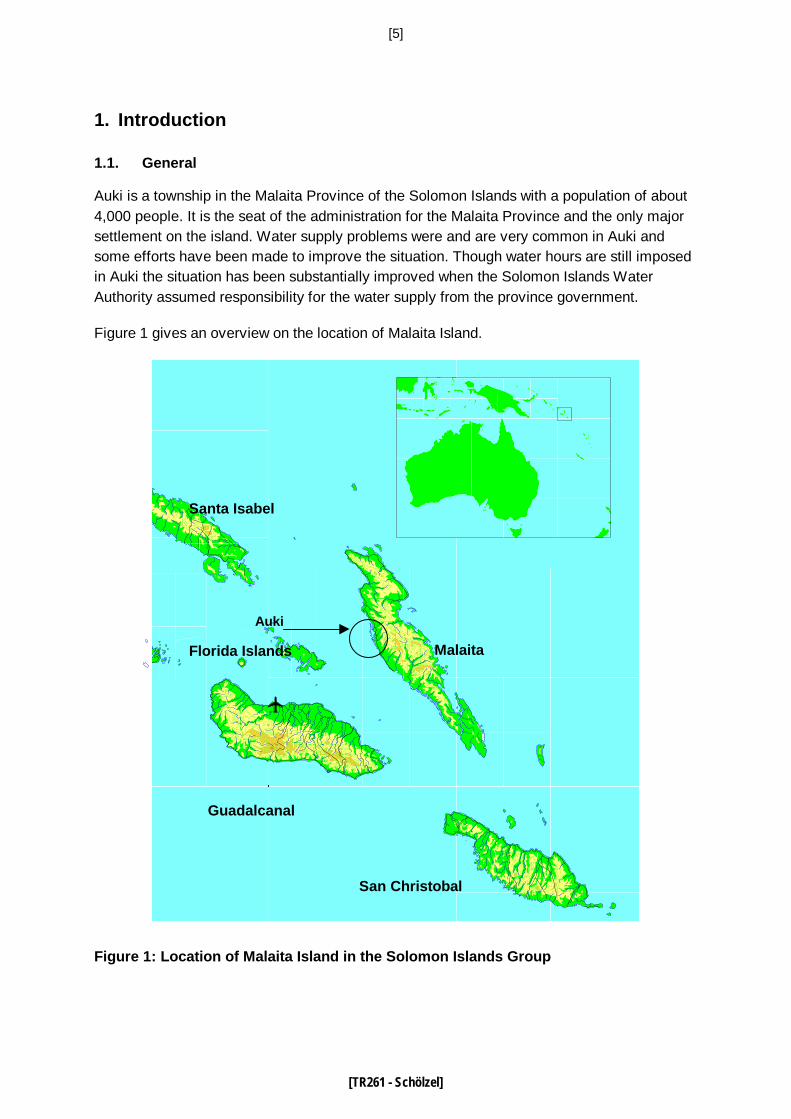
Table 2: Major elevations, distances and pipe specifications for the Auki Water SupplySystem
Location Elevation Straight LineDistance
Pipe Length Pipe Diameter PipeMaterial
[m] [m] [m] [mm]
MainSource
(Kwaibala)15.3
15 15 200, 80 PVC, Cast Iron
Pumps atMain
Source
16.8
1000 1800 80 PVC
StorageTanks atGallery
48.820 20 80 Cast Iron
Pumps atGallery
45.4
500 650 80 PVCHigh-level
Tank 85.6
The constant flow rates into the two distribution systems can be explained in terms of therestricted imposed water hours. It is very likely that consumers in Auki keep most of theirtaps open in order to get the biggest share possible if water is flowing into the systems. Itcould be observed that many households store water during the water hours impeding acorrect reflection of the diurnal water consumption patterns in Auki. The question markbeside the interconnecting valve in Figure 2 between the low-level and high-level distributionsystem indicates that it is not known whether the interconnection exists at all and whether atrade off between the two systems is possible. However, experience shows that connectionsbetween presumably separated pressure zones exist in many water supply systems.
4.2. Water Sources
4.2.1. Main Source (Kwaibala Source)
The main water source for the water supply is a kind of spring catchment southeast of themain township. Seepage and partly artesian groundwater is impounded by an artificial basinconstructed initially from bare rocks plaster mounted to a retaining wall and in 1985rehabilitated by a concrete structure (Figure 3).
The spring intake is founded on Alluvium while the steep slope and the major parts of thecatchment area consist of fractured limestone. A full understanding of the hydrologicalmechanism creating the spring could not be gained but it seems that perched watertables inthe limestone combined with a permeable fault running from west to east provide the waterinflux. Though no indications of imminent geo-hazards could be found further geological andhydrogeological investigations to assess the long term availability and the sustainableabstraction rate of this water source would be very desirable.

[TR261 - Schölzel]
[12]
It appears that the idea behind this structure is that the springwater should be captured withinthe structure (Basin 1) so that some reservoir is being created from which the water flowsinto Basin 2 through an inlet and is then is abstracted by a 200 mm PVC suction pipe. Basins2 and 3 are structures that were constructed as part of the 1985 rehabilitation and wereintended to limit the leakage to a tolerable rate though neither structure penetrates deepenough into impermeable underground to avoid the leakage.
The springs shown in Figure 3 are spots were water enters Basin 1 and were discoveredduring dryer times when it ran dry. However, they do not seem to be the only source. Gravelspots on the bottom of Basin 1 indicate continuous influx in these parts and some surfacewater could also be observed entering Basin 1.
No measurements of the overall yield of the source are available. Water losses at the twoindicated spots were estimated to be about 6 l/s, which is in the same range as theabstraction rate of between 6.6 l/s and 7.2 l/s. Hence, the yield at the time the source wasinspected can be estimated to 12 l/s. Photographs of the intake structure have been attachedas Appendix 1.
Areas of major leakage
40.50 m
12.20 m
4m
Springs
Steep Slope
Discharge
Suction LinePVC 200
Rock Wall
Concrete Wall
Basin
Basin
Basin
Inlet
Figure 3: Sketch of the main source for the Auki water supply system
During dryer periods the spring tends to run dry mainly due to the high losses. As a responseBasin 1 had been partly deepened to allow the suction pipe penetrating deeper into the basinand making a greater water body available for pumping. This measure can be seen only as aprovisional rehabilitation. The entire intake is in very poor condition and needs upgrading andrehabilitation. Solutions will be discussed in section 5.0.
To Pumps
1
2
3

[TR261 - Schölzel]
[13]
4.2.2. Gallery Source
The second source for the Auki water supply system is another artesian spring locatedbeneath the two low-level tanks and the Auki Power Station at about 45 m amsl. It is used topump only into the high-level tank. From what could be seen during the inspection the springis being captured through a simple 1-m wide and 2-m long perforated concrete box.Presumably water enters the box through the bottom. The water is clear and didn't smellalthough doubts about the water quality may be justified due to the closeness of the sourceto the Power Station with lots of diesel spillage on the same compound.
No measurements of the overall yield of the source are available. At the time of inspection,about 4.8 l/s were abstracted from the gallery source and the water level was falling.Therefore the sustainable abstraction rate is smaller than the measured pump rate.
4.3. Pumps and Storage Tanks
4.3.1. Main Source Pumps and Storage Tanks
Figure 4 shows a schematic drawing of the pumping arrangements at the main source withaveraged flow rates. Both pumps, sharing a PVC 200 mm suction line of about 20 m, pumpagainst a static head of about 35.5 m into the storage tanks at the gallery. At the moment thestandard operation is to have both pumps pumping 24 hours a day. Measurements taken atthe pressure side of the pumps give flow rates of 4.4 l/s for the 7.5 kW pump and about 2.8l/s for the 11 kW pump indicating that headloss for the bigger pump is much higher than forthe smaller pump. summarises the measurements at the Kwaibala Source.
In order to confirm this result a test of the pump performance was carried out running onepump at a time. The 11 kW pump generated a flow rate of about 4.9 l/s while the 7.5 kWpump generated a flow of 5.5 l/s. Assuming that interconnecting pipe no 4 in Figure 4 wasopen at the time, hence allowing the flow to separate and to use both pipes, the majorheadloss occurs in pipe no 3. It is also possible to infer from the measurements that whileboth pumps were operating, headloss in pipe no 6 is higher than in pipe no 5. The practicaluse of this information is that, if maintenance work is carried out it should first focus on thosetwo pipes. The pump performance test for the main source pumps has been attached asFigure A2.1 and a computed analysis (in Appendix 2) of the pumps with conventionalmethods has been attached as Figures A2.2 to A2.4.
2 Consolidated means in this context that the different pumping rates measured have been made consistent.

[TR261 - Schölzel]
[14]
180 180
117.5
Gov.House
Distribution Area
180 m3 Storage Tank
Water Source
11 kW Pump11
180
2.5 l/s4.5 l/s
0.1 l/s
0.1 l/s
4.4 l/s2.8 l/s
7.2 l/s
6 l/s
2.0 l/s
Usually closed
1
56
7
4
8
9
32
Figure 4: Schematic drawing of the pumping arrangements from the main source
Table 3: Summary of the measurements for the pumping arrangement at the mainsource
Another important result of the test refers to the flow rates entering the storage tanks. Withthe present operation routine using both pumps simultaneously 24 hours per day, water isabstracted from the main source at a rate of 7 l/s resulting in a daily production of about 605m3. Out of this 2.5 l/s or 216 m3/d of water is entering the storage tank feeding the low-leveldistribution area and 4.5 l/s or 389 m3/d entering the second tank to be pumped further intothe high-level tank leaving the low-level area with only 35 % of the daily production.
Pipe No. Material Diameter Flow Rate Comments
[-] [mm] [l/s]
1 PVC 200 6.6 -7.2 Measured at various times
2 Cast Iron 79 3.8 - 4.4Measured at the pressure end of
the pipe
3 Cast Iron 79 2.4 - 3.0Measured at the pressure end of
the pipe
4 PVC 80 (?) 2.0Estimated, pipe could not be
located and unearthed
5 PVC 80 2.5 Measured at the tank inlet
6 PVC 80 4.5 Measured at the tank inlet
7 PVC 25 0.1 Estimated
8 PVC 100 6.0 - 6.1Measured, flow rate almost
constant
9 PVC 25 0.1 Estimated
23

[TR261 - Schölzel]
[15]
Figure A2.5 shows the inflow-outflow analysis for the low-level storage tank applying themeasured inflow rate of 2.5 l/s and a constant outflow rate during water hours of 6 l/s. Waterhours (when water is available) are applied from 6.00 AM to 9.00 AM, 11.00 AM to 1.00 PMand 3.00 PM to 8.00 PM. Figure A2.6 shows the same analysis for a 12-day period.
The outflow divided by the inflow times the daily water hours or 6 / 2.5 * 10 = 24 [hours] givesthe required pumping time, which is in this special case 24 hours. In other words, the pumpshave to run 24 hours per day to supply 216 m3 at a flow rate of 6 l/s for ten hours a day. Thatleaves no space for any optimisation of the present configuration.
It can be further derived from Appendix 2.6 and 2.7 that the maximum volume in the tank, orthe fluctuating water body is about 90 m3 (or 50 % of the available storage capacity) or 42 %of the daily water consumption of that particular zone.
4.3.2. Gallery Pumps and Storage Tanks
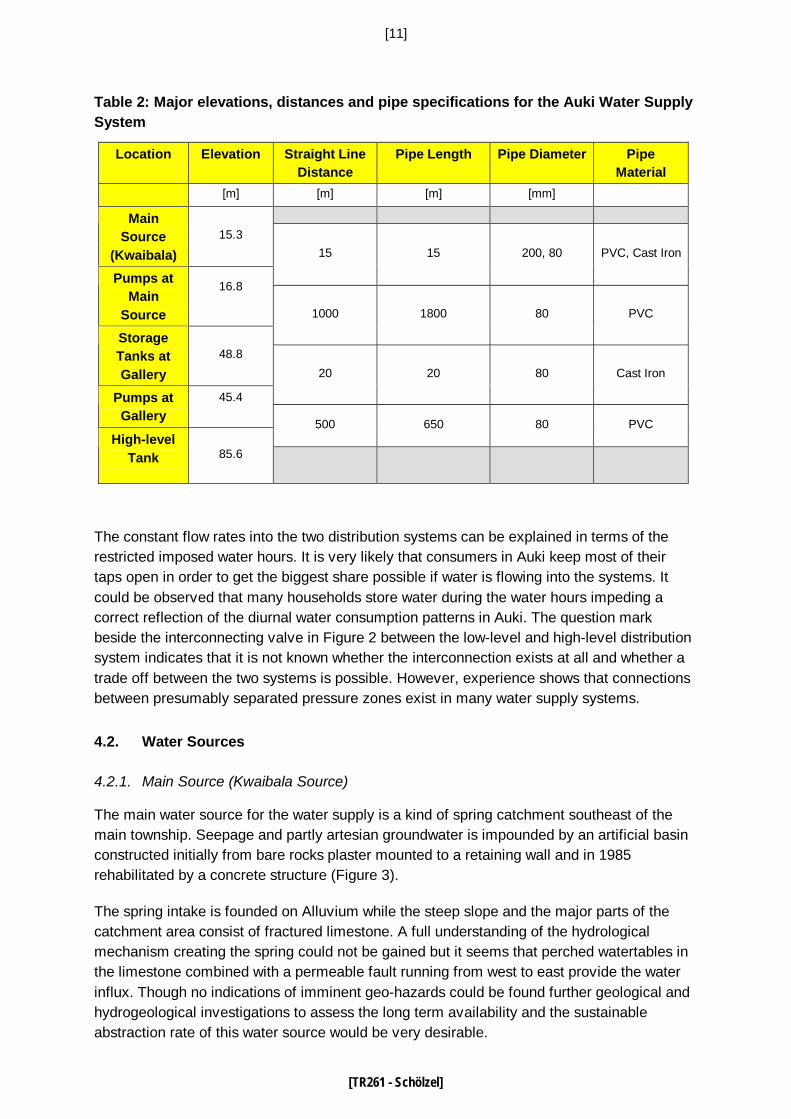
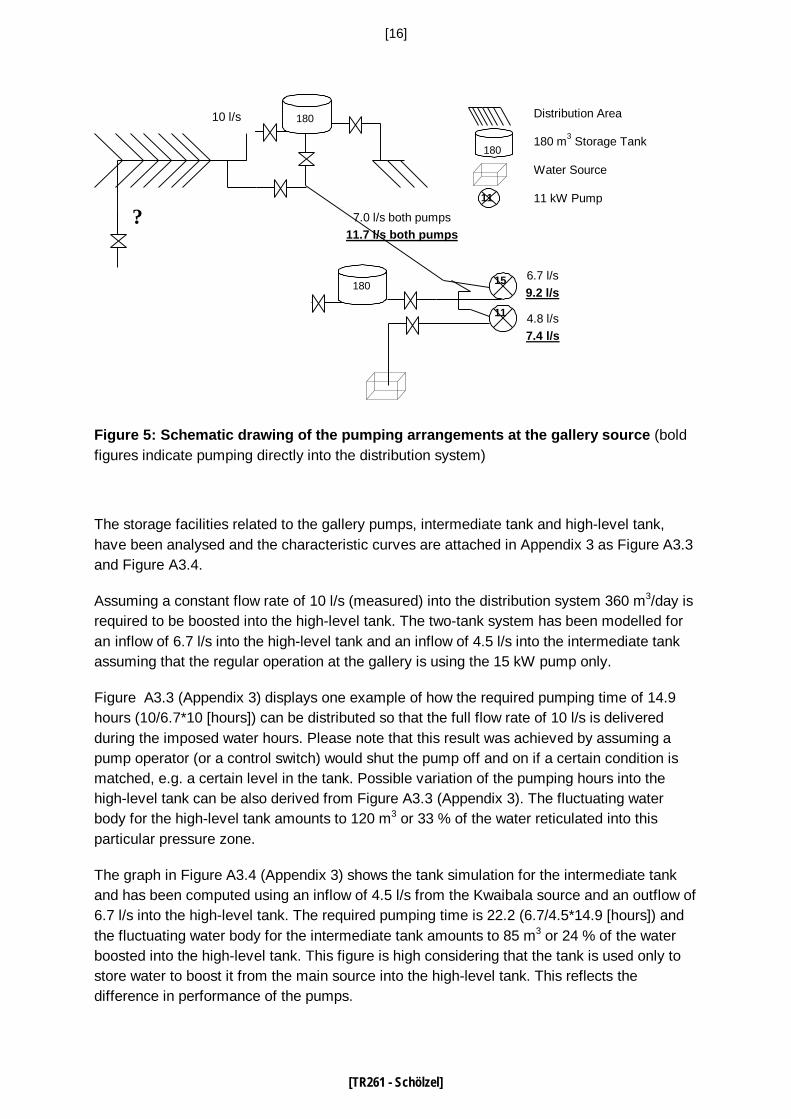
Figure 5 shows a schematic drawing of the pumping arrangements at the gallery source.There are two pumps installed using the same 80 mm PVC pressure line. The smaller one, a11 kW Southern Cross centrifugal pump, pumps water from the gallery source into the high-level tank and the larger, a 15 kW pump, pumps water from the second storage tank at thegallery into the high-level tank. Both pump against a static head of about 36.8 m. At themoment the standard operation is using the 15 kW pump until the high-level tank is filled up.From time to time, depending on the operator's judgement, the 11 kW pump supplementswater from the gallery source. If there is enough water available in the second tank at thegallery and the high level tank is already full, both pumps can be used to pump directly intothe distribution system.
Considering the different pumping options from the gallery a pumping test was carried out toassess pump performance. Measurements taken at the pressure side of the pumps whilepumping into the high-level tank gave flow rates of 4.8 l/s for the 11 kW pump and 6.7 l/s forthe 15 kW pump. Using both pumps at the same time gave a flow rate of 7 l/s. Whenpumping into the distribution system the 11 kW pump pumped 7.4 l/s and the 15 kW pump9.2 l/s reflecting the lower total pump head. Both pumps together can force 11.7 l/s into thedistribution system. Bold and underlined figures in Figure 5 indicate pumping into thedistribution system. The pump performance test for the gallery source pumps are attached asFigure A3.1 in Appendix 3.
An analysis similar to the one for the Kwaibala pumps was carried out. Again, since the exactspecification was unknown a set of curves has been produced. The computed curves inFigure A3.2: Pipe and Pump Analysis for the gallery pumps pumping into the high level tankfor a 15 kW/ 194 mm pump, a 11 kW/ 205 mm and their parallel pumping match the piperesistance curve for a 650 m long pipe with a roughness of k = 0.6 mm for the measured flowrate of 7 l/s. The total head for the parallel pumping configuration is about 69.5 m or 73 % ofthe static head and a flow rate of 7 l/s and 67.8 m or 69% of the static head for the 15 kW/194 mm pump at a flow rate of 6.8 l/s.
[TR261 - Schölzel]
[16]
180
11
15180180
?
Distribution Area
180 m3 Storage Tank
Water Source
11 kW Pump11
180
6.7 l/s9.2 l/s
4.8 l/s7.4 l/s
7.0 l/s both pumps11.7 l/s both pumps
10 l/s
Figure 5: Schematic drawing of the pumping arrangements at the gallery source (boldfigures indicate pumping directly into the distribution system)
The storage facilities related to the gallery pumps, intermediate tank and high-level tank,have been analysed and the characteristic curves are attached in Appendix 3 as Figure A3.3and Figure A3.4.
Assuming a constant flow rate of 10 l/s (measured) into the distribution system 360 m3/day isrequired to be boosted into the high-level tank. The two-tank system has been modelled foran inflow of 6.7 l/s into the high-level tank and an inflow of 4.5 l/s into the intermediate tankassuming that the regular operation at the gallery is using the 15 kW pump only.
Figure A3.3 (Appendix 3) displays one example of how the required pumping time of 14.9hours (10/6.7*10 [hours]) can be distributed so that the full flow rate of 10 l/s is deliveredduring the imposed water hours. Please note that this result was achieved by assuming apump operator (or a control switch) would shut the pump off and on if a certain condition ismatched, e.g. a certain level in the tank. Possible variation of the pumping hours into thehigh-level tank can be also derived from Figure A3.3 (Appendix 3). The fluctuating waterbody for the high-level tank amounts to 120 m3 or 33 % of the water reticulated into thisparticular pressure zone.
The graph in Figure A3.4 (Appendix 3) shows the tank simulation for the intermediate tankand has been computed using an inflow of 4.5 l/s from the Kwaibala source and an outflow of6.7 l/s into the high-level tank. The required pumping time is 22.2 (6.7/4.5*14.9 [hours]) andthe fluctuating water body for the intermediate tank amounts to 85 m3 or 24 % of the waterboosted into the high-level tank. This figure is high considering that the tank is used only tostore water to boost it from the main source into the high-level tank. This reflects thedifference in performance of the pumps.
10 l/s

[TR261 - Schölzel]
[17]
The required pumping time of 22.2 hours is not consistent with the fact that at present wateris being pumped up into the intermediate tank 24 hours a day. A likely explanation is thatsome of the excess water is used to prolong water hours for the high-level distributionsystem or that the measured flow rates used for the simulation were inaccurate.
Photographs of the facilities at the gallery have been attached as Photo A3.1 to A3.4(Appendix 3).
4.4. Conclusions
The main components of the Auki water supply system have been described and analysed.Water hours are imposed even though 7 l/s or 605 m3/day are abstracted from the Kwaibalaspring source, which would allow a daily consumption rate of 120 litres per person, assuming5000 people are to be served.
The nearly constant flow rates of 6 l/s into the low-level distribution system and 10 l/s into thehigh-level system during water hours imply that consumers try to store as much water aspossible when water is available. Since it is unknown how many people are being servedwater in each of the two pressure zones more information needs to be collected before afinal decision on the upgrading of the system can be made.
However, based on the information gathered and derived through its analysis majorupgrading is necessary. The applied analysis of the spring itself and the pumping andstorage facilities identify the leakage and the undersized pumping system (rising main pipesand pumps) at the Kwaibala source as the main reasons for the relative water shortage (orwater hours)3. Both pumping arrangements investigated don't indicate that the pumpsperform particularly badly. They are simply undersized. The rehabilitation of the spring has tobe accompanied by the upgrading of the pumps at Kwaibala source and/or the rising mains.A general and holistic analysis of the entire distribution system through network modelling isnecessary. At this stage there is not enough information to undertake this kind ofinvestigation4.
5. Recommendations
5.1. General
An efficient upgrading of the system should be based on further recommendation derivedfrom a water distribution network model. SIWA's Design and Planning Engineer shoulddevelop such a model. The work can be supervised and backstopped by SOPAC's WaterResources Unit. Work should start as soon as possible.
In order to develop such a model more data need to be collected on the existing population,the population growth and diurnal consumption patterns. The existing database needs to be
3 Note that water shortage refers to the desired consumption rate of 215 l/p/d only.
4 A simple model has been created for the system shown in Figure 2 using the described data. The results complywith the conclusions given in Chapter 4.
[TR261 - Schölzel]
[18]
updated with consumer data and checked regularly. A clear picture of consumption for thetwo pressure zones needs to be gained. Upgrading and rehabilitation of the system shouldinclude the Kwaibala Source, pumps and rising mains as well as the rising main to high leveltank.
The present proposal to upgrade the system by building a new high-level tank being pumpeddirectly from the Kwaibala source can not be assessed without more data, i.e. topographicaland population data. No decision should be made on this suggestion without havingdeveloped a strategy to upgrade the system to avoid poor investments.
Water conservation measures as carried out by SIWA in Honiara should be applied to Auki.SIWA management should discuss how to overcome the current behaviour of storing waterduring water hours. A gradual transition into regular service could be reached by reducingflow rates released into the distribution system by partly closing valves and extending waterhours accordingly. This could indicate to consumers that major changes are upcoming andhording-behaviour is no longer necessary.
5.2. Main Source
The main source could yield a sustainable rate of 12 l/s if the abstraction is done correctly. Amajor change in how water should be taken from the various springs and seepage isrecommended. The proposal consists of four major steps:
• Deepening of Basin 1 using some kind of caisson fabricated from shaft-rings to be usedas an open well.
• Excavating Basin 2 to a level where either impermeable ground is reached or the depth isconsidered sufficient (probably 1.0 m to 1.5 m).
• Laying slotted pipes into Basin 2 and Basin 1
• Building filter layers around the pipes and connect them to the shaft in Basin 1.
The described rehabilitation combines the principal of a filter gallery with that of an open slow(sand) filter (Figure 6).

[TR261 - Schölzel]
[19]
Suction main
Collection Pipes , slotted
Open well
A
A
1.0 to 1.50 m Excavation Level
Slotted Pipes
Slope Protection
Basin 2
Plan View
Section A -A
Figure 6: Proposed rehabilitation measure for the Kwaibala Source
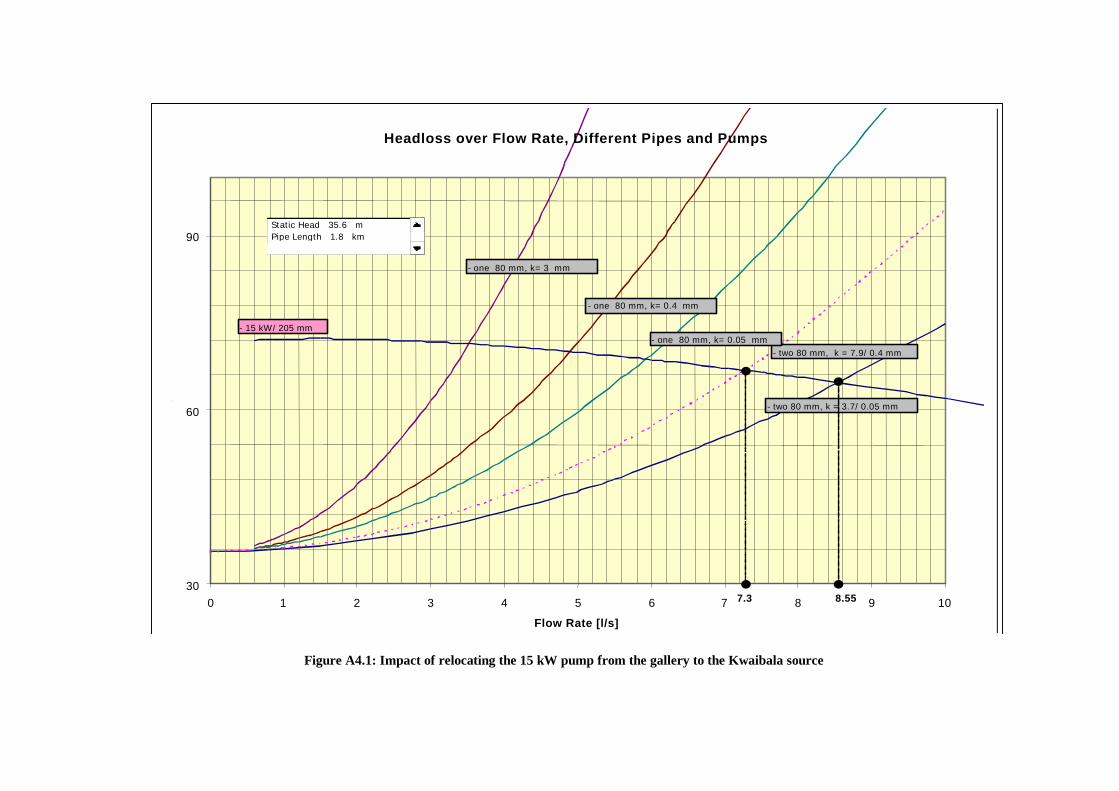
5.3. Kwaibala Source Pumps and Mains
The pump and mains need upgrading, though exactly how should be determined in thedevelopment of the strategy plan. If SIWA was prepared to spend some money for an ad-hocimprovement of the system the 15 kW pump at the gallery could be relocated to the Kwaibalasource. Based on the calculation presented in this report and on Figure A4.1 (Appendix 4)the pump could pump between 7.3 l/s and 8.5 l/s. Since that would not mean a significantchange to the present rate of 7 l/s such a measure should be accompanied with therehabilitation and commissioning of the already laid 100 mm PVC pipe. It should be noted in

[TR261 - Schölzel]
[20]
general that by changing the pump, no big increase in flow rate can be gained by increasingpump performance, due to the high resistance of the two 80 mm pipes.
As a general precaution against low pump performance the sharing of suction lines betweenpumps should be avoided.
5.4. Gallery Pumps
Some saving in pumping time could be gained by applying the pumping hours from thegallery into the high-level tank. Considering that a higher flow rate can be pumped into thedistribution system than into the tank, some further pumping power could be saved by doingthat. Saving would only materialise if the pump's speed is reduced when pumping into thesystem.
Water from the gallery, if used at all, should not be pumped directly into the high level tankbut into the intermediate tank. If reconnecting the pump seems to be too costly the pumpshould run only if the other pump is not running. Parallel operation proved to be highlyinefficient.
5.5. Distribution Network
The distribution network should be subject to a leak detection and control program.

[TR261 - Schölzel]
[21]
Appendix 1: Kwaibala Water Source (Main Source)
[TR261 - Schölzel]
[22]
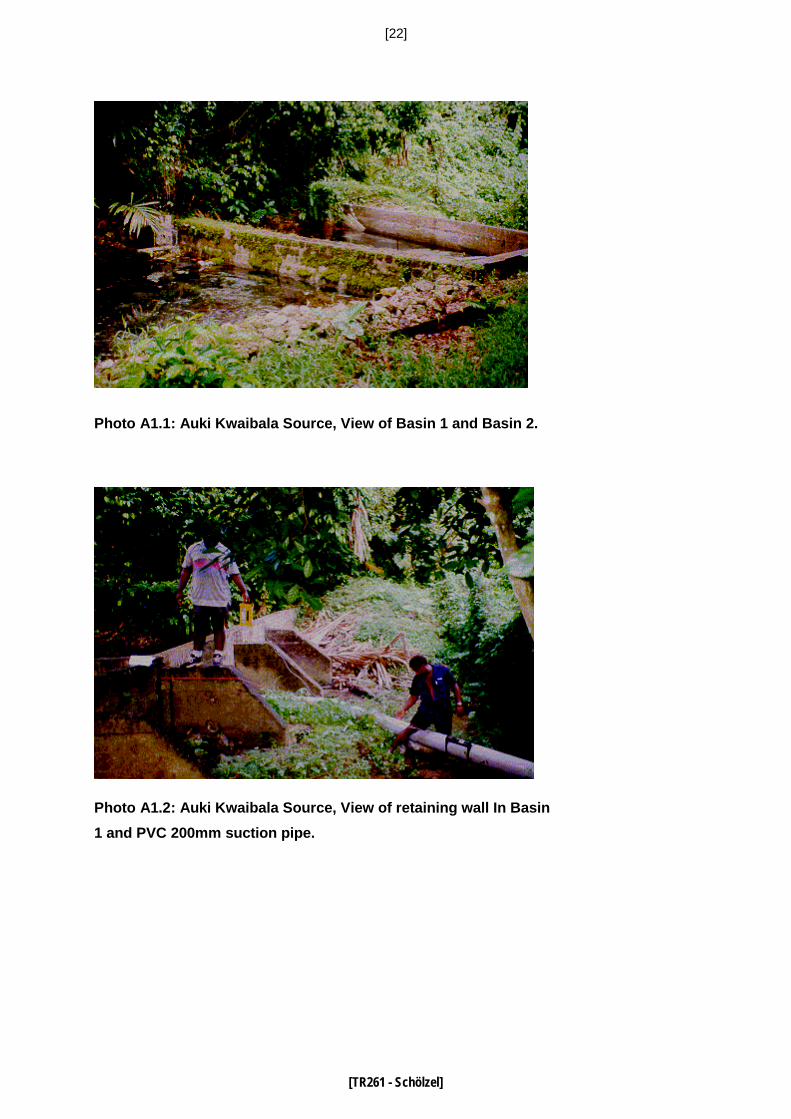
Photo A1.1: Auki Kwaibala Source, View of Basin 1 and Basin 2.
Photo A1.2: Auki Kwaibala Source, View of retaining wall In Basin
1 and PVC 200mm suction pipe.

[TR261 - Schölzel]
[23]
Photo A1.3: Auki Kwaibala Source, View of Basin 3 showing both
new and old retaining structure.
Photo A1.4: Auki Kwaibala Source, View into Basin 1 showing the
old suction pipe and gravel spots indicating water entry.

[TR261 - Schölzel]
[24]
Photo A1.5: Auki Kwaibala Source, View into Basin 1 showing the
new PVC 200mm suction sipe and gravel spots indicating water entry.

[TR261 - Schölzel]
[25]
Appendix 2: Kwaibala Source Pumps

Pump Performance Auki Main Source, 28 May 1998, Measured at PVC 200 Suction Line
0
1
2
3
4
5
6
7
8
9
11:18
:24
11:21
:15
11:23
:15
11:25
:10
11:27
:05
11:29
:05
11:30
:50
11:32
:50
11:34
:50
11:36
:45
11:38
:45
11:40
:35
11:42
:35
11:44
:35
11:46
:40
11:48
:30
11:50
:15
11:52
:25
11:54
:15
11:56
:10
11:58
:00
11:59
:50
12:01
:40
12:03
:30
12:05
:30
12:07
:35
12:09
:35
12:11
:45
12:13
:35
12:15
:40
12:17
:35
12:19
:35
Time
Flow
Rat
e [l/
s]
Both Pumps 11 kW Pump
7.5 kW Pump
Both Pumps
11 kW Pump
7.5 kW Pump
Pump Priming
Figure A2.1: Pump Performace test at Kwaibala Source, 28 of May 1998

[TR261 - Schölzel]
[27]
Simple Pump Analysis
In order to further assess the pump performance a set of calculations comparing differentpump performance curves with a set of pipe resistance curves has been computed. Theentire approach can be summarised as follows:
1. Display pump performance curves for the installed pumps over pipe resistance curves(length of pipe is 1800 m) in a standard way (Figure A2.2 and 2.3) and compare it withthe measured results.
2. Exclude impossible or unlikely solutions.
3. Change variables of the displayed curves so that they match the measured results aswell as possible (Figure A2.4).
The graphs in Figure A2.2 to A2.4 show pumping performance curves for an 11 kW and a15kW Southern Cross pump. Since the exact specification, i.e. impeller size is not known,two different curves have been produced. .1 shows the configurations used for alternativepumping arrangements:
Table A5.1: Configuration of pumping arrangements
Pumping arrangement Configuration
11 kW/ 205 mm impeller diameter and 7.5 kW/ 194mm impeller diameter
1
11 kW/ 194 mm impeller diameter and 7.5 kW/ 194mm impeller diameter
2
11 kW/ 205 mm impeller diameter 3
11 kW/ 194 mm impeller diameter 4
7.5 kW/ 194 mm impeller diameter 5
In Figure A2.2 Configurations 1 and 2 pump into two parallel 80 mm PVC pipes of 1800 mlength. Since the actual state of the pipes is unknown, three different curves for threeroughness factors k have been computed (dashed lines in the graph) in order to find arealistic k figure. The three upper pipe resistance curves have been added to enable acomparison between pumping into a two-pipe and a one-pipe system. The pinpointed flowrates of 4.45 l/s and 8.46 l/s indicate the level where the second (smaller) pump within eachconfiguration begins to have an impact on the pumped flow rate.
The operation points for Configurations 1 and 2 have been marked where the measured flowrate of 7 l/s matches the pipe resistance curve for a pipe resistance of k = 1 mm withConfiguration 1 and k =0.4 mm with Configuration 2.
[TR261 - Schölzel]
[28]
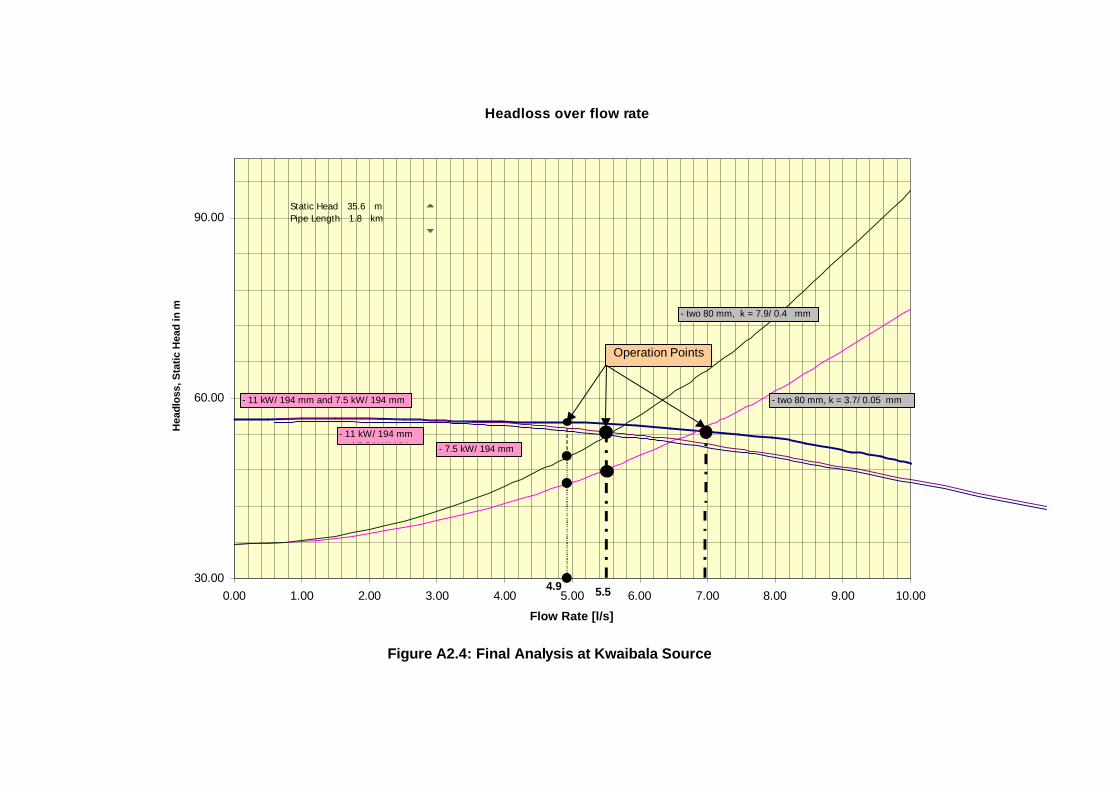
Figure A2.3 shows the same pipe curves but now with the pump performance curves ofConfigurations 3, 4 and 5. The measured operation points have again been highlighted forthe measured flow rates of 4.9 l/s (measured for the 11 kW pump) and 5.5 l/s (measured forthe 7.5 kW pump). Both operation points are for flow rates considerably less than thoseindicated by the intersection of the pipe and pump performance curves which indicate flowrates of 7 l/s for Configuration 3, and about 6.8 l/s for Configurations 4 and 5. Theinconsistency between the measured results can be explained as follows:
1. Pumps perform well below their usual performance.
2. Pipe roughness could not be modelled.
3. Combination of 1. and 2.
Which one exactly, is hard to decide. Figure A2.4 shows the attempt to model the actualsituation assuming very different pipes resistance. As can be seen the parallel pumping(assuming normal pump performance) can be simulated through a two-pipe system with twovery different k factors, though each pump alone would be supposed to pump a higher rate.

Headloss over flow rate, different pipes and two pumps running
30.00
60.00
90.00
0.00 1.00 2.00 3.00 4.00 5.00 6.00 7.00 8.00 9.00 10.00
Flow Rate [l/s]
Hea
dlos
s, S
tatic
Hea
d in
m
Static Head 35.6 mPipe Length 1.8 km
- two 80 mm, k = 0.4 mm
- two 80 mm, k = 2 mm
- one 80 mm, k= 2 mm
- one 80 mm, k= 0.4 mm
- 11 kW/ 205 mm and 7.5 kW/ 194 mm
- 11 kW/ 194 mm and 7.5 kW/ 194 mm
4.45
56.16
8.46
- two 80 mm, k = 1 mm
- one 80 mm, k= 1 mm
Operation Pointsat 7 l/s
Figure A2.2: Analysis for the two pumps in parallel operation, pumping into different pipe systems of a length of 1800 m.

Headloss over flow rate, different pipes and one pump running
30.00
60.00
90.00
0.00 1.00 2.00 3.00 4.00 5.00 6.00 7.00 8.00 9.00 10.00
Flow Rate [l/s]
Hea
dlos
s, S
tatic
Hea
d in
m
Static Head 35.6 mPipe Length 1.8 km
- two 80 mm, k = 0.4 mm
- two 80 mm, k = 2 mm
- one 80 mm, k= 2 mm
- one 80 mm, k= 0.4 mm
- 11 kW/ 205 mm
- 7.5 kW/ 194 mm
4.9 5.5
- two 80 mm, k = 1 mm
- one 80 mm, k= 1 mm
Operation Points
- 11 kW/ 194 mm
Figure A2.3: Analysis for one pump operating at the time at Kwaibala Source.
Headloss over flow rate
30.00
60.00
90.00
0.00 1.00 2.00 3.00 4.00 5.00 6.00 7.00 8.00 9.00 10.00
Flow Rate [l/s]
Hea
dlos
s, S
tatic
Hea
d in
m
Static Head 35.6 mPipe Length 1.8 km
- two 80 mm, k = 3.7/ 0.05 mm
- two 80 mm, k = 7.9/ 0.4 mm
- 11 kW/ 194 mm and 7.5 kW/ 194 mm
4.9 5.5
Operation Points
- 11 kW/ 194 mm and 7.5 kW/ 194 - 7.5 kW/ 194 mm
Figure A2.4: Final Analysis at Kwaibala Source

Water Volumes, Inflow and Outflow Data for Low-Level Tank
0
1
2
3
4
5
6
7
8
20:00:00 22:00:00 0:00:00 2:00:00 4:00:00 6:00:00 8:00:00 10:00:00 12:00:00 14:00:00 16:00:00 18:00:00 20:00:00
Time
Flow
Rat
es [l
/s]
0.00
20.00
40.00
60.00
80.00
100.00
120.00
140.00
160.00
180.00
200.00
220.00
240.00
Vol
ume
[m3]
Outflow
Inflow
Accumulated Inflow in m3
Present Volume in Tank in m3
Accumulated Outflow in m3
Reservoir Volume: 180 [m3]Time Increment: 0:1:00 [time]Outflow: 6 [l/s]Inflow: 2.50 [l/s]Morning: on 6:00:00 [time] off 9:00:00 [time]Afternoon on 11:00:00 [time] off 13:00:00 [time]Evening on 15:00:00 [time] off 20:00:00 [time]End Volume in Tank: 0.00 [m3]Max Differenz: 89.94 [m3]
Figure A2.5: Analysis for the low-level storage tank assuming a constant inflow of 2.5 l/s and a constant outflow of 6 l/s

Water Volume in Low Level Tank
0.00
10.00
20.00
30.00
40.00
50.00
60.00
70.00
80.00
90.00
100.00
20:00:00 20:00:00 20:00:00 20:00:00 20:00:00 20:00:00 20:00:00 20:00:00 20:00:00 20:00:00 20:00:00 20:00:00
Time
Vol
ume
[m3]
Trend
- Inflow 2.6 l/s- Outflow 6 l/s- Water Hours from 6 -9, 11 -13, 15 -20- No input from any other source- based on measurements with Portaflow 300
Figure A2.6: Twelve-day simulation for the low-level tank for the most likely inflow rate of 2.5 l/s

[TR261 - Schölzel]
[34]
Appendix 2.2: Photographs of the Kwaibala Pumps
Photo A2.1: Operator Charles Fox in the pump house at Kwaibala Source
Photo A2.2: Pumps at the Kwaibala Source, foreground 7.5 kW Southern Cross,background 11 kW Southern Cross

[TR261 - Schölzel]
[35]
Photo A2.3: Lemuel Siosi taking flow measurements at the suction pipe of the 7.5 kWpump
Photo A2.4: Lemuel Siosi taking flow measurements at the pressure pipe of the 7.5 kWpump.

[TR261 - Schölzel]
[36]
Appendix 3: Gallery Pumps

Pumping Performance at Auki Gallery, 28 May 1998
-2
0
2
4
6
8
10
12
14
10:23
:44
10:25
:14
10:26
:39
10:28
:04
10:29
:24
10:30
:44
10:32
:09
10:33
:34
10:35
:19
10:36
:39
10:38
:04
10:39
:29
10:40
:59
10:42
:24
10:43
:49
10:45
:19
10:46
:54
10:48
:34
10:49
:54
10:51
:34
Time
Flow
Rat
e [l/
s]
into high level tank
into distribution system
into high level tank
Gallery Pump 11 kW
High Level Tank Pump15 kW
both pumps
High Level Tank Pump15 kW
Gallery Pump 11 kW
Figure A3.1: Pump performance test for the gallery pumps switching between pumping into the high level-tank and the distribution system.

Headloss over Flow Rate, Different Pipes and Pumps
30.00
40.00
50.00
60.00
70.00
80.00
90.00
100.00
0.00 1.00 2.00 3.00 4.00 5.00 6.00 7.00 8.00 9.00 10.00
Flow Rate [l/s]
Hea
dlos
s, S
tatic
Hea
d in
m
- one 80 mm, k= 3 mm
- one 80 mm, k= 0.4 mm
- one 80 mm, k= 0.05 mm
- 15 kW/ 205 mm
- 15 kW/ 194 mm
Static Head 40.2 mPipe Length 0.65 km
- 11 kW/ 215 mm
- one 80 mm, k= 0.6 mm
- 15 kW/ 194 and 11 kW/ 215 mm
4.22
69.567.8
Figure A3.2: Pipe and Pump Analysis for the gallery pumps pumping into the high- level tank.

Water Volumes, Inflow and Outflow Data for High-Level Tank
0
2
4
6
8
10
12
20:00:00 22:00:00 0:00:00 2:00:00 4:00:00 6:00:00 8:00:00 10:00:00 12:00:00 14:00:00 16:00:00 18:00:00 20:00:00
Time
Flow
Rat
es [l
/s]
0.00
50.00
100.00
150.00
200.00
250.00
300.00
350.00
400.00
Vol
ume
[m3]
Reservoir Volume: 180 [m3]Time Increment: 0:01:00 [time]Outflow: 10 [l/s]Inflow: 6.70 [l/s]Morning: on 6:00:00 [time] off 9:00:00 [time]Afternoon on 11:00:00 [time] off 13:00:00 [time]Evening on 15:00:00 [time] off 20:00:00 [time]End Volume in Tank: 0.00 [m3]Max Differenz: 120.20 [m3]Simulation Time: 1 day(s)
Outflow
Inflow
Accumulated Inflow in m3
Present Volume in Tank in m3
Accumulated Outflow in m3
Figure A3.3: One-day simulation for the high-level tank (pumping time into the tank optimised).

Water Volumes, Inflow and Outflow Data for Intermediate Tank
0
2
4
6
8
10
12
20:00:00 22:00:00 0:00:00 2:00:00 4:00:00 6:00:00 8:00:00 10:00:00 12:00:00 14:00:00 16:00:00 18:00:00 20:00:00
Time
Flow
Rat
es [l
/s]
0.00
50.00
100.00
150.00
200.00
250.00
300.00
350.00
400.00
Input-Output SummaryReservoir Volume: 180 [m3]Time Increment: 0:01:00 [time]Max. Outflow: 6.7 [l/s]Inflow: 4.50 [l/s]Stop Pump at Volume 85 [m3]Start Pump when volume lower than 30 [m3]Your applied flow control result into 22.2 pumping hoursTime full outflow is delivered 14.9 [hours]Minimum theoretical pumping time required 22.2 [hours]Ratio between theoretical and present pumping time 1.0 [-]Amount of water being delivered to consumers 359.8 [m3]Amount of water being pumped 359.4 [m3]Start Volume in Tank: 39.00 [m3]End Volume in Tank: 39.05 [m3]Max Differenz: 85.05 [m3]Simulation Time: 1 day(s)
Outflow
Inflow
Accumulated Inflow in m3
Present Volume in Tank in m3
Accumulated Outflow in m3
Figure A3.4: One-day simulation for the intermediate tank (pumping time into the tank opti-

[41]
Photographs of the gallery Pumps, gallery source and storage facilities
Photo A3.1: Gallery pumps and gallery source
Photo A3.2: Flow measurements outside gallery pump house

[42]
[TR261 - Schölzel]
Photo A3.3: Storage facilities, the left tank is serving the low-level tank, the right on eis the intermediate tank
Photo A3.4: Pump house at Auki Gallery

[43]
Appendix 4: Recommendations
Headloss over Flow Rate, Different Pipes and Pumps
30
60
90
0 1 2 3 4 5 6 7 8 9 10
Flow Rate [l/s]
Hea
dlos
s, S
tatic
Hea
d in
m
Static Head 35.6 mPipe Length 1.8 km
- two 80 mm, k = 3.7/ 0.05 mm
- two 80 mm, k = 7.9/ 0.4 mm
- one 80 mm, k= 3 mm
- one 80 mm, k= 0.4 mm
- one 80 mm, k= 0.05 mm- 15 kW/ 205 mm
8.557.3
Figure A4.1: Impact of relocating the 15 kW pump from the gallery to the Kwaibala source


