
GALCIT REPORT NO.
A STUDY OF METHODS TO INCREASETHE LIFT OF SUPERSONIC AIRFOILS AT LOW SPEEDS
Thesis by
Lt. Comdr. A. D. Pollock, Jr., U.S.N.and
Lt. Comdr. F. F# Reck, U.S.N.
O)
r-
Library^^^
«^w*<*U. S. Naval Postgraduate scnooi
Annapolis, Md.
A STUDY OF METHODS TO IXHFJTHB LIFT OF SUPERSONIC AIRFOILS AT
Theais
*y
Lt. Oomdr. A. D. ^ollock, Jr., U.S.N.
andLt. Coradr. F. F. Keck, U.S. a*.
In Partial fulfillment of the Requirements for theProfessional Degree
in Aeronautical hh^ineering
California Institute of TechnologyPasadena, California
1947

The authors wish to express their appreciation to t. H, T.
-iagamatsu for his interest in the problem and his many helpful
suggestions.
Special thanks is to be given to Dr. E. 8. Sechler, 'r. . H.
riowon, and members of the GALCIT staff for their assistance and ad-
vice in making the experimental installation and final preparation
of the data and pictures.
reciation and gratitude are expressed to Mr. Peter Syropolus
for his unfailing generosity with equipment under his cognizance.
809*o

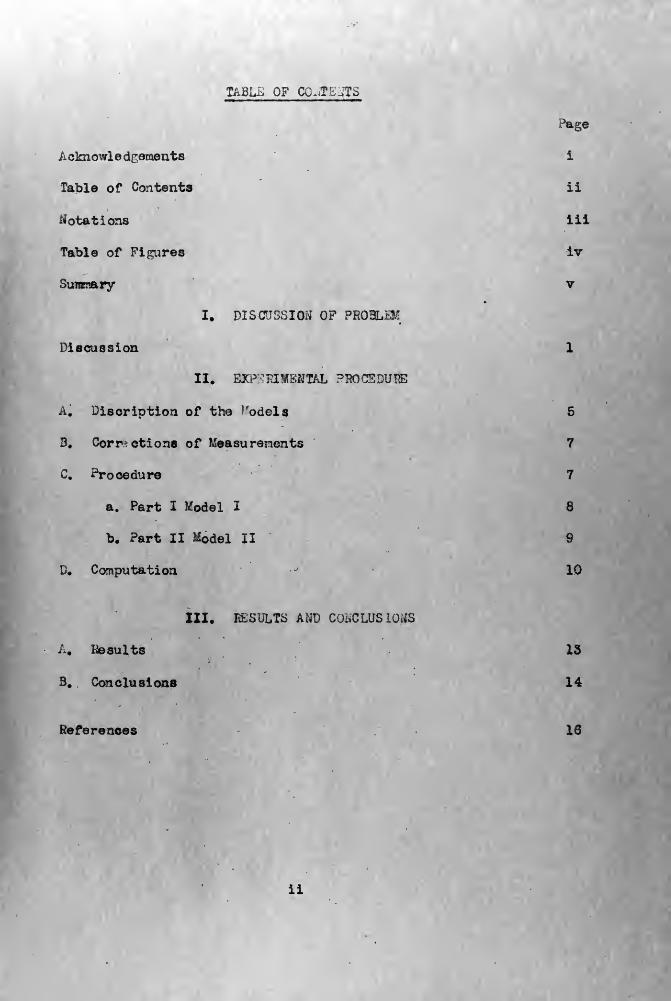
TABLi^ OF CO^TUJTo
Page
Acknowledcements i
Table of Contents ii
dotations iii
Table of Figures iv
Summary v
I. Discr Tr/;io.v of pros.
Discussion 1
II. K VL ^HOCEDU!S
A. Disoription of the "odols 5
3. Corr ctions of Measurements 7
C. Procedure 7
a. Part I Model I 8
b. Part II Model II 9
D. Computation 10
III. RESULTS A MCUTS10
A. Insults IS
3. Conclusions 14
References 16
ii


..:t.-t:..i
b Model span
c Model chord
coefficient
Tare drag coefficient
Parasite drag coefficient
Cl Lift coefficient
MoEcnt coefficient about
rt coefficient about 50^ c
'25
•olunetric coefficient
d Tare tr
D -a-g
L Lift
b Tare moment
V Dfonent
P_ ' Static nressure in modelo
q Dynar.io pressure in tunnel
"Vantity of air (corrected)
.antity of air (Fotaneter)
I gas constant
Temperature of air in model
v c of ?et at slit
.Del rel
J o of speeific beat
iii


T,,BL5 OF FIG
Figure
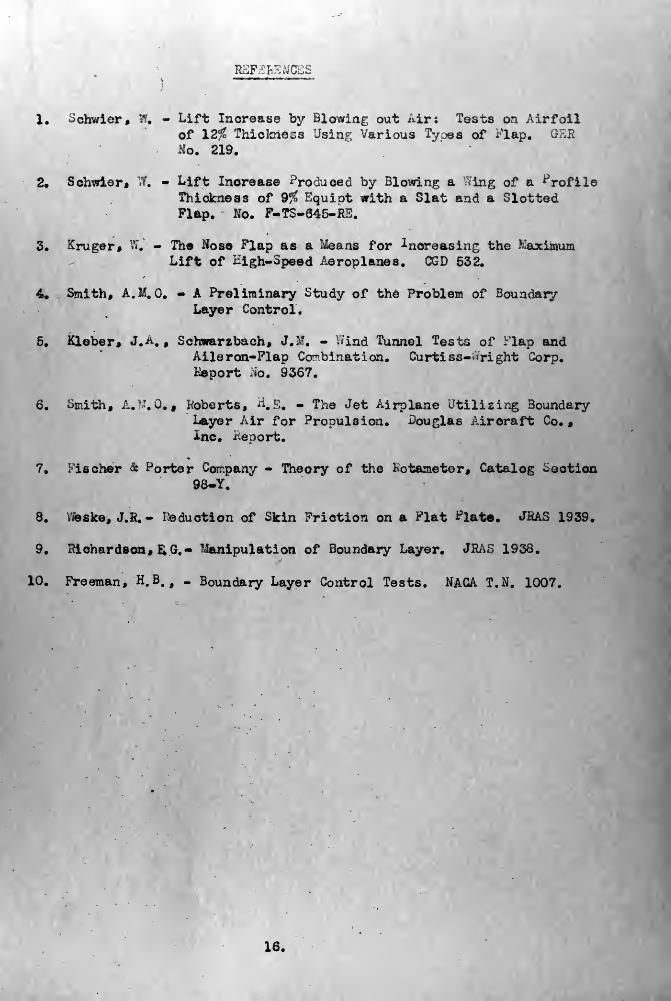
1 Drav/ing of ^odel II
2 Schematic air system diagram
3 Tuft survey pictures, no flap
4 Tuft survey pictures, 60° trailing edf,e flap
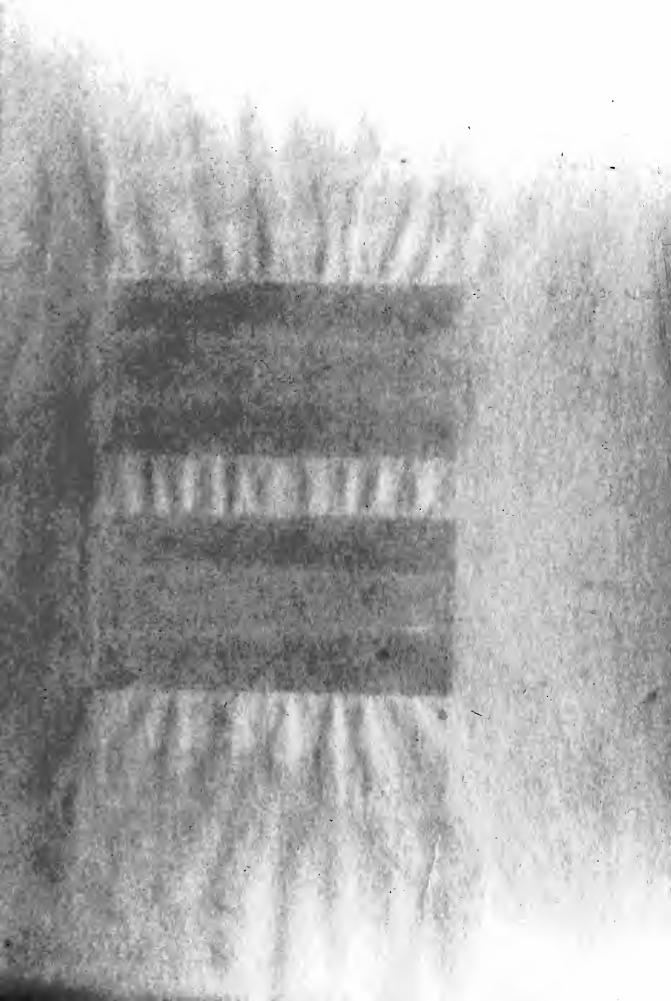
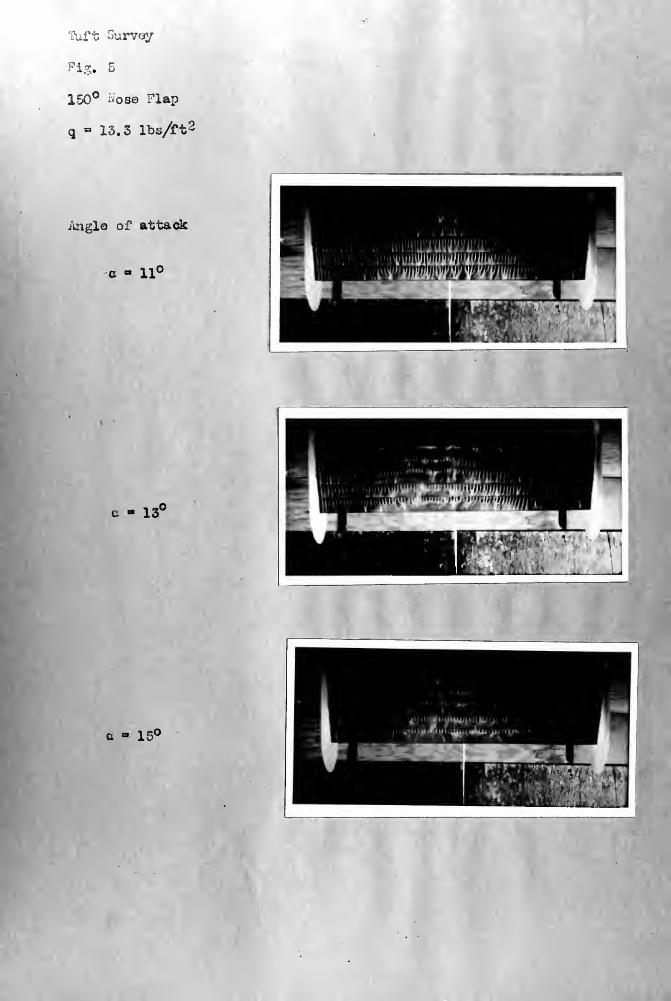
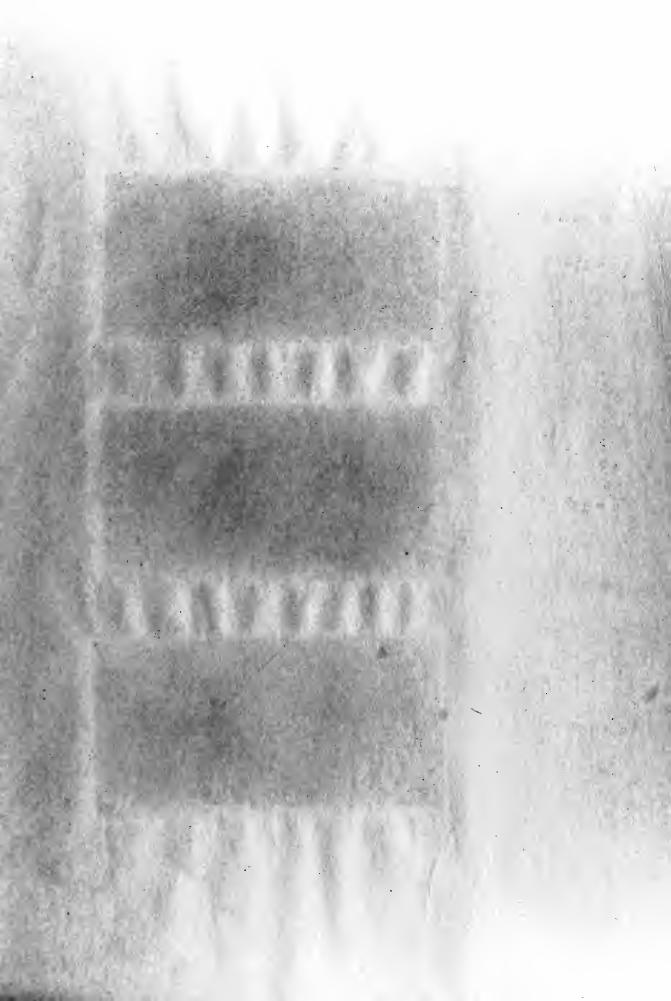
5 Tuft survey pictures* 15° nose flaps
6 Tuft survey oictures, oonbination flaps
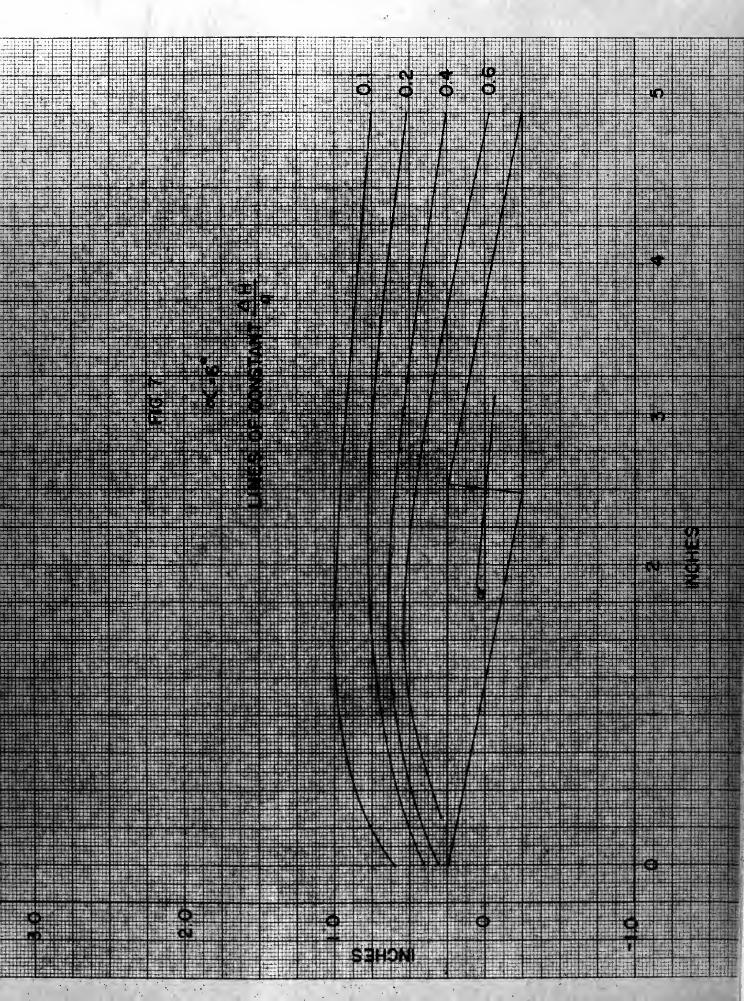
7 Total head survey c • 6°
8 Total head survey c - 10°
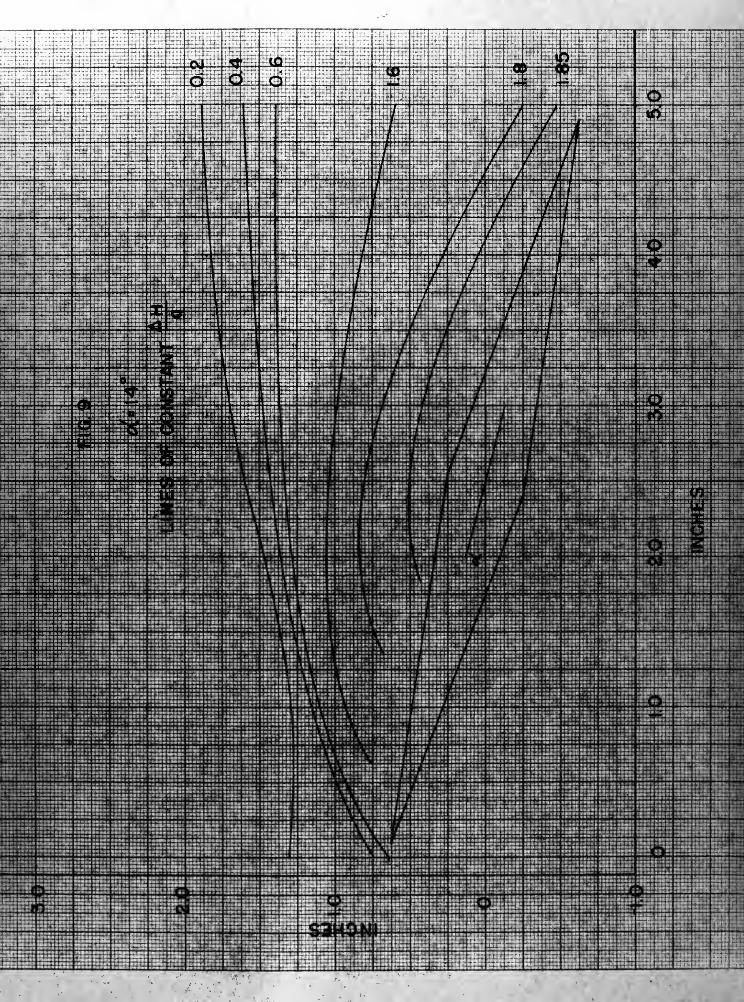
9 Total head survey a 14°
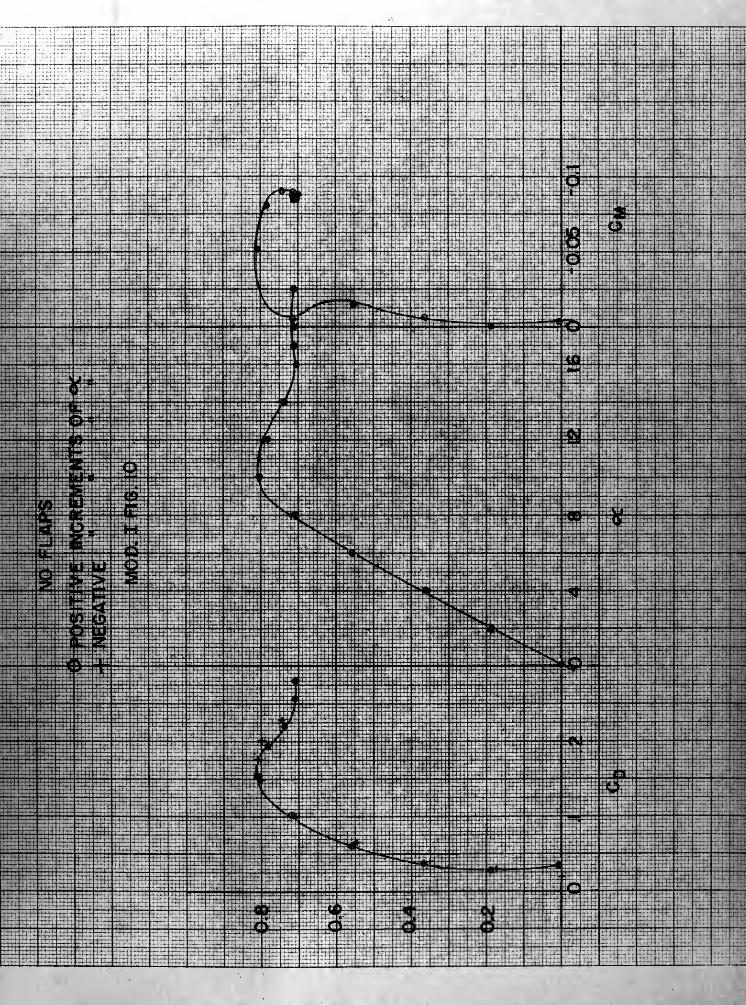
10 Model I - ^ring polar at positive and negative increments of a.
Ho flaps
11 Comparison of Cj> and C^ with various nose or trailing flap de-
flection - k-odel I
12 Comparison of C. and Cn with combinations of nose and trailing^nax u
edge flaps - *-odel I
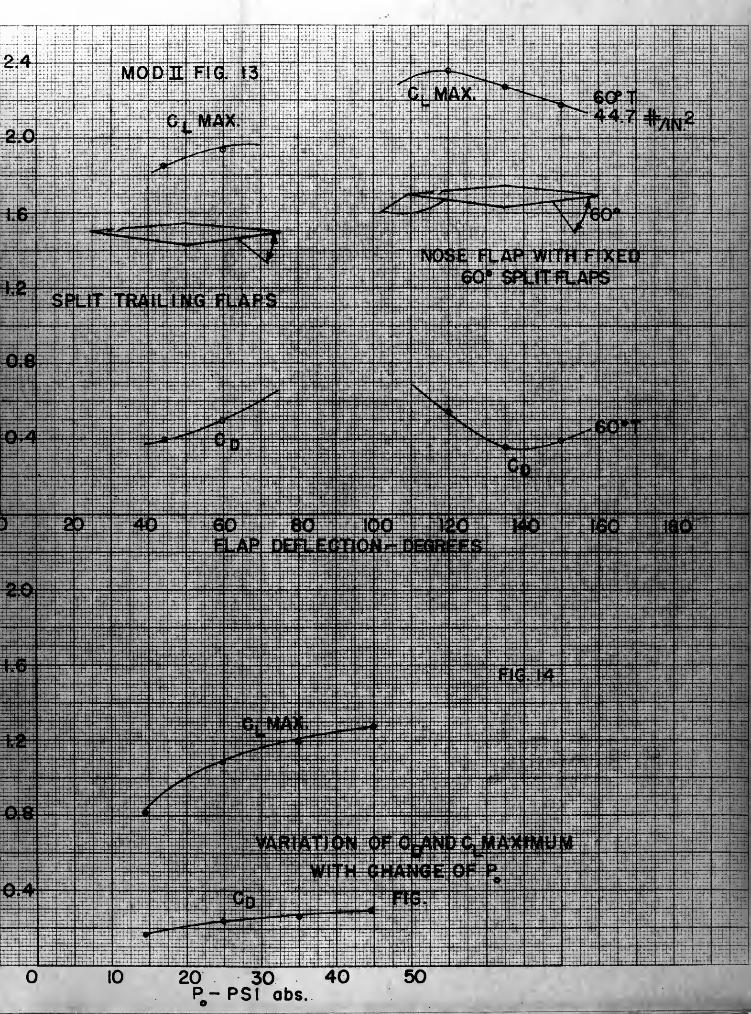
13 ^odel II - Comparison of Cr and CD with various flap configurati
14 Variation Ct and C^ with variation of P^"max %ax °
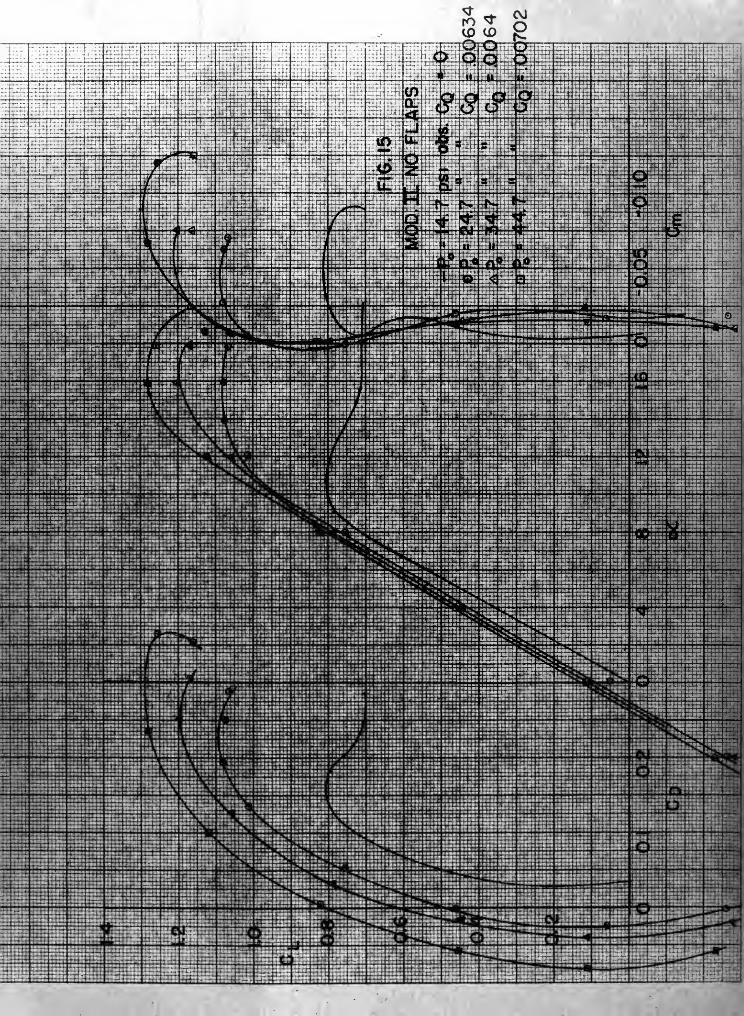
15 "odel II - Polar with various PQ (*o flaps)
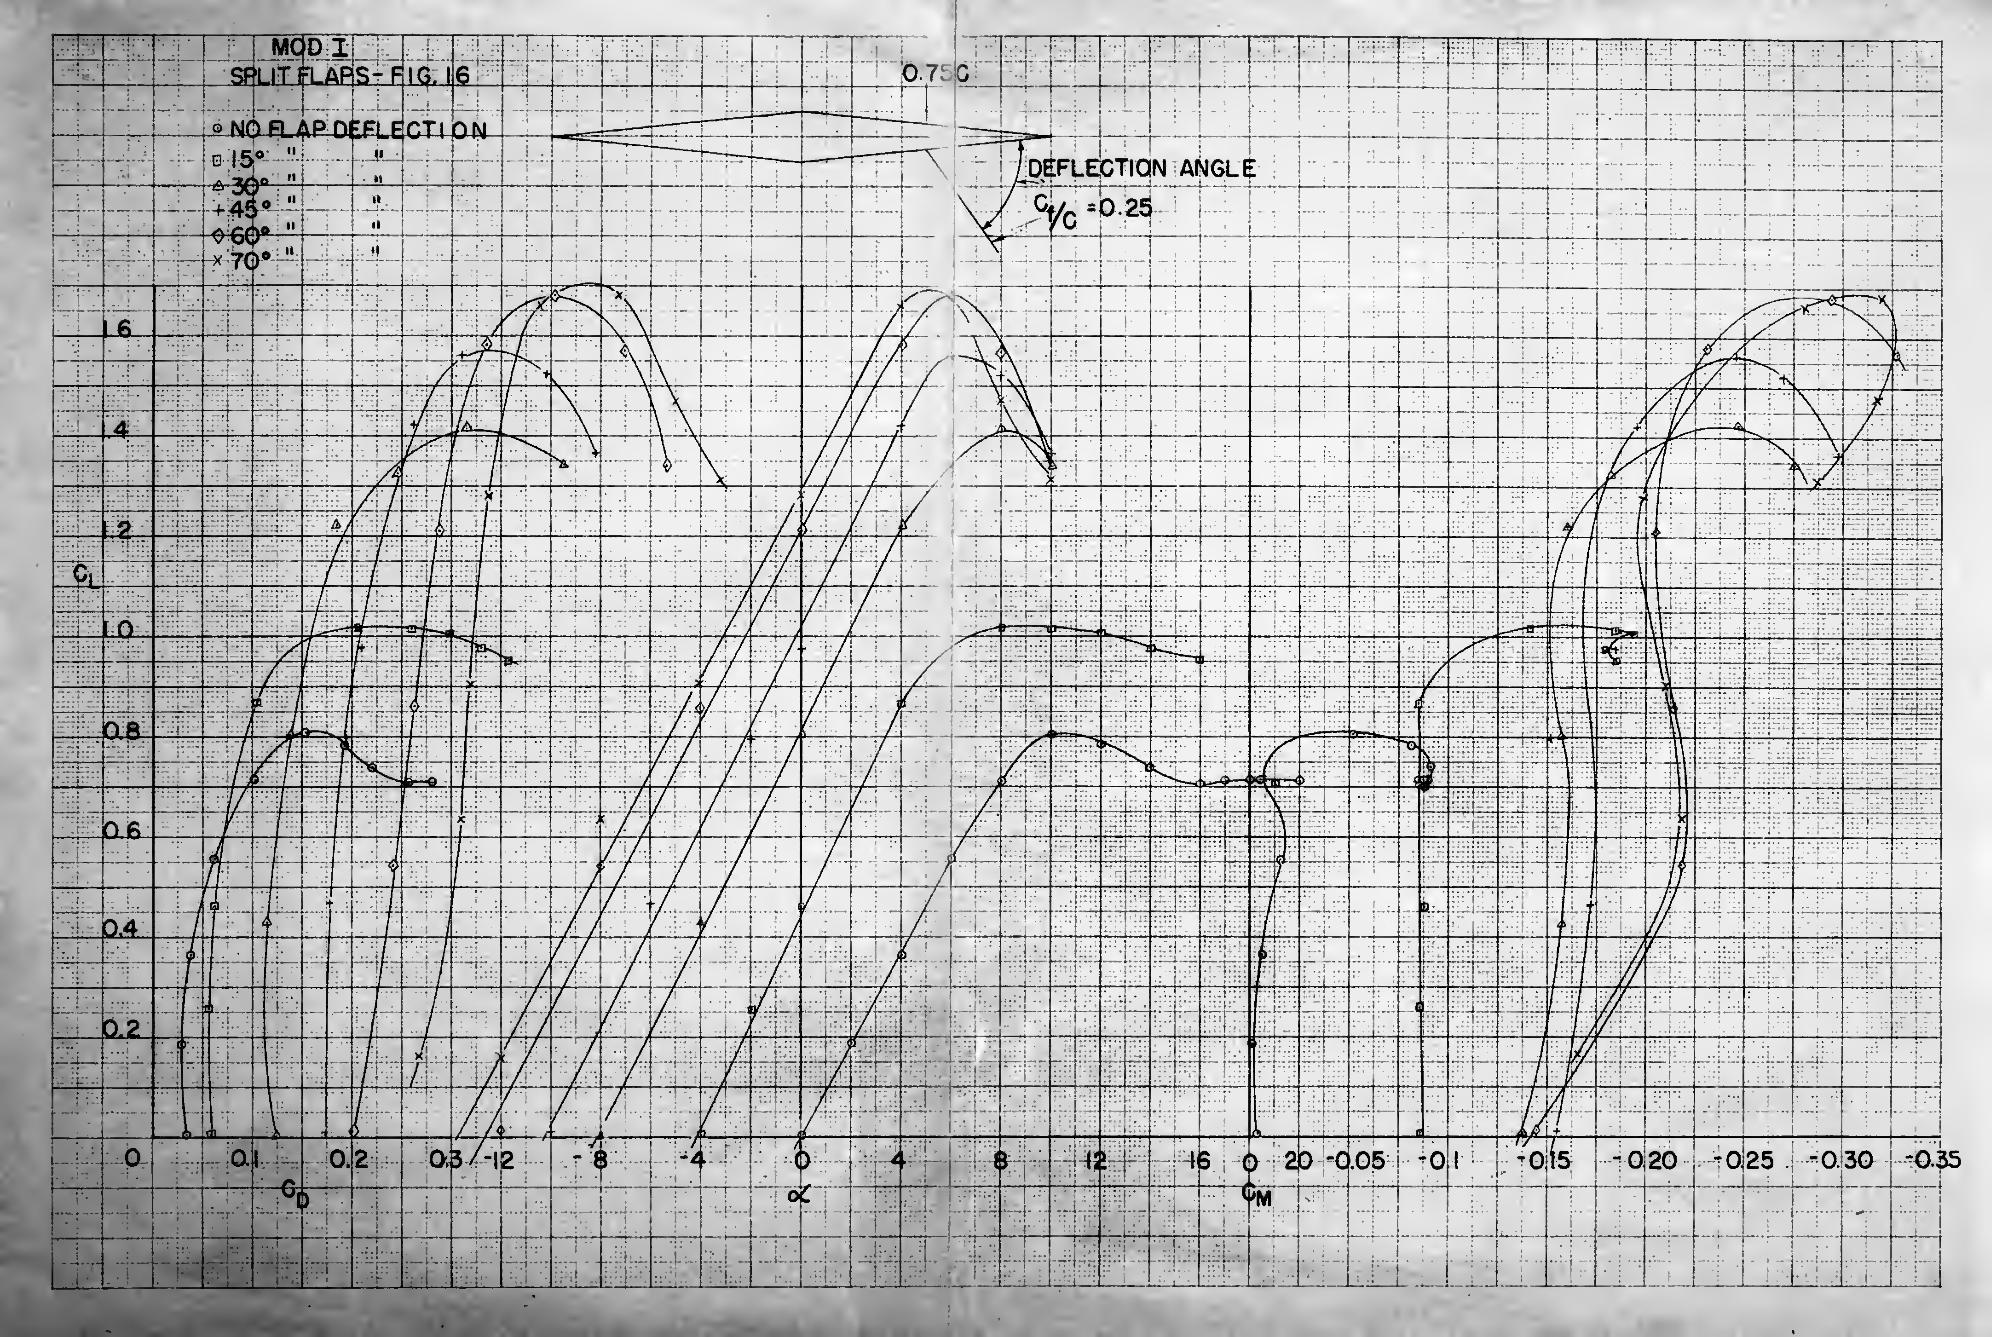
16 Model I - 5olar various trailing edge flaps
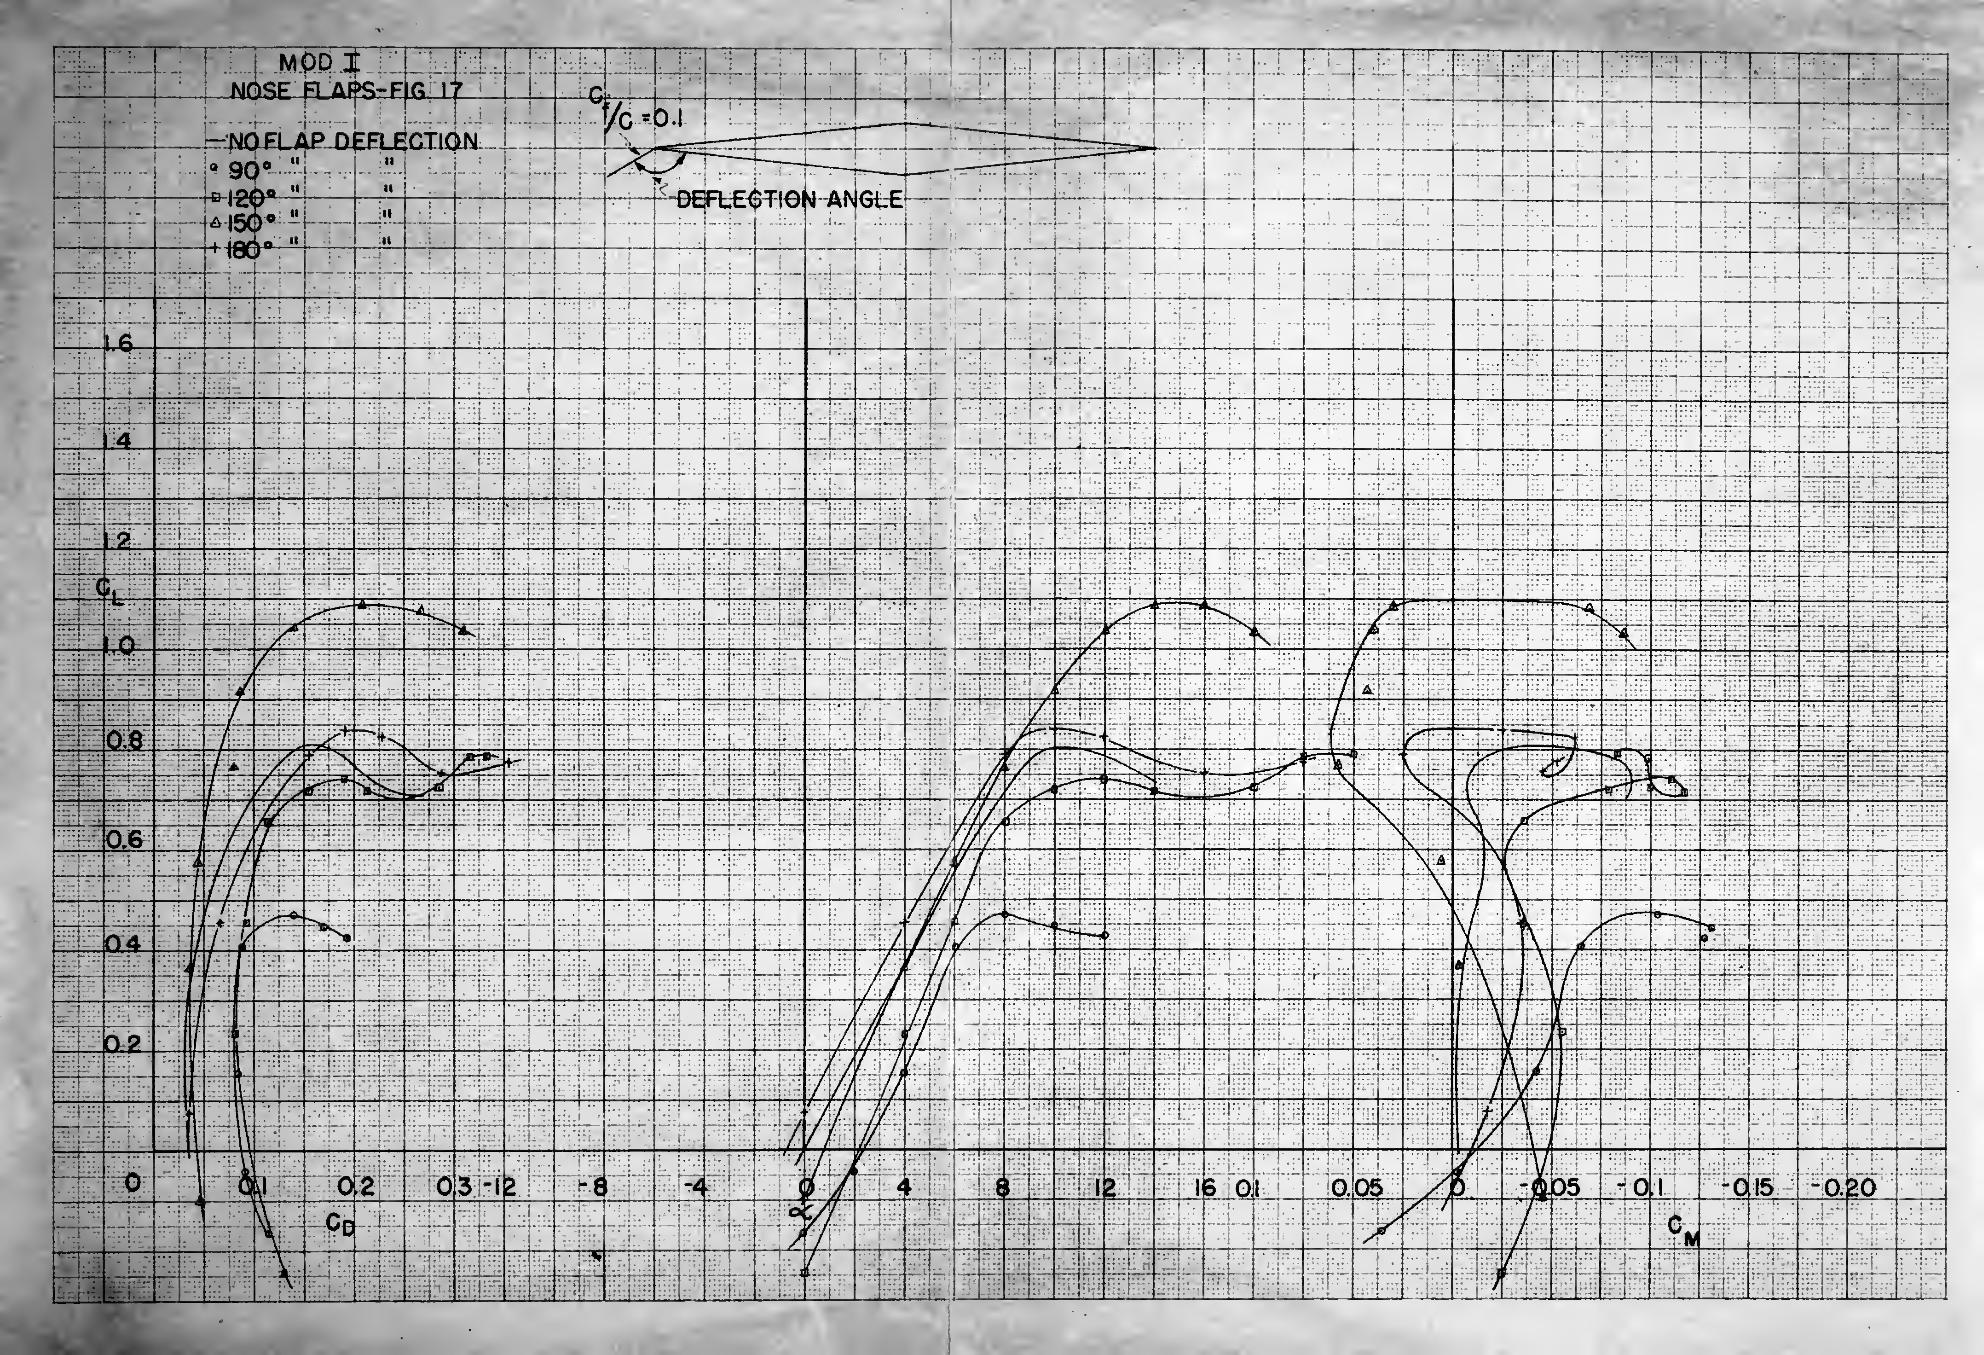
17 Model I • Polar various nose flaps
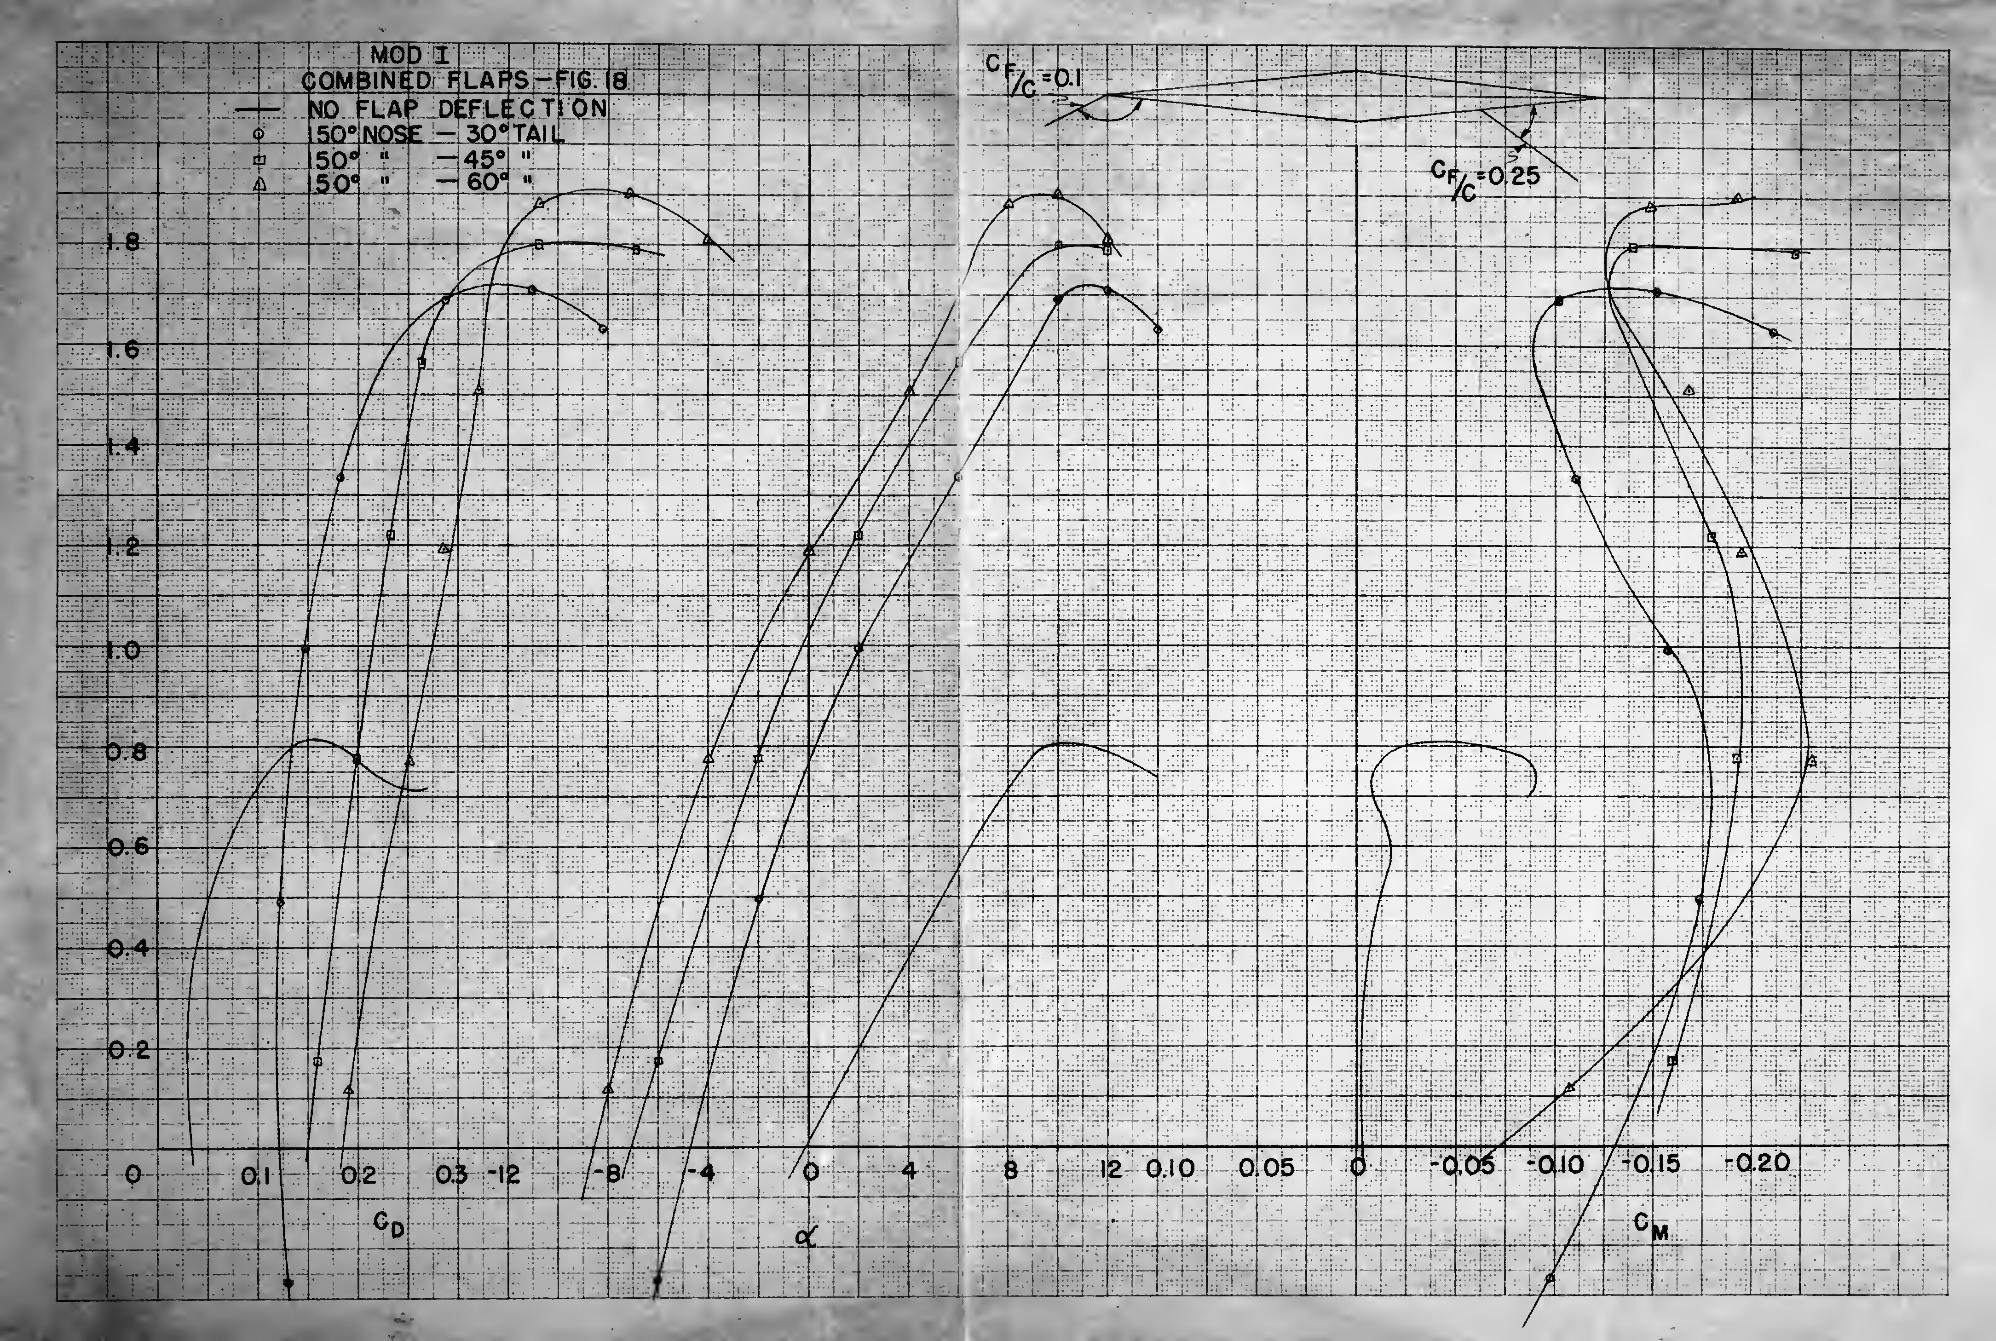
18 tfodel I - Polar various configurations of combined flans
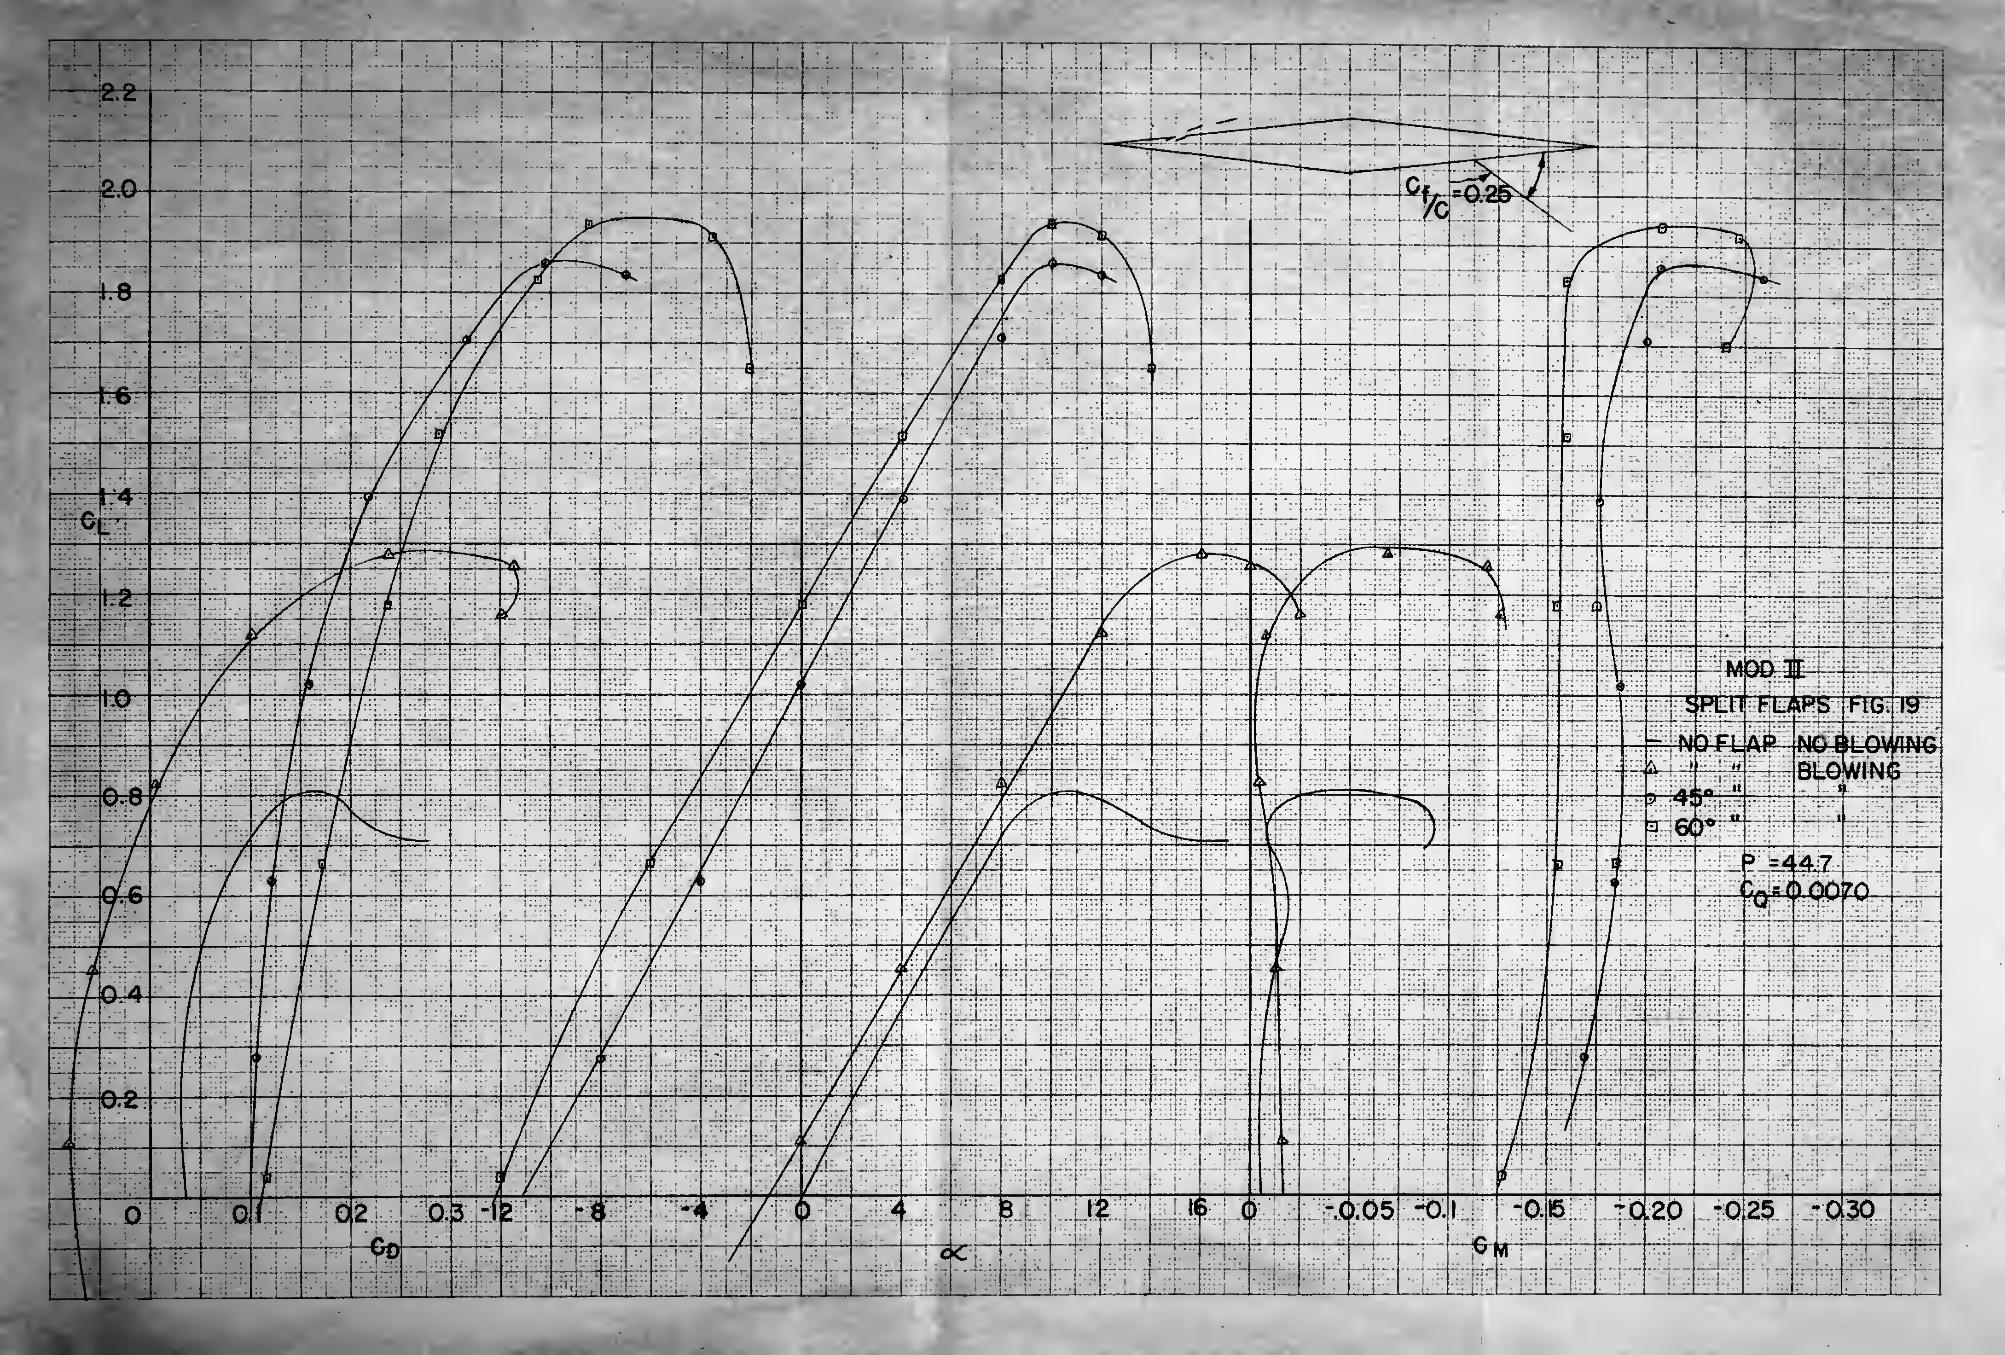
19 Model II - Polar trailing edge flaps C - .,0070
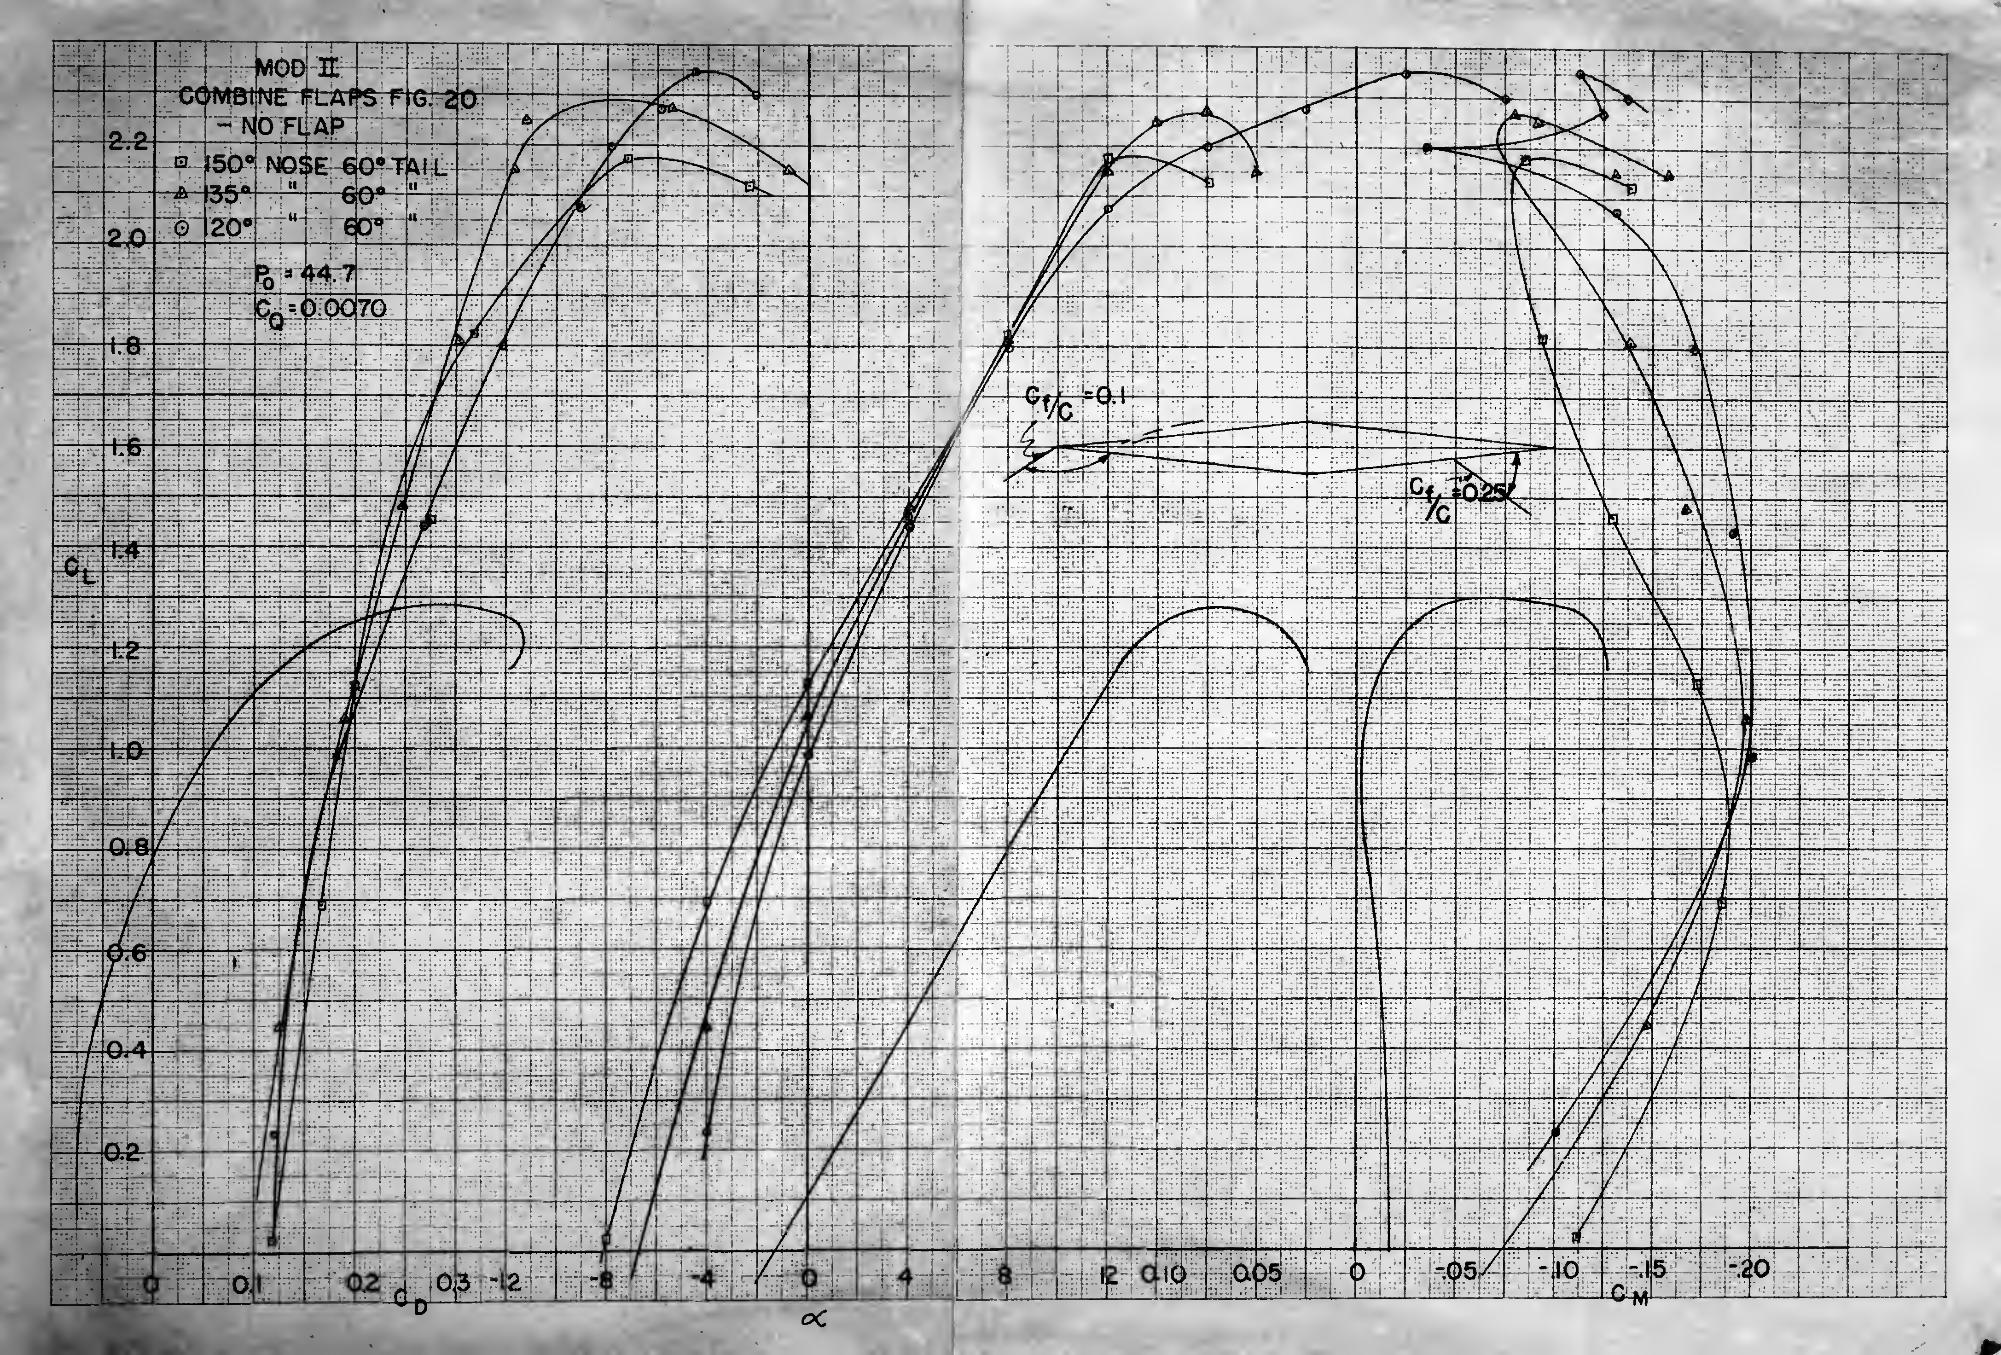
20 "odel II - ^olar various configurations of combined flaps
21 Table I - Comparison of Heaults
22 Table II - Comparison of Results
IV
ons

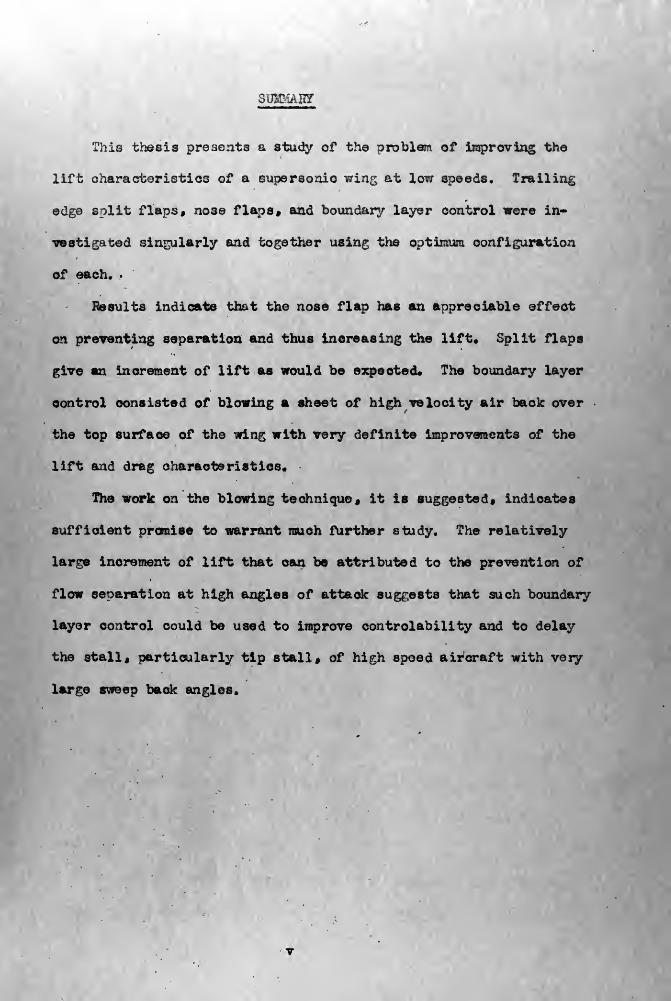
This thesis presents a study of the problem of improving the
lift characteristics of a supersonio wing at low speeds. Trailing
edge split flaps, nose flaps , and boundary layer control were in-
vestigated singularly and together using the optimum configuration
of each, ,
Results indicate that the nose flap has an appreciable effect
on preventing separation and thus increasing the lift* Split flaps
give an increment of lift as would be expected* The boundary layer
oontrol consisted of blowing a sheet of high velocity air baok over
the top surface of the wing with very definite improvements of the
lift and dreg characteristics.
The work on the blowing technique $ it is suggested* indicates
sufficient promise to warrant much further study. The relatively
large increment of lift that can be attributed to the prevention of
flow separation at high angles of attack suggests that such boundary
layer oontrol could be used to improve controlability and to delay
the stall, particularly tip stall, of high spoed aircraft with very
large sweep baok angles.
I. £IS -.: op .'Her
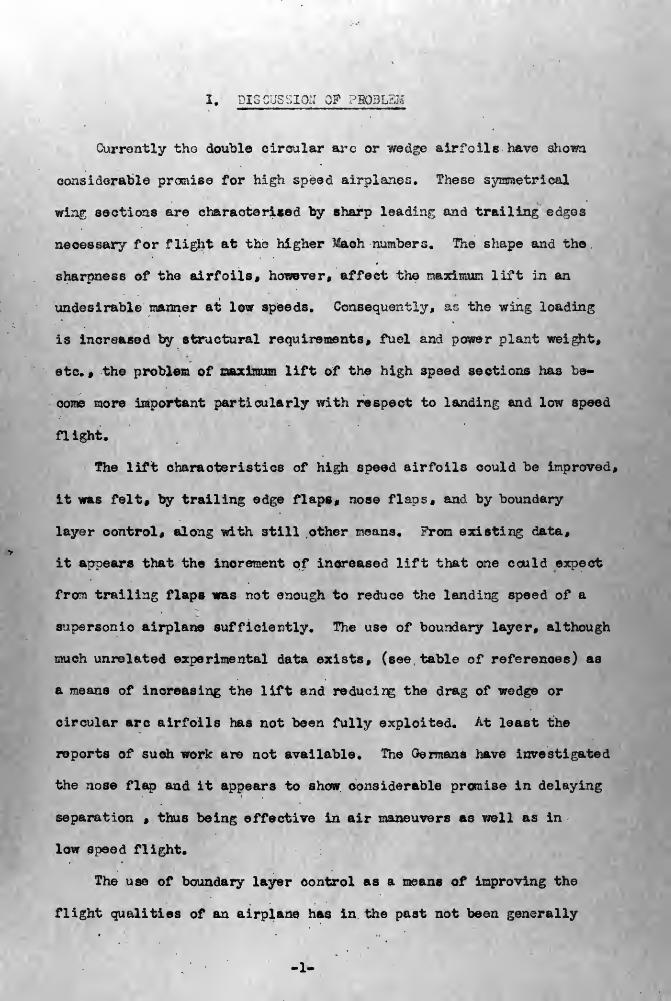
Currently tho double circular arc or wedge airfoils have shown
considerable promise for high speed airplanes. These symmetrical
win^ sections are characterised by sharp leading and trailing edscos
necessary for f light at the higher *2aoh numbers. The shape and the
sharpness of the airfoils, however, affect the maximum lift in an
undesirable manner at low speeds. Consequently, as the wing loading
is increased by structural requirements, fuel and power plant weight,
etc., the problem of maximum lift of the high speed sections has be-
come more important particularly with respect to landing and low speed
f1 ight.
The lift characteristics of high speed airfoils could be improved,
it was felt, by trailing edge flaps, nose flaps, and by boundary
layer control, along with still other means. From existing data,
it appears that the increment of increased lift that one could expect
from trailing flaps was not enough to reduce the landing speed of a
supersonio airplane sufficiently. The use of boundary layer, although
much unrelated experimental data exists, (see table of references) as
a means of increasing the lift and reduoirig the drag of wedge or
circular arc airfoils has not been fully exploited. At least the
reports of such work are not available. The Qermans have investigated
the nose flap and it appears to show considerable promise in delaying
separation , thus being effective in air maneuvers a3 well as in
low speed flight.
The use of boundary layer control as a means of improving the
flight qualities of an airplane has in the past not been generally
-1-
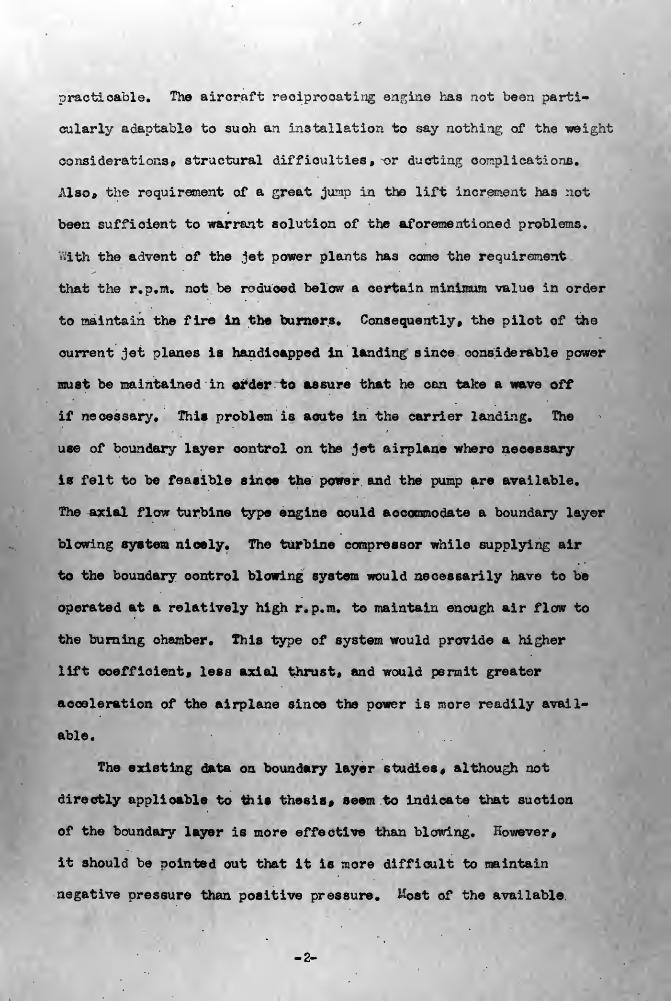
practicable. The aircraft reciprocating engine has not been parti-
cularly adaptable to such an installation to say nothing of the wel
considerations* structural difficulties, or ducting complications.
Also* the requirement of a great jump in the lift increment has not
been sufficient to warrant solution of the aforementioned problems.
•ith the advent of the jet power plants has come the requirement
that the r.p.m. not be reduced below a certain minimum value in order
to maintain the fire in the burners. Consequently* the pilot of the
current jet planes is handicapped in landing since considerable power
must be maintained in order to assure that he oan take a wave off
if necessary. This problem is acute in the carrier landing. The
use of boundary layer control on the jet airplane where necessary
is felt to be feasible since the power and the pump are available.
The axial flow turbine type engine could aocommodate a boundary layer
blowing system nicely. The turbine compressor while supplying air
to the boundary control blowing system would necessarily have to be
operated at a relatively high r.p.m. to maintain enough air flow to
the burning chamber. This type of syBtem would provide a higher
lift coefficient* less axial thrust, and would permit greater
acceleration of the airplane since the power is more readily avail-
able.
The existing data on boundary layer studies* although not
directly applicable to this thesis, seem to indicate that suction
of the boundary layer is more effective than blowing. However*
it should be pointed out that it is more difficult to maintain
negative pressure than positive pressure. &ost of the available
-2-

reports deal with boundary layer control or improvement on low speed
conventional section wings or wing flap combinations and almost all
use low pressure systems.
. Schwier at Goettingen (ref. 1) has done considerable work
on the blowing technique. Using an #ACA 23012-64 airfoil and blowing
air out immediately ahead of the flaps and immediately behind the
hinged nose, he reoorts the following results
s
Plain flaps, defleotion - 45°
Uo air blown, Cq - ^ax " 2#18
at Ca -.020 QlaBX- 3.70
Corresponding values for slotted flap
No air blown, CQ
- CLnax " 2 * S8
CQ " • 02° (W " 4*°
Using a 9% wing (ref. 2) with a slot-flap and a slat he reports:
With open slat, deflected flap
Ho air blown Cq • Ol 1.86
at Cq «• .025 0^-3.5
The nose flap (ref. 3) used with a high-speed section has shown
considerable increase of the maximum lift. The effect of this high-
lift device can be explained by the fact that at a suitable defleotion
angle the front stagnation point of the flow will be displaced quite
near the leading edge of this flap. This effect diminishes the
considerable super velocities observed near the leading edge of the
high speed profile at high angles of attack. Thus tho steep pressure
rise behind the leading edge is reduced and the stalling is delayed
-3-


to higher an^lee of attack. Th© stalling characteristics of high
speed profiles with nose flaps become similar to those of normal
leadior ed Te radius.
-4-


IX.
t\
>
A. Description of the model
•
....... r , i
?#o similar to ols wot mts. The basic
design o? . :* symmetrical Lo-
wed i five 1 lord and a twenty inch span.
••id plates were used to give i ;io.
1 lj made of wood with C.10 inch end
-O of 0.10
inch phosphor .bronze plate
3
soldered or screwed to the ribs
plates (Fig. l). The
modelfe eurfaco v-ias sealed cx-
oeot at the slit. Mr was
1 into the r^odel through
both end supports and blov/n
jver tho too surface from.
the span-wise slit which was
located at th >rd line.
as necessary to put 0. 00 f at 1-1/2 inch stati
across an to maintain a uniform slit opening* r lei was
ed to viitlistand sufficient i . pressure so that a ••ach
number oC one oould be reached in tho slit* This feature assured
an even spantd.se distribution of flow across th si.
: air was conducted into the model ( 'ig. Z) in the tunnel
attaol idly to t! lates. These pines were
$1 support wer Lded by externally
Vu i
&Model II showing support tube,
fairing.and flexible hose.
N;
-£.
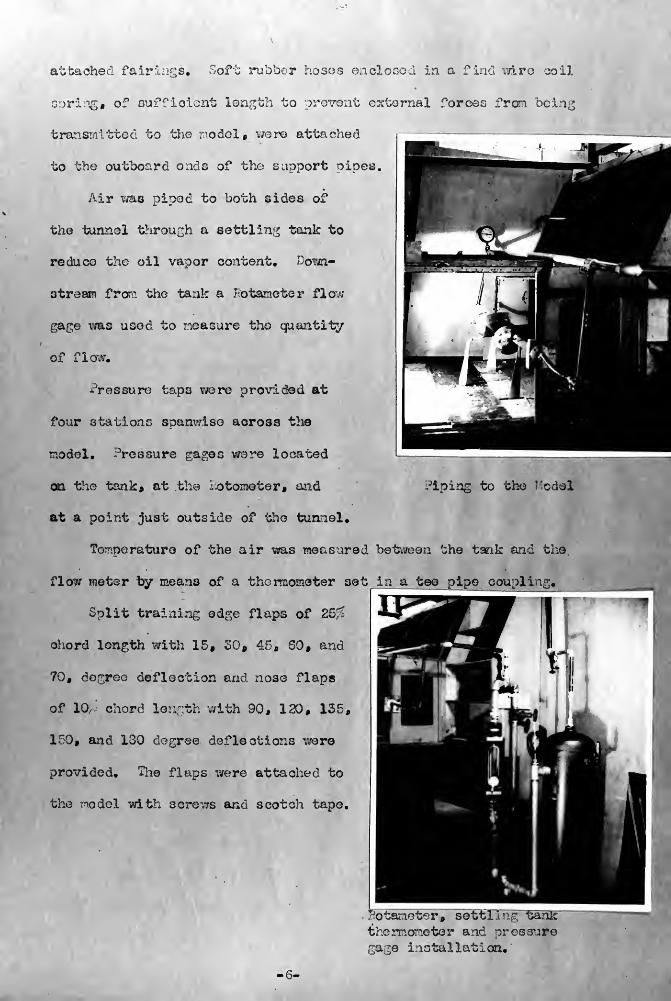
attached fairings* Soft rubber hoses enclosed in s
spring* of sufficient length to it external forces from
tra: ed to the model, were attached
to the outboard ends of tfc ^ort oipes.
r was piped to both sides
the tunnel through a settling tank to
reduce the oil vapor content. Down-
stream fror. the tank a Rotameter flow
as used to measure tho quantity
of flow.
Pressure tap a were provided at
four 8 1 mnwise across the
model. Pressure gages were located
on the tank, at the i-otometer, and
at a point just outside of the tunnel.
perature of the air was measured between the tank a
flow meter by mean3 of a thermometer set in a tee pipe coupli .
Split training edge flaps of 26
chord length with 15, o0 8 \0$ and
70, degree deflection and nose flaps
of 10,' chord length with 90, 120, 135,
130, and 130 degree deflections v/ere
provided. The flaps were attached to
iol with soro".7S and scotch tape.
Piping to the Hodel
Botameter , settD i ig~ tank"
^.oneter an ;3ure
3 installation.
B. Corrections of Measurements
The drag correction for -odel I was ascertained by using the
image system method. Since Model II was essentially the same as
r
~odel I except for the end plates and the slit, the drag correction
was determined by making similar runs and comparing the data. It
was assumed that the difference in the drag at various angles of
attack was clue to the end plates and modol support interference,
and the air connection fittings on th< olates which were not
faired. The drag correction obtained in thi3 way turned out, with-
in the limits of accuracy, to be a constant for all angles of attack.
Tare moment correction runs were made with both models. In
order to duplicate operating conditions with T'odel II the air line
between the flexible hose connection and the model was blocked and
44.7 psi absolute pressure was maintained in the line.
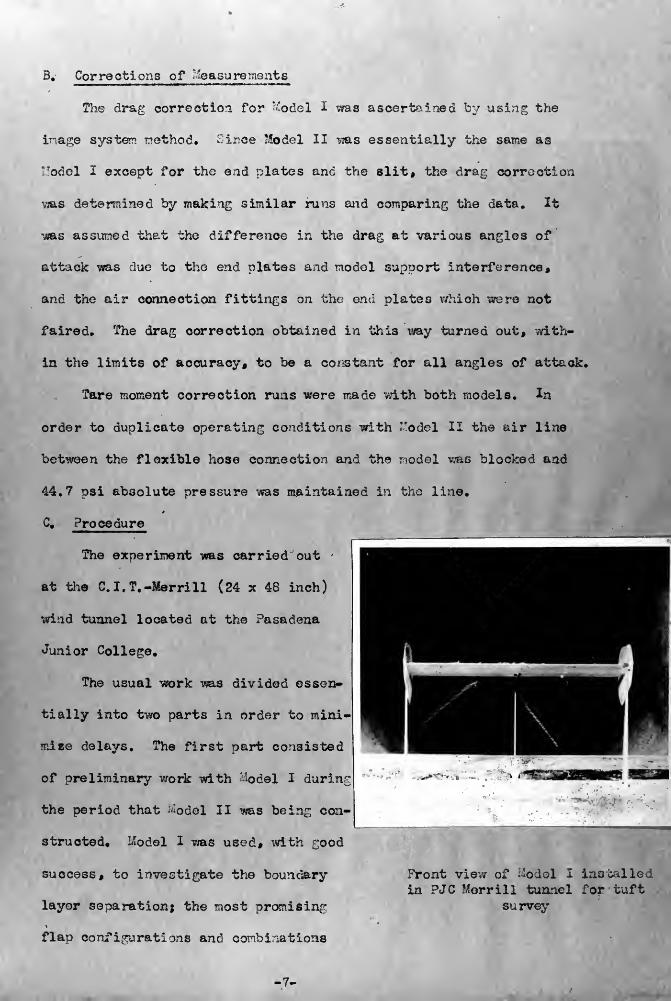
C. Procedure
The experiment was carried out
at the C. I. T. -Merrill (24 x 48 inch)
wind tunnel located at the Pasadena
Junior College.
The usual work -was divided essen-
tially into two parts in order to mini-
mi eg delays. The first part consisted
of preliminary work with -iodel I during
the period that -odel II was being con-
structed, -vlodel I was used, with good
success, to investigate the boundary
layer separation; the most promising
f1ap co nJPigurati ons and cornb i iat ions
. .
-T".
Front view of - odol I installedin PJC Morrill tunnel for tuft
su rvey
-7-
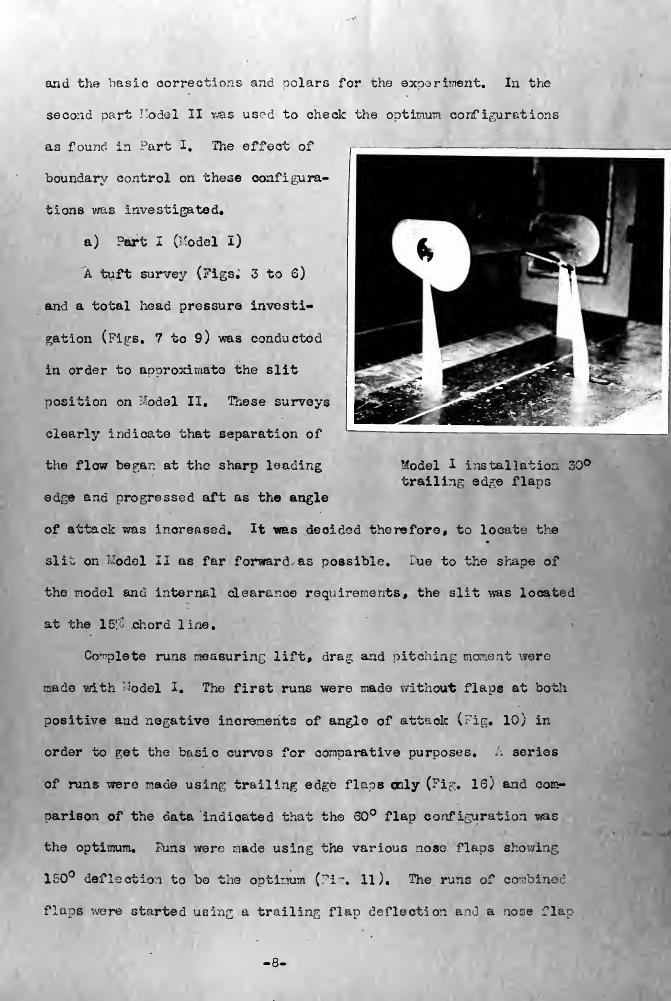
Model I installation 30°
trailing edge flapa
and the basic corrections and molars for the experiment. In the
second part F 'odel II was used to check the optimum configurations
as found in ;;'art I. The effect of ^^
boundary control on these oonfi .^ra-
tions was Investigated.
a) Part I (Model I)
A tuft survey (?igs. 3 to 6)
and a total head pressure invest!-
gation (Fips. 7 to 9) was conducted
in order to approximate the slit
position on "-odel II. These surveys
clearly indicate that separation of
the flow bep;ai: at the sharp leading
ed^e and progressed aft as the angle
of attack was increased. It was decided therefore, to locate t!
slio or. odel II as far forward as possible, -ue to the shape of
the model and internal clearance requirements, the slit was located
at the 15; chord line.
Complete runs measuring lift, drag; and pitching moment were
made with t del I. The first runs were made without flaps at both
positive and negative increments of angle of attaok ("ic, 10) in
order to p;et the basic curves for comparative purposes. A series
of runs were made usinf- trailing edge flaos oily (?i.: :. lo) and com-
parison of the data indicated that the 60° flap configuration was
the optimum. Puns were made using the various nose flaps shov/ing
150° deflection to bo the optimum ("i ". 11 ). The runs of co
/ere started usin£ a trailing flap deflection and a nose flap
-8-
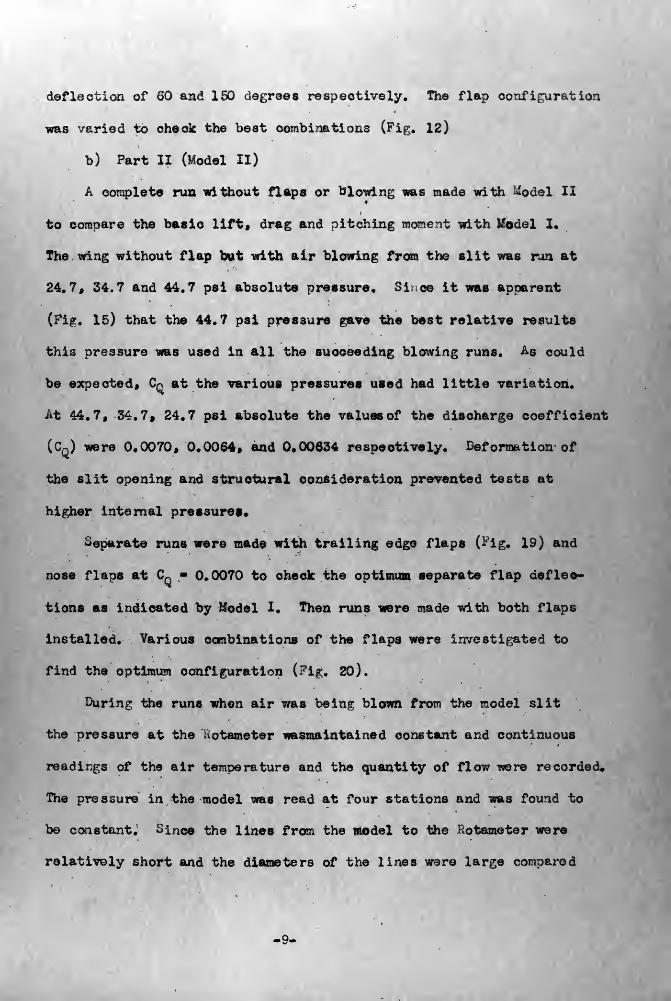
deflection of 60 and 160 degrees respectively. The flap configuration
was varied to check the best combinations (Fig. 12)
b) Part II (Model II)
A complete run without flaps or blowing was made with ^odel II
to compare the basic lift, drag and pitching moment with Model I.
The wing without flap but with air blowing from the slit was rjn at
24.7, 34.7 and 44.7 psi absolute pressure. Siuce it was apparent
(Fig. 15) that the 44.7 psi pressure gave the best relative results
this pressure was used in all the succeeding blowing runs. As could
be expected, Cq at the various pressures used had little variation.
At 44.7, 34.7, 24.7 psi absolute the values of the discharge coefficient
(Cq) were 0.0070, 0.0064, and 0.00634 respectively. Deformation of
the slit opening and structural consideration prevented tests at
higher internal pressures.
Separate runs were made with trailing edge flaps (^'ig. 19) and
nose flaps at CQ
- 0.0070 to check the optimum separate flap deflec-
tions as indicated by Model I. Then runs were made with both flaps
installed. Various combinations of the flaps were investigated to
find the optimum configuration (Fig* 20).
During the runs when air was be in,? blown from the model slit
the pressure at the Rotameter wasmaintained constant and continuous
readings of the air temperature and the quantity of flow were recorded.
The pressure in the model was read at four stations and was found to
be constant, ^ince the lines from the model to the Rotameter were
relatively short and the diameters of the lines were large compared
-9-
to the slit area a pressure loss in the lines could not be detected.
All pressure gages were calibrated just before being installed.
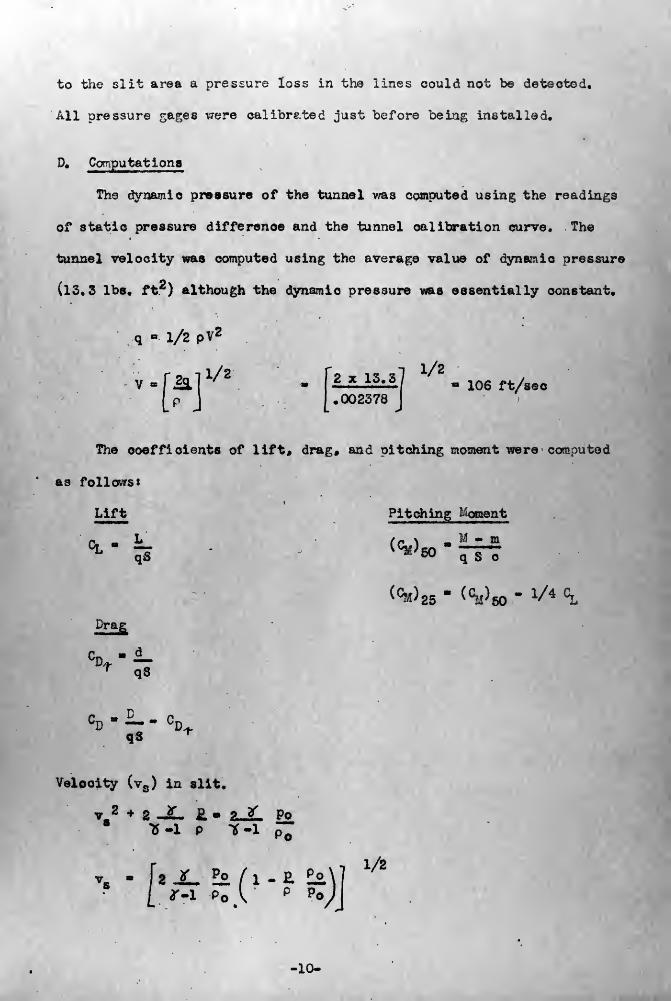
D. Computations
The dynamic pressure of the tunnel was computed using the readings
of static pressure difference and the tunnel calibration curve. The
tunnel velocity was computed using the average value of dynamic pressure
(l3. 3 lbs. ft2 ) although the dynamic pressure was essentially constant.
q - 1/2 pV2
iila]
1/ 2. U » 13.3]
1/2. 106 ft/890
J1.002378
The coefficients of lift, drag, and oitching moment were computed
as follows:
Lift Pitching Moment
«^»>ae " «*>» - x^ °l
Dra
r qS
qS *
Velocity (vs ) in slit.
2 2 y £. » 9 3T p5-1 P "tf-1 p^
v8 - 2 JL !° / 1 - 2. ££
jr.l p V P P0j
-10-
1/2
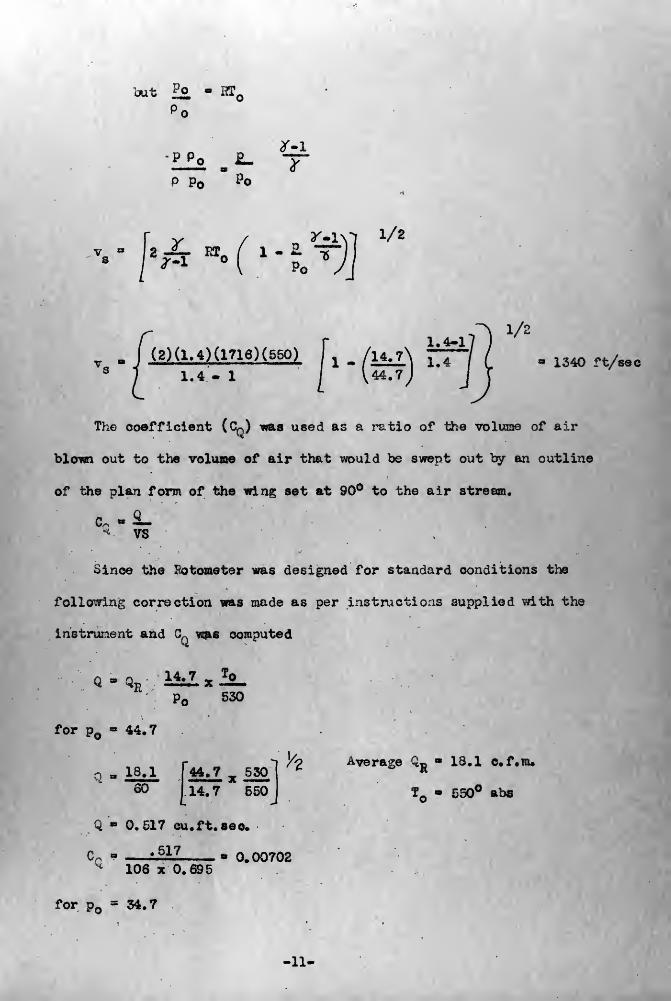
but £o BT.
P P
y — / ,y-r*»• i -t*
1/2
(2)(1.4)(1716)(550)
1.4 - 11 -
1/i
- 1340 ft/sec
The coefficient (Cn) waa used as a ratio of the volume of air
blown out to the volume of air that would be swept out by an outline
of the plan form of the wing set at 90° to the air stream.
VSc- -&-
Since the Kotometer was designed for standard conditions the
following correction was made as per instructions supplied with the
instrument and CL was computed
^ T
Pr 530i4J
>o
for p 44.7
=» 18.1u
"so"44.7 x 530
14.7 550J
Vt Average QR 13.1 c.f.m.
? 550° abs
Q 0.517 cu.ft. sec.
C„ .517
106 x 0.6950.00702
for p = 34.7
-11-
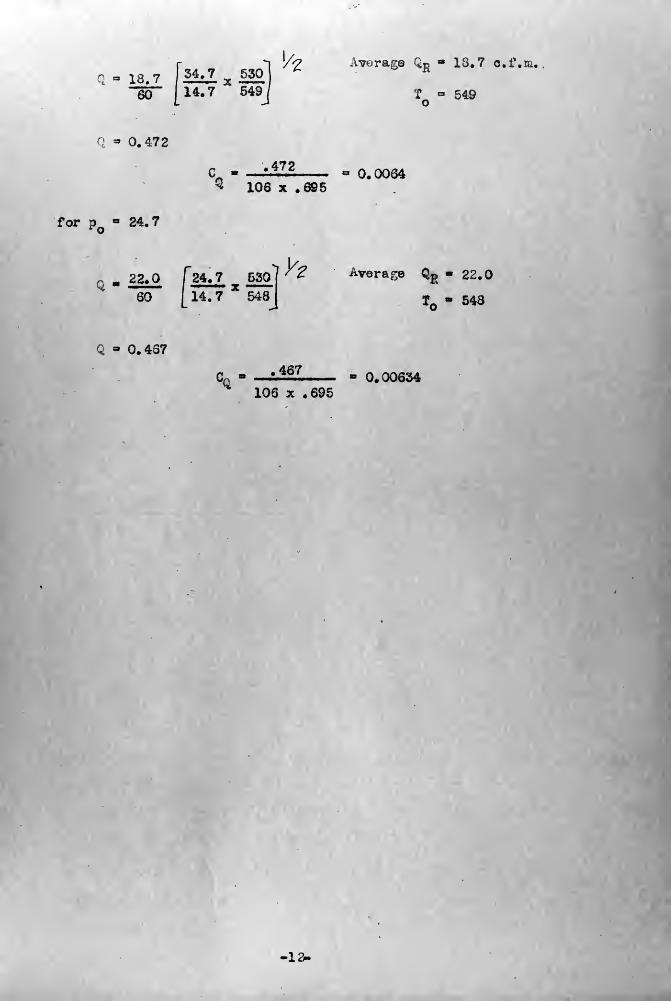
\*a 7 «*n1 ^ Average QR - IS. 7 c.f.m.
18.7 £il xS30
"60" [14.7549J t « 549
0.472
for pQ« 24.7
0.457
C - —'J21 «= 0.0064^ 106 x .695
22.0 ["24.7 530] '? Average Qfi
- 22.0
60 [l4.73C
548j T » 548
CQ- V467 » 0.00634
106 x .695
-12-
III. F33SJUS - MS
A. Results
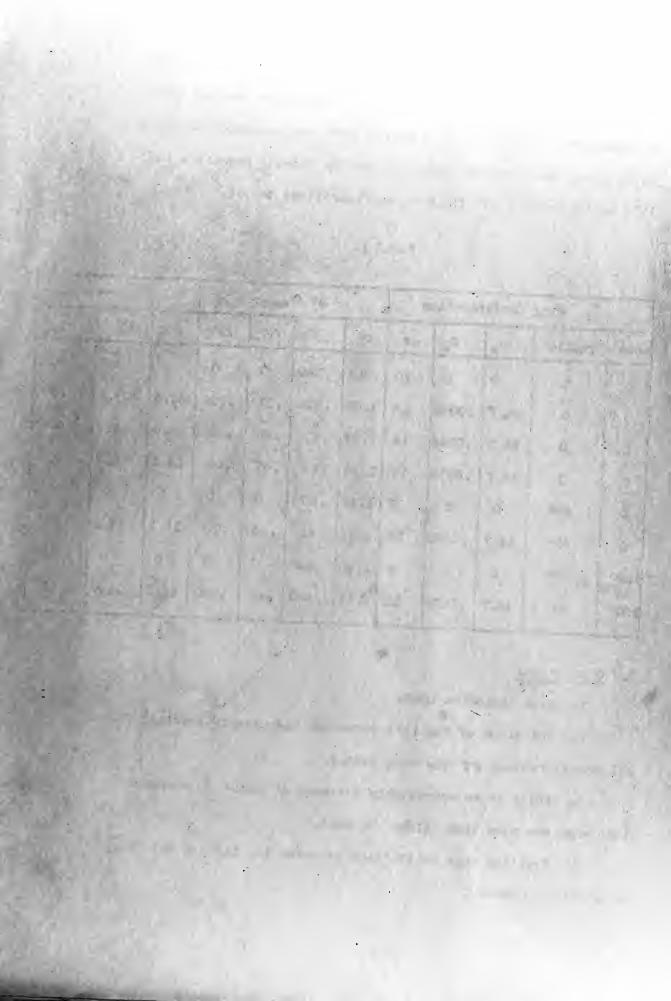
A comparison of results is presented in the following tabular
forms.
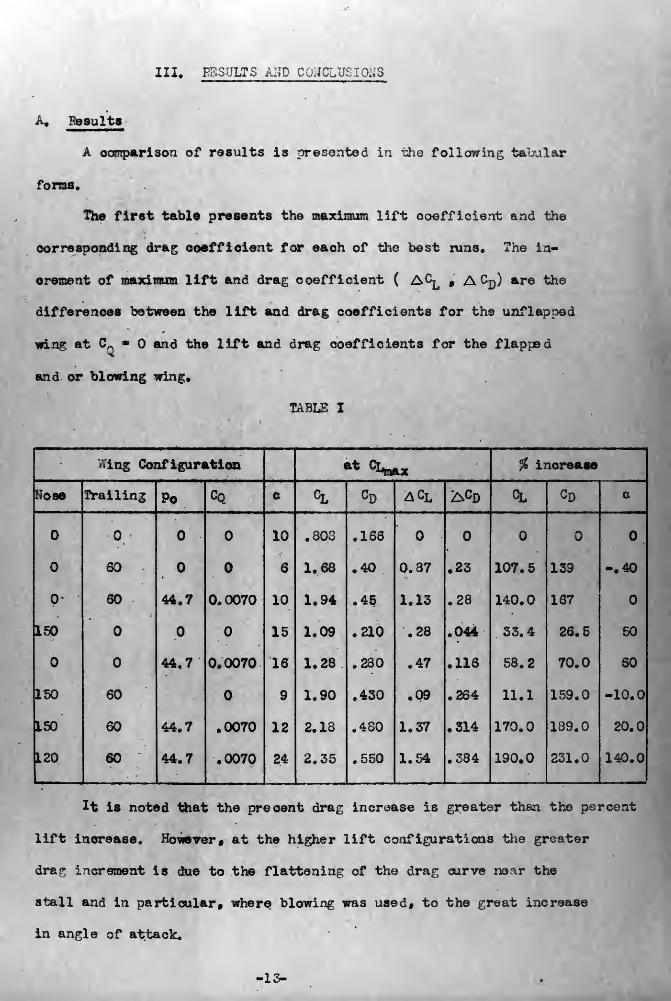
The first table presents the maximum lift coefficient and the
corresponding drag coefficient for each of the best runs. The in-
crement of maximum lift and drag coefficient ( AC^ f A Cj)) are the
differences between the lift and drag coefficients for the unflapoed
wing at CA * and the lift and drag coefficients for the flapped
and or blowing wing.
TABLE I
.ing Configuration at °Wx % increase
Nose Trailing Po °Q c CL cD ACl acd CL CD a
10 .803 .166
SO 6 1.68 .40 0.37 • 23 107.5 139 -.40
o- 60 44.7 0.0070 10 1.94 .45 1.13 .28 140.0 167
150 15 1.09 .210 .28 .044 33.4 26.5 50
44.7 0.0070 16 1.28 .230 .47 .116 58.2 70.0 60
ISO 60 9 1.90 .430 .09 .264 11.1 159.0 -10.0
ISO 60 44.7 .0070 12 2.18 .480 1.37 .314 170.0 139.0 20.0
120 60 44.7 .0070 24 2.35 .550 1.54 .384 190.0 231.0 140.0
It is noted that the pre cent drag increase is greater than tho percent
lift increase. However, at the higher lift configurations the greater
drar increment is due to the flattening of the drag curve near the
stall and in particular, where blowing was used, to the great increase
in angle of attack.
-13-
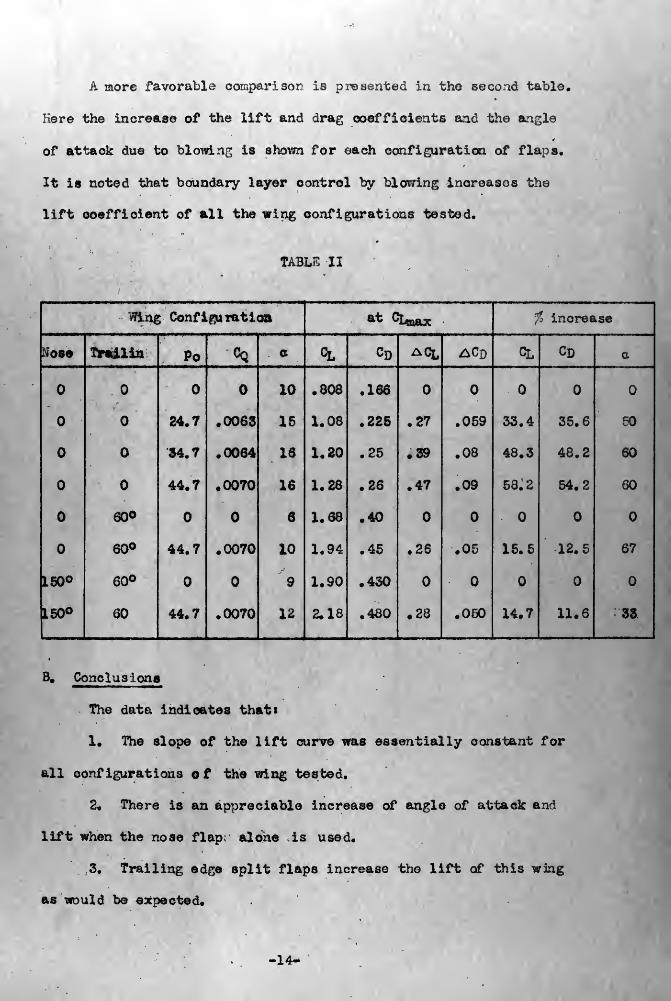
A more favorable comparison is presented in tho second table.
Here the increase of the lift and drag coefficients and the angle
of attack due to blowing is shown for each configuration of flaps.
It is noted that boundary layer control by blowing increases the
lift coefficient of all the wing configurations tested.
TABLE II
Wing Configuration &t °Udax increase
-»ose Trailin Po CQ a cL CD ACl ACd CL CD a
10 .808 .166
24.7 .0063 15 1.08 • 225 .27 .059 33.4 35.6 50
34.7 .0064 16 1.20 .25 .39 .08 48.3 48.2 60
44.7 • 0070 16 1.28 .26 .47 .09 58.2 54.2 60
60° 6 1.68 .40
60° 44.7 .0070 10 1.94 .45 .26 .05 15.5 12.5 67
150° 60° 9 1.90 .430
150° 60 44.7 .0070 12 2.18 .480 .28 .050 14.7 11.6 33
B. Conclusions
The data indicates thati
1. The slope of the lift curve was essentially oonstant for
all configurations of the wing tested.
2. There is an appreciable increase of angle of attack and
lift when the nose flap, alone is used.
3. Trailing ed^e split flaps increase tho lift of this wing
as would be expected.
-14-

4, The combination of nose and trail! ;e flaps on the wing,
while giving a great increase in lift, caused the wing to stall at
about the same angle of attack as the stall anr;le for the basic wing.
The addition of the jet boundary layer control to the flapped wing
increased the angle of attack appreciably and thus increased the lift,
6. The boundary layer control by blowing Improves the wing
characteristics sufficiently to warrant much further study. It
should be noted that the model was tested with the jet slit located
at the 15 nercent wing chord line and at a coefficient of discharge
of air of 0.0070. It is suggested therefore, that further tests
be made with the current model. The optimum position of the jet
slit and the most practicable value of Cq could be investigated.
-1!
REF/CfcSWCES
1. Schwier, W. - Lift Increase by Blowing out nirs Tests on Airfoilof 12$ Thickness Using; Various Tyoes of Flap.Ho. 219.
2. Schwior, "". - Lift Increase Produced by Blowing a 'ving of a ProfileThickness of 9% Equiot with a Slat and a SlottedFlap. No. F-TS-645-R2.
3. Kruger, %* - The Nose Flap as a I^ans for increasing the MaximumLift of High-Speed Aeroplanes. CGD 532.
4. Smith, A.M. 0. - A Preliminary Study of the Problem of BoundaryLayer Control.
5. Kleber, J.^. , Schwarzbach, J..". - .ind Tunnel Tests of Flap andAileron-Flap Combination. Curtiss-.?right Corp.
Keport No. 9367.
6. Smith, A. \Q* 9 Koberts, ->. . - The Jet Airplane Utilising 3oundaryLayer Air for Propulsion. Douglas Airoraft Co.,inc. report.
7. Fischer * Porter Company - Theory of the Rotameter, Catalog section98-Y.
8. tteske, J.R.- Induction of Skin Friction on a Flat Plate. JRAS 1939.
9. Eiohardson, £G.- Manipulation of Boundary Layer. JRAS 1938.
10. Freeman, H.B., - Boundary Layer Control Tests. WACA T.N. 1007.
16.

FIG. I
MODEL IL
Z
^
X
7
Z
0.275
^
ii
20
-rf 7
OIOPHOSPHERBRONZEPLATE
TYPICAL RIB
SECTION
2.75
2.0"
375
A-A


EC
-X
€>
cc (T
LU LUH h-
LU LU
2 ^< £K OO _Jcr u_
<
<
^LUO ce< LUCD h-
LULUor
2o3CO(/) crLU LUor X0- h-
or cm
<
2 LI
LUXoC/)
0- K
©ct
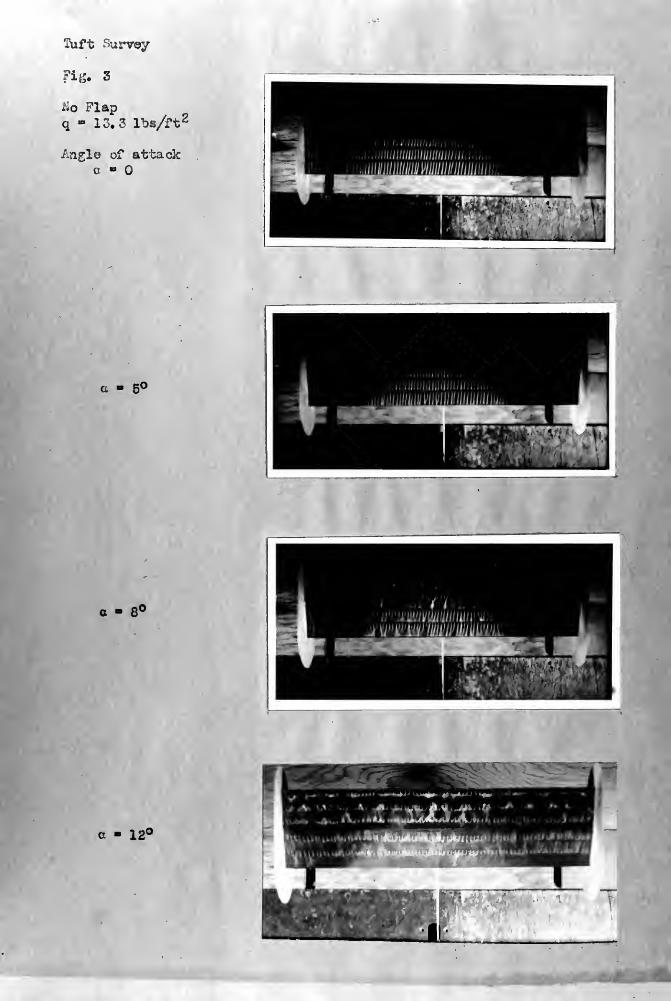
Tuft Survey
?U;. 3
Ho Flap
q - 13.3 lbs/ft2
Angle of attackc -
a - 8°
c - 8°
a - 12°
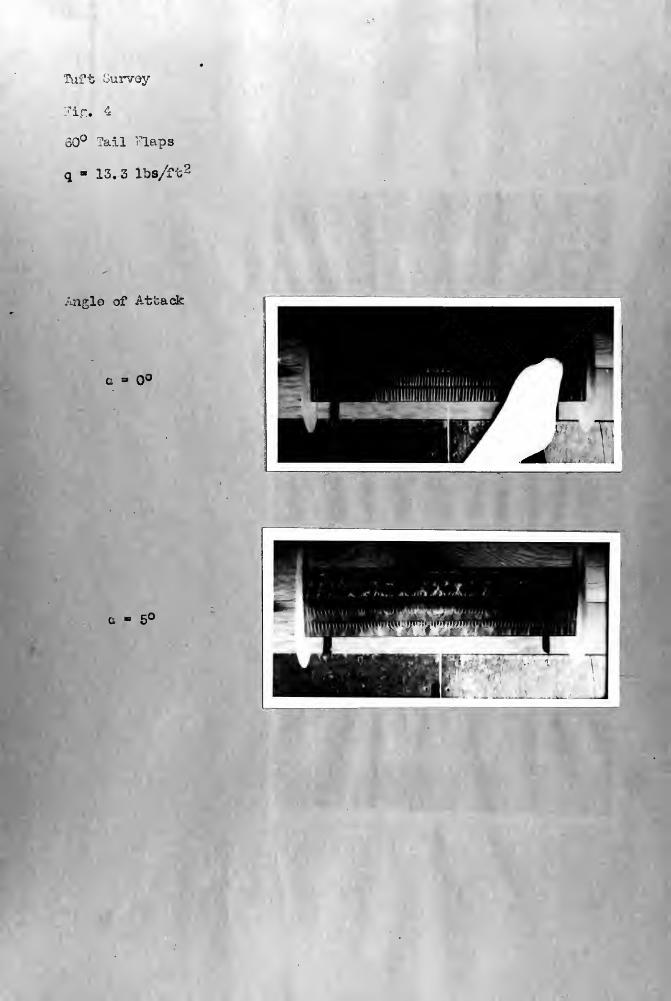
Tuft Purvey
'i'-. 4
oO° Tail "laps
q - 13.3 lbs/
lo of Attack
0° "BHW
a » 5°
Tuft Survey
Pig. 5
150° ^ose Flap
q » 13.3 lbs/ft2
Anglo of attack
11°
c - 13'
c » 15r;0

Tuft Survey
Fig. S
60° Tail Flaps
150° *«ose ?laps
q - 13.3 lbs/ft 2
Arifle .of Attack
a = d30
a « 8 (
a - 10°

:-
'
--K-'
.t- [ •;•
;
•
'
;:[;;.
;
|
:
, :'rr:: "j'
.:\
'
::'.
.t BE r — :... I ;...-['-
;-;:t .
'
;;";
6


1 s<0
1
tryoft <fr
/
Otrt

n—nrrrn
i{


SPLIT »FL AP' DEFLECTION

20 30P- PS I obs.o

^ •*. CVJ

-0.35

1 '
ON AIS
5
i
'
—1- -^*=
8

1
—
—i—
-
-rr—
f
I
~
8 12 0.10

f
'.:
aic

MY 28 57 INTERL IB
mm" "
DATE DUB
2! St*4?
%,«151

thesP73
A study of methods to increase the lift
U
3 2768 001 92317DUDLEY KNOX LIBRARY


