
DNV GL Headquarters, Veritasveien 1, P.O.Box 300, 1322 Høvik, Norway. Tel: +47 67 57 99 00. www.dnvgl.com
A study for Lithuanian Power Sector
Scenario Building for the Evolution of
Lithuanian Power Sector for 2020 - 2050 Litgrid AB
Date: 2020-12-16 REPORT: 2020-0430

DNV GL - Scenario Building for the Evolution of Lithuanian Power Sector for 2020-2050
2
Report title: Scenario Building for the Evolution of Lithuanian
Power Sector for 2020-2050
Client: Litgrid AB
Contact person: Vaida Tamašauskaitė
Date: 2020-12-16
Org. unit: Energy Markets and Technology
Project no: 10208029
Report no: 2020-0430
Performed by:
Verified by:
Approved by:
Ingrid Bye Løken
Gudmund Bartnes
Jørgen Bjørndalen
Erik Dugstad
Daniel Brenden
Frida Berglund
Copyright © DNV GL 2020. All rights reserved. Unless otherwise agreed in writing: (i) This publication or parts thereof may not be
copied, reproduced or transmitted in any form, or by any means, whether digitally or otherwise; (ii) The content of this publication
shall be kept confidential by the customer; (iii) No third party may rely on its contents; and (iv) DNV GL undertakes no duty of care
toward any third party. Reference to part of this publication which may lead to misinterpretation is prohibited. DNV GL and the Horizon Graphic are trademarks of DNV GL AS.
DNV GL Energy
Energy Markets and Technology
P.O.Box 300
1322 Høvik
Norway
Tel: +47 67 57 99 00
DNV GL - Scenario Building for the Evolution of Lithuanian Power Sector for 2020-2050
3
Table of contents
1 EXECUTIVE SUMMARY ..................................................................................................... 7
2 INTRODUCTION ............................................................................................................ 10
3 THE ENERGY POLICIES SHAPING OUR FUTURE ................................................................. 12
3.1 Introduction 12
3.2 Clean Electricity To Drive Increasing Global Decarbonisation Momentum 12
3.3 EU To Spearhead Global Decarbonisation Efforts 16
3.4 Lithuania: Energy Independence And Decarbonisation To Drive Transition 18
3.5 From policy to modelling: Key assumptions 24
3.6 Developing three scenarios for power generation 25
4 LITHUANIAN ELECTRICITY SCENARIOS ........................................................................... 27
4.1 Introduction 27
4.2 Cross-scenario assumptions 29
4.3 National Trends Scenario 37
4.4 Centralized Energy Scenario 41
4.5 Distributed Energy Scenario 45
5 POWER GENERATION MODELLING RESULTS .................................................................... 49
5.1 Introduction 49
5.2 Key Takeaways 49
5.3 National Trends Results 52
5.4 Centralised Energy Results 55
5.5 Distributed Energy Results 60
5.6 Peak demand 64
6 FLEXIBILITY MARKET BACKGROUND: THE IMPORTANCE OF FLEXIBILITY ............................. 66
6.1 Introduction 66
6.2 Evolving Flexibility Solutions in the Power Market 66
6.3 The Balancing Market 69
6.4 Flexibility Market Background: Defining Relevant Flexibility Solutions 70
7 SYSTEM ADEQUACY ASSESSMENT: INTRODUCING THREE LEVELS OF FLEXIBILITY TO THE LITHUANIAN POWER MARKET .................................................................................. 78
7.1 Introduction 78
7.2 Outlining the challenges in a Low Flexibility Case 80
7.3 Outlining challenges and solutions in a medium flexibility case 84
7.4 Identifying surplus week solutions in a high flexibility case 91
7.5 System adequacy performance by scenario 94
8 IDENTIFICATION AND RECOMMENDATIONS FOR ACTIONS AND MEASURES ....................... 102
8.1 Wind Power Business Case 102
8.2 Power-To-Gas Business Case 103
8.3 Battery Storage Business Case 112
8.4 Demand-Side Flexibility Business Case 116
8.5 Summary of flexibility business cases: Technology trilemma 117

DNV GL - Scenario Building for the Evolution of Lithuanian Power Sector for 2020-2050
4
9 ROADMAP TO 2050 ..................................................................................................... 120
9.1 Introduction 120
9.2 2020-2025: Supporting the ramp-up towards de-synchronisation 123
9.3 2025-2030: Delivering on EU targets and facilitating NENS implementation 125
9.4 2030-2050: Delivering on the NENS 128
10 CONCLUSIONS ........................................................................................................... 131
10.1 Meeting NENS targets 131
10.2 The importance of flexibility to facilitating the energy transition 131
10.3 Defining a roadmap that can support NENS target delivery 132
11 REFERENCES .............................................................................................................. 134
APPENDIX 1: ANALYSIS TOOL AND MODELLING METHODOLOGY ................................................... 136
Main sources for scenario development 137
List of figures Figure 1: World Final Energy Demand By Carrier ........................................................................... 13 Figure 2: World electricity generation by power station type ........................................................... 14 Figure 3: Flexibility issues by timescale ........................................................................................ 15 Figure 4: World utility-scale storage capacity ................................................................................ 16 Figure 5: Overview Over Green Deal Aims .................................................................................... 17 Figure 6: Installed generation capacity in Lithuania in 2020, MW ..................................................... 19 Figure 7: Strategic Aims Under NENS ........................................................................................... 20 Figure 8: Power Consumption, Generation and Net Imports over 2019 ............................................. 21 Figure 9: Power generation over 2019 by technology % share of total .............................................. 21 Figure 10: Power generation by renewable energy source under NENS vision, TWh ............................ 23 Figure 11: TYNDP Development Scenarios .................................................................................... 26 Figure 12: Installed Capacities By DNV GL Scenario, 2030, GW ....................................................... 28 Figure 13: Power Generating Capacity By Technology By Scenario, 2050 .......................................... 29 Figure 14: Lithuanian electricity import and export capacity ............................................................ 30 Figure 15: Electricity Forecast Scenario By Sector .......................................................................... 31 Figure 16: Scenario for electricity demand from electric vehicles in Lithuania .................................... 34 Figure 17: Commodity prices in DNV GL’s power price model .......................................................... 35 Figure 18: Installed Capacity Under National Trends Scenario ......................................................... 37 Figure 19: Net Change By Technology By Year, GW ....................................................................... 38 Figure 20: Technology Share Of Total Capacity In 2040 .................................................................. 39 Figure 21: Installed Capacity Under Centralized Energy Scenario, GW .............................................. 41 Figure 22: Net Capacity Change By Technology By Year, GW........................................................... 42 Figure 23: Technology Share Of Total Capacity In 2040 .................................................................. 43 Figure 24: Net Capacity Growth By Technology By Year, GW ........................................................... 45 Figure 25: Net Capacity Change By Technology By Year, GW........................................................... 46 Figure 26: Technology Share Of Total Capacity In 2040 .................................................................. 47 Figure 27: National Trends Power Generation By Year, TWh ............................................................ 53 Figure 28: Centralised Energy Power Generation by Year, TWh ........................................................ 57 Figure 29: Distributed Energy Power Generation by Year, TWh ........................................................ 62 Figure 30: Lithuania peak load results compared with ENTSO-E scenarios ......................................... 65 Figure 31: Sources of variability and flexibility in the power system, based on (DNV GL, 2017) ........... 67 Figure 32: Time-scale of flexibility services, based on (DNV GL, 2017) ............................................. 68 Figure 33: EV electricity demand projection (left) and capacity profile (right) .................................... 72 Figure 34: Load curtailment versus load shifting ............................................................................ 73 Figure 35: Lithuania import and export capacity ............................................................................ 75 Figure: 36 Power to gas capacity scenario ..................................................................................... 76 Figure 37: Average annual power price and wind power capture price by flexibility case ..................... 79 Figure 38: Electricity price duration curves in the National Trends Scenario - Low flex case ................. 80
DNV GL - Scenario Building for the Evolution of Lithuanian Power Sector for 2020-2050
5
Figure 39: Low flex case, production, load and price during energy surplus week in 2050 ................... 82 Figure 40: Low Flex case - Power price in an energy deficit week in 2030, 2040 and 2050. ................. 83 Figure 41: Low flex case: Production, load and price during energy deficit week in 2050 ..................... 84 Figure 42: Medium Flex case - Price duration curves ...................................................................... 85 Figure 43: Medium flex case - Generation, load and power price - Energy surplus week in 2030 .......... 86 Figure 44: Medium flex case - Generation, load and power price - Energy surplus week in 2040 .......... 86 Figure 45: Medium flex case - Generation, load and power price - Energy surplus week in 2050 .......... 87 Figure 46: Medium flex case - Generation, load and power price - Energy deficit week in 2030 ............ 88 Figure 47: Medium flex case - Generation, load and power price - Energy deficit week in 2040 ............ 89 Figure 48: Medium flex case - generation, load and price – energy deficit week in 2050 ..................... 89 Figure 49: Medium flex case – Decomposition of electricity consumption – energy deficit week in 2050 90 Figure 50: Medium flex case - Flexibility effect on power price during deficit week in 2050 .................. 91 Figure 51: High Flex price duration curve ...................................................................................... 92 Figure 52: High flex case - production, load and price - energy surplus week in 2050 ......................... 93 Figure 53: High flex case - decomposition of load - energy surplus week in 2050 ............................... 93 Figure 54: High flex case - flexibility effect on power price - energy surplus week in 2050 .................. 94 Figure 55: National Trends - Price duration curves in 2050 by flexibility case .................................... 97 Figure 56: Development of wind power LCOE (DNV GL, 2020) ...................................................... 102 Figure 57: P2X effect on onshore and offshore wind capture price .................................................. 103 Figure 58: Power to gas capacity and consumption - National Trends scenario................................. 104 Figure 59: Electricity consumption from power to gas facilities throughout the year in 2050 .............. 104 Figure 60: European hydrogen potential scenario (European Commission, 2020) ............................. 105 Figure 61: The effect of power price for hydrogen production on cost of hydrogen, power price and wind power capture price ................................................................................................................. 107 Figure 62: Cost of power-to-gas-to-power (EUR/MWh) ................................................................. 108 Figure 63: Business case for power to hydrogen (for blending with natural gas at 20 EUR/MWh) ....... 109 Figure 64: Current and future prices* for natural gas in Lithuania (Heat Roadmap Europe, 2017) ...... 110 Figure 65: Illustrations of P2G business cases with more favourable market conditions .................... 112 Figure 66: Installed BESS capacity and use in the wholesale market .............................................. 113 Figure 67: Business case for stationary batteries ......................................................................... 114 Figure 68: Stacking of revenues (DNV GL, 2017) ......................................................................... 114 Figure 69: Annual net income from V2G ..................................................................................... 115 Figure 70: National Trends - the impact of P2G - Need for subsidies in Medium Flex vs High Flex....... 118 Figure 71: Renewable Energy Generation Expansion Targets ......................................................... 121 Figure 72: National Trends - Electricity consumption, generation and net imports by year, TWh ........ 122 Figure 73: National Trends - Installed power generating capacity by year, MW ................................ 122 Figure 74: National Trends - Net flexibility capacity growth by period, GW ...................................... 123 Figure 75: National Trends - Capacity Change By Year, GW........................................................... 124 Figure 76: National Trends - Generation Capacity Net Growth By Year, GW ..................................... 126 Figure 77: National Trends – Net Flexibility Capacity Growth, 2025-2030, GW ................................. 127 Figure 78: National Trends - Net power generating capacity growth by decade, GW ......................... 129 Figure 79: National Trends - Net flexibility capacity growth by decade, GW ..................................... 130 Figure 80: Focus countries in the power market model ................................................................. 136 Figure 81: Main sources for Lithuania scenario development ......................................................... 137
List of tables
Table 1: Key Overall Targets In NENS (2030 & 2050) & NECP (2030) ............................................... 19 Table 2: Scenario for annual total load development in Lithuania (TWh) ........................................... 31 Table 3: Summary of national trends scenario ............................................................................... 40 Table 4: Summary Of Centralized Energy Scenario ......................................................................... 44 Table 5: Summary Of Distributed Energy Scenario ......................................................................... 48 Table 6: 2030 NENS Targets results by scenario ............................................................................ 50 Table 7: 2050 NENS Targets result by scenario ............................................................................. 51 Table 8: Summary of National Trends Power Generation By Year, TWh ............................................. 54 Table 9: Summary of Centralised Energy Power Generation by Year, TWh ......................................... 58 Table 10: Summary of Distributed Energy Power Generation by Year, TWh ....................................... 64 Table 11: Peak load results by scenario ........................................................................................ 65 Table 12: Overview of balancing market characteristics .................................................................. 69

DNV GL - Scenario Building for the Evolution of Lithuanian Power Sector for 2020-2050
6
Table 13: DSM methodology ....................................................................................................... 74 Table 14: Indicators of system stress in 2040 and 2050, by scenario and flexibility case ..................... 96 Table 15: Lithuania's resource requirements ................................................................................. 98 Table 16: Installed capacities and potential frequency resources (National Trends scenario) ................ 99 Table 17: Inertia in the Lithuanian power system in 2050 ............................................................. 100 Table 18: Investment costs for stationary batteries in the National Trends scenario ......................... 114 Table 19: Subsidies needed for wind power, P2G and batteries in 2050 .......................................... 118

DNV GL Headquarters, Veritasveien 1, P.O.Box 300, 1322 Høvik, Norway. Tel: +47 67 57 99 00. www.dnvgl.com
1 EXECUTIVE SUMMARY
The momentum of the global energy transition is picking up. In line with steadily increasing aspirations
globally for limiting global climate change and weaning the world off fossil fuels, policymakers and
businesses find themselves in the middle of a profound shift in the way energy is produced and
consumed. This will present new challenges, as well as opportunities, and markets that are willing to
adapt politically, economically and technologically will be best able to capitalise on the transition to a
decarbonised energy market. In the context of rising global decarbonisation aspirations and the push
towards renewable energy, the European Union is taking a lead role in developing policy frameworks that
can best facilitate such a shift.
Against this backdrop, in June 2018, the Lithuanian Parliament approved the National Energy
Independence Strategy (NENS). The NENS puts in place a strategic vision and roadmap for the evolution
of the Lithuanian energy sector leading up to 2050. The strategy reflects the key focus areas for
Lithuanian energy policy – namely to achieve energy independence, energy security and deep
decarbonisation at an affordable cost. This is in the context of a historic Lithuanian reliance on Russia for
its energy, both as a part of the IPS/UPS (Integrated Power System/Unified Power System of Russia) as
well as a net importer of fossil fuels for power generation. In line with the NENS, desynchronization from
this system is planned by the end of 2025. Instead, by integrating into the European system and
diversifying its energy supply, both in terms of power system synchronisation and greater renewables
utilisation, Lithuania will progress towards its energy objectives through EU energy policy alignment.
With Lithuania currently importing around 70% of the electricity it consumes, reaching the NENS targets
means a substantial increase in installed renewable generation capacity. Three potential scenarios for
the Lithuanian power market to meet its near and long-term aspirations under the NENS and align with
EU targets were modelled and simulated in DNV GLs power market model. The scenarios are based on
the scenarios outlined by the European Network of Transmission System Operators for Electricity
(ENTSO-E) in its TYNDP 2020 report leading up to 2040. Adjustments has been made to the scenarios in
the short term based on the NENS, and DNV GL assumptions form the development after 2040. The
three scenarios are described below.
• National Trends: National Trends (NT) is the central scenario based on draft NECPs in
accordance with the governance of the energy union and climate action rules, as well as on
further national policies and climate targets already stated by the EU member states.
• Centralized Energy: The Centralized Energy scenario is based on ENTSO-E’s Global Ambition
scenario. It is compliant with the 1.5° C target of the Paris Agreement and looks at a future that
is led by development in large-scale centralized generation.
• Distributed Energy: The Distributed Energy scenario also aims for 1.5° C target compliance,
but envisions more of a decentralised approach to power generation.
Electricity demand in Lithuania is forecasted to increase substantially compared to current levels, from a
total demand of 13 TWh today to almost 20 TWh in 2050. In general, greater electrification of industry,
services and particularly transport will be the key drivers of electricity demand growth.
Modelling results for the three scenarios shows that Lithuania will be able to meet its key targets as
presented in the NENS:
- 2030 targets of 70% domestic power generation share with 45% renewable sources is met with
a significant margin.

Page 8 of 138
DNV GL - Scenario Building for the Evolution of Lithuanian Power Sector for 2020-2050 litgrid test
- In terms of energy independence by 2050, available generation capacity is sufficient to meet
electricity demand, but results show that there will still be some net import in all three scenarios
as this is the most cost-efficient solution.
- The NENS aims at 18 TWh renewable generation in 2050 and 100% of Lithuania’s power
consumption to be supplied by renewable sources. All three scenarios fulfil the first target, but as
we have kept two natural gas plants that are expected to operate leading up to 2050 the share
of power consumption supplied by renewable sources is slightly below 100%. In general, this
means that key Lithuanian targets under the NENS are mostly met or can be met by phasing out
the natural gas fired power generation sooner than what is incorporated in our scenarios.
Achieving these results will however be contingent on the Lithuanian power system and market
adapting efficiently to the new reality that comes with an incrementally growing power supply
from intermittent renewable energy resources – namely wind and solar.
Analyses on system adequacy and the need for flexibility resources such as batteries, electric vehicle
vehicle-to-grid, demand side flexibility, interconnection capacity and power to gas were undertaken with
a main focus on the National Trends scenario. In order to illustrate the effect of different technologies on
the power system balance, three levels of flexibility were introduced;
- Low Flex: Only existing forms of flexibility such as power plant response (including pumped
hydro storage) and interconnectivity are taken into account.
- Medium Flex: Stationary batteries, electric vehicle V2G, increased interconnectivity and
demand side flexibility are integrated to absorb supply peaks and plug supply deficits.
- High Flex: The same flexibility solution as the medium flex case, in addition to power-to-x,
which here is assumed to be power-to-hydrogen - P2G
The Low Flex case clearly highlights that without any more flexibility in the power system than is
present today, there will be substantial adequacy challenges starting around 2040 as the renewables
power supply increases. These challenges will be evident both for long periods of energy deficit and
energy surplus, manifesting in protracted periods of very high prices in the former and protracted
periods of zero prices and generation curtailment in the latter. However, with the introduction of
flexibility resources from batteries, electric vehicles, demand side and interconnection capacity presented
in the Medium Flex scenario, system adequacy will not be a significant challenge to system stability
and operation in any of the three scenarios for the evolution of the Lithuanian power system towards
2050.
That said, the Medium Flex case results also showed that battery systems, demand side flexibility and
increased interconnection capacity will not be sufficient to appropriately deal with all the power surplus
in the system towards 2050. In fact, continued protracted periods of low electricity prices showcased a
steady decline in wind power capture prices for electricity as the supply grew. As such, achieving the
renewables capacity growth envisioned by the NENS would thus either require more flexible power
demand, or an increasing volume of power generation subsidies, in order to ensure the profitability of
new wind power facilities.
Our results indicate that the most favourable approach will be to deploy power-to-gas to absorb power
generation surpluses – by extension bolstering wind power capture prices, which is done in our High
Flex case. P2G will according to our results play an important part in improving the business case for
wind power, mainly after 2040 as the share of renewables increases and the wind power capture price
decreases. Our analysis of P2G and wind power business cases in chapter 8 further indicate that
Page 9 of 138
DNV GL - Scenario Building for the Evolution of Lithuanian Power Sector for 2020-2050 litgrid test
subsidising P2G in order to support the electricity price could have a lower subsidy burden vis-à-vis
subsidising wind to address low capture prices. This is based on assumptions that the hydrogen will be
used to blend with natural gas in the existing gas grid. Our analysis also highlights that an aim should be
to stimulate demand for hydrogen at higher prices, i.e. as a fuel for transport, in order to improve the
business case for P2G and reduce the overall need for subsidies.
In order to meet the targets envisioned under the NENS, and address the flexibility challenges in an
appropriate manner, a roadmap to 2050 must balance capacity growth with flexibility capacity
deployment. We argue that such a roadmap can be divided into three time periods, namely:
• De-synchronisation from IPS/UPS – up to 2025: The key focus over this period is to
execute plans already in place in the period up the synchronisation with Continental Europe by
the end of 2025. This includes implementing renewables capacity auctions to facilitate onshore
wind growth, phasing out inefficient gas-fired capacity and integrating into the European
balancing market. Beyond this, our results indicate limited need to the flexibility resources
introduced in the Medium and High Flex cases.
• Delivering on the NECP – up to 2030: The key focus leading up to 2030 will be to facilitate
the implementation of Lithuania’s first offshore wind project. This will build on the regulatory
framework and tender mechanism having been put in place in a timely manner, with the tender
date currently being scheduled for February 2023 with project commissioning factored in for
2029. While there is limited need for flexibility resources, V2G should emerge in line with EV
fleet penetration, while P2G pilots should be envisioned to build competence and tap into EU
hydrogen funding for the period leading up to 2030.
• Delivering on the NENS – up to 2050: In order to deliver on the target to generate 18TWh
from renewable energy, and increase the renewables share in power generation to 100%, a
substantial amount of renewable energy capacity will be developed between 2030 and 2050.
Given that the challenges of renewables generation oversupply will emerge over this period, a
substantial uptick in flexibility resources will be a key focus over this timeframe. Notably,
towards 2040 and 2050 in particular, P2G resources will be required to support wind power
capture prices and thus reduce the overall subsidy burden of the Lithuanian energy transition.
This focus should in turn be accompanied with a focus on stimulating hydrogen demand in
sectors that can increase the hydrogen offtake price, by extension reducing the need subsidies to
facilitate an economically viable P2G business case.

Page 10 of 138
DNV GL - Scenario Building for the Evolution of Lithuanian Power Sector for 2020-2050 litgrid test
2 INTRODUCTION
In June 2018, the Lithuanian Parliament approved the National Energy Independence Strategy
(Nacionaline Energetines Nepriklausomybes Strategija – referred to as NENS). The NENS puts in place a
strategic vision and roadmap for the evolution of the Lithuanian energy sector leading up to 2050. The
strategy reflects the key focus areas for Lithuanian energy policy – namely to achieve energy
independence, energy security and deep decarbonisation at an affordable cost.
In particular, the focus on energy independence is a guiding principle for Lithuanian policymakers. The
most imminent objective under the NENS is therefore to achieve the de-synchronisation the Russian-
controlled IPS/UPS power system and synchronisation with the continental European system in the end
of 2025. This will reduce Lithuania’s reliance on Russia for its energy, and instead unlock the market’s
integration into a rapidly decarbonising European power system. Concurrently, Lithuania is set to embark
on an ambitious decarbonisation drive for its energy market – and power sector in particular – driven by
increasingly ambitious domestic, EU and international policy with regards to climate change mitigation.
Against this backdrop, this report will identify various paths Lithuania can follow to meet its targets for
energy security, decarbonisation and affordability in its power sector. More specifically, we will assess
how various intermittent renewable energy sources can be integrated into the Lithuanian power
generation mix leading up to 2050 in order to meet NENS targets, their impact on power system
adequacy in the context of European synchronisation and the role of flexibility in facilitating favourable
outcomes. The key takeaways from these discussions will feed into an assessment of, and suggestion for,
technical, legal and economic measures that should be considered in the context of the Lithuanian
energy strategy to build on strengths and mitigate weaknesses identified in our analysis. The result will
be actionable insights for Lithuanian stakeholders that can support the development of long-term power
sector strategy in the market.
In order to set the stage for this discussions, chapter three will set the stage for discussion by outlining
key development trends in the global power sector and EU energy policy – providing the context for an
in-depth discussion on Lithuanian strategy. Our global level discussion will first showcase how global
decarbonisation will be enabled by an accelerating deployment of variable renewable energy capacity
and phase-out of conventional generation, and how this is facilitated by rising power system flexibility.
At the EU level, we will highlight how ambitious policy is set to speed up the transition we are observing
at the global level, which in turn will feeds into our discussion on Lithuanian energy strategy. Against this
backdrop, we will go into the specifics of the Lithuanian NENS strategy and define the objectives it sets
for the Lithuanian power market over the coming three decades.
These objectives, and the key takeaways from our technology discussion in chapter three, will be the
primary guide informing our power capacity scenario modelling for Lithuania in chapter four. In line
with the incremental transition from conventional power generation to intermittent renewable energy, we
will identify three scenarios for power capacity development that enables Lithuania to meet its targets
for energy independence and decarbonisation. These scenarios will outline different compositions of
variable renewable energy capacity with varying degrees of reliance on centralised and decentralised
renewable energy. Our scenarios are informed by targets outlined in the NENS and the Lithuanian
National Energy and Climate Plan (NECP), scenarios developed by the ENTSO-E for Lithuania in its
TYNDP report, DNV GL’s own Energy Transition Outlook for 2050 and interactions with relevant
Lithuanian stakeholders. The aim of these scenarios is to provide various viable development paths for

Page 11 of 138
DNV GL - Scenario Building for the Evolution of Lithuanian Power Sector for 2020-2050 litgrid test
Lithuanian policy makers in the context of already implemented strategy, regional policy and global
technology trends.
The annual power generation from the three identified capacity development scenarios will then be
simulated in our European Power Market Model in chapter five. This simulation will assess to what
extent the three scenarios can meet the 2030 and 2050 targets envisioned under the NENS, and how
relying, to different degrees, on various power generation resources impacts the evolution of the
Lithuanian power generation mix.
In chapter six, we will delve into a discussion on the various power system flexibility resources that will
be available to Lithuania over the coming decades, and how these can solve issues associated with
having a power generation mix increasingly reliant on intermittent renewable energy. This chapter will
thus set the stage for a deeper discussion on the role of flexibility in Lithuania over the coming three
decades leading up to 2050.
Chapter seven will build on the key takeaways from chapter six and go in-depth on the impact of
flexibility in Lithuania under our national trends power generation scenario for the market. We will
identify three flexibility cases, assessing the impact of introducing low, medium or high levels of
flexibility on hourly supply/demand dynamics, electricity prices and power generation capture prices.
These results will enable the identification of a most favourable composition of flexibility resources for
Lithuanian consumers and generators, which in turn should shape power sector policy. This will be
followed by a discussion on Lithuanian system adequacy.
Chapter eight will, as such, build on the results and key takeaways from chapter seven and seven to
enable us to formulate recommendations for actions and measures to achieve the targets as envisioned
by Lithuanian strategy, and mitigate the challenges identified through our modelling. We will undertake
such analysis by assessing various business cases for renewable power generation and flexibility, how
they interact and how they can mutually reinforce each other.
Chapter nine will then incorporate the key takeaways from the report and put these in the context of a
roadmap to 2050 that provide a pathway to achieving targets. A roadmap will take into account what is
required to move towards achieving the NENS target of having 18TWh of renewables generation in the
market by 2050, both in terms outlining power generating capacity and flexibility capacity growth by
technology. This chapter will also assess the challenges to achieving such growth and how such
challenges can be addressed.
Finally, a summary of the main findings and conclusions is presented in chapter ten.

Page 12 of 138
DNV GL - Scenario Building for the Evolution of Lithuanian Power Sector for 2020-2050 litgrid test
3 THE ENERGY POLICIES SHAPING OUR FUTURE
3.1 Introduction
The momentum of the global energy transition is picking up. In line with steadily increasing aspirations
globally for limiting global climate change and weaning the world off fossil fuels, policymakers and
businesses find themselves amid a profound shift in the way energy is produced and consumed. This will
present new challenges, as well as opportunities, and markets that are willing to adapt politically,
economically and technologically will be best able to capitalise on the transition to a decarbonised energy
market. Against this backdrop, Lithuania finds itself in the process of strategizing its own decarbonisation
agenda under the auspices of EU policy frameworks and global climate pledges. This chapter of the
report will tie together how the global energy transition, EU energy policy and Lithuanian strategic
energy goals align – setting the stage for a deep-dive into prospective Lithuanian development scenarios
in the following chapters.
3.2 Clean Electricity To Drive Increasing Global Decarbonisation Momentum
Progressing towards mid-century climate goals will require a cross-sector decarbonisation that facilitates
a decline in fossil fuels consumption. Decoupling energy demand growth from economic growth will be
key to this, feeding into DNV GL’s expectation that final energy demand will peak in 2034, as will the
electrification of traditionally fossil-fuel reliant activities. The gradual decarbonisation of the power supply
will add to the electrification push for traditionally fossil-fuel reliant sectors such as transport and heating,
highlighting the growing importance of clean electricity to reducing emissions from the energy sector as
a whole. DNV GL forecasts the electricity share in the final energy use globally will increase from 19% in
2018 to 41% in 2050 (DNV GL, 2020).
In line with the demand slump triggered by COVID-19, DNV GL forecast that global energy demand will
contract by 8% in 2020, clearly visible in Figure 1. Energy demand growth is expected to pick up again
from 2021 until reaching the 2034 peak, but nonetheless remain below our pre-pandemic forecasts
leading up to 2050.

Page 13 of 138
DNV GL - Scenario Building for the Evolution of Lithuanian Power Sector for 2020-2050 litgrid test
Figure 1: World Final Energy Demand By Carrier
Source: (DNV GL, 2020)
Facilitating the continued transition to cleaner sources of power supply will become a determining factor
for making progress towards climate policy goals. This transition will require the continued move away
from centralised sources of conventional baseload power generation towards more decentralised variable
renewable energy resources (vRES). While this shift has largely been driven by progressive energy policy
and subsidy support to date, rapidly falling technology costs for cleaner sources of power generation will
enable the acceleration of market-driven decarbonisation leading up to 2050.
As vRES technology moves towards grid parity in several markets, it coincides with an increasing sense
of urgency in global climate policy. Policymakers are becoming more cognisant of the requirement for a
big push towards clean energy to deliver on their Paris pledges, translating into more ambitious policy.
At the same time, this type of policy has become more economically attractive by cost-competitive
renewable energy, reinforcing this trend. Against this backdrop, DNV GL forecasts vRES sources to
steadily grow its share in the global electricity supply over the coming decades, totalling 62% of the
global electricity supply by 2050. In 2018, only 26% of the power supply was from renewable sources, of
which only about 1/3 was vRES (DNV GL, 2020).
Page 14 of 138
DNV GL - Scenario Building for the Evolution of Lithuanian Power Sector for 2020-2050 litgrid test
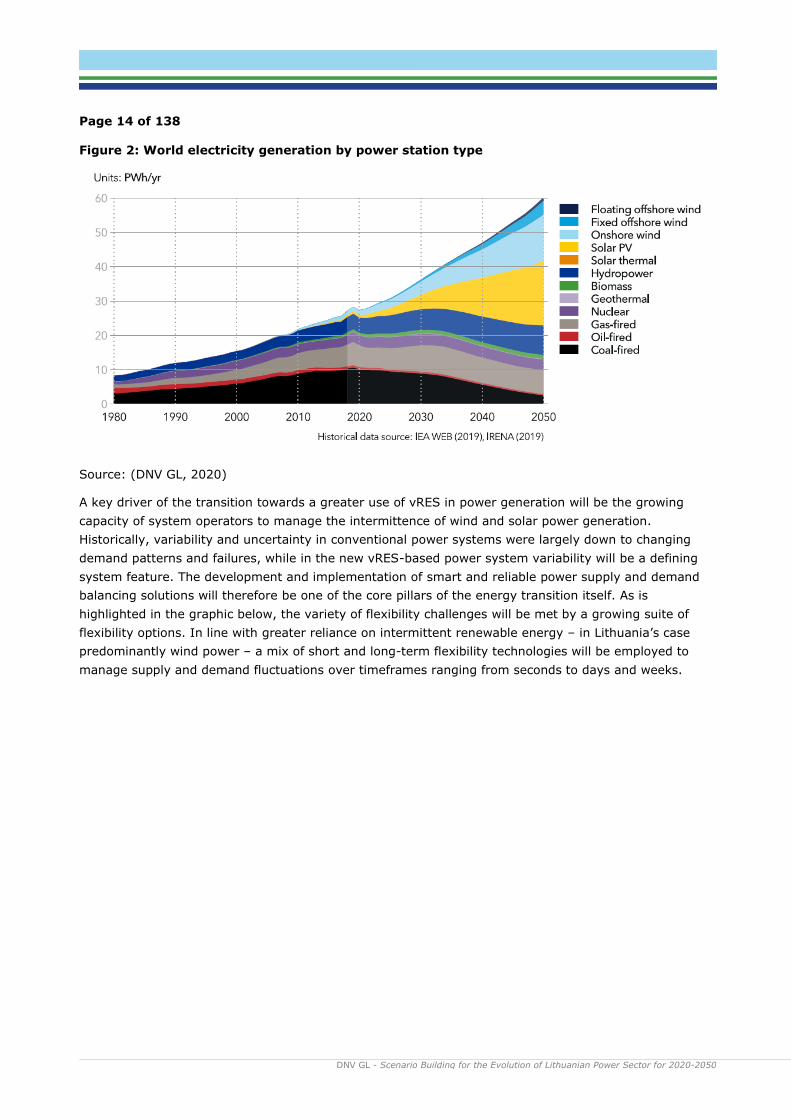
Figure 2: World electricity generation by power station type
Source: (DNV GL, 2020)
A key driver of the transition towards a greater use of vRES in power generation will be the growing
capacity of system operators to manage the intermittence of wind and solar power generation.
Historically, variability and uncertainty in conventional power systems were largely down to changing
demand patterns and failures, while in the new vRES-based power system variability will be a defining
system feature. The development and implementation of smart and reliable power supply and demand
balancing solutions will therefore be one of the core pillars of the energy transition itself. As is
highlighted in the graphic below, the variety of flexibility challenges will be met by a growing suite of
flexibility options. In line with greater reliance on intermittent renewable energy – in Lithuania’s case
predominantly wind power – a mix of short and long-term flexibility technologies will be employed to
manage supply and demand fluctuations over timeframes ranging from seconds to days and weeks.

Page 15 of 138
DNV GL - Scenario Building for the Evolution of Lithuanian Power Sector for 2020-2050 litgrid test
Figure 3: Flexibility issues by timescale
Source: (DNV GL, 2020)
The utilisation of flexibility solutions will take multiple forms depending on the market in question, its
power generation resources and its interconnectedness to other power systems. Their application will
increasingly be based on smart technology that ensures seamless coordination between generation,
consumption and flexibility assets, highlighting the importance of continued power system digitalisation.
Against this backdrop, conventional solutions such as dispatchable baseload power plants will continue to
play a role in stepping in when vRES is not available, but we expect this role to become increasingly
marginal as the capacity to manage vRES variability through alternative means improves.
Continued cost reductions for battery storage both at the distributed and utility-scale level, coupled with
the rapid increase in storage availability from the burgeoning global electric vehicle fleet, will enable the
shift of power supplies from periods of surplus generation to peak demand. Consumers will also be able
to sell flexibility through demand-response solutions, enabling improved balancing between supply and
demand and therefore facilitating higher utilisation of vRES power. At the same time, rising
interconnectivity between sub-national, national and regional power markets will play a key role in
ensuring the most efficient allocation of clean power supplies over both short and long timeframes.
Finally, we also highlight that the eventual emergence of ‘power-to-gas’ will, on the other hand, play a
key role in balancing longer-term supply variability. In conjunction, these resources will help facilitate
the transition towards an increasingly vRES-based power system.

Page 16 of 138
DNV GL - Scenario Building for the Evolution of Lithuanian Power Sector for 2020-2050 litgrid test
Figure 4: World utility-scale storage capacity
Source: (DNV GL, 2020)
3.3 EU To Spearhead Global Decarbonisation Efforts
Against the global backdrop of rising decarbonisation aspirations and a push towards renewable energy,
the European Union is taking a lead role in developing policy frameworks that can best facilitate such a
shift. The EU has long been a global frontrunner in formulating progressive policy frameworks that
facilitate the transition to cleaner sources of energy, informed by the large number of strategic long-term
targets Brussels pursue. These include reducing greenhouse gas emissions, boosting energy security,
maximising value creation and ensuring energy affordability – aims encapsulated in the Juncker
Commission’s (2014-2019) Energy Union Strategy (EU Commission, 2015).
3.3.1 Clean Energy For All Europeans Package
The adoption of the ‘Clean energy for all Europeans’ package – completed in 2019 – marked a significant
next step in moving the EU towards transitioning away from fossil fuels and delivering on Paris
Agreement (2016) GHG reduction pledges (European Commission, 2019). The package seeks to
accelerate the clean energy transition by focusing on energy efficiency, greater usage of renewable
energy, enabling ‘prosumers’ and equipping the electricity market to deal with a more intermittent power
generation mix. Key updated 2030 targets that are binding for the 27 EU member states include:
• Reducing CO₂ emissions by at least 40% compared to 1990-levels
• Reaching a renewable energy share in final energy consumption of 32% - the updated
Renewable Energy Directive (2018/2001/EU) came into force in December 2018. The previous
target was 27%.
• Improving energy efficiency by 32,5% relative to a business-as-usual scenario - the updated
Directive on Energy Efficiency ((EU) 2018/844) came into force in December 2018. The former
target was 27%.
Given that these targets are fixed at the EU level, the clean energy package also established that EU
members can determine how to progress towards such targets via their own plans, measures and
targets. Implicit in this is that member states draft National Energy and Climate Plans (NECPs) that will
be evaluated by the EU commission to monitor EU’s overall progress towards 2030 targets and

Page 17 of 138
DNV GL - Scenario Building for the Evolution of Lithuanian Power Sector for 2020-2050 litgrid test
eventually 2050 aspirations. The final plans, covering the period 2021-2030, were submitted before end-
2019 with additional progress reports being due biannually.
3.3.2 Green Deal Highlights Strengthened Policy Action
As is evident in the clean energy package, EU climate and energy policy rhetoric has become increasingly
progressive in tandem with the greater sense of urgency in global climate policy following the Paris
agreement. The proposed European Green Deal, announced in December 2019 and advocated by the
new EU commission under Ursula von der Leyen, is the latest most ambitious iteration of this rhetoric.
The Green Deal takes aim at formulating a binding long-term policy roadmap that ensures regional
climate neutrality by 2050 – a component of which is a CO₂ emissions reduction target of 50-55% by
2030 compared to 1990-levels (European Commission, 2019). To this end, the Commission proposed the
European Climate Law, which upon adoption would enshrine carbon neutrality to EU law. This aim also
builds on the previous Juncker Commission’s ‘Clean Planet for all’ vision from November 2018, which
sought to keep the global warming increase to 2 degrees and to pursue efforts to keep it at 1.5 degrees,
in accordance with the Paris agreement.
As the most comprehensive approach to tackling climate change to date, the Green Deal aims to balance
its key objectives of carbon neutrality and economic growth decoupled from resource use. This implies
transitioning to a circular economy, with the underlying intention to leave no person or place behind. The
latter objective is set to be supported by the ‘Just Transition Mechanism’, which seeks to mobilise at
least EUR100bn over the period of 2021-2027 for the most negatively affected regions. Highlighting the
growing consensus for carbon neutrality within the EU, we note that all the members of the European
Council – with the exception of Poland – endorsed climate neutrality in December 2019 (BBC, 2019).
Poland’s opposition, however, reflects that carbon neutrality will require wholesale changes in markets
that currently rely heavily on fossil-fuels – in Poland’s case coal. Furthermore, we note that Hungary and
Czech Republic only endorsed the target after being assured that nuclear power could be included in the
final energy mix.
Figure 5: Overview Over Green Deal Aims

Page 18 of 138
DNV GL - Scenario Building for the Evolution of Lithuanian Power Sector for 2020-2050 litgrid test
Source: (European Commission, 2019)
While there are bastions of conventional power generation left in Europe, notably the aforementioned
Visegrad countries1, the policy direction of travel in the EU is strongly towards renewable energy and
away from fossil fuels. There are also in place several key initiatives that will continue playing a role in
pushing this transition:
• The European Emissions Trading Scheme (ETS) is the largest of its kind in the world and has
increased operational costs for emitters covered by the mechanism, accelerating the phase-out
of inefficient polluting facilities. Sectors covered under the ETS are regulated at the EU level and
the mechanism aims to reduce emissions from ETS-covered sectors by 43% from 2005 levels by
2030. The mechanism will be further strengthened under its phase IV to (2021-2030) to meet
this target (European Commission, n.d.).
• Non-ETS Sectors make up nearly 60% of total domestic GHG emissions in the EU and include
sectors such as transport, buildings, agriculture and industry & waste (non-ETS). Sectors not
covered by the ETS must reduce emissions by 30% by 2030 compared to 2005. That said, the
Effort Sharing Regulation translates this overall target into specific member-state targets “based
on the principles of fairness, cost-effectiveness and environmental integrity” (European
Commission, n.d.). In Lithuania’s case, the non-ETS reduction target is set at 9%.
• National Long-Term Strategies are also required under the EU governance regulation and
must have a perspective of at least 30 years, in order to enable EU to achieve goals set under
the Paris agreement. They are also meant to be consistent with the NECPs and are due every ten
years, with the first iteration having been due January 1 2020.
As the contents of the European Green Deal and accompanying carbon neutrality aspirations become
more enshrined in EU policy and law, EU member states will be subject to near and long-term targets.
On the one hand, this will create challenges for the markets that face substantial shifts in their energy
markets due to the energy transition. On the other hand, the overarching focus on ‘leave no one behind’
will also set the stage for transformational change in the markets that are ready to embrace the
opportunities the transition will offer.
3.4 Lithuania: Energy Independence And Decarbonisation To
Drive Transition
As the EU intensifies efforts to accelerate its transition towards a carbon neutral economy by 2050, it
coincides with Lithuania strategizing how to achieve its objectives of energy independence, security,
affordability and decarbonisation. Over the last decades Lithuania has been reliant on Russia for its
energy, both as a part of the Integrated/Unified Power System (IPS/UPS) of Russia and Belarus as well
as a net importer of fossil fuels for power generation. By integrating into the European system and
diversifying the energy supply, both in terms of power system synchronisation and greater renewables
utilisation, Lithuania can progress towards its energy objectives through EU energy policy alignment.
1 The Visegrad countries are Poland, Czech Republic, Slovakia, Hungary
Page 19 of 138
DNV GL - Scenario Building for the Evolution of Lithuanian Power Sector for 2020-2050 litgrid test
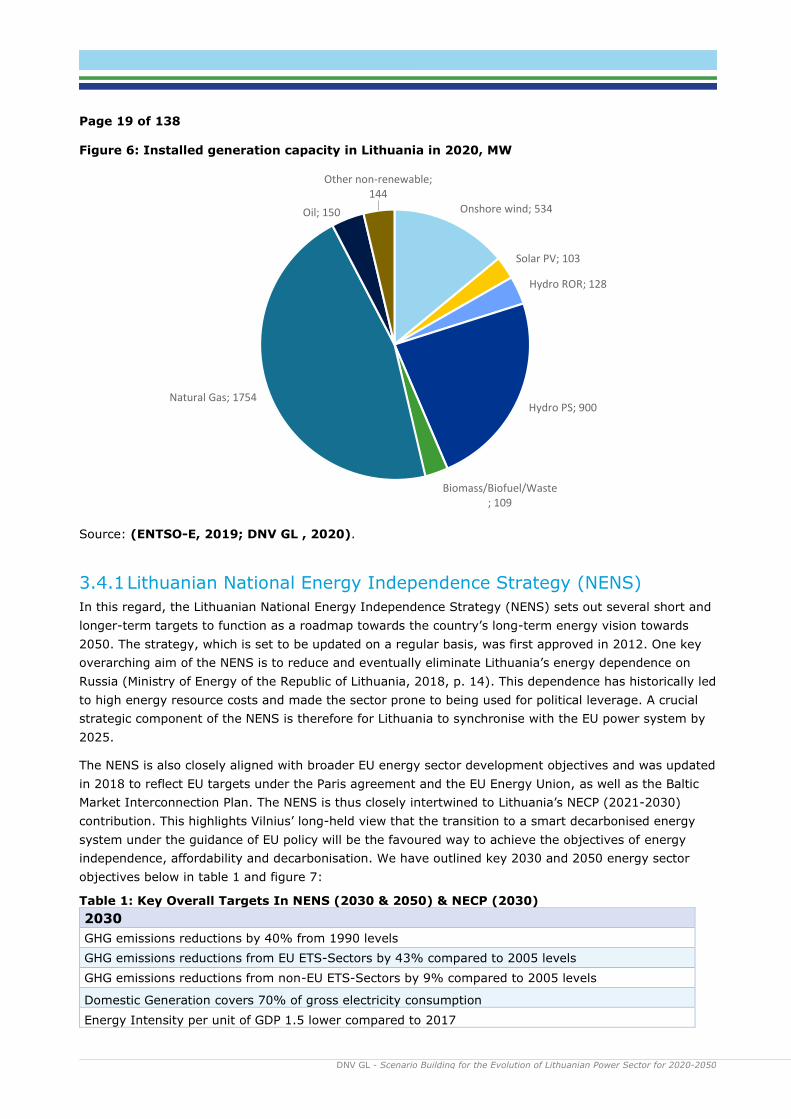
Figure 6: Installed generation capacity in Lithuania in 2020, MW
Source: (ENTSO-E, 2019; DNV GL , 2020).
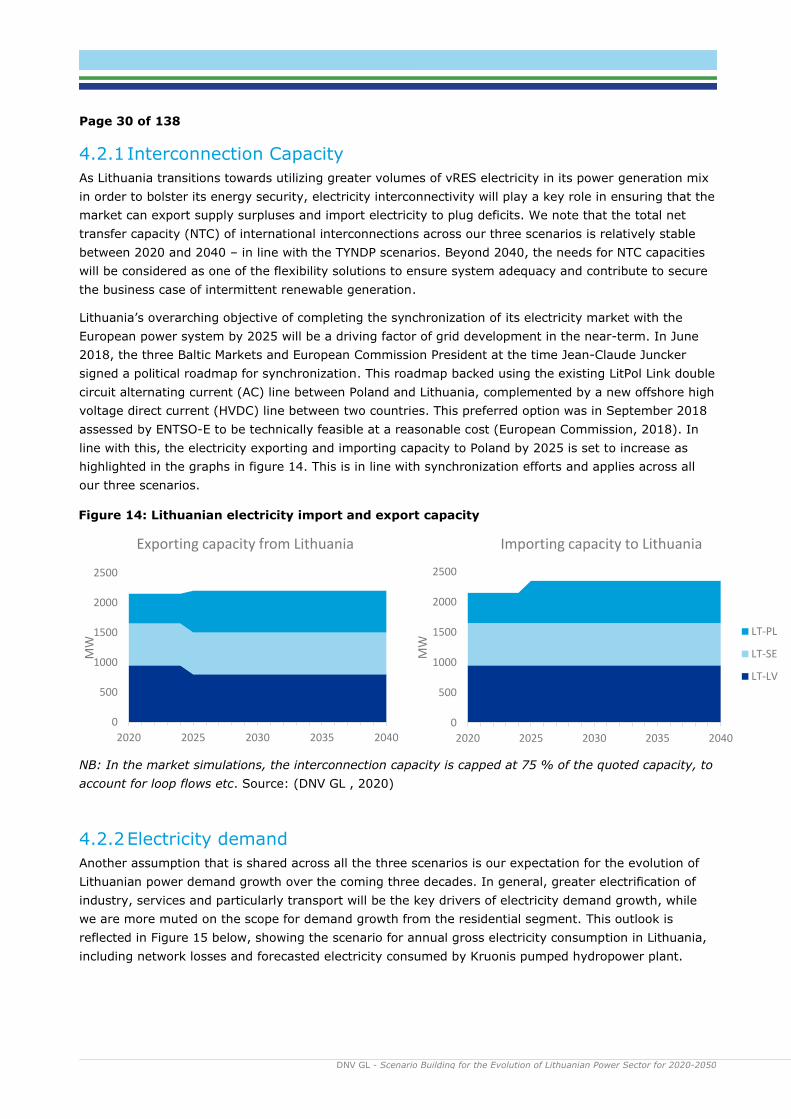
3.4.1 Lithuanian National Energy Independence Strategy (NENS)
In this regard, the Lithuanian National Energy Independence Strategy (NENS) sets out several short and
longer-term targets to function as a roadmap towards the country’s long-term energy vision towards
2050. The strategy, which is set to be updated on a regular basis, was first approved in 2012. One key
overarching aim of the NENS is to reduce and eventually eliminate Lithuania’s energy dependence on
Russia (Ministry of Energy of the Republic of Lithuania, 2018, p. 14). This dependence has historically led
to high energy resource costs and made the sector prone to being used for political leverage. A crucial
strategic component of the NENS is therefore for Lithuania to synchronise with the EU power system by
2025.
The NENS is also closely aligned with broader EU energy sector development objectives and was updated
in 2018 to reflect EU targets under the Paris agreement and the EU Energy Union, as well as the Baltic
Market Interconnection Plan. The NENS is thus closely intertwined to Lithuania’s NECP (2021-2030)
contribution. This highlights Vilnius’ long-held view that the transition to a smart decarbonised energy
system under the guidance of EU policy will be the favoured way to achieve the objectives of energy
independence, affordability and decarbonisation. We have outlined key 2030 and 2050 energy sector
objectives below in table 1 and figure 7:
Table 1: Key Overall Targets In NENS (2030 & 2050) & NECP (2030)
2030
GHG emissions reductions by 40% from 1990 levels
GHG emissions reductions from EU ETS-Sectors by 43% compared to 2005 levels
GHG emissions reductions from non-EU ETS-Sectors by 9% compared to 2005 levels
Domestic Generation covers 70% of gross electricity consumption
Energy Intensity per unit of GDP 1.5 lower compared to 2017
Onshore wind; 534
Solar PV; 103
Hydro ROR; 128
Hydro PS; 900
Biomass/Biofuel/Waste; 109
Natural Gas; 1754
Oil; 150
Other non-renewable; 144

Page 20 of 138
DNV GL - Scenario Building for the Evolution of Lithuanian Power Sector for 2020-2050 litgrid test
Renewable Energy makes up 45% of final energy consumption
Renewable Energy makes up 45% of electricity consumption
Interconnectivity Level of 15% of total power generating capacity
Renewable Energy makes up 90% of district heating supply
Renewable Energy makes up a 15% of energy consumed in the transport sector
2050
Renewable Energy makes up 100% of electricity consumption
To enable EU-wide GHG emissions reductions by 80-95% from 1990 levels
The energy sector will produce 80% of energy from non-polluting sources
GHG emissions from energy and transport reduced by more than 95% by 2050 compared to 1990
Domestic Generation covers 100% of gross electricity consumption
Energy Intensity per unit of GDP 2.4 lower compared to 2017
Renewable Energy makes up 100% of district heating supply
Renewable Energy makes up 50% of energy consumed in the transport sector
Source: (Ministry of Energy of the Republic of Lithuania, 2019, pp. 11-12; Ministry of Energy of the
Republic of Lithuania, 2018, p. 10)
Figure 7: Strategic Aims Under NENS
Source: (Ministry of Energy of the Republic of Lithuania, 2018, p. 9)
Lithuania’s long-term energy and power sector expansion targets highlights a strong strategic direction
towards generating renewable energy domestically as a way to ensure energy independence over the
longer term. According to the Litgrid (Litgrid, 2020) the country consumed a total of 13.0 TWh of
electricity over 2019 (11.1 TWh without grid losses and hydro pump load) but only generated about
3.6TWh domestically, as is illustrated in Figure 8. This implies that domestic generation sources only
made up around 30% of total power consumption over the year. This share is envisioned to increase to
70% 2030 according to the NENS and to 100% by 2050.
2020:
Energy-Secure State
2030:
Competitive Energy
2050:
Energy Sustainability And Independence

Page 21 of 138
DNV GL - Scenario Building for the Evolution of Lithuanian Power Sector for 2020-2050 litgrid test
Figure 8: Power Consumption, Generation and Net Imports over 2019
Source: (Litgrid, 2020)
While Lithuania generates relatively limited volumes of electricity domestically, the country already
sources a majority domestically generated power from renewable forms of power generation. The market
had, as of end-2019, a total of 534MW of wind power generating capacity installed. This led to the wind
sector having made up 40% of total power generation over 2019, as reflected in figure 9 below. The
hydropower and biofuels segments, on the other hand, made up 27% and 12% of power generation
respectively, compared to the 11% share generated by natural gas specifically. This means that the
composition of Lithuania’s power generation mix is already aligned with NENS 2030 targets to source
more than 45% of power generation from renewable energy.
Figure 9: Power generation over 2019 by technology % share of total
Source: (ENTSO-E, 2019)
Biomass12 %
Fossil Gas11 %
Hydro Pumped Storage17 %
Hydro Run-of-river and poundage
10 %Other
4 %
Solar2 %
Waste4 %
Wind Onshore40 %

Page 22 of 138
DNV GL - Scenario Building for the Evolution of Lithuanian Power Sector for 2020-2050 litgrid test
3.4.2 Key Strategic Components of the NENS
Against this backdrop of relatively limited but largely renewable domestic power generation supply, we
will further delve into the NENS vision. The vision can be broken down into four key focus areas that
highlights the strategic long-term energy policy imperatives for the Lithuanian government:
• Reliability and security
• Mitigation of environmental impact
• Energy sector competitiveness
• Business participation in advancing energy progress
Each of this is commented on in more details in the following sections.
3.4.2.1 Reliability And Security
Lithuania is currently heavily reliant on imported electricity. The reliability and security energy vision
component has as a precondition synchronisation with continental Europe by 2025, which in turn will
unlock more flexible use of power interconnections with EU member states. However, the NENS also
stresses the importance of developing additional cost-competitive domestic generation capacity pre-
synchronisation. This push is evident in the Lithuanian Ministry of Energy planning to hold technology-
neutral renewable auction annually between 2020 and 2022, awarding 0.7TWh of renewable generation
each. This is in addition to the 0.3TWh awarded to the UAB Windfarm Akmene One onshore wind project
in the auction scheme’s first round in 2019, following the submission of a zero-subsidy bid (Recharge,
2020). Over 2020, the aim is for 35% of gross electricity consumption to come from domestic power
generation sources, a share that will be increased to 70% by 2030 and 100% by 2050 (Ministry of
Energy of the Republic of Lithuania, 2018, p. 6). This highlights Lithuania’s aspirations to substantially
ramp-up domestic power generation over the coming years to strengthen energy security and ensure
reliable energy access.
3.4.2.2 Mitigation of Environmental Impact
Domestic power generation targets will be intertwined with broader power sector decarbonisation
aspirations advocated by EU policy. While renewable energy already comprises a high share of
Lithuanian power generation, continued robust renewables growth is required to maintain this share as
Lithuania ramps up domestic power generation. As such, energy security and reliability ambitions are
intertwined with the aim to develop more renewable energy capacity. By 2030, the NENS and the NECP
aim for renewable energy making up 45% of electricity consumption, totalling at least 7TWh of power
generation (Ministry of Energy of the Republic of Lithuania, 2018, p. 25) In comparison, renewable
electricity generation, including hydropower, made up 3TWh over 2019. By 2050, the renewables share
will increase to 100% with generation totalling at least 18TWh.
The bulk of near-term generation growth will come from the wind power sector – as is illustrated in
figure 10 – as the sector is envisioned to comprise at least 53% of total renewables generation by 2030.
Growth will also be aided by the solar segment, which will comprise an equivalent 22% share by that
year. This dynamic will be supported by the incremental introduction of ‘prosumers’ in the market. The
longer-term composition of the power generation mix and how Lithuania could meet its aim of
generating at least 18TWh from renewables will be discussed in market evolution scenarios in the next
chapter of this report. In summary, Lithuania’s power generation mix will become increasingly based on

Page 23 of 138
DNV GL - Scenario Building for the Evolution of Lithuanian Power Sector for 2020-2050 litgrid test
vRES sources. This will in turn translate into a rising need for the deployment of flexibility resources over
the coming decades.
Figure 10: Power generation by renewable energy source under NENS vision, TWh
Source: (Ministry of Energy of the Republic of Lithuania, 2018, pp. 25-26)
Another key aspect of Lithuania’s push to mitigate environmental impact will be to increase energy
efficiency. This will in turn curb energy demand growth in the market over the coming decades. By
targeting efficiency gains across industry and through building renovations, Lithuanian will seek to
ensure that it can progress towards reducing the energy intensity of GDP compared to 2017 by 1.5 times
by 2030 and 2.4 times by 2050. Key to this will be the renovation of multi-apartment and public
buildings – a category for which the target is to save 5-6TWh of energy by 2030 relative to 2018
(Ministry of Energy of the Republic of Lithuania, 2019, p. 15) (Ministry of Energy of the Republic of
Lithuania, 2018, p. 30)
3.4.2.3 Energy Sector Competitiveness
Underlying the push for greater energy security and a lower carbon footprint is Lithuania’s aim increase
the competitiveness of the country’s energy sector. This includes progressing to an advanced and
effective energy market that is closely integrated with the EU. The aim is to align the market with global
decarbonisation trends through the integration of new smart technological solutions – i.e. smart and
remote accounting and control systems. This will be key to integrating the rising vRES supplies and
facilitating the emergence of a strong prosumer segment in the market. A key aim for Lithuania is to
ensure that the final energy price does not exceed the EU average, as this would help to incentivise new
industrial investment through competitive energy costs (Ministry of Energy of the Republic of Lithuania,
2018, p. 5)
0
2
4
6
8
10
12
14
16
18
20
2025 2030 2050
Wind Solar Biofuel Hydro Biogas Not Defined
Page 24 of 138
DNV GL - Scenario Building for the Evolution of Lithuanian Power Sector for 2020-2050 litgrid test
3.4.2.4 Business Participation In Advancing Energy Progress
In order to facilitate the introduction of smart technology in the market, a key component of the NENS is
to strengthen domestic energy technology expertise. This point is tied into Lithuania’s energy security
aspirations under the NENS as it would enable the market to become a net technology exporter, as
opposed to net importer. Estonia, in this case, could serve as an example as the birthplace of
technologies used worldwide including Skype and TransferWise. The development of Lithuanian cyber
security capacity will play a key role in ensuring the integrity of an increasingly connected, digitalised
and smart power system over the coming decades. This will mean that Vilnius will seek to enable
Lithuania’s business environment to play a key role in capitalising on the opportunities associated with
the market’s energy transition with the aim to facilitate longer-term technology export. Such a strategy
would in part enabled by financial incentives from the EU.
In combination, Lithuania’s four NENS focus areas formulate the foundation for the Lithuanian
government’s strategy to strengthen its energy independence through transitioning towards an
increasingly vRES-based power system. Closer integration with the EU, increased digitalisation,
enhanced energy efficiency efforts and greater consumer participation will all be key enablers to
incrementally enabling this transition. Against this background, we will in the next section identify and
assess various scenarios through which Lithuania can meet their targets as envisioned under the NENS
and NECP strategies. This assessment will draw on the core components of Lithuanian aims and
scenarios developed by ENTSO-E.
3.5 From policy to modelling: Key assumptions
The rising deployment of intermittent renewable energy is a key driving factor of global decarbonisation
efforts. This growth is enabled by falling technology costs and increasing political appetite to deliver on
climate reduction targets. Through our Energy Transition Outlook (ETO) model (DNV GL, 2020), we
forecast photovoltaic (PV) solar power and onshore & offshore wind power to be the by far most
important global drivers of power sector expansion over the coming decades. In comparison, fossil-
fuelled power generation will continue its decline. As baseload power generation availability is reduced as
a result, continued advances in power system flexibility solutions can facilitate the increasing use of
vRES generation in the global power generation mix without jeopardising energy security. This will
involve smart energy management and increased interconnection capacity between markets.
At the regional level, the European Union is set to take on a global leadership role in driving the
continued uptake of vRES renewable energy and reducing the use of conventional generation. Through
the Climate Law and the Green Deal, the European Commission is aiming to move the region towards
climate neutrality by 2050. Meeting this aim is dependent on an accelerated transition towards greater
renewable energy use the market. The composition of such growth will likely entail a combination of
local-level distributed generation combined with large-scale centralised sources of power generation at
the regional level. The exact combination of distributed and centralised power generation resources at
the member-state level, however, will rely on a plethora of factors. These include natural resources,
national policy frameworks and the state of the power system. Some markets will favour large-scale
generation due to favourable natural resources for technologies, such as offshore wind, and utilise
international interconnections to export and import electricity. Other markets may instead focus on
deploying solar capacity at a distributed level in order to tap into favourable solar irradiation profiles and
reduce the need for grid investment.

Page 25 of 138
DNV GL - Scenario Building for the Evolution of Lithuanian Power Sector for 2020-2050 litgrid test
3.6 Developing three scenarios for power generation
Against this backdrop, we will seek to model and assess the various potential development
trajectories of the Lithuanian power market in this context. This will include outlining the various
ways the country can meet its near and long-term aspirations under the NENS and align with EU targets.
In order to highlight the different impacts of the various potential development paths Lithuania’s power
system might take, we will assess three main scenarios. These will focus on the evolution of a Lithuanian
power system in which renewable energy power generation resources are differently distributed between
onshore and offshore wind as well as solar power. More importantly, the impact of these various
development trajectories will be assessed in chapters 5, 6, 7 and 8 of this report. This will give
policymakers greater insights into the implications of pursuing different power sector development
strategies.
Forming the key foundation of our scenario analysis will be the three main scenarios outlined by the
European Network of Transmission System Operators (ENTSO-E) in its TYNDP 2020 report. These
scenarios seek to encapsulate key storylines for power sector development in Europe leading up to 2050.
ENTSO-E provides three separate scenarios for Lithuania specifically leading up to 2040, and these will
form the basis of DNV GL’s scenario development and impact assessment in the next chapters. We
highlight the key characteristics of the TYNDP scenario’s below:
• National Trends: The scenario was based on draft NECPs (final NECP versions were submitted
to the EU by end-2019) in combination with the Energy Union and climate action rules, as well as
national policies and climate targets stated by EU member states (ENTSO-E, 2020). As such, this
scenario is to be compliant with the current EU 2030 climate and energy targets and meet the
agreed upon target of reducing CO₂ by 80-95% by 2050. Such compliance will largely be
achieved through a combination of centralized and distributed renewable energy power
generation solutions.
• Global Ambition: The second ‘Global Ambition’ scenario outlined in TYNDP 2020 is envisioned
to ensure compliance with the 1.5° C target under the Paris agreement. This is achieved through
the development of centralized power generation, particularly onshore and offshore wind,
enabled by continued renewable energy technology cost deflation through economies of scale.
This scenario also assumes greater imports of competitively sourced electricity as a means to
decarbonise and ensure efficient utilisation of centralised generation sources.
• Distributed Energy: Just as the Global Ambition scenario, the Distributed Energy scenario also
aims for 1.5° C target compliance. However, instead of centralized generation, this scenario
envisions more of a decentralised approach to power generation. This means that ‘prosumers’
are a key feature of the power system. ‘Prosumers’, in this case, will invest in decentralised
power generation capacity – notably solar power - and actively participate in the energy market.

Page 26 of 138
DNV GL - Scenario Building for the Evolution of Lithuanian Power Sector for 2020-2050 litgrid test
Figure 11: TYNDP Development Scenarios
Source: (ENTSO-E, 2020)
In summary, the three ENTSO-E scenarios will form a backdrop to our in-depth analysis of Lithuanian
power sector development scenarios in chapter 4. We will go into more detail on how these scenarios are
likely to pan out in the Lithuanian context, thus setting the stage for a deep-dive into the results of the
three scenarios in chapters 5 and 7.

Page 27 of 138
DNV GL - Scenario Building for the Evolution of Lithuanian Power Sector for 2020-2050 litgrid test
4 LITHUANIAN ELECTRICITY SCENARIOS
4.1 Introduction
In this section of the report, we will delve into detail on how the various global and EU level energy
market trends, coupled with Lithuanian sector expansion plans, will shape the development of the
Lithuanian power system over the coming three decades leading up to 2050. In order to reflect the
various potential development scenarios for the Lithuanian market, we will outline the key characteristics
of three power generating capacity growth scenarios rooted in those previously outlined by the TYNDP:
(i) National Trends (NT) development trajectory (based on TYNDP National Trends)
(ii) Centralized Energy (CE) development trajectory (based on TYNPD Global Ambition)
(iii) Distributed Energy (DE) development trajectory (based on TYNDP Distributed Energy)
To set the stage for a discussion on these scenarios and their implications for the Lithuanian power
system, this chapter will first outline the core assumptions shared across all three scenarios in section
4.2. These include our expectations for electricity demand growth in Lithuania, electricity interconnection
capacity, our outlook for commodity prices, the characteristics of flexibility resources and a general
discussion on our power generating capacity forecast. This will then feed into a separate discussion on
each power generating capacity scenario. In these discussions we will outline how each will have can
have a different power generating capacity mix will evolve leading up to 2050. The key takeaways on
similarities and differences between each scenario over each decade are highlighted below.
2020-2030: Notably, we highlight that the National Trends scenario is aligned with that of Lithuania’s
NECP, while the Centralized and Distributed Energy scenarios largely follow their respective TYNDP
scenarios. As a result, the National Trends scenario feature more solar capacity than the other two. In
general, there is more visibility with regards to what projects will be implemented when over the coming
decade, and the scenarios therefore feature relatively limited variations. We do highlight that all three
scenarios follow the NECP offshore wind plan towards 2030. As a result, the Centralised and Distributed
energy scenarios have slightly lower onshore wind capacity than what is outlined in their respective
TYNDP scenarios.

Page 28 of 138
DNV GL - Scenario Building for the Evolution of Lithuanian Power Sector for 2020-2050 litgrid test
Figure 12: Installed Capacities By DNV GL Scenario, 2030, GW
Source: (Ministry of Energy of the Republic of Lithuania, 2019; ENTSO-E, 2020; DNV GL , 2020)
2030-2040: Post-2030 we stress that the NENS allows for much more flexibility in the evolution of the
Lithuanian power generating capacity mix, and rather focuses on reaching the targets outlined in chapter
4. At the same time, the NECP time horizon is only until 2030. As such, from 2030 the capacity growth
trajectories under our National Trends, Centralised Energy and Distributed Energy scenarios largely
follow the growth trajectory of their respective National Trends, Global Ambition and Distributed Energy
TYNDP scenarios. However, the CE and DE scenarios are adjusted to meet a target of 1.4 GW installed
offshore wind capacity in 20402. Since this is higher than in the TYNDP scenarios for offshore wind,
onshore wind capacity is reduced to add up to TYNDP’s total expected wind generation. The TYNDP
scenarios end in 2040.
2040-2050: Leading up to 2050, the key objectives under the NENS for power generation is for
Lithuania to generate at least 18TWh of electricity from renewable sources and for 100% of electricity
consumption to be covered by domestic generation. Given that these targets are top-level, our three
scenarios vary more in how they attempt to meet this target after 2040. The national trends scenario
envisions balanced growth between onshore/offshore wind and solar power, the centralised energy
2 Target of 1.4 GW offshore wind in 2040 communicated by Litgrid.
0,7 0,7 0,7 0,7
1,51,8 1,8
1,5
0,5
0,9 0,20,4 0,9
0,1
0,1
0,1
0,10,1
0,1
1,1
1,1
1,11,1
0,9
0,2
0,2
0,20,2
0,1
0,5
0,5
0,50,5
1,8
0,1
0,1
0,10,1
0,1
0,2
0,2
0,20,2
0,2
0
1
2
3
4
5
6
National Trends CentralizedEnergy
DistributedEnergy
NECP 2030 2020
GW
Scenario
Oil
Other non-renewable
Natural Gas
Biomass/Biofuel/Waste
Hydro PS
Hydro ROR
Solar PV
Onshore wind
Offshore wind

Page 29 of 138
DNV GL - Scenario Building for the Evolution of Lithuanian Power Sector for 2020-2050 litgrid test
scenario envisions more offshore and onshore wind, while the decentralised scenario reflects more
robust growth in distributed solar power.
Figure 13: Power Generating Capacity By Technology By Scenario, 2050
Source: (DNV GL , 2020)
Under section 4.3, we will outline and assess the three scenarios in greater detail, to prepare for a
deeper discussion on their impact in a future Lithuanian power market in chapter 5. These analyses will
be structured around first discussing the background of each scenario, what outlook they are showcasing,
and how our scenario is aligned with the NECP and the TYNDP counterpart.
4.2 Cross-scenario assumptions
While we are assessing three distinct power generating capacity scenarios for Lithuania, we highlight
that all the three scenarios are built on a set of key assumptions held in common across all three. This
section of chapter 4 will elaborate more on these assumptions, as they form the foundation for which the
variations in generating capacity across the three scenarios will be built upon.
The cross-scenario assumptions, discussed in more detail in the following sections, comprise:
• Interconnection capacity
• Electricity demand
• Commodity prices
• Power generating capacity
2,0 2,01,6
2,22,6
2,6
1,60,4
3,00,1
0,1
0,1
1,1
1,1
1,1
0,2
0,2
0,2
0,5
0,5
0,5
0,0
1,0
2,0
3,0
4,0
5,0
6,0
7,0
8,0
9,0
10,0
National Trends Centralized Energy Distributed Energy
GW
Scenario
Natural gas
Biomass/Biofuel/Waste
Hydro PS
Hydro ROR
Solar PV
Onshore wind
Offshore wind
Page 30 of 138
DNV GL - Scenario Building for the Evolution of Lithuanian Power Sector for 2020-2050 litgrid test
Figure 14: Lithuanian electricity import and export capacity
0
500
1000
1500
2000
2500
2020 2025 2030 2035 2040
MW
Exporting capacity from Lithuania
4.2.1 Interconnection Capacity
As Lithuania transitions towards utilizing greater volumes of vRES electricity in its power generation mix
in order to bolster its energy security, electricity interconnectivity will play a key role in ensuring that the
market can export supply surpluses and import electricity to plug deficits. We note that the total net
transfer capacity (NTC) of international interconnections across our three scenarios is relatively stable
between 2020 and 2040 – in line with the TYNDP scenarios. Beyond 2040, the needs for NTC capacities
will be considered as one of the flexibility solutions to ensure system adequacy and contribute to secure
the business case of intermittent renewable generation.
Lithuania’s overarching objective of completing the synchronization of its electricity market with the
European power system by 2025 will be a driving factor of grid development in the near-term. In June
2018, the three Baltic Markets and European Commission President at the time Jean-Claude Juncker
signed a political roadmap for synchronization. This roadmap backed using the existing LitPol Link double
circuit alternating current (AC) line between Poland and Lithuania, complemented by a new offshore high
voltage direct current (HVDC) line between two countries. This preferred option was in September 2018
assessed by ENTSO-E to be technically feasible at a reasonable cost (European Commission, 2018). In
line with this, the electricity exporting and importing capacity to Poland by 2025 is set to increase as
highlighted in the graphs in figure 14. This is in line with synchronization efforts and applies across all
our three scenarios.
NB: In the market simulations, the interconnection capacity is capped at 75 % of the quoted capacity, to
account for loop flows etc. Source: (DNV GL , 2020)
4.2.2 Electricity demand
Another assumption that is shared across all the three scenarios is our expectation for the evolution of
Lithuanian power demand growth over the coming three decades. In general, greater electrification of
industry, services and particularly transport will be the key drivers of electricity demand growth, while
we are more muted on the scope for demand growth from the residential segment. This outlook is
reflected in Figure 15 below, showing the scenario for annual gross electricity consumption in Lithuania,
including network losses and forecasted electricity consumed by Kruonis pumped hydropower plant.
0
500
1000
1500
2000
2500
2020 2025 2030 2035 2040
MW
Importing capacity to Lithuania
LT-PL
LT-SE
LT-LV
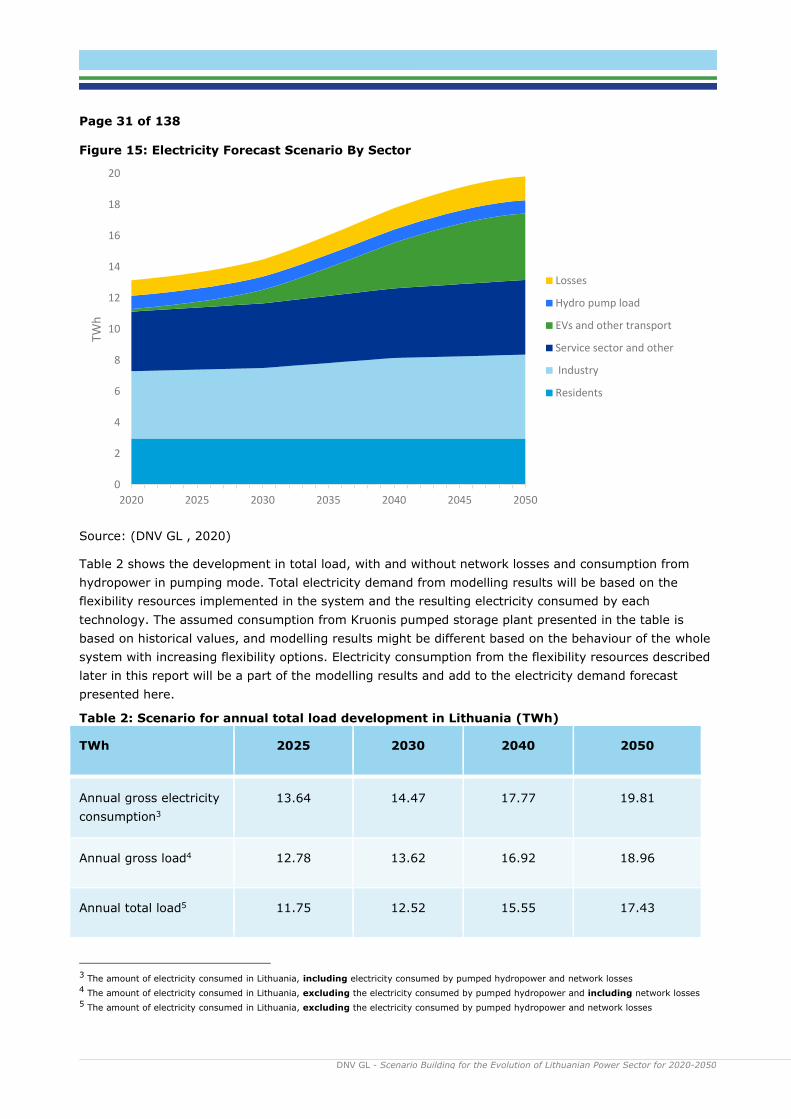
Page 31 of 138
DNV GL - Scenario Building for the Evolution of Lithuanian Power Sector for 2020-2050 litgrid test
Figure 15: Electricity Forecast Scenario By Sector
Source: (DNV GL , 2020)
Table 2 shows the development in total load, with and without network losses and consumption from
hydropower in pumping mode. Total electricity demand from modelling results will be based on the
flexibility resources implemented in the system and the resulting electricity consumed by each
technology. The assumed consumption from Kruonis pumped storage plant presented in the table is
based on historical values, and modelling results might be different based on the behaviour of the whole
system with increasing flexibility options. Electricity consumption from the flexibility resources described
later in this report will be a part of the modelling results and add to the electricity demand forecast
presented here.
Table 2: Scenario for annual total load development in Lithuania (TWh)
TWh 2025 2030 2040 2050
Annual gross electricity
consumption3
13.64 14.47 17.77 19.81
Annual gross load4 12.78 13.62 16.92 18.96
Annual total load5 11.75 12.52 15.55 17.43
3 The amount of electricity consumed in Lithuania, including electricity consumed by pumped hydropower and network losses
4 The amount of electricity consumed in Lithuania, excluding the electricity consumed by pumped hydropower and including network losses
5 The amount of electricity consumed in Lithuania, excluding the electricity consumed by pumped hydropower and network losses
0
2
4
6
8
10
12
14
16
18
20
2020 2025 2030 2035 2040 2045 2050
TWh
Losses
Hydro pump load
EVs and other transport
Service sector and other
Industry
Residents

Page 32 of 138
DNV GL - Scenario Building for the Evolution of Lithuanian Power Sector for 2020-2050 litgrid test
As the electricity demand increases, the peak load is expected to increase. With new demand coming
from electrification the consumption patterns also change, and flexibility solutions become increasingly
important to avoid high demand peaks when electricity generation is low. Hence, peak demand for the
different years is a result of market simulations and is presented in chapter 5.
4.2.2.1 Residential
We forecast electricity demand from Lithuania’s residential sector to remain stagnant over the coming
three decades. This is the result of counterbalancing forces in the form of rising electrification bolstering
demand growth, all the while the downwards pressures of a declining Lithuanian population and rising
energy efficiency efforts equalize each other. We highlight, in this context, that boosting energy
efficiency is a key focus are for the Lithuanian government under the NENS and NECP plans. Both plans
target the intensity of primary and final energy to be 1.5 times lower by 2030 compared to 2018.
The NENS takes this further to 2050, a year by which the energy intensity should have fallen
considerably further to 2.4 times lower than 2018 (Ministry of Energy of the Republic of Lithuania, 2018,
p. 29). This is set to support electrification efforts – notably in the realm of heating. However, the large
push envisioned by the Lithuanian government to promote renovation to boost the energy efficiency of
multi-apartments, coupled with the high energy efficiency of electrification options such as heat pumps,
will curb overall electricity demand growth in the residential sector. We do note that solar growth at the
distributed level is supported through Lithuania’s net metering scheme for capacity up to 500kW which
will help drive capacity uptick at the residential, but also commercial level. This capacity can help reduce
demand from households, as they self-generate more of the power they consume. This distributed solar
PV solar generation is factored into the total solar power generation for Lithuania and thus not factored
into net electricity consumption in the residential segment.
4.2.2.2 Industry
The electricity demand from Lithuania’s industrial sector is expected to increase moderately in the
coming years. Lithuania is steadily ramping up domestic electricity generation from competitive sources
of renewable energy. The resulting lower cost of electricity and decarbonisation pressures boosting
electrification efforts will help stimulate some industry demand growth over the coming decades. This
informs our forecast that a net 1.2TWh of power demand will be added by the industrial sector between
2020 and 2050. A key component of the NENS is to ensure that Lithuanian energy costs do not exceed
the EU average – as they do today. With the deployment of more cost-competitive domestically sourced
electricity, the cost of electricity will be reduced and by extension this will be positive for industrial
electricity demand.
That said, similarly to the residential sector, we expect rising energy efficiency will moderate the demand
growth in the industrial sector. Smarter energy management through more efficient industrial
applications will curb longer-term electricity demand growth in particular. This will be enabled by the
adoption of new technologies and increasing digitalisation. In line with this, we highlight that a focus
area under the Lithuanian NECP is to facilitate a shift of Lithuanian industry away from obsolete
technology and encourage ”energy-and resource-efficient processes and technologies in enterprises”
(Ministry of Energy of the Republic of Lithuania, 2019, p. 68)

Page 33 of 138
DNV GL - Scenario Building for the Evolution of Lithuanian Power Sector for 2020-2050 litgrid test
4.2.2.3 Service sector and other
Similarly to the Industry sector, we expect electricity demand from the services sector, and other related
segments, to register relatively robust net electricity demand growth of 1.1TWh between 2020 and 2050.
This demand outlook is also derived from similar expectations for electrification in the sector and from
economic growth in the market. However, we again stress that energy efficiency will be a hurdle to a
substantial acceleration in demand growth. This is due to reducing the energy intensity of GDP being a
key focus point for the Lithuanian government under both the NENS and NECP strategies.
4.2.2.4 Electric Vehicles and other transport
The electrification of transport – and notably that of road vehicles – will be the main driver of new
electricity demand in Lithuania over the coming decades. We forecast the segment to give an increase of
4.5 TWh from today to 2050. Promoting the use of electric vehicles (EV) and facilitating the build-out of
charging infrastructure is a focus area for Lithuania under the market’s NECP plan. The aim is to ensure
that 10% of annual class M1 purchase transactions (registered and re-registered cars) are electric
vehicles by 2025, and 50% by 2030. Based on estimations informed by the NECP and discussions with
relevant Lithuanian stakeholders, we have formulated a scenario in which about 230,000 cars are to be
electric by 2030. This scenario takes into account that growth in the share of electric vehicles in
Lithuania’s overall car fleet will expand steadily leading up to 2030. Lithuania’s large second-hand car
market will however remain fossil-fuel based in the near-term. The uptake of EVs towards 2030 is
ambitious and requires a large build-out of charging infrastructure. The lack of charging infrastructure
for multi-apartment buildings can be a barrier to EV uptake.
Between 2030 and 2040, the higher share of electric vehicles in annual sales will accelerate the
electrification of the passenger vehicle segment, also aided by EVs trickling into the country’s second-
hand car market. By 2050 it is assumed that all cars are electric. With an assumption that the number of
cars in 2017 will remain constant toward 2050, this would imply a fleet of 1.49mn vehicles in Lithuania
when excluding trucks and motorcycles. Based on our assumptions that each EV will drive on average
14,000km per year and consume about 0.2kWh/km driven, this will give a growth in electricity demand
from electric vehicles from almost zero today to more than 4 TWh in 2050, shown in Figure 16.
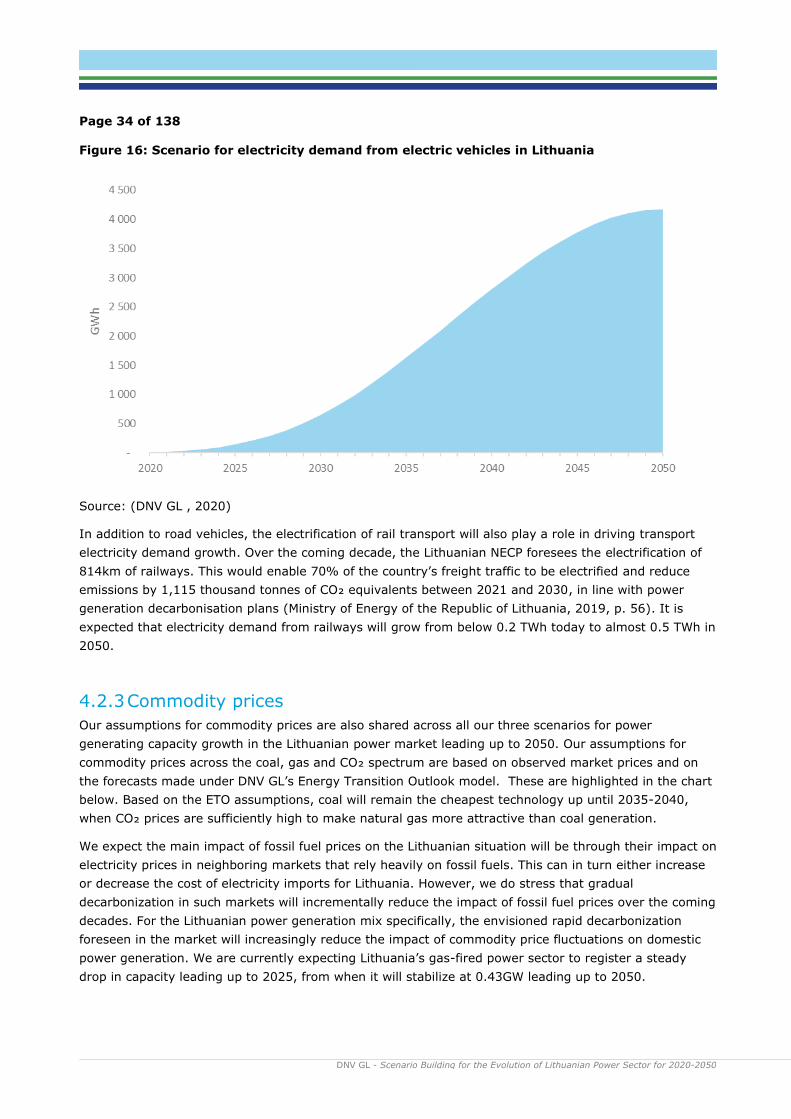
Page 34 of 138
DNV GL - Scenario Building for the Evolution of Lithuanian Power Sector for 2020-2050 litgrid test
Figure 16: Scenario for electricity demand from electric vehicles in Lithuania
Source: (DNV GL , 2020)
In addition to road vehicles, the electrification of rail transport will also play a role in driving transport
electricity demand growth. Over the coming decade, the Lithuanian NECP foresees the electrification of
814km of railways. This would enable 70% of the country’s freight traffic to be electrified and reduce
emissions by 1,115 thousand tonnes of CO₂ equivalents between 2021 and 2030, in line with power
generation decarbonisation plans (Ministry of Energy of the Republic of Lithuania, 2019, p. 56). It is
expected that electricity demand from railways will grow from below 0.2 TWh today to almost 0.5 TWh in
2050.
4.2.3 Commodity prices
Our assumptions for commodity prices are also shared across all our three scenarios for power
generating capacity growth in the Lithuanian power market leading up to 2050. Our assumptions for
commodity prices across the coal, gas and CO₂ spectrum are based on observed market prices and on
the forecasts made under DNV GL’s Energy Transition Outlook model. These are highlighted in the chart
below. Based on the ETO assumptions, coal will remain the cheapest technology up until 2035-2040,
when CO₂ prices are sufficiently high to make natural gas more attractive than coal generation.
We expect the main impact of fossil fuel prices on the Lithuanian situation will be through their impact on
electricity prices in neighboring markets that rely heavily on fossil fuels. This can in turn either increase
or decrease the cost of electricity imports for Lithuania. However, we do stress that gradual
decarbonization in such markets will incrementally reduce the impact of fossil fuel prices over the coming
decades. For the Lithuanian power generation mix specifically, the envisioned rapid decarbonization
foreseen in the market will increasingly reduce the impact of commodity price fluctuations on domestic
power generation. We are currently expecting Lithuania’s gas-fired power sector to register a steady
drop in capacity leading up to 2025, from when it will stabilize at 0.43GW leading up to 2050.

Page 35 of 138
DNV GL - Scenario Building for the Evolution of Lithuanian Power Sector for 2020-2050 litgrid test
Figure 17: Commodity prices in DNV GL’s power price model
0
10
20
30
40
50
60
70
2021Q1 2022 2026 2030 2034 2038 2042 2046 2050
Development of the EU ETS price
€/tonne
0
5
10
15
20
2021Q1 2026 2034 2042 2050
Development of the natural gas price
€/MWh
0
20
40
60
80
2021Q1 2026 2034 2042 2050
Development of the coal price
$/tonne
0
20
40
60
80
100
2021Q1 2022 2026 2030 2034 2038 2042 2046 2050
SRMC NGAS - Model
SRMC COAL - Model
Development of short run marginal cost for coal and natural gas fired plants
€/MWh

Page 36 of 138
DNV GL - Scenario Building for the Evolution of Lithuanian Power Sector for 2020-2050 litgrid test
Source: (DNV GL , 2020)
4.2.4 Power Generating Capacity
Finally, to further set the stage for the power generating capacity scenario discussion, we highlight that
all three scenarios share certain power generating capacity characteristics over our forecast time horizon.
These include the following:
• Natural Gas: We maintain that natural gas-fired capacity will register a steady decline from the
about 1.7GW installed as of end-2019 to 0.46 GW by 2025. This will be the result of the phase-
out of ageing natural gas-fired capacity in the market, with the exception of the relatively new
combined cycle gas turbine (CCGT) unit at the Elektrenai Complex that was commissioned in
2012 and Panevezys CHP, commissioned in 2008. We expect these facilities to remain available
for power generation leading up to 2050, given their potential operational lifetimes.
• Oil and Other Non-Renewables: Installed oil capacity is expected to remain constant at 0.15
GW until 2040, when this is expected to be decommissioned. Power generating resources under
the ‘other non-renewables’ segment is expected to follow TYNDP and remain constant at 0.14
GW until 2040. After this, in line with Lithuania’s carbon neutrality aims for electricity generation,
we forecast this segment to register a steady decline towards full phase-out by 2050.
• Offshore Wind: We forecast Lithuania to install 0.7GW of offshore wind capacity across all the
scenarios by 2030. This is in line with the market’s NECP strategy and reflecting the push Vilnius
has made to establishing a 700MW offshore wind zone in the market. It was announced in May
2020 that the Lithuanian Energy Ministry had submitted a government decree for public
consultation, covering an area of 137.5 square km and located 29km from shore. In line with this,
the first offshore wind capacity auctions are planned for announcement in 2023 (Recharge,
2020). The three scenarios are also aligned on the offshore wind segment towards 2040, to meet
the target of 1.4 GW installed capacity, which is higher than the TYNDP scenarios. Beyond 2040,
our three scenarios envision different development trajectories for the sector.
• Pumped Storage And Run-of-River Hydro: We maintain that the 900MW Kruonis Pumped
Storage (PHS) Hydroelectric Plant will remain the sole PHS facility in operation over the coming
three decades – with the facility set to expand to 1,125MW in 2025 when a new fifth 225MW unit
is due to be commissioned. As for run-of-river (ROR) hydroelectric capacity, the 100.8MW
Kaunas Algirdas Brazauskas and the 27MW small hydroelectric power plants will comprise the
capacity in this segment until 2050. We do not forecast any changes in expected precipitation
and inflow.
• Biomass/Biofuels/Waste: Generation capacity from biomass, biofuels and municipal waste is
combined in one category. The net installed capacity will increase in 2021 with an additional 63
MW of biomass and 39 MW of municipal waste. After 2030 the capacity in this category will
remain constant.
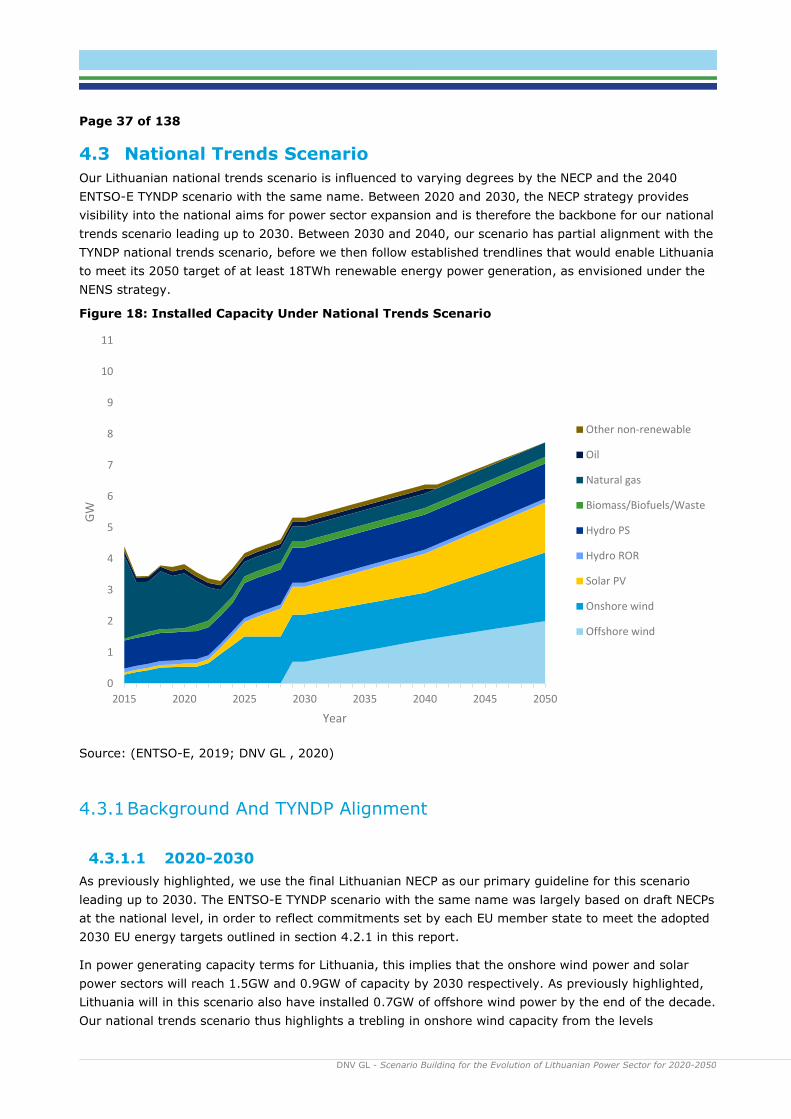
Page 37 of 138
DNV GL - Scenario Building for the Evolution of Lithuanian Power Sector for 2020-2050 litgrid test
4.3 National Trends Scenario
Our Lithuanian national trends scenario is influenced to varying degrees by the NECP and the 2040
ENTSO-E TYNDP scenario with the same name. Between 2020 and 2030, the NECP strategy provides
visibility into the national aims for power sector expansion and is therefore the backbone for our national
trends scenario leading up to 2030. Between 2030 and 2040, our scenario has partial alignment with the
TYNDP national trends scenario, before we then follow established trendlines that would enable Lithuania
to meet its 2050 target of at least 18TWh renewable energy power generation, as envisioned under the
NENS strategy.
Figure 18: Installed Capacity Under National Trends Scenario
Source: (ENTSO-E, 2019; DNV GL , 2020)
4.3.1 Background And TYNDP Alignment
4.3.1.1 2020-2030
As previously highlighted, we use the final Lithuanian NECP as our primary guideline for this scenario
leading up to 2030. The ENTSO-E TYNDP scenario with the same name was largely based on draft NECPs
at the national level, in order to reflect commitments set by each EU member state to meet the adopted
2030 EU energy targets outlined in section 4.2.1 in this report.
In power generating capacity terms for Lithuania, this implies that the onshore wind power and solar
power sectors will reach 1.5GW and 0.9GW of capacity by 2030 respectively. As previously highlighted,
Lithuania will in this scenario also have installed 0.7GW of offshore wind power by the end of the decade.
Our national trends scenario thus highlights a trebling in onshore wind capacity from the levels
0
1
2
3
4
5
6
7
8
9
10
11
2015 2020 2025 2030 2035 2040 2045 2050
GW
Year
Other non-renewable
Oil
Natural gas
Biomass/Biofuels/Waste
Hydro PS
Hydro ROR
Solar PV
Onshore wind
Offshore wind

Page 38 of 138
DNV GL - Scenario Building for the Evolution of Lithuanian Power Sector for 2020-2050 litgrid test
registered as of end-2019. The Lithuanian solar segment also only totals about 0.1GW of capacity to
date, highlighting how the segment is forecasted to register robust growth from a low base over the
coming decade in this scenario. In combination, the installed vRES capacity in Lithuania will total 3.1GW
by 2030, comprising nearly 65% of total installed power generating capacity in the market. This trend
towards greater reliance on intermittent power generation will be supported by the phase-out of natural
gas capacity, as highlighted in section 5.2.5.
Figure 19: Net Change By Technology By Year, GW
Source: (Ministry of Energy of the Republic of Lithuania, 2019; DNV GL , 2020)
4.3.1.2 2030-2040
Between 2030 and 2040, our forecast is partly aligned with the equivalent TYNDP scenario. We expect
vRES sources of renewable energy to remain the key drivers of growth in the Lithuanian power market
over this timeframe. Notably, we forecast the offshore wind sector to double in size over this timeframe,
totalling 1.4GW by 2040. This will, as highlighted in the chart below, mean that the offshore wind sector
overtakes the solar segment in terms of capacity. At the same time, higher offshore wind capacity
factors relative to onshore wind will make the segment the largest in terms of power generation in
Lithuania. Solar capacity will continue to increase, and reach 1.25GW by 2040, which is slightly higher
than the TYNDP National Trends scenario.
-0,60
-0,40
-0,20
0,00
0,20
0,40
0,60
0,80
2020 2021 2022 2023 2024 2025 2026 2027 2028 2029 2030
Natural gas
Biomass/Biofuels/Waste
Hydro PS
Solar PV
Onshore wind
Offshore wind

Page 39 of 138
DNV GL - Scenario Building for the Evolution of Lithuanian Power Sector for 2020-2050 litgrid test
Figure 20: Technology Share Of Total Capacity In 2040
Source: (DNV GL , 2020)
Offshore wind21 %
Onshore wind22 %
Solar PV18 %
Hydro ROR2 %
Hydro PS17 %
Biomass/Biofuels/Waste3 %
Natural gas7 %
Oil2 %
Other non-renewable2 %
Batteries6 %

Page 40 of 138
DNV GL - Scenario Building for the Evolution of Lithuanian Power Sector for 2020-2050 litgrid test
4.3.1.3 2040-2050
Finally, between 2040 and 2050 the 18TWh renewable energy generation target under the NENS is the
main power generating capacity mix evolution driver in our forecast. In the national trends scenario, this
translates into continued stable growth for onshore and offshore wind, as well as solar power. The
technologies are estimated to more or less maintain their 2040 shares of total power generating capacity
leading up to 2050. In total, the three intermittent power generating sources will comprise about 68% of
total power generating capacity in Lithuania by the end of our forecast in 2050.
Table 3: Summary of national trends scenario
GW 2025 2030 2040 2050
Offshore wind 0.00 0.70 1.40 2.00
Onshore wind 1.51 1.51 1.51 2.20
Solar PV 0.46 0.90 1.25 1.60
Hydro PS 1.13 1.13 1.13 1.13
Hydro ROR 0.13 0.13 0.13 0.13
Biomass/Biofuels/Waste 0.21 0.21 0.21 0.21
Natural gas 0.46 0.46 0.46 0.46
Oil 0.15 0.15 0.15 0.00
Other non-renewable 0.14 0.14 0.14 0.00
Source: (DNV GL , 2020)

Page 41 of 138
DNV GL - Scenario Building for the Evolution of Lithuanian Power Sector for 2020-2050 litgrid test
4.4 Centralized Energy Scenario
Our centralized energy scenario is built on top of the ENTSO-E global ambition scenario and has an
overarching focus on the deployment of large-scale centralised power generating capacity. As previously
highlighted, the global ambition scenario is set to be compliant with the 1.5° degree target under the
Paris Agreement, and to be aligned with the adopted 2030 climate targets under EU Regulation.
While our scenario follows a relatively similar growth trajectory to that of global ambition in terms of the
deployment of large-scale wind capacity, we stress that we have omitted some onshore wind capacity
and increased offshore wind power capacity relative to the TYNDP scenario. Post-2040, the offshore wind
sector will be the main driver of power capacity growth in Lithuania in this scenario. This is on the basis
of anticipated land-use challenges for the onshore wind segment over the coming decades.
Figure 21: Installed Capacity Under Centralized Energy Scenario, GW
Source: (ENTSO-E, 2019; DNV GL , 2020)
0
1
2
3
4
5
6
7
8
9
10
11
2015 2020 2025 2030 2035 2040 2045 2050
GW
Year
Other non-renewable
Oil
Natural gas
Biomass/Biofuels/Waste
Hydro PS
Hydro ROR
Solar PV
Onshore wind
Offshore wind

Page 42 of 138
DNV GL - Scenario Building for the Evolution of Lithuanian Power Sector for 2020-2050 litgrid test
4.4.1 Background and TYNDP Alignment
4.4.1.1 2020-2030
In the decade between 2020 and 2030, there are several commonalities between our national trends
scenario, and that of our centralized energy scenario. Both have an overarching near-term focus on
onshore wind deployment, and we forecast capacity in the segment to expand to 1.8GW by 2030. This
expansion will be driven by a notable uptick in growth post-2025. In summary this will entail slightly
faster onshore wind growth in this scenario than what we envision in national trends. The big
differentiator here is our expectation that solar power capacity will register slower growth, totalling only
0.18GW installed by 2030. This will be the result of an overarching focus on developing large-scale
power generating facilities in this scenario.
Figure 22: Net Capacity Change By Technology By Year, GW
Source: (DNV GL , 2020)
4.4.1.2 2030-2040
Growth in the onshore and offshore wind sectors will remain robust between 2030 and 2040 in the
centralised energy scenario. We envision the two segments to, in combination, make up about 60% of
installed power generating capacity in Lithuania by the end of the decade. Total installed wind capacity
will be in line with TYNDP Global Ambition, but, as mentioned, the share between onshore and offshore is
adjusted to meet the target of 1.4GW offshore capacity in 2040. Solar power capacity growth will remain
weak over this period, and only make up about 6% of total power generating capacity in the market.
-0,60
-0,40
-0,20
0,00
0,20
0,40
0,60
0,80
1,00
2020 2021 2022 2023 2024 2025 2026 2027 2028 2029 2030
Natural gas
Biomass/Biofuels/Waste
Hydro PS
Solar PV
Onshore wind
Offshore wind

Page 43 of 138
DNV GL - Scenario Building for the Evolution of Lithuanian Power Sector for 2020-2050 litgrid test
Figure 23: Technology Share Of Total Capacity In 2040
Source: (DNV GL , 2020)
Offshore wind21 %
Onshore wind40 %
Solar PV6 %
Hydro ROR2 %
Hydro PS17 %
Biomass/Biofuels/Waste3 %
Natural gas7 %
Oil2 %
Other non-renewable2 %

Page 44 of 138
DNV GL - Scenario Building for the Evolution of Lithuanian Power Sector for 2020-2050 litgrid test
4.4.1.3 2040-2050
The biggest shift in the centralized energy scenario is set to occur between 2040 and 2050, when the
offshore wind sector becomes the by far most important driver of capacity growth in the market. In line
with robust onshore wind capacity growth in the timespan between 2020 and 2040, we believe land-use
challenges will become a barrier to additional growth in the sector. Instead, developing new offshore
wind capacity will be the main way through which the Vilnius will seek to achieve its 2050 ambitions
under the NENS and EU energy targets – as is highlighted in the table below.
Table 4: Summary Of Centralized Energy Scenario
GW 2025 2030 2040 2050
Offshore wind 0.00 0.70 1.40 2.00
Onshore wind 1.00 1.80 2.60 2.60
Solar PV 0.15 0.18 0.40 0.40
Hydro PS 1.13 1.13 1.13 1.13
Hydro ROR 0.13 0.13 0.13 0.13
Biomass/biofuels/waste 0.21 0.21 0.21 0.21
Natural gas 0.46 0.46 0.46 0.46
Oil 0.15 0.15 0.15 0
Other non-renewable 0.14 0.14 0.14 0.00
Source: (DNV GL , 2020)

Page 45 of 138
DNV GL - Scenario Building for the Evolution of Lithuanian Power Sector for 2020-2050 litgrid test
4.5 Distributed Energy Scenario
Finally, our distributed energy scenario is built on the equivalent TYNDP scenario developed by ENTSO-E.
Just as the centralised energy scenario, the TYNDP distributed energy scenario is also set to align with
1.5° degree Paris Agreement target and EU 2030 climate targets. The defining factor for this scenario is
a more rapid deployment rate of solar capacity at the distributed level in the Lithuanian market from
2030 to 2040. As such, our scenario for renewable capacity growth is based on the TYNDP Distributed
Energy scenario for the period of 2020 to 2040, with the main difference being that we anticipate slightly
less onshore wind and slightly more offshore wind development. This is due to the onshore wind growth
barriers we highlighted in the centralised energy scenario.
Figure 24: Net Capacity Growth By Technology By Year, GW
Source: (ENTSO-E, 2019; DNV GL , 2020)
4.5.1 Background And TYNDP Alignment
4.5.1.1 2020-2030
As is illustrated in the chart below, we maintain that the onshore wind sector will be the main driver of
Lithuanian power generating capacity growth over the coming decade, and that 0.7GW of offshore wind
will be installed. This view is also based on our expectation that the share of prosumers relative to all
electricity consumers in Lithuania will remain relatively low prior to 2030. According to the 2018 NENS,
the share was forecasted to be around 2% as of 2020. This in turn means that the wind sector will play
the main role in boosting renewables power generation over the coming decade, in line with a relatively
slow initial momentum in distributed solar capacity growth.
0
1
2
3
4
5
6
7
8
9
10
11
2015 2020 2025 2030 2035 2040 2045 2050
GW
Year
Other non-renewable
Oil
Natural gas
Biomass/Biofuels/Waste
Hydro PS
Hydro ROR
Solar PV
Onshore wind
Offshore wind

Page 46 of 138
DNV GL - Scenario Building for the Evolution of Lithuanian Power Sector for 2020-2050 litgrid test
Figure 25: Net Capacity Change By Technology By Year, GW
Source (DNV GL , 2020)
4.5.1.2 2030-2040
The growth momentum for distributed solar capacity will instead accelerate rapidly between 2030 and
2040, supported by an anticipated rising importance of the Lithuanian prosumer in this scenario. Under
the NENS, the prosumer share of total consumers is expected to increase to 30% by 2030, and this
would in turn facilitate a substantial uptick in solar capacity deployment between 2030 and 2040. The
rapid increase of solar capacity over this decade is the key driving force of power market shift in this
scenario, with the sector registering a net increase in growth of about 2.15GW over this timeframe,
totalling 2,55GW by 2040. This will increase the share of the solar power capacity in the Lithuanian
capacity mix from about 8% over 2030 to 28% by 2040.
For wind power we anticipate continued robust growth over this timeframe, mirroring that outline for the
centralised energy scenario and TYNDP. This highlights the continued importance of centralised large-
scale resources in Lithuania, even in a scenario that outlines the scope for rapid growth in distributed
solar capacity. This is mainly due to the low solar power capacity factor.
-0,60
-0,40
-0,20
0,00
0,20
0,40
0,60
0,80
1,00
2020 2021 2022 2023 2024 2025 2026 2027 2028 2029 2030
Natural gas
Biomass/Biofuels/Waste
Hydro PS
Solar PV
Onshore wind
Offshore wind

Page 47 of 138
DNV GL - Scenario Building for the Evolution of Lithuanian Power Sector for 2020-2050 litgrid test
Figure 26: Technology Share Of Total Capacity In 2040
Source: (DNV GL , 2020)
Offshore wind16 %
Onshore wind30 %
Solar PV29 %
Hydro ROR1 %
Hydro PS13 %
Biomass/Biofuels/Waste
2 %
Natural gas5 % Oil
2 %
Other non-renewable2 %2040
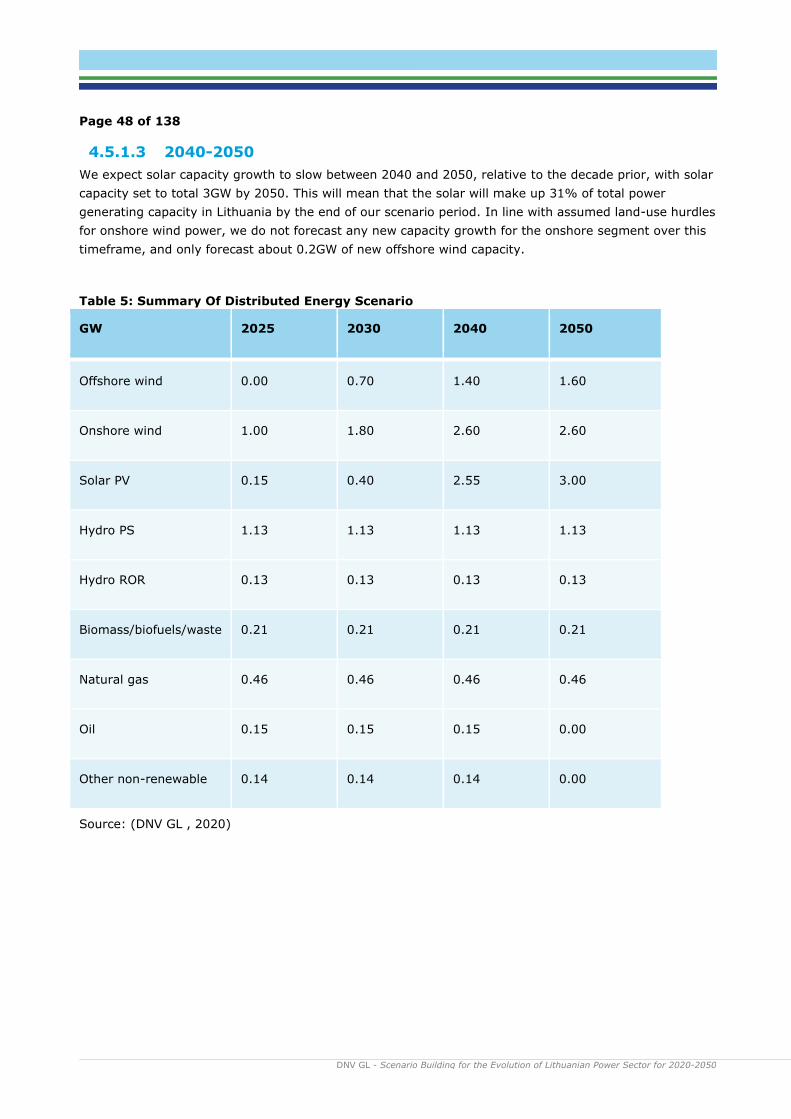
Page 48 of 138
DNV GL - Scenario Building for the Evolution of Lithuanian Power Sector for 2020-2050 litgrid test
4.5.1.3 2040-2050
We expect solar capacity growth to slow between 2040 and 2050, relative to the decade prior, with solar
capacity set to total 3GW by 2050. This will mean that the solar will make up 31% of total power
generating capacity in Lithuania by the end of our scenario period. In line with assumed land-use hurdles
for onshore wind power, we do not forecast any new capacity growth for the onshore segment over this
timeframe, and only forecast about 0.2GW of new offshore wind capacity.
Table 5: Summary Of Distributed Energy Scenario
GW 2025 2030 2040 2050
Offshore wind 0.00 0.70 1.40 1.60
Onshore wind 1.00 1.80 2.60 2.60
Solar PV 0.15 0.40 2.55 3.00
Hydro PS 1.13 1.13 1.13 1.13
Hydro ROR 0.13 0.13 0.13 0.13
Biomass/biofuels/waste 0.21 0.21 0.21 0.21
Natural gas 0.46 0.46 0.46 0.46
Oil 0.15 0.15 0.15 0.00
Other non-renewable 0.14 0.14 0.14 0.00
Source: (DNV GL , 2020)

Page 49 of 138
DNV GL - Scenario Building for the Evolution of Lithuanian Power Sector for 2020-2050 litgrid test
5 POWER GENERATION MODELLING RESULTS
5.1 Introduction
Through the National Trends, the Centralized Energy and Distributed Energy scenarios, three different
avenues for power generating capacity development have been envisioned for Lithuania leading up to
2030. The next step of the discussion will be to assess how these scenarios pan out in the form of power
generation, consumption and imports in our power market model6. These results will be outlined in this
chapter, forming the backbone of a more in-depth discussion into the role of flexibility resources in
chapter 6 and their role for ensuring the reliable operation of the power system. This will then form the
basis for our discussion on system adequacy in chapter 7 of this report.
5.2 Key Takeaways
To initiate the discussion on modelling results, we will first provide some key insights into how the
National Trends, Centralized, and Distributed Energy generation scenarios perform in relation to key
indicators outlined under the NENS strategy. The prerequisite targets from the NENS have formed the
basis for the formulation of the three scenarios, as discussed in chapter 4. The targets focus on ensuring
that sufficient generation is sourced domestically and that it is increasingly green.
As such, the tables below present to what extent the different scenarios reach selected NENS renewables
targets for 2030 and 2050:
• 2030 – Domestic Generation: The target of ensuring that domestic generation covers 70% of
gross electricity consumption in 2030 is exceeded by a significant margin. This is mainly due to
the increase in wind power, but also increased utilization of existing natural gas capacity at the
Elektrenai Complex and the Panevezys CHP.
• 2030 – Renewables Generation: The large increase in installed renewable generation capacity
also enables Lithuania to exceed the 2030 target of increasing the share of renewable energy
generation in total power consumption to 45%. Even though these results look very similar for
all three scenarios there are differences the composition of solar, onshore and offshore wind in
Lithuanian the generation mix by scenario – as highlighted in chapter 4.
6 See description of the power market modelling tool in Appendix I

Page 50 of 138
DNV GL - Scenario Building for the Evolution of Lithuanian Power Sector for 2020-2050 litgrid test
Table 6: 2030 NENS Targets results by scenario
2030 NENS Targets National Trends Centralized
Energy
Distributed
Energy
Domestic generation
covers 70% of gross
electricity consumption
Yes, 92% Yes, 92% Yes, 93%
Renewable energy
makes of 45% of
electricity consumption
Yes, domestic
renewable energy
generation makes
63% of electricity
consumption
Yes, domestic
renewable energy
generation makes
62 % of electricity
consumption
Yes, domestic
renewable energy
generation makes
65 % of electricity
consumption
• 2050 – Domestic Generation: Lithuania aims to meet 100% of gross electricity consumption
with domestic resources by 2050, as set out under the NENS. We note that across our three
scenarios we expect Lithuania to import power during hours of low renewables generation, as the
most cost-competitive option. Import is also seen in hours with surplus generation in
neighbouring countries than can be consumed by flexible demand like Power-to-gas (P2G) in
Lithuania. That said, we stress that Lithuania theoretically can meet such a target in our
scenarios, but that this is likely to come at a higher expense than importing electricity during
generation deficit hours.
• 2050 – Renewables Generation: The NENS sets the aim of sourcing 100% of gross electricity
consumption from renewable energy by 2050. Given that we have kept two gas-fired power
plants in the Lithuanian power capacity fleet leading up to 2050, as well as having some net
import, we currently forecast domestic renewable generation be around 80-90% of consumption
depending on scenario.

Page 51 of 138
DNV GL - Scenario Building for the Evolution of Lithuanian Power Sector for 2020-2050 litgrid test
Table 7: 2050 NENS Targets result by scenario
2050 NENS Targets National Trends Centralized
Energy
Distributed Energy
Domestic generation
covers 100% of gross
electricity consumption
In terms of installed (and available) generation capacity and annual
electricity demand, the target is reached. However, there is an electricity
surplus when wind and solar generation is high, and a deficit when
intermittent generation is low. The surplus can either be curtailed or
used for power to gas. Theoretically, the gas produced in surplus hours,
could be converted back to electricity in deficit hours, but the cost of
that is higher than importing electricity when needed.
Renewable energy
makes of 100% of
gross electricity
consumption
Domestic renewable
generation makes up
84% of electricity
consumption. The
remaining 16%
comes from import
and the assumption
of two remaining gas
plants.
Domestic renewable
generation makes
up 83% of
electricity
consumption. The
remaining 17%
comes from import
and the assumption
of two remaining
gas plants.
Domestic renewable
generation makes up
87% of electricity
consumption. The
remaining 13% comes
from import and the
assumption of two
remaining gas plants.
In order to provide further insights into the aforementioned results, we will discuss the three power
generation scenarios and corresponding power generation, consumption and import results in greater
detail in the following sections of this chapter. Notably, as outlined in section 5.2 these scenarios
have several variables in common, including assumptions for the growth trajectory of:
• Electricity demand
• Interconnection capacity
• Commodity prices
• Offshore wind capacity leading up to 2040
• Natural gas-fired capacity leading up to 2050
• Biomass/biofuels/waste capacity leading up to 2050
• Pumped storage and run-of-river hydropower capacity leading up to 2050
• Oil and other non-renewables capacity leading up to decommissioning in 2040

Page 52 of 138
DNV GL - Scenario Building for the Evolution of Lithuanian Power Sector for 2020-2050 litgrid test
5.3 National Trends Results
The National Trends scenario is largely based on Lithuania’s NECP and ENTSO-E’s equivalent scenario for
the market – with the overarching aim being to meet the 18TWh target under the NENS by 2050. As is
illustrated in figure 27 below, the power generation resulting from the national trends power capacity
outlook results in Lithuania increasingly relying on onshore and offshore wind generation to meet power
demand. This trend is particularly noticeable post-2030, in line with an expected contraction in natural
gas-fired power generation, coupled with the expected increase in domestic generation. Key results
takeaways include:
• 2020-2025: Leading up to 2025, Lithuania will be in the process of preparing the de-
synchronisation from the IPS/UPS system and will seek to substantially ramp up power
generation output from 2020 levels. We expect this to occur through a combination of gas-fired
generation and onshore wind.
• 2025-2030: The main driver of generation growth between 2025 and 2030 will be from the
offshore wind segment, with an expected 700MW facility coming online.
• 2030-2040: A contraction in gas generation output will coincide with further generation
increases in onshore and offshore wind. This rise in vRES will drive the development of battery
storage, as well as V2G services from electric vehicles, which can help balance an increasingly
intermittent power supply.
• 2040-2050: Generation growth in the onshore and offshore wind segments will further
accelerate to set Lithuania on a trajectory through which it can meet its domestic and
renewables supply targets under the NENS.

Page 53 of 138
DNV GL - Scenario Building for the Evolution of Lithuanian Power Sector for 2020-2050 litgrid test
Figure 27: National Trends Power Generation By Year, TWh
The offshore wind segment is by far the most impactful over the coming three decades, increasing its
share of total generated power in Lithuania from 0% over as of 2025 to 17% by 2030, 30% by 2040 and
37% by 2050. In comparison, we note that onshore wind as a share of total generation will remain
relatively steady over the same period. Natural gas generation increases slightly from 2025 to 2030 with
the desynchronization from IPS/UPS, before falling to 7% by 2050.
Other key indicators of the National Trends scenario include:
• Imports: The table below outlines that Lithuania will reduce its reliance on imports from the
high levels registered at present. By 2025, net imports share of total electricity consumption will
amount to 29%, a share that will contract to only 8% by 2030 and 6% by 2040. That said, as
Lithuania increasingly relies on intermittent renewables, we expect imports will be the most cost-
competitive manner to ensure security of supply during hours of low renewables output. Import
is also seen in hours with power surplus in other countries, exporting low price electricity to
Lithuania that can increasingly be consumed by flexible demand. As such we foresee Lithuania to
have some net import in 2050, but a share of 10% of annual consumption.
• Power-to-gas: We expect P2G to also play an increasingly important role in absorbing
renewables generation surpluses and foresee substantial growth in the segment post-2040 in
line with increasing technology maturity and cost reductions.
The table below outlines in more detail how the power generation, consumption and import results pan
out in our National Trends scenario:

Page 54 of 138
DNV GL - Scenario Building for the Evolution of Lithuanian Power Sector for 2020-2050 litgrid test
Table 8: Summary of National Trends Power Generation By Year, TWh
TWh 2025 2030 2040 2050
Offshore wind - 2.3 5.2 7.4
Onshore wind 3.3 3.7 4.3 6.2
Solar PV 0.4 0.9 1.2 1.6
Hydro PS 0.5 0.4 0.5 0.5
Hydro ROR 0.5 0.5 0.5 0.5
Biomass 1.0 1.0 1.2 1.1
Natural gas 2.6 3.0 2.4 1.4
Other non-RES 1.2 1.2 1.2 -
EV and battery
generation
0.0 0.2 1.1 1.5
Total generation 9.4 13.1 17.5 20.0
Consumption 13.3 14.2 18.7 22.3
Of which is P2G - 0.0 0.2 1.4
Net import 3.9
1.1 1.2 2.3

Page 55 of 138
DNV GL - Scenario Building for the Evolution of Lithuanian Power Sector for 2020-2050 litgrid test
5.4 Centralised Energy Results The Centralized Energy scenario for power generation, which is largely built on ENTSO-E’s Global
Ambition scenario, also has meeting the NENS generation targets as the foundation for its growth
trajectory. As the name indicates, this scenario has an overarching focus on outlining a growth trajectory
that incorporates greater penetration of large-scale centralised power generating resources. Given
Lithuanian decarbonisation ambitions, the main thrust of this growth will be in renewable energy
capacity – and notably onshore and offshore wind facilities. This is evident in

Page 56 of 138
DNV GL - Scenario Building for the Evolution of Lithuanian Power Sector for 2020-2050 litgrid test
Figure 28 below. Key results takeaways include:
• 2020-2025: As in the National Trends scenario, the Centralised energy scenario will register
robust capacity growth leading up to 2025 – resulting in a strong increase in onshore wind
generation. Natural gas will, however, be the largest generation source, covering 21% of
domestic electricity consumption.
• 2025-2030: We expect a surge in onshore wind capacity development leading up to 2030,
coupled with the emergence of offshore wind generation. In combination, this will cement the
wind segment’s importance to Lithuanian power generation and increase the share of wind power
in the generation mix from 23% in 2025 to 51% in 2030. This will coincide with a substantial
drop in gas generation output.
• 2030-2040: The share of the wind segment will continue to grow leading up to 2040, with
onshore and offshore wind registering 38% and 27% shares of total power generation by that
year. At this point, the natural gas share will have contracted to 11% of the total. By 2040
stationary batteries and EV batteries will be important for balancing the system and will make up
5% of the generation mix, even with a lower installed stationary battery capacity than in the two
other scenarios.
• 2040-2050: Leading up to 2050, the offshore wind segment will be the main driver of
generation growth, informed by increasing land-use restrictions for the onshore segment. As
such, we forecast output from onshore wind to remain constant over this decade, leading to both
the onshore and the offshore wind segment have 37% shares of the generation mix by 2050.

Page 57 of 138
DNV GL - Scenario Building for the Evolution of Lithuanian Power Sector for 2020-2050 litgrid test
Figure 28: Centralised Energy Power Generation by Year, TWh

Page 58 of 138
DNV GL - Scenario Building for the Evolution of Lithuanian Power Sector for 2020-2050 litgrid test
Figure 28 shows the trend of a substantial decrease of gas-fired power’s importance in meeting
Lithuanian power demand over the coming decades. Instead, in this scenario, onshore and offshore wind
will in conjunction become the by far most important sources of power generation, highlighting the
increasingly intermittent nature of the Lithuanian power supply in this scenario.
Other key indicators of the Centralised Energy scenario include:
• Imports: The table below outlines that Lithuania will reduce its reliance on imports from the
levels registered at present. By 2025, imports share of total electricity consumption will amount
to a share of 38%, which highlights the greater importance of electricity imports in this scenario
relative to the National Trends scenario in the first years. We envision this share contracting to 8%
by 2030, in line with the substantial build-up of wind capacity. By 2040, the growth in wind
power capacity will make Lithuania a net exporter of electricity, exporting 0.6 TWh over the year.
That said, as Lithuania increasingly relies on intermittent renewables, we expect imports will be
the most cost-competitive manner to ensure security of supply during hours of low renewables
output. Import is also seen in hours where surplus generation in neighbouring countries can be
consumed by an increasingly flexible demand side in Lithuania, like power to gas. As electricity
demand increases the import share will increase again post-2040 to about 11% of electricity
consumption in 2050.
• Power-to-gas: We expect P2G to also play a more important role in absorbing renewables
generation surpluses and foresee substantial growth in the segment post-2040 in line with
increasing technology maturity and cost reductions.
The table below outlines in more detail how the power generation, consumption and import results pan
out in our Centralised Energy scenario:
Table 9: Summary of Centralised Energy Power Generation by Year, TWh
TWh 2025 2030 2040 2050
Offshore wind - 2.3 5.2 7.4
Onshore wind 2.2 4.4 7.3 7.3
Solar PV 0.1 0.2 0.4 0.4
Hydro PS 0.4 0.4 0.6 0.6
Hydro ROR 0.5 0.5 0.4 0.5
Biomass 1.0 1.0 1.2 1.1
Natural gas 2.9 3.0 2.2 1.4
Other non-RES 1.2 1.2 1.2 -

Page 59 of 138
DNV GL - Scenario Building for the Evolution of Lithuanian Power Sector for 2020-2050 litgrid test
EV and battery generation 0.0 0.2 0.9 1.1
Total generation 8.2 13.1 19.4 19.7
Consumption 13.2 14.3 18.8 22.2
Of which is P2G - 0.0 0.3 1.6
Net import 5.0 1.1 -0.6 2.4

Page 60 of 138
DNV GL - Scenario Building for the Evolution of Lithuanian Power Sector for 2020-2050 litgrid test
5.5 Distributed Energy Results The Distributed Energy Scenario is informed by ENTSO-E’s equivalent scenario and envisions a greater
deployment rate of distributed energy – notably solar capacity – over the coming decades. In the
previous two scenarios, solar generation has played a small role in the Lithuanian power generation mix.
In this scenario, we envision a faster solar capacity adoption rate, which is illustrated in the growth
acceleration between 2030 and 2040 in

Page 61 of 138
DNV GL - Scenario Building for the Evolution of Lithuanian Power Sector for 2020-2050 litgrid test
Figure 29. That said, we do stress that the main driver of Lithuanian power generation growth will be the
country’s wind power segment. This is particularly prominent leading up to 2030, and to a slightly lesser
extent post-2030. Key results takeaways include:
• 2020-2025: The centralised and distributed scenarios are more or less aligned leading up to
2025, with the onshore wind power segment covering 26% of total domestic generation, and
natural gas 35%. We foresee limited solar capacity deployment in the near-term, with the
segment only making up an equivalent 2% share.
• 2025-2030: The main drivers of growth leading up to 2030 will be onshore and offshore wind,
which will comprise a cumulative share of 50% by 2030 – highlighting that the initial growth
push in this scenario will also be driven by large-scale wind development. Natural gas remains at
a constant level in terms of TWh, with a generation share of 22% by 2030 – highlighting the
segment’s continued importance. The solar PV segment will remain relatively nascent leading up
to 2030. In this scenario, 100 MW of stationary battery capacity is assumed to be installed by
2030 and will together with the growing EV fleet start contributing to system balance.
• 2030-2040: Post-2030, solar PV generation growth will accelerate, taking a share of total power
generation to 12% by 2040. The wind segment will continue to grow and make up an equivalent
58% by the end of the decade. Energy storage solutions become increasingly important, and
both hydro pumped storage, stationary batteries and electric vehicles is forecasted to
increasingly contribute to balancing the system.
• 2040-2050: Solar PV growth will remain robust, ensuring that its share of total power
consumption will reach 14% in 2050. The onshore wind share will remain stable, and there will
be a small increase in offshore wind. As natural gas generation decrease further, we see a small
decrease in total domestic electricity generation in this decade.
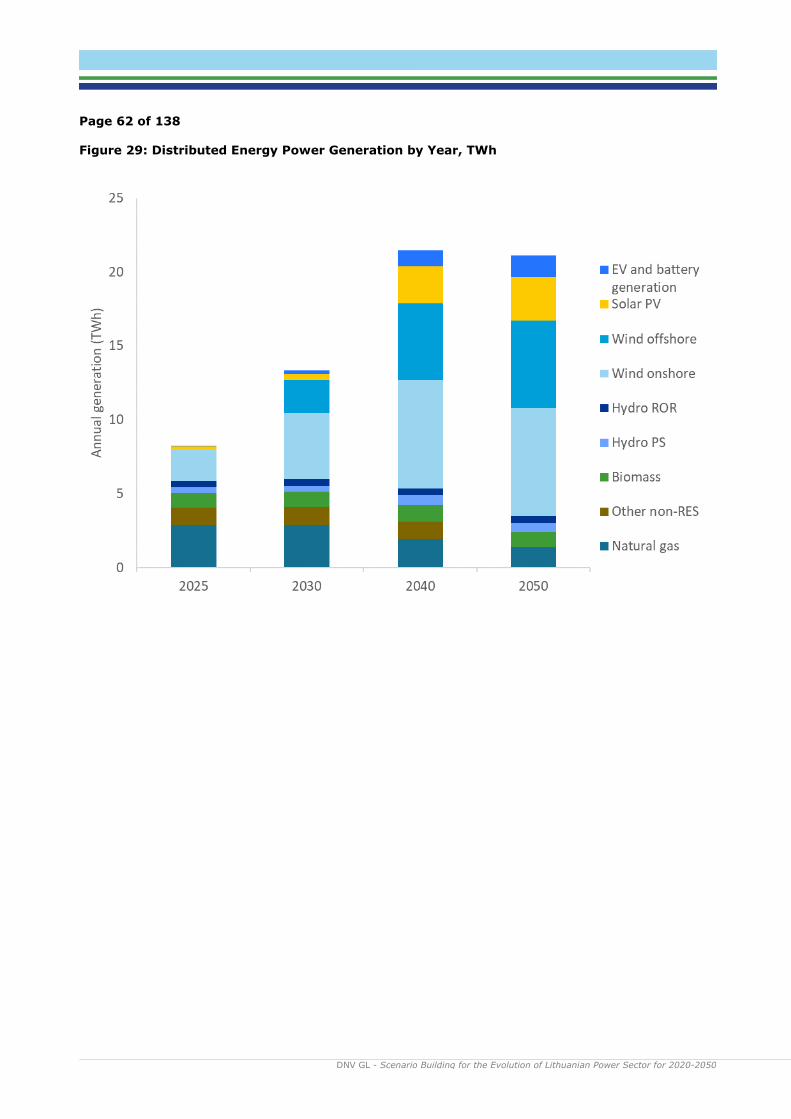
Page 62 of 138
DNV GL - Scenario Building for the Evolution of Lithuanian Power Sector for 2020-2050 litgrid test
Figure 29: Distributed Energy Power Generation by Year, TWh

Page 63 of 138
DNV GL - Scenario Building for the Evolution of Lithuanian Power Sector for 2020-2050 litgrid test
Figure 29 illustrates how the solar PV segment is set to play a more important role in the Lithuanian
power generation mix post-2030, coinciding with slowing generation growth in the wind power segment.
This scenario envisions a slightly steeper natural gas decline relative to the National Trends and
Centralised Energy scenarios towards 2040, while ending up at similar levels in 2050 of 6% of total
generation.
Other key indicators of the Distributed Energy scenario include:
• Imports: The table below outlines that Lithuania will reduce its reliance on imports from the
levels registered at present. By 2025, imports share of total electricity consumption will amount
to a share of 38%, this highlights the greater importance of electricity imports in the first years
in this scenario relative to the National Trends scenario. However, we envision this share
contracting to only 7% by 2030, in line with the substantial build-up of onshore and offshore
wind capacity. By 2040, the build-out of offshore wind and solar PV capacity will make Lithuania
a net exporter of electricity, exporting 2.2 TWh, i.e. 12% of total generation. However, as in the
two other scenarios, imports are forecasted to increase post 2040 as renewable generation
increases both in Lithuania and in the rest of Europe.
• Power-to-gas: We expect P2G to also play a more important role in absorbing renewables
generation surpluses and foresee substantial growth in the segment post-2040 in line with
increasing technology maturity and cost reductions. In 2050, this would entail the P2G segment
absorbing a total of 8% of the power generated in Lithuania in this scenario.
• Seasonality: Solar generation varies throughout the year and is substantially higher in the
summer than in the winter. As such, the utilisation of batteries to store solar energy from peak
sun hours in the daytime is higher in the summer than in the winter. On the other hand, wind
generation is generally higher in the winter than mid-summer, and often also slightly higher at
night than in the day. Wind variability is lower than solar, but these patterns has positive effects
on balancing energy supply.
The table below outlines in more detail how the power generation, consumption and import results pan
out in our Distributed Energy scenario:

Page 64 of 138
DNV GL - Scenario Building for the Evolution of Lithuanian Power Sector for 2020-2050 litgrid test
Table 10: Summary of Distributed Energy Power Generation by Year, TWh
TWh 2025 2030 2040 2050
Offshore wind - 2.3 5.2 5.9
Onshore wind 2.2 4.4 7.3 7.3
Solar PV 0.1 0.4 2.5 2.9
Hydro PS 0.4 0.4 0.7 0.6
Hydro ROR 0.5 0.5 0.4 0.5
Biomass 1.0 1.0 1.1 1.1
Natural gas 2.9 2.9 2.0 1.4
Other non-RES 1.2 1.2 1.1 -
EV and battery generation 0.0 0.3 1.1 1.5
Total generation 8.2 13.3 21.5 21.1
Consumption 13.2 14.3 19.2 22.6
Of which is P2G - 0.0 0.4 1.6
Net import 5.0 1.0 -2.2 1.5
5.6 Peak demand
The peak load is expected to increase as the electricity demand increases. With new demand coming
from electrification the consumption patterns also change, and flexibility solutions become increasingly
important to avoid high demand peaks that can potentially occur i.e. if all EVs charge at the same time
when electricity generation is low. However, P2G and energy storage will also be important to increase
peak load in hours with high renewable generation to avoid curtailment.
Figure 30 shows peak demand forecast for the three different ENTSO-E scenarios, compared with
average peak demand from DNV GLs three scenarios. Since the scenarios have the same demand
assumptions variations are minor and only caused by behaviour of demand side flexibility. Peak demand
including flexible demand from energy storage solutions activated in supply surplus hours is also
included, showing how demand can increasingly be adjusted by generation availability. The figure shows

Page 65 of 138
DNV GL - Scenario Building for the Evolution of Lithuanian Power Sector for 2020-2050 litgrid test
that modelling results for peak demand in Lithuania develops in line with ENTSO-E assumptions, from
around 2 GW today to 3.1 GW in 2050. Modelling results are slightly lower than the TYNDP National
Trends forecast in 2030, which can be explained by annual variations in consumption patterns and
assumptions on flexibility of EV charging and electric heating to reduce peak demand. Peak demand
results by DNV GL scenario are listed in Table 11.
Figure 30: Lithuania peak load results compared with ENTSO-E scenarios
Table 11: Peak load results by scenario
2025 2030 2040 2050
Peak load excl.
P2G, batteries,
V2G and hydro
pump load
(GW)
National Trends 2.1 2.2 2.6 3.1
Centralised Energy 2.1 2.2 2.6 3.0
Distributed Energy 2.1 2.3 2.6 3.0
Peak load incl.
P2G, batteries,
V2G and hydro
pump load
(GW)
National Trends 2.7 2.9 4.3 5.9
Centralised Energy 2.7 3.0 4.0 5.4
Distributed Energy 2.7 3.1 4.3 5.9

Page 66 of 138
DNV GL - Scenario Building for the Evolution of Lithuanian Power Sector for 2020-2050 litgrid test
6 FLEXIBILITY MARKET BACKGROUND: THE IMPORTANCE OF FLEXIBILITY
6.1 Introduction
Following the development of three power generation scenarios in chapter four, accompanied with power
generation, consumption and import results in chapter five, chapter six discuss the importance of
flexibility to ensuring the reliable operation of a power system increasingly based on vRES power
generation.
In relation to this, system adequacy can be defined as the ability of a power system to meet demand at
all times, ensuring grid stability and security of supply. As we have repeatedly highlighted, the
Lithuanian power generation mix will, along with the overall European generation mix, become
increasingly based on intermittent renewable energy over the coming three decades. To develop and
implement solutions that can help mitigate the challenges associated with renewables intermittence will
thus be the defining characteristic of efforts to support system adequacy in the Lithuanian, Baltic and
European power system.
Furthermore, the desynchronization from the IPS/UPS system by 2025 will pose new questions to
system management – in line with Lithuania being required to perform system balancing operations
currently undertaken by the Russian system operator. That said, new technology and the Lithuanian
entry to the Continental European power system will also unlock new opportunities to support system
balancing – by extension enabling Lithuania to meet the challenges posed from an increasing reliance on
intermittent renewable energy generation.
This chapter will, as such, provide background on the flexibility market and will be structured as follow:
• We will first outline the role of flexibility in the power market, with a particular emphasis on
dealing with the challenges posed by intermittent renewable energy.
• This will include a discussion on short-term and long-term balancing, and the evolution of the
balancing market in Lithuania in light of the IPS/UPS desynchronization in 2025.
• We will also discuss in greater detail the various technological solutions set to be available over
the coming three decades – and how they can solve different flexibility challenges.
6.2 Evolving Flexibility Solutions in the Power Market
In order to address expanding supply surpluses and deficits as the share of intermittent renewables
continues to grow in the Lithuanian power generation mix, resources that can absorb excess supply and
plug supply deficits will grow in importance. In line with the power generation scenarios outlined, it is
clear that wind power in particular will play an outsized role in fulfilling Lithuanian energy security and
decarbonisation aspirations over the coming decades. This in turn highlights that the market must draw
on a number of flexibility solutions over the coming decades to address its increasingly intermittent
electricity supply.
Historically, variability in the power system happened at the demand side, while flexibility was provided
at the supply side. However, as illustrated in the generation component of Figure 31, with increasing
levels of variable RES generation, interconnectivity and end-user participation, the structure and
operation of the system is changing. Notably, more flexibility can now be provided through flexible loads

Page 67 of 138
DNV GL - Scenario Building for the Evolution of Lithuanian Power Sector for 2020-2050 litgrid test
and demand side management – as is illustrated in the graphic - while more variability at the supply side
is introduced due to variable RES. In addition, with reduced cost for automation systems it becomes
more attractive and possible for flexible demand to respond to variations in supply.
Figure 31: Sources of variability and flexibility in the power system, based on (DNV GL, 2017)
Source: (DNV GL, 2017)
Upon desynchronization with the IPS/USP power system, Lithuania will take greater part in power supply
and demand balancing to deal with the variability challenges outlined in the chart above. This will
increase the relevance of ensuring access to various flexibility solutions on both the generation and load-
side. This will occur simultaneously with the deepening of abovementioned structural changes in the
generation and load categories. More specifically the phase-down of conventional fossil-fueled power
generation capacity and deployment of intermittent renewables at the generation side highlights the
importance of increasing the suite of available flexibility solutions to balance supply and demand over
the coming decades.
6.2.1 The Importance of Short- and Long-term Flexibility Solutions to
Addressing Variability Challenges
Variability in the power system occurs at different levels in the network and at different operational time
scales (e.g. solar variations from day to night or wind variations within seconds). This is also true for
flexibility services, which serve different purposes and have different technical and market-based
characteristics (e.g. start-up time of a generation asset or discharging time of a storage device).

Page 68 of 138
DNV GL - Scenario Building for the Evolution of Lithuanian Power Sector for 2020-2050 litgrid test
Flexibility services need to be matched with the flexibility required in the system. As markets rely
increasingly on intermittent power generation sources, the importance of longer-term flexibility grows in
prominence for energy security as conventional power generation sources are phased out. We highlight
the two key services undertaken by flexibility below:
▪ Addressing surplus: This can be done through short-term flexibility resources that absorb power
generation peaks, with a duration from seconds to days and can include battery storage. This will
also be complemented with longer-term flexibility resources that can absorb more power over
longer timeframes, from weeks to months, such as power-to-gas.
▪ Addressing deficit: Short-term deficits can be addressed with demand-side flexibility and
management (DSM) from consumers of varying sizes, battery storage, electric vehicles, while
solutions such as pumped storage, interconnections and hydrogen re-electrification can address
longer-term deficits.
Figure 32 visualized the relationship between near- and long-term flexibility technologies. The key
takeaway from this graphic is that a variety of flexibility resources working in combination and
overlapping each other are required to deal with the challenges associated with supply and demand
fluctuations. In essence, different technologies are needed to provide flexibility over different timeframes,
which can range from seconds and minutes to weeks and months.
Figure 32: Time-scale of flexibility services, based on (DNV GL, 2017)
Source: (DNV GL, 2017)

Page 69 of 138
DNV GL - Scenario Building for the Evolution of Lithuanian Power Sector for 2020-2050 litgrid test
6.3 The Balancing Market
In order to ensure that power system integrity is maintained under all circumstances – with respect to
metrics such as energy, capacity, inertia, voltages and frequency – a number of reserve markets exist in
a power market. These vary in expected response time and expected time of duration. Frequency
containment and frequency restoration reserves operate within seconds and minutes, while replacement
reserves can be applied over days, in order to balance supply and demand. The variety of reserve
markets are key to ensuring supply and demand match in every hour in case a disturbance happens,
such as a forecasting error of a renewable generator. As such, reserves are elemental to ensure system
adequacy.
Table 12: Overview of balancing market characteristics
Abreviation Type Description Response
FCR Frequency Containment
Reserve
Capacity reserved for
increasing or reducing
energy output to
contain frequency
deviation
Response: seconds
Delivery: <1 min
aFRR Automatic frequency
restoration reserve
Automatic activation to
contain frequency
deviation over longer
timeframe.
Response: Full
activation within 5
minutes
Delivery: Up to 15
mins
mFRR Manual frequency
restoration reserve
Manual activation to
ensure that that area of
control error (ACE) is
within allowed limits
every hour.
Response: Full
activation within
12,5 mins
Delivery: no higher
than 20 minutes for
scheduled activation
and 35 minutes for
direct activation.
RR Replacement Reserves
Used to replace mFRR
due to its limited
duration. Combined
with balancing market
and RR should cover
the largest contingency
in the market
Response: Full
activation within 30
mins
Delivery: Need to
be sustained for at
least 15 mins
Source: (AST, Elering & Litgrid, 2020)

Page 70 of 138
DNV GL - Scenario Building for the Evolution of Lithuanian Power Sector for 2020-2050 litgrid test
In line with Lithuania synchronising with the Continental European power system in 2025, the market is
set to participate in existing EU initiatives for joint procurement of FCR resources (Commission, Pursuant
to Article 20(5) of Regulation (EC) No 2019/943 on the implementation plan of, 2020). According to an
opinion paper published by the European Commission, Lithuania should also amend its market design in
order to join EU’s future mFRR platform (MARI) and future aFRR platform (PICASSO) – in accordance
with the Commission Regulation 2017/2195 on establishing a guideline on electricity balancing (EBGL)
(Commission, COMMISSION REGULATION (EU) 2017/2195 of 23 November 2017 establishing a guideline
on electricity balancing, 2017). We also highlight that the Baltic TSOs are to join the IGCC platform,
which seeks to design and implement the imbalance netting platform defined under EBGL article 22. The
aim of the IGCC is to reduce the overall volume of activated balancing reserves in Europe and national
balancing markets by avoiding simultaneous counter-activation of balancing reserves (AST, Elering &
Litgrid, 2020). This highlights how Lithuania will be required to become increasingly active in the
balancing market, contrasting the state of play at present given the overarching Russian control of near-
term balancing prior to IPS/UPS synchronous area de-synchronisation.
Another recommendation outlined by the European commission is for the Baltic states to form a single
Load Frequency Control (LFC) block to enable FRR and RR to be dimensioned at a regional level, by
extension ensuring significant cost savings across the region. According to a the ‘Baltic Load-Frequency
Control block concept document’ published by the Baltic TSOs in September 2020, the companies have
made a proposal to make an LFC operational agreement by end-2024 to strengthen load frequency
balancing cooperation. As a result, we expect the opening of new balancing markets in Lithuania, and
participation in EU initiatives and platforms, will unlock avenues for a broader flexibility application in the
market. By facilitating the participation of various forms of flexibility to fulfil different balancing market
roles, the scope for their implementation will improve.
6.4 Flexibility Market Background: Defining Relevant Flexibility
Solutions
The need for implementing flexibility solutions will increase as the renewables supply in Lithuanian
expands, both for short-term and long-term power supply balancing. This section will delve into more
detail on the most important flexibility solutions that will be at Lithuania’s disposal, and how these solve
the challenges associated with intermittent power generation. This will then feed into chapter eight, in
which we will outline different scenarios for flexibility-use in which the below resources will be
implemented to different degrees in our model, and the corresponding results of such scenarios.
6.4.1 Renewable Energy Generation Flexibility
The rapid increase in intermittent renewable energy power generation in Lithuania will lead to more
protracted periods of power generation supply and demand mismatch. However, while this supply
volatility creates challenges for system frequency control, we also stress that renewables generation also
can support in dealing with these challenges.
In Lithuania, this is the most relevant for the wind power sector, which will comprise a majority of power
generation across our three power generation scenarios. The traditional goals of wind power control
systems have been to maximize power generation output and protect system components. However,
legislation is increasingly requiring generators to also adjust their operations to support the electricity
grid. Accordingly, the importance of wind turbines actively controlling their power output to support
frequency control is set to grow in prominence. This can be done through:

Page 71 of 138
DNV GL - Scenario Building for the Evolution of Lithuanian Power Sector for 2020-2050 litgrid test
- By keeping margins in the active generation: Wind generators can underschedule in the
hour-ahead energy market, meaning they can hold some of their expected output for reserves.
Additional wind energy is then available for mitigating forecast errors and other system
uncertainties.
- Regulating downwards (curtailment): Wind generators can regulate output downwards, thus
curtailing output, at limited additional cost.
- Pitch control: The pitch angle of a wind turbine can be adjusted to reduce output and optimised
to increase output.
6.4.2 Stationary Batteries
Stationary battery storage facilities provide services in terms of absorbing surplus electricity supplies and
plugging supply deficits. This battery capacity is assumed to be grid-connected and is thus not limited in
their use to PV solar home installations or renewables facilities. The stationary batteries are assumed to
be able to consume and store power for a duration of about five hours of maximum capacity, and feed
back to the grid at the same capacity for the same duration of time. We have modelled the batteries to
make up 100MW of capacity respectively, implying that they can store a total of 500MWh.
As this segment can balance the power supply over seconds to hours, they can participate in a number
of balancing markets. However, longer periods of renewables supply surpluses or deficits require
complementary balancing solutions to ensure energy security. The multitude of short-term balancing
applications for battery storage creates numerous potential markets for the segment – depending on
market needs and technology specifics. The share of renewable energy in a power system, coupled with
the availability of alternative balancing solutions, is key to dictating the application of technology.
A large battery storage project is initiated in Lithuania, with four 50 MW batteries with at least 200 MWh
storage capacity. It is planned to be built by the end of 2021 to prepare for the desynchronization of the
IPS/UPS in 2025 (Reuters, 2020). Before this the battery storage system will be used for security and
stability in case of emergency event, and after desynchronization for FCR and FRR. As the power market
model in this project is simulating the wholesale market, batteries dedicated to FCR and FRR are not
included in the scenarios (see also section 7.5).

Page 72 of 138
DNV GL - Scenario Building for the Evolution of Lithuanian Power Sector for 2020-2050 litgrid test
Figure 33: EV electricity demand projection (left) and capacity profile (right)
The assumed storage duration of 5 hours is based on an increasing need for longer-duration batteries as
the trend is for battery business models to shift from frequency response as a primary application to
price arbitrage (DNV GL, 2020). As the share of wind power capacity in Lithuania increases, the need for
grid-connected storage increases. The scenarios for installed battery capacity in Lithuania follows the
TYNDP 2020 scenarios to 2040 and continues the growth to 2050. In the National Trends scenario, the
battery capacity grows from 0 MW in 2030 to 900 MW in 2050, In the two other scenarios 100 MW of
installed capacity is assumed by 2030, increasing to 300 and 700 GW for the Centralised Energy and
Distributed Energy scenarios, respectively. The installed capacity and storage duration are not based on
optimisation, and other combinations and sizes may be preferred solutions for Lithuania towards 2050.
The business case for batteries is discussed in chapter 8.3.
6.4.3 Electric Vehicles
Electric vehicles (EV) will become an increasingly important provider of flexibility services through
flexible charging and eventually vehicle-to-grid (V2G) solutions as the Lithuanian EV fleet and
accompanying charging infrastructure expands. Flexible charging, outside of peak power demand, will
enable the EV fleet to absorb power supply surpluses. For EV owners, this will reduce electricity bills by
the charging taking part during hours with more electricity supply and as a result lower price. Eventually,
V2G will enable grid feed-in during supply deficit periods. EV owners will benefit from charging their EVs
during periods of low electricity prices and selling portions of the electricity back during higher prices. As
such, EVs can over time play a similar role to power supply balancing as that of stationary battery
storage installations.
Our assumptions on the evolution of EVs as a flexibility provider in Lithuania include that a small
percentage of grid connected EV battery capacity is available for V2G purposes, following the availability
profile in the figure below. The availability profile is based on what times of day EVs are expected to be
connected used for driving and connected to the grid. The capacity for V2G increases from 0 to 10% of
total EV charging capacity 2030 and remains at 10% towards 2050. This means that a maximum of 10%
of EVs are assumed to be able to deliver V2G services as long as they also charge and store the daily
electricity demand for driving. The flexibility in the EV charging increases towards throughout the
modelling timeframe:
– 2020-2029: EVs have limited charging flexibility
– 2030-2050: EVs are able to shift charging hours within the day

Page 73 of 138
DNV GL - Scenario Building for the Evolution of Lithuanian Power Sector for 2020-2050 litgrid test
The main differences between the EV batteries and the stationary batteries are the limited availability of
EVs, and the assumptions that EVs have a slightly higher charge and discharge efficiency than stationary
batteries. As such, the model chose EV charge and discharge over stationary batteries when the EVs are
grid connected. This will utilize the V2G capacity that is assumed to become available without additional
investment costs when the share of EVs in Lithuania increase.
6.4.4 Demand-Side Flexibility
In addition to flexibility from EV charging, demand side flexibility can involve either shifting demand
within a (short) period of time, or load reduction, where demand is shut off for a certain amount of time
when the price reaches a certain level. The former is often a preferred economic proposition, given that
there can be high associated costs with load curtailment in cases where it can lead to a halt in business
activities. However, with increasing consumer flexibility, voluntary load reduction can offer substantial
scope for economic optimisation of power consumption. Demand curtailment and/or shifting can be
provided by consumers, but industry could provide these services in greater concentration. Electricity
intensive industries could be possible providers of demand response solutions.
Figure 34: Load curtailment versus load shifting
6.4.4.1 Load shifting
A demand category that is suitable for demand side flexibility is demand for electric heating, which in
most cases, i.e. hot water heating or heating of buildings, can be shifted for a few hours without making
a significant difference. To make electric heating more flexible, thermal storage systems – for example
within district heating systems - can be used to help with balancing. Some flexibility in electric heating is
included in our model, where heating can be shifted from higher price hours to lower price hours. This is
expected to happen automatically based on price signals, like the flexible EV charging. The electric heat
capacity assumed available for shifting gradually increases towards 2050.
6.4.4.2 Load curtailment
Load curtailment or load shedding is consumers that can reduce part of their consumption when prices
reach a certain level (called the ‘activation price’). Load shedding is often assumed to be industrial load.
In our power market model this option is available, but it is expensive and has limited capacity to
provide the market. A study on demand response in Lithuania (Ea Energy Analyses, 2018) presents the
potential for demand reduction from industrial consumers to be limited to only a few MW, with
availability depending on the season. Hence it is assumed that load curtailment will not happen in
Lithuania, as this is forecasted to be too costly and would have to happen at very high price levels. It
Time
Consum
pti
on
Load curtailment
Time
Consum
pti
on
Load shifting

Page 74 of 138
DNV GL - Scenario Building for the Evolution of Lithuanian Power Sector for 2020-2050 litgrid test
must be emphasised though, which will be clarified in chapter 7, that without any other flexibility in the
system, load curtailment might be the only solution to maintain system balance in supply deficit hours.
Based on the Belgian TSO Elia’s Demand Side Management (DSM) methodology (Elia, 2017), the total
available capacity in a country for load curtailment (which for Lithuania is assumed to be zero) can be
split into different categories with different activation duration, bid capacity and price. This is shown in
13, which makes it clear that for load curtailment to happen, the power price must reach very high levels.
Table 13: DSM methodology
Category number 1 2 3 4 5 6 7
Activation duration [hours] 1 4 2 2 4 4 no limit
Activation price [EUR/MWh] 1500 1200 900 600 400 200 150
Share of total Market response volume 10% 10% 25% 10% 30% 10% 5%

Page 75 of 138
DNV GL - Scenario Building for the Evolution of Lithuanian Power Sector for 2020-2050 litgrid test
6.4.5 Interconnectivity
As Lithuania transitions towards utilizing greater volumes of vRES electricity in its power generation mix,
electricity interconnectivity will play a key flexibility role in ensuring that the market can export supply
surpluses and import electricity to plug deficits. The overarching objective of completing the
synchronisation with the European energy system by 2025 will be a key driver of interconnectivity
investment in the near-term, notably through expanded capacity to Poland.
Increased interconnection capacity is considered as one of the flexibility solutions to ensure system
adequacy and contribute to supporting the business case of intermittent renewable generation. In 2040,
we forecast that interconnection capacity to Poland will expand further (from 700 to 1200 MW),
reflecting how rising flows of electricity between the two markets will be key to facilitating the steady
forecasted increase in renewables generation in the Lithuanian market. The extent of increasing
interconnection capacity available to support system adequacy is depicted in Figure 35. However, the
extent of how much new interconnection capacity should be implemented in order to achieve the optimal
mix of flexibility capacity from interconnections will depend on the power generation situation in the
relevant exporting country. In periods with low renewable generation in Lithuania there will likely be low
renewable generation in the neighbouring countries as well, meaning reduced import possibilities. This
will be reflected in the interconnector’s utilization ratio and market prices between interconnected
bidding zones.
Figure 35: Lithuania import and export capacity
0
500
1000
1500
2000
2500
3000
2020 2025 2030 2035 2040 2045 2050
MW
Importing capacity to Lithuania
LT-LV LT-SE LT-PL
0
1000
2000
3000
2020 2025 2030 2035 2040 2045 2050
MW
Exporting capacity from Lithuania
LT-LV LT-SE LT-PL
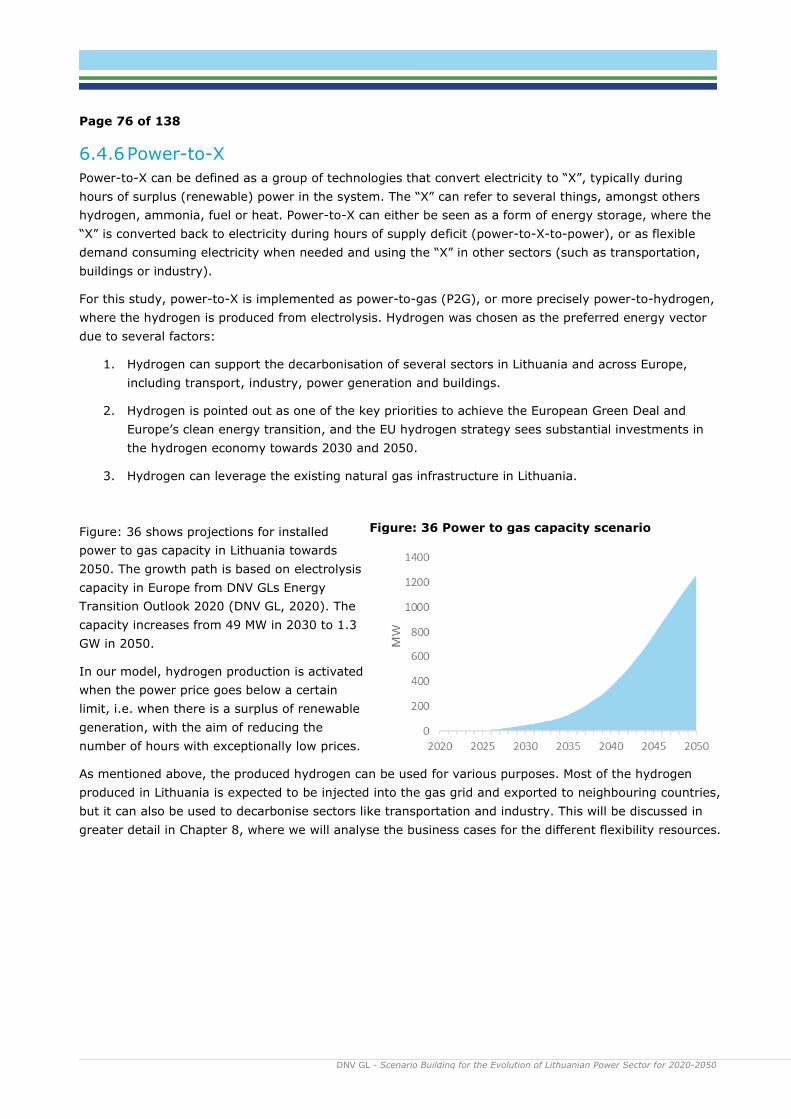
Page 76 of 138
DNV GL - Scenario Building for the Evolution of Lithuanian Power Sector for 2020-2050 litgrid test
6.4.6 Power-to-X
Power-to-X can be defined as a group of technologies that convert electricity to “X”, typically during
hours of surplus (renewable) power in the system. The “X” can refer to several things, amongst others
hydrogen, ammonia, fuel or heat. Power-to-X can either be seen as a form of energy storage, where the
“X” is converted back to electricity during hours of supply deficit (power-to-X-to-power), or as flexible
demand consuming electricity when needed and using the “X” in other sectors (such as transportation,
buildings or industry).
For this study, power-to-X is implemented as power-to-gas (P2G), or more precisely power-to-hydrogen,
where the hydrogen is produced from electrolysis. Hydrogen was chosen as the preferred energy vector
due to several factors:
1. Hydrogen can support the decarbonisation of several sectors in Lithuania and across Europe,
including transport, industry, power generation and buildings.
2. Hydrogen is pointed out as one of the key priorities to achieve the European Green Deal and
Europe’s clean energy transition, and the EU hydrogen strategy sees substantial investments in
the hydrogen economy towards 2030 and 2050.
3. Hydrogen can leverage the existing natural gas infrastructure in Lithuania.
Figure: 36 shows projections for installed
power to gas capacity in Lithuania towards
2050. The growth path is based on electrolysis
capacity in Europe from DNV GLs Energy
Transition Outlook 2020 (DNV GL, 2020). The
capacity increases from 49 MW in 2030 to 1.3
GW in 2050.
In our model, hydrogen production is activated
when the power price goes below a certain
limit, i.e. when there is a surplus of renewable
generation, with the aim of reducing the
number of hours with exceptionally low prices.
As mentioned above, the produced hydrogen can be used for various purposes. Most of the hydrogen
produced in Lithuania is expected to be injected into the gas grid and exported to neighbouring countries,
but it can also be used to decarbonise sectors like transportation and industry. This will be discussed in
greater detail in Chapter 8, where we will analyse the business cases for the different flexibility resources.
Figure: 36 Power to gas capacity scenario

Page 77 of 138
DNV GL - Scenario Building for the Evolution of Lithuanian Power Sector for 2020-2050 litgrid test

Page 78 of 138
DNV GL - Scenario Building for the Evolution of Lithuanian Power Sector for 2020-2050 litgrid test
7 SYSTEM ADEQUACY ASSESSMENT: INTRODUCING THREE LEVELS OF FLEXIBILITY TO THE LITHUANIAN POWER MARKET
7.1 Introduction
Building on the takeaways from the background discussion in chapter 6, we will in this chapter identify to
what extent flexibility resources will play a role in dealing with the challenges associated with an
increasingly intermittent power generation mix in Lithuania over the coming decades, as outlined in the
National Trends scenario identified in chapter 4 and 5. We will then highlight how the various flexibility
solutions identified in chapter 6 can help solve these challenges. These discussions will focus on solving:
• Surplus Supply Week: We have identified weeks with substantial power generation surplus,
driven by output from the wind power segment. Supply surplus is seen primarily towards 2040
and 2050, in tandem with the deployment of more wind capacity. The key role of flexibility
resources in such a week will be to export surplus energy or absorb it either through
consumption or storage solutions that shifts the energy to periods with less generation.
• Supply Deficit Week: This week entails a period when renewables generation is particularly low
while the load is high, meaning that there can be a mismatch between supply and demand. This
dynamic becomes more challenging over time as conventional generation is switched off and
replaced with intermittent renewables and the electricity demand increases. The key role of
flexibility will be to shift load to periods of higher generation, ramp up electricity imports from
Sweden, Latvia and Poland and to release energy stored from surplus periods.
In order to identify the relevant flexibility resource needs in Lithuania related to dealing with energy
surpluses and deficits leading up to 2050, and assessing the impact of such resources, we have
developed and modelled three specific flexibility cases that are based on our National Trends
Scenario for power generation7. The three cases will showcase how the availability of various levels
of flexibility resources – from low to high - can, to different extents, aggravate or solve the challenges
associated with an increasingly renewables-based power generation mix in Lithuania in weeks
characterised by energy surplus or deficits. The three cases discussed in this chapter are as follow:
1. Low Flexibility (’Low Flex’): In this scenario, only existing forms of flexibility such as power
plant response (including pumped hydro storage) and interconnectivity are taken into account.
As such, the variability in sunshine or wind conditions will yield a combination of very high and
zero electricity prices, depending of energy deficit and surplus periods respectively. Protracted
periods of very high prices skew the average price to close to EUR 90/MWh by 2050. We will
provide 2050 snapshots of surplus and deficit weeks to illustrate how deep the challenges would
become with a minimum of flexibility resources being available.
2. Medium Flexibility (’Medium Flex’ - all flexibility solutions except for Power-to-gas
(P2G)): Flexibility solutions such as stationary batteries, electric vehicle V2G, increased
interconnectivity and demand side solutions are integrated to absorb supply peaks and plug
supply deficits – leading to less supply volatility and lower average electricity prices. We will
provide snapshots on the evolution of the surplus and deficit weeks in 2030, 2040 and 2050 and
the use of flexibility resources in this section. The flexibility solutions introduced in the Medium
Flex case will address the challenges associated with the deficit week in the ’Low Flex’ case. That
7 The same flexibility cases are applied for all the countries in the model.
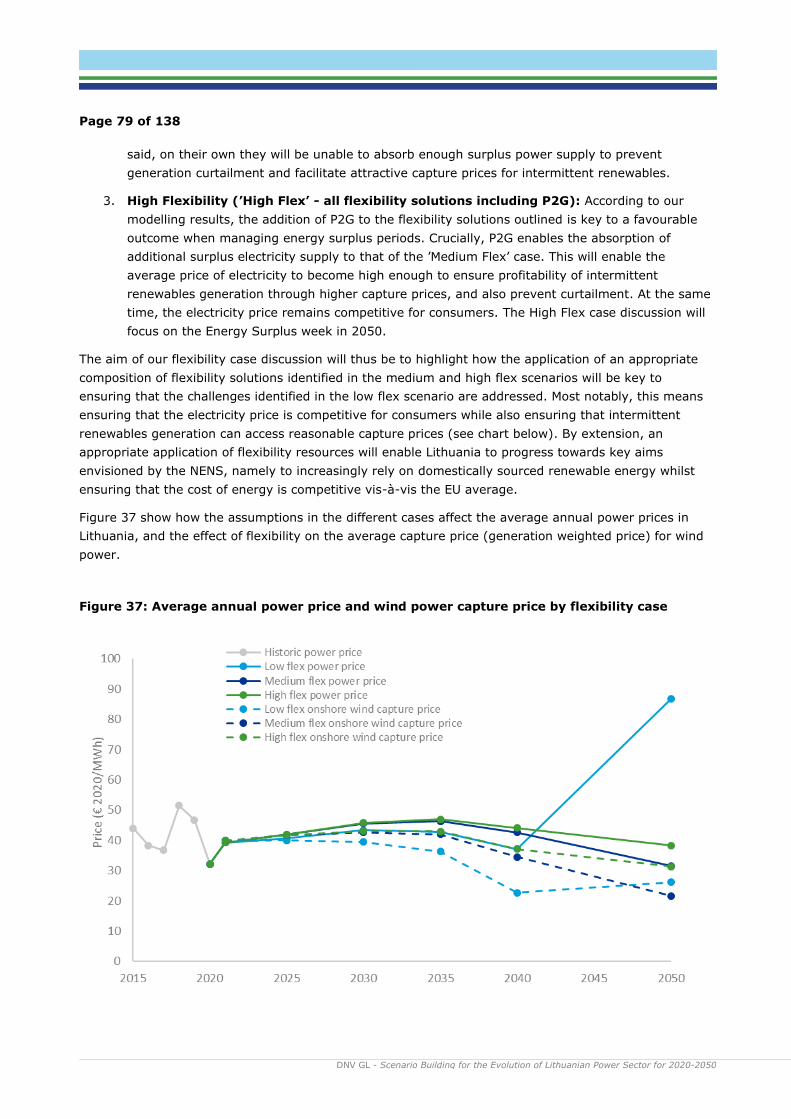
Page 79 of 138
DNV GL - Scenario Building for the Evolution of Lithuanian Power Sector for 2020-2050 litgrid test
said, on their own they will be unable to absorb enough surplus power supply to prevent
generation curtailment and facilitate attractive capture prices for intermittent renewables.
3. High Flexibility (’High Flex’ - all flexibility solutions including P2G): According to our
modelling results, the addition of P2G to the flexibility solutions outlined is key to a favourable
outcome when managing energy surplus periods. Crucially, P2G enables the absorption of
additional surplus electricity supply to that of the ’Medium Flex’ case. This will enable the
average price of electricity to become high enough to ensure profitability of intermittent
renewables generation through higher capture prices, and also prevent curtailment. At the same
time, the electricity price remains competitive for consumers. The High Flex case discussion will
focus on the Energy Surplus week in 2050.
The aim of our flexibility case discussion will thus be to highlight how the application of an appropriate
composition of flexibility solutions identified in the medium and high flex scenarios will be key to
ensuring that the challenges identified in the low flex scenario are addressed. Most notably, this means
ensuring that the electricity price is competitive for consumers while also ensuring that intermittent
renewables generation can access reasonable capture prices (see chart below). By extension, an
appropriate application of flexibility resources will enable Lithuania to progress towards key aims
envisioned by the NENS, namely to increasingly rely on domestically sourced renewable energy whilst
ensuring that the cost of energy is competitive vis-à-vis the EU average.
Figure 37 show how the assumptions in the different cases affect the average annual power prices in
Lithuania, and the effect of flexibility on the average capture price (generation weighted price) for wind
power.
Figure 37: Average annual power price and wind power capture price by flexibility case
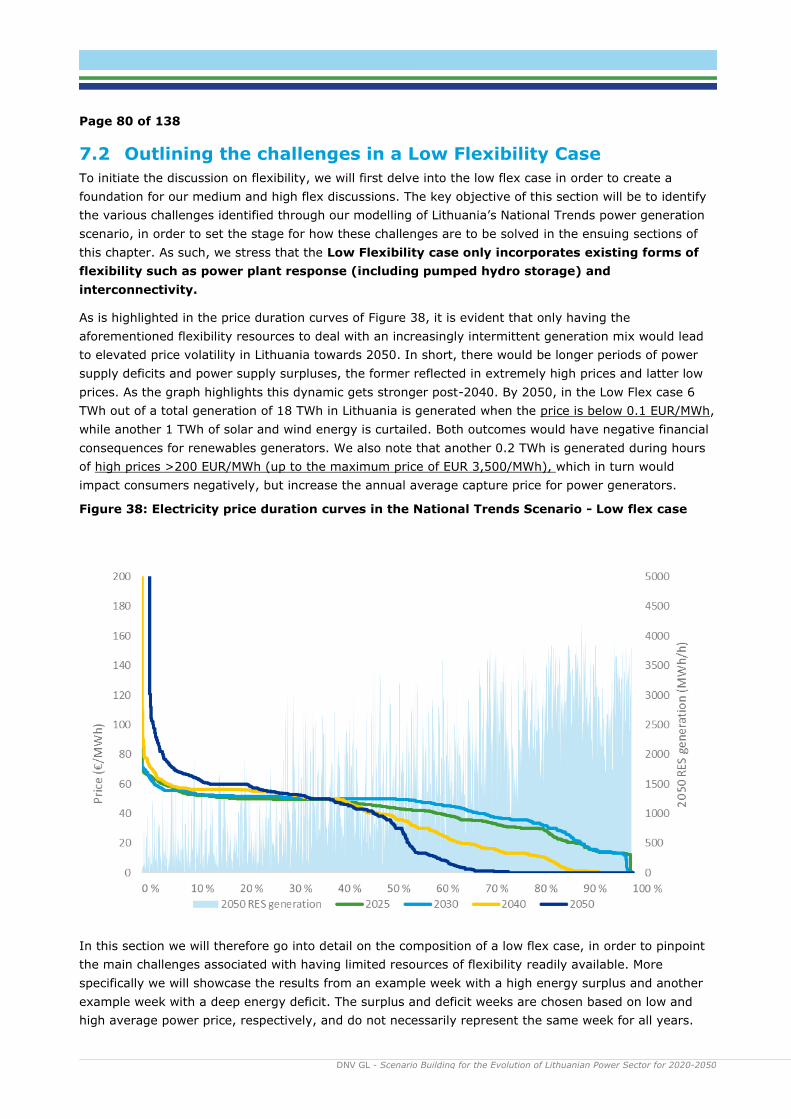
Page 80 of 138
DNV GL - Scenario Building for the Evolution of Lithuanian Power Sector for 2020-2050 litgrid test
7.2 Outlining the challenges in a Low Flexibility Case
To initiate the discussion on flexibility, we will first delve into the low flex case in order to create a
foundation for our medium and high flex discussions. The key objective of this section will be to identify
the various challenges identified through our modelling of Lithuania’s National Trends power generation
scenario, in order to set the stage for how these challenges are to be solved in the ensuing sections of
this chapter. As such, we stress that the Low Flexibility case only incorporates existing forms of
flexibility such as power plant response (including pumped hydro storage) and
interconnectivity.
As is highlighted in the price duration curves of Figure 38, it is evident that only having the
aforementioned flexibility resources to deal with an increasingly intermittent generation mix would lead
to elevated price volatility in Lithuania towards 2050. In short, there would be longer periods of power
supply deficits and power supply surpluses, the former reflected in extremely high prices and latter low
prices. As the graph highlights this dynamic gets stronger post-2040. By 2050, in the Low Flex case 6
TWh out of a total generation of 18 TWh in Lithuania is generated when the price is below 0.1 EUR/MWh,
while another 1 TWh of solar and wind energy is curtailed. Both outcomes would have negative financial
consequences for renewables generators. We also note that another 0.2 TWh is generated during hours
of high prices >200 EUR/MWh (up to the maximum price of EUR 3,500/MWh), which in turn would
impact consumers negatively, but increase the annual average capture price for power generators.
Figure 38: Electricity price duration curves in the National Trends Scenario - Low flex case
In this section we will therefore go into detail on the composition of a low flex case, in order to pinpoint
the main challenges associated with having limited resources of flexibility readily available. More
specifically we will showcase the results from an example week with a high energy surplus and another
example week with a deep energy deficit. The surplus and deficit weeks are chosen based on low and
high average power price, respectively, and do not necessarily represent the same week for all years.

Page 81 of 138
DNV GL - Scenario Building for the Evolution of Lithuanian Power Sector for 2020-2050 litgrid test
This will then form the backdrop of a discussion on medium and high flexibility scenarios – and how they
can be solved through the introduction of flexibility resources.
7.2.1 Energy surplus week: Identifying the challenges
Firstly, we will delve into the characteristics of an energy surplus week in 2050 in a low flexibility case to
highlight how big the challenges associated with having an intermittent power generation mix can be
with a minimum of flexibility resources. Figure 39 shows the modelling results for generation, demand
and electricity price in an energy surplus week in Lithuania in 2050 in the low flex case. This is a winter
week with high wind power generation, and highlights how a substantial surplus in Lithuanian power
generation, driven by the wind power segment, impacts the power price over that week. The generation
above the black load line shows amount of energy exported to neighbouring countries, while the light
blue areas show curtailment of renewables. The power price (red line, left axis) is close to zero for most
hours, except for one price peak where wind generation is low.
In a power system increasingly based on intermittent wind and solar power, power generation will often
mismatch with electricity demand. When supply substantially exceeds demand, the power price drops to
zero, and power curtailment may be necessary to protect the integrity of the power system. Similar
weather patterns in neighbouring countries with increasing renewable share amplify the effect and
reduces the possibilities to export in surplus hours. This can have an adverse effect on wind and solar
project economics, as they require a set average electricity price per MWh (capture price) to be
profitable. In the early stages of renewables development, high technology cost meant that subsidies
covered the gap between the market price and the price needed to ensure profitability. As renewables
have now in many cases reached grid parity, such subsidies have been mostly phased out. This has in
turn made renewables generators exposed to merchant market risk. To address the issue of oversupply,
zero prices and curtailment, by extension supporting generator profitability, additional power demand
that can flexibly absorb power supplies must be introduced.

Page 82 of 138
DNV GL - Scenario Building for the Evolution of Lithuanian Power Sector for 2020-2050 litgrid test
Figure 39: Low flex case, production, load and price during energy surplus week in 2050
7.2.2 Energy deficit week: Identifying the challenges
In stark contrast to the energy surplus week, an energy deficit week is characterised by very limited
output from Lithuania’s wind power segment, due to weather conditions. Similar weather conditions in
neighbouring countries makes the effect stronger and in the worst case limit import availability. Supply
deficit periods become and increasing challenge as renewables capacity and electricity demand increases.
This can lead to extreme power price peaks due to demand outstripping supply, dramatically increasing
the electricity price. This is evident in Figure 40, which shows modelling results for the electricity price in
a deficit week in 2030, 2040 and 2050. It shows that in 2050, the low flexibility case would regularly
yield prices as high as EUR 3,500/MWh in 2050 (which is the value for lost load).

Page 83 of 138
DNV GL - Scenario Building for the Evolution of Lithuanian Power Sector for 2020-2050 litgrid test
Figure 40: Low Flex case - Power price in an energy deficit week in 2030, 2040 and 2050.
Figure 41 shows modelling results for generation, load and price for the energy deficit week in the low
flex case 2050. The blue area shows that there is limited wind generation over this period, with
electricity imports from Sweden, Latvia and Poland making up a large portion of supply. Deficit periods
can be addressed through supplying stored electricity from periods of surplus generation and facilitating
such energy shifting will be an increasingly important role for flexibility resources. Other ways to address
the challenges in a deficit week are through the import of electricity, as well as reducing demand through
demand-side flexibility solutions.

Page 84 of 138
DNV GL - Scenario Building for the Evolution of Lithuanian Power Sector for 2020-2050 litgrid test
Figure 41: Low flex case: Production, load and price during energy deficit week in 2050
7.3 Outlining challenges and solutions in a medium flexibility case
The low flexibility case highlights the substantial challenges that would face Lithuania in a scenario where
limited flexibility resources would be available to balance an increasingly intermittent power supply.
However, there are a number of flexibility solutions not applied in the low flexibility scenario available to
date, and new technologies set to reach maturity over the coming decades. As such, this section will
assess what and how flexibility resources can address such challenges through a combination of energy
storage absorbing and shifting surplus power generation to deficit periods, and the demand-side
responding to energy supply dynamics.
In line with this, we will showcase how introducing an increased level of flexibility resources in Lithuania,
and surrounding markets in Europe, will alter the results of the energy surplus and deficit weeks
assessed in the low flexibility scenario. In line with this, the medium flexibility case introduces the
following flexibility resources vis-à-vis the low flexibility case:
• Stationary battery storage and EV vehicle-to-grid, as described in section 6.4.2 and 6.4.3
• Higher levels of interconnectivity, as described in in 6.4.5.
• Demand-side flexibility as described in 6.4.4
In short, by assessing the price duration curves for the Medium Flex case in Figure 42 it is evident that
the aforementioned flexibility resources help address the long durations of high prices in 2040 and 2050.
In fact, in 2040 the peak price is reduced to 96 EUR/MWh and in 2050, the number of hours when the
power price exceeds EUR200/MWh reduced to 24. This highlights that flexible load and energy supply
shifting can address supply deficit challenges. On the other hand, it is evident in the chart below that
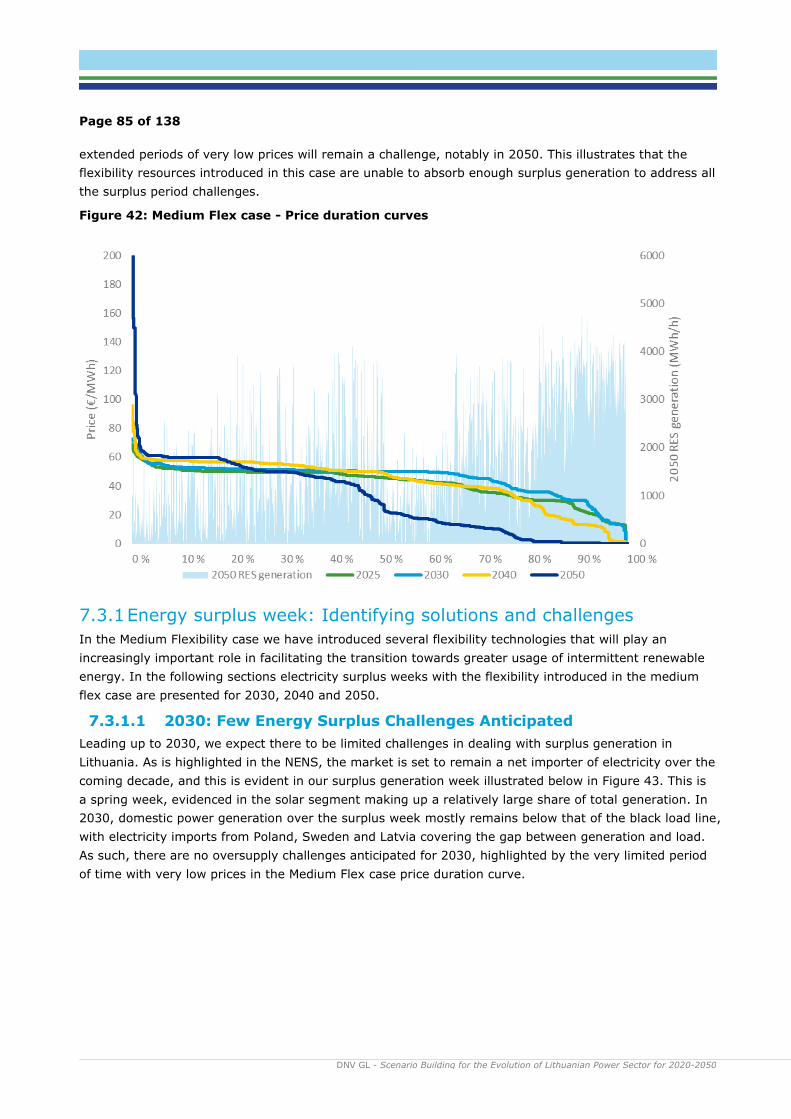
Page 85 of 138
DNV GL - Scenario Building for the Evolution of Lithuanian Power Sector for 2020-2050 litgrid test
extended periods of very low prices will remain a challenge, notably in 2050. This illustrates that the
flexibility resources introduced in this case are unable to absorb enough surplus generation to address all
the surplus period challenges.
Figure 42: Medium Flex case - Price duration curves
7.3.1 Energy surplus week: Identifying solutions and challenges
In the Medium Flexibility case we have introduced several flexibility technologies that will play an
increasingly important role in facilitating the transition towards greater usage of intermittent renewable
energy. In the following sections electricity surplus weeks with the flexibility introduced in the medium
flex case are presented for 2030, 2040 and 2050.
7.3.1.1 2030: Few Energy Surplus Challenges Anticipated
Leading up to 2030, we expect there to be limited challenges in dealing with surplus generation in
Lithuania. As is highlighted in the NENS, the market is set to remain a net importer of electricity over the
coming decade, and this is evident in our surplus generation week illustrated below in Figure 43. This is
a spring week, evidenced in the solar segment making up a relatively large share of total generation. In
2030, domestic power generation over the surplus week mostly remains below that of the black load line,
with electricity imports from Poland, Sweden and Latvia covering the gap between generation and load.
As such, there are no oversupply challenges anticipated for 2030, highlighted by the very limited period
of time with very low prices in the Medium Flex case price duration curve.

Page 86 of 138
DNV GL - Scenario Building for the Evolution of Lithuanian Power Sector for 2020-2050 litgrid test
Figure 43: Medium flex case - Generation, load and power price - Energy surplus week in 2030
7.3.1.2 2040: Low Prices Increasingly Common
By 2040 our model results show that the surplus supply situation in Lithuania has changed, with supply
exceeding load. This in turn reflected in lower prices over the selected surplus week – namely week 1.
The large share of wind power of total generation over this week is a result of higher wind generation
and lower solar generation over the winter months. Figure 44 showcases a load line that is more
responsive to supply fluctuations over the week than what was the case for the Low Flex case, the low
price indicates that not enough electricity is absorbed to account for the large supply. This is also
indicative of surplus periods also leading to low prices in neighboring markets, with electricity exports
being unable to bolster Lithuanian power prices during most of this week. As such, the flexibility
resources available are unable to boost demand flexibility enough to support higher prices – by
extension hitting the electricity capture price registered for renewables generation assets.
Figure 44: Medium flex case - Generation, load and power price - Energy surplus week in 2040

Page 87 of 138
DNV GL - Scenario Building for the Evolution of Lithuanian Power Sector for 2020-2050 litgrid test
Figure 45: Medium flex case - Generation, load and power price - Energy surplus week in 2050
7.3.1.3 2050: Deepened Surplus Challenges
By 2050, the challenges identified for 2040 have deepened further according to our results. While the
Medium Flex case helps to reduce the extent of issues associated with power supply curtailment,
extreme electricity price volatility and zero prices evident in the Low Flex case, it is not enough to avoid
curtailment and long periods of zero prices. This is shown in Figure 45 of generation, power price and
decomposition of load for week 1 in 2050.
The combination of pumped hydro storage, stationary batteries, EV V2G and demand side flexibility play
a key role in absorbing surplus electricity and shifting it to periods with less supply in the system. As can
be seem in the right figure the EV load (which is both electricity used for driving and for V2G) and the
stationary battery storage facilities play a key role in absorbing power generation peaks. However, this is
insufficient to deal with the large power surpluses available in the system over this time-period,
suggesting that additional flexibility measures are required to increase the power price and eliminate
curtailment.
As a result, the medium flexibility case yields an average electricity capture price for onshore wind
generation of EUR22/MWh in 2050 – even below that of the Low Flex case. This is the result of flexibility
resources being insufficient to stimulate enough demand to substantially support the electricity price
over surplus weeks.
7.3.2 Energy Deficit Week: Identifying solutions and challenges
The electricity price duration curves for the Medium Flex case highlights that the flexibility resources
introduced in this case can help to substantially reduce the extent and duration of peak electricity prices
in Lithuania leading up to 2050. Notably, by 2050, our results indicate that the power price only will
exceed EUR200/MWh for 24 hours through the year. The following sections present electricity deficit

Page 88 of 138
DNV GL - Scenario Building for the Evolution of Lithuanian Power Sector for 2020-2050 litgrid test
Figure 46: Medium flex case - Generation, load and power price - Energy deficit week in 2030
weeks for 2030, 2040 and 2050, and how the flexibility implemented in the medium flex case help solve
the challenges presented in section 7.2.2.
7.3.2.1 2030: Imports key to plug deficit
In the Energy deficit week in the Medium Flex case in 2030, it is clear that power generation output is
very low throughout the week. The key to plugging these deficits will again be the import of electricity
from neighboring markets, as is evident in the chart below. This ensures that the power price remains
stable throughout the week, though at a relative high level, and that no substantial price peaks are
evident. As is visualized by the black load line, the load remains steady throughout the week – with
flexibility resources outside of electricity imports playing a relatively negligible part.
7.3.2.2 2040: Flexibility resources playing a more important role
In comparison to the 2030 week, it is clear in the 2040 deficit week that flexibility resources are playing
a more outsized role. While imports remain key to plugging supply gaps, the black load line is more
responsive to the supply situation. The first load peak around hour 65 – as is illustrated in the
decomposition of load - in part the result of battery charging. The price peak that follows is in turn met
by batteries discharging – helping to curb further price increases. Over the same timeframe, EV V2G is
also calibrating its charge and discharge in order to capitalize on electricity price differences, by
extension supporting the stability of the power system. This highlights how the flexibility resources
introduced in the Medium Flex case can appropriately deal with a deficit week in 2040, according to our
modelling results.

Page 89 of 138
DNV GL - Scenario Building for the Evolution of Lithuanian Power Sector for 2020-2050 litgrid test
Figure 47: Medium flex case - Generation, load and power price - Energy deficit week in 2040
7.3.2.3 2050: Substantial flexibility resources curbing price peaks
Naturally, the supply situation in 2050 will be characterized by Lithuania having a higher load and more
supplies of intermittent renewables generation to contend with than in previous decades. A more
detailed breakdown of the gap between generation and load and how this is dealt with in 2050 is
provided in Figure 48. In 2050, it is again clear that imports will play the most important part in plugging
the supply deficit over this period, with extensive imports from Sweden, Latvia and Poland being
registered in our modelling results. At the same time, a much more flexible load in Lithuania and Europe
more generally compared to that of the Low Flex case is key to reducing price peaks over the deficit
week.
Figure 48: Medium flex case - generation, load and price – energy deficit week in 2050

Page 90 of 138
DNV GL - Scenario Building for the Evolution of Lithuanian Power Sector for 2020-2050 litgrid test
Our results show that the peak price registered over this week in 2050 is reduced from the protracted
periods of EUR3,500/MWh that were evident in the Low Flex case, to only one peak of about
EUR500/MWh. This substantial improvement is the result of a combination of increased electricity import
access from adjacent markets, the injection of power supplies shifted from energy surplus periods by
EVs and batteries to the grid, and demand-side load shifting. Figure 49 shows the decomposition of
electricity consumption in the deficit week in 2050.
Furthermore, the scope for energy storage supply shifting and demand-side load shifting also contribute
to reducing the periods of close to zero prices evident in the Low Flexibility scenario. This dynamic is
evident in the figure above with battery storage and V2G generating power during periods of limited
renewables generation. Furthermore, the decomposition of load – illustrated in the figure below –
showcases how a more flexible load responds to supply fluctuations. Close to zero prices are only
registered at the end of the energy deficit week, being the result of a surge in wind power generation.
This does not, however, lead to power supply curtailment as in the Low Flex case, as the result of a more
flexible demand side that is able to increase load to capitalize on the lower prices.
Figure 49: Medium flex case – Decomposition of electricity consumption – energy deficit week in 2050
In summary, more infrequent and greatly reduced peak prices, in addition to raised bottom prices, in the
Medium Flex case energy deficit week scenario for 2050 vis-à-vis the Low Flex case is indicative of
significantly reduced power price volatility. Figure 50: Medium flex case - Flexibility effect on power price
during deficit week in 2050 highlights in more detail how a more flexible load and flexible generation
resources can respond effectively to price signals, by extension plugging supply deficits and absorbing
supply surpluses. The flexibility generation in Figure 50 includes battery and EV (V2G) discharge, while
the flexibility load includes battery and EV charge (both for driving and V2G), hydro pump load and
flexible heating.

Page 91 of 138
DNV GL - Scenario Building for the Evolution of Lithuanian Power Sector for 2020-2050 litgrid test
Figure 50: Medium flex case - Flexibility effect on power price during deficit week in 2050
7.4 Identifying surplus week solutions in a high flexibility case
The Medium Flex case highlights the importance of introducing flexibility resources to address the
challenges associated with an increasing reliance on intermittent renewable energy generation. By
enabling the absorption of surplus energy and shifting of such supplies to deficit periods, coupled with a
demand-side more responsive to electricity price signals, flexibility resources can help bridge the gap
between supply and demand in various scenarios – by extension supporting the introduction of more
renewable energy capacity and bolstering energy security.
In our Medium Flex case, it was evident that the combination of EV V2G, battery storage, demand-side
flexibility and increased interconnectivity would dramatically improve the results registered in the Low
Flex case. This was particularly noticeable in a deficit week, for which price volatility was substantially
reduced. That said, it was also clear that during surplus periods renewables generation curtailment and
low electricity prices would remain key pressure points, even with the introduction of the flexibility
resources. This would result in capture prices that are unsustainably low for renewable energy over the
duration of 2050. More flexibility resources than those incorporated in the Medium Flex case will
therefore be required to deal with energy surplus periods in a satisfactory manner as the Lithuanian (and
European) renewable energy reliance increases over the coming decades.
With this in mind, we will in this section showcase how the introduction of power-to-gas in a High Flex
case can help appropriately address the challenges identified in the Medium Flex surplus week. In short,
the added capacity of P2G production facilities, producing hydrogen through electrolysis, can absorb
additional surplus power generation on top of the resources already identified in the Medium Flex case.
In our model, we have integrated the P2G electrolysers to start consuming power for hydrogen
production when the price drops below EUR20/MWh. As the installed P2G capacity both in Lithuania and
the rest of Europe is forecasted to increase substantially towards 2050, this additional consumption will
lift almost all low prices up to 20 EUR/MWh. The substantially reduced duration of periods with very low

Page 92 of 138
DNV GL - Scenario Building for the Evolution of Lithuanian Power Sector for 2020-2050 litgrid test
electricity prices results in more favourable capture prices for renewable energy. This is reflected in the
High Flex price duration curve below, clearly visible for the 2050 curve where almost all the zero prices
from Figure 42 are raised to 20 EUR/MWh. As a result, we argue that the introduction of P2G will be key
to supporting the build-out of new renewables capacity, as envisioned by the NENS plan.
Figure 51: High Flex price duration curve
7.4.1 Energy surplus week: the impact of P2G
The key role of P2G in the High Flex case will be to support addressing the challenges associated with
surplus generation periods by adding to the capacity of flexibility resources to absorb such surpluses. In
line with Lithuania’s steadily expanding renewables generation supply, challenges associated with surplus
power generation will appear by 2040 and increase towards 2050. The positive impact of introducing
P2G on top of the flexibility resources available in the Medium Flex case is clearly illustrated in Figure 52
given that the black load line is even more responsive to generation output than what was the case in
the Medium Flex scenario. As a result, wind and solar curtailment is no longer necessary, while zero
prices are no longer evident with the bottom price again trending at around EUR20/MWh.

Page 93 of 138
DNV GL - Scenario Building for the Evolution of Lithuanian Power Sector for 2020-2050 litgrid test
Figure 52: High flex case - production, load and price - energy surplus week in 2050
In line with this, Figure 53 showcases how P2G load is adding to the flexible load provided by EVs and
battery storage. The generation peaks are in this case largely absorbed by P2G, reducing the importance
of battery storage to dealing with the highest generation peaks, as was evident in the Medium Flex case.
Figure 53: High flex case - decomposition of load - energy surplus week in 2050
The importance of flexible load in the High Flex case is further underscored in Figure 54, which
showcases that substantial volumes of generation is absorbed over the full duration of the week.
0
500
1000
1500
2000
2500
3000
3500
4000
4500
5000
0
10
20
30
40
50
60
1 6
11
16
21
26
31
36
41
46
51
56
61
66
71
76
81
86
91
96
10
1
10
6
11
1
11
6
12
1
12
6
13
1
13
6
14
1
14
6
15
1
15
6
16
1
16
6
MW
Pri
ce (
€/M
Wh
)
HourRegular load Residential heating Industrial heating EV load
Batteries load P2G load Hydro pump load Price

Page 94 of 138
DNV GL - Scenario Building for the Evolution of Lithuanian Power Sector for 2020-2050 litgrid test
Crucially, P2G enables the flexible load to absorb greater bulks of electricity over longer timeframes,
thereby preventing the zero prices evident in the Low and Medium Flex case, as is illustrated in the dark
blue (High Flex) and light blue (Low Flex) power price lines in the figure below. The price peak registered
in the Low flex case is also prevented, in line with energy storage resources being available to supply
electricity in response to higher prices.
Figure 54: High flex case - flexibility effect on power price - energy surplus week in 2050
7.5 System adequacy performance by scenario
System adequacy can be defined as the ability of a power system to satisfy demand – at all times. There
are several ways of assessing the system adequacy of a power system. In building up the scenarios and
flexibility cases above, we have observed four indicators of system stress for each of the projected
market equilibriums, further explained in section 7.5.2 below. Two of these indicators, the loss of load
expectation (LOLE) and the energy not served (ENS) are also observed by ENTSO-E. ENTSO-E
continuously develops methodologies to assess the system adequacy for the different members and
regularly publish methodology and adequacy forecast reports with LOLE and ENS numbers (ENTSO-E,
2019), see comparison in section 7.5.1.
A different approach to analyse system adequacy is to focus on the resources TSOs would need to
ensure security of supply and a resilient power system. In section 7.5.3 we assess system requirements
and balancing capabilities of the modelled electricity system for the different scenarios.
7.5.1 Analytical approach and comparison with ENTSO-E
The approach to system adequacy assessment in this report is based on extensive analyses by means of
DNV GL’s PLEXOS model of the European electricity market, with a special focus on the Lithuanian and
system. This is an electricity market model with hourly time resolution and a simplified description of the

Page 95 of 138
DNV GL - Scenario Building for the Evolution of Lithuanian Power Sector for 2020-2050 litgrid test
electricity networks, both of which are significant simplifications necessary to model and analyse
different scenarios for a 30-year period. Unfortunately, this implies that traditional system adequacy
analyses, e.g. as applied by ENTSO-E, is not a direct modelling result. Instead, we first use the modelling
results as far as they reach, to describe how ‘stressed’ the system is in the different scenarios.
Given the hourly resolution of our PLEXOS model, it is natural to conceive the results as a description of
future day-ahead or intraday market results. This also means that resources that are ‘fully occupied’ in
the model in a specific hour, can only deliver ancillary services like aFRR and mFRR to the extent it
complies with their (modelled) obligations in the day-ahead and intraday markets. Similarly, resources
that are meant for ancillary services, are not modelled in the PLEXOS model at all. Hence, the next and
final step in the adequacy analysis is to consider how reserve requirements can be met, taking into
account the obligations the resources then ‘already’ have in the day-ahead and organised markets.
Indicators for system stress are partly overlapping with ENTSO-E’s indicators for system adequacy, but
the method to calculate the indicators differ. ENTSO-E combines five different models in their adequacy
assessments, and vary important stochastic parameters such as wind and solar conditions, temperature,
precipitation, unscheduled outages, etc. using a Monte Carlo simulation to generate both expected
values as well as information about the probability distribution for key parameters (LOLE and ENS,
among others).
The ENTSO-E approach is thus truly probabilistic, while the approach in this report relies on the use of
expected or representative values for different data. However, it is worth mentioning that during the
process of preparing this report, we have analysed a number of variants of the final scenarios, typically
to test different ways to model e.g. storage or demand side flexibility. During this process, we have also
observed the indicators of system stress explained below. While the results of this is not reported, the
experience is that the reported numbers are representative for what we have seen in preliminary
modelling results.
7.5.2 Indicators of system stress
When developing the scenarios and the flexibility cases, we used ENTSO-E’s LOLE-indicator as a starting
point and added two more indicators to identify critical hours. In addition, the expected energy not
supplied in the hours with loss of load is listed. A ‘critical hour’ can be interpreted as an hour when there
is a risk of the demand not being met. In addition, we also observed the number of hours with prices
equal to zero. Both types of indicators are useful in power market modelling in order to design scenarios
that represent conceivable future market equilibriums.
The system stress indicators are listed below. Even though there is a strong correlation between the
different indicators, all are not necessarily met in the same hour.
1. Loss of Load Expectation (LOLE): This is the same indicator used by ENTSO-E, described as
number of hours per year for which the load is expected to exceed the available capacity
(European Commission, 2016). In DNV GL’s Plexos model, demand is met unless the price
exceeds 3500 EUR/MWh. The indicator is thus a count of the number of hours per year with
power price at 3500 EUR/MWh in Lithuania and is the closest we can get to a LOLE number using
DNV GL’s Plexos model.
2. Expected Energy Not Supplied (EENS): The amount of electricity demand which is expected
not to be met in a given year.

Page 96 of 138
DNV GL - Scenario Building for the Evolution of Lithuanian Power Sector for 2020-2050 litgrid test
3. Power prices exceeding a threshold of 200 EUR/MWh. In power market models based on
economic principles, scarcity of some sort would typically result in relatively high prices. To
observe how often there is some scarcity in the model, and then indirectly how close the system
might be to require a load curtailment, we count the number of hours with prices above 200
EUR/MWh.
4. Number of hours with reserve margin below 700 MW. As an indication of system stress, we
have counted the number of hours where the available, not utilized capacity in the model is
below 700 MW. The result illustrates the vulnerability of the system for unplanned outages; a
low score means the system has a higher reserve margin, all else equal. The motivation is an N-
1 approach: If one of the large units (either a generator or a transmission line) in the system
fails, and there is not enough available generation or import capacity to meet the requested
demand in that hour, security of supply is at risk. The largest unit in the system is the 700 MW
NordBalt HVDC interconnection link between Sweden and Lithuania.
Table 14 shows the scores of these system stress indicators for the different flexibility cases in the
National Trends scenario, as well as for the high flex cases of the the Centralised and Distributed Energy
scenarios for 2040 and 2050. Earlier years are not included in the table as modelling results showed no
hours fulfilling the indicators of system stress before 2040.
Table 14: Indicators of system stress in 2040 and 2050, by scenario and flexibility case
Adequacy
indicators
Year National Trends Centralised
Energy
(high flex)
Distributed
Energy
(high flex) Low
flex
Medium
flex
High
flex
Loss of Load
Expectation
(hours/year;
price =
3500EUR/MWh)
2040 7 0 0 0 0
2050 139 0 0 0 0
Expected Energy
Not Supplied
(GWh/year)
2040 0.02 0 0 0 0
2050 45.8 0 0 0 0
Number of hours
with relatively
high power-
prices (above
200 EUR/MWh)
2040 7 0 0 0 0
2050 146 24 24 25 24
Number of hours
with available
capacity less
than 700 MW
2040 13 0 0 0 0
2050 66 0 0 0 0

Page 97 of 138
DNV GL - Scenario Building for the Evolution of Lithuanian Power Sector for 2020-2050 litgrid test
The number of critical hours is drastically decreased when flexibility resources are implemented in the
system. In the low flex case, the lack of flexibility in the system leads to several critical hours, while
when batteries, V2G, demand side flexibility and increased interconnectivity is implemented in the
medium flex case, this number is drastically decreased. The power to gas that is added in the high flex
case does not make any difference to the critical hours, as this is only included as additional demand
when prices are low. This shows the importance of flexibility moving towards mid-century, both in terms
of energy storage and demand side flexibility, to avoid loss of load expectation. The price duration
curves for the different flexibility cases in Figure 55 also illustrates the difference in price volatility
between the three cases in the National Trends scenario.
Table 14 and Figure 55 show that that critical hours are mainly seen in the low flexibility case in 2050,
and that, with the indicators described above, system stress is not an issue when flexibility is introduced.
The Centralised Energy and Distributed Energy Scenario gives similar results on these system stress
measures, with only 24-25 hours with power price above 200 EUR/MWh in 2050, and no loss of load
expectation for any of the modelling years.
Figure 55: National Trends - Price duration curves in 2050 by flexibility case
7.5.3 System adequacy assessment
The objective of a system adequacy assessment is to assess to what extent a power system can
maintain, or contribute to maintaining, a stable frequency. To ensure a stable and resilient electricity
system, the system operator needs access to frequency resources and inertia. We start this assessment
with a description of the Lithuanian frequency resources and continue with an assessment of system
inertia in the different scenarios and flexibility cases.
Frequency resources

Page 98 of 138
DNV GL - Scenario Building for the Evolution of Lithuanian Power Sector for 2020-2050 litgrid test
The overall conclusion is that with the amount of flexible resources introduced in the high flexibility case
(batteries, EV’s and power-to-gas), providing frequency control will be feasible, despite the high share of
intermittent generating resources.
After the synchronisation with the Western European system by the end of 2025, Lithuania will be
responsible for ensuring access to resources as specified in Table 15. The synchronous area applies a
system of sharing of reserves. Each participant contributes with a share, such that the aggregated needs
are met in a cost-efficient manner. This implies that the contribution from each participant is lower than
the individual needs.
Table 15: Lithuania's resource requirements8
Resource Responsibility (MW)
(upward/downward)
FCR 9 / 9
aFRR 60 / 60
mFRR 226 / 276
RR n.a.
The above resource requirements must be met by local resources in Lithuania. Traditionally, most of
these services are delivered from conventional power plants in most electricity systems. But going
forward, it is expected that both demand side resources as well as intermittent renewable power
generation will be competitive resources applied in frequency management.
The capabilities of such electricity resources to ensure power reserves in terms of FCR, aFRR, mFRR and
RR (see Table 12) naturally varies across the scenarios and flexibility cases as well as over time during
the year, depending on in particular wind conditions. Table 16 below outlines the actual Lithuanian
resources in the National Trends scenario and how the provision of frequency resources might be split
between the sources. Two figures are given for frequency services - with wind available / without wind at
all. The Centralised Energy and Distributed Energy scenarios are identical with respect to hydropower
and thermal capacity, and thus have at least as good reserve capabilities as the National Trends scenario
without wind.
A reasonable share of the totally installed capacity is reserved for frequency reserves. E.g. biomass is
modelled as must-run for 50%, which gives reserves up to 0.5x210 MW = 105 MW upwards and
downwards, depending its commitment in the day-ahead and intraday market and the nature of the
must-run condition. To avoid double counting and to be conservative, we assume no contribution from
biomass.9 Pumped storage hydro (PS) is estimated to be able to provide +/- 30 % capacity, while run of
river (RoR) capability is normally very limited, and we do not count on it. If possible, it will provide an
option to reduce requirements on other sources.
Solar is not used for frequency control, although downward regulation during sunny days would be
possible.
8 The numbers are taken from a joint Baltic document; Baltic Load-Frequency Control block concept, dated 30/9-2020, and downloaded from
https://www.litgrid.eu/uploads/files/dir555/dir27/dir1/17_0.php. 9 This implies that plants using biomass and waste represent additional reserve potential.

Page 99 of 138
DNV GL - Scenario Building for the Evolution of Lithuanian Power Sector for 2020-2050 litgrid test
Natural gas is generally very good for control and is used for the FCR. In addition, a +/-10% allocation
can be made for aFRR and mFRR.
The installed capacities for 2030 are used as the basis for the reserve calculations. In future scenarios
(2040 and 2050) also batteries could be used to substitute other resources.
The split between aFRR and mFRR can be changed to more mFRR and less aFRR.
Table 16: Installed capacities and potential frequency resources (National Trends scenario)
Installed capacity [GW] Frequency service [MW]
Year/ Resource 2030 2040 2050
Upward With/without wind
Downward With/without wind
Biomass and waste
0.21 0.21 0.21
FCR 0/0 0/0
aFRR 0/0 0/0
mFRR 0/0 0/0
Onshore wind 0.51 0.51 2.20
FCR 0/0 0/0
aFRR 0/0 50/0
mFRR 0/0 50/0
Offshore wind 0.70 1.40 2.00
FCR 0/0 0/0
aFRR 0/0 70/0
mFRR 0/0 70/0
Hydro PS 1.13 1.13 1.13
FCR 0/0 0/0
aFRR 150/150 50/40
mFRR 150/150 250/260
Hydro ROR 0.13 0.13 0.13
FCR 0/0 0/0
aFRR 0/0 0/0
mFRR 0/0 0/0
Solar PV 0.90 1.25 1.60
FCR 0/0 0/0
aFRR 0/0 0/0
mFRR 0/0 0/0
Natural gas 0.46 0.46 0.46
FCR 9/9 (all the FCR) 9/9 (all the FCR)
aFRR 23/23 23/23
mFRR 73/73 23/23
Other non-RES 0.14 0.14 0.00
FCR 0/0 0/0
aFRR 0/0 0/0
mFRR 0/0 0/0
Batteries and EV V2G
0.20 + 0.11
0.50 + 0.47
0.90 + 0.70
FCR 0/0 0/0
aFRR 50/50 0/0
mFRR 54/54 0/0
Total
FCR 9/9 9/9
aFRR 223/223 193/63
mFRR 277/277 393/283

Page 100 of 138
DNV GL - Scenario Building for the Evolution of Lithuanian Power Sector for 2020-2050 litgrid test
System inertia
Another aspect to grid stability is the amount of inertia in the system. Inertia refers to the energy stored
in rotating mass, such as generators and industrial motors. These rotate at the same frequency as the
grid, acting as a buffer against rapid change. If, for example, demand for power spikes, the rotating
mass acts like a shock absorber and slows down the resulting rate of change in frequency.
Intermittent renewable resources, such as solar and wind, do not inherently provide inertia. With little to
no inertia in the system, it will be more difficult to keep the frequency within its normal range. A power
system with a large share of renewables, such as the Lithuanian power system in 2050, would therefore
be more vulnerable to sudden changes in supply or demand.
The ability of a power generating unit to supply inertia is often referred to as the ‘inertia constant’ (H).
The inertia constant of a generator-turbine unit is the ratio of kinetic energy stored at synchronous
speed to the generator rating (MVA). The total system inertia, or the rotating mass, can then be
calculated as:
∑𝑀𝑉𝐴𝑝𝑝
∙ 𝐻𝑝
Here, p is the specific generator unit, MVAp the total installed capacity of the unit, and Hp the inertia
constant of the unit.
When synchronized to the CE, system operators in the Baltic region must ensure at least 17 100 MW/s of
power system inertia to be used for frequency stability. At least three synchronous compensators shall
be installed in each Baltic country (Litgrid, u.d.). The maximum system inertia in the Lithuanian power
grid in 2050 is calculated as 4 553 MW/s, see Table 17.
Table 17: Inertia in the Lithuanian power system in 2050
Power generator unit Inertia constant (H) Installed capacity
National Trends, 2050
(MW)
Maximum inertia
(MW/s)
Hydro 2 1264 2528
Natural gas and bio 3 675 2025
Wind 0 4200 0
Solar 0 1600 0
Batteries (stationary
and EV V2G)
0 1255 0
Assuming Litgrid would need to ensure at least 6 000 MW/s, this is not enough. Hence, adding three
synchronous compensators would give sufficient margin. Assuming each compensator is rated 600 MVA
with an H-constant of 2, this gives an additional 3 600 MW/s inertia to the system. Moreover, battery
controllers can be designed to provide fast frequency response (FFR), which to some extent can replace
inertia.

Page 101 of 138
DNV GL - Scenario Building for the Evolution of Lithuanian Power Sector for 2020-2050 litgrid test
Conclusion
Comparing Table 16 with the requirements in Table 15, we see that the pumped storage plant is quite
important. The utilisation of pumped storage in the scenarios is limited, mostly because the scenarios
assume a positive development of dedicated battery storage and electric vehicles. Utilisation of
electricity storage is often cheaper and thus the often ‘preferred’ option for the model in the scenarios.
As seen from the perspective of the model, and then implicitly the domestic electricity market, it is more
efficient that the pumped storage is largely ‘occupied’ delivering frequency resources to the TSO and not
utilised too much in the day-ahead and intraday markets.
For the similar reasons, we have in Table 16 suggested not to rely on EVs and batteries for frequency
resources; it is expected that these resources will be active in the day-ahead and intraday markets in
addition to serving EV owners.
Without wind, the frequency requirements are met with only a small margin for downward regulation. If
critical, it might be possible to regulate biomass and waste further down, but this might create other
concerns as regards heat supply, etc.
Inertia seems to be the major unsolved challenge as regards the system adequacy and adding three
synchronous compensators currently seems as the preferred option, in addition to encouraging or
ensuring battery controllers are designed to provide fast frequency response.
The overall conclusion is thus that from a system adequacy perspective, the RES scenarios offer
challenging but manageable pathways to a sustainable and less carbon intensive Lithuanian energy
supply.

Page 102 of 138
DNV GL - Scenario Building for the Evolution of Lithuanian Power Sector for 2020-2050 litgrid test
8 IDENTIFICATION AND RECOMMENDATIONS FOR ACTIONS AND MEASURES
In this chapter, we will analyse business cases for wind power and the different flexibility solutions. The
business cases are presented for 2050, but recommendations for actions and measures and roadmaps
will be discussed for both short- and long-term perspectives.
8.1 Wind Power Business Case
In order to achieve the wind power investment growth trajectory that is assumed for the future
Lithuanian power system, the average generation weighted price the wind power producers receive
(capture price) must be at least equal to their levelised cost of energy (LCOE).
The LCOE of wind power is continuously decreasing but is expected to stabilize towards 2050. IRENA
expects the LCOE of onshore and offshore wind in 2050 to be 18-27 EUR/MWh (20-30 USD/MWh) and
27-64 EUR/MWh (30-70 USD/MWh), respectively. DNV GLs Energy Transition Outlook 2020 presents
2050 LCOE of onshore wind to be 30 EUR/MWh, and offshore wind slightly higher, shown in Figure 56.
Figure 56: Development of wind power LCOE (DNV GL, 2020)
In order to raise the average capture price for wind power to these levels in 2050, there must be a
demand for power (P2X) at a power price limit of at least 20 EUR/MWh, i.e. activation of P2X (here
power-to-gas) during surplus hours when the price goes below this limit. This is shown in Figure 57,
where the average annual onshore and offshore wind capture price is plotted against the forecasted
LCOE. The dark blue dotted line shows the wind capture price in the Medium Flex case, while the green
line shows the wind capture price in the High Flex case. By including P2X with these assumptions, the
onshore wind capture price is raised from 21.6 to 31.4 EUR/MWh in 2050, meeting LCOE levels.
Even though batteries and demand side flexibility reduce the number of hours with zero prices, without
additional flexible demand from P2X 27 % of the total wind power production in 2050 will be at power
prices below 0.1 EUR/MWh, in addition to 1.4% curtailment. With a flexible demand activated at a
certain power price limit, the extremely low prices and the VRES curtailment are eliminated. With the
assumption of this P2X being power-to-hydrogen, there must be demand for hydrogen produced at that
price.

Page 103 of 138
DNV GL - Scenario Building for the Evolution of Lithuanian Power Sector for 2020-2050 litgrid test
Figure 57: P2X effect on onshore and offshore wind capture price
8.2 Power-To-Gas Business Case
The main drivers for the business case for power to gas are the demand for hydrogen, the power price,
the investment cost and the production facility capacity factor. These variables all involve uncertainty
and may impact a business case negatively or positively. Given our assumptions, we expect power to
gas to become increasingly needed in the longer-term in order to address power generation surplus
periods in Lithuania, while by 2030 these surplus periods imply fewer challenges as highlighted in
chapter 7. That said, while a near-term business case for P2G is uncertain, we maintain that the long-
term need for P2G will warrant Lithuania moving to support the development of the technology earlier in
order to prepare for longer-term challenges. This would enable the building of P2G competence,
development of foundations for a technology supply chain and appropriate infrastructure for hydrogen
transport, as well as the facilitation of an emerging market for hydrogen offtake in industry and
transport.
As described in 0, the necessary flexible consumption power-to-X is implemented as power-to-hydrogen,
specifically hydrogen produced from electrolysis. Figure 58 shows installed capacity and generation
results for the National Trends scenario with power to gas activated at prices below 20 EUR/MWh. In
2050 total annual electricity consumption for power to gas is 1.4 TWh, with electrolysers operating
between 0 and 100% in 1518 hours. Figure 59 shows how the P2G consumption is distributed over the
year in 2050. The amount of hydrogen produced from the consumed electricity depends on the
electrolysis losses and required compression and storage.
The utilization of the assumed power to gas capacity in Lithuania and the resulting amount of hydrogen
produced is dependent on the power to gas assumptions in the neighboring countries. If P2G/P2X
capacity is high in the other countries, it contributes to increasing the power price, also in Lithuania,
which decreases the number of hours with P2G production in Lithuania. Other European countries can
have such a high flexible P2G/P2X demand that most of the surplus electricity in Lithuania can be
exported and there will be limited need for P2G capacity in the country. Also, if the total capacity is high
enough to increase all low prices up to the set price limit, changing the installed capacity will not make
further difference on the average power price. Hence, it must be noted that the scenario for installed
P2G capacity in Lithuania in this study is not meant as target, but rather to show that a flexible
electricity demand like power to hydrogen can help to solve future challenges in the power system.

Page 104 of 138
DNV GL - Scenario Building for the Evolution of Lithuanian Power Sector for 2020-2050 litgrid test
Figure 58: Power to gas capacity and consumption - National Trends scenario
Figure 59: Electricity consumption from power to gas facilities throughout the year in 2050
8.2.1 Hydrogen injection into natural gas grid
The produced hydrogen can be used for various purposes. Most of the hydrogen produced in Lithuania is
expected to be injected into the gas grid, blended with natural gas and exported to neighboring countries.
With existing technology, it is possible to inject hydrogen into the natural gas pipelines with a blend rate
up to 2 percent. In the future, it is expected that the possible hydrogen blend rate will increase to 10%,
and even higher in some gas grid sections with additional investments. Since it is possible to use existing
natural gas infrastructure to transport hydrogen, making use of the produced hydrogen from the
assumed 1.3 GW of power to gas production capacity in 2050 will not be difficult. However, as hydrogen
production may vary in different parts of the grid and throughout the year and the hydrogen mix will not
be homogeneous there might be a need for additional investments into retrofitting transport
infrastructure and gas consumption facilities.

Page 105 of 138
DNV GL - Scenario Building for the Evolution of Lithuanian Power Sector for 2020-2050 litgrid test
The EU-study ”Impact of the use of the biomethane and hydrogen potential on trans-European
infrastructure” (European Commission, 2020) indicates a large potential for hydrogen in Lithuania in
2050, shown in Figure 60. Realizing a potential of this size would however require large gas grid
investments.
Figure 60: European hydrogen potential scenario (European Commission, 2020)
8.2.2 The cost of hydrogen vs the required capture price for wind power
In order to have a business case for hydrogen injection into the gas grid, the cost of hydrogen from
power (electrolysis) must be competitive with the cost of natural gas, which in our modelling
assumptions is 20 EUR/MWh from 2025 and onwards. In addition to the cost of electricity for electrolysis,
CAPEX, OPEX and energy losses during production decides the cost of hydrogen.
The cost of hydrogen was calculated for two different power price levels (10 and 20 EUR/MWh) using
DNV GL’s tool ExplEnergy and the following assumptions:
▪ All produced hydrogen is fed into the gas infrastructure.
▪ The cheapest electrolysis technology for producing hydrogen (AEL) with CAPEX, OPEX and losses
in a range expected from 2030.
▪ No compression and storage of hydrogen.
The results for the calculated hydrogen cost at the two different power price levels, as well as the
resulting capture price for onshore wind and power piece is shown in Figure 61.
As described in section 8.1; to ensure investments in wind power, we most likely need a wind power
capture price of at least 30 EUR/MWh. To achieve a wind capture price of 30 EUR/MWh in our 2050

Page 106 of 138
DNV GL - Scenario Building for the Evolution of Lithuanian Power Sector for 2020-2050 litgrid test
scenario, P2G is necessary to absorb surplus electricity at prices of 20 EUR/MWh and below. However,
this gives an estimated cost of hydrogen of minimum of 35 EUR/MWh (1.1 EUR/kg)10, which is not
competitive with the assumed natural gas cost. In addition, some storage and compression of hydrogen
would be necessary to ensure the percentage mix of hydrogen into the gas grid stays within the
requirements at all times, which increases the cost further.
It must be noted that the estimated cost of hydrogen is uncertain. There are several factors that can
increase the costs, including storage and compression costs and higher than expected electrolysis
investment costs. The main share of the hydrogen cost is the electricity cost (including costs for energy
losses), while a lower share of the costs is CAPEX and OPEX costs. Hence, higher or lower electricity
price will have the highest impact on hydrogen production costs. In addition, in order for the CAPEX part
of the cost per kg hydrogen to remain relatively low, a certain number of operating hours is required for
the hydrogen production. A low number of operating hours gives a higher cost per kg of hydrogen
produced.
For hydrogen to be competitive with natural gas at an assumed natural gas cost of 20 EUR/MWh, the
required power price paid by hydrogen producers would have to be 10 EUR/MWh or lower. With the
assumptions described above, this leads to a cost of hydrogen of 21 EUR/MWh (0.7 EUR/kg),
approximately the same as assumptions for the natural gas price. This means that hydrogen must be
produced at 10 EUR/MWh or lower to be competitive with natural gas to be injected into the gas grid.
However, market modelling results for this case gives an average wind capture price of 25 EUR/MWh.
To summarize, our results show that in order to have a business case both for wind power and power-to-
hydrogen in 2050, there must most likely be a demand for hydrogen at a cost of at least 35 EUR/MWh (1
EUR/kg), plus additional compression, storage and transport costs. However, as both the LCOE of wind
power and the cost of hydrogen production 30 years from now are uncertain business cases might
change.
10 BNEF and IRENA project significant cost reductions of green hydrogen, showing costs down to $0.8-$1.0 per kg or lower in 2050 (BNEF,
2020), (IRENA). The EU green hydrogen strategy presents cost projections as low as EUR 1.1/kg already in 2030 (European commission, 2020).

Page 107 of 138
DNV GL - Scenario Building for the Evolution of Lithuanian Power Sector for 2020-2050 litgrid test
Figure 61: The effect of power price for hydrogen production on cost of hydrogen, power price and wind power capture price
8.2.3 Power-to-gas-to-power
Another solution is to utilize the hydrogen produced during surplus hours to produce electricity in deficit
hours; power-to-gas-to-power (P2G2P). In order to have a business case for P2G2P, the associated cost
of energy must be cheaper than the electricity price received. P2G2P has some challenges that drive up
the costs:
▪ The overall process efficiency is low (~35%) due to losses in hydrogen production, compression
and conversion back to electricity.
▪ Large investments are needed, since P2G2P requires compression and storage units,
transportation and power plants. To reduce the need for transportation, it would be favourable to
locate the electrolyser and the power plant next to each other.
The business case for power to gas in Lithuania was analysed by calculating the overall cost of P2G2P
per MWh using the DNV GL tool ExplEnergy. The following assumptions have been made:
• The hydrogen production is charged at 20 EUR/MWh for its use of electricity.
▪ A lifetime of 15 years for all components
▪ Losses, CAPEX and OPEX in the lower range expected from 2030 onwards

Page 108 of 138
DNV GL - Scenario Building for the Evolution of Lithuanian Power Sector for 2020-2050 litgrid test
▪ No transportation needs, and an
average storage requirement of 3
days2
The results for the total cost of P2G2P is 123
EUR/MWh, with hydrogen-to-power being the
largest contributor to the high cost. The
contribution of the different cost elements in
EUR/MWh is shown in Figure 62.
In our modelling results for 2050, there are in
total only 48 hours with power prices above 120
EUR/MWh. Considering the large investments
needed, this is not enough to create a viable
business case for P2G2P without substantial
subsidies. Also, with a larger need for storage,
the cost increases. Having a storage capacity of
7 days would increase the total cost to 156
EUR/MWh.
To conclude, it will be more economically
favourable to utilise the hydrogen for other
purposes (e.g. industry or transport or injection
it into the gas grid) than to convert it back to
power.
8.2.4 The business case for hydrogen is dependent on several factors
If hydrogen is going to be competitive with a natural gas price of 20 EUR/MWh, there is a need to
subsidise the hydrogen production in order to cover the production costs. A simplified illustration of this
is shown in Figure 63, where the black line is the minimum cost of hydrogen, the blue area is the annual
income for selling hydrogen at 20 EUR/MWh (0.7 EUR/kg). This is based on the P2G scenario presented
in Figure 58.
Figure 62: Cost of power-to-gas-to-power (EUR/MWh)

Page 109 of 138
DNV GL - Scenario Building for the Evolution of Lithuanian Power Sector for 2020-2050 litgrid test
Figure 63: Business case for power to hydrogen (for blending with natural gas at 20 EUR/MWh)
However, the business case for power to hydrogen is dependent on several factors and, which can
reduce or remove the gap between cost and revenue or make hydrogen production profitable. The
business case for hydrogen would improve with, among others:
▪ Increasing cost of natural gas
Figure 64 shows the current and expected prices for natural gas in Lithuania compared to our calculated
cost of hydrogen produced at a power price of 20 EUR/MWh. It shows that most scenarios have a higher
natural gas price than our assumptions, and that hydrogen could be cost-competitive with natural gas in
2050 for most scenarios. Note that the cost of hydrogen is without the added cost of storage and
compression11.
11 Today, hydrogen produced from alkaline (ALK) electrolyzers normally has an output pressure of 1 barg before compression. For PEM
electrolyzers, this lies in the range of 15-30 barg. With technology development this is expected to increase, and ALK electrolyzers with output pressure between 20 and 50 barg are already being developed. Depending on the end use, the hydrogen might need to be
compressed further up to 350 bar (heavy-duty transport and buses) or 700 bar (light-weight transport), or liquified (especially relevant for
maritime use).

Page 110 of 138
DNV GL - Scenario Building for the Evolution of Lithuanian Power Sector for 2020-2050 litgrid test
Figure 64: Current and future prices* for natural gas in Lithuania (Heat Roadmap Europe, 2017)
▪ Increasing carbon taxes
Emissions stemming from the consumption of natural gas is subject to carbon taxes, while consumption
of hydrogen from renewable sources is not. With an expected scenario toward 2050 of incrementally
increasing carbon taxes, hydrogen produced from renewable sources (green hydrogen) would become
increasingly cost-competitive with natural gas. How the share of hydrogen in a natural gas blend can be
visible in terms of carbon taxes is uncertain, but for direct comparison to natural gas and other fossil
fuels green hydrogen will become more competitive if carbon taxes are high. Note that Figure 64 shows
the prices of natural gas excluding taxes.
▪ Hydrogen for other end-user applications
Hydrogen can be utilized for several other purposes than injecting it into the gas grid; as fuel for heavy-
duty transport, to replace fossil hydrogen in existing refining and fertilizer industry, or to decarbonise
heating in buildings or industry. The California Energy Commission recently published a report where the
target cost range of renewable hydrogen for different end-user applications was analysed (California
Energy Comission, 2020):
– Medium- to heavy-duty vehicles (replacing gasoline or diesel): $2-$4/kg (€1.8-€3.6/kg)
– Refining and fertilizer industry (replacing fossil hydrogen): $2.2-$3.4/kg (€2-€3/kg)
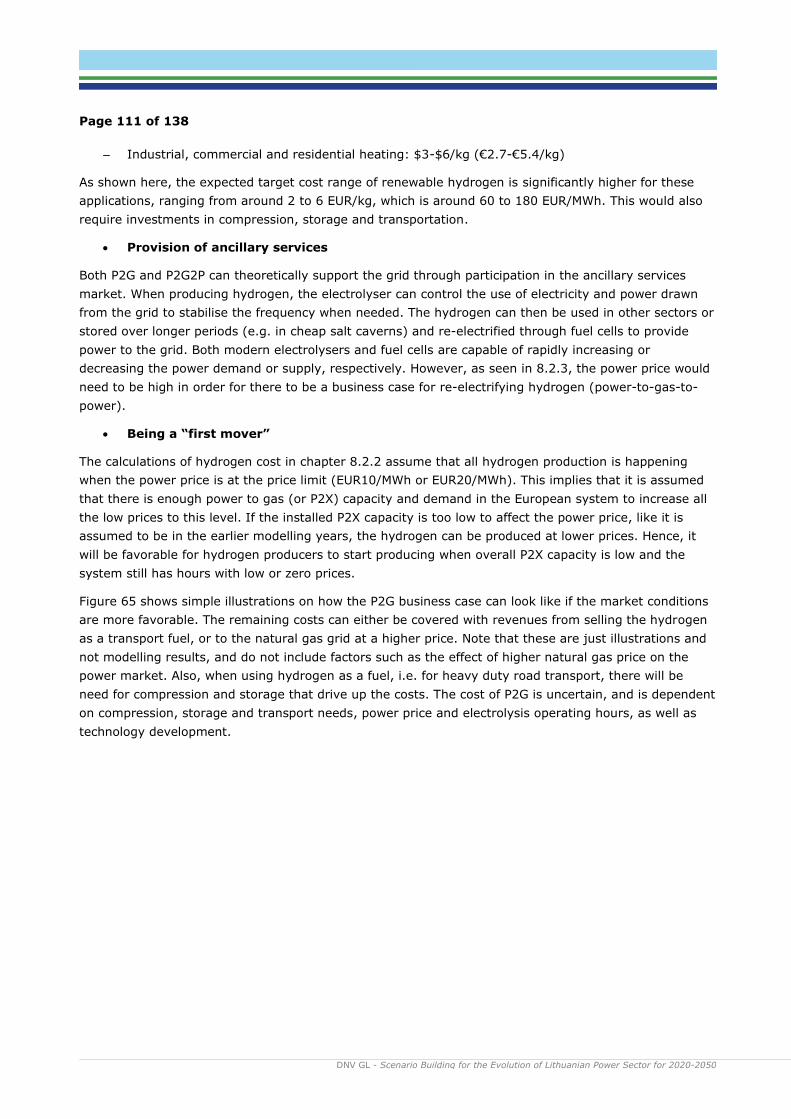
Page 111 of 138
DNV GL - Scenario Building for the Evolution of Lithuanian Power Sector for 2020-2050 litgrid test
– Industrial, commercial and residential heating: $3-$6/kg (€2.7-€5.4/kg)
As shown here, the expected target cost range of renewable hydrogen is significantly higher for these
applications, ranging from around 2 to 6 EUR/kg, which is around 60 to 180 EUR/MWh. This would also
require investments in compression, storage and transportation.
• Provision of ancillary services
Both P2G and P2G2P can theoretically support the grid through participation in the ancillary services
market. When producing hydrogen, the electrolyser can control the use of electricity and power drawn
from the grid to stabilise the frequency when needed. The hydrogen can then be used in other sectors or
stored over longer periods (e.g. in cheap salt caverns) and re-electrified through fuel cells to provide
power to the grid. Both modern electrolysers and fuel cells are capable of rapidly increasing or
decreasing the power demand or supply, respectively. However, as seen in 8.2.3, the power price would
need to be high in order for there to be a business case for re-electrifying hydrogen (power-to-gas-to-
power).
• Being a “first mover”
The calculations of hydrogen cost in chapter 8.2.2 assume that all hydrogen production is happening
when the power price is at the price limit (EUR10/MWh or EUR20/MWh). This implies that it is assumed
that there is enough power to gas (or P2X) capacity and demand in the European system to increase all
the low prices to this level. If the installed P2X capacity is too low to affect the power price, like it is
assumed to be in the earlier modelling years, the hydrogen can be produced at lower prices. Hence, it
will be favorable for hydrogen producers to start producing when overall P2X capacity is low and the
system still has hours with low or zero prices.
Figure 65 shows simple illustrations on how the P2G business case can look like if the market conditions
are more favorable. The remaining costs can either be covered with revenues from selling the hydrogen
as a transport fuel, or to the natural gas grid at a higher price. Note that these are just illustrations and
not modelling results, and do not include factors such as the effect of higher natural gas price on the
power market. Also, when using hydrogen as a fuel, i.e. for heavy duty road transport, there will be
need for compression and storage that drive up the costs. The cost of P2G is uncertain, and is dependent
on compression, storage and transport needs, power price and electrolysis operating hours, as well as
technology development.

Page 112 of 138
DNV GL - Scenario Building for the Evolution of Lithuanian Power Sector for 2020-2050 litgrid test
Figure 65: Illustrations of P2G business cases with more favourable market conditions
8.2.5 Power-To-X SWOT analysis
8.3 Battery Storage Business Case
Battery energy storage systems (BESS) can provide flexibility at multiple levels in the power system,
depending on their characteristics and size. In our model, we have both utility-scale stationary BESS
(100 MW per unit) and smaller-scale moving batteries in EV’s. The installed capacities for stationary
batteries in the three different scenarios follow the corresponding TYNDP scenarios to 2040. It is
assumed that the growth trend will continue to 2050, giving an installed battery capacity in Lithuania of
900 MW in 2050 the National Trends scenario.
Both the stationary batteries and the EV’s (with vehicle to grid) can provide several flexibility services:

Page 113 of 138
DNV GL - Scenario Building for the Evolution of Lithuanian Power Sector for 2020-2050 litgrid test
▪ Ancillary services to the grid (e.g. voltage support, frequency response, power quality) due to
their fast response time.
▪ RES absorption at times with surplus generation.
▪ Grid congestion management at times with high demand.
Figure 66 shows our National Trends scenario for installed battery capacities and modelling results for
generation towards 2050, both for stationary batteries and EV vehicle to grid. Some key observations
from the results are that:
• The relatively low annual utilization of the batteries compared to capacity indicate that the
scenario for installed battery capacity might be higher than necessary. The scenarios for installed
battery capacity in the Distributed Energy and Centralized Energy scenarios are lower, 700 and
300 MW in 2050, respectively, while the utilisation in MWh charge/discharge per MW capacity is
higher than in the National Trends scenario.
▪ An increased amount of power to gas in the system reduces the usage and the business case for
batteries as it reduces the need for surplus energy absorption and removes the lowest power
prices.
▪ V2G is utilized more than stationary batteries compared to available capacity. This is because our
modelling assumptions favour EV batteries slightly over stationary batteries at times when the
EVs are assumed to be connected to the grid.
Figure 66: Installed BESS capacity and use in the wholesale market

Page 114 of 138
DNV GL - Scenario Building for the Evolution of Lithuanian Power Sector for 2020-2050 litgrid test
Figure 67: Business case for stationary batteries
Figure 68: Stacking of revenues (DNV GL, 2017)
8.3.1 Stationary batteries business case
This section presents the business case for stationary batteries in the Lithuanian power system for the
National Trends scenario.
Table 18: Investment costs for stationary batteries in the National Trends scenario
2040 2050
Installed battery capacity 500 MW 900 MW
Battery storage 5 hours (2500 MWh) 5 hours (4500 MWh)
Total investment cost 333 MEUR12 600 MEUR13
Lifetime 20 years 20 years
Equivalent annual cost
Assuming a discount rate of 4%
25 MEUR 44 MEUR
The investment cost for stationary batteries are high,
and modelling results show that the net yearly income
for stationary batteries is too low to cover the
investment cost of a battery of this size. This is shown in
Figure 67. The net revenue shown here comes from
energy time-shifting (arbitrage), where the batteries
charge at low electricity prices (supply surplus) and
discharge at high electricity prices (supply deficit).
Revenues for stationary batteries would increase if V2G
charge/discharge was done by the stationary batteries
instead, but it would not be enough to cover the annual
costs.
With battery energy storage systems being relatively
expensive compared to other flexibility resources, they
would need to provide several flexibility services to
increase their revenue and improve the business case. This
is called stacking of revenues and is illustrated in Figure 68.
Stacking of revenues from several flexibility services could
potentially make BESS profitable depending on the system
needs. Both BESS and EV’s can also participate in the
balancing markets (FCR, aFRR), as long as the legislation
enables this.
It must be noted that the assumption for installed capacity
of stationary batteries is not necessarily meant as a target.
Depending on future V2G solutions and capacity, EVs
12 (DNV GL, 2017)
13 (NREL, 2019) Battery cost projections for 2050 (mid-scenario) for 4-hour battery system show a CAPEX of 150 USD/kWh. A conversion rate of
1,12 USD/EUR is used.

Page 115 of 138
DNV GL - Scenario Building for the Evolution of Lithuanian Power Sector for 2020-2050 litgrid test
Figure 69: Annual net income from V2G
might be able to cover more of the need for battery services.
In line with the substantial increase in EV battery storage over the coming years in Lithuania, we also
note that there is scope to use EV batteries for stationary applications when they no longer meet EV
performance standards. This is typically when the battery’s usable capacity is at 80% or lower and can
no longer efficiently perform its role, typically after around a decade of use for transport applications. On
the one hand, recycling of batteries can yield new supplies of valuable metals such as Cobalt and Nickel
– which are the core components of EV batteries, such as nickel-manganese-cobalt (NMC) used by most
international car manufacturers and nickel-cobalt-aluminum (NCA) used by Tesla. However, with
recycling processes currently not competitive with mining, we expect the use of EV batteries as second
life battery storage will be a potentially attractive avenue for using degraded batteries.
Given the substantial increase in the EV fleet, over time the build up of expired EV batteries will also be
substantial. By stacking these batteries, Lithuania could use its fleet of EVs to deploy some of the
stationary battery storage envisioned for the coming decades. Assuming a lifetime of 15 years for EV
batteries used for driving, 50 000 EV batteries have surpassed their lifetime by 2040, a number
increasing substantially to more than 500 000 by 2050. With battery capacity of 50 kWh per car, this
adds up to 2.5 GW of EV batteries in 2040 and 25 GW in 2050. As EV battery storage capacity is
continuously increasing, these numbers can be even higher. That said, we also note that EV battery-pack
designs vary in chemistry and design, which increases refurbishing complexity of repurposing and
stacking such batteries for stationary storage. We also stress that battery manufacturing cost is set to
continue declining, which also could pose a risk to the use of stationary batteries should the cost of
repurposing battery capacity exceed that of investing in a purpose-built new-build.
8.3.2 EV vehicle to grid business case
As the number of EVs in Lithuania increase they will become an increasingly important provider of
flexibility services. EVs can potentially provide flexibility both through flexible charging and vehicle to
grid solutions. As the capacity available for V2G increases over the next decades (described in chapter
6.4.3), the potential income from V2G services increases.
Annual net income for V2G providers in the National Trends
scenario is shown in Figure 69. Annual net income for
V2G providers increases to around 8 MEUR/Year in 2040
and 9 MEUR/Year in 2050. This does not include EV
owner’s savings from flexible charging. Flexible charging
will improve the business case for EV/V2G owners further
as charging will be shifted to hours with more electricity
supply and a lower power price.
EVs can over time play a similar role to power supply
balancing as that of stationary battery storage
installations, and without additional investment costs.
However, EVs are not available to the grid at all times,
and people have similar driving patterns, meaning that
they might not be available to the grid when their V2G
services are needed.

Page 116 of 138
DNV GL - Scenario Building for the Evolution of Lithuanian Power Sector for 2020-2050 litgrid test
8.3.3 Battery Storage SWOT analysis
8.4 Demand-Side Flexibility Business Case
As described in 6.4.4, demand-side flexibility is the possibility of reducing, increasing or shifting load
within a period of time to provide flexibility to the power system. The business case for demand side
flexibility essentially comes down to the weighting between the costs entailed and the revenues earned
for the end user.
Not all load can (or should) be used for demand-side response. It should for example be possible to
increase or reduce the load without it having a high negative impact on the end user. The load should
also be able to respond to external signals, for example a given power price, which requires some sort of
control system connected to the load. Due to an expected reduction in cost of control systems, as well as
more and more consumer appliances being produced with integrated smartness, it is expected that an
increasing amount of resources can be used for demand-side response towards 2050.
Controllable, residential loads, such as electric heating or charging of EV’s, can be shifted a few hours
within a day with minimal effect on the end user. It can however have a large positive impact on grid
stability and security of supply, by aiding in balancing and alleviating local congestion.
In our model, the ability to shift the load is applied to both electric heating and charging of EV’s. For
electrical heating, it is modelled as the ability to shift the load for a few hours within the day based on
price signals. The same applies for EV charging from 2030 and onwards, shifting EV consumption to
hours of the day with low prices. Although essentially a flexible load, the business case for EV’s is
included in the business case for batteries, as EV’s are also used for vehicle-to-grid services.
The business case for load shifting for the end user comes down to the weighing between the cost
entailed and the revenue earned. The cost can be in the form of additional equipment needed to be able
to control the loads, as well as the cost of lost comfort and flexibility. Although difficult to quantify, it is
assumed that the total cost is close to zero as there is minimal to no investment needed, and the load
shifting has minimal effect on the end user. It is assumed that technology allowing load shifting to
happen automatically without consumer investments or actions will be implemented in the system in the
Page 117 of 138
DNV GL - Scenario Building for the Evolution of Lithuanian Power Sector for 2020-2050 litgrid test
coming years. The revenue can be in the form of reduced electricity bill if the load is shifted from hours
of high power prices to hours of low prices, and/or from direct earnings from participating in local
flexibility markets14. The latter would increase the business case, but is dependent on regulation.
8.5 Summary of flexibility business cases: Technology trilemma
This chapter has shown how the different technologies affect the business case of each other, and that
we are facing a “technology trilemma”:
• Wind power
With high volumes of wind power, the average power price and capture price for wind power
decrease, and the business case is weakened. Subsidies or other measures are necessary to
support the business case for wind power investors.
• Power to gas
Flexible demand from power to gas can be implemented to consume electricity in hours with high
renewable generation, which increases the power price and hence the business case for
renewable technologies. For the business case for power to gas to be positive, the natural gas
price must be higher than we have assumed, or produced hydrogen must be sold to markets
with higher hydrogen prices. Unless these criteria are fulfilled, power to gas will also require
subsidies.
• Batteries
Batteries play an important role in peak shaving, but with high investment costs the business
case for stationary batteries for energy arbitrage is negative. When power to gas is introduced,
power prices become less volatile, and the profitability of batteries is further weakened.
Consequently, power to gas is necessary for the business case of wind power, but opens a new
need for subsidies by reducing the net profit for batteries.
The main question is what combination of the technologies gives the lowest total system cost or need for
subsidies. The subsidies needed for the three technologies were calculated as the difference between the
assumed costs and earnings:
• For wind power, the costs were calculated as the LCOE multiplied by the available wind
generation, while the earnings were calculated as the capture price multiplied by the actual wind
generation. The LCOE was assumed to follow the Energy Transition Outlook projections for
onshore and offshore wind in 2050 of 30.92 EUR/MWh and 32.91 EUR/MWh, respectively.
• For hydrogen, the costs were calculated as the cost of hydrogen multiplied by the amount
produced, while the associated earnings were assumed to be the cost of natural gas multiplied
by the amount produced. The cost of natural gas was assumed to be 20 EUR/MWh.
• For batteries, the estimated subsidies represent the gap between annual costs and annual
revenues.
14 Flexible loads could participate in local flexibility markets in order to manage grid congestion and/or postpone grid reinforcements at low to
medium voltage distribution level. The network operator would request a given amount of flexibility (up or down), and the price it is willing
to pay. The end user providing the flexibility would thus earn a revenue for meeting this request. This would require an aggregator, a third
party who aggregates several smaller resources to bid in a larger volume on the market.

Page 118 of 138
DNV GL - Scenario Building for the Evolution of Lithuanian Power Sector for 2020-2050 litgrid test
Figure 70: National Trends - the impact of P2G - Need for subsidies in Medium Flex vs High Flex
A comparison of the estimated total need for subsidies for these technologies in the Medium Flex case
and the High Flex case is presented in Figure 70. In both cases there is a potential need for subsidies for
one or more technology towards 2050. In the High Flex case, onshore wind power is profitable without
subsidies, and power to gas requires less support than wind in the Medium Flex case. Hence, given the
assumptions in this study, the High Flex case with power to gas is the most favorable case with regards
to subsidy requirements. The magnitude of the difference will depend on the future cost developments of
both wind power, power to gas and other competing technologies.
Table 19 shows the numbers behind the calculations of Figure 70 for 2050.
Table 19: Subsidies needed for wind power, P2G and batteries in 2050
Medium flexibility
No P2G
High flexibility
P2G produced at prices <= 20
EUR/MWh
Available wind generation (TWh) 13.59 13.59
Actual wind generation (TWh) 13.41 13.59
Avg. capture price of wind (onshore
and offshore (EUR/MWh)) 21.93 31.54
Subsidies needed for wind
(MEUR) 140.6 6.0
Electricity demand for P2G (GWh) - 1439
Cost of hydrogen (EUR/MWh) - 35.0
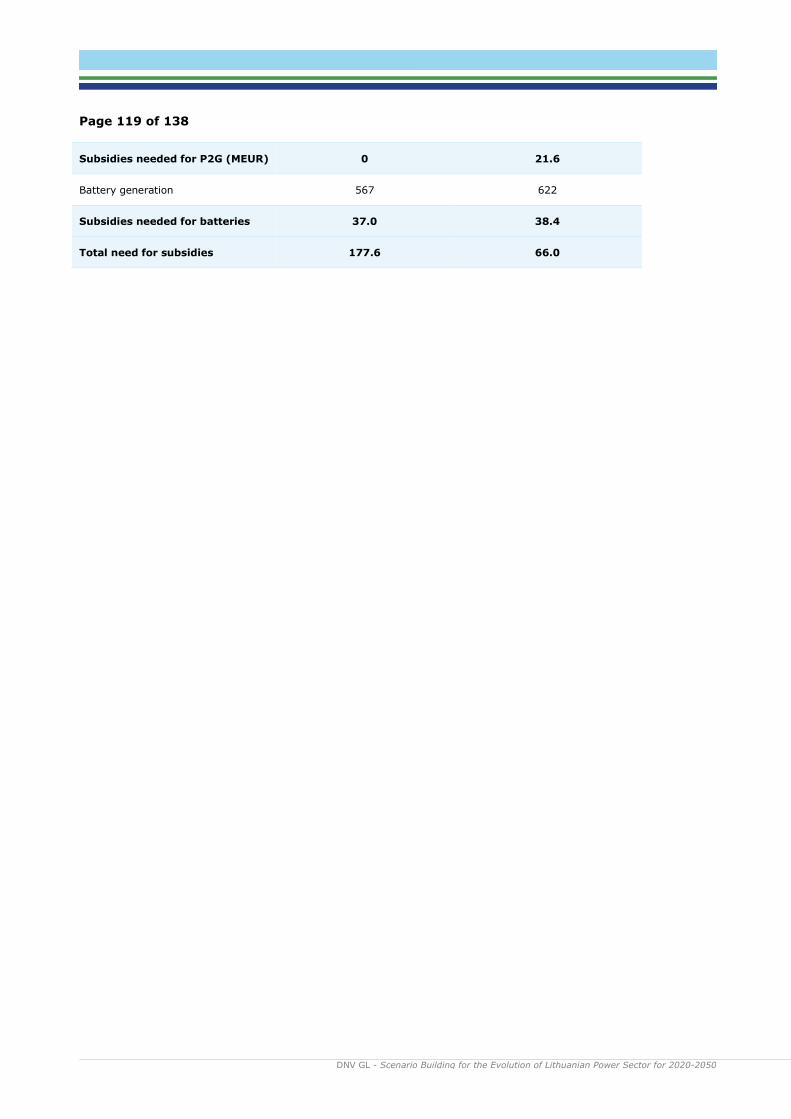
Page 119 of 138
DNV GL - Scenario Building for the Evolution of Lithuanian Power Sector for 2020-2050 litgrid test
Subsidies needed for P2G (MEUR) 0 21.6
Battery generation 567 622
Subsidies needed for batteries 37.0 38.4
Total need for subsidies 177.6 66.0
Page 120 of 138
DNV GL - Scenario Building for the Evolution of Lithuanian Power Sector for 2020-2050 litgrid test
9 ROADMAP TO 2050
9.1 Introduction
Lithuania has in place ambitious targets for transitioning the country to relying on sustainable energy
and in the process substantially strengthen energy security and reduce electricity import reliance. In line
with this, Lithuanian power sector expansion plans are rooted in substantially expanding the country’s
wind and solar power capacity. In order to ensure reliability of supply in the Lithuanian power system
throughout this transition to 2050, a combination of resources providing flexibility services is needed:
flexible loads and demand side management, batteries and vehicle-to-grid, increased interconnection
capacity, and power-to-gas. A roadmap to 2050 thus has to take into account how to balance the
development of power capacity and flexibility capacity in order to meet targets as envisioned by
Lithuanian energy policy.
In the previous chapters we have distilled pathways for how Lithuania can meet its long-term targets for
electricity generation under the NECP and NENS – highlighted in the figure below. It is clear that
formulating the strategy to deliver on such targets need to take into account several factors:
• Facilitating power generation: Building out the needed renewables capacity for power
generation must be economically viable, supported either by high enough electricity capture
prices or subsidies.
• Facilitating power consumption: Key focus areas of Lithuanian energy plans is to ensure that
the cost of energy consumption remains attractive. As such, stimulating power capacity growth
should not negatively impact the cost of energy.
• Balancing an increasingly intermittent power supply: Renewables generation volatility will
mean that matching supply with demand will become increasingly challenging, heightening risks
for periods of supply surpluses and supply deficits.
According to our results, the most cost-efficient way to stimulate renewables capacity growth while
keeping the cost of energy down will be to apply an appropriate mix of power balancing flexibility
resources as the power generation mix evolves. In order to outline how such a development
trajectory should look like, we will in this chapter chronologically outline the characteristics of a roadmap
towards 2050 that can support power generation growth, ensure competitive electricity prices and deal
with renewables supply intermittence. Accordingly, we will split this roadmap in three focus areas:
• 2020-2025 – Desynchronisation Timeline: Leading up to 2025, a key focus will be to
develop onshore wind capacity to increase domestic generation and offset natural gas closures –
with the aim to meet the 5TWh renewables generation target for 2025 shown in Figure 71.
According to our results, limited flexibility capacity deployment will be required over this
timeframe.
• 2025-2030 – NECP Timeline: Between 2025 and 2030, renewables capacity growth will slow
down after the surge registered up to 2025. Targeted renewables generation by 2030 is 7TWh.
We note that Lithuania’s first offshore wind project is set to come online by 2029. This period
also foresees a robust uptick in solar capacity growth. Over this timeframe the focus on flexibility
will increase, with an emerging focus on implementing and building competence on new
technology.
• 2030-2050 – NENS Timeline: Renewables growth will remain steady over the 2030s and
accelerate in 2040s as Lithuania gears up to meet its 18TWh renewables generation target by

Page 121 of 138
DNV GL - Scenario Building for the Evolution of Lithuanian Power Sector for 2020-2050 litgrid test
2050. In the 2040s, growth will be driven by a combination of offshore and onshore wind as well
as solar capacity. As vRES penetration in the power generation mix thus steadily increases, we
expect an increasing focus on deploying battery storage, P2G and EV V2G over this timeframe.
Figure 71: Renewable Energy Generation Expansion Targets
The impact of the aforementioned power generation expansion will be that Lithuania will substantially
reduce its reliance on imported electricity over the coming decades. Figure 72 showcase that Lithuania
will go from being reliant on importing about 70% of the power it consumed over 2019, to generating 90%
of the power consumed in 2050 domestically15.
15 As outlined in chapter 5, Lithuania will have sufficient power generating capacity to meet 100% of power consumption with domestic power
generation. That said, our results indicate that it is more cost-efficient to import electricity during periods of the year.
0
2
4
6
8
10
12
14
16
18
20
2025 2030 2050
TWh
Wind Solar Biofuel Hydro Biogas Not Defined
RES
resources
generating
18TWhRES
resources
generating
7TWh
De-synchronisation TimelineNECP Timeline
NENS Timeline
RES
resources
generating
5TWh

Page 122 of 138
DNV GL - Scenario Building for the Evolution of Lithuanian Power Sector for 2020-2050 litgrid test
Figure 72: National Trends - Electricity consumption, generation and net imports by year, TWh
This surge in domestic generating capacity will be driven by wind and solar capacity expansion. Figure 73
showcase the forecasted transition of the Lithuanian power generating capacity mix between 2020 and
2050. While natural gas-fired power plants currently are the largest source of generating capacity, in
2050 the wind segment will be the by far largest share of capacity in Lithuania.
Figure 73: National Trends - Installed power generating capacity by year, MW
This highlights how Lithuania’s reliance on intermittent renewables is set to increase over time. As
highlighted above, our results show that ramping up flexibility resources is key to mitigating the
challenges with VRES and achieving a power system that is favourable to both power generators and
electricity consumers. Notably, we expect the deployment of flexibility to grow in prominence post-2030,
as is highlighted in the Figure 74. The corresponding roadmap outlined in this chapter takes this into
account.
Offshore wind
Onshore wind
Solar PV
Hydro ROR
Hydro PS
Biomass/Biofuel/Waste
Natural Gas
Oil
Other non-renewable
0 500 1 000 1 500 2 000 2 500
2020
Offshore wind
Onshore wind
Solar PV
Hydro ROR
Hydro PS
Biomass/Biofuels/Waste
Natural gas
0 500 1000 1500 2000 2500
2050

Page 123 of 138
DNV GL - Scenario Building for the Evolution of Lithuanian Power Sector for 2020-2050 litgrid test
Figure 74: National Trends - Net flexibility capacity growth by period, GW
9.2 2020-2025: Supporting the ramp-up towards de-
synchronisation
The first five years of a Lithuanian roadmap towards 2050 are naturally influenced heavily by plans
already well in motion:
• NENS: The NENS plan was approved by the Lithuanian government in June 2018.
• Baltic desynchronisation from IPS/UPS: The plan has been in the works for several years,
with the first political roadmap envisioning its implementation having been agreed in June 2018
(European Commission, 2018)
• The NECP plan: The NECP was submitted to the EU at the end of 2019.
In combination, these plans naturally overlap and are key drivers for Lithuania’s near- and long-term
power sector development for power generation, system operation and flexibility.
9.2.1 Power generation: Executing existing plans
Leading up to 2025, expected closures of ageing power generating facilities and the commissioning of
new facilities are already in the works. Figure 75 highlights forecasted capacity growth in the National
Trends scenario, envisioning net onshore wind and solar PV capacity growth of nearly 1GW and 0.4GW
respectively between 2020 and 2025. At the same time, natural gas capacity will decline by more than
1.2GW over the same timeframe. When compared with the Distributed and Centralised energy scenarios,
the National Trends scenario takes into account faster onshore wind and solar capacity growth compared
to the other two.
0
0,1
0,2
0,3
0,4
0,5
0,6
0,7
0,8
0,9
1
2020-2025 2025-2030 2030-2040 2040-2050
Batteries Power-to-Gas EV Vehicle-to-Grid

Page 124 of 138
DNV GL - Scenario Building for the Evolution of Lithuanian Power Sector for 2020-2050 litgrid test
Figure 75: National Trends - Capacity Change By Year, GW
Given the near-term time horizon of capacity growth and closures leading up to 2025, measures to
facilitate this power generating capacity development are already in place. Lithuania has capacity
auctions for renewable energy, awarding 700GWh of renewables generation annually leading up to 2022,
in addition to the 300GWh auction held in 2019 (PV Magazine , 2019). The scheme, which is technology-
neutral through its incorporation of hydropower, wind and solar power has EUR385mn of funding and
was approved by the European commission in April 2019 under its state-aid rules. The first auction was
awarded to the subsidy-free Akmene One Wind Farm, as highlighted in chapter 3. This highlights the
competitive advantage of wind power in Lithuania and informs the near-term growth outlook in the
National Trends scenario.
The Lithuanian government has also in place a net metering scheme for PV installations up to 500kW of
capacity, which also informs the solar outlook. The 500kW limit is substantially higher than what is
common in EU markets, and can help stimulate a substantial uptick in distributed solar capacity. The
scheme ties in with NENS targets to grow the share of prosumers compared to the total number of
consumers to 30% by 2030 and 50% by 2050, as highlighted in section 3.4.2. The scheme’s flexibility
will support capacity uptake, given that it enables the building of the PV unit in one part of the country
(i.e. on a cheap plot of land with favourable solar irradiation and grid connection conditions) and
consume the power elsewhere. Individuals can also lease parts of a bigger PV station, with the scheme
thus enabling strong cumulative solar capacity growth through a decentralised approach akin to that of
the German Energiewende.
9.2.2 System operation and flexibility: Executing existing plans
In addition to facilitating generating capacity development, we foresee few challenges with regards to
system adequacy leading up to 2030, as is highlighted in chapter 7. Given that energy surplus and deficit
-0,6
-0,4
-0,2
0,0
0,2
0,4
0,6
0,8
2020 2021 2022 2023 2024 2025
Offshore wind Onshore wind Solar PV Hydro PS Biomass/Biofuels/Waste Natural gas

Page 125 of 138
DNV GL - Scenario Building for the Evolution of Lithuanian Power Sector for 2020-2050 litgrid test
weeks caused few issues across our Low, Medium and Flex cases for National Trends – we anticipate
limited need for investment into flexibility resources additional to what is already planned. Notably,
Lithuania is set to deploy a 200MW/200MWh battery dedicated to FCR and aFRR in order to support
system stability over this timeframe. The nine synchronous compensators built across the Baltics for the
synchronisation with the Continental European system will also be key contributors to supporting system
inertia and frequency balancing.
On the regulatory side, the first five years of a Roadmap towards 2050 will incorporate a focus on the
integration of the Lithuanian market to Continental European electricity balancing markets. As noted in
sections 6.3 and 7.5, a key focus for Lithuania – and the Baltic Markets generally – will be to integrate to
and participate in European balancing markets. This includes participation in the MARI platform for mFRR,
PICASSO platform for aFRR and the establishment of a Baltic Load Frequency Control Block. We highlight
that these plans are already advanced, with the aim of such participation being in place by the time of
the Baltic synchronisation with the Continental European power system by the end of 2025.
Efforts to integrate to the European balancing market will also be supported through the implementation
of the ”Clean Energy Package for All Europeans”, which proposes changes in market design, market
players and technologies to facilitate the need for new flexibility resources. This includes, among others,
opening up the balancing markets to aggregation of smaller units (like EV’s), lowering the minimum bid
requirements, and defining regulations for energy storage systems. Implementing such regulation will
equip the Lithuanian market to deploy flexibility resources, and support the emergence of V2G and
revenue stacking for battery storage through the participation in balancing markets (FCR, aFRR, mFRR).
The latter was highlighted as key to improving the battery storage business case in chapter 8.
9.3 2025-2030: Delivering on EU targets and facilitating NENS
implementation
In the interim between 2025 and 2030, there will be less visibility with regards to policy and project
implementation. Over this timeframe, we expect the main focus to be on delivering Lithuania’s first
offshore wind farm, alongside continued growth in the solar segment in line with distributed solar
support.
9.3.1 Power generation: Plans and relevant measures
For power generating capacity, we have taken into account that Lithuania’s first offshore wind farm will
come online by end-2029, shown in Figure 76. This feature is integrated across the National Trends,
Distributed Energy and Centralised Energy scenarios and marks the start of a longer-term push for
offshore wind capacity in the market. Given foreseen land-use limitations, onshore wind capacity growth
over this timeframe is not included in the National Trends scenario – while some onshore wind capacity
growth is included in the Distributed and Centralised Energy scenarios. In essence, this means that a key
focus of Lithuanian policy will be to facilitate the implementation of relatively more expensive offshore
wind in the late 2020s.

Page 126 of 138
DNV GL - Scenario Building for the Evolution of Lithuanian Power Sector for 2020-2050 litgrid test
Figure 76: National Trends - Generation Capacity Net Growth By Year, GW
The biggest challenge associated with offshore wind will be to cover the cost gap between offshore wind
LCOE and the electricity price over a period of time sufficient to stimulate investment. A financing
mechanism commonly used to address this challenge for offshore wind is that of contracts-for-difference
(CfD). CfDs enable generators to bid a strike price per MWh sold, with the government covering the
difference when the electricity price goes below the strike price. Conversely, the generator pays back the
excess when the electricity price exceeds the strike price. The result is a mechanism that provides
revenue certainty, by extension incentivising investment in high-up front cost offshore wind facilities at
the lowest cost project developers are willing to accept.
As such, we highlight that Lithuania plans to hold its first offshore wind auction on February 1st 2023,
evident in a package of draft laws aiming to regulate the offshore wind sector. In line with this, the
Lithuanian Ministry of Energy has opted for using a CfD scheme for the 700MW project planned, which is
the project that is reflected across our power generation scenarios as coming online in 2029
(Offshorewind.biz, 2020). The next step is for the government to approve the laws for them to enter into
force. A timely implementation of a 2023 tender could facilitate an earlier project commissioning date
than what we currently factor in. That said, we also highlight that by providing a longer lead-time for
project implementation, project developers will be able to factor in future technology improvements to
their bids, helping to drive costs down.
9.3.2 System operation and flexibility: Plans and relevant measures
As outlined in chapter 7, we maintain that dealing with an increasing Lithuanian reliance on intermittent
renewable energy will not require any substantial uptick in flexibility capacity leading up to 2030. In our
Medium and High Flex cases, we have implemented very limited penetration of flexibility resources in
2030, shown in Figure 77. This is due to electricity surplus not yet being a challenge, and that imports
0,00
0,10
0,20
0,30
0,40
0,50
0,60
0,70
0,80
2026 2027 2028 2029 2030
Offshore wind Solar PV

Page 127 of 138
DNV GL - Scenario Building for the Evolution of Lithuanian Power Sector for 2020-2050 litgrid test
from Sweden, Latvia and Poland are sufficient to ensure prices remain stable in a deficit week. In the
National Trends scenario no battery capacity operating in the wholesale power market has been factored
in, while in the Centralized Energy and the Distributed Energy scenarios, 100 MW of installed battery
capacity is assumed to be installed by 2030, and modelling results shows charge/discharge of around 80
GWh.
Figure 77: National Trends – Net Flexibility Capacity Growth, 2025-2030, GW
While there is limited need for a substantial deployment of flexibility resources by 2030, we maintain
that there nonetheless should be an overarching strategic focus on flexibility leading up to 2030. Notably,
we have factored in some EV V2G and P2G capacity net growth in between 2025 and 2030 – at 0.10 and
0.05GW of capacity respectively – which reflects the expectation that the first projects will emerge over
this period. Available capacity for V2G services is expected to occur as the EV fleet expands alongside
appropriate charging infrastructure and software.
The first P2G projects, on the other hand, can benefit from the fact that there will not be sufficient P2G
capacity to substantially increase power prices during surplus generation periods. This will provide an
economic advantage to first movers in the P2G sectors, as described in section 8.2.4. However, we also
stress that P2G technology will require support to be economically viable, given the nascent stage of the
technology and the broader hydrogen value chain. As was highlighted section 8.2, the utilisation of P2G
facilities is likely to be relatively limited to begin with, highlighting the need for support for the first
projects to be implemented. In terms of P2G, initial efforts are likely to focus on facilitating the injection
hydrogen into the existing gas grid - with safety checks and tests being necessary to facilitating the
blending of hydrogen with natural gas. The creation of demand for higher value hydrogen offtake in
industry, transport and heating should also constitute a key focus in order to improve the P2G business
case and thus reduce the need for P2G subsidies over the longer term.
0
0,02
0,04
0,06
0,08
0,1
0,12
Batteries Power-to-Gas EV Vehicle-to-Grid

Page 128 of 138
DNV GL - Scenario Building for the Evolution of Lithuanian Power Sector for 2020-2050 litgrid test
9.4 2030-2050: Delivering on the NENS
By supporting the deployment of P2G pilots, Lithuania can build competence towards an anticipated
greater need for P2G post-2030. This will also tie in with EU’s push to support the emergence of an
European hydrogen economy through its Hydrogen Strategy – announced in July 2020 (European
Commission, 2020). This will likely facilitate P2G funding from the EU level. Competence building for P2G
technology must be accompanied by efforts to assess the scope for establishing hydrogen value chains in
Lithuanian transport and industry sectors with the intention to stimulate domestic hydrogen demand
over the longer-term.
Naturally, there is less visibility for project and policy implementation post-2030. The main driver for the
power generating scenarios developed in this report is the main long-term target of the NENS, namely
the domestic generation of 18TWh of renewable energy by 2050. To meet this target, a substantial
amount of new renewables capacity will be required post-2030, and notably in the 2040s. At the same
time, this substantial increase in intermittent renewables generation will create deeper challenges
associated with dealing with periods of energy supply surpluses or deficits.
9.4.1 Power generation: Plans and relevant measures
In our National Trends scenario, we forecast offshore wind to be the main driver of capacity growth
between 2030 and 2050 – adding a net 1.3GW of capacity over this timeframe. Net generation capacity
growth in the 2030s and 2040s is shown in Figure 78. In the Centralised Energy and Distributed Energy
scenarios we also foresee net offshore wind capacity growth of 1.3GW and 0.9GW respectively. This
highlights and overarching expectation for offshore wind to be a key driver in delivering NENS targets.
The key to delivering this long-term growth will be to continue building on the CfD mechanism from the
late 2020s, and ideally provide visibility into long-term development plans at an early stage. Long-term
policy visibility has been touted to be one of the most important aspects of successful offshore wind
development regimes – such as that in the United Kingdom. Notably, policy visibility enables offshore
wind equipment manufacturers and developers to build up local supply chains with the knowledge that
these can be used for future projects. Maintaining the CfD approach will also reduce concerns about the
risk of falling offshore wind power capture prices should local flexibility resources be unable to support
electricity prices – as envisioned in the High Flex case.
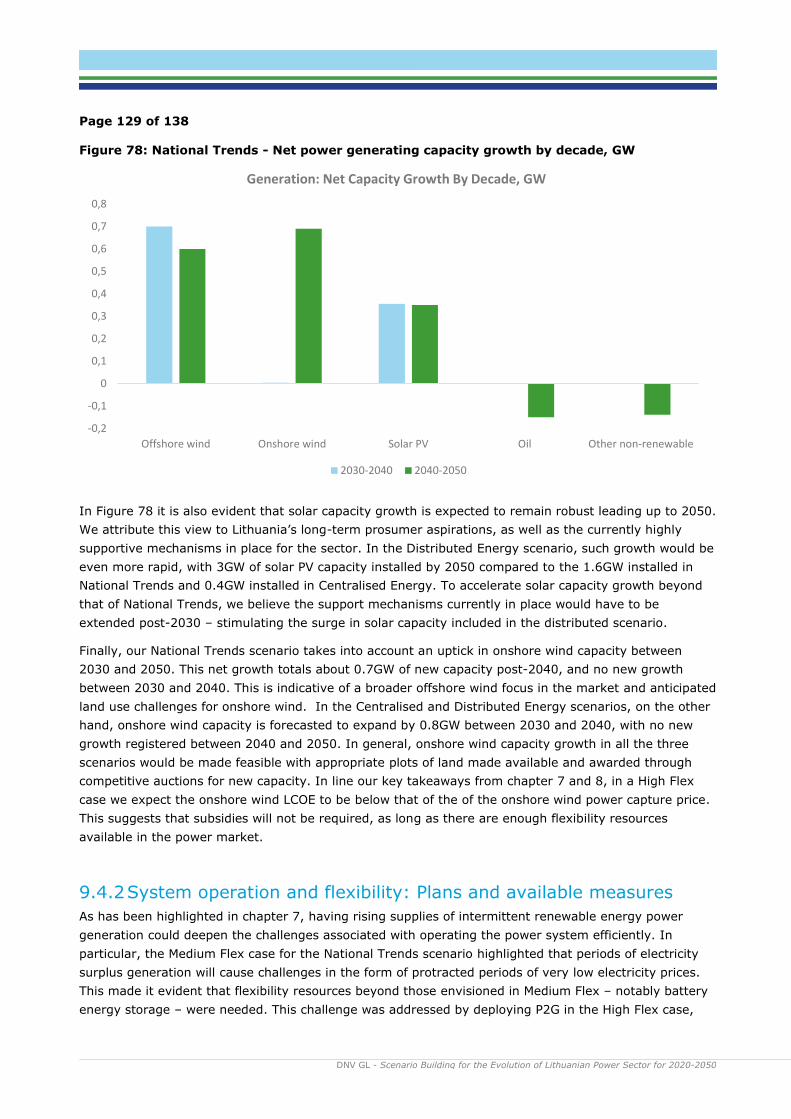
Page 129 of 138
DNV GL - Scenario Building for the Evolution of Lithuanian Power Sector for 2020-2050 litgrid test
Figure 78: National Trends - Net power generating capacity growth by decade, GW
In Figure 78 it is also evident that solar capacity growth is expected to remain robust leading up to 2050.
We attribute this view to Lithuania’s long-term prosumer aspirations, as well as the currently highly
supportive mechanisms in place for the sector. In the Distributed Energy scenario, such growth would be
even more rapid, with 3GW of solar PV capacity installed by 2050 compared to the 1.6GW installed in
National Trends and 0.4GW installed in Centralised Energy. To accelerate solar capacity growth beyond
that of National Trends, we believe the support mechanisms currently in place would have to be
extended post-2030 – stimulating the surge in solar capacity included in the distributed scenario.
Finally, our National Trends scenario takes into account an uptick in onshore wind capacity between
2030 and 2050. This net growth totals about 0.7GW of new capacity post-2040, and no new growth
between 2030 and 2040. This is indicative of a broader offshore wind focus in the market and anticipated
land use challenges for onshore wind. In the Centralised and Distributed Energy scenarios, on the other
hand, onshore wind capacity is forecasted to expand by 0.8GW between 2030 and 2040, with no new
growth registered between 2040 and 2050. In general, onshore wind capacity growth in all the three
scenarios would be made feasible with appropriate plots of land made available and awarded through
competitive auctions for new capacity. In line our key takeaways from chapter 7 and 8, in a High Flex
case we expect the onshore wind LCOE to be below that of the of the onshore wind power capture price.
This suggests that subsidies will not be required, as long as there are enough flexibility resources
available in the power market.
9.4.2 System operation and flexibility: Plans and available measures
As has been highlighted in chapter 7, having rising supplies of intermittent renewable energy power
generation could deepen the challenges associated with operating the power system efficiently. In
particular, the Medium Flex case for the National Trends scenario highlighted that periods of electricity
surplus generation will cause challenges in the form of protracted periods of very low electricity prices.
This made it evident that flexibility resources beyond those envisioned in Medium Flex – notably battery
energy storage – were needed. This challenge was addressed by deploying P2G in the High Flex case,
-0,2
-0,1
0
0,1
0,2
0,3
0,4
0,5
0,6
0,7
0,8
Offshore wind Onshore wind Solar PV Oil Other non-renewable
Generation: Net Capacity Growth By Decade, GW
2030-2040 2040-2050

Page 130 of 138
DNV GL - Scenario Building for the Evolution of Lithuanian Power Sector for 2020-2050 litgrid test
and we thus highlight P2G as an increasingly impactful flexibility resource towards 2040 and beyond in
particular. This is reflected in Figure 79, showing the net flexibility resource capacity growth per decade.
P2G penetration is forecasted to substantially increase from 0.05GW in 2030 to 0.36GW by 2040 and
1.26GW by 2050.
Figure 79: National Trends - Net flexibility capacity growth by decade, GW
In chapter 8, we have highlighted that this deployment of P2G capacity – as envisioned in the High Flex
case – can substantially reduce the subsidy burden for renewable energy. In order to facilitate this P2G
deployment over the longer term, our results show that new facilities will either require subsidies or high
enough prices for hydrogen offtake. Given that feeding in gas to the grid is set to yield insufficient
revenues for hydrogen producers with the gas price assumptions in our model, subsidies will likely be
required to facilitate the P2G growth we have envisioned. As such, a roadmap post-2030 must focus on
facilitating hydrogen uptake in alternative sectors, notably in transport, industry and heating. These
sectors can give a higher hydrogen offtake price, by extension reducing the need for subsidising P2G.
0
0,1
0,2
0,3
0,4
0,5
0,6
0,7
0,8
0,9
1
Batteries Power-to-Gas EV Vehicle-to-Grid
Flexibility: Net Capacity Growth By Decade, GW
2030-2040 2040-2050
Page 131 of 138
DNV GL - Scenario Building for the Evolution of Lithuanian Power Sector for 2020-2050 litgrid test
10 CONCLUSIONS
10.1 Meeting NENS targets
The scenarios that have been outlined in this report, with corresponding assumptions and modelling
methodology will enable Lithuania to meet its key targets as presented in the National Energy
Independence Strategy (NENS). These are as follows:
- Reduce electricity import reliance:
o 2030: The NENS targets for Lithuania to meet 70% of gross electricity consumption with
domestic generation by 2030. According to our results, the domestic power generation
share will range between 92-93% of the total by 2030.
o 2050: The NENS target aims for 100% of gross electricity consumption to be met by
domestic generation by 2050. Our results show that this is theoretically possible, but
that practically some net import will be assumed given that our modelling results
showcase this as the most cost-efficient solution across our scenarios.
- Renewable Energy Power Generation:
o 2030: Renewable energy generation should total at least 7TWh
o 2050: Renewable energy generation should total at least 18TWh
- Increasing the renewable energy share in power generation:
o 2030: For 2030, the NENS aims to supply 45% of power generation from renewable
sources. According to our results this share will be between 62-65% depending on
scenario.
o 2050: For 2050, the NENS aims to supply 100% of power consumption from renewable
sources. In our scenario assumptions we have kept two natural gas facilities that are
expected to operate leading up to 2050, while there will still be some net import. This
means that our modelling results indicate a share between 84-87% depending on
scenario.
In general, this means that key Lithuanian targets under the NENS are mostly met or can be met by
phasing out the natural gas fired power generation sooner than what is incorporated in our scenarios.
Achieving these results will however be contingent on the Lithuanian power system and market adapting
efficiently to the new reality that comes with an incrementally growing power supply from intermittent
renewable energy resources – namely wind and solar.
10.2 The importance of flexibility to facilitating the energy
transition
The Low Flex case for the National Trends scenario in chapter 7 clearly highlights that without any
more flexibility in the power system than is present today, there will be substantial adequacy challenges
starting around 2040 as the renewables power supply increases. These challenges will be evident both
for long periods of energy deficit and energy surplus, manifesting in protracted periods of very high
prices in the former and protracted periods of zero prices and generation curtailment in the latter.
However, with the introduction of flexibility resources from batteries, electric vehicles, demand side and
interconnection capacity presented in the Medium Flex scenario in this report, system adequacy will
Page 132 of 138
DNV GL - Scenario Building for the Evolution of Lithuanian Power Sector for 2020-2050 litgrid test
not be a significant challenge to system stability and operation in any of the three scenarios for the
evolution of the Lithuanian power system towards 2050.
o Battery energy storage systems will be important to balancing the electricity system as
both intermittent renewable energy and electricity demand increase. With the substantial
increase forecasted for electric vehicles, vehicle-to-grid can supply an increasing amount of
grid services. Batteries can contribute with several different flexibility services that can
mitigate the challenges seen in the Low Flex case.
o Demand side flexibility, mainly from EV charging and electric heating, can also shift
demand from supply deficit hours to supply surplus hours and thus become increasingly
important.
However, the Medium Flex case results also showed that Battery systems, demand side flexibility and
increased interconnection capacity will not be sufficient to appropriately deal with all the power surplus
in the system towards 2050. In fact, continued protracted periods of low electricity prices showcased a
steady decline in wind power capture prices for electricity as the supply grew. As such, achieving the
renewables capacity growth envisioned by the NENS would thus either require more flexible power
demand, or an increasing volume of power generation subsidies, in order to ensure the profitability of
new wind power facilities.
Our results indicate that the most favourable approach will be to deploy power-to-x (in this report
assumed to be hydrogen – P2G) to absorb power generation surpluses – by extension bolstering wind
power capture prices. As a result, in our High Flex case we have added P2G capacity to absorb surplus
power generation. This flexible P2G demand is activated during periods of low prices, and will according
to our results play an important part in improving the business case for wind power, mainly after 2040
as the share of renewables increases and the wind power capture price decreases. Our analysis of P2G
and wind power business cases in chapter 8 further indicate that subsidising P2G in order to support the
electricity price could have a lower subsidy burden vis-à-vis subsidising wind to address low capture
prices. This is based on assumptions that the hydrogen will be used to blend with natural gas in the
existing gas grid. Our analysis also highlights that an aim should be to stimulate demand for hydrogen at
higher prices, i.e. as a fuel for transport, in order to improve the business case for P2G and reduce the
overall need for subsidies.
10.3 Defining a roadmap that can support NENS target delivery
In order to meet the targets envisioned under the NENS, and address the flexibility challenges in an
appropriate manner, a roadmap to 2050 must balance capacity growth with flexibility capacity
deployment. We argue that such a roadmap can be divided into three time periods, namely:
• De-synchronisation from IPS/UPS – up to 2025: The key focus over this period is to
execute plans already in place in the period up the synchronisation with Continental Europe by
the end of 2025. This includes implementing renewables capacity auctions to facilitate onshore
wind growth, phasing out inefficient gas-fired capacity and integrating into the European
balancing market. Beyond this, our results indicate limited need to the flexibility resources
introduced in the Medium and High Flex cases.
• Delivering on the NECP – up to 2030: The key focus leading up to 2030 will be to facilitate
the implementation of Lithuania’s first offshore wind project. This will build on the regulatory
framework and tender mechanism having been put in place in a timely manner, with the current
tender date being in February 2029. While there is limited need for flexibility resources, V2G

Page 133 of 138
DNV GL - Scenario Building for the Evolution of Lithuanian Power Sector for 2020-2050 litgrid test
should emerge in line with EV fleet penetration, while P2G pilots should be envisioned to build
competence and tap into EU hydrogen funding for the period leading up to 2030.
• Delivering on the NENS – up to 2050: In order to deliver on the target to generate 18TWh
from renewable energy, and increase the renewables share in power generation to 100%, a
substantial amount of renewable energy capacity will be developed between 2030 and 2050.
Given that the challenges of renewables generation oversupply will emerge over this period, a
substantial uptick in flexibility resources will be a key focus over this timeframe. Notably,
towards 2040 and 2050 in particular, P2G resources will be required to support wind power
capture prices and could reduce the overall subsidy burden of the Lithuanian energy transition.
This focus should in turn be accompanied with a focus on stimulating hydrogen demand in
sectors that can increase the hydrogen offtake price, by extension reducing the need for
subsidies to facilitate an economically viable P2G business case.
Page 134 of 138
DNV GL - Scenario Building for the Evolution of Lithuanian Power Sector for 2020-2050 litgrid test
11 REFERENCES Acemoglu, D. (2007). Introduction to Modern Economic Growth. Retrieved from
http://scholar.google.no/scholar_url?url=https://www.theigc.org/wp-content/uploads/2016/06/acemoglu-2007.pdf&hl=en&sa=X&ei=4EyhX4_IB4_0mQHX4Y6YCQ&scisig=AAGBfm0LL5ThB2rUWXavpa7t9GiVJFh0ug&nossl=1&oi=scholarr
AST. (2020, September 1). System Balancing . Retrieved from AST.LV:
https://www.ast.lv/en/content/system-balancing AST, Elering & Litgrid. (2020, September 30). Baltic Load-Frequency Control block concept document.
Retrieved from www.litgrid.eu: https://www.litgrid.eu/uploads/files/dir555/dir27/dir1/17_0.php BBC. (2019, December 13). EU carbon neutrality: Leaders agree 2050 target without Poland. Retrieved
from BBC: https://www.bbc.com/news/world-europe-50778001 BNEF. (2020). Liebreich: Separating Hype from Hydrogen - Part One: The Supply Side. Retrieved from
https://about.bnef.com/blog/liebreich-separating-hype-from-hydrogen-part-one-the-supply-side/
California Energy Comission. (2020). Renewable Hydropen Transportation Fuel Production. Commission, E. (2017, November 28). COMMISSION REGULATION (EU) 2017/2195 of 23 November
2017 establishing a guideline on electricity balancing. Retrieved from EUR-LEX.EUROPA.EU : https://eur-lex.europa.eu/legal-content/EN/TXT/PDF/?uri=CELEX:32017R2195&from=EN
Commission, E. (2020, 04 30). Pursuant to Article 20(5) of Regulation (EC) No 2019/943 on the implementation plan of. Retrieved from EC.EUROPA.EU:
https://ec.europa.eu/energy/sites/ener/files/documents/adopted_opinion_lt_en.pdf DNV GL . (2020). DNV GL Calculations . DNV GL. (2017). Flexibility in the power system. DNV GL. DNV GL. (2019). Energy Transition Outlook 2019: A Global and Regional Forecast To 2050. Oslo: DNV
GL.
DNV GL. (2020). Energy Transition Outlook 2020: A global and regional forecast to 2050. DNV GL. (2020). Energy Transition Outlook 2020: Power Supply and Use. Oslo: DNV GL.
Ea Energy Analyses. (2018). Summary Report & recommendations, Lithuania demand response study. Elia. (2017). Electricity scenarios for belgium towards 2050. ENTSO-E. (2019, December). Data Visualisation Platform. Retrieved December 2013, 2019, from entsos-
tyndp2020-scenarios: https://www.entsos-tyndp2020-scenarios.eu/#download ENTSO-E. (2019). Mid-term Adequacy Forecast. Retrieved from
https://www.entsoe.eu/outlooks/midterm/wp-content/uploads/2019/12/entsoe_MAF_2019.pdf ENTSO-E. (2020). TYNDP 2020 Scenario Report. ENTSO-E. Retrieved 06 15, 2020, from
https://www.entsos-tyndp2020-scenarios.eu/wp-content/uploads/2019/10/TYNDP_2020_Scenario_Report_entsog-entso-e.pdf
ENTSO-E. (n.d.). System Development Committee. Retrieved from ENSTO-E: https://www.entsoe.eu/about/system-development/
EU Commission. (2015). Energy Union Package. Brussels: European Commission.
European Commission. (2016). Identification of Appropriate Generation and System Adequacy Standards
for the Internal Electricity Market. Retrieved from https://ec.europa.eu/energy/sites/ener/files/documents/Generation%20adequacy%20Final%20Report_for%20publication.pdf
European Commission. (2018, September 14). Synchronisation of the Baltic States' electricity grid with the continental European system. Retrieved from https://ec.europa.eu/info/news/synchronisation-baltic-states-electricity-grid-continental-european-system-2018-sep-14_en
European Commission. (2019). Clean Energy For All Europeans Package. Retrieved from https://ec.europa.eu/energy/topics/energy-strategy/clean-energy-all-europeans_en
European Commission. (2019). COMMUNICATION FROM THE COMMISSION TO THE EUROPEAN PARLIAMENT, THE EUROPEAN COUNCIL, THE COUNCIL, THE EUROPEAN ECONOMIC AND SOCIAL COMMITTEE AND THE COMMITTEE OF THE REGION. Brussels: European Commission.
European commission. (2020). A hydrogen strategy for a climate-netural Europe. Retrieved from https://ec.europa.eu/energy/sites/ener/files/hydrogen_strategy.pdf
European Commission. (2020, July 8). A hydrogen strategy for a climate-neutral Europe. Retrieved from EC.EUROPA.EU: https://ec.europa.eu/energy/sites/ener/files/hydrogen_strategy.pdf
European Commission. (2020). Impact of the use of the biomethane and hydrogen potential on trans-European infrastructure.
European Commission. (n.d.). Effort sharing: Member States' emission targets. Retrieved from https://ec.europa.eu/clima/policies/effort_en

Page 135 of 138
DNV GL - Scenario Building for the Evolution of Lithuanian Power Sector for 2020-2050 litgrid test
European Commission. (n.d.). https://ec.europa.eu/clima/policies/ets_en. Retrieved May 15, 2020, from https://ec.europa.eu/clima/policies/ets_en
Heat Roadmap Europe. (2017). EU28 fuel prices for 2015, 2030 and 2050. IEA. (2020). IEA. Retrieved from https://www.iea.org/data-and-statistics/data-
tables?country=LITHUANIA&energy=Electricity&year=2018 IRENA. (n.d.). Hydrogen: A renewable energy perspective. Retrieved from 2019:
https://www.irena.org/-/media/Files/IRENA/Agency/Publication/2019/Sep/IRENA_Hydrogen_2019.pdf
Litgrid. (2020). National electricity demand and generation. Retrieved from https://www.litgrid.eu/index.php/power-system/power-system-information/national-electricity-
demand-and-generation/3523
Litgrid. (n.d.). Synchronous operation. Retrieved from Litgrid: https://www.litgrid.eu/index.php/grid-development-/strategic-projects-/synchronous-operation-/137
Ministry of Energy of the Republic of Lithuania. (2018). National Energy Independence Strategy: Energy For Lithuania's Future (Nacionaline energetines nepriklausomybes strategija). Ministry of Energy of the Republic of Lithuania.
Ministry of Energy of the Republic of Lithuania. (2019). National Energy and Climate Action Plan of the
Republic of Lithuania for 2021-2030. Vilnius. NREL. (2019). Cost Projections for Utility-Scale Battery Storage. Offshorewind.biz. (2020, September 3). Lithuania Opts For CfD Offshore Wind Auction Scheme.
Retrieved from Offshorewind.biz: https://www.offshorewind.biz/2020/09/03/lithuania-opts-for-cfd-offshore-wind-auction-scheme/
PV Magazine . (2019, September 10). Lithuanian energy ministry issues timeline for renewables auctions. Retrieved from PV Magazine : https://www.pv-magazine.com/2019/09/10/lithuanian-energy-
ministry-issues-timeline-for-renewables-auctions/#:~:text=Lithuanian%20energy%20minister%20%C5%BDygimantas%20Vai%C4%8Di
%C5%ABnas,a%20statement%20from%20the%20ministry. Recharge. (2020, January 17). Retrieved from Recharge: https://www.rechargenews.com/wind/onshore-
wind-wins-lithuanian-tech-neutral-auction-with-zero-bid/2-1-739647 Recharge. (2020, May 14). Lithuania eyes 700MW offshore wind zone that could meet 25% of its power
needs. Retrieved from Recharge: https://www.rechargenews.com/wind/lithuania-eyes-700mw-offshore-wind-zone-that-could-meet-25-of-its-power-needs/2-1-809240
Reuters. (2020). Lithuania to build one of the largest battery parksin the world. Retrieved from https://www.reuters.com/article/lithuania-battery-idUSL8N2GZ280
Stern, D. I. (2010). The Role of Energy in Economic Growth. The Australian National University: Centre for Climate Economics & Policy.

Page 136 of 138
DNV GL - Scenario Building for the Evolution of Lithuanian Power Sector for 2020-2050 litgrid test
APPENDIX 1: ANALYSIS TOOL AND MODELLING METHODOLOGY
The results in this study is based on a power market model developed by DNV GL. The model is
developed with focus around Lithuania, and includes detailed representation of the dark blue countries in
the figure and generic representation of the light blue countries. Before the desynchronization from
IPS/UPS by the end of 2025, imports to the Baltic countries from this area is included.
Figure 80: Focus countries in the power market model
DNV GL is using the PLEXOS® Integrated Energy Model, an industry state-of-art power market and
transmission network modelling framework developed by Energy Exemplar (http://energyexemplar.com).
PLEXOS is simulation software of choice for a range of power generators, transmission system operators,
electricity and gas market operators, investors, regulators, energy traders, power generation
manufacturers, and consultants and academia over the world. DNV GL is among the most sophisticated
users of PLEXOS, and is using PLEXOS for power market and dispatch modelling, as well as for
transmission network modelling including load flow security and redispatch analysis, herewith using a
nodal representation of the power system in Europe.
Deploying PLEXOS has several key benefits, as it allows for:
• a detailed representation of generation units including using technology attributes such as start cost,
ramp rate, minimum turndown level, and part load efficiency;
• the usage of hourly profiles for electricity load, heat, wind and solar generation;
• the modelling of neighbouring markets, by considering a detailed representation of neighbouring
markets (core region) and assumptions on interconnection capacities;
• assessment of power prices representative of day ahead power market prices, and generation
dispatch economics acknowledged by generators, OEMs and the investor community;

Page 137 of 138
DNV GL - Scenario Building for the Evolution of Lithuanian Power Sector for 2020-2050 litgrid test
• the potential integration of DC transmission network analysis to assess the impact of network
constraints on generation dispatch (load flow security and redispatch analysis), optionally to be
extended with AC network modelling.
Main sources for scenario development
The European modelling scenario is based on DNV GL’s vision of the most likely future quantified per
country. The main sources are:
- DNV GLs Energy Transition Outlook 2020 (DNV GL, 2020)
- ENTSO-E Ten Year Network Development Plan (TYNDP) 2020
- National reports and insights from country experts
Figure 81 shows the main sources used for development of the scenarios for Lithuania.
Figure 81: Main sources for Lithuania scenario development

Page 138 of 138
DNV GL - Scenario Building for the Evolution of Lithuanian Power Sector for 2020-2050 litgrid test
About DNV GL DNV GL is a global quality assurance and risk management company. Driven by our purpose of safeguarding life, property and the environment, we enable our customers to advance the safety and sustainability of their business. We provide classification, technical assurance, software and independent expert advisory services to the maritime, oil & gas, power and renewables industries. We also provide
certification, supply chain and data management services to customers across a wide range of industries. Operating in more than 100 countries, our experts are dedicated to helping customers make the world
safer, smarter and greener.


