
A peer-reviewed version of this preprint was published in PeerJ on 7August 2014.
View the peer-reviewed version (peerj.com/articles/511), which is thepreferred citable publication unless you specifically need to cite this preprint.
Munguia-Vega A, Jackson A, Marinone SG, Erisman B, Moreno-Baez M, Girón-Nava A, Pfister T, Aburto-Oropeza O, Torre J. (2014) Asymmetric connectivityof spawning aggregations of a commercially important marine fish using amultidisciplinary approach. PeerJ 2:e511 https://doi.org/10.7717/peerj.511
1
1
Asymmetric connectivity of spawning aggregations of a commercially important 1
marine fish using a multidisciplinary approach 2
3
Adrian Munguia-Vega1,2, Brad Erisman3, Alexis Jackson4, Silvio Guido Marinone5, 4
Marcia Moreno-Baez3, Alfredo Girón6, Tad Pfister7, Octavio Aburto-Oropeza3, Jorge 5
Torre1 6
7
1 Comunidad y Biodiversidad A.C., Guaymas, Sonora, México 8
2 Conservation Genetics Laboratory, School of Natural Resources and the Environment, 9
The University of Arizona, Tucson, AZ, USA 10
3 Marine Biology Research Division, Scripps Institution of Oceanography, University of 11
California, San Diego, La Jolla CA, USA 12
4 Department of Ecology and Evolutionary Biology, University of California Santa Cruz, 13
Santa Cruz, CA, USA 14
5 Departamento de Oceanografía Física, Centro de Investigación Científica y de 15
Educación Superior de Ensenada, Ensenada, Baja California, México 16
6Universidad Autónoma de Baja California, Ensenada, Baja California, México 17
7 School of Natural Resources ant the Environment, Center for Latin American Studies, 18
The University of Arizona, Tucson, AZ, USA 19
20
Corresponding Author: Adrian Munguia-Vega. Comunidad y Biodiversidad A.C., Isla del 21
Peruano 215, Col. Lomas de Miramar, Guaymas, Sonora CP 85448, Mexico. Phone: + 22
(52) 612-1232233. E-mail: [email protected] 23
PeerJ PrePrints | https://peerj.com/preprints/170v1/ | v1 received: 23 Dec 2013, published: 23 Dec 2013, doi: 10.7287/peerj.preprints.170v1
PrePrin
ts

2
2
Abstract 24
Understanding patterns of larval dispersal is key in determining whether no-take marine 25
reserves are self-sustaining, what will be protected inside reserves and where the benefits 26
of reserves will be observed. However, explicitly incorporating dispersal data into 27
designing reserves for fisheries and conservation is still uncommon in many places 28
around the world. We followed a multidisciplinary approach that merged detailed 29
descriptions of fishing zones and spawning time at 17 sites distributed in the Midriff 30
Island region of the Gulf of California (GC) with a biophysical oceanographic model that 31
simulated larval transport at Pelagic Larval Duration (PLD) 14, 21 and 28 days for the 32
most common and targeted predatory reef fish (leopard grouper Mycteroperca rosacea). 33
M. rosacea is endemic to the GC and considered ‘Vulnerable’ according to World 34
Conservation Union. We described metapopulation dynamics using graph theory and 35
employed empirical sequence data from a subset of 10 sites at two mitochondrial genes to 36
verify the model predictions. Our approach made sense of seemingly chaotic patterns of 37
genetic diversity and structure, and provided a mechanistic explanation of the location of 38
fishing zones. Most of the connectivity patterns observed were strictly asymmetric, 39
except for a small region in the Southeast. The best-supported gene flow model 40
confirmed a pulse of larvae from the Baja Peninsula, across the GC and northward up the 41
Sonoran coastline, in agreement with the cyclonic gyre present at the peak of spawning 42
(May). We found support that genetic diversity increased in sink sites that concentrated 43
larvae from many sources at the time of larval flexion (PLD 14 days), while diversity 44
decreased at important gateways identified at PLD 28 days with high betweenness 45
centrality that are key for multigenerational dispersal and population resilience. Heavily 46
PeerJ PrePrints | https://peerj.com/preprints/170v1/ | v1 received: 23 Dec 2013, published: 23 Dec 2013, doi: 10.7287/peerj.preprints.170v1
PrePrin
ts
3
3
targeted fished areas seem to be sustained by high levels of local retention, contribution 47
of larvae from upstream sites and oceanographic patterns that concentrate larval density 48
from all over the region. The general asymmetry in marine connectivity observed 49
highlights that benefits from reserves are biased towards particular directions, that no-50
take areas need to be located upstream of targeted fishing zones, and that some fishing 51
localities might not directly benefit from avoiding fishing within reserves located 52
adjacent to their communities. We discuss the implications of marine connectivity for the 53
current network of marine protected areas and no-take zones, and identify ways of 54
improving it. 55
56
57
58
59
60
61
62
63
64
65
66
67
68
69
PeerJ PrePrints | https://peerj.com/preprints/170v1/ | v1 received: 23 Dec 2013, published: 23 Dec 2013, doi: 10.7287/peerj.preprints.170v1
PrePrin
ts
4
4
Introduction 70
Knowledge of patterns of larval dispersal is essential to implement fully-protected 71
marine reserves (no-take zones), a tool frequently used to enhance the conservation of 72
biodiversity and the recovery of fisheries (Gaines et al. 2010). Reserves must either be 73
self-sufficient via local retention (larvae retained or returning to the reserve where they 74
were produced), or need to be linked by a network of reserves for persistence (larval 75
supply from reserves to other reserves/fished sites) (Hastings & Botsford 2006; White et 76
al. 2010). However, the efficacy of networks of reserves has been hindered by a lack of 77
knowledge regarding complex patterns of marine connectivity (Burgess et al. 2013; Sale 78
et al. 2005). A multidisciplinary approach could best address the intricacy of connectivity 79
by merging biophysical models of ocean currents that generate connectivity hypotheses 80
using detailed biological information on the spatial and temporal distribution of 81
propagules (larvae), followed by validation with empirical population genetics data 82
(Alberto et al. 2011; Crandall et al. 2012; Feutry et al. 2013; Foster et al. 2012; Soria et 83
al. 2012). A multi-prong approach could also help advance an increasing interest in 84
incorporating genetic information into marine spatial planning, for instance, by 85
identifying sites with high genetic diversity that hold evolutionary potential under future 86
environmental change (Beger et al. 2013). 87
Marine connectivity within a single species is influenced by multiple biological and 88
physical factors including: spawning time and location, pelagic larval duration (PLD), 89
their interaction with ocean current speed and direction, as well as the distribution of 90
suitable habitat for settlement (Cowen & Sponaugle 2009). Additionally, many 91
commercially exploited species of invertebrates and fishes display meta populations that 92
PeerJ PrePrints | https://peerj.com/preprints/170v1/ | v1 received: 23 Dec 2013, published: 23 Dec 2013, doi: 10.7287/peerj.preprints.170v1
PrePrin
ts

5
5
are connected via larval dispersal (Cowen 2000). This is why relatively few attempts 93
have been done to establish multidisciplinary approaches to understand marine 94
connectivity, and the great challenge is to find a key species that can be a relevant case 95
study, and which can be use to gather this information relative easily and can be use as an 96
umbrella species to design marine reserves. 97
The leopard grouper Mycteroperca rosacea (Streets, 1877), is a large 98
predatory reef fish (Teleostei: Epinephelidae) endemic to the Gulf of California (GC) 99
bioregion. It ranges from Bahía Magdalena in the Pacific coast of the Baja California 100
Peninsula south to Bahía Banderas in Nayarit, Mexico, including all rocky-reefs within 101
the interior of GC (Hastings et al. 2010; Robertson & Cramer 2009; Thomson et al. 102
2000). Ecologically, it represents the most common and numerically abundant fish top 103
predator on reefs in the entire GC. Individuals can reach 1 m in length and at least 22 104
years of age (Diaz-Uribe et al. 2001). Histological and population data indicate 105
gonochorism, with no evidence of post-maturational sex change found in adults caught in 106
the wild (Erisman et al. 2007b). Adults form spawning aggregations of hundreds of 107
individuals during spring in the GC, with spawning occurring earlier in southern 108
locations (Erisman et al. 2007a; Sala et al. 2003). Spawning occurs in the evening within 109
groups of 6 to 40 individuals and is not correlated with the lunar cycle (Erisman et al. 110
2007a). 111
Small fisheries world-wide comprise most of the global catch, yet most lack formal 112
assessments and are thought to continue to decline (Costello et al. 2012). M. rosacea is 113
the most heavily targeted grouper by commercial, artisanal, and recreational fisheries in 114
the GC (Craig et al. 2012; Sala et al. 2003). Due to increased fishing pressure and 115
PeerJ PrePrints | https://peerj.com/preprints/170v1/ | v1 received: 23 Dec 2013, published: 23 Dec 2013, doi: 10.7287/peerj.preprints.170v1
PrePrin
ts
6
6
observed declines in fisheries landings, sizes of harvested fish, and population 116
abundances in some areas of the GC over the past few decades (Sala et al. 2004), the 117
World Conservation Union (IUCN) currently lists M. rosacea as ‘Vulnerable’ (Craig & 118
Sadovy 2008). While commercial fishers are required to hold a finfish permit and record 119
their landings of leopard grouper to their local fisheries offices, no specific regulations 120
related to catch, size, or gear restrictions exist for this species. Currently, all M. rosacea 121
catches are aggregated in the finfish group with other 270 fish species according to the 122
National Fisheries Chart (CNP 2012). Marine Protected Areas (MPAs) represent the 123
primary, current conservation and management strategy that has been implemented for 124
this or any other reef fish in the GC, and are mainly concentrated in the western coast of 125
the GC and contain a few small no-take zones (Fig. 1) (Aburto-Oropeza et al. 2011; 126
Cudney-Bueno et al. 2009). 127
Our goal was to identify the potential larval connectivity of spawning aggregation 128
sites and fishing zones for M. rosacea where larvae recruit in the Midriff Island region of 129
the GC. We first determined the distinct spawning season for leopard grouper and 130
identified the spatial distribution of spawning aggregation sites and fishing zones across 131
the entire region. We modeled connectivity with a biophysical model and used graph 132
theory to describe metapopulation dynamics. We then contrasted distinct measures 133
derived from graph theory against empirical estimates of genetic diversity and 134
differentiation to corroborate model expectations' and identify sites that are likely self-135
sustaining and important sources and sinks for leopard grouper larvae, including locations 136
that may lie inside or outside the borders of existing MPAs. Results of this study provide 137
insights on validating biophysical models with empirical genetic data, on the benefits and 138
PeerJ PrePrints | https://peerj.com/preprints/170v1/ | v1 received: 23 Dec 2013, published: 23 Dec 2013, doi: 10.7287/peerj.preprints.170v1
PrePrin
ts

7
7
limitations of the current network of MPAs to fishing communities in the Midriffs region 139
that harvest M. rosacea and help identify areas that may serve as ideal locations for 140
spawning or juveniles refuges of this economically important yet vulnerable species. 141
142
Methods 143
Spawning sites, season and period 144
We examined information acquired from underwater and fisheries surveys 145
conducted at locations throughout the Midriffs Islands region in the GC, Mexico (Fig. 1) 146
in order to identify representative sites to simulate the dispersal of leopard grouper eggs 147
and larvae from spawning aggregation sites. Underwater surveys were performed at 33 148
sites throughout the Midriffs during the spawning season of M. rosacea (April to June) in 149
2008, 2009, and 2010. Evidence of the formation of spawning aggregations were based 150
on standard protocols (Colin et al. 2003) and those adapted for leopard grouper (Erisman 151
et al. 2007b). Direct evidence of spawning aggregations included observations of 152
courtship or spawning behavior or the collection of females with hydrated or ovulated 153
oocytes. Indirect evidence involved observations of putative females with enlarged 154
abdomens indicative of imminent spawning, color patterns associated with courtship, the 155
collection of males with ripe testes, and abundances and densities of fish that were 156
markedly higher (e.g., 3-fold increases or greater) than observed during non-spawning 157
months. Additional indirect evidence of spawning aggregations was acquired through 158
interviews with commercial fishers at five fishing communities (Bahía de los Ángeles, 159
Bahía de Kino, Desemboque Seri, Puerto Libertad and Punta Chueca) during 2005 and 160
2006 (Moreno-Báez et al. 2012; Moreno-Baez et al. 2010). 161
PeerJ PrePrints | https://peerj.com/preprints/170v1/ | v1 received: 23 Dec 2013, published: 23 Dec 2013, doi: 10.7287/peerj.preprints.170v1
PrePrin
ts

8
8
Spatial units (Fig. S1) were established to evaluate spatial connectivity by 162
combining physical and political boundaries, as well as local knowledge from fishers 163
(Moreno-Báez et al. 2012; Moreno-Baez et al. 2010). We incorporated coastline and 164
bathymetry developed by the National Geophysical Data Center 165
(http://www.ngdc.noaa.gov/mgg/shorelines/shorelines.html) and the marine protected 166
areas in Mexico (www.conanp.gob.mx), respectively. We used the spatial union function 167
to integrate the different boundaries and define the spatial units, under ArcGIS 10.1 168
(ESRI) with the Spatial Analyst Extension and Model Builder tools. The size of the 169
spatial units varied from 13 to 812 km2 (Fig. S1). 170
While the general spawning season for M. rosacea in the GC occurs from late 171
April to June (Erisman et al. 2007a), it was necessary to collect empirical data to narrow 172
the specific spawning season from the Midriff Islands region. We acquired gonad 173
samples of adult female leopard groupers (i.e. > 30 cm TL; Erisman et al. 2007a) from 174
commercial fishers on a monthly basis from December 2008 to June 2010. Fish were 175
captured by gill nets or handlines at various sites at or near San Pedro Martir and Tiburon 176
islands, and Bahia Kino (Fig. 1). We processed tissue taken from the central portion from 177
one gonad lobe for each sample using standard histological techniques (Humason 1972) 178
in order to determine sex and developmental stage. Classes of ovarian and testicular 179
development were adapted from previous studies (Erisman et al. 2007b), and stages of 180
gametogenesis followed previously established definitions (Wallace & Selman 1981). 181
We determined the duration of the spawning season using a combination of two 182
methods. First, we examined the histological preparations of all gonad samples to identify 183
the percentage of females capable of spawning or actively spawning during each month 184
PeerJ PrePrints | https://peerj.com/preprints/170v1/ | v1 received: 23 Dec 2013, published: 23 Dec 2013, doi: 10.7287/peerj.preprints.170v1
PrePrin
ts
9
9
of sampling. Females categorized as ‘spawning capable’ included those with ovaries 185
dominated by oocytes in advanced stages of vitellogenesis (e.g., primary to tertiary yolk 186
stage), whereas those categorized as ‘actively spawning’ contained ovaries with oocytes 187
in the migratory nucleus, hydrated, or ovulated stage or post-ovulatory follicles were 188
present. Data were pooled by month to estimate the monthly proportion of spawning 189
females over a calendar year. Dates on which actively spawning females were collected 190
were used as indicators to determine exact dates of spawning. A second estimate of the 191
spawning season was obtained by calculating the mean monthly gonadosomatic index 192
(GSI = 100* gonad weight/ total body weight) of female M. rosacea over the study 193
period. Changes in monthly GSI were used to assess reproductive activity, associating 194
elevated levels with gonadal development and spawning. This information was used in 195
the release dates for larvae in the oceanographic model (see below). 196
197
Supporting fishing knowledge 198
The central component to documenting the fishing grounds for the M. rosacea was 199
captured through a series of interviews implemented across 17 fishing communities in the 200
northern GC (Moreno-Báez et al. 2010, Moreno-Báez et al., 2012). The methodology 201
entailed aggregating local knowledge of a representative set of individual fishers 202
(captains) through semi-structured interviews conducted between December 2005 and 203
July 2006 regarding what, where, when and how they fish. The interview included 204
questions regarding the spatial and temporal distribution of fishing activities but also, 205
their knowledge about spawning aggregations and juvenile sights. The maps were 206
digitized, georeferenced, and integrated into a geographic information systems (GIS) 207
PeerJ PrePrints | https://peerj.com/preprints/170v1/ | v1 received: 23 Dec 2013, published: 23 Dec 2013, doi: 10.7287/peerj.preprints.170v1
PrePrin
ts

10
10
using ArcGIS 9.2 (ESRI, 1999 - 2008). 208
These interviews indicated that fishing activity frequently overlapped spatially with 209
spawning aggregation sites in three main regions: 1) the north end of Angel de la Guarda 210
Island; 2) on the south, western and northern edge of Tiburon Island, and on sites in 211
mainland Sonora north of Tiburon, around Las Cuevitas, Puerto Libertad and Puerto 212
Lobos (yellow areas Fig. 1). Other important fishing zones were identified around Puerto 213
Peñasco in northern Sonora. According to the interviews, the principal fishing season 214
starts in November and ends in June. 215
Oceanographic model 216
In a computer simulation exercise, four thousand particles were released at a 217
depth of 5 m at each of 17 spawning aggregation sites (see below). Particles were tracked 218
for 28 days, which is close to the maximum pelagic larval duration (PLD) for M. rosacea 219
(Aburto-Oropeza et al. 2007). We released particles during May 16th and May 25th of 220
2007, which based on our observations covers the peak spawning period around the 221
Midriff Islands region (see Results). Since seasonal oceanographic regimes are consistent 222
across years in the GC (Marinone 2003; Soria et al. 2013), the simulation year was 223
chosen arbitrarily (2007) while the dates covered spring and neap tides. The phase of the 224
springs-neaps cycle is simply shifted from year to year. 225
We used the velocity field from the GC implementation of the three-dimensional 226
baroclinic Hamburg Shelf Ocean Model (HAMSOM) (Backhaus 1985) to calculate the 227
particle trajectories. The model has been described in detail for the GC (Marinone 2003; 228
Marinone 2008). Its domain has a mesh size of 2.5′/3 × 2.5′/3 (~1.31 × 1.54 km) in the 229
horizontal and 12 layers in the vertical with nominal lower levels at 10, 20, 30, 60, 100, 230
PeerJ PrePrints | https://peerj.com/preprints/170v1/ | v1 received: 23 Dec 2013, published: 23 Dec 2013, doi: 10.7287/peerj.preprints.170v1
PrePrin
ts
11
11
150, 200, 250, 350, 600, 1000 and 4000 m. The model equations are solved semi-231
implicitly with fully prognostic temperature and salinity fields, thus allowing time-232
dependent baroclinic motions. The model is started from rest with a 300 s time step and 233
becomes periodically stable after three years. Results for this study were obtained from 234
the fourth year of the model when it adequately reflects the main seasonal signals of 235
surface temperature, heat balance, tidal elevation and tidal currents and surface 236
circulation in the NGC (Lavin et al. 1997; Marinone 2003). The forcing includes at the 237
open boundary model tidal components (M2, S2, N2, K2, K1, O1, P1, Ssa, and the Sa), 238
climatological hydrography historical data and at the sea surface climatological heat and 239
fresh water fluxes. We used the seasonal climatology constructed from QUICKSCAT 240
data as forcing for wind. The Lagrangian trajectories are due to the Eulerian velocity field 241
plus a random-walk contribution related to turbulent eddy diffusion processes (Proehl et 242
al. 2005; Visser 1997). We obtained values of the diffusivities from the numerical model. 243
A pseudo-advective term was introduced, since the vertical diffusivity is not constant, to 244
prevent particles from walking away from areas of high to low diffusivities. The velocity 245
at each particle position and the vertical eddy coefficients are calculated by bilinear 246
interpolation of the instantaneous Eulerian velocity fields and the eddy coefficient from 247
the numerical model, which were saved every hour. The horizontal diffusivity is taken as 248
a constant (100 m2/s). We reasonably assumed that larvae are advected as passive 249
particles and do not migrate vertically downward to deep depths (Watson et al. 2010), 250
given that leopard grouper recruit to shallow Sargassum spp. beds of < 5 m deep 251
(Aburto-Oropeza et al. 2007). 252
253
PeerJ PrePrints | https://peerj.com/preprints/170v1/ | v1 received: 23 Dec 2013, published: 23 Dec 2013, doi: 10.7287/peerj.preprints.170v1
PrePrin
ts
12
12
Modeled connectivity 254
Hourly latitude and longitude data for each modeled particle were imported into 255
MatLab (MATHWORKS). We estimated connectivity at different time intervals: 336 h 256
(14 days), 504 h (21 days) and 672 h (28 days) respectively after the released dates. 257
These PLDs were selected based on the average time of flexion in groupers that 258
corresponds to the onset of larval behavior (14 days) (Cowen 2002; Gracia-Lopez et al. 259
2005) and the maximum PLD (Aburto-Oropeza et al. 2007). A selection by location 260
function “inpolygon” was used to identify the intersection between particles and the 261
recruitment areas (spatial units). We then generated connectivity matrices using the 262
proportion of larvae that settled at each location relative to the total number of larvae 263
released at each site. We constructed matrices averaging for the two spawning dates May 264
16th and May 25th within each PLD (i.e. day 14, 21, 28). The probability of local retention 265
(i.e., diagonal in the connectivity matrix) was calculated as the proportion of particles 266
produced locally that remained within the spatial unit at the end of the PLD (Burgess et 267
al. 2013). The probabilities within each site were summarized with two statistics aimed at 268
describing source-sink dynamics. Export probability was defined as the proportion of 269
larvae produced within a site that successfully settled within any of the other 16 coastal 270
areas left at the end of the PLD. Import probability was defined as the proportion of all 271
larvae produced among the 17 sites that settled within each site. This later metric is 272
identical to self-recruitment as defined by Burgess et al. 2013. 273
Marine connectivity patterns were displayed using graph theory and a spatial 274
network approach (Treml et al. 2012) with the software NODEXL (Smith et al. 2010). 275
We calculated four statistics that describe the relationships among elements in complex 276
PeerJ PrePrints | https://peerj.com/preprints/170v1/ | v1 received: 23 Dec 2013, published: 23 Dec 2013, doi: 10.7287/peerj.preprints.170v1
PrePrin
ts
13
13
networks (Newman 2003), including: 1) graph size (the total number of directed links 277
within a graph); 2) in-degree (number of links that enter a node); 3) out-degree (number 278
of links that leave a node); and 4) betweenness centrality, or the proportion of shortest 279
paths between all node pairs that pass through a particular node, which highlights ‘most 280
used’ dispersal pathways or stepping stones that act like gateways though which genes or 281
individuals have to pass to spread to other nodes, emphasizing key sites for 282
multigenerational connectivity (Andrello et al. 2013). Betweenness centrality can be 283
viewed as a measure of resilience by measuring how many paths will get longer when a 284
node is removed (Newman 2003). 285
286
Genetic connectivity 287
We collected tissue samples from the pectoral fins of M. rosacea from 10 sites 288
included in our modeling exercise around the Midriff Islands region (Fig. 1). Samples 289
were acquired in fish markets or directly from fishermen at harbors between 2009 and 290
2012 under IACUC protocol Berng1101. We interviewed both fish vendors and 291
fishermen to determine the approximate localities where fish were collected. 292
Immediately after collection, samples were stored in 95% ethanol and kept at -20ºC in the 293
laboratory. Genomic DNA was extracted using standard chloroform extraction protocols 294
(Sambrook et al. 1989). We amplified a 787 bp fragment of mitochondrial marker 295
cytochrome b using primers Gludgl and CB3H (Palumbi et al. 1991). Thermocycler 296
parameters were as follows: initial hold at 94°C/5 min, 35 cycles of 94°C/45 sec, 45°C/45 297
sec, 72°C/45 sec, with a final extension of 72°C/7 min. We developed species-specific 298
primers for M. rosacea (MYCROS Forward: TTCTCCCACTACCCTGATTC and 299
PeerJ PrePrints | https://peerj.com/preprints/170v1/ | v1 received: 23 Dec 2013, published: 23 Dec 2013, doi: 10.7287/peerj.preprints.170v1
PrePrin
ts
14
14
MYCROS Reverse: TACGTAGGCTTGGATCATTG) to amplify a 726 bp fragment of 300
mitochondrial marker ATPase. Thermocycler parameters were as follows: initial hold at 301
94°C/5 min, 35 cycles of 94°C/30 sec, 54°C/30 sec, 72°C/30 sec, with a final extension 302
of 72°C/7 min. After purification of PCR products following ABI manufacturer’s 303
protocols (ABI, Perkin-Elmer), we sequenced clean PCR products on an ABI 3730xl 304
automated sequencer (Applied Biosystems, Foster City, CA). 305
We calculated molecular diversity indices including nucleotide diversity (π) and 306
haplotype diversity (h). We corrected haplotype diversity using CONTRIB (Petit et al. 307
1998) to account for differences in sample size between sites based on rarefaction to a 308
minimum sample size of n = 4. Theory predicts that genetic diversity levels observed 309
whiting sites is highly dependent upon the amount of migration from source populations 310
(Gaggiotti 1996), and that genetic diversity increases in sink sites that concentrate larvae 311
from multiple sources (Kool et al. 2011). To compare directly the ocean model with the 312
empirical genetic data, we performed simple linear regressions between corrected 313
haplotype diversity and in-degree, out-degree and betweenness centrality estimates for 314
networks at each PLD. To explore the possibility that patterns could be confounded if a 315
single outlier site if it would have been modeled wrong, we repeated the regressions 316
leaving out one site at a time. 317
Phylogenetic relationships among sequences were inferred from a haplotype 318
network based on pairwise differences between haplotypes generated using Arlequin 319
(Excoffier et al. 2005) and R software. To test for hierarchical population structure we 320
performed an Analysis of Molecular Variance (AMOVA) in Arlequin. AMOVA 321
significance was estimated using a permutation test of 10,000 replicates. The 10 sites 322
PeerJ PrePrints | https://peerj.com/preprints/170v1/ | v1 received: 23 Dec 2013, published: 23 Dec 2013, doi: 10.7287/peerj.preprints.170v1
PrePrin
ts
15
15
were clustered into three regions: Baja Peninsula (La Ventana, La Poma and San 323
Francisquito), the Midriff Islands (San Pedro Martir, Salsipuedes, Datil, San Esteban) and 324
the Sonoran coast (Puerto Libertad, El Tecomate, Puerto Lobos, Puerto Libertad). Chi-325
squared analyses were concurrently performed using DnaSP version 5.10 (Librado & 326
Rozas 2009) to test for patterns of regional subdivision. Pairwise comparisons were 327
made between each location to assess patterns of genetic differentiation. 328
We evaluated three different migration models using Migrate-n 3.2.16 (Beerli & 329
Palczewski 2010). First, we tested an unrestricted full migration model between all 330
sampling localities. Next, we considered two models with three population sizes 331
comprised of a subsampling (n=30) from sampling localities in the Baja Peninsula, the 332
Midriff Islands, and the Sonoran coast. One model assessed unidirectional gene flow 333
from the Baja Peninsula, across the Midriff Islands, and northward up the Sonoran coast, 334
while the other model tested gene flow in the reverse direction. The latter two models 335
reflect seasonal differences in directionality of a cyclonic (May to September) and 336
anticlyclonic (October to April) gyres, respectively, present in the northern GC 337
(Marinone 2003; Marinone 2012). Using a Bezier approximation, we chose the most 338
appropriate model for our dataset by taking the natural log of the ratio of the marginal 339
likelihoods (Baye’s factors) for each model (Beerli & Palczewski 2010). Running 340
conditions for Migrate-n were as follows: 5,000,000 recorded steps, a burn-in of 341
2,500,000 steps, a static heating scheme using 20 temperatures, a tree swapping interval 342
of 1, and an upper prior boundary for migration set to 7,500. 343
344
345
PeerJ PrePrints | https://peerj.com/preprints/170v1/ | v1 received: 23 Dec 2013, published: 23 Dec 2013, doi: 10.7287/peerj.preprints.170v1
PrePrin
ts

16
16
Results 346
Spawning sites, season and period 347
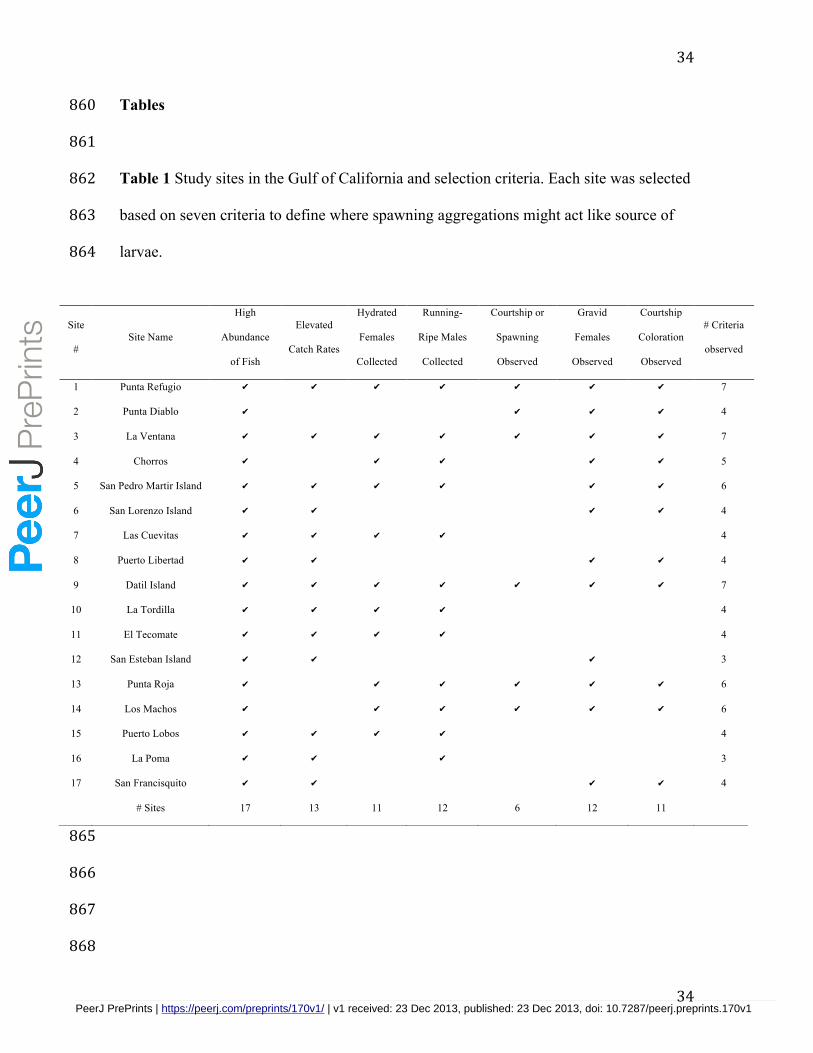
We chose seventeen sites representative of distinct spatial units for the release of 348
virtual larvae in the simulation model based on direct and indirect evidence of the 349
presence of spawning aggregations for leopard grouper (Table 1). Although some spatial 350
units had evidence of multiple spawning aggregations, we assumed their close proximity 351
along with the spatial resolution of the oceanographic model meant multiple aggregations 352
within the same unit would disperse larvae in similar directions. Individual sites were 353
distributed throughout the region and fulfilled a range of 3 to 7 criteria, with an average 354
of 4.76±1.48 (SD). A marked increase in the abundance of adult groupers during the 355
spawning season relative to the non-spawning season was the most common evidence 356
(recorded at all 17 sites). Other types of indirect evidence such as the observation of 357
gravid females with swollen abdomens, observations of fish exhibiting courtship 358
coloration, the collection of running-ripe males, or elevated catch rates by fishers during 359
the spawning season were recorded for the majority of sites. Direct evidence of spawning 360
via the collection of hydrated females was recorded for 65% of the sites, whereas 361
spawning was observed at only 35% of the sites. 362
A total of 162 samples of female M. rosacea were collected from commercial 363
fishers over the study period, with an average of 14 samples collected each month (range 364
= 8 to 27). Based on microscopic examinations of gonadal tissue samples, females in the 365
spawning capable phase were collected from March through June, and actively spawning 366
females were collected April to June. Similarly, the GSI of adult females showed 367
elevated levels from April to June, with a peak during May (Fig. 2). When the results of 368
PeerJ PrePrints | https://peerj.com/preprints/170v1/ | v1 received: 23 Dec 2013, published: 23 Dec 2013, doi: 10.7287/peerj.preprints.170v1
PrePrin
ts

17
17
the gonadal phases and GSI were combined, they indicate that M. rosacea spawn from 369
April to June in the Midriffs region, with peak spawning activity occurring in May. 370
Actively spawning females were collected on three days in 2009 (14 May, 31 May, 25 371
June) and two days in 2010 (25 April, 7 May). 372
373
Modeled connectivity 374
From all simulated particles released (4,000 particles x 17 sites x two release 375
dates = 136,000), coastal areas that are suitable for larval recruitment captured 41.84% 376
(PLD 14 days), 35.24% (PLD 21 days) and 33.26% (PLD 28 days). Remaining particles 377
did not reach any coastal habitat by the end of the PLD. Simulations of ocean currents 378
produced the highest concentrations of larvae in coastal areas north of Tiburon Island 379
after PLD 28 days (around Las Cuevitas Fig. 3), followed by the south end of Tiburon 380
Island, Puerto Libertad, and the north end of Angel de la Guarda Island. Simulations at 381
PLD 14 and 21 days indicated similar trends (Fig. 3). 382
The trajectories of particles released from each site at the two dates (Fig. 4a and 383
4b) showed sites in the Baja California Peninsula generally followed a southward 384
direction (except those released from La Ventana that entered the Canal de Ballenas), 385
while sites on mainland Sonora and the north edge of Tiburon Island followed a 386
northward trajectory. Most locations around Angel de la Guarda Island and Tiburon 387
Island had particles dispersing north and south of the release site. In all cases, the 388
distance traveled by particles was directly proportional to the PLD. The graph size of the 389
connectivity networks increased from 38 edges at PLD 14 days, to 59 at PLD 21 days and 390
67 at PLD 28 days, indicating a longer PLD is associated with more connected and 391
PeerJ PrePrints | https://peerj.com/preprints/170v1/ | v1 received: 23 Dec 2013, published: 23 Dec 2013, doi: 10.7287/peerj.preprints.170v1
PrePrin
ts

18
18
complex networks (Fig. 5). Although few differences were observed between networks 392
derived from the two release dates (see Fig. S2 for an example at PLD 28 days), 393
connectivity patterns showed similar trends. Based on the directionality of the links in the 394
networks, three main patterns were evident. First, northward links were prevalent along 395
the eastern coast of the GC, in the Canal de Ballenas and between the southern end of 396
Angel de la Guarda Island and San Lorenzo Island across the GC towards the northern 397
end of Tiburon Island and mainland Sonora (Fig. 5). Second, southward links were 398
present between the eastern coast of Angel de la Guarda Island towards southern 399
locations in San Lorenzo Island and Baja California and across the GC to Tiburon Island 400
and San Esteban Island. Third, bi-directional north-south links were evident only in a 401
small area located between San Pedro Martir Island, San Esteban Island and the southern 402
end of Tiburon Island. Overall, the strongest links (i.e., those showing the larger 403
probabilities) were observed between the western and northern coasts of Tiburon Island 404
towards northern localities situated in mainland Sonora and in the Canal de Ballenas (Fig 405
5). 406
The probability of local retention decreased with increasing PLD, except in Datil 407
(Fig. 6). According to the ocean model, local retention was most likely in Puerto Libertad 408
(range: 0.26 to 0.72 for PLD 28 and 14 days, respectively), the northern end of Tiburon 409
Island (El Tecomate, range: 0.21 to 0.69), followed by the northern end of Angel de la 410
Guarda Island (Punta Refugio, range: 0.28 to 0.46), the western coast of Tiburon Island 411
(La Tordilla, range: 0.07 to 0.35), and the southern coast of Tiburon Island (Datil Island, 412
range: 0.13 to 0.24). With one exception (Puerto Lobos at PLD 14), all other sites had 413
probabilities below 0.07. 414
PeerJ PrePrints | https://peerj.com/preprints/170v1/ | v1 received: 23 Dec 2013, published: 23 Dec 2013, doi: 10.7287/peerj.preprints.170v1
PrePrin
ts
19
19
Our analyses about the performance of each site on the network using statistics 415
describing the probabilities of local retention, export/import and the number of 416
connections leaving and entering each site (degree) illustrated the spatial overlap of some 417
criteria, highlighting a few sites that were important despite variation in PLD (Fig. 6, 418
Table S1-S3). For instance, Tecomate on the north of Tiburon Island and Puerto Libertad 419
on mainland Sonora had the largest probabilities of export, import and local retention. 420
However, both sites exported larvae to only a few sites and showed relatively low 421
betweenness centrality. The north end of Angel de la Guarda Island (Puerto Refugio) also 422
had relatively large probability of import and local-retention, but low export probability 423
to few sites. Some sites acted exclusively as sources (e.g., La Ventana) with high export 424
probability to many sites despite low local retention and low import probabilities. Datil 425
Island was identified as a sink with intermediate levels of larvae imported from many 426
sites but relatively low export probabilities. Betweenness centrality was more sensitive 427
to PLD variation than the other measures, and identified Las Cuevitas on mainland 428
Sonora, the Southern end of Angel de la Guarda Island and La Ventana as key sites for 429
multigenerational larval dispersal through the entire network. 430
431
Genetic connectivity 432
We analyzed a 787 bp fragment of cytochrome b and a 726 bp fragment of 433
ATPase for 235 individuals. We identified a total of 77 haplotypes, with adjacent 434
haplotypes in the haplotype network separated by 1 to 4 bp (Fig. 7). There was limited 435
evidence of geographic separation of haplotypes, and the three most frequent haplotypes 436
were present in all locations, with the exception of the third most frequent which was 437
PeerJ PrePrints | https://peerj.com/preprints/170v1/ | v1 received: 23 Dec 2013, published: 23 Dec 2013, doi: 10.7287/peerj.preprints.170v1
PrePrin
ts
20
20
absent in San Francisquito on the Baja Peninsula. Corrected estimates of haplotype 438
diversity were high, ranging from 0.844 (San Lorenzo Island) to 0.943 (San Esteban 439
Island) (Table 2). Linear regression models were unable to find significant correlations 440
between empirical observations (corrected haplotype diversity) and modeled connectivity 441
measured with in-degree, out-degree and betweenness centrality at any PLD (all R2 < 442
0.147, P values > 0.550, Table S1-S3). However, upon elimination of one site at a time, 443
we observed two significant trends when San Lorenzo Island was excluded from the 444
analyses (Fig. 8). First, genetic diversity was significantly higher at sites with larger in-445
degree values estimated from the model at PLD 14 days (R2 = 0.489, P = 0.035, Fig. 8a). 446
Second, genetic diversity was significantly lower at locations showing higher 447
betweenness centrality according to the model at PLD 28 days (R2 = 0.471, P = 0.041, 448
Fig. 8b). All other comparisons leaving out one site were not significant (R2 < 0.170, P > 449
0.175). 450
Statistically significant pairwise estimates of genetic structure were observed 451
(Table 3). Pairwise φST values suggest Puerto Libertad is genetically divergent from the 452
majority of other sampling localities. Pairwise FST values suggest greater overall genetic 453
differentiation between most sampling localities, except between San Esteban Island and 454
all the other sites. Global estimates of FST and φST suggest moderate levels of population 455
structure within the northern Gulf (φST = 0.04663, P = 0.0001; FST = 0.10836, P < 456
0.00001). Regional genetic subdivision was also observed when sampling sites were 457
clustered into the following groups – Baja Peninsula, Midriff Islands and the Sonoran 458
coast. Genetic subdivision of regional groups was supported by a chi-squared test (χ2 = 459
186.876, d.f. = 152, P = 0.0286). Rankings of proposed larval dispersal models between 460
PeerJ PrePrints | https://peerj.com/preprints/170v1/ | v1 received: 23 Dec 2013, published: 23 Dec 2013, doi: 10.7287/peerj.preprints.170v1
PrePrin
ts

21
21
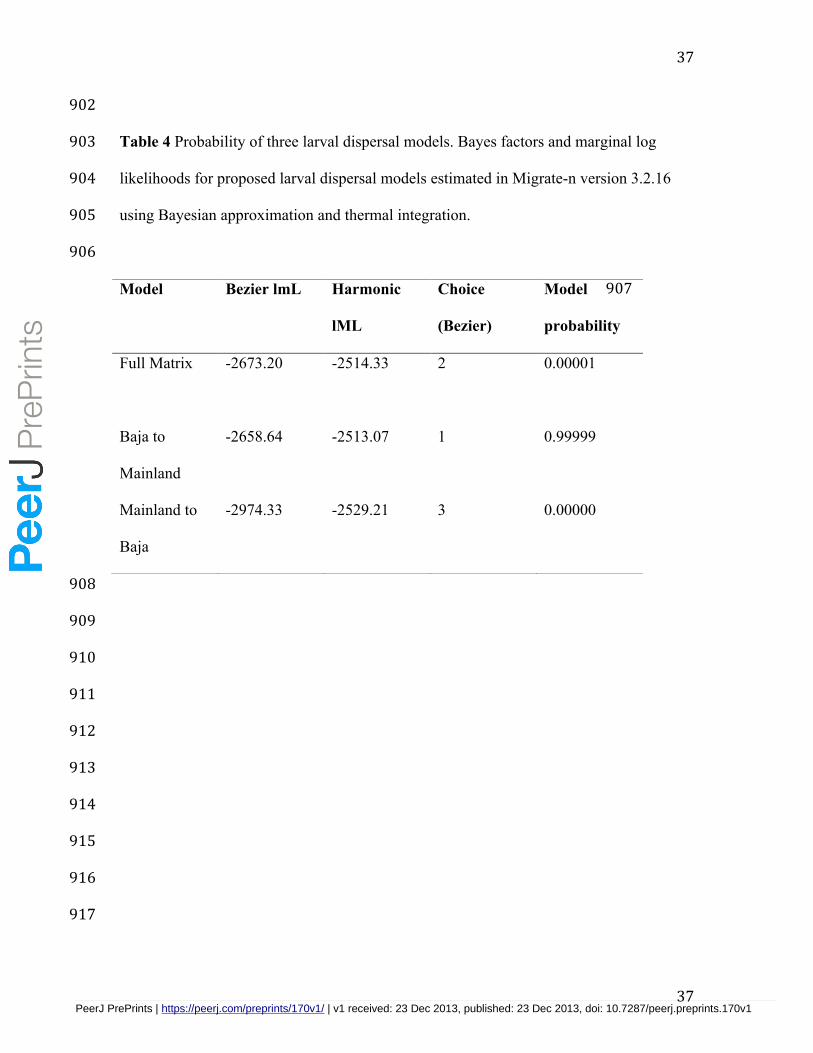
the aforementioned regions are listed in Table 4. The best-supported model was for 461
unidirectional larval dispersal from the Baja Peninsula to the mainland. There was minor 462
support for the full, unrestricted larval dispersal model and almost no support for 463
unidirectional larval dispersal from the mainland to the Baja Peninsula. 464
465
Discussion 466
Our study contribute to a growing body of literature (Alberto et al. 2011; Crandall 467
et al. 2012; Feutry et al. 2013; Foster et al. 2012; Galindo et al. 2010; Petitgas et al. 2012; 468
Selkoe et al. 2010; Soria et al. 2012) highlighting the inherent value of verifying outputs 469
of biophysical oceanographic models with empirical genetic data to inform larval 470
dispersal patterns and marine connectivity. Concordance of genetic and biophysical 471
modeling data for M. rosacea elucidate the role of oceanographic processes in driving 472
patterns of larval dispersal, while models helped to explain seemingly chaotic patterns of 473
genetic diversity and structure. The best supported gene flow model (based on genetic 474
subdivisions) confirmed biophysical model outputs demonstrating a pulse of larvae from 475
the Baja Peninsula, across the GC and northward up the Sonoran coastline, in agreement 476
with the cyclonic gyre present from May to September. Our modeled connectivity 477
networks mirrored these results. Furthermore, our study demonstrates that patterns of 478
oceanographic circulation in the GC may be a powerful predictor of source-sink 479
dynamics for M. rosacea. In our dataset we found support from empirical genetic data 480
that genetic diversity increases in sink sites that concentrate larvae from many sources. 481
However, the fact that patterns were significant only for PLD 14 days supports that larvae 482
reaching suitable habitat are already able to settle early at the average time of flexion in 483
PeerJ PrePrints | https://peerj.com/preprints/170v1/ | v1 received: 23 Dec 2013, published: 23 Dec 2013, doi: 10.7287/peerj.preprints.170v1
PrePrin
ts
22
22
groupers. Our results could suggest that biophysical models in combination with graph 484
theory could be used as a proxy for predicting genetic diversity, but further studies are 485
needed to verify the validity of this relationship across markers and species. For instance, 486
San Esteban Island, the site with the largest number of incoming sources of larvae at PLD 487
14 days and with the largest diversity of haplotypes, showed the lowest levels of genetic 488
differentiation according to pairwise statistics, likely as a result of high levels of gene 489
flow towards this site. In contrast, Puerto Libertad on mainland Sonora showed the 490
largest genetic differences compared to other sites, which could be explained by a higher 491
proportion of kin than expected by chance due to high levels of local retention (Iacchei et 492
al. 2013), as supported by the model regardless of PLD. By coupling modeled and 493
empirical connectivity approaches, we are able to better understand the mechanisms 494
driving dispersal in the Gulf and to potentially inform spatially explicit management 495
efforts for M. rosacea as well as marine organisms with similar life histories. However, 496
validation of the passive dispersal model through subsequent studies such as those that 497
use parentage analyses and highly polymorphic microsatellite loci are recommended and 498
underway. 499
Our study had several limitations. Below we discuss some of the major ones. The 500
relationship between patterns of genetic connectivity and modeled larval connectivity 501
was significant only after removing San Lorenzo Island, where, according to observed 502
levels of genetic variation, our ocean model seemed to have overestimated connectivity 503
in terms of the number of sources supplying larvae to that site. San Lorenzo is a relatively 504
thin and small island, and a detailed examination of the connectivity matrices indicated 505
that the scenario where most of the larvae arrive from multiple sites to this one, has very 506
PeerJ PrePrints | https://peerj.com/preprints/170v1/ | v1 received: 23 Dec 2013, published: 23 Dec 2013, doi: 10.7287/peerj.preprints.170v1
PrePrin
ts
23
23
small probabilities (< 0.01). These observations suggest that the large size of the spatial 507
unit in our study, relative to the small size of the island, coupled with a large bathymetric 508
profile around the island, likely biased real connectivity estimates, indicating room for 509
improving the spatial resolution of our analyses. While there is no direct evidence that 510
groupers larvae vertically migrate downward to escape advecting currents, there is a 511
growing body of evidence that suggests that local retention of larvae in groupers can be 512
quite high (Almany et al. 2013; Harrison et al. 2012). Thus our passive model could have 513
overestimated larval exchange rates and underestimated local retention (Cowen 2000). 514
However, the effects of vertical migration are comparable to those of reducing PLD 515
(Andrello et al. 2013). Investigations into larval behavior of groupers are warranted and 516
could greatly increase the precision and accuracy of the model. Our models did not 517
include an explicit description of the habitat for larval recruitment (Sargassum sp. beads), 518
neither considered larval mortality after settlement, thus we only assessed potential 519
connectivity, as opposed to realized connectivity. 520
Our multidisciplinary approach provided a mechanistic explanation of why some 521
areas in the Midriff Island region concentrate the fishing effort for leopard grouper in the 522
GC. Heavily targeted fished areas, including the north end of Angel de la Guarda Island, 523
the west, north and south edges of Tiburon Island and Las Cuevitas and Puerto Libertad 524
on mainland Sonora, showed the largest values of local retention of larvae, together with 525
a high probability of importing larvae from other spawning sites and for concentrating 526
larvae from all over the region. Notably, some of these are known to be sites that 527
historically have held huge spawning aggregations of leopard grouper that have been 528
harvested at high levels for decades, like the north end of Angel de la Guarda Island 529
PeerJ PrePrints | https://peerj.com/preprints/170v1/ | v1 received: 23 Dec 2013, published: 23 Dec 2013, doi: 10.7287/peerj.preprints.170v1
PrePrin
ts

24
24
(Cannon 1966). Thus, the main fishing areas seem to depend both on local retention and 530
contributions of larvae from upstream sites, coupled to oceanographic patterns that focus 531
larval density towards these areas that sustain most of the fisheries. 532
A key result of our study is the observation that marine connectivity for M. 533
rosacea around the Midriff island region is predominantly asymmetric. Other studies 534
have previously shown the negative effects that asymmetric connectivity has on 535
population persistence (Bode et al. 2008; Vuilleumier et al. 2010). In the presence of 536
strong asymmetric currents, reserves can significantly outperform traditional quota based 537
management strategies in terms of fisheries yield, with considerably less risk (Gaines et 538
al. 2003). Asymmetry also constrains the notion that benefits of reserves in terms of 539
larval input are proportional to their distance to the reserve (Almany et al. 2009; Buston 540
et al. 2012). For example, one study using DNA parentage analyses found that reserves in 541
the Great Barrier Reef, which accounted for 28% of the local reef area, produced 542
approximately half of all juvenile recruitment of snappers and groupers to both reserve 543
and fished reefs within 30 km of the source spawning site inside the reserve (Harrison et 544
al. 2012), while a similar study in Papua New Guinea found that 50% of larvae in a coral 545
grouper settled within 14 km of the spawning aggregation sites (Almany et al. 2013). In 546
contrast, the benefits of reserves are completely biased towards one particular direction in 547
the GC, highlighting that the spatial location of no-take zones is even more important in 548
the Midriff Island region than in other systems. An exception to the general asymmetry in 549
connectivity was detected in small area between the south edge of Tiburon Island, San 550
Esteban Island, and San Pedro Martir Island. 551
PeerJ PrePrints | https://peerj.com/preprints/170v1/ | v1 received: 23 Dec 2013, published: 23 Dec 2013, doi: 10.7287/peerj.preprints.170v1
PrePrin
ts

25
25
A network of no-take zones within the Midriff region might have a very well 552
defined zone of influence that does not include the eastern edge of Tiburon Island or any 553
locality towards the south in mainland Sonora. This observation has important practical 554
implications. For example, fishing localities on mainland Sonora South of Tiburon Island 555
are restricted from fishing at no-take areas within MPAs in the Midriffs, yet according to 556
this an other studies (Soria et al. 2013) they receive no benefit by not fishing there. 557
Conversely, fishing communities in mainland Sonora (Puerto Lobos, Puerto Libertad) 558
seem to receive great benefits from San Pedro Martir, San Esteban and Tiburon Islands, 559
even though they may not fish there. This brings up an important concept in highly 560
advective systems like the GC where there may be a spatial disconnect and strong 561
directionality between the location of no-take zones and the areas that benefit most from 562
them, and highlights that, in order of reserves to be effective, they need to be located 563
upstream of targeted fishing sites (Beger et al. 2010). Our analyses suggest that 564
establishment of smaller no-take zones at the north end of Angel de la Guarda Island 565
within the current MPA will likely boost local fisheries via local retention, while other 566
current no-take zones within the Canal de Ballenas and San Lorenzo MPA could export 567
larvae to fishing sites across the GC. The additional establishment of no-take zones 568
adjacent to current heavily fished areas in the western and northern edges of Tiburon 569
Island, and in the coast between Las Cuevitas-Puerto Lobos will likely increase not only 570
local fisheries (via local retention) but fisheries at downstream fished sites on mainland 571
Sonora as north as Puerto Peñasco (located ~300 km from Tiburon Island) via larval 572
dispersal. Notably, except for San Francisquito on the coast of Baja California, current 573
MPAs do not include those sink sites receiving larvae from multiple sources and that 574
PeerJ PrePrints | https://peerj.com/preprints/170v1/ | v1 received: 23 Dec 2013, published: 23 Dec 2013, doi: 10.7287/peerj.preprints.170v1
PrePrin
ts

26
26
harbor the largest genetic diversity and evolutionary potential (San Esteban and Tiburon 575
Islands). In other hand, the fact that key gateway routes for multigenerational dispersal 576
showing high betweenness centrality at PLD 28 days had low genetic variation (e.g. La 577
Ventana on Baja California, Las Cuevitas on mainland Sonora), stress that important sites 578
for long-term metapopulation persistence and resilience are not necessarily aligned 579
spatially with other criteria for protection, such as preserving evolutionary potential via 580
genetic variation. 581
582
Acknowledgements 583
We would like to acknowledge Rene Loiaza, Ivan Martinez, Angeles Cruz, Mario Rojo, 584
Kimberly Tenggardjaja, Eva Salas, Gary Longo, Emmett Ziegler and Ana Liedke for 585
their assistance with acquiring samples in the field. This a scientific contribution of the 586
multidisciplinary PANGAS project (www.pangas.arizona.edu). 587
588
ADDITIONAL INFORMATION AND DECLARATIONS 589
590
Funding 591
This work was funded by the David and Lucile Packard Foundation, National Geographic 592
(Young Explorers Grant #8928-11), the University of California Office of the President 593
(UC-HBCU Initiative grant), Marine Conservation Institute (Mia J. Tegner memorial 594
research grant), Ecology Project International, CenTread, the Dr. Earl H. Myers and Ethel 595
M. Myers Oceanographic and Marine Biology Trust, FCT (SFRH/BPD/26901/2006) and 596
the Friends of Long Marine Lab. Additional funding for this research was provided by 597
PeerJ PrePrints | https://peerj.com/preprints/170v1/ | v1 received: 23 Dec 2013, published: 23 Dec 2013, doi: 10.7287/peerj.preprints.170v1
PrePrin
ts

27
27
Dr. Exequiel Ezcurra through the Pew Fellowship Program on Marine Conservation, and 598
several grants from the Walton Family Foundation. 599
600
Grant Disclosures 601
The following grant information was disclosed by the authors: 602
The David and Lucile Packard Foundation (grant award #2008- 32210, #2013-39400) 603
University of California Office of the President (UC-HBCU Initiative grant) 604
Marine Conservation Institute (Mia J. Tegner memorial research grant) 605
Ecology Project International 606
CenTread 607
Dr. Earl H. Myers and Ethel M. Myers Oceanographic and Marine Biology Trust 608
FCT (SFRH/BPD/26901/2006) 609
Friends of Long Marine Lab 610
Pew Fellowship Program on Marine Conservation 611
Walton Family Foundation 612
613
Competing Interests 614
The authors declare that they have no competing interests. 615
616
Author Contributions 617
Adrian Munguia-Vega, Brad Erisman, Alexis Jackson, Jorge Torre and Tad Pfister 618
conceived and designed the experiments. 619
PeerJ PrePrints | https://peerj.com/preprints/170v1/ | v1 received: 23 Dec 2013, published: 23 Dec 2013, doi: 10.7287/peerj.preprints.170v1
PrePrin
ts

28
28
Adrian Munguia-Vega, Alexis Jackson, Silvio Guido Marinone, Marcia Moreno-Baez 620
and Alfredo Giron perfomed the experiments and analyzed data. 621
Adrian Munguia-Vega, Brad Erisman, Alexis Jackson, Octavio Aburto-Oropeza and 622
Jorge Torre wrote the paper. 623
624
Field Study Permissions 625
Scientific collection permits were acquired from SAGARPA (No. 626
DGOPA.09151.260809.2885 and DAPA/2/020511/01197). 627
628
629
Supplemental Information 630
Table S1 Statistics describing the dynamics of larval dispersal in a network of 17 sites 631
after PLD 14 days. 632
Table S2 Statistics describing the dynamics of larval dispersal in a network of 17 sites 633
after PLD 21 days. 634
Table S3 Statistics describing the dynamics of larval dispersal in a network of 17 sites 635
after PLD 28 days. 636
Figure S1 Spatial units of analyses for studying connectivity in the Gulf of California. 637
Figure S2 Modeled networks of larval connectivity for PLD 28 days for larvae released 638
at two distinct dates. 639
640
641
642
PeerJ PrePrints | https://peerj.com/preprints/170v1/ | v1 received: 23 Dec 2013, published: 23 Dec 2013, doi: 10.7287/peerj.preprints.170v1
PrePrin
ts

29
29
References 643 644
Aburto-‐Oropeza O, Erisman B, Galland GR, Mascarenas-‐Osorio I, Sala E, and Ezcurra 645 E. 2011. Large Recovery of Fish Biomass in a No-‐Take Marine Reserve. PloS 646 one 6:e23601. 647
Aburto-‐Oropeza O, Sala E, Paredes G, Mendoza A, and Ballesteros E. 2007. 648 Predictability of reef fish recruitment in a highly variable nursery habitat. 649 Ecology 88:2220-‐2228. 650
Alberto F, Raimondi PT, Reed DC, Watson JR, Siegel DA, Mitarai S, Coelho N, and 651 Serrao EA. 2011. Isolation by oceanographic distance explains genetic 652 structure for Macrocystis pyrifera in the Santa Barbara Channel. Molecular 653 ecology 20:2543-‐2554. 654
Almany GR, Connolly SR, Heath DD, Hogan JD, Jones GP, McCook LJ, Mills M, Pressey 655 RL, and Williamson DH. 2009. Connectivity, biodiversity conservation and 656 the design of marine reserve networks for coral reefs. Coral Reefs 28:339-‐657 351. 658
Almany GR, Hamilton RJ, Bode M, Matawai M, Potuku T, Saenz-‐Agudelo P, Planes S, 659 Berumen ML, Rhodes KL, Thorrold SR et al. . 2013. Dispersal of grouper 660 larvae drives local resource sharing in a coral reef fishery. Current biology : 661 CB 23:626-‐630. 662
Andrello M, Mouillot D, Beuvier J, Albouy C, Thuiller W, and Manel S. 2013. Low 663 Connectivity between Mediterranean Marine Protected Areas: A Biophysical 664 Modeling Approach for the Dusky Grouper Epinephelus marginatus. PloS one 665 8:e68564. 666
Backhaus JO. 1985. A three-‐dimensional model for the simulation of the shelf sea 667 dynamics. Dtsch Hydrogr 38:165-‐187. 668
Beerli P, and Palczewski M. 2010. Unified framework to evaluate panmixia and 669 migration direction among multiple sampling locations. Genetics 185:313-‐670 326. 671
Beger M, Linke S, Watts M, Game E, Treml E, Ball I, and Possingham HP. 2010. 672 Incorporating asymmetric connectivity into spatial decision making for 673 conservation. Conservation Letters 3:359-‐368. 674
Beger M, Selkoe KA, Treml EA, Barber PH, von der Heyden S, Crandall ED, Toonen RJ, 675 and Riginos C. 2013. Evolving coral reef conservation with genetic 676 information. Bulletin of Marine Science 90. 677
Bode M, Burrage K, and Possingham HP. 2008. Using complex network metrics to 678 predict the persistence of metapopulations with asymmetric connectivity 679 patterns. Ecological Modelling 214:201-‐209. 680
Burgess SC, Nickols KJ, Griesemer CD, Barnett LAK, Dedrick AG, Satterthwaite EV, 681 Yamane L, Morgan SG, White JW, and Botsford LW. 2013. Beyond 682 connectivity: how empirical methods can quantify population persistence to 683 improve marine protected area design. Ecological Applications In-‐press. 684
Buston PM, Jones GP, Planes S, and Thorrold SR. 2012. Probability of successful 685 larval dispersal declines fivefold over 1 km in a coral reef fish. Proceedings 686 Biological sciences / The Royal Society 279:1883-‐1888. 687
Cannon R. 1966. The Sea of Cortez: Lane Magazine and Book Company. 688
PeerJ PrePrints | https://peerj.com/preprints/170v1/ | v1 received: 23 Dec 2013, published: 23 Dec 2013, doi: 10.7287/peerj.preprints.170v1
PrePrin
ts
30
30
CNP. 2012. Carta Nacional Pesquera. Secretaria de Agricultura, Ganaderia, Desarrollo 689 Rural, Pesca y Alimentacion 236 pp:available from: 690 http://www.inapesca.gob.mx. 691
Colin PL, Sadovy YJ, and Domeier ML. 2003. Manual for the study and conservation 692 of reef fish spawning aggregations. Society for the Conservation of Reef Fish 693 Aggregations, Special Publication 1:1-‐99. 694
Costello C, Ovando D, Hilborn R, Gaines SD, Deschenes O, and Lester SE. 2012. Status 695 and Solutions for the World's Unassessed Fisheries. Science 338:517-‐520. 696
Cowen RK. 2000. Connectivity of Marine Populations: Open or Closed? Science 697 287:857-‐859. 698
Cowen RK. 2002. Larval dispersal and retention and consequences for population 699 connectivity. In: Sale PF, ed. Ecology of Coral Reef Fishes: Recent Advances. San 700 Diego, CA: Academic Press, 149-‐170. 701
Cowen RK, and Sponaugle S. 2009. Larval Dispersal and Marine Population 702 Connectivity. Annual Review of Marine Science 1:443-‐466. 703
Craig MT, Sadovy de Mitcheson YJ, and Heemstra PC. 2012. Groupers of the World: a 704 field and market guide: Taylor & Francis Group. 705
Craig MT, and Sadovy Y. 2008. Mycteroperca rosacea. IUCN 2012 IUCN Red List of 706 Threatened Species Version 20122 <wwwiucnredlistorg> Downloaded on 16 707 June 2013. 708
Crandall ED, Treml EA, and Barber PH. 2012. Coalescent and biophysical models of 709 stepping-‐stone gene flow in neritid snails. Molecular ecology 21:5579-‐5598. 710
Cudney-‐Bueno R, Bourillón L, Sáenz-‐Arroyo A, Torre-‐Cosío J, Turk-‐Boyer P, and 711 Shaw WW. 2009. Governance and effects of marine reserves in the Gulf of 712 California, Mexico. Ocean & Coastal Management 52:207-‐218. 713
Diaz-‐Uribe JG, Elorduy-‐Garay JF, and Gonzalez-‐Valdovinos MT. 2001. Age and 714 Growth of the Leopard Grouper, Mycteroperca rosacea, in the Southern Gulf 715 of California, Mexico. Pacific Science 55:171-‐182. 716
Erisman BE, Buckhorn ML, and Hastings PA. 2007a. Spawning patterns in the 717 leopard grouper, Mycteroperca rosacea, in comparison with other 718 aggregating groupers. Marine Biology 151:1849-‐1861. 719
Erisman BE, Rosales-‐Casián JA, and Hastings PA. 2007b. Evidence of gonochorism in 720 a grouper, Mycteroperca rosacea, from the Gulf of California, Mexico. 721 Environmental Biology of Fishes 82:23-‐33. 722
Excoffier L, Laval G, and Schneider S. 2005. Arlequin (version 3.0): An integrated 723 software package for population genetics data analysis. Evolutionary 724 Bioinformatics 1:47-‐50. 725
Feutry P, Vergnes A, Broderick D, Lambourdiere J, Keith P, and Ovenden JR. 2013. 726 Stretched to the limit; can a short pelagic larval duration connect adult 727 populations of an Indo-‐Pacific diadromous fish (Kuhlia rupestris)? Molecular 728 ecology 22:1518-‐1530. 729
Foster NL, Paris CB, Kool JT, Baums IB, Stevens JR, Sanchez JA, Bastidas C, Agudelo C, 730 Bush P, Day O et al. . 2012. Connectivity of Caribbean coral populations: 731 complementary insights from empirical and modelled gene flow. Molecular 732 ecology 21:1143-‐1157. 733
PeerJ PrePrints | https://peerj.com/preprints/170v1/ | v1 received: 23 Dec 2013, published: 23 Dec 2013, doi: 10.7287/peerj.preprints.170v1
PrePrin
ts

31
31
Gaggiotti OE. 1996. Population Genetic Models of Source-Sink Metapopulations. 734 Theoretical Population Biology 50:178-‐208. 735
Gaines SD, Gaylord B, and Largier JL. 2003. Avoiding current oversights in marine 736 reserve design. Ecological Applications 13:S32-‐S36. 737
Gaines SD, White C, Carr MH, and Palumbi SR. 2010. Designing marine reserve 738 networks for both conservation and fisheries management. Proceedings of 739 the National Academy of Sciences of the United States of America 107:18286-‐740 18293. 741
Galindo HM, Pfeiffer-‐Herbert AS, McManus MA, Chao Y, Chai F, and Palumbi SR. 742 2010. Seascape genetics along a steep cline: using genetic patterns to test 743 predictions of marine larval dispersal. Molecular ecology 19:3692-‐3707. 744
Gracia-‐Lopez V, Kiewek-‐Martinez M, Maldonado-‐Garcia M, Monsalvo-‐Spencer P, 745 Portillo-‐Clark G, Civera-‐Cerecedo R, Linares-‐Aranda M, Robles-‐Mungaray M, 746 and Mazon-‐Suastegui JM. 2005. Larvae and juvenile production of the 747 leopard grouper, Mycteroperca rosacea (Streets, 1877). Aquaculture 748 Research 36:110-‐112. 749
Harrison HB, Williamson DH, Evans RD, Almany GR, Thorrold SR, Russ GR, Feldheim 750 KA, van Herwerden L, Planes S, Srinivasan M et al. . 2012. Larval export from 751 marine reserves and the recruitment benefit for fish and fisheries. Current 752 biology : CB 22:1023-‐1028. 753
Hastings A, and Botsford LW. 2006. Persistence of spatial populations depends on 754 returning home. Proceedings of the National Academy of Sciences of the United 755 States of America 103:6067-‐6072. 756
Hastings PA, Findley LT, and Van der heiden AMV. 2010. Fishes of the Gulf of 757 California. In: Brusca RC, ed. The Gulf of California Biodiversity and 758 Conservation. Tucson, AZ: The University of Arizona Press, 96-‐118. 759
Humason GL. 1972. Animal tissue techniques, 3rd edn. San Francisco: WH Freeman 760 and Company. 761
Iacchei M, Ben-‐Horin T, Selkoe KA, Bird CE, Garcia-‐Rodriguez FJ, and Toonen RJ. 762 2013. Combined analyses of kinship and FST suggest potential drivers of 763 chaotic genetic patchiness in high gene-‐flow populations. Molecular ecology 764 22:3476-‐3494. 765
Kool JT, Paris CB, Barber PH, and Cowen RK. 2011. Connectivity and the 766 development of population genetic structure in Indo-‐West Pacific coral reef 767 communities. Global Ecology and Biogeography 20:695-‐706. 768
Lavin MF, Durazo R, Palacios E, Argote ML, and Carrillo L. 1997. Lagrangian 769 observations of the circulation in the northern Gulf of California. Journal of 770 Physical Oceanography 27:2298-‐2305. 771
Librado P, and Rozas J. 2009. DnaSP v5: a software for comprehensive analysis of 772 DNA polymorphism data. Bioinformatics (Oxford) 25:1451-‐1452. 773
Marinone SG. 2003. A three-‐dimensional model of the mean and seasonal circulation 774 of the Gulf of California. Journal of Geophysical Research 108:1-‐27. 775
Marinone SG. 2008. On the three-‐dimensional numerical modeling of the deep 776 circulation around Ángel de la Guarda Island in the Gulf of California. 777 Estuarine, Coastal and Shelf Science 80:430-‐434. 778
PeerJ PrePrints | https://peerj.com/preprints/170v1/ | v1 received: 23 Dec 2013, published: 23 Dec 2013, doi: 10.7287/peerj.preprints.170v1
PrePrin
ts

32
32
Marinone SG. 2012. Seasonal surface connectivity in the Gulf of California. Estuarine, 779 Coastal and Shelf Science 100:133-‐141. 780
Moreno-‐Báez M, Cudney-‐Bueno R, Orr BJ, Shaw WW, Pfister T, Torre-‐Cosio J, Loaiza 781 R, and Rojo M. 2012. Integrating the spatial and temporal dimensions of 782 fishing activities for management in the northern Gulf of California, mexico. 783 Ocean & Coastal Management 55:111-‐127. 784
Moreno-‐Baez M, Orr BJ, Cudney-‐Bueno R, and Shaw WW. 2010. Using fishers local 785 knowledge to aid management at regional scales: spatial distribution of 786 small-‐scale fisheries in the Northern Gulf of California, Mexico. Bulletin of 787 Marine Science 86:339-‐353. 788
Newman MEJ. 2003. The Structure and Function of Complex Networks. SIAM Review 789 45:167-‐256. 790
Palumbi SR, Martin A, Romano S, McMillan WO, Stice L, and Grabowski G. 1991. The 791 Simple Fool's Guide to PCR, Version 2.0. Honolulu, HI: Privately published 792 document. 793
Petit RJ, El Mousadik A, and Pons O. 1998. Identifying populations for conservation 794 on the basis of genetic markers. Conservation Biology 12:844-‐855. 795
Petitgas P, Alheit J, Peck MA, Raab K, Irigoien X, Huret M, van der Kooij J, Pohlmann 796 T, Wagner C, Zarraonaindia I et al. . 2012. Anchovy population expansion in 797 the North Sea. Marine Ecology Progress Series 444:1-‐13. 798
Proehl JA, Lynch DR, McGillicuddy DJ, and Ledwell JR. 2005. Modeling turbulent 799 dispersion on the North Flank of Georges Bank using Lagrangian Particle 800 Methods. Continental Shelf Research 25:875-‐900. 801
Robertson DR, and Cramer KL. 2009. Shore fishes and biogeographic subdivisions of 802 the Tropical Eastern Pacific. Marine Ecology Progress Series 380:1-‐17. 803
Sala E, Aburto-‐Oropeza O, Paredes G, and Thompson G. 2003. Spawning 804 aggregations and reproductive behavior of reef fishes in the Gulf of 805 California. Bulletin of Marine Science 72:103-‐121. 806
Sala E, Aburto-‐Oropeza O, Reza M, Paredes G, and López-‐Lemus LG. 2004. Fishing 807 Down Coastal Food Webs in the Gulf of California. Fisheries 29:19-‐25. 808
Sale PF, Cowen RK, Danilowicz BS, Jones GP, Kritzer JP, Lindeman KC, Planes S, 809 Polunin NV, Russ GR, Sadovy YJ et al. . 2005. Critical science gaps impede use 810 of no-‐take fishery reserves. Trends in ecology & evolution 20:74-‐80. 811
Sambrook J, Fritsch EF, and Maniatis T. 1989. Molecular Cloning: A Laboratory 812 Manual Second Edition Vols. 1, 2, and 3. Molecular Cloning: A Laboratory 813 Manual, Second Edition, Vols 1, 2 and 3 Cold Spring Harbor, New York: Cold 814 Spring Harbor Laboratory Press. 815
Selkoe KA, Watson JR, White C, Horin TB, Iacchei M, Mitarai S, Siegel DA, Gaines SD, 816 and Toonen RJ. 2010. Taking the chaos out of genetic patchiness: seascape 817 genetics reveals ecological and oceanographic drivers of genetic patterns in 818 three temperate reef species. Molecular ecology 19:3708-‐3726. 819
Smith M, Milic-‐Frayling N, Shneiderman B, Mendes-‐Rodriguez E, Leskovec J, and 820 Dunne C. 2010. NodeXL: a free and open network overview, discovery and 821 exploration add-‐in for Excel 2007/2010 http://nodexlcodeplexcom. 822
PeerJ PrePrints | https://peerj.com/preprints/170v1/ | v1 received: 23 Dec 2013, published: 23 Dec 2013, doi: 10.7287/peerj.preprints.170v1
PrePrin
ts

33
33
Soria G, Munguía-‐Vega A, Marinone SG, Moreno-‐Báez M, Martínez-‐Tovar I, and 823 Cudney-‐Bueno R. 2012. Linking bio-‐oceanography and population genetics to 824 assess larval connectivity. Marine Ecology Progress Series 463:159-‐175. 825
Soria G, Torre-‐Cosio J, Munguia-‐Vega A, Marinone SG, Lavín MF, Cinti A, and Moreno-‐826 Báez M. 2013. Dynamic connectivity patterns from an insular marine 827 protected area in the Gulf of California. Journal of Marine Systems 828 10.1016/j.jmarsys.2013.06.012. 829
Thomson DA, Findley LT, and Kerstitch AN. 2000. Reef fishes of the Sea of Cortez. 830 Austin, TX: University of Texas Press. 831
Treml EA, Roberts JJ, Chao Y, Halpin PN, Possingham HP, and Riginos C. 2012. 832 Reproductive output and duration of the pelagic larval stage determine 833 seascape-‐wide connectivity of marine populations. Integrative and 834 Comparative Biology 52:525-‐537. 835
Visser AW. 1997. Using random walk models to simulate the vertical distribution of 836 particles in a turbulent water column. Marine Ecology Progress Series 837 158:275-‐281. 838
Vuilleumier S, Bolker BM, and Leveque O. 2010. Effects of colonization asymmetries 839 on metapopulation persistence. Theoretical Population Biology 78:225-‐238. 840
Wallace RA, and Selman K. 1981. Cellular and dynamic aspects of oocyte growth in 841 teleosts. American Zoology 21:325-‐343. 842
Watson JR, Mitarai S, Siegel DA, Caselle JE, Dong C, and McWilliams JC. 2010. 843 Realized and potential larval connectivity in the Southern California Bight. 844 Marine Ecology Progress Series 401:31-‐48. 845
White JW, Botsford LW, Hastings A, and Largier JL. 2010. Population persistence in 846 marine reserve networks: incorporating spatial heterogeneities in larval 847 dispersal. Marine Ecology Progress Series 398:49-‐67. 848
849 850
851
852
853
854
855
856
857
858
859
PeerJ PrePrints | https://peerj.com/preprints/170v1/ | v1 received: 23 Dec 2013, published: 23 Dec 2013, doi: 10.7287/peerj.preprints.170v1
PrePrin
ts
34
34
Tables 860
861
Table 1 Study sites in the Gulf of California and selection criteria. Each site was selected 862
based on seven criteria to define where spawning aggregations might act like source of 863
larvae. 864
865
866
867
868
Site
# Site Name
High
Abundance
of Fish
Elevated
Catch Rates
Hydrated
Females
Collected
Running-
Ripe Males
Collected
Courtship or
Spawning
Observed
Gravid
Females
Observed
Courtship
Coloration
Observed
# Criteria
observed
1 Punta Refugio ✔ ✔ ✔ ✔ ✔ ✔ ✔ 7
2 Punta Diablo ✔ ✔ ✔ ✔ 4
3 La Ventana ✔ ✔ ✔ ✔ ✔ ✔ ✔ 7
4 Chorros ✔ ✔ ✔ ✔ ✔ 5
5 San Pedro Martir Island ✔ ✔ ✔ ✔ ✔ ✔ 6
6 San Lorenzo Island ✔ ✔ ✔ ✔ 4
7 Las Cuevitas ✔ ✔ ✔ ✔ 4
8 Puerto Libertad ✔ ✔ ✔ ✔ 4
9 Datil Island ✔ ✔ ✔ ✔ ✔ ✔ ✔ 7
10 La Tordilla ✔ ✔ ✔ ✔ 4
11 El Tecomate ✔ ✔ ✔ ✔ 4
12 San Esteban Island ✔ ✔ ✔ 3
13 Punta Roja ✔ ✔ ✔ ✔ ✔ ✔ 6
14 Los Machos ✔ ✔ ✔ ✔ ✔ ✔ 6
15 Puerto Lobos ✔ ✔ ✔ ✔ 4
16 La Poma ✔ ✔ ✔ 3
17 San Francisquito ✔ ✔ ✔ ✔ 4
# Sites 17 13 11 12 6 12 11
PeerJ PrePrints | https://peerj.com/preprints/170v1/ | v1 received: 23 Dec 2013, published: 23 Dec 2013, doi: 10.7287/peerj.preprints.170v1
PrePrin
ts

35
35
869
Table 2 Molecular diversity. Number of samples (n), number of haplotypes (nH), 870
haplotype diversity (h), corrected haplotype diversity (h†) and nucleotide diversity (π). 871
872
Location n nH h h† π
3. La Ventana* 52 23 0.870 ± 0.035 0.885 0.002 ± 0.001
5. San Pedro Martir Island* 17 9 0.860 ± 0.068 0.881 0.001 ± 0.001
6. San Lorenzo Island* 11 4 0.673 ± 0.123 0.844 0.001 ± 0.001
8. Puerto Libertad 55 21 0.874 ± 0.033 0.887 0.002 ± 0.001
9. Datil Island 20 13 0.947 ± 0.032 0.919 0.002 ± 0.001
11. El Tecomate 26 16 0.935 ± 0.034 0.914 0.002 ± 0.001
12. San Esteban Island 4 4 1.000 ± 0.177 0.943 0.001 ± 0.001
15. Puerto Lobos 11 7 0.909 ± 0.066 0.902 0.002 ± 0.001
16. La Poma 16 12 0.950 ± 0.040 0.920 0.002 ± 0.001
17. San Francisquito* 23 17 0.949 ± 0.034 0.920 0.002 ± 0.001
* Indicates sites within MPAs. 873
874
875
876
877
878
879
880
881
882
883
884
PeerJ PrePrints | https://peerj.com/preprints/170v1/ | v1 received: 23 Dec 2013, published: 23 Dec 2013, doi: 10.7287/peerj.preprints.170v1
PrePrin
ts

36
36
885
Table 3 Pairwise F statistics between sites. Pairwise FST values are above diagonal and 886
pairwise φST values are below diagonal. Values in bold are statistically significant (P < 887
0.05). 888
889
890
Location 3 5 6 8 9 11 12 15 16 17
3. La Ventana - 0.1342 0.2089 0.1278 0.0939 0.0988 0.0837 0.1130 0.0935 0.0929
5. San Pedro Martir Island -0.0122 - 0.2262 0.1321 0.0955 0.1006 0.0868 0.1167 0.0951 0.0943
6. San Lorenzo Island 0.0381 0.0869 - 0.2064 0.1776 0.1800 0.2039 0.2091 0.1803 0.1747
8. Puerto Libertad 0.0912 0.1189 -0.0094 - 0.0920 0.0969 0.0812 0.1109 0.0915 0.0910
9. Datil Island -0.0001 -0.0018 -0.0090 0.0408 - 0.0587 0.0323 0.0706 0.0513 0.0520
11. El Tecomate 0.0101 -0.0094 0.0621 0.1234 0.0169 - 0.0401 0.0767 0.0576 0.0581
12. San Esteban Island -0.0421 -0.0391 0.0772 0.0386 -0.0605 0.0203 - 0.0542 0.0915 0.0317
15. Puerto Lobos 0.0567 0.0555 -0.0353 0.0122 -0.0035 0.0433 0.0193 - 0.0696 0.0697
16. La Poma -0.0124 -0.0196 0.0725 0.0891 -0.0169 0.0038 -0.0578 0.0554 - 0.0507
17. San Francisquito -0.0045 -0.0055 0.0193 0.0601 -0.0129 0.0092 -0.0455 0.0193 -0.0176 -
891
892
893
894
895
896
897
898
899
900
901
PeerJ PrePrints | https://peerj.com/preprints/170v1/ | v1 received: 23 Dec 2013, published: 23 Dec 2013, doi: 10.7287/peerj.preprints.170v1
PrePrin
ts
37
37
902
Table 4 Probability of three larval dispersal models. Bayes factors and marginal log 903
likelihoods for proposed larval dispersal models estimated in Migrate-n version 3.2.16 904
using Bayesian approximation and thermal integration. 905
906
907
908
909
910
911
912
913
914
915
916
917
Model Bezier lmL Harmonic
lML
Choice
(Bezier)
Model
probability
Full Matrix -2673.20 -2514.33
2 0.00001
Baja to
Mainland
-2658.64 -2513.07 1 0.99999
Mainland to
Baja
-2974.33 -2529.21 3 0.00000
PeerJ PrePrints | https://peerj.com/preprints/170v1/ | v1 received: 23 Dec 2013, published: 23 Dec 2013, doi: 10.7287/peerj.preprints.170v1
PrePrin
ts
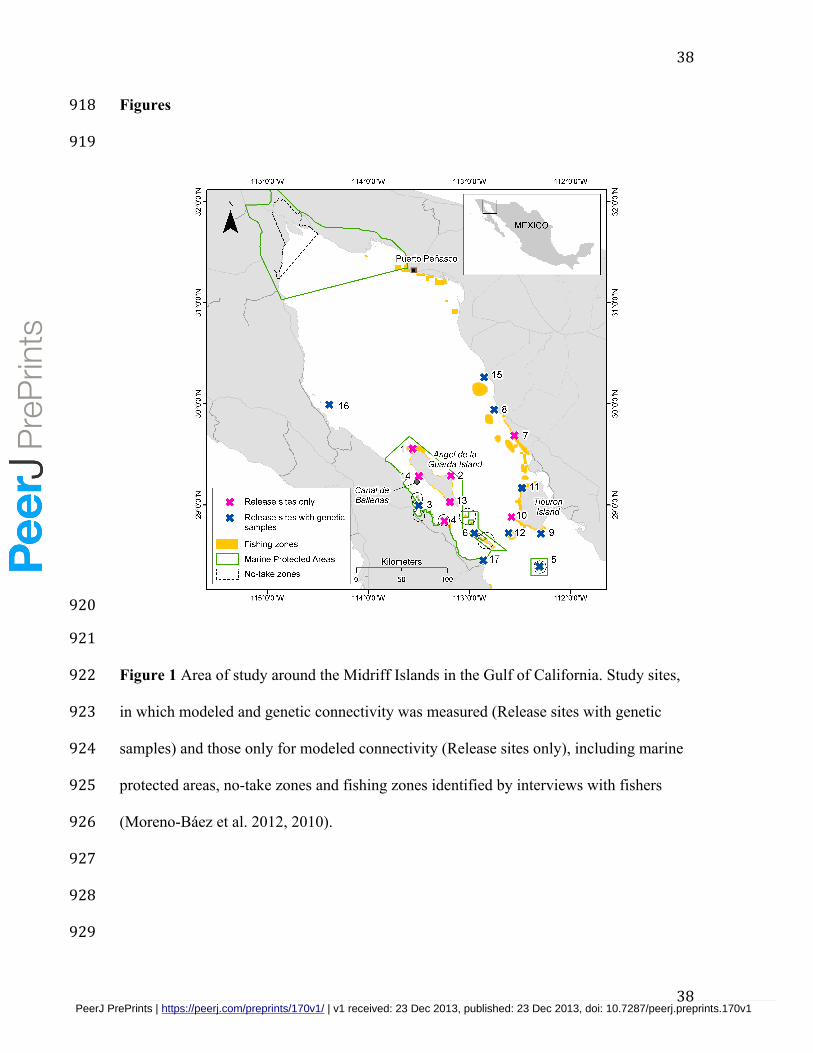
38
38
Figures 918
919
920
921
Figure 1 Area of study around the Midriff Islands in the Gulf of California. Study sites, 922
in which modeled and genetic connectivity was measured (Release sites with genetic 923
samples) and those only for modeled connectivity (Release sites only), including marine 924
protected areas, no-take zones and fishing zones identified by interviews with fishers 925
(Moreno-Báez et al. 2012, 2010). 926
927
928
929
PeerJ PrePrints | https://peerj.com/preprints/170v1/ | v1 received: 23 Dec 2013, published: 23 Dec 2013, doi: 10.7287/peerj.preprints.170v1
PrePrin
ts
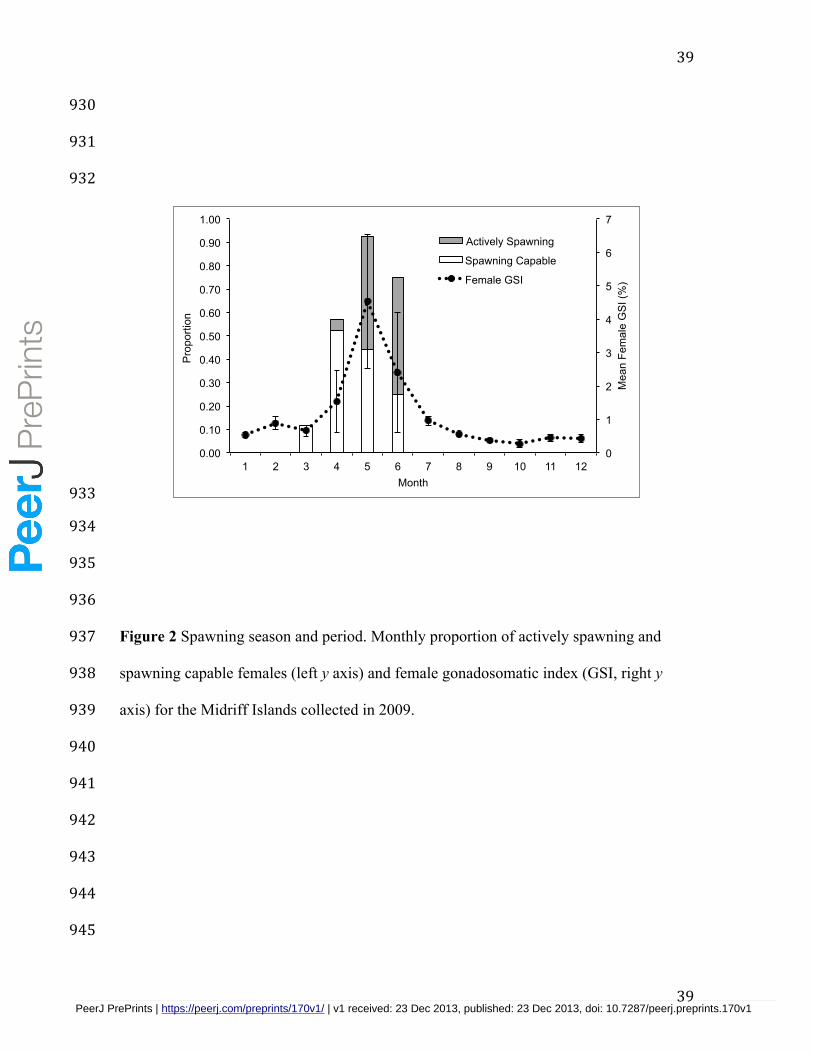
39
39
930
931
932
933
934
935
936
Figure 2 Spawning season and period. Monthly proportion of actively spawning and 937
spawning capable females (left y axis) and female gonadosomatic index (GSI, right y 938
axis) for the Midriff Islands collected in 2009. 939
940
941
942
943
944
945
0
1
2
3
4
5
6
7
0.00
0.10
0.20
0.30
0.40
0.50
0.60
0.70
0.80
0.90
1.00
1 2 3 4 5 6 7 8 9 10 11 12
Mea
n Fe
mal
e G
SI (
%)
Pro
porti
on
Month
Actively Spawning
Spawning Capable
Female GSI
PeerJ PrePrints | https://peerj.com/preprints/170v1/ | v1 received: 23 Dec 2013, published: 23 Dec 2013, doi: 10.7287/peerj.preprints.170v1
PrePrin
ts

40
40
946
947
948
949
950
Figure 3 Probability of larval density. Density is shown for larvae only in coastal areas 951
after PLD 14 days (A), 21 days (B) and 28 days (C) in each spatial unit of analysis. 952
953
954
955
956
957
PeerJ PrePrints | https://peerj.com/preprints/170v1/ | v1 received: 23 Dec 2013, published: 23 Dec 2013, doi: 10.7287/peerj.preprints.170v1
PrePrin
ts

41
41
958
Figure 4 Larval dispersal from each spawning site. Maps showing the spatial distribution 959
of larvae released in May 16th (A) and May 25th (B) at each of 17 sites ("X" in each box) 960
for PLD 14, 21 and 28 days. Scale in kilometers. 961
962
963
964
PeerJ PrePrints | https://peerj.com/preprints/170v1/ | v1 received: 23 Dec 2013, published: 23 Dec 2013, doi: 10.7287/peerj.preprints.170v1
PrePrin
ts

42
42
965
966
967 968
969
Figure 5 Modeled networks of larval connectivity. Spatial networks of larval dispersal 970
between sites for PLD 14 days (A), 21 days (B) and 28 days (C), showing dispersal 971
events (links) between sites (nodes). Line width is proportional to probability, according 972
to the scale to the right. The direction of the larval dispersal events is indicated by 973
different colors: northward (red), southward (blue) or both simultaneously (green). Open 974
nodes are sites within MPAs, solid nodes are fished sites. 975
976
977
978
979
980
981
982
PeerJ PrePrints | https://peerj.com/preprints/170v1/ | v1 received: 23 Dec 2013, published: 23 Dec 2013, doi: 10.7287/peerj.preprints.170v1
PrePrin
ts
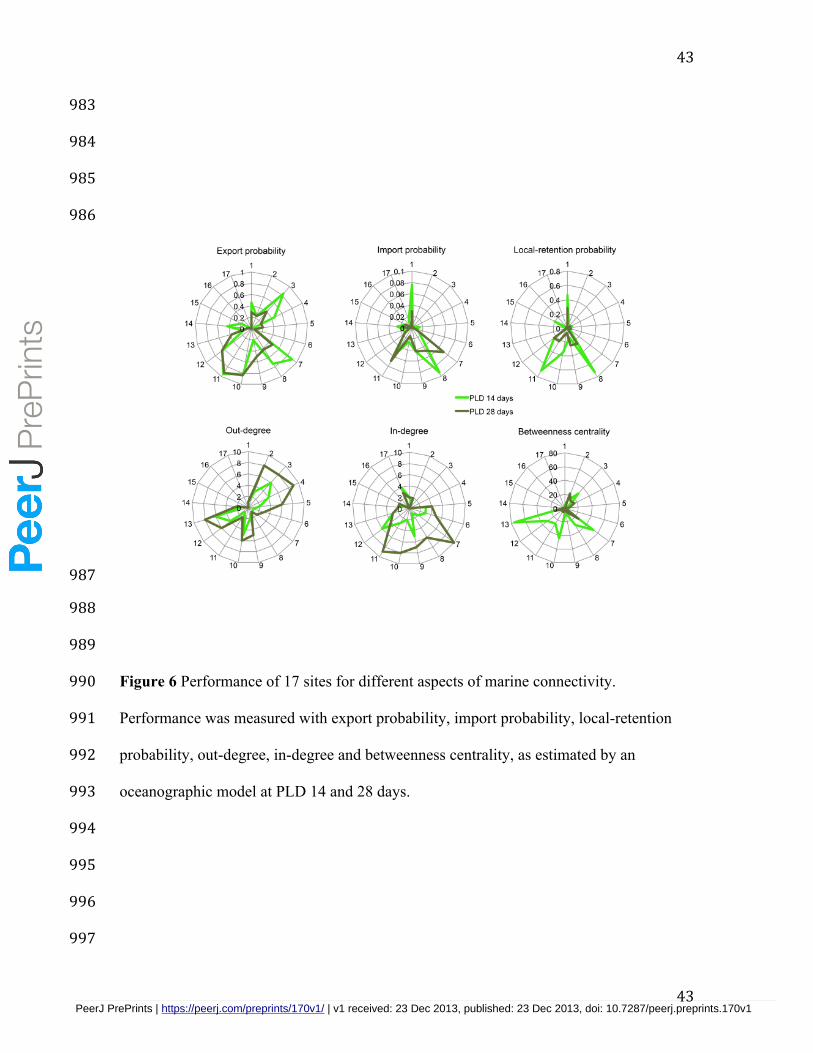
43
43
983
984
985
986
987
988
989
Figure 6 Performance of 17 sites for different aspects of marine connectivity. 990
Performance was measured with export probability, import probability, local-retention 991
probability, out-degree, in-degree and betweenness centrality, as estimated by an 992
oceanographic model at PLD 14 and 28 days. 993
994
995
996
997
PeerJ PrePrints | https://peerj.com/preprints/170v1/ | v1 received: 23 Dec 2013, published: 23 Dec 2013, doi: 10.7287/peerj.preprints.170v1
PrePrin
ts
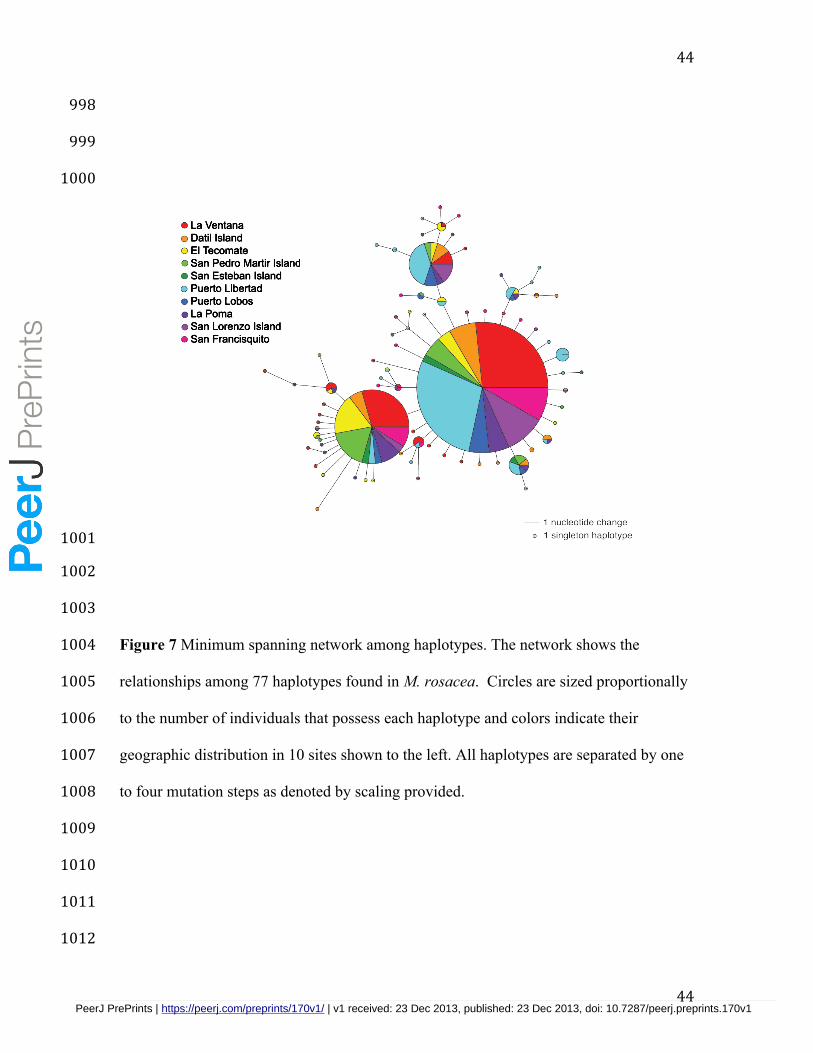
44
44
998
999
1000
1001
1002
1003
Figure 7 Minimum spanning network among haplotypes. The network shows the 1004
relationships among 77 haplotypes found in M. rosacea. Circles are sized proportionally 1005
to the number of individuals that possess each haplotype and colors indicate their 1006
geographic distribution in 10 sites shown to the left. All haplotypes are separated by one 1007
to four mutation steps as denoted by scaling provided. 1008
1009
1010
1011
1012
La VentanaDatil IslandEl TecomateSan Pedro Martir IslandSan Esteban IslandPuerto LibertadPuerto LobosPuerto LobosLa PomaSan Lorenzo IslandSan Francisquito
PeerJ PrePrints | https://peerj.com/preprints/170v1/ | v1 received: 23 Dec 2013, published: 23 Dec 2013, doi: 10.7287/peerj.preprints.170v1
PrePrin
ts
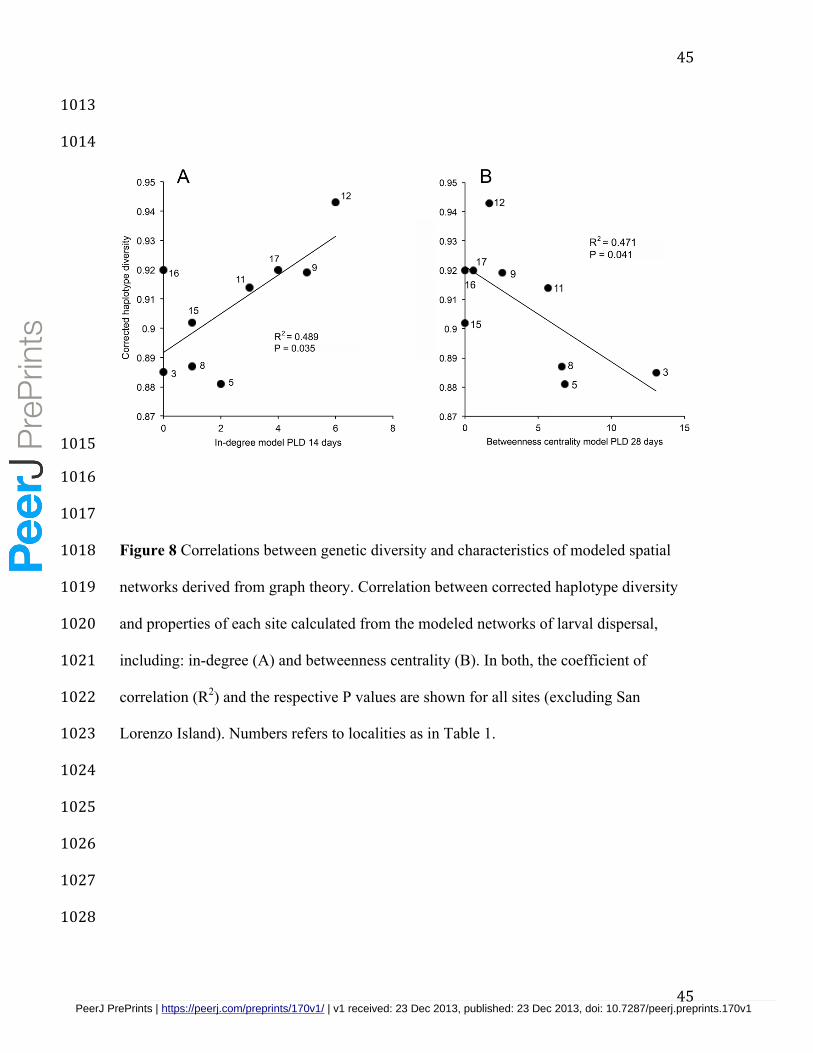
45
45
1013
1014
1015
1016
1017
Figure 8 Correlations between genetic diversity and characteristics of modeled spatial 1018
networks derived from graph theory. Correlation between corrected haplotype diversity 1019
and properties of each site calculated from the modeled networks of larval dispersal, 1020
including: in-degree (A) and betweenness centrality (B). In both, the coefficient of 1021
correlation (R2) and the respective P values are shown for all sites (excluding San 1022
Lorenzo Island). Numbers refers to localities as in Table 1. 1023
1024
1025
1026
1027
1028
PeerJ PrePrints | https://peerj.com/preprints/170v1/ | v1 received: 23 Dec 2013, published: 23 Dec 2013, doi: 10.7287/peerj.preprints.170v1
PrePrin
ts


![The starred publications are in Peer-reviewed Congress ... · The starred publications are in Peer-reviewed Congress Proceedings, the others are in Peer- Reviewed Journals 2018 [178]](https://cdn.vdocuments.mx/doc/165x107/5ead514d568d9a70b57151ef/the-starred-publications-are-in-peer-reviewed-congress-the-starred-publications.jpg)