
A MULTIMODAL ANALYSIS OF HEAR-A MOBILE HEARING SCREENING
APPLICATION
A Dissertation
by
LAKSHMI VAISHNAVI DAKURI
Submitted to the Office of Graduate and Professional Studies of
Texas A&M University
in partial fulfillment of the requirements for the degree of
DOCTOR OF PUBLIC HEALTH
Chair of Committee, Adam W. Pickens
Co-Chair of Committee, Mark E. Benden
Committee Members, Ranjana K. Mehta
Qi Zheng
Head of Department, Mark E. Benden
August 2019
Major Subject: Epidemiology and Environmental Health
Copyright 2019 Lakshmi Vaishnavi Dakuri

ii
ABSTRACT
Presented here are the results of a series of three studies focused on the need, validation,
and improvement of hEAR, a mobile hearing screening application.
The first study was a systematic review of 37 peer-reviewed studies to assess the efficacy
of different types of audiology mHealth interventions, especially in high-risk populations. Four
main modes of technology used to deliver the mHealth intervention were identified, out of which
remote computing was found to be most effective. Smartphone applications were found to be as
efficacious, but the results were dependent on the population characteristics. The study resulted
in demonstrating the need for hEAR in high risk populations.
The purpose of the second study was to validate headphone hardware for use with hEAR,
when compared to a pure tone audiometric test. Both hEAR and the audiologist’s test used 7
frequencies (independent variable), 125 Hz, 250 Hz, 500 Hz, 1000 Hz, 2000 Hz, 4000 Hz and
8000 Hz, and the recorded measurements were sound pressure levels (dependent variable)
measured in decibels. Participants (30) from Texas A&M University were recruited based on a
screener, and were randomly assigned and counterbalanced to one of two groups, differing in the
order the hEAR tests and the audiologist’s test were administered. Data were analyzed using a
generalized estimating equation model at α=0.05, which showed that Pioneer headphones, were
comparably similar to the audiologist’s test at all frequencies.
The third study was a multi-method assessment of hEAR based on user-centered
design principles. Six nurses and thirty students from the Bryan Independent School District
were recruited and the assessments were conducted at the participants’ schools. Nurses used
hEAR to screen their students, after which the nurses filled out two questionnaires: The System

iii
Usability Scale and the After-Scenario Questionnaire. The time taken to complete the tasks, as
well as the number of errors committed were also observed. The nurses participated in individual
in-depth interviews. The result of the assessments revealed 8 problems that the nurses
encountered during their use of hEAR, which were then grouped into 4 usability themes to derive
user-centered design recommendations for similar mHealth applications.

iv
DEDICATION
This dissertation is dedicated to my husband, Bobby, and my son, Nicholas Jaxom. It is also
dedicated to my parents, and parents-in-law. Thank you.

v
ACKNOWLEDGEMENTS
I would like to thank my committee chair, Dr. Pickens, and my committee members, Dr.
Benden, Dr. Mehta, and Dr. Zheng for their guidance and support throughout the course of this
research.
I would also like to thank Dr. Jill Morris at the Bryan Independent School District, and all
the nurses and students who participated in this research with their valuable time. I would also
like to thank Dr. Christie Madsen, and Ms. Rema Lara from Texas ENT and Allergy for their
gracious participation in this research.
Thanks also go to my friends and colleagues and the department faculty and staff for
making my time at Texas A&M University a great experience.

vi
CONTRIBUTORS AND FUNDING SOURCES
Contributors
This work was supervised by a dissertation committee consisting of Professors Adam
Pickens, advisor, Mark Benden, co-advisor, and Ranjana Mehta of the Department of
Environmental and Occupational Health, and Professor Qi Zheng of the Department of
Epidemiology and Biostatistics.
All work for the dissertation was completed by the student, in collaboration with Dr.
Adam W. Pickens, of the Department of Environmental and Occupational Health, and Dr. Qi
Zheng, of the Department of Epidemiology and Biostatistics.
Funding Sources
This work was also made possible in part by UT Southwestern NIOSH-ERC Pilot
Project. Its contents are solely the responsibility of the authors and do not necessarily represent
the official views of the UTHSC NIOSH ERC.

vii
NOMENCLATURE
AAA American Academy of Audiology
AAP American Academy of Pediatrics
ANSI American National Standards Institute
ASHA American Speech-Language-Hearing Association
ASQ After-Scenario Questionnaire
BISD Bryan Independent School District
BLS Bureau of Labor Statistics
CDC Centers of Disease Control
CFR Code of Federal Regulations
DFPS Department of Family and Protective Services
DHHS Department of Health & Human Services
DPOE Distortion Product Otoacoustic Emissions (test)
EHDI Early Hearing Detection and Intervention
EHR Electronic Health Records
IRB Institutional Review Board
ISD Independent School District
mHealth Mobile health
NHANES National Health and Nutrition Examination Survey
NIOSH National Institute for Occupational Safety and Health
ONIHL Occupational Noise Induced Hearing Loss
OSHA Occupational Safety and Health Administration

viii
PRISMA Preferred Reporting Items for Systematic Reviews
SNAP Supplemental Nutrition Assistance Program
SPL Sound Pressure Level
SUS System Usability Scale
Telemed Telemedicine
TS Audiometer Telessaude audiometer
UAF User Action Framework (model)
UNHS Universal Newborn Hearing Screening
UPT Usability Problem Taxonomy (model)
WHO World Health Organization
ix
TABLE OF CONTENTS
ABSTRACT .................................................................................................................................. ii
DEDICATION.............................................................................................................................. iv
ACKNOWLEDGEMENTS .......................................................................................................... v
CONTRIBUTORS AND FUNDING SOURCES ....................................................................... vi
NOMENCLATURE .................................................................................................................... vii
TABLE OF CONTENTS ............................................................................................................ ix
LIST OF FIGURES ..................................................................................................................... xi
LIST OF TABLES ...................................................................................................................... xii
INTRODUCTION.......................................................................................................................... 1
PAPER 1: A SYSTEMATIC REVIEW OF THE EFFICACY OF MHEALTH BASED SERVICES TO FACILITATE AUDIOLOGICAL MEASUREMENT IN HIGH-RISK
POPULATIONS ............................................................................................................................. 5
Introduction ................................................................................................................................. 5 Methods ...................................................................................................................................... 7
Statistical Analyses ................................................................................................................. 9 Results ......................................................................................................................................... 9 Discussion ................................................................................................................................. 16
Key Findings ......................................................................................................................... 16 Limitations ............................................................................................................................ 21
Conclusion ................................................................................................................................ 22
PAPER 2: HARDWARE VALIDATION FOR HEAR MOBILE HEARING
SCREENING APPLICATION ..................................................................................................... 29
Introduction ............................................................................................................................... 29 Need for Alternatives ............................................................................................................ 30 Research Aims ...................................................................................................................... 31 Participants ............................................................................................................................ 32
Methods .................................................................................................................................... 32 Equipment ............................................................................................................................. 32 Headphone Acoustics ............................................................................................................ 32 hEAR Application ................................................................................................................. 34

x
Statistical Analyses ............................................................................................................... 35
Results ....................................................................................................................................... 38
Discussion ................................................................................................................................. 42 Conclusion ................................................................................................................................ 45
PAPER 3: A MULTI-METHOD USER-CENTERED ASSESSMENT OF HEAR .................... 47
Introduction ............................................................................................................................... 47 Need for Hearing Screening .................................................................................................. 48
Need for a usability test for hEAR ........................................................................................ 50 Research Questions for the formative usability assessment ................................................. 51
Methods .................................................................................................................................... 51 System being tested ............................................................................................................... 51
Users and Testing environment ............................................................................................ 52 Usability assessment protocol ............................................................................................... 54 Evaluation Tools: .................................................................................................................. 54
Task Description ................................................................................................................... 62 Procedure .............................................................................................................................. 62
Statistical Analyses ............................................................................................................... 64 Results ....................................................................................................................................... 65
Nurse comments .................................................................................................................... 74
Discussion ................................................................................................................................. 78 Design Recommendations .................................................................................................... 91
General Guidelines ................................................................................................................ 97 Limitations ............................................................................................................................ 99
Conclusion .............................................................................................................................. 101
CONCLUSION .......................................................................................................................... 102
Public Health Implications .................................................................................................. 103
REFERENCES ............................................................................................................................ 106
xi
LIST OF FIGURES
Figure 1: PRISMA flow chart for literature selection .................................................................. 10
Figure 2: Forest plot for the systematic review ............................................................................ 11
Figure 3: Individual influence analysis graph using Metainf........................................................ 13
Figure 4: Funnel plot for the systematic review ........................................................................... 15
Figure 5: Boxplots of the headphones and the audiologist's test using summary statistics
plotted against the measured sound pressure levels (SPL) on the Y-axis. .................... 38
Figure 6: Sound Pressure Level (SPL) means per headphone for Group 1 .................................. 39
Figure 7: Sound pressure level (SPL) means per headphone for Group 2 .................................... 39
Figure 8: hEAR instruction screen ................................................................................................ 52
Figure 9: hEAR screening ............................................................................................................. 52
Figure 10: The Usability Problem Taxonomy Model by Keenan et. al. (1999) ........................... 60
Figure 11: a) Interaction cycle parts b) user action framework (from André et. al., (2001)) ....... 61
Figure 12: Graphical representation of application and audiometry sensitivity results ................ 66
Figure 13: hEAR login screen ....................................................................................................... 93
Figure 14: Administrator page ...................................................................................................... 93
Figure 15: Selection of type of test ............................................................................................... 94
Figure 16: Instructions for practice and screening ........................................................................ 94
Figure 17: Screening page ............................................................................................................ 95
Figure 18: Result main screen ....................................................................................................... 95
Figure 19: Result audiogram ......................................................................................................... 96

xii
LIST OF TABLES
Table 1: Results of test of individual study influence (Metainf) .................................................. 12
Table 2: Results from sensitivity analyses .................................................................................... 14
Table 3: Studies assessing remote computing .............................................................................. 23
Table 4: Studies assessing specialized instruments ...................................................................... 25
Table 5: Studies assessing internet/email ..................................................................................... 26
Table 6: Studies assessing mobile technology .............................................................................. 27
Table 7: Results of generalized estimating equation model analysis for the counterbalanced
headphones and audiologist’s test of the test initiation ................................................. 40
Table 8: Probability statistics and statistical significance (p Values) for test headphones ........... 41
Table 9: Task description for the nurses ....................................................................................... 62
Table 10: Individual frequency sensitivity and confidence intervals ........................................... 65
Table 11: Nurse error rates ........................................................................................................... 66
Table 12: Time taken by nurses to complete tasks/enter data ...................................................... 67
Table 13: Time taken to screen patients ....................................................................................... 68
Table 14: Total time taken per nurse ............................................................................................ 69
Table 15: SUS scores for the hEAR application (R=Raw, T=Transformed) ............................... 70
Table 16: SUS scores for GSI-17 Audiometer (R=Raw, T=Transformed) .................................. 71
Table 17: ASQ score for the hEAR application............................................................................ 72
Table 18: ASQ score for GSI-17 Audiometer .............................................................................. 72
Table 19: Summary results for hEAR application, and the GSI-17 audiometer .......................... 73
Table 20: Problem matrix for the nurses ....................................................................................... 75
Table 21: Classification of problems encountered by nurses according to Usability Problem
Taxonomy ...................................................................................................................... 77

xiii
Table 22: Classification of problems encountered by nurses according to the User Action
Framework .................................................................................................................... 78
Table 23: Emergent usability themes and corresponding examples from the nurses’ interviews 87

1
INTRODUCTION
Hearing loss is the third most common physical condition in the United States, with a
higher incidence than both cancer(s) and diabetes (Masterson, 2017). According to the World
Health Organization (WHO), an estimated population of 360 million-488 million people suffer
from debilitating hearing loss worldwide (WHO, 2017). Debilitating hearing loss refers to
hearing loss greater than 40 dB in the ‘better hearing ear’ in adults and at 30 dB or greater in
children (WHO, 2017). Audiologists, and audiology researchers define ‘at-risk’ or ‘high-risk’
patients for hearing loss as those who are more susceptible to hearing loss due to either genetics,
or age, usually children or older adults, or those exposed to loud noises by virtue of their
occupations or leisure activities, or if the susceptibility is caused as a ‘side effect’ of a previously
existing disease, or an interaction/effect of a medication (WHO, 2019). By this definition,
children and adults who may be exposed to loud noises due to occupational or recreational
activities, and older adults due to natural presbycusis, would all fall under the category of ‘high-
risk’ or ‘at-risk’, and thus this encompasses a large part of the general population. According to
the Centers of Disease Control, over 22 million workers are exposed to hazardous occupational
noise, and approximately 20% of children may have undiagnosed hearing loss at the time of
school entry; making hearing loss and hearing-related disorders of great concern across all age
groups and many working conditions.
Prompt and immediate diagnosis and screening for hearing loss can considerably aid in
mitigating the effects of such disorders, which requires access to audiologists, and audiology
technicians. However, most audiologists, like other secondary care providers, tend to be more
centralized in population-dense areas. This hinders access to much-needed audiometric care in

2
remote or rural areas (Windmill and Freeman, 2013). In addition to the scarcity of availability of
audiological services in rural areas, other factors such as socioeconomic status, insurance status,
and transportation barriers also contribute to lower levels of access as compared to urban areas
(Goldenberg & Wenig, 2002). Due to the aforementioned factors, patients in rural and remote
areas tend to visit the physician less often, and later in the progression of their illness. There is a
clear need for highly accessible alternatives that can provide hearing screening to populations
that reside in rural and remote areas. However, any intervention method that is developed to
screen and diagnose hearing loss, should be equally valid and accurate in all sub-populations
(WHO, 2017).
Increasingly, mobile and wireless technologies such as smartphones and tablets, are being
used to achieve health objectives. Use of technology in this way is termed as mHealth, and it has
great potential to transform access to health service delivery. The rapid advancement in mobile
technologies and applications dependent on them increases opportunities to integrate mHealth
into existing healthcare services, and this will continue to increase with the growth in coverage
of cellular networks. Because of the sheer popularity, abundance, and capabilities of mobile and
wireless technologies, mHealth applications are particularly appropriate for providing individual-
level support, provided the applications are reliable, viable, and accurate.
hEAR is a mobile hearing screening application developed by researchers at the Texas
A&M School of Public Health that is capable of providing full-spectrum, pure-tone audiometric
tests with frequencies ranging from 125 Hz to 8000 Hz, to the general population. The aim, like
all mHealth technologies, is to increase access to audiologist-quality screening for those in need
of quality healthcare examinations who may not have them immediately available. hEAR was
previously validated in a separate pilot study (Pickens et. al., 2017), however, it was observed

3
that the application is highly dependent on the type of hardware used for data collection and
assessment. It was therefore endeavored that hEAR could be further improved with the following
aims:
1. A systematic review of available literature pertaining to audiometric mHealth
applications was conducted using the Preferred Reporting Items for Systematic reviews
and Meta-Analyses (PRISMA) methodology. This was done with the goal of assessing
the efficacy of different methods of delivery of audiology mHealth interventions,
especially in high-risk populations, and more importantly, to demonstrate the need for
hEAR in such populations.
2. hEAR was evaluated for screening efficacy with the goal of optimizing hardware for
accurate data collection and assessment. A study of thirty participants from the general
population was conducted to determine the optimal hardware required to achieve
statistically comparable results to the industry gold standard of pure tone audiometry.
This was done with the goal to define standardized testing equipment for hEAR.
3. A multi-method assessment including a formative usability assessment of hEAR was
conducted to assess the usability of hEAR, with respect to user-centered design. The goal
of this assessment was to identify and mitigate user interface problems that could be
encountered during hearing screenings using the application. This assessment was then
used to establish human factors-based design recommendations for other such
applications, with emphasis on the needs of end-users and target audiences.
The expected outcomes of this research were to further develop and refine hEAR, to demonstrate
that hEAR provides statistically comparable results to the industry gold standard in all
populations, and to demonstrate the ease of self-administration without need for formal training.
4
It was the overall goal to demonstrate that hEAR could be used as a mHealth screening and
diagnostic tool by healthcare workers, and could increase access to high quality hearing
screening for the public on their personal mobile devices.
5
PAPER 1: A SYSTEMATIC REVIEW OF THE EFFICACY OF MHEALTH
BASED SERVICES TO FACILITATE AUDIOLOGICAL MEASUREMENT
IN HIGH-RISK POPULATIONS
Introduction
In the United States, approximately 48 million people live with disabling/debilitating
hearing loss, and this number is expected to double in the next two decades (Lin, Niparko, and
Ferrucci, 2011). An estimated 5% of the world’s population live with disabling hearing loss
(World Health Organization, 2017). Most people who suffer from disabling hearing loss,
unfortunately, reside in low-resource/low-income areas, where audiology services may be
limited (Olusanya, Neumann, & Saunders, 2014). Because of this limitation, patients who live in
such areas are less likely to receive the services they require to minimize the effects and impacts
of their disability (Olusanya, Neumann, & Saunders, 2014). One of the major impacts of a
hearing related disability is the inability to effectively communicate with others. In adults, this
tends to isolate and stigmatize, and leads to poor social participation, and may severely restrict
occupational opportunities, which is evidenced by high unemployment rates (WHO, 2017). It is
estimated that two-thirds of adults over 70 have some form of hearing impairment. In older
adults, hearing related disorders may decrease the quality of life, decrease cognitive
performance, and increase comorbidities with depression (Dawes et. al., 2014). In children,
especially younger children such as infants and toddlers, undiscovered hearing impairments can
be even more detrimental because of the potential delays to language acquisition and
development (Samelli, Rabelo, Sanches, Aquino, & Gonzaga, 2016).
6
According to the Centers for Disease Control (CDC), five out of every thousand
children may be impacted by hearing-related illness between three to seventeen years of age.
However, hearing loss also significantly impacts older children, who may acquire hearing loss
later on in life. Prompt intervention for hearing related illnesses can drastically reduce, if not
eradicate, any speech related disabilities in children. Access to audiologists and hearing
interventions is therefore paramount for children, which may not be possible in rural areas. Many
audiologists may not have adequate staff or facilities to be able to undertake pediatric
counselling.
Proper audiological diagnosis and subsequent interventions can help mitigate the
aforementioned debilitating effects of undiagnosed hearing related disorders. However, in many
regions around the world, there may be no access to audiological services including diagnostics.
Even in higher income countries such as the United States, there may be a deficiency in
providing access to hearing healthcare services (National Academies of Sciences, Engineering,
and Medicine, 2016). The shortage of audiological professionals and services contributes greatly
to this shortage in access. Conventional audiology practices require dedicated premises with at
least a sound booth and desktop audiometric equipment, which may not be conducive to low-
income areas due to cost, and/or budget constraints (Szudek et. al., 2012).
However, with the rise of mobile technologies, telehealth and/or mHealth (mobile health)
applications offer a promising alternative to the mismatch of need and supply. mHealth
applications such as hEAR, a fully automated hearing screening application, may facilitate the
provision of quality service delivery and improved healthcare access to those who suffer from
debilitating hearing loss. Currently, many researchers all over the world are working on
providing different methods of delivery of hearing healthcare services, with respect to mHealth.
7
Some of these methods may use Békésy audiometry with smartphones and tablets, such as
hEAR, while others may use web browsers. However, regardless of the method of intervention
used to provide access to ‘audiologist quality’ services, all of them have great potential to
improve access to underserved communities both locally and globally.
Telehealth and mHealth have been attested by professional bodies in audiology such as
the American Speech-Language-Hearing Association (ASHA) (Krupinski & Bernard, 2014;
Swanepoel et. al., 2015), as a valid means of delivering services, but there is a need to assess the
success of these technologies in performing as screening/diagnosis tools, as compared to the gold
standards of pure-tone, sweep, and to a lesser extent, speech audiometry, as conducted by an
audiologist. The present study aims to conduct a systematic review of the current body of
literature on available empirical studies pertaining to the efficacy of telehealth and mHealth
applications and services, with a focus on the type of technology used to deliver such
interventions, in ‘at-risk populations’ of adults and children.
Methods
This systematic review was conducted according to the Preferred Reporting Items for
Systematic Reviews and Meta-Analyses (PRISMA) standard. Observational studies in (humans)
adults, and children including infants, that assessed hearing screening via a mobile/handheld
device or a remote connection were included. The participant pool consisted of both men and
women, and was well distributed with respect to age groups, i.e., the participants included
children, adults and older adults. Any studies which utilized any tele-audiology/tele-audiometry
methods including remote computing, handheld mobile devices, computers, specialized devices
developed for the purpose of tele-audiology/tele-audiometry to screen, diagnose, and/or improve

8
access to primary care for hearing related disorders were included in this systematic review.
Studies that assessed paper-based interventions were excluded. Also, meta-analyses, systematic
reviews, clinical trials, white papers, and case reports were excluded. Studies that investigated
physiological/anatomical effects of hearing loss or hearing disorders were also excluded. For the
purpose of this review, efficacy was defined as the success of the intervention(s) in replicating
the results of an audiologist administered test/gold standard. The measures of efficacy were,
therefore, the intervention’s sensitivity, specificity, accuracy, concordance etc., as reported in the
parent study, when the intervention was compared to an industry gold standard, such as a pure
tone test performed by an audiologist.
A two-pronged search strategy was used for this review. The first was searching
databases such as MEDLINE, Web of Science, and PubMed for relevant peer reviewed articles
that followed the inclusion criteria using the following keywords: ‘mobile hearing screening’ OR
‘tablet hearing screening’ OR ‘remote hearing screening’ OR ‘internet based hearing screening’
OR ‘internet-based hearing screening’ OR ‘tablet-based hearing screening’ OR ‘hearing
screening mobile application’ OR ‘hearing screening application’ OR ‘mobile audiometry’ OR
‘remote audiometry’ OR ‘computer-based hearing screening’ OR ‘computer based hearing
screening’ OR ‘computer hearing screening’ OR ‘pure tone audiometry’ OR ‘air conduction
tones’ OR ‘Bekesy audiometry’ OR ‘remote audiology’ OR ‘mobile audiology’ . The second
strategy was using/analyzing the reference lists of relevant articles. The search was then
modified to only include studies published in English, and was limited to studies published from
the year 2000 onwards.

9
Statistical Analyses
Pooled standardized mean differences (SMDs) with their corresponding 95% confidence
intervals were calculated, and the estimates compared the efficacy of different audiology
mHealth technology to the comparators (usually pure tone audiometry performed face to face by
an audiologist), using the metan package in Stata 12 software (Statacorp, 2011) with the default
fixed effects model. The fixed effects model is based on the assumption that all studies
considered in the review are homogenous, i.e., there is no variability between the effect sizes of
the studies, and the model relies on the Q-test statistic to test for heterogeneity. There was
presence of heterogeneity between the studies, and as a result, sensitivity analyses were also
conducted, by stratifying the studies on the basis of type of technology used to deliver mHealth
intervention, and separate estimates were calculated for the different groups. In addition to the
fixed effects model and the forest plot, Begg-Mazumdar regression asymmetry tests were also
conducted to check for potential publication biases using the metabias package in Stata 12. In
addition to both Metan and Metabias, the Metaninf package was also used to test for the
influence of each individual study on the results, and to identify outliers with respect to the
studies.
Results
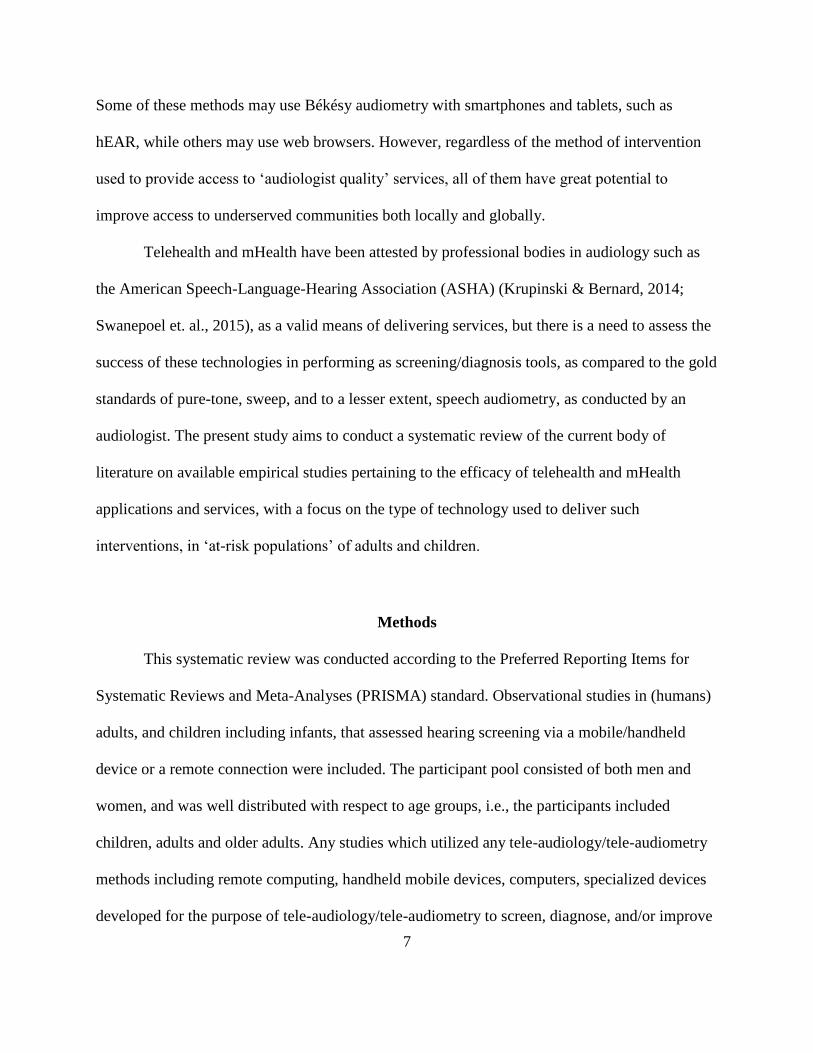
The combined search strategies led to the identification of 13,546 studies, which were
screened for eligibility, and the abstracts of 1,957 were further assessed. Out of 1,957, the full
texts of 284 were further analyzed, and thirty-seven (37) studies met the inclusion criteria, as
shown in Figure 1 below. For the purposes of this review, screening/diagnosis was defined as the
purpose for which the interventions were being specifically tested. Most of the studies (22)
particularly mentioned ‘screening’ as the purpose, 6 mentioned diagnosis, 2 were formulated
10
specifically for newborn screening, 5 mentioned both screening and diagnosis, and 1 assessed
counselling. The potential exists that even though the interventions in the 22 aforementioned
studies were tested as screening devices, they could be used for diagnosis as well (perhaps after
further investigation).
Figure 1: PRISMA flow chart for literature selection
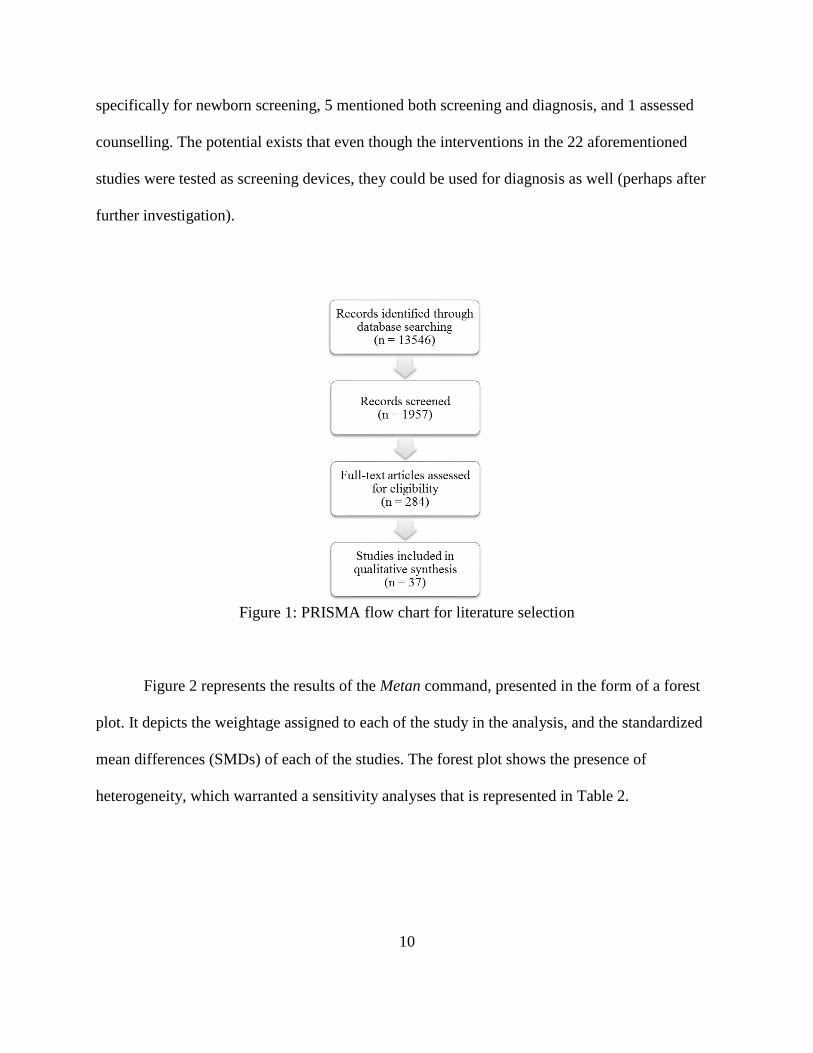
Figure 2 represents the results of the Metan command, presented in the form of a forest
plot. It depicts the weightage assigned to each of the study in the analysis, and the standardized
mean differences (SMDs) of each of the studies. The forest plot shows the presence of
heterogeneity, which warranted a sensitivity analyses that is represented in Table 2.
11
Figure 2: Forest plot for the systematic review
Table 1 represents the results of the tests for individual study influence (Metainf) which
revealed two studies, namely, Rourke et. al. (2016), and Krumm et. al. (2008), were outliers due
to their having the smallest (0.44), and the second smallest (0.62) effect sizes respectively,
however, no study dominated the review. This is also shown by Figure 3 (below).

12
Table 1: Results of test of individual study influence (Metainf)
Reference SMD (95% CI) Combined SMD (95% CI) of other
studies with this study omitted
Samelli (2016) 1 (.71-1.42) .904 (.87-.94)
Choi (2013) 2.11 (.28-16.25) .91 (.88-.94)
Smits (2004) .96 (.89-.1.04) .902 (.87-.93)
Larossa (2015) .97 (.96-.98) .90 (.85-.95)
Foulad (2013) .98 (.94-1.03) .90 (.87-.93)
Kassner (2013) 3.2 (.37-.27.8) .904 (.87-.94)
Yeung (2015) .96 (.89-1.04) .902 (.87-.93)
Yeung (2013) .97 (.84-1.16) .903 (.87-.93)
Pickens (2017) 1.88 (1.07-3.32) .904 (.87-.94)
Tonder (2017) 0.92 (.86-.98) .905 (.88-.94)
Sandstrom (2016) .67 (.35-1.3) .904 (.88-.94)
Mahomed-Asmail (2016) .88 (.86-.91) .906 (.88-.94)
Swanepoel (2014) .99 (.98-1) .899 (.85-.95)
Swanepoel (2015) 1.08 (.75-.1.6) .903 (.87-.93)
Thompson (2015) .98 (.93-1.03) .901 (.87-.93)
Szudek (2012) .99 (.94-1.05) .90 (.87-.93)
Meinke (2017) 1.12 (.25-5.12) .90 (.88-.94)
Bexilius (2008) .88 (.81-.96) .91 (.88-.94)
Gan (2012) .97 (.92-1.02) .902 (.87-.93)
Rourke (2016) .44 (.37-.52) .92 (.89-95)
Eikelboom (2005) .89 (.77-1.03) .91 (.88-.94)
Felizar-Lopez (2011) .90 (.83-.97) .91 (.88-.94)
Eikelboom (2013) .92 (.85-.97) .904 (.88-.94)
Biagio (2011) 1.72 (.67-4.46) .904 (.87-.94)
Ferrari (2013) .95 (.89-1.01) .902 (.87-.93)
Givens (2003) .80 (.74-.85) .91 (.88-.94)
Swanepoel (2010) .74 (.44-1.24) .91 (.88-.94)
Lancaster (2008) .98 (.92-1.04) .901 (.871-.93)
Yao (2015) .79 (.43-1.44) .91 (.88-.94)
Visagie (2015) 2 (.74-5.22) .904 (.87-.94)
Krumm (2007) 1 (.95-1.05) .90 (.87-.93)
Krumm (2008) .62 (.59-.65) .93 (.91-.95)
Ramkumar (2013) .98 (.80-1.21) .903 (.87-.94)
Batasso (2015) .79 (.71-.88) .91 (.88-.94)
Pooled .91 (.88-.94) .91 (.88-.94)

13
Figure 3: Individual influence analysis graph using Metainf
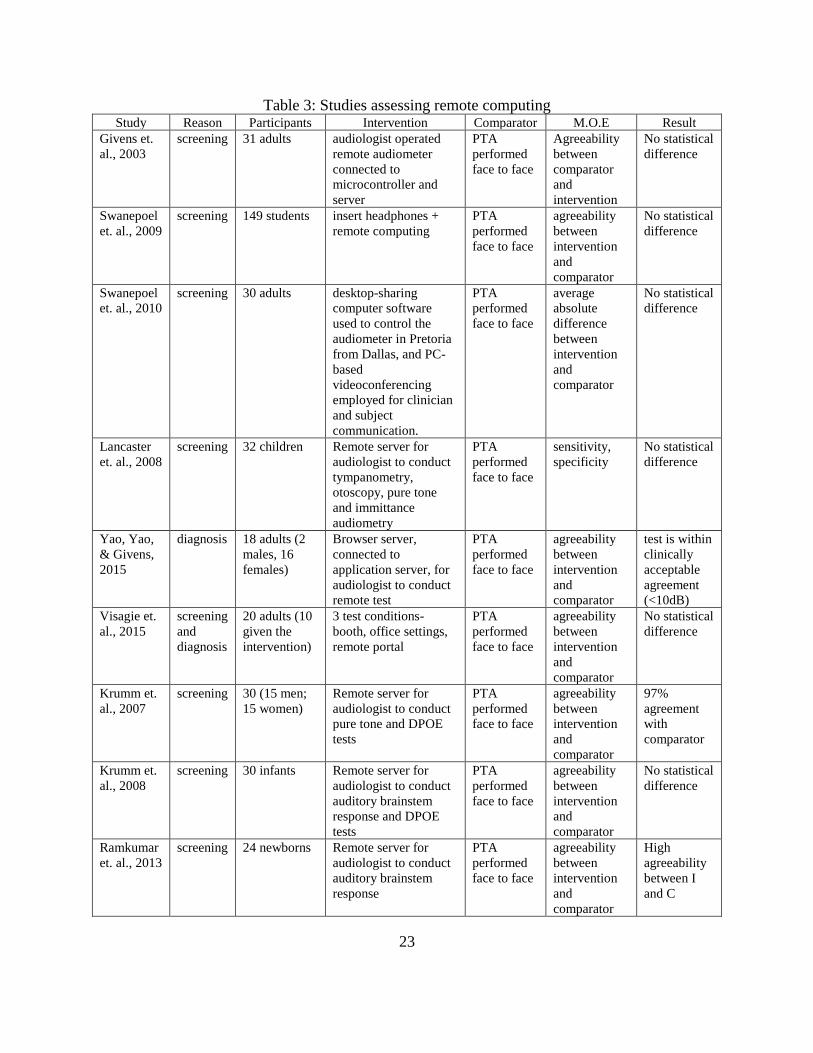
Table 2 represents the results of different types of sensitivity analyses. From the table, it
can be observed that studies assessing remote computing as an intervention did not violate the
assumption of homogeneity, as evidenced by the two non-significant p-values (0.08, 0.16). With
respect to efficacy, ‘special instruments’ were equally efficacious to ‘mobile technology’,
‘remote computing’ was the most efficacious out of the four interventions.

14
Table 2: Results from sensitivity analyses Types of Analyses No. of
studies
Combined SMD
(95% CI) P
All studies 37 0.91 (0.88-0.94) <0.001
Studies that assessed screening 22 0.91 (0.86-0.97) 0.004
Studies that assessed diagnosis 7 0.82 (0.70-0.97) 0.02
Studies that assessed screening and diagnosis 6 0.98 (0.92-1.05) 0.6
Studies with remote computing as intervention 10 0.85 (0.72-1.02) 0.08
Studies with specialized instruments as intervention 7 0.95 (0.91-0.98) 0.001
Studies with internet/email as intervention 2 0.88 (0.811-0.96) 0.004
Studies with mobile technology as intervention 18 0.95 (0.92-0.97) 0.021
Studies with pure tone audiometry as comparator 34 0.92 (0.89-0.96) 0.024
Studies with sweep audiometry as comparator 2 0.84 (0.69-1.02) 0.2
Studies with speech audiometry as comparator 1 2.11 (0.28-16.25) 0.4
Studies with no comparator 3 0.77 (0.52-0.86) 0.048
Studies with otoscopy as a comparator 1 0.89 (0.77-1.03) 0.1
Studies with pure tone audiometry as comparator and mobile
technology as intervention 13 0.96 (0.94-0.98) <0.001
Studies with pure tone audiometry as comparator and remote
computing as intervention 8 0.87 (0.71-1.06) 0.16
Studies with pure tone audiometry as comparator and specialized
instruments as intervention 6 0.95 (0.92-0.98) 0.004
Studies with sweep audiometry as comparator and mobile
technology as intervention 1 1 (0.71-1.42) <0.001
Studies with sweep audiometry as comparator and remote
computing as intervention 1 0.79 (0.71-0.88) <0.001
Studies with speech audiometry as comparator and mobile
technology as intervention 1 2.11 (0.28-16.25) 0.4
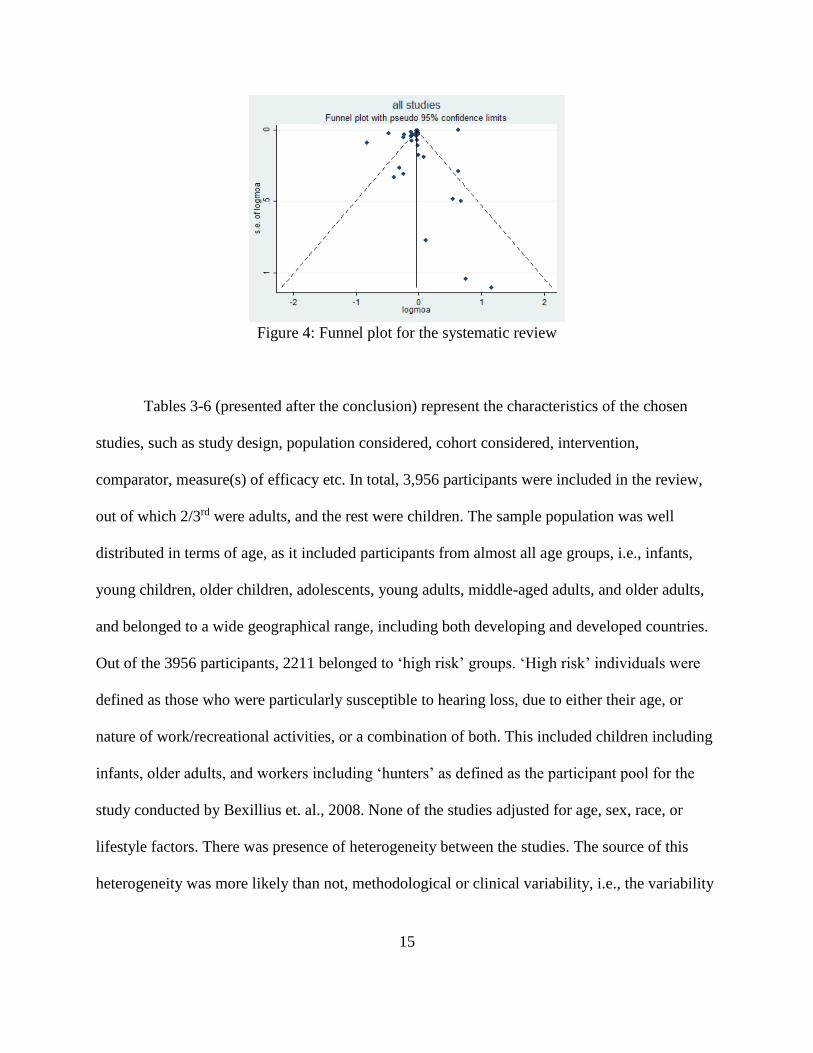
Figure 4 represents a funnel plot depicting the presence/absence of publication bias. The
Begg-Mazumdar test for bias indicates a p value of 0.386 suggesting the absence of any
publication bias (p>0.05). The funnel plot however, suggests that there may be presence of some
publication bias.
15
Figure 4: Funnel plot for the systematic review
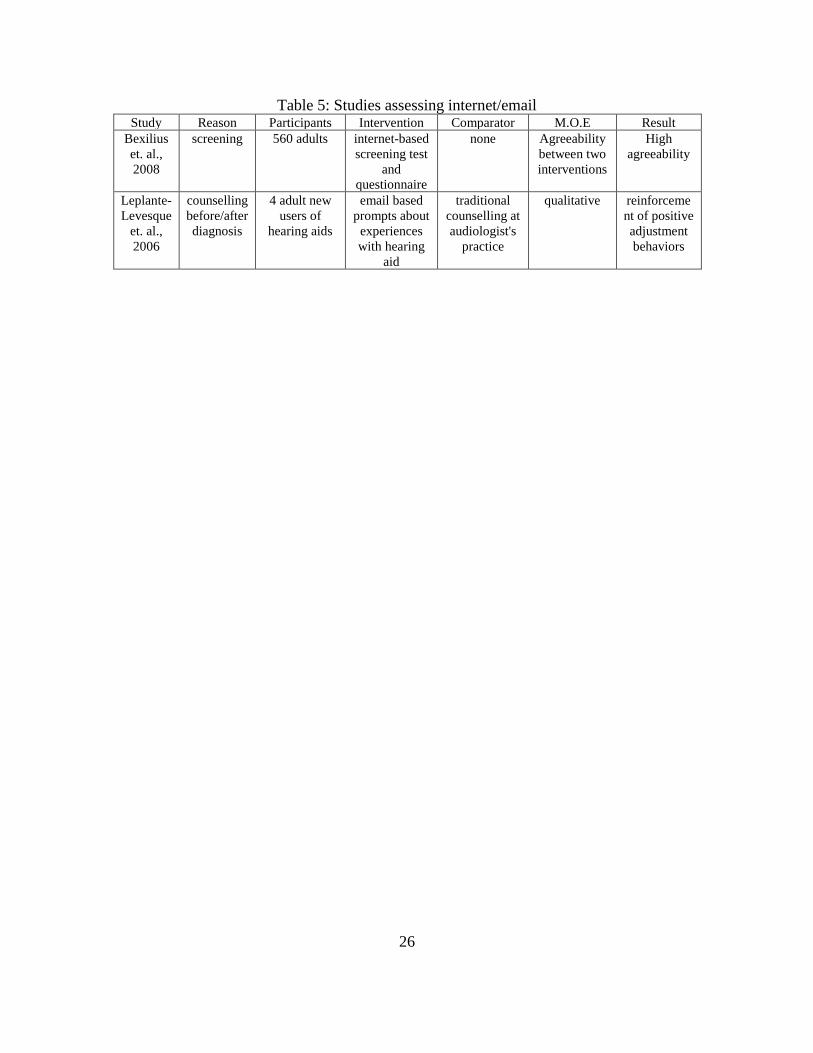
Tables 3-6 (presented after the conclusion) represent the characteristics of the chosen
studies, such as study design, population considered, cohort considered, intervention,
comparator, measure(s) of efficacy etc. In total, 3,956 participants were included in the review,
out of which 2/3rd were adults, and the rest were children. The sample population was well
distributed in terms of age, as it included participants from almost all age groups, i.e., infants,
young children, older children, adolescents, young adults, middle-aged adults, and older adults,
and belonged to a wide geographical range, including both developing and developed countries.
Out of the 3956 participants, 2211 belonged to ‘high risk’ groups. ‘High risk’ individuals were
defined as those who were particularly susceptible to hearing loss, due to either their age, or
nature of work/recreational activities, or a combination of both. This included children including
infants, older adults, and workers including ‘hunters’ as defined as the participant pool for the
study conducted by Bexillius et. al., 2008. None of the studies adjusted for age, sex, race, or
lifestyle factors. There was presence of heterogeneity between the studies. The source of this
heterogeneity was more likely than not, methodological or clinical variability, i.e., the variability
16
due to the difference in patient populations, study designs, types of interventions, types of
comparators, etc.
Discussion
Key Findings
Research on telehealth and mHealth services with respect to both screening and diagnosis
of hearing and hearing related disorders respectively, is growing with the rise of advanced
mobile technology. The present review provides a consolidation of results of such research.
Among all the studies chosen for this review, the methodology for most of the studies considered
was consistent, with some minor deviations. Most of the studies involved using an audiologist’s
diagnosis as the comparator. Three (3) studies used sweep audiometry as the comparator, either
in addition to pure tone audiometry, or singularly. All studies were pilot studies, and therefore
had a smaller participant pool. Despite that, the total combined participants were almost four
thousand (3956). While most of the participants were adults, between 18 to 77, nine (9) studies,
namely, Eikelboom & Swanepoel, 2005, Botasso et.al., 2015, Samelli et. al., 2016, Rourke et.al.,
2016, Swanepoel, Smith & Hall, 2009, Lancaster et. al., 2008, Mohamed-Asmail et. al., 2016,
Yeung et. al., 2013, 2015, Thompson et. al., 2015, had children as the target participants.
Because of the distribution of the participant pool, the findings of the studies may be considered
generalizable. Measures of associations for almost all the studies considered were sensitivity and
specificity of the telehealth intervention, five (5) studies also included the positive and negative
predictive values of the telehealth interventions in addition to the sensitivity and specificity. Out
of the studies considered for this paper, six studies investigated tele-audiology for the purpose of
diagnosis of hearing loss/hearing related disorders, while all others investigated the use of tele-
17
audiology as a screening device. All other studies with the exception of Leplante-Levesque et.
al., (2006) were all quantitative studies, while the latter was a qualitative study researching the
use of tele-audiology as a counselling device/program.
Remote computing as a technological platform to provide mHealth was the most
efficacious to the traditional audiologist performed pure tone screening, and the group also had
low amounts of heterogeneity, as evidenced by the sensitivity analyses shown in Table 2. This
implied, with respect to methodology, assumptions, observations, etc., this intervention method
was the most efficacious, with regards to results, sensitivity, accuracy, and concordance of the
intervention when compared to pure tone audiometry. Study designs, study populations, study
intervention and comparators were similar across these ten studies, and therefore strengthening
the conclusion. This technology is the most similar to a traditional face-to-face test, and this
similarity with the comparator could have contributed to the overall effectiveness of this method.
However, there are also limitations to the method, especially since it relies on a viable internet
connection. In many rural parts of the world, a fast internet connection may not be as achievable
as it was at the study centers. Also, for this method to be as successful as the industry standard, a
dedicated secondary site where the patient could go to get remotely assessed, is required. This
site would also need to be associated with a registered audiologist practice, willing to provide
remote diagnosis/screening services. All of these factors could limit the reach of this method.
With respect to ‘special instruments’, all seven studies assessed different instruments, and
found no statistical difference between the instruments and the comparator, which was a pure
tone test performed face to face by an audiologist for all the studies. However, since none of the
studies reassessed a previously validated instrument (as mentioned in the seven studies) as was
demonstrated for several mobile applications, it is not entirely possible to arrive at a concrete

18
consensus about the efficacy of each of those specialized instruments, without further
assessments in a broader population sample. One study in particular investigated the efficacy of
using an industry designed mobile screening device-the Siemens HearCheck. The
aforementioned device was specifically designed to screen for hearing loss, and is statistically
similar to an audiologist based pure tone test.
Bexilius et. al. (2008) investigated an internet-based hearing test, as well as an internet-
based questionnaire, wherein the researchers compared these two conditions to each other. They
did not use an industry gold standard test to conduct a baseline comparison, and as a result, their
intervention(s) was similar to a self-assessment, as a measure of hearing related disorders.
According to the literature on this subject, self-assessments of hearing are considered at par with
the industry norm of pure tone testing, but an audiologist’s diagnosis is still required. This
affords a significant amount of flexibility and independence to the population, but may suffer
from recall bias, as some may overestimate their conditions. One of the advantages of using self-
assessments for hearing screening in research, is that it may have a much bigger participant pool,
as evidenced by the above-mentioned study (560 participants).
With respect to mobile technology used to provide mHealth interventions, there were a
higher number of studies that relied on a smartphone/tablet application-based system, than all
other interventions. This could have been the cause of the higher degree of heterogeneity in this
group. While the applications had been validated against an industry gold standard, it was found
that for some applications, the results were variable depending upon the population tested. There
were five studies that assessed the validity of uHear mobile application, four studies assessed the
validity of Shoebox Audiometry, two studies assessed HearScreen application, and one study
each assessed AudCal, hEAR, and hearTest applications. Out of all the applications mentioned,

19
uHear, and Shoebox Audiometry, have been made commercially available. However, the validity
of uHear and Shoebox Audiometry, has not been proven conclusively, with varying results in the
studies chosen. It is possible that these issues also exist with the other applications.
The hEAR mobile hearing screening application provides a full spectrum hearing
screening test using seven frequencies (125-8000 Hz). The pilot study by Pickens et. al. (2017)
demonstrated that while the application has the aforementioned capabilities, it is also highly
dependent on the type of headphones (hardware) that it is used in conjunction with. The
headphones used by Pickens et. al. (2017) in their pilot study were reportedly susceptible to
ambient noise, especially at higher frequencies. This was clearly demonstrated in the ‘noisy’
testing room condition, wherein the ambient noise reached over 55dB. While results at all
frequencies were significantly different from the comparator of an audiologist performed pure
tone test in this test condition, results were similar to the comparator at all frequencies, except
4000 Hz and 8000 Hz, in the ‘quiet’ testing room condition. A subsequent study was conducted
by Pickens et. al. (2018) which aimed at validating the hEAR application at all frequencies using
two ‘professional’ headphones, namely, Pioneer HDJ 2000 and Sennheiser HD280 Pro. Any
further research with hEAR should reassess the application in a high-risk population.
As mentioned earlier, there were 2211 participants who belonged to a ‘high risk’ group
by virtue of their age, occupation, activities, or a combination of all three. These participants
accounted for more than 55% of the total sample population, and it bodes well that audiology
related research is conducted on participants who are most representative of the actual affected
population. However, there were a few inconsistencies with respect to the methodology of the
studies that may reduce the efficacy of mHealth interventions for such populations. For example,
25% of the participants belonged to the study conducted by Bexilius et. al (2008). No industry

20
recognized comparator was used to validate the interventions in the study, wherein the two
intervention conditions, i.e., internet-based hearing test and internet-based hearing questionnaire,
were compared to each other. While the sensitivity and specificity of the interventions was
‘good’ when compared to each other, a formal audiometric test would still be required. Similarly,
the mobile application, uHear, also had variable results with respect to validity and accuracy, in a
number of high-risk populations, including children and older adults. In fact, within a pediatric
population, the accuracy and sensitivity of other applications such as ShoeBox Audiometry, also
varied widely. The variation in results was not observed in older populations, and the application
was not tested on workers exposed to occupational noise, or other persons engaged in ‘loud’
activities. This observation of variability of results of a validated application, presents the need to
test similar interventions on a pediatric population.
Like all studies, systematic reviews also have limitations. For instance, as mentioned
earlier, only studies published in English were chosen for this review, and because of the
language bias, other important studies may not have been considered. Similarly, only studies
conducted recently, i.e. from the year 2000 onwards were selected. Also, clinical trials, and other
similar research were excluded which may have resulted in the subsequent exclusion of
important findings. Studies that investigated cochlear implants and the anatomy and physiology
of said implants, were also excluded which may have also excluded other research. Moreover,
since systematic reviews inherently rely on the selected studies’ results, variables, outcomes,
exposures, confounders, etc., any misclassification in the parent studies would more likely than
not have been applied to the systematic review. Also, such reviews suffer from inherent selection
bias, even with efforts to control for it.

21
Overall, this review brought to light the need for such mobile hearing screening
technologies, as a way to not only extend the provision to basic preventative care to underserved
areas, but also as a way of extending a provider’s service capabilities to benefit all stakeholders.
However, even though research on this topic is flourishing, it is still in its infancy, and there is a
dearth of fully validated, clinically proven applications/devices that can be used to truly be
mobile screening technology. There are only a handful of mobile applications (Shoebox
audiometry, uHear, and hEAR) that are fully validated against an industry gold standard, but the
accuracy of the application is dependent on a variety of factors, including sample populations,
and hardware used in conjunction with it, respectively. While the three applications may be
similar, there are considerable monetary differences between the three, with hEAR being the
much cheaper version of a mobile screening application, making it more useful for use in
underserved and under-developed areas around the United States, and the world.
Limitations
Only studies published in English were chosen for this review, and because of the
language limitation other important studies may not have been considered. Similarly, only
studies conducted recently, i.e. from the year 2000 onwards were selected, and as a result earlier
studies were probably missed out on. Moreover, since a systematic review inherently relies on
the selected studies’ results, variables, outcomes, exposures, confounders, comorbidities etc., any
misclassification in the parent studies would have likely have been applied to the review as well,
and the consequent results could have underestimated or overestimated certain measures. Also, it
would be beneficial to use studies that have a more diverse array of comparator variables, so as
to arrive at more robust results.

22
Conclusion
The field of mHealth with respect to audiology is flourishing thanks in part to the
dedication of the many researchers and investigators mentioned many times over in this review.
Over the course of the review, which spans a temporal range of almost two decades, it is evident
that the field is advancing by leaps and bounds-developing from ‘remote’ connections wherein
the audiologists remotely test their patients, to truly mobile applications for smartphones and
tablets such as hEAR, uHear, ShoeBox Audiometry etc. These mobile applications not only
provide patients with the independence to self-administer hearing tests, but also provide them
access to audiologist quality services while doing so. However, the next step would be to test
these applications in the actual way they are going to be used, instead of a highly controlled
experimental environment, to assess if the lab results have ecological validity. mHealth hearing
screening applications can provide an essential service to patients especially in underserved
areas, and more research should be undertaken to facilitate that. The next step would, therefore,
be to test hEAR in a high-risk population, such as a pediatric population, as the results of
validated mobile technology in that particular population are variable.
23
Table 3: Studies assessing remote computing Study Reason Participants Intervention Comparator M.O.E Result
Givens et.
al., 2003
screening 31 adults audiologist operated
remote audiometer
connected to
microcontroller and
server
PTA
performed
face to face
Agreeability
between
comparator
and
intervention
No statistical
difference
Swanepoel
et. al., 2009
screening 149 students insert headphones +
remote computing
PTA
performed
face to face
agreeability
between
intervention
and
comparator
No statistical
difference
Swanepoel
et. al., 2010
screening 30 adults desktop-sharing
computer software
used to control the
audiometer in Pretoria
from Dallas, and PC-
based
videoconferencing
employed for clinician
and subject
communication.
PTA
performed
face to face
average
absolute
difference
between
intervention
and
comparator
No statistical
difference
Lancaster
et. al., 2008
screening 32 children Remote server for
audiologist to conduct
tympanometry,
otoscopy, pure tone
and immittance
audiometry
PTA
performed
face to face
sensitivity,
specificity
No statistical
difference
Yao, Yao,
& Givens,
2015
diagnosis 18 adults (2
males, 16
females)
Browser server,
connected to
application server, for
audiologist to conduct
remote test
PTA
performed
face to face
agreeability
between
intervention
and
comparator
test is within
clinically
acceptable
agreement
(<10dB)
Visagie et.
al., 2015
screening
and
diagnosis
20 adults (10
given the
intervention)
3 test conditions-
booth, office settings,
remote portal
PTA
performed
face to face
agreeability
between
intervention
and
comparator
No statistical
difference
Krumm et.
al., 2007
screening 30 (15 men;
15 women)
Remote server for
audiologist to conduct
pure tone and DPOE
tests
PTA
performed
face to face
agreeability
between
intervention
and
comparator
97%
agreement
with
comparator
Krumm et.
al., 2008
screening 30 infants Remote server for
audiologist to conduct
auditory brainstem
response and DPOE
tests
PTA
performed
face to face
agreeability
between
intervention
and
comparator
No statistical
difference
Ramkumar
et. al., 2013
screening 24 newborns Remote server for
audiologist to conduct
auditory brainstem
response
PTA
performed
face to face
agreeability
between
intervention
and
comparator
High
agreeability
between I
and C

24
Table 3 Continued Study Reason Participants Intervention Comparator M.O.E Result
Batasso et.
al., 2015
screening 243 children
(118 male,
125 female)
Teleaudiometry by
computer software
Sweep
audiometry
Sensitivity Se: 58%

25
Table 4: Studies assessing specialized instruments Study Reason Participants Intervention Comparator M.O.E Result
Gan et. al.,
2012
screening 96 adults
(192 ears)
automated
hearing
screening kit
(auto-kit) with
real time
noise
monitoring
PTA
performed
face to face
sensitivity,
and
specificity
Se: 92.5%,
Sp: 75%
Meinke et.
al., 2017
screening 40 adult
workers
mobile
wireless
automated
hearing-test
system
(WAHTS)
PTA
performed
face to face
(in a mobile
trailer)
test-retest
reliability
no
significant
difference
Eikelboom
&
Swanepoel,
2005
diagnosis 66 children digitized still
images with
accompanying
tympanometry
data
PTA
performed
face to face,
otoscopy
agreeability
between
intervention
and
comparator
High
agreeability
Felizar-
Lopez et.
al., 2011
screening 100 adults Siemens
HearCheck
face to face
audiometry
Sensitivity,
specificity,
PPV, NPV,
accuracy
Se:
77.61%,
Sp:
92.42%,
PPV:
95.41%,
NPV:
67.03%,
Accuracy:
82.5%
Ferrari et.
al., 2013
Screening 60 adults TS
audiometer
PTA
performed
face to face
Sensitivity,
specificity,
PPV, NPV
Se: 95.5%,
Sp: 90.4%,
PPV:
94.9%,
NPV:
91.5%
Eikelboom
et al., 2013
screening
and
diagnosis
54 adults automated
method for
testing
auditory
sensitivity
(AMTAS):
prototype
computer-
based
audiometer
PTA
performed
face to face
test retest
reliability;
accuracy
No
significant
difference
Swanepoel
& Biagio,
2011
screening 30 adults KUDUwave
5000-
computer
based
audiometer
PTA
performed
face to face
test-retest
reliability
No
significant
difference
26
Table 5: Studies assessing internet/email Study Reason Participants Intervention Comparator M.O.E Result
Bexilius
et. al.,
2008
screening 560 adults internet-based
screening test
and
questionnaire
none Agreeability
between two
interventions
High
agreeability
Leplante-
Levesque
et. al.,
2006
counselling
before/after
diagnosis
4 adult new
users of
hearing aids
email based
prompts about
experiences
with hearing
aid
traditional
counselling at
audiologist's
practice
qualitative reinforceme
nt of positive
adjustment
behaviors

27
Table 6: Studies assessing mobile technology
Study Reason Participants Intervention Comparator M.O.E Result
Samelli et.
al., 2016
Screening 30 adults Ipad with hearing
software as
interactive game
sweep
audiometry in
acoustic test
booth
Sensitivity,
specificity,
PPV, NPV
All moa:
100%
Choi et.
al., 2013
Screening
and
diagnosis
15 adults
(25 ears)
Samsung
smartphone with
the pure tones
replaced by 4
Korean
phonemes
Speech
audiometry
agreeability
between
intervention
and
comparator
5 db
difference
between
conventional
pure tone
audiometry,
and PhoSHA
Smits et.
al.,2004
screening 10 adults sound files stored
in computer and
interfaced to
telephone line
that play when
keys are pressed
3 conditions:
sound played
on computer
through
headphones,
use of
telephone in
audiology
dept., using
own
telephone
sensitivity
and
specificity
high
sensitivity
and
specificity for
the
headphone
condition
Larossa et.
al., 2015
diagnosis 110 adults audcal-an ipad
application
PTA
performed
face to face
Kappa’s
coefficient,
Pearson’s
correlation
coefficient
K= 0.89,
PCC= 1
Foulad et.
al., 2013
screening 42 adults iPhone and iPad
based application
PTA
performed
face to face
agreeability
between
intervention
and
comparator
Application
results within
clinically
acceptable
agreement
Shangase
&
Kassner,
2013
screening 86 children UHear on iPod
toucch
PTA
performed
face to face
agreeability
between
intervention
and
comparator
UHear worse
than
comparator
Yeung et.
al., 2013
diagnosis 85 children interactive game
for the Apple®
iPad® (Shoebox
audiometry)
PTA
performed
face to face
sensitivity,
specificity,
npv
Se: 93.3%,
Sp: 94.5%,
NPV: 98.1%
Yeung et.
al., 2015
diagnosis 80 children interactive game
for the Apple®
iPad® (Shoebox
audiometry)
PTA
performed
face to face
sensitivity,
npv
Se: 91.2%,
NPV: 89.7%
Peer &
Fagan,
2015
Screening
and
diagnosis
25 adults uHear-iPhone
app
PTA
performed
face to face
Kappa’s
coefficient
K=0.81-1
Swanepoel
et. al.,
2015
Screening
and
diagnosis
23 adults Smartphone
application
PTA
performed
face to face
test retest
reliability
no significant
difference

28
Table 6 Continued Study Reason Participants Intervention Comparator M.O.E Result
Pickens et.
al., 2017
screening 30 adults hEAR mobile
application for
Android on
Samsung Galaxy
tab 3
PTA
performed
face to face
absolute
differences
between the
intervention
and the
comparator
no statistical
differences
for 5
frequencies
(125-2000
HZ),
marginal
significant
differences at
4000, 8000
Hz.
Tonder
et.al.,
2017
screening 95 (30
adults; 65
adolescents)
Smartphone-
based threshold
audiometry-
hearTest
PTA
performed
face to face
agreeability
between
intervention
and
comparator
no significant
difference
Sandstrom
et. al.,
2016
Screening
and
diagnosis
94 adults calibrated
smartphone-
based hearing test
PTA
performed
face to face
agreeability
between
intervention
and
comparator
Different
reliability at
different
frequencies
Mahomed-
Asmail et.
al., 2016
screening 1070
children
hearScreen
smartphone
application
PTA
performed
face to face
sensitivity
and
specificity,
referral rate,
test time
Se: 75%, Sp:
98.5%,
RR: 3.2% (vs
4.6%), TT:
12.3% faster
Swanepoel
et. al.,
2014
Screening 15 adults;
162
children
hearScreen
android
application
PTA
performed
face to face
Absolute
differences
between the
intervention
and the
comparator
no significant
difference
Thompson
et. al,
2015
screening
and
diagnosis
49 (44
adults, 5
children)
Shoebox
audiometry
face to face
audiometry
agreeability
between
intervention
and
comparator
test is within
clinically
acceptable
agreement
(<10dB)
Szudek et.
al., 2012
Screening 100 adults uHear iPod
application
PTA
performed
face to face
sensitivity,
specificity,
Positive
likelihood
ratio
Se: 98%, Sp:
82%, PLR: 9
Rourke et.
al., 2016
diagnosis 218
children
a tablet connected
to TDH 39
headphones to
conduct air
conduction pure
tones
none Abnormal
results=
hearing loss
Hearing loss
in 14.8%
participants

29
PAPER 2: HARDWARE VALIDATION FOR HEAR MOBILE HEARING
SCREENING APPLICATION*
Introduction
Hearing loss is the third most common physical condition in the United States, with a
higher incidence than both cancer(s) and diabetes (Masterson et. al., 2017). The World Health
Organization (WHO) estimates that over 5% of the world’s population, which is approximately
360 million people, suffer from debilitating hearing loss, defined as ‘hearing loss greater than 40
dB in the ‘better hearing ear’ in adults and at 30 dB or greater in children’ (WHO, 2017). While
the causes of hearing loss may be varied, ranging from congenital factors, to smoking, to
occupational and/or recreational noise exposure, the effect of hearing loss on a person’s life and
lifestyle is profound. One of the major impacts is the inability to effectively communicate with
others and the subsequent impact on quality of life.
Some may be more susceptible, or ‘at-risk’ to hearing loss than others, due to certain
factors. Audiologists, and audiology researchers define ‘at-risk’ or ‘high-risk’ patients for
hearing loss as those who are more susceptible to hearing loss due to either age, usually children
or older adults, or those exposed to loud noises by virtue of their occupations or leisure activities
(WHO, 2019). While occupationally-induced hearing loss is frequently targeted as a major
concern for employees (Li-Korotky, 2012), the overall shortfall of qualified audiologists has
created the demand for a valid hearing screening options for not only the employed (regardless
* Reprinted with permission from “Headphone evaluation for app-based automated mobile hearing screening” by
Pickens, A., Robertson, L., Smith, M., Zheng, Q., Mehta, R., & Song, S., 2018. International Archives of
Otorhinolaryngology, 22(04), 358-363, 2018, by Thieme publishers
30
of the industry, be it rural or urban, public or private) but also, for others in the greater
population (Yeuh, Shapiro, MacLean, & Shekelle, 2003).
Need for Alternatives
To address the gap between supply and demand of audiological services, the number of
qualified audiologists would need to increase by 34%. Currently, there is no such indication that
such an increase is expected. The ubiquity of smartphone and tablet computers enables the
distribution of applications that can close this purported gap, and can perform audiometric
screenings using commercially available hardware. The hEAR application is one such
application, and previous work (Pickens et. al., 2017) analyzing the application indicated the
capacity for the hEAR mobile application to replicate audiologist-collected screening data, but
with a strong dependence upon headphone reproduction capacity. The headphones used in the
aforementioned study were Bose AE2 headphones, which were designed for ‘day-to-day use’
such as music listening. These were supra-aural or over-the-ears headphones, and while they
may have been objectively good for what they were designed for, they couldn’t accurately
reproduce frequencies above 1500 Hz. It was concluded by that study, that the hEAR application
needed to be retested using different types of headphones, to find ones that could accurately
reproduce the frequencies used in the application, since the hEAR mobile application was
capable of replicating audiologist-collected screening data, but had a strong dependence upon
headphone reproduction capacity (Pickens et. al., 2017).
This incident of headphone reliability affecting the accuracy of tablet audiometers (and
similar instruments) is not a singular one. Other researchers have had similar issues. For
example, Masalski & Krecicki (2013) conducted a study to validate a ‘web-based pure-tone self-
test’ using off-the shelf ‘ordinary headphones’, and found that the test sound pressure level

31
observations were ‘greatly exaggerated’ with respect to pure tone audiometry. They concluded
that the self-test should not be used by itself, since the difference in headphone/earphone
hardware at different households could result in ambiguous or inconclusive results. Similarly,
Choi et. al. (2013) observed different results when different sets of headphones were used to test
their phoneme-based screening application. Ferrari et. al. (2013) also observed a certain degree
of variability in the sensitivity and specificity of the TS audiometer when different headphones
were used.
Therefore, while the somewhat inconclusive results of the hEAR application in the
Pickens et. al. (2017) pilot study are not isolated, it is imperative that the correct hardware
(headphones) need to be identified so as to be used in conjunction with the application, and any
further research regarding the hEAR application should focus on this endeavor, as the application
is dependent on the headphone reproduction capacity. If hEAR is to be considered as a reliable
and valid alternative to a pure tone audiometric test for the eventual purposes of screening, and
diagnosis of hearing loss, it must first be validated against the gold standard of audiologist-
administered pure-tone testing. This was the purpose of the present study.
Research Aims
H0-1: There is no statistically significant difference between the results of screening data
collected with the hEAR application using the four different types of headphones, i.e., two sets
of professional headphones, and two sets of consumer headphones.
H0-2: There is no statistically significant difference between the results of screening data
collected with the hEAR application, and that of an audiologist-administered pure-tone test.
32
Participants
Thirty (30) participants who were university students, faculty, and staff were enrolled in
the study. Twelve (12) of the 30 participants were female, and eighteen (18) (60%) were male.
While participants’ ages ranged from 20–57 years, most were aged 25–32 years (n = 18).
Participants had no previously diagnosed hearing loss and were required to limit noise exposure
24 hours prior to all tests. All participant recruitment, consent, data collection, and evaluation
methodologies were reviewed and approved by the Texas A&M University Institutional Review
Board (IRB) for the Protection of Human Subjects.
Methods
Equipment
A Samsung Galaxy Tab™ 3.0 - an Android device, was chosen to test hEAR mobile
application because it is built upon the Android platform. The hEAR application itself was
designed based on best-practices for automated screenings from a variety of sources, such as the
World Health Organization (WHO), which recommends the Békésy-style audiometry for self-
administered hearing screenings (Franks, 1995). As is best practice with these recommendations,
test tones initiate at inaudible levels and subjects respond to the attenuator control once they hear
the tone.
Headphone Acoustics
There were four pairs of headphones that were chosen based on their frequency spectrum
reproduction qualities. Two of the headphones were professional headphones, and the other two
headphones were consumer headphones. While consumer headphones usually have a more
‘natural’ frequency response, these types of headphones are also the most widely available, and
33
therefore, are easier to access. A ‘natural’ frequency response is defined to be ‘slightly higher (3-
4 dB) frequency weight in the bass’ which is the lower frequency range, and with ‘slight dips in
the higher frequency range’ (Hertsens, 2015). The four headphones were namely:
Pioneer HDJ 2000: These headphones are circumaural headphones, and the flagship
‘professional headphones’ from Pioneer. They have a frequency reproduction range of 5-30,000
Hz, and have a ‘flat frequency response’ in keeping with their intended purpose, which is to be
used by audio engineers, and DJs. Because of the flat frequency reproduction, they are able to
more accurately reproduce the cross-spectrum frequencies from input through the output, with
minimal distortions, or enhancements. By virtue of their design being circumaural, i.e. the
cushion of the headphone(s) seals around the ear, the headphones offer some amount of ambient
noise attenuation, but are not noise cancelling.
Sennheiser HD280 Pro: These headphones are also circumaural, and are designed for
audiometric testing. However, they are also referred to as ‘hybrid’ headphones as some regard
their design as ‘super-aural’ (Hertsons, 2019). They have a frequency reproduction range of 20-
20,000 Hz, and have a ‘flat frequency response’, and are therefore, suitable for audiometric
testing. These have indeed been used for the same purpose by several researchers (Pereira et. al.,
2018; Smull, Madsen, & Margolis, 2018; Van der Aerschot et.al., 2016). These headphones
comply with ANSI S3.6 (2010) which is the standard for ‘Coupler Calibration of Earphones’.
Bose Quiet Comfort 25 NC: These headphones are also circumaural, and are designed for
everyday use. These are the flagship noise cancelling headphones by the manufacturer, and offer
the best noise cancellation (Hertsens, 2014) in consumer headphones. The frequency response is
‘natural’, i.e. slightly higher bass frequencies, and somewhat colored over 4000 Hz.

34
Sony MDR 7506: These headphones are also circumaural, and are designed for everyday use.
Their frequency response is also ‘natural’, and emphasize the 500-2000 Hz frequency range.
These are budget headphones, and do not offer noise cancellation.
hEAR Application
Working within the OSHA and WHO guidelines, the application automatically
administered a series of mini-trials based on the OSHA-designated frequencies (125, 250, 500,
1000, 2000, 4000, and 8000 Hz). Each frequency was administered a minimum of four (4) times
bilaterally. Each of these mini-trials were administered randomly to the subject. Each participant
underwent at least 28 mini-trials; each individual frequency collection period lasted for 27–33
seconds. The entirety of one full-spectrum collection period of ~15–20 minutes.
With the potential for false positives/negatives in the user feedback, the application has a
series of algorithms to identify values that may be false positives/negatives in the data collection.
These series of algorithms are primarily based on amount of deviations from normal hearing
responses (dB) of the general public at each test frequency. With regard to this, the application,
upon identifying a potential false positive/negative in the data collection, automatically randomly
re-administered the identified frequency again later in the test sequence.
The study was the continuation of a previously conducted prospective cohort pilot study
(Pickens et. al., 2017). Pilot data indicated the presence of confounders on basis of hardware
used on the quality of data collected. That was the purpose of this study, to evaluate headphones
with different frequency response reproduction capacities for accuracy of app-based hearing
screening data collection.
Each participant was assigned a participant ID, which was a 7-digit random number.
These were generated by a uniform distribution random number generator for data
35
collection/analysis purposes. Subject trials were randomized and counterbalanced so that half of
subjects-initiated data collection procedures in the laboratory (Group 1) and the other half with
the audiologist (Group 2). This was done to ensure unbiased estimates. Scheduling of data
collection was performed at an initial meeting with a member of the research team where
subjects completed screening questionnaires. All communication between the researchers and the
local audiologist used this identification number to maintain participant protection standards.
Testing procedures were performed in the laboratories to meet the requirements of
Appendix D of 29 CFR 1910.95 (Audiometric Test Rooms, 2015). Ambient SPL, on each testing
cycle, for all 30 subjects averaged 24 dBA.
Statistical Analyses
The outcome variable of interest was Sound Pressure Level (SPL) in decibels (dB). The
SPL measurements were differentiated by both the hEAR mobile application and pure-tone
audiometry test, based on ear side (i.e., left and right ears). Preliminary analysis for the pilot data
as well as the current data showed that ear side was not significant (t=0.593, df=1478, p =
0.5532).
For each fixed group, fixed frequency, and fixed headphone, each participant had 8
measurements recorded by the hEAR application and 8 corresponding measurements recorded
by the audiologist. These measurements were used to calculate 8 agreement scores. Each
agreement score was defined as the absolute difference between the SPL response recorded by
the hEAR application and the SPL response recorded by the audiologist. The agreement scores
were correlated within each study subject. From these 8 scores, a total agreement score was
generated for that ID at the particular frequency, using the Eq. 1 below.
36
𝐴𝑔𝑖 = ∑ |𝑙𝑒𝑓𝑡𝐴𝑝𝑝𝑖𝑗 − 𝑙𝑒𝑓𝑡𝐷𝑜𝑐𝑡𝑜𝑟𝑗| + ∑ |𝑟𝑖𝑔ℎ𝑡𝐴𝑝𝑝𝑖𝑗 − 𝑟𝑖𝑔ℎ𝑡𝐷𝑜𝑐𝑡𝑜𝑟𝑖|4𝑗=1
4𝑗=1 . (1)*
Here Agi is the (total) agreement score for subject i at the particular frequency, and for
each j (j=1,2,3,4), leftAppij is the sound pressure level of the left ear (in decibels) as measured by
the hEAR application on that particular set of headphones, leftDoctorj is the sound pressure level
of the left ear (in decibels) as measured by the audiologist, rightAppij is the sound pressure level
of the right ear (in decibels) as measured by the hEAR application on that particular set of
headphones, and rightDoctorj is the sound pressure level of the right ear (in decibels) as
measured by the audiologist. The smaller the agreement score, the better it was.
The final outcome variable is a dichotomized version of the agreement score. It is
generally accepted that a difference of 1db between the device and the audiologist should be
‘good enough’. Therefore, a threshold tolerance value (θ) of 8 was chosen to dichotomize the
agreement score. In other words, Yi was a binary random variable defined by Eq. (2):
𝑌𝑖 = {0 𝑖𝑓 𝐴𝑔𝑖 ≤ 𝜃1 𝑖𝑓 𝐴𝑔𝑖 > 𝜃
(2)†
Where θ is the threshold value of the agreement score Agi, set at 8. Yi can take the values of 0
and 1, with probabilities Pi and 1-Pi.
The binary response variable Yi depends on three predictor/indicator variables, namely,
group, headphone, and frequency (these indicator variables are also called dummy variables).
* Reprinted with permission from “Headphone evaluation for app-based automated mobile hearing screening” by
Pickens, A., Robertson, L., Smith, M., Zheng, Q., Mehta, R., & Song, S., 2018. International Archives of
Otorhinolaryngology, 22(04), 358-363, 2018, by Thieme publishers † Reprinted with permission from “Headphone evaluation for app-based automated mobile hearing screening” by
Pickens, A., Robertson, L., Smith, M., Zheng, Q., Mehta, R., & Song, S., 2018. International Archives of
Otorhinolaryngology, 22(04), 358-363, 2018, by Thieme publishers

37
This is represented in the following SAS proc genmod model statement, with the distribution
being binomial, and the link function being logit:
Y = group headphone frequency;
As iterated earlier, the participants were placed into one of two groups depending upon
the order in which they tested the hEAR application. Therefore, the indicator variable group had
two possible values. Since the participants were testing the hEAR application on four different
headphones (Pioneer, Sennheiser, Bose, and Sony), the indicator variable headphone had four
possible values. Lastly, the hEAR application uses pure tones at seven different frequencies to
provide a full spectrum hearing test. Therefore, the indicator variable frequency had seven
possible values.
The indicator variable frequency was added as an additional variable in the model
statement to improve the fit of the model. The original model initially had two indicator
variables, namely, group, and headphone.
Statistical analyses were performed using SAS® (Version 13.1). The agreement scores
were correlated within each study subject. Hence, Generalized Estimating Equations (GEE) were
used to analyze the data (Pickles, 1998). The analyses gave results in terms of log-odds (logits),
which were then translated to corresponding probabilities using the relation (3) below.
𝑃𝑖 = 𝑙𝑜𝑔𝑖𝑡−1(𝜂𝑖) =𝑒𝜂𝑖
1+𝑒𝜂𝑖=
1
1+𝑒−𝜂𝑖 (3)
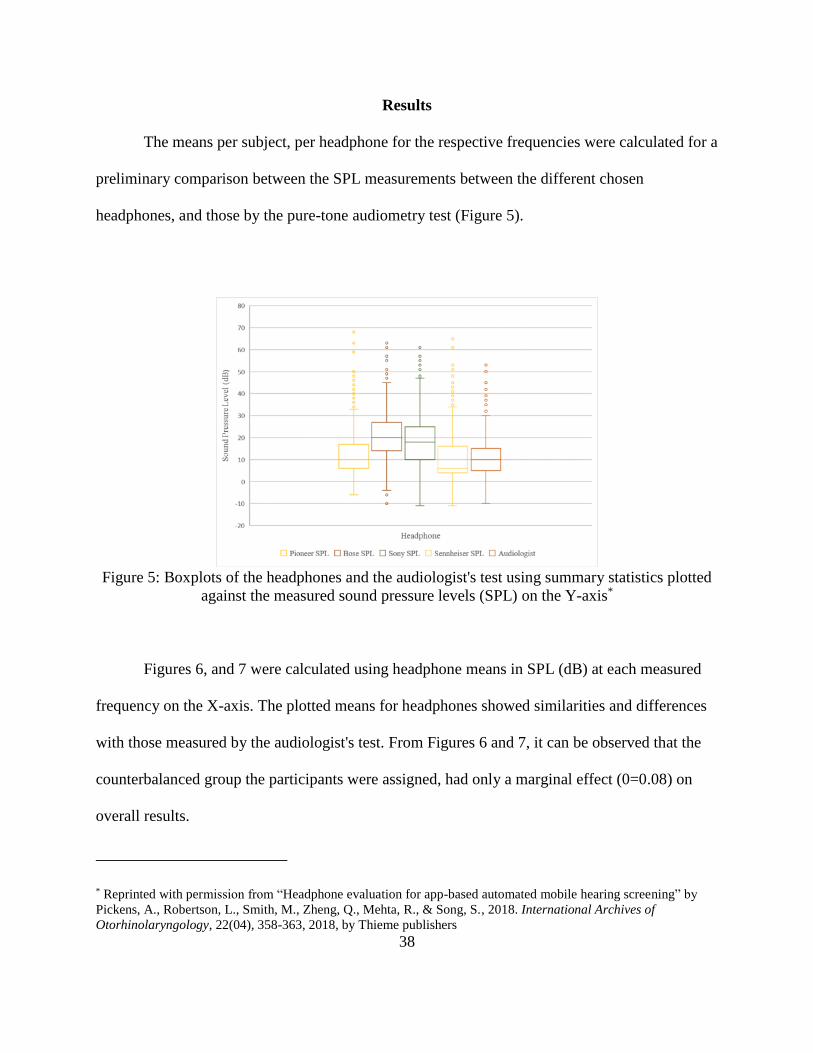
38
Results
The means per subject, per headphone for the respective frequencies were calculated for a
preliminary comparison between the SPL measurements between the different chosen
headphones, and those by the pure-tone audiometry test (Figure 5).
Figure 5: Boxplots of the headphones and the audiologist's test using summary statistics plotted
against the measured sound pressure levels (SPL) on the Y-axis*
Figures 6, and 7 were calculated using headphone means in SPL (dB) at each measured
frequency on the X-axis. The plotted means for headphones showed similarities and differences
with those measured by the audiologist's test. From Figures 6 and 7, it can be observed that the
counterbalanced group the participants were assigned, had only a marginal effect (0=0.08) on
overall results.
* Reprinted with permission from “Headphone evaluation for app-based automated mobile hearing screening” by
Pickens, A., Robertson, L., Smith, M., Zheng, Q., Mehta, R., & Song, S., 2018. International Archives of
Otorhinolaryngology, 22(04), 358-363, 2018, by Thieme publishers

39
Figure 6: Sound Pressure Level (SPL) means per headphone for Group 1*
Figure 7: Sound pressure level (SPL) means per headphone for Group 2†
The results show that neither the group nor the order in which the two tests were
* Reprinted with permission from “Headphone evaluation for app-based automated mobile hearing screening” by
Pickens, A., Robertson, L., Smith, M., Zheng, Q., Mehta, R., & Song, S., 2018. International Archives of
Otorhinolaryngology, 22(04), 358-363, 2018, by Thieme publishers † Reprinted with permission from “Headphone evaluation for app-based automated mobile hearing screening” by
Pickens, A., Robertson, L., Smith, M., Zheng, Q., Mehta, R., & Song, S., 2018. International Archives of
Otorhinolaryngology, 22(04), 358-363, 2018, by Thieme publishers
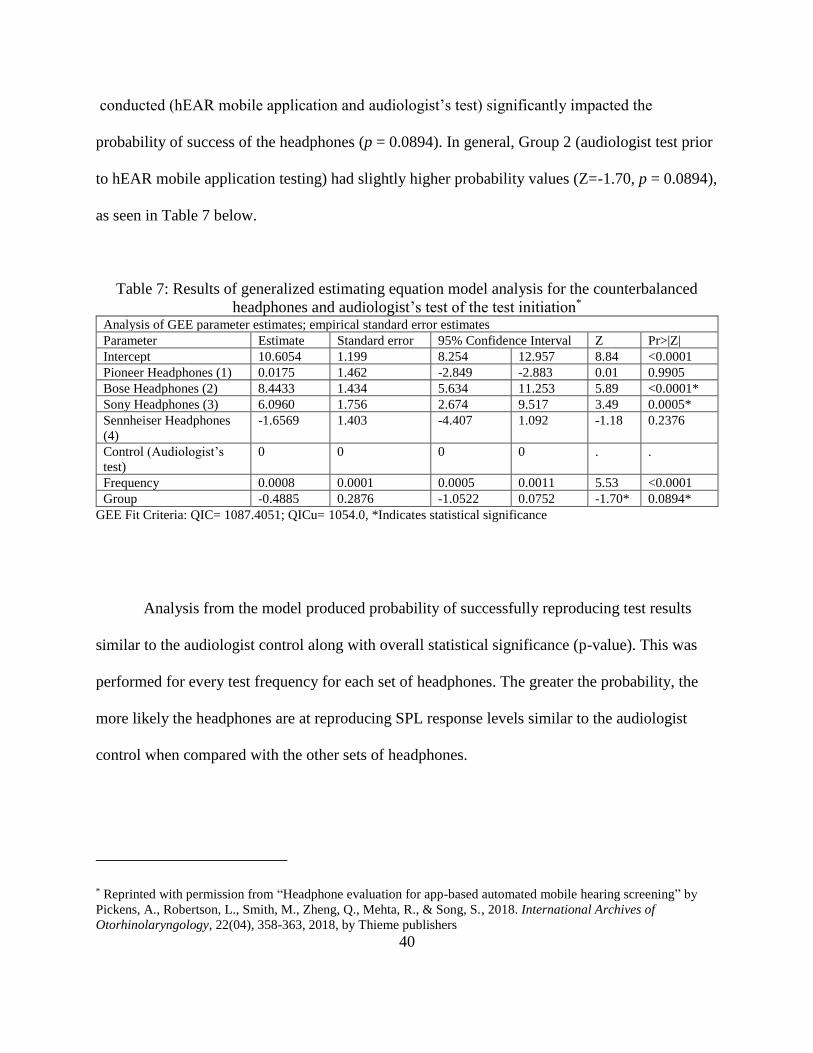
40
conducted (hEAR mobile application and audiologist’s test) significantly impacted the
probability of success of the headphones (p = 0.0894). In general, Group 2 (audiologist test prior
to hEAR mobile application testing) had slightly higher probability values (Z=-1.70, p = 0.0894),
as seen in Table 7 below.
Table 7: Results of generalized estimating equation model analysis for the counterbalanced
headphones and audiologist’s test of the test initiation* Analysis of GEE parameter estimates; empirical standard error estimates
Parameter Estimate Standard error 95% Confidence Interval Z Pr>|Z|
Intercept 10.6054 1.199 8.254 12.957 8.84 <0.0001
Pioneer Headphones (1) 0.0175 1.462 -2.849 -2.883 0.01 0.9905
Bose Headphones (2) 8.4433 1.434 5.634 11.253 5.89 <0.0001*
Sony Headphones (3) 6.0960 1.756 2.674 9.517 3.49 0.0005*
Sennheiser Headphones
(4)
-1.6569 1.403 -4.407 1.092 -1.18 0.2376
Control (Audiologist’s
test)
0 0 0 0 . .
Frequency 0.0008 0.0001 0.0005 0.0011 5.53 <0.0001
Group -0.4885 0.2876 -1.0522 0.0752 -1.70* 0.0894*
GEE Fit Criteria: QIC= 1087.4051; QICu= 1054.0, *Indicates statistical significance
Analysis from the model produced probability of successfully reproducing test results
similar to the audiologist control along with overall statistical significance (p-value). This was
performed for every test frequency for each set of headphones. The greater the probability, the
more likely the headphones are at reproducing SPL response levels similar to the audiologist
control when compared with the other sets of headphones.
* Reprinted with permission from “Headphone evaluation for app-based automated mobile hearing screening” by
Pickens, A., Robertson, L., Smith, M., Zheng, Q., Mehta, R., & Song, S., 2018. International Archives of
Otorhinolaryngology, 22(04), 358-363, 2018, by Thieme publishers
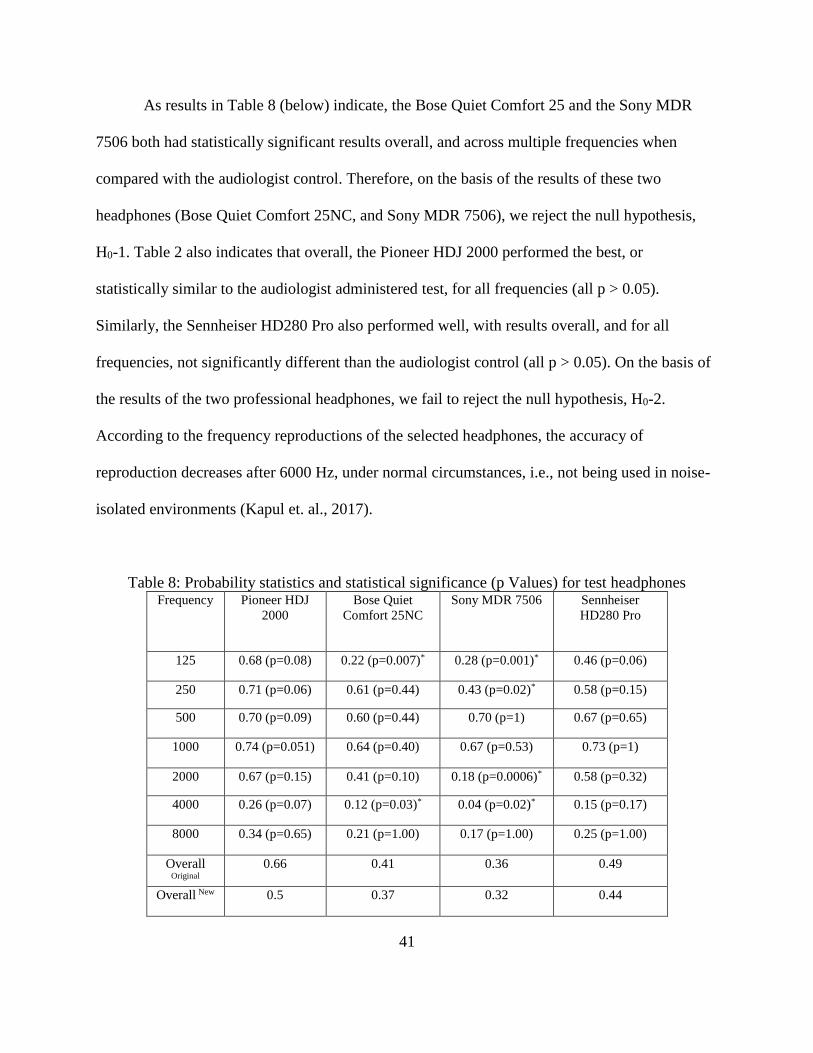
41
As results in Table 8 (below) indicate, the Bose Quiet Comfort 25 and the Sony MDR
7506 both had statistically significant results overall, and across multiple frequencies when
compared with the audiologist control. Therefore, on the basis of the results of these two
headphones (Bose Quiet Comfort 25NC, and Sony MDR 7506), we reject the null hypothesis,
H0-1. Table 2 also indicates that overall, the Pioneer HDJ 2000 performed the best, or
statistically similar to the audiologist administered test, for all frequencies (all p > 0.05).
Similarly, the Sennheiser HD280 Pro also performed well, with results overall, and for all
frequencies, not significantly different than the audiologist control (all p > 0.05). On the basis of
the results of the two professional headphones, we fail to reject the null hypothesis, H0-2.
According to the frequency reproductions of the selected headphones, the accuracy of
reproduction decreases after 6000 Hz, under normal circumstances, i.e., not being used in noise-
isolated environments (Kapul et. al., 2017).
Table 8: Probability statistics and statistical significance (p Values) for test headphones Frequency Pioneer HDJ
2000
Bose Quiet
Comfort 25NC
Sony MDR 7506 Sennheiser
HD280 Pro
125 0.68 (p=0.08) 0.22 (p=0.007)* 0.28 (p=0.001)* 0.46 (p=0.06)
250 0.71 (p=0.06) 0.61 (p=0.44) 0.43 (p=0.02)* 0.58 (p=0.15)
500 0.70 (p=0.09) 0.60 (p=0.44) 0.70 (p=1) 0.67 (p=0.65)
1000 0.74 (p=0.051) 0.64 (p=0.40) 0.67 (p=0.53) 0.73 (p=1)
2000 0.67 (p=0.15) 0.41 (p=0.10) 0.18 (p=0.0006)* 0.58 (p=0.32)
4000 0.26 (p=0.07) 0.12 (p=0.03)* 0.04 (p=0.02)* 0.15 (p=0.17)
8000 0.34 (p=0.65) 0.21 (p=1.00) 0.17 (p=1.00) 0.25 (p=1.00)
Overall
Original
0.66 0.41 0.36 0.49
Overall New 0.5 0.37 0.32 0.44

42
Additionally, in Figure 5 it can be seen that the boxplots for Pioneer headphones and the
audiologist’s test show noticeable similarity with strong overlap in the data.
These analyses were redone, wherein an additional variable, namely ‘Frequency’, was
added to the SAS model statement. This was done to improve the fit of the model further. This
resulted in the reduction of the overall probability of the headphones, however, the results were
identical to the previous analysis, i.e. Pioneer HDJ2000 were the best headphones out of the four
headphones tested, followed by Sennheiser HD280 Pro, followed by Bose QuietComfort 25NC,
and Sony MDR 7506 were the poorest performing headphones out of the four.
Discussion
The study aimed to evaluate an automated application in hearing screening effectiveness
when compared to audiologist-administered examinations. The study also aimed to evaluate the
laboratory effectiveness of off-the-shelf headphones with flat vs. natural reproduction spectrums
in comparison to audiologist collected hearing data. It was found that the use of the hEAR
application with either of the two professional units of headphones, i.e., Pioneer HDJ2000 and
Sennheiser HD280 Pro, resulted in statistically similar pure-tone thresholds at all frequencies, as
compared to an audiologist’s test. This was most likely due to the relatively ‘flat frequency
reproduction’ of both those headphones, wherein there is no difference between the input and the
output frequencies, and as a result, the frequency spectrum is most accurately reproduced. This
study also found Pioneer HDJ2000 to be the best overall headphones for use with this
application, followed by Sennheiser HD280 Pro, on the basis of probability of success, i.e., the
higher the probability, the better the headphones were (at that particular frequency).

43
The efficacy of Sennheiser HD280 Pro as audiometric testing headphones has been
documented by recent studies (Pereira et. al., 2018; Smull, Madsen, & Margolis, 2018; Van der
Aerschot et.al., 2016). These studies found that the headphones were ‘fairly accurate’ in
reproducing the ‘requisite frequencies’ (Pereira et. al., 2018), the headphones’ ability to attenuate
ambient noise decreased at higher frequencies (Van der Aerschot et.al., 2016), and that when
compared to its predecessor, the HDA 200, the HD 280 had 5dB decrease in the reference
equivalent threshold sound pressure levels, and demonstrated more occlusion effects (Smull,
Madsen, & Margolis, 2018). It could be concluded from these studies the Sennheiser HD280 Pro
were usable as audiometric headphones for pure tones (air conduction tests). However, none of
the studies measured the differences in threshold measurements at each frequency level, when
compared to the audiologist performed pure tone test. All of the studies also found that the
headphones were not as accurate at higher frequencies, which is replicated in our study results as
well. This finding could be due to a couple of reasons. Firstly, the Sennheiser HD280 Pro
headphones are designed to be used in soundproof testing environments. Our testing lab, and the
testing lab used for Pereira et. al., 2018 were both not soundproof. Coupled with the decreased
noise attenuation at higher frequencies, this could likely cause the decrease in probability of
success, due to interaction with ambient noise. Despite these characteristics, the Sennheiser HD
280 Pro have been recommended as an effective audiometric headphone set, especially for
portable audiometry (Kapul et. al., 2017). However, during the testing, several participants
commented that the ear cups did not fully cover their ears during testing for the Sennheiser HD
280 Pro. This lack of coverage could potentially have had an effect on the overall results for the
Sennheiser headphones.

44
Studies that research tablet audiometry usually use the TDH brand of audiometric
headphones (Gan et. al., 2012; Batasso et. al., 2015; Rourke et. al., 2016; Samelli et. al., 2016),
which are the ‘preferred brand of audiologists’, but are usually much less accessible for the
general public. Using this brand of headphones would have resulted in the validation of hEAR,
just as with Pioneer HDJ 2000 and Sennheiser HD280 Pro, but would have negated one of the
recommended best practices principle of any alternative intervention (to pure tone audiometry)
being readily accessible.
Although the Bose Quiet Comfort 25 were noise canceling, they are specifically designed
for a heavier weight in the reproduction spectrum to be placed on lower frequencies e.g. a “heavy
bass music listening” for daily use and comfort rather than audiometric testing (Hertsens, 2014).
Therefore, even though these headphones were preferred by most participants because of their
comfort, they did not prove as effective for testing hearing. The same was the case with Sony
MDR 7506.
With respect to the consumer headphones, both sets had statistically significant
differences for at least two frequencies (125 Hz, 4000 Hz), resulting in an overall statistically
significant difference between the hEAR application and the audiologist test. The circumaural
nature of the headphones and the resultant noise attenuation resulted in a more accurate
representation of the frequencies utilized in the hEAR application, as compared to our previous
study, wherein we utilized supra-aural headphones.
Overall, the Pioneer HDJ 2000 headphones were the best audiometry screening option for
use with the hEAR mobile application. Therefore, they may offer a portable option for full-
spectrum audiometric screening. The Sennheiser HD280 Pro headphones, while potentially more
capable than the Pioneer HDJ 2000, may be limited to very isolated testing environments. The

45
Bose Quiet Comfort 25 and the Sony MDR 7506 did not have the capability of producing
audiologist-quality data when paired with the hEAR application.
Conclusion
hEAR is the first hearing screening application that has been validated at seven of the
most commonly used frequencies, i.e., 125-8000 Hz. While other similar applications exist, they
do not provide a seven-frequency hearing screening test. This suggests that hEAR is a viable
alternative to a pure tone audiometry test when using appropriately validated headphones. While
the study was conducted with a relatively small sample pool, a third of the participants
corresponded to an ‘at-risk’ group such as older adults, or those susceptible to Occupational
Noise Induced Hearing Loss (ONIHL). While that number may not be as large, it does provide
some preliminary evidence that a tablet hearing screening application such as hEAR, may be a
useful screening tool. The application can be administered by anyone, does not require any
specific training for the use of it, and can be used without the presence of an internet connection,
making it especially convenient for those who may have difficulty in accessing audiology
services.
It is important to note that there are limitations to this study. The ambient noise in the
testing environment was not tested with an octave band analyzer, as is required by most
organizations, including OSHA (Appendix D, Occupational Safety and Health Administration).
However, it is not expected that analysis with an octave band analyzer would have produced data
that would have altered the overall interpretation of the data, as the SPL of the overall
background noise was just 24 dBA. While there is no way of accurately knowing if there was
frequency-specific interference, the research team does not expect that octave band analysis

46
would have significantly changed the results of the study. More evaluation is also needed for a
broader test population. However, even with these limitations, the Pioneer HDJ 2000 headphones
paired with the self-administered hEAR mobile application were able to reproduce overall and
frequency-specific results that were not significantly different than that of a certified audiologist
in a controlled testing environment. These results show a promising trajectory for mobile
automated hearing screening options.

47
PAPER 3: A MULTI-METHOD USER-CENTERED ASSESSMENT OF
HEAR
Introduction
Hearing ability is important in children as it is primarily required for speech and language
acquisition. Undetected hearing loss in children therefore, adversely affects speech and language
skills (Ruben, 2000). Early detection and intervention for hearing loss/hearing-related illnesses
prior to six months of age results in significantly better outcomes in life when compared to
interventions applied after six months of age. As a result, newborn hearing screening has become
universal in hospitals across the United States. According to the Centers for Disease Control
(CDC), five out of every thousand children may be impacted by hearing-related illness between
three to seventeen years of age. However, hearing loss also significantly impacts older children,
who may acquire hearing loss later on in life. Unidentified hearing loss has a substantial effect
on a child’s speech development, language acquisition, educational attainment, and overall
socioemotional development (WHO, 2018). Infant hearing screening is now a mandated test for
newborns and has helped identify any hearing impairments in babies. However, it is not so in
developing countries, where there are no mandated hearing screening requirements for infants.
As a result, there are limited prospects of early detection for hearing loss even though more than
80% of persons with hearing loss/hearing-related disorders reside in developing countries
(WHO, 2017). Therefore, at the time of school entry, almost 20% of moderate or greater hearing
impairments remain unidentified (Bamford et. al. 2007). Screening at the time of school entry,
48
when available, is the first point of access in most countries, developing or developed
(Theunissen & Swanepoel, 2008).
Need for Hearing Screening
Language acquisition, literacy advancement, and developmental outcomes that are
congruent to the age of the child, require early and ongoing attention, so that any effects of
hearing-related disorders can be prevented/mitigated in time. This requires the disorders to be
identified, first and foremost. Currently, in addition to neonatal hearing screening, parent
questionnaires are also used to identify hearing loss based on the child’s everyday behavior.
However, research has shown that reliably identifying hearing loss via parental questionnaires is
faulty (Olusanya, 2001; Gomes & Lichtig, 2005). Evidence suggests that many elementary
school aged children who may suffer from ‘educationally significant’ hearing loss would have
passed their neonatal hearing screens (Fortnum et. al., 2001). The American Academy of
Pediatrics recommends hearing screening throughout infancy, early childhood, middle
childhood, and adolescence (AAP, 2007). All newborns are screened at birth, with routine
screenings and checkups at ages 4, 5, 6, 8 and 10 (AAP, 2007). These routine checkups help in
identifying any anomalies in hearing, and therefore provide access to quality healthcare, and
quality preventative care to children; however, it is estimated that children only seldom get all
the well-child visits as recommended by the AAP (Selden, 2006). Moreover, even when these
visits are provided, pediatricians may not recheck children’s hearing, or only refer less than half
of the children who fail their hearing screening (Halloran et. al., 2006).
According to Grote (2000), neonatal hearing screening programs would not be able to
detect 10 to 20% of cases that may result in permanent hearing loss later on in life. This suggests
that the prevalence rates of hearing loss in the school going population may be higher relative to

49
the prevalence rates of hearing loss as identified in the neonatal/newborn period. The Centers for
Disease Control and Prevention (CDC) has conducted the National Health and Nutrition
Examination Survey (NHANES) since 1970 and provides statistical data on the incidence,
distribution, and effects of illness and disability in the United States, and each of these surveys
report pure tone average conduction results for 500, 1000, 2000, 4000 Hz of more than 5000
children (CDC, 2005). According to NHANES 2005-2006, the prevalence of hearing-related
disorders in school aged children increased to almost 17% in the 6-19 years age group
(Henderson, Testa, & Hartnick, 2010). It is likely that these numbers are on the conservative
side, since many respondents may choose to not answer some questions.
Conventionally, pure-tone audiometry administered by an audiologist in a sound-proof
booth is considered the gold standard for the majority of the population. In accordance with
several federal mandates, individual school districts are also responsible for mass hearing
screenings of all elementary school-aged children which is at times extended up to students in
the 7th grade as well. In addition, all transfer students are also eligible for mass screening, and so
are students who are to be evaluated for any special education programs. According to the Texas
Department of Health and Human Services (Health and Safety Code, Chapter 36), school
screenings are conducted at three fixed frequencies, namely, 1000, 2000, and 4000 Hz, at a set
threshold level of 25 dBs. Pure tones are played at the above-mentioned frequencies in each ear,
and to indicate that the tones were heard, the student is asked to raise the hand corresponding to
the ear side. If the student does not raise his/her hand, it is inferred that they did not hear that
tone, and that particular frequency is marked as a fail. That student is either retested, or referred
to an audiologist for further testing. This pass/fail based mass screening is relatively fast, and is
widely used in the United States. However, research suggests there may be a need to identify

50
accurate hearing thresholds at each relevant frequency, in addition to a generalized pass/fail
based screening, and the method to screen to should be fast (Sliwa, Hatzopoulos, Kochanek,
Pilka, Senderski, & Skarzynski, 2011).
The use of mHealth and telehealth-based interventions in audiology is continuing to
increase. mHealth applications in audiology are generally used to screen for hearing loss, though
some applications are also being developed for diagnosis. Research on mHealth applications
suggests that the individual applications can accurately estimate hearing thresholds, and
therefore, can be used to screen for hearing loss. However, while those results have been more or
less consistent in the general population, the results of such applications, namely, Shoebox
audiometry, and Uhear, have been somewhat variable in a pediatric population (Bright &
Pallawela, 2016). mHealth interventions could be more accessible to those who live in
underserved areas, and could be used as valid alternatives to the present screening methods,
including mass screening. This presents the need for a validated mHealth intervention that
performs consistently in all populations, including pediatric populations. hEAR is a validated
mobile hearing application, and if the results can be replicated in a pediatric population, it would
be a likely intervention to fulfill this purported need.
Need for a usability test for hEAR
The demand for mHealth applications for disease management, disease diagnosis, and
data collection increase almost daily. However, research suggests the need for improved usability
to allow users to confidently interact with such applications (Arsand et. al., 2010). Many current
mHealth interventions are designed similar to their healthcare system counterparts, and may not
be as effective as those that involve end-users in the design process (McCurdie, Taneva,
Casselman, et. al., 2012). Such applications need to be developed with equivalent consideration
51
to the users’ needs, so that the applications are easy to use, and are perceived useful (Brown,
Yen, Rojas, et. al., 2013). If the usability of mHealth applications is not tested, then it is possible
that the applications may not be able to fully perform their intended function, and may ultimately
fail to accomplish their objectives, or yield unintended outcomes (Nilsen, Kumar, Shar, et.al.,
2012). Methodical improvements in mHealth applications’ usability could result in more specific
redesign efforts that are based upon user-centered data, and for users, improved designs could
result in improved performance. Relatively few studies exist on mHealth usability (El-Gayar et.
al., 2013), and no study exists on the usability of an audiology based mHealth application.
Therefore, it is also imperative to assess the usability of the hEAR mobile application to identify
any issues with the interface, that may act as a hindrance for the users.
Research Questions for the formative usability assessment
1. Evaluate the sensitivity of hEAR in a pediatric population.
2. Identify and evaluate deficiencies in the user interface for hEAR.
3. Recommend changes to user interface for future iterations of hEAR.
Methods
System being tested
The most current version of the hEAR mobile hearing screening application on the
dedicated Samsung Galaxy Tab 3 along with the preferred headphones, Pioneer HDJ 2000 were
used. These headphones were observed to achieve results that were the most statistically similar
to those administered by an audiologist (Pickens et. al., 2018). The application required users to
login as administrators via a dedicated username and password which was connected to an email
address. After logging in as administrators, the users could add patients to a ‘subject list’ by
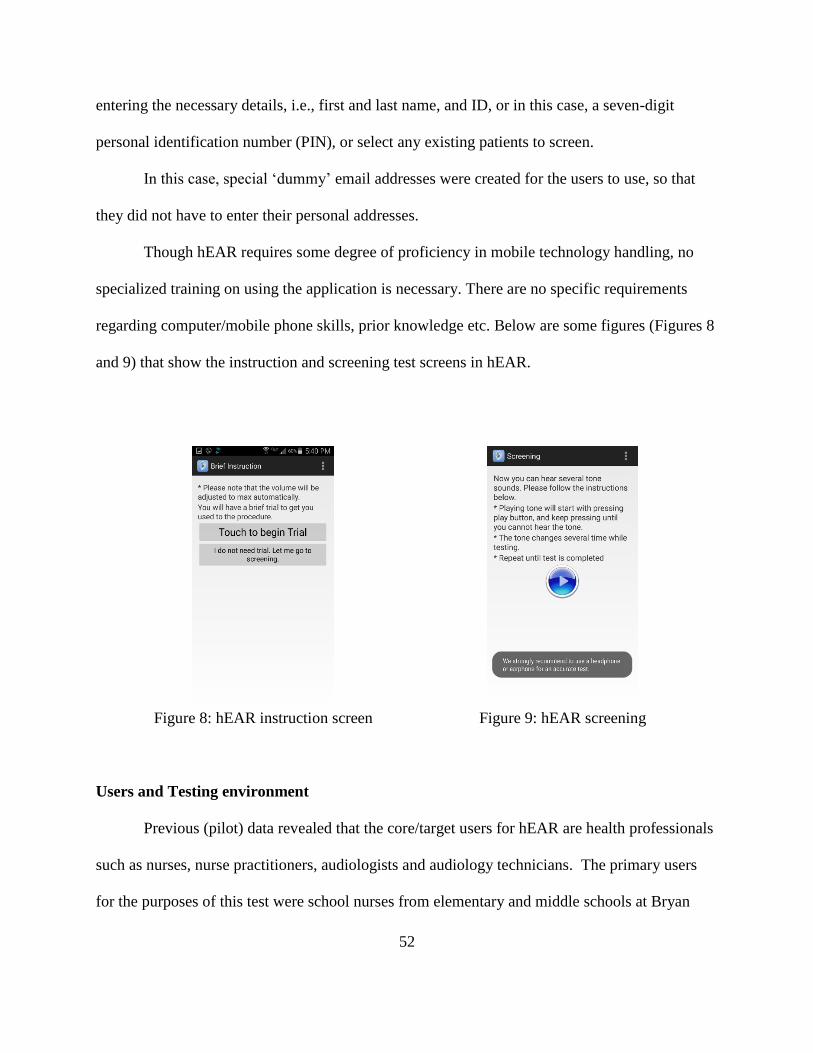
52
entering the necessary details, i.e., first and last name, and ID, or in this case, a seven-digit
personal identification number (PIN), or select any existing patients to screen.
In this case, special ‘dummy’ email addresses were created for the users to use, so that
they did not have to enter their personal addresses.
Though hEAR requires some degree of proficiency in mobile technology handling, no
specialized training on using the application is necessary. There are no specific requirements
regarding computer/mobile phone skills, prior knowledge etc. Below are some figures (Figures 8
and 9) that show the instruction and screening test screens in hEAR.
Figure 8: hEAR instruction screen Figure 9: hEAR screening
Users and Testing environment
Previous (pilot) data revealed that the core/target users for hEAR are health professionals
such as nurses, nurse practitioners, audiologists and audiology technicians. The primary users
for the purposes of this test were school nurses from elementary and middle schools at Bryan
53
Independent School District who in turn tested their ‘patient population’ which comprised of
Bryan ISD students. While consent forms were obtained from the end-users (nurses), permission
forms had to have been signed by the students' parents, to consent to act as the patients for the
purposes of this test. All people handling the data, i.e., the experimenter, school nurses and the
Principal Investigator were HIPPA certified to handle patient data. Also, the use of the
application did not cause any harm to the patients. Before data collection could begin, permission
to do so was requested from the Texas A&M University Institutional Review Board (IRB). After
the Texas A&M University IRB approval, formal permission to conduct the assessment was
granted to the research team by the Office of Accountability, Research, Evaluation, and
Assessment on behalf of the Bryan Independent School District.
While initial projections indicated that 10 school nurses, 7 from elementary schools, and
3 from middle schools, from the Bryan Independent School District would be recruited for this
assessment, due to several issues beyond the control of all parties, only 6 nurses were able to
participate. However, the participating nurses tested five participants (students) each, thereby
resulting in the recruitment of 30 students. All nurses were female, between 29-62 years of age,
and had experience using their own smart devices. The assessments were conducted at the users’
respective schools.
Timing parameters: Timing was automatically logged by hEAR in the data log file. For
redundancy, timing was also logged by a timer on a smartphone (Samsung Galaxy S8). After
each test, the hEAR screen would revert to the application home screen. The user/participant was
given the tasks in writing and after the user indicated that he/she was ready to begin, the login
screen was presented and timing was logged, timing was stopped when the user indicated
explicitly that he/she were ‘finished/done’.
54
Support materials: Consent forms for the users, as well as separate permission consent forms for
patients (students) that were to be signed by their parent/legal guardian, System Usability Scale,
After Scenario Questionnaire, debrief forms, written task instructions, were used. In addition,
pens, pencils, notepads, clipboards, cellphone (for logging time) were also be used.
Usability assessment protocol
A formative usability assessment was conducted to assess the usability of hEAR, so as to
identify and evaluate any, or most of the problems or difficulties that end users would have
encountered during their use of the application to collect hearing data. It is anticipated that this
assessment can be further used to establish usability benchmarks for hEAR to ensure that future
versions of the application are more ‘user friendly’ for similar user populations of health
professionals, such as nurses, audiologists, and audiology technicians.
Evaluation Tools:
The ISO 9241-11 is a set of standards specifically meant for human-system interaction and
explains how to identify the information that is to be assessed to evaluate usability. The metrics
of effectiveness, efficiency and satisfaction as defined by ISO 9241-11 were chosen for to
evaluate the hEAR application. Effectiveness refers to whether a user was able to successfully
complete the task and was measured by the error rate/number of mistakes made (failure to follow
task guidelines), efficiency was defined by the overall time it took a user to complete the task,
satisfaction was measured by the After-Scenario Questionnaire and the System Usability Scale.
Also, the number of errors committed by the users was measured. Furthermore, the evaluation
tools could be categorized into two main categories, based on when and where they were
administered, namely:

55
• On-site assessment tools: These were tools that were administered at the study sites. Two
of these tools were post-task assessment tools that were administered immediately after
the nurses were done interacting with the system (Kortum, 2016) such as the System
Usability Scale (SUS), and the After-Scenario Questionnaire (ASQ). The think-aloud
protocol was used during the tasks. The number of errors (failure to follow task list) the
nurses made was calculated as a measure of effectiveness (Sauro & Lewis, 2012).
Moreover, time taken to complete the tasks, was also calculated, as a measure of
efficiency (Sauro & Lewis, 2012). In addition to these measures, the nurses also
participated in an in-depth open-ended interview (Shah & Robinson, 2007) after the
screenings, wherein they talked about their experience with hEAR. All comments made
during the think-aloud protocol, and the interviews were recorded via written notes.
o Error rate: Errors are any unintended action, slip, mistake, or omission a user
makes while attempting a task. The maximum possible number of errors that
could be committed by the users implies that the user committed an error in each
step. An error rate which is the number of errors committed divided by the
maximum possible number of errors committed, is the most commonly used
metric to signify effectiveness, apart from success rate (Nielson, 2001; Reason,
1990). Every time that a nurse deviated from the task list was recorded as an
error. All errors were documented on-site via written notes, and corroborated
through the nurse’s use of think-aloud protocol, and their comments during their
interviews.
o Task completion time: This was the total time used to complete the tasks
successfully. Timing was automatically logged via the hEAR application,
56
however, for redundancy, timing was also logged using a stopwatch application
on the Samsung Galaxy S8 phone. There were two timing measurements, namely,
time taken to complete data entry, and time taken to complete screening
(aggregate and per patient). An upper limit of 30 minutes was set for the first
timing measurement, i.e., for the time taken for data entry, and an upper limit of 2
hours was set for screening all five patients.
o Think-Aloud Protocol/Method: The think-aloud protocol is a commonly used
usability assessment tool, used to determine users’ thoughts and opinions while
they perform a list of tasks within a system. It requires the users to ‘think aloud’
during their interactions with the system, to express their reactions, and thinking,
and to explain what they are doing as they perform specific tasks on the system
(Kushniruk & Patel, 2004). There is minimal interference from the
observer/experimenter except to remind the users to keep talking, to assure that
their thought processes are not interrupted. The nurses were advised to ‘think-
aloud’ their thoughts, concerns, and comments, while they were using the hEAR
application to perform the tasks.
o System Usability Scale: The System Usability Scale (SUS) was developed in 1986
as part of the usability engineering program in integrated office systems
development at Digital Equipment Co Ltd., United Kingdom, and is a ten-item
scale which allows easy usability assessment. The components of SUS were
developed according to the three criteria of usability as defined by the ISO 9241-
11, i.e., 1). the ability of users to complete tasks using the system, and the quality
of output of those tasks or effectiveness, 2). The level of resources consumed

57
while performing the task or efficiency, 3). The user’s subjective reactions of
using the system or satisfaction. The SUS is a robust, reliable, and valuable
evaluation tool, and has been utilized by various research projects and industrial
evaluations. The SUS is a unidimensional assessment and utilizes a Likert scale of
a 5-point scale. It is used after the user has had an opportunity to do a task on the
system being evaluated. It helps record users’ immediate responses to each item,
before they’ve had a moment to think about them. It yields a single number which
represents a composite measure of the overall usability of the system. To calculate
the SUS scores, the score contributions from each item have to be summed. Each
item’s score contribution ranges from 0 to 4. For the odd numbered items (1, 3, 5,
7, and 9) the score contribution is the scale position minus 1. For the even
numbered items (2,4,6,8, and 10) the contribution is 5 minus the scale position.
The sum of scores is then multiplied by 2.5 to obtain the overall SUS score which
ranges from 0 to 100. This questionnaire was collected immediately after the
nurses had screened their patients.
o After Scenario Questionnaire: The After-Scenario Questionnaire (ASQ)
developed by Lewis (1991) is a set of three rating scales which is used after the
user completes a set of related tasks or scenario. These scales or sentences are
concerned with the ease of task completion, the amount of time taken to complete
the tasks, and the information given regarding the tasks. These statements are
accompanied by a seven-point rating scale each, ranging from ‘strongly disagree’
to ‘strongly agree’. The statements presented in the ASQ touch upon the three
fundamental areas of usability namely: effectiveness (statement 1), efficiency
58
(statement 2), and satisfaction (statement 3). This questionnaire was also collected
immediately after the nurses had screened their patients.
o Kids’ After Use Questionnaire: A modified ASQ was administered to the students
who had participated as patients in the assessment. The ASQ had been modified
based on the work done by Laurie-Rose, Frey, Ennis, & Zamary (2014), wherein
they modified the NASA-TLX to measure workload in children. For the purposes
of this study, the ASQ was modified to have four questions, three of which were
accompanied by a five point ‘emoji’ scale which portrayed human expressions
akin to very angry, angry, indifferent, smiling, and very happy. This emoji scale
was used instead of the standard five or seven-point Likert scale. The fourth
‘question’ was regarding any comments that the students had regarding the app or
the screening itself.
o In-depth interview: Nurses participated in a post-screening/post-interaction
interview, which included open-ended questions about hEAR. Nurses described
what they found difficult or easy about the system, what they liked/did not like
about the system, what they would like to change about the system, and so on.
This was performed after all patients had been screened, and the SUS, and ASQ
had been filled out.
• Off-site post task assessment tools: These were used to determine the
difficulties/problems that the nurses encountered while using hEAR, and the usability
concepts that the nurses’ problems/difficulties fell under, and was based on their
interviews and the ‘think-aloud protocol’ that the nurses used while performing the tasks.

59
These were namely, the Problem Matrix, the Usability Problem Taxonomy model (UPT),
and the User Action Framework model (UAF).
o Problem Matrix: A problem matrix or user by problem matrix, categorizes all
problems experienced by users. The matrix provides information about the
frequency per problem, frequency by user, the problem(s) that affected only one
user, the average problem frequency, and the percent of problems likely
discovered (Sauro & Lewis, 2012). The problem matrix was created from the
problems discovered through the interviews, and the ‘think-aloud’ protocol that
the nurses used while performing their tasks.
o Usability Problem Taxonomy model (UPT): This was developed by Keenan et. al.
(1999) and shown below in Figure 10, and the method contains an ‘artifact
component’ and a ‘task component’, wherein the former refers to the system and
the latter refers to the tasks. The artifact component is subdivided into three
categories namely, visualness, language, manipulation, each of which are further
subdivided. These categories focus on difficulties observed when the user
interacts with individual user interface objects, and help classify the way the user
examines interface objects, reads/understands words, and manipulates the
interface. Conversely, the task component refers to the way a user task is
structured on the system, and the system’s ability to help the user follow the task
structure and return to the task. The problems observed are then classified, which
results in one of three outcomes, namely, full classification wherein the problem
has been classified to the rightmost subcategory (smallest subcategory), partial
classification wherein the problem is classified within a primary category or a
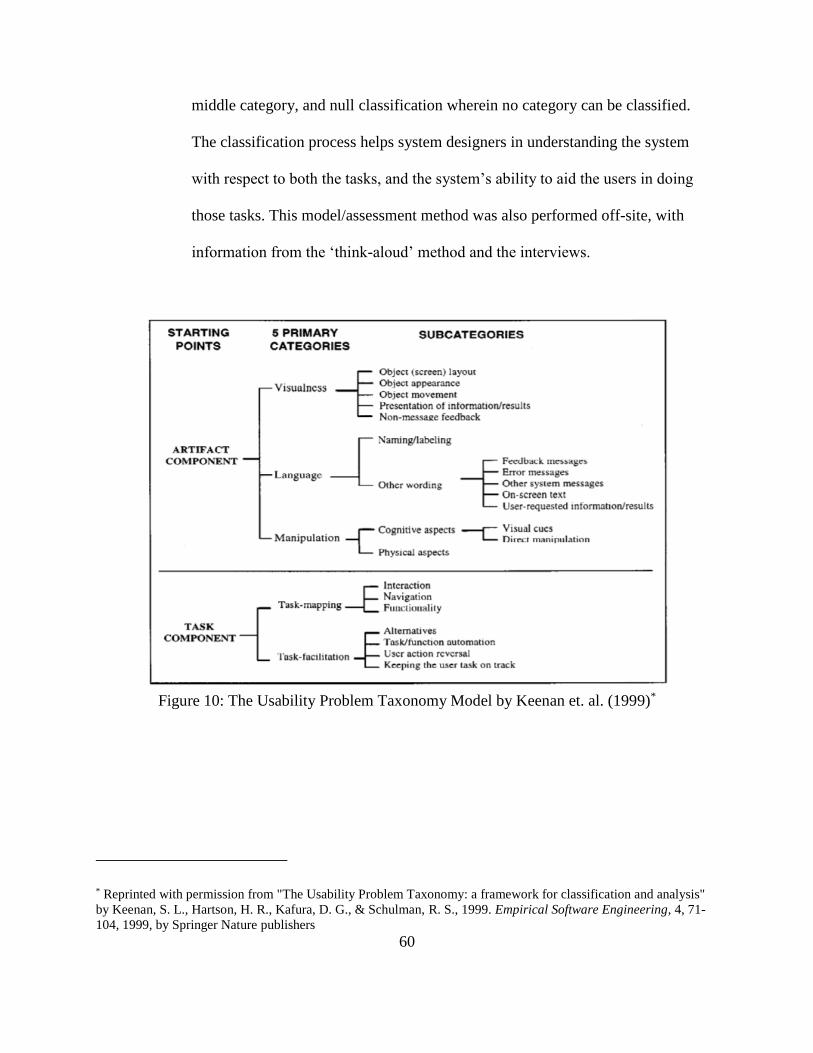
60
middle category, and null classification wherein no category can be classified.
The classification process helps system designers in understanding the system
with respect to both the tasks, and the system’s ability to aid the users in doing
those tasks. This model/assessment method was also performed off-site, with
information from the ‘think-aloud’ method and the interviews.
Figure 10: The Usability Problem Taxonomy Model by Keenan et. al. (1999)*
* Reprinted with permission from "The Usability Problem Taxonomy: a framework for classification and analysis"
by Keenan, S. L., Hartson, H. R., Kafura, D. G., & Schulman, R. S., 1999. Empirical Software Engineering, 4, 71-
104, 1999, by Springer Nature publishers

61
o User Action Framework model (UAF): The UAF model developed by André et.
al. (2001) is based on Norman’s (1986) theory of action model, and built upon the
work done by Keenan et. al. (1999) with the UPT model, shown below as Figure
11. The UAF describes user activities and experiences and how the user interacts
with the system in question. It introduces the term ‘Interaction Cycle’ which has
five levels, that are mapped to Norman’s theory terms. This cycle helps the
designers of the system understand the effects of the interactions between the
system and the users. This model/assessment method was also performed off-site,
with information from the ‘think-aloud’ method and the interviews.
Figure 11: a) Interaction cycle parts b) user action framework (from André et. al., (2001))*
* Reprinted with permission from "The user action framework: a reliable foundation for usability engineering
support tools" by Andre, T. S., Hartson, H. R., Belz, S. M., & McCreary, F. A., 2001. International Journal of
Human-Computer Studies, 54(1), 107-136, 2001, by Elsevier publishers

62
Task Description
For the test, a broad range of tasks intended to exercise and evaluate hEAR to the greatest
possible degree was provided. A maximum time of 30 minutes was allotted to each user (nurse)
test. The task list is shown in Table 9 below.
Table 9: Task description for the nurses 1. Click on the hEAR application icon
2. Make an administrator account
3. On the next screen, click on ‘screener’ tab
4. Enter UserID and password
5. Sign in
6. Click on ‘manage screener’ tab
7. Click on ‘Add new screener’
8. Enter 7-digit ID under first & last name and user ID
9. Click on ‘register’
10. Click ‘Back’ button on device twice to revert to main app screen
11. Click on ‘Subject’ tab
12. Select the newly entered user ID
13. Present device to patient and explain the ‘brief instructions’
Procedure
Six (6) nurses from Bryan ISD schools, namely, Houston Elementary, Johnson
Elementary, Kemp Elementary, Branch Elementary, Rayburn Intermediate, and Navarro
Elementary, participated in testing hEAR to conduct hearing screenings on students.
Conventionally, they use the GSI 17 audiometer to conduct these screenings annually for all
elementary school children, and up to seventh grade. According to chapter 36 of Texas’s Health
and Safety Code, screening of all children enrolled in any private, public, parochial, or
denominational school, or in Department of Family and Protective Services (DFPS) licensed
child care center, and/or licensed child care center in Texas, or those who meet certain grade
criteria is required to detect any possible hearing problems. Hearing screenings are conducted for

63
both ears with pure-tone audiometric sweep audiometry using the gold standard, GSI-17
audiometer, at sound pressure level less than/equal to 25 dB, at 1000, 2000 and 4000 HZ. When
tones are played, the student raises their hand corresponding to the ear side the tone was
presented in, i.e., if the tone was presented in the left ear, the student would raise their left hand
and vice versa.
One participant (nurse) was scheduled per day so as to be conducive to their and the
students’ schedules, and they screened 5 patients (school students) each. After the experimenter
arrived at the test site, informed consents were signed by the users, and signed permission forms
were collected, and returned to the experimenter. The users were then given the instructions on
how the test would proceed. The users were given a printed/written list of instructions to perform
the tasks, detailing what the users would be doing. Users were told that no assistance would be
provided to them, and if they were unable to complete the task, they would have to let the
experimenter know that by saying, “I can’t do this task” or “I can’t complete this task”. Once the
users acknowledged that they understood these instructions, the assessment began. The users
were instructed to follow the ‘think-aloud protocol’ until tasks were completed, and they were
observed by the experimenter throughout the duration of the assessment, and all comments made
by the nurses and patients were documented via written notes. After the test, the users completed
the two usability surveys/questionnaires: System Usability Scale, and the After-Scenario
Questionnaire. Their patients also filled out a modified After Scenario Questionnaire after the
hearing screening was done. After the patients left the nurse’s office, the nurses were interviewed
about their experiences with hEAR, and all comments were documented via written notes. All of
the above-mentioned procedures were done on the same visit. However, baseline data regarding
the use (or usability) of the GSI 17 audiometer, was also collected via questionnaires on a second

64
visit. The GSI-17 audiometer itself was not used to screen any patients, as it was used only for
annual screenings, which occurred in February 2018. During the data collection period, one of
the nurses (Nurse 4) had quit her position at the school, so baseline usability data for the GSI 17
audiometer was only obtained from 5 nurses.
Statistical Analyses
The present study only consisted of human factors-based data from six (6) nurses for
hEAR, and that number decreased to five (5) for the GSI 17 audiometer, due to Nurse 4 dropping
out (Nurse 4 had quit her place of employment at the start of the summer vacations, around the
fourth week of May 2018). As such, any analyses apart from descriptive statistics, did not appear
to be in good faith, nor of much use as those analyses would have no statistical power due to the
small sample size. Sensitivity at individual frequencies was calculated for hEAR using SAS®
statistical software, version 9.4, as this is a standard evaluation technique for mHealth
applications. Descriptive statistics for the aforementioned metrics (Total time, Error Rate, ASQ,
SUS) were calculated. In addition, a problem matrix was formulated based on the comments of
the nurses regarding hEAR. The descriptive statistics are as follows.
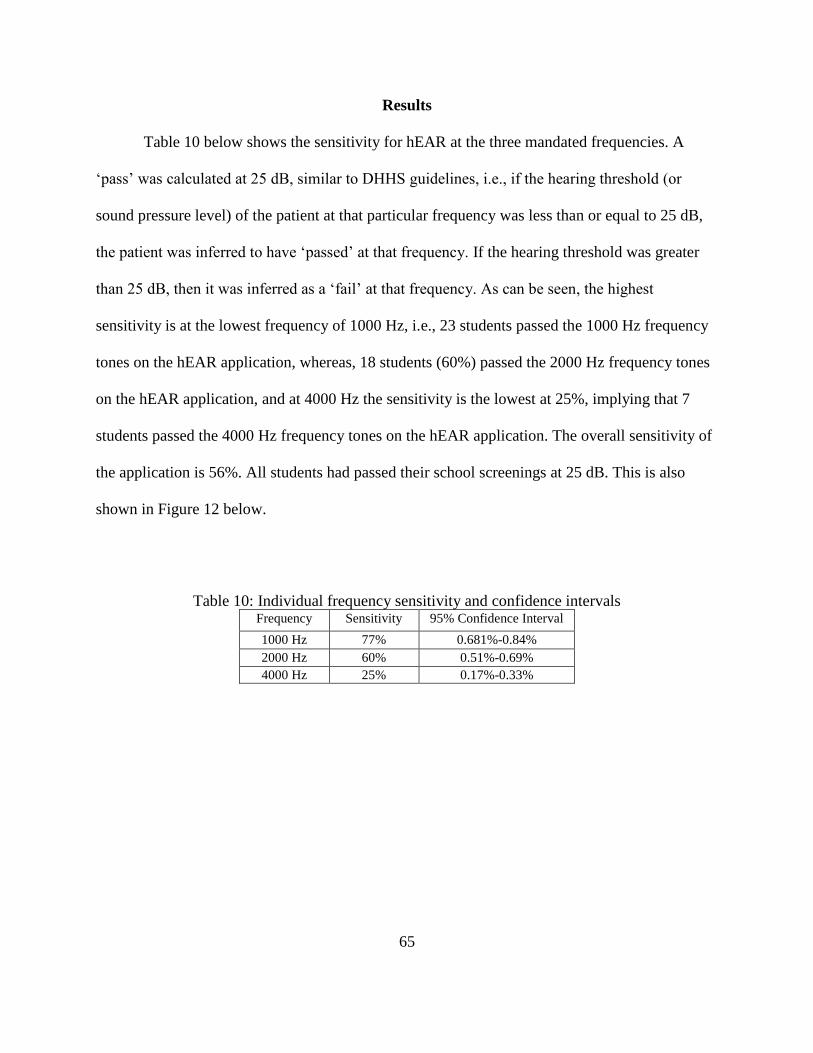
65
Results
Table 10 below shows the sensitivity for hEAR at the three mandated frequencies. A
‘pass’ was calculated at 25 dB, similar to DHHS guidelines, i.e., if the hearing threshold (or
sound pressure level) of the patient at that particular frequency was less than or equal to 25 dB,
the patient was inferred to have ‘passed’ at that frequency. If the hearing threshold was greater
than 25 dB, then it was inferred as a ‘fail’ at that frequency. As can be seen, the highest
sensitivity is at the lowest frequency of 1000 Hz, i.e., 23 students passed the 1000 Hz frequency
tones on the hEAR application, whereas, 18 students (60%) passed the 2000 Hz frequency tones
on the hEAR application, and at 4000 Hz the sensitivity is the lowest at 25%, implying that 7
students passed the 4000 Hz frequency tones on the hEAR application. The overall sensitivity of
the application is 56%. All students had passed their school screenings at 25 dB. This is also
shown in Figure 12 below.
Table 10: Individual frequency sensitivity and confidence intervals Frequency Sensitivity 95% Confidence Interval
1000 Hz 77% 0.681%-0.84%
2000 Hz 60% 0.51%-0.69%
4000 Hz 25% 0.17%-0.33%

66
Figure 12: Graphical representation of application and audiometry sensitivity results
The error rates are presented in Table 11 below. As can be seen, Nurse 1 has the most
errors out of all, while nurse 5 had the least. The average number of errors was 5 for Nurses 2-6.
Almost all nurses preferred to enter the details of all of their ‘patients’ at one go, instead of
entering the details of one patient, testing that patient, logging out, and logging back in to enter
the details of another patient and so on, as mentioned in the task list. That itself was classified as
an error.
Table 11: Nurse error rates Nurse Errors Committed Error Rate
1 12 0.15
2 5 0.063
3 6 0.075
4 5 0.063
5 4 0.05
6 5 0.063
Total possible number errors that can be committed = 80
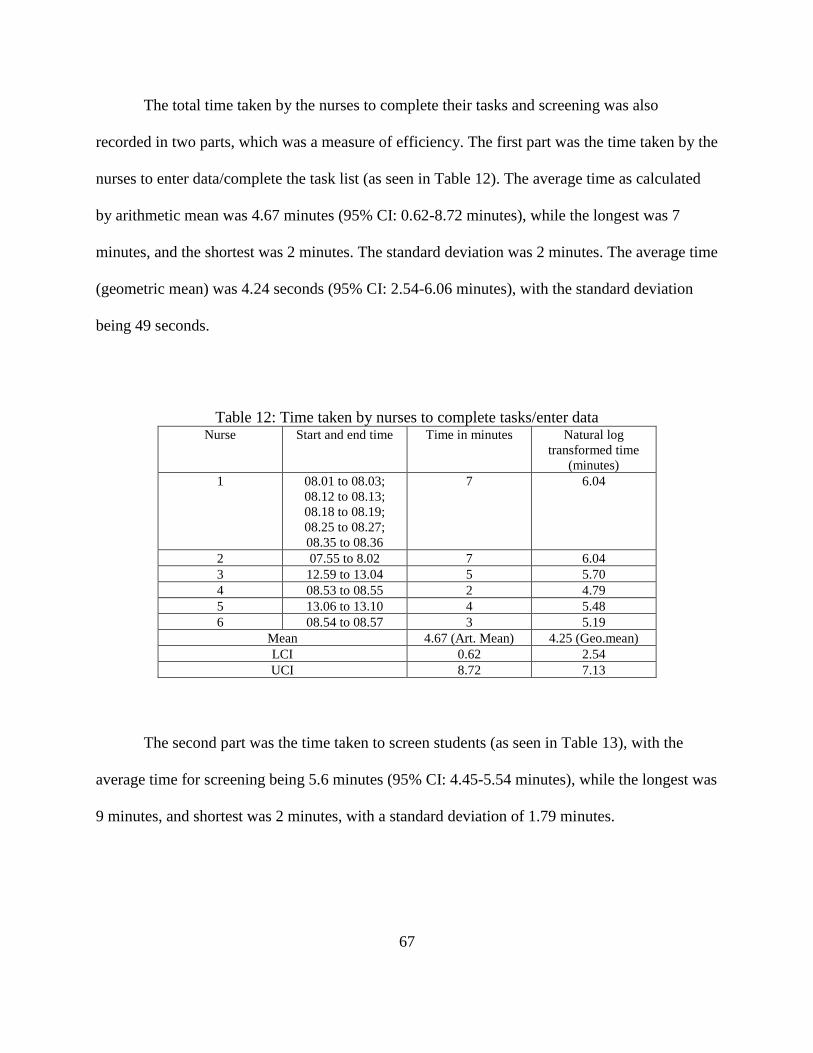
67
The total time taken by the nurses to complete their tasks and screening was also
recorded in two parts, which was a measure of efficiency. The first part was the time taken by the
nurses to enter data/complete the task list (as seen in Table 12). The average time as calculated
by arithmetic mean was 4.67 minutes (95% CI: 0.62-8.72 minutes), while the longest was 7
minutes, and the shortest was 2 minutes. The standard deviation was 2 minutes. The average time
(geometric mean) was 4.24 seconds (95% CI: 2.54-6.06 minutes), with the standard deviation
being 49 seconds.
Table 12: Time taken by nurses to complete tasks/enter data Nurse Start and end time Time in minutes Natural log
transformed time
(minutes)
1 08.01 to 08.03;
08.12 to 08.13;
08.18 to 08.19;
08.25 to 08.27;
08.35 to 08.36
7 6.04
2 07.55 to 8.02 7 6.04
3 12.59 to 13.04 5 5.70
4 08.53 to 08.55 2 4.79
5 13.06 to 13.10 4 5.48
6 08.54 to 08.57 3 5.19
Mean 4.67 (Art. Mean) 4.25 (Geo.mean)
LCI 0.62 2.54
UCI 8.72 7.13
The second part was the time taken to screen students (as seen in Table 13), with the
average time for screening being 5.6 minutes (95% CI: 4.45-5.54 minutes), while the longest was
9 minutes, and shortest was 2 minutes, with a standard deviation of 1.79 minutes.

68
Table 13: Time taken to screen patients Nurse Patient Time (in minutes) per
patient
Time (in minutes)
per nurse
Nurse 1 4334864 7
35
Nurse 1 4805471 7
Nurse 1 5215521 5
Nurse 1 6330847 8
Nurse 1 5248927 8
Nurse 2 5494942 9
35
Nurse 2 5248175 9
Nurse 2 8032599 8
Nurse 2 3029104 5
Nurse 2 1794828 4
Nurse 3 7848032 7
28
Nurse 3 109908 5
Nurse 3 4148659 5
Nurse 3 7719498 5
Nurse 3 1652065 6
Nurse 4 3715224 3
20
Nurse 4 790304 4
Nurse 4 1470608 6
Nurse 4 2243930 2
Nurse 4 3157519 5
Nurse 5 9390393 3
25
Nurse 5 1611307 6
Nurse 5 6156476 6
Nurse 5 7406909 3
Nurse 5 1304076 7
Nurse 6 8477952 5
25
Nurse 6 4602950 5
Nurse 6 668457 4
Nurse 6 7680354 5
Nurse 6 3709634 6
Average 5.6 28
Median 5 26.5
Standard Deviation 1.79 6
Standard Error 0.33 2.45
The total time taken per nurse to complete both type of tasks is shown in Table 14 below:
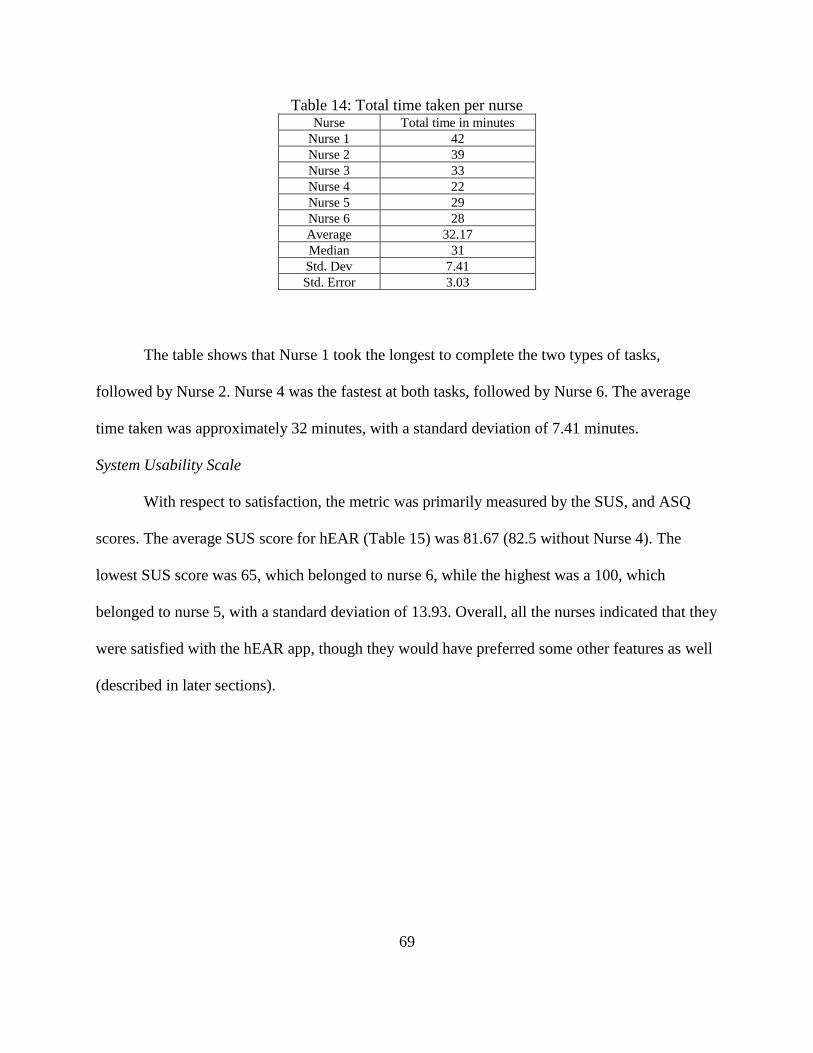
69
Table 14: Total time taken per nurse Nurse Total time in minutes
Nurse 1 42
Nurse 2 39
Nurse 3 33
Nurse 4 22
Nurse 5 29
Nurse 6 28
Average 32.17
Median 31
Std. Dev 7.41
Std. Error 3.03
The table shows that Nurse 1 took the longest to complete the two types of tasks,
followed by Nurse 2. Nurse 4 was the fastest at both tasks, followed by Nurse 6. The average
time taken was approximately 32 minutes, with a standard deviation of 7.41 minutes.
System Usability Scale
With respect to satisfaction, the metric was primarily measured by the SUS, and ASQ
scores. The average SUS score for hEAR (Table 15) was 81.67 (82.5 without Nurse 4). The
lowest SUS score was 65, which belonged to nurse 6, while the highest was a 100, which
belonged to nurse 5, with a standard deviation of 13.93. Overall, all the nurses indicated that they
were satisfied with the hEAR app, though they would have preferred some other features as well
(described in later sections).

70
Table 15: SUS scores for the hEAR application (R=Raw, T=Transformed)
Nurse
Item
1
Item
2
Item
3
Item
4
Item
5
Item
6
Item
7
Item
8
Item
9
Item
10
R T R T R T R T R T R T R T R T R T R T score
1 3 2 1 4 5 4 1 4 4 3 2 3 5 4 1 4 5 4 1 4 90
2 2 1 2 3 5 4 4 1 3 2 2 3 5 4 2 3 4 3 2 3 67.5
3 5 4 1 4 1 0 1 4 5 4 1 4 5 4 1 4 5 4 1 4 90
4 4 3 2 3 3 2 1 3 4 3 3 2 4 3 1 4 5 4 1 4 77.5
5 5 4 1 4 5 4 1 4 5 4 1 4 5 4 1 4 5 4 1 4 100
6 4 3 2 3 4 3 3 2 3 2 3 2 4 3 2 3 4 3 3 2 65
average 81.66666667
median 83.75
std. dev 13.93436998
std.error 5.688682722
For the GSI 17 audiometer, the average SUS score (Table 16) was 80. The lowest SUS
score was 52.5 which belonged to Nurse 2, whereas the highest score was 97.5 which belonged
to Nurse 3, with a standard deviation of 19.20. Nurse 1 had a score of 67.5, while Nurse 5 and 6
had a respective score of 92.5 and 90 each.
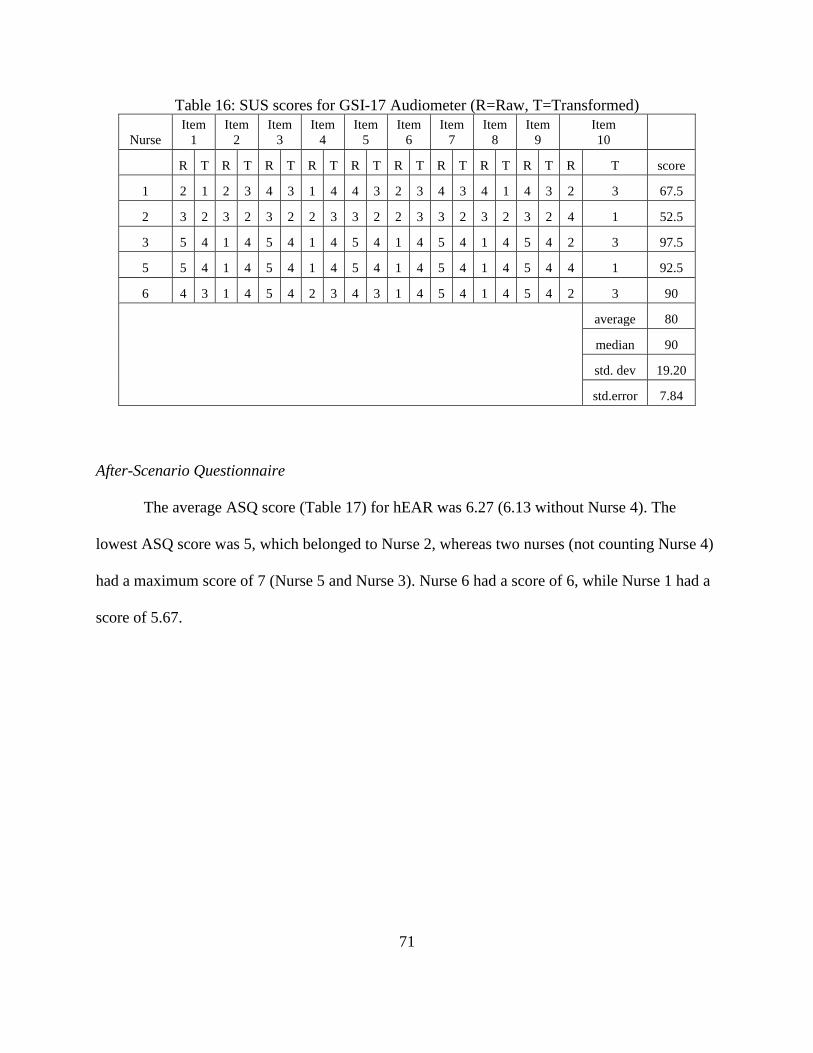
71
Table 16: SUS scores for GSI-17 Audiometer (R=Raw, T=Transformed)
Nurse
Item
1
Item
2
Item
3
Item
4
Item
5
Item
6
Item
7
Item
8
Item
9
Item
10
R T R T R T R T R T R T R T R T R T R T score
1 2 1 2 3 4 3 1 4 4 3 2 3 4 3 4 1 4 3 2 3 67.5
2 3 2 3 2 3 2 2 3 3 2 2 3 3 2 3 2 3 2 4 1 52.5
3 5 4 1 4 5 4 1 4 5 4 1 4 5 4 1 4 5 4 2 3 97.5
5 5 4 1 4 5 4 1 4 5 4 1 4 5 4 1 4 5 4 4 1 92.5
6 4 3 1 4 5 4 2 3 4 3 1 4 5 4 1 4 5 4 2 3 90
average 80
median 90
std. dev 19.20
std.error 7.84
After-Scenario Questionnaire
The average ASQ score (Table 17) for hEAR was 6.27 (6.13 without Nurse 4). The
lowest ASQ score was 5, which belonged to Nurse 2, whereas two nurses (not counting Nurse 4)
had a maximum score of 7 (Nurse 5 and Nurse 3). Nurse 6 had a score of 6, while Nurse 1 had a
score of 5.67.
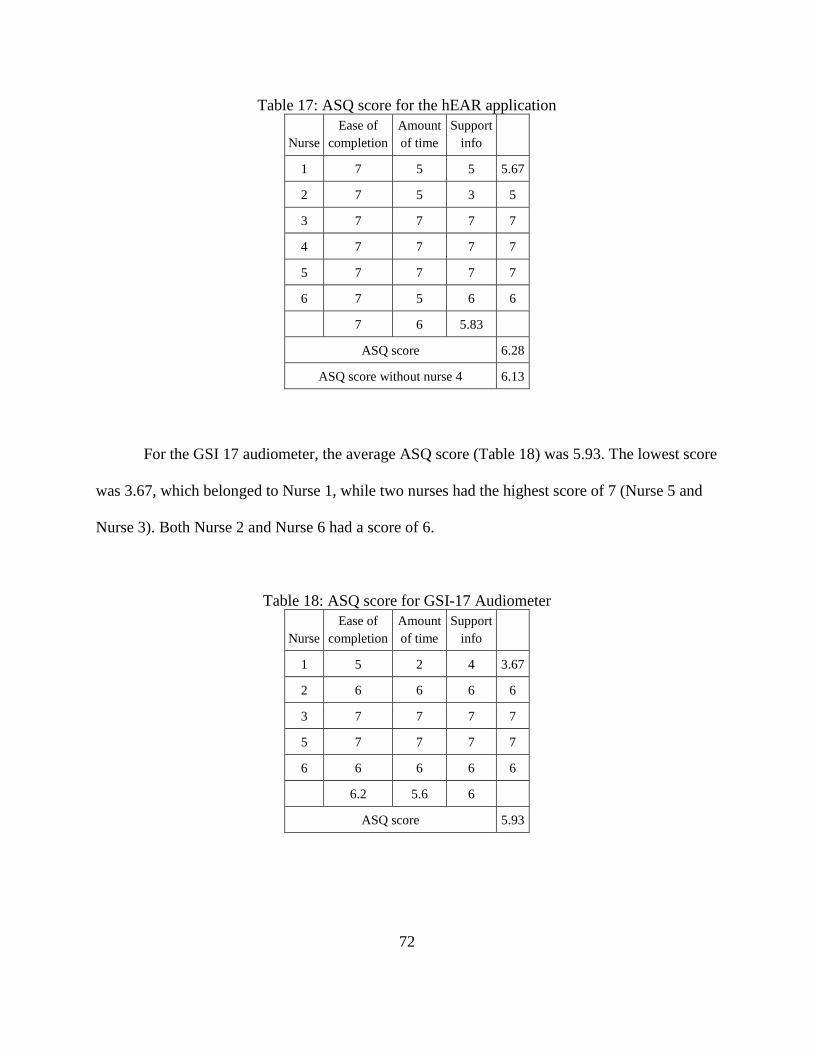
72
Table 17: ASQ score for the hEAR application
Nurse
Ease of
completion
Amount
of time
Support
info
1 7 5 5 5.67
2 7 5 3 5
3 7 7 7 7
4 7 7 7 7
5 7 7 7 7
6 7 5 6 6
7 6 5.83
ASQ score 6.28
ASQ score without nurse 4 6.13
For the GSI 17 audiometer, the average ASQ score (Table 18) was 5.93. The lowest score
was 3.67, which belonged to Nurse 1, while two nurses had the highest score of 7 (Nurse 5 and
Nurse 3). Both Nurse 2 and Nurse 6 had a score of 6.
Table 18: ASQ score for GSI-17 Audiometer
Nurse
Ease of
completion
Amount
of time
Support
info
1 5 2 4 3.67
2 6 6 6 6
3 7 7 7 7
5 7 7 7 7
6 6 6 6 6
6.2 5.6 6
ASQ score 5.93

73
As mentioned earlier, a modified ASQ was used for the students. The average score for
the modified ASQ was 4.08 out of a possible maximum of 5. The highest modified ASQ was 5,
while the lowest was 3.
These results are also summarized in Table 19 below.
Table 19: Summary results for hEAR application, and the GSI-17 audiometer hEAR application GSI Audiometer
SUS
• Two nurses had ‘excellent’ SUS scores of 90,
90, and one a best imaginable score of 100
• Three nurses (3, 5, 6) had excellent scores for
the audiometer of 97.5, 92.5, and 90; none had
a score of 100
• Two nurses had high-marginal SUS scores of
65, 67.5, and one had an ‘acceptable’ score of
77 each.
• Two nurses (1, 2) had a high-marginal SUS
score, and a ‘low’ score for the audiometer of
67.5, and 52.5 respectively.
Converging SUS results for hEAR and the audiometer: at least 2 nurses for both the systems had
excellent scores. There were 3 nurses who gave the audiometer (the control system) excellent scores. At
least one nurse gave both systems a high marginal score.
Diverging SUS results for hEAR and the audiometer: One nurse gave hEAR a best imaginable score
(100), while no nurse gave such a score to the audiometer. One nurse gave the audiometer a low score
(52.5), while no nurse gave such a score to the hEAR app.
ASQ
• Three nurses scored the app a 7, and all nurses
scored the app a 7 on the ‘ease of completion’
field.
• Two nurses had the highest score of 7. And
two nurses had a score of 6.
Converging ASQ results for hEAR and the audiometer: At least two nurses scored both the app and the
audiometer a 7 overall. One nurse scored both systems a 6 in the ‘support info’ category.
Diverging ASQ results for hEAR and the audiometer: The lowest score for the app is 5.67, while that for
the audiometer is 3.67. The lowest score for an individual category is 3 for the ‘support info’ category
for the app, while it is 2 for the ‘amount of time’ category for the audiometer.
Error rate
Highest error rate was 0.12, lowest was 0.05 No data on error rate present
Total time
Time to screen
Average time to screen one patient was 6 minutes,
while the longest time was 9 minutes, and the shortest
time was 2 minutes
Average time to screen one patient was 2 minutes
(reported by nurse; experimenter was not present at
annual screen for verification of time to screen)
Time for ‘data entry’
Average time was 5 minutes (approx.), longest time
was 7 minutes, shortest time was 2 minutes
No data present for the same task. Nurses complained
of ‘long’ data entry hours.

74
Nurse comments
Converging experiences from the interviews: All the nurses wanted the test to be shorter.
The nurses were used to the three-frequency test (1KHz, 2KHz, and 4KHz) that was
administered via the GSI-17 audiometer. It is highly probable that this is why they thought of the
full seven frequency test as administered by the hEAR app, as ‘too long’. Almost all the nurses
wanted a ‘pass/fail’ notification after the screening of a student, so that they could plan their next
course of action immediately, whether it be retesting or a referral to preventative care physician.
Four out of the six nurses would have liked a ‘gamified’ version of the application, especially for
the younger students, and students with special needs. Three of the six nurses wanted the
application to be linked/be linkable to the database used throughout the school(s), to make it
easier to enter/get patient details, without manually entering them, and for referral purposes.
Diverging experiences from the interviews: The nurses had different opinions on the
length of the test. Two nurses thought that the length of the test would deter them from using the
application in the near future, because it would be very difficult to ‘quickly’ test five hundred
students per schools for 6 schools. Two nurses thought that even though the test was longer than
what they and their students were used to, they didn’t think that it would be disadvantageous
since they thought that the longer test would be better for retesting students or for referring them.
One nurse thought that the test length was of no consequence, since the application afforded the
independence of being used simultaneously on multiple devices.
Problem Matrix
The problem matrix (Table 20) based on the nurses’ interviews, think-aloud protocols,
and observation of nurses performing the tasks, unmasked eight different problems that one or
more of the nurses encountered while trying to complete their tasks. Out of all problems, two
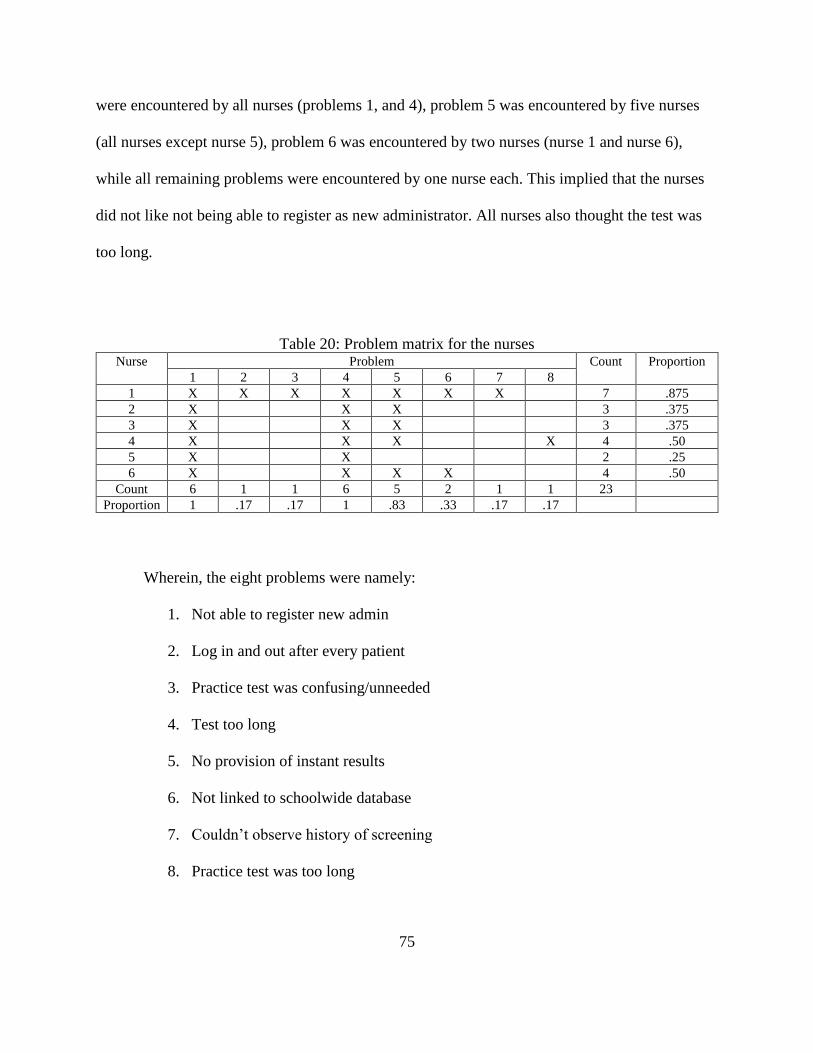
75
were encountered by all nurses (problems 1, and 4), problem 5 was encountered by five nurses
(all nurses except nurse 5), problem 6 was encountered by two nurses (nurse 1 and nurse 6),
while all remaining problems were encountered by one nurse each. This implied that the nurses
did not like not being able to register as new administrator. All nurses also thought the test was
too long.
Table 20: Problem matrix for the nurses Nurse Problem Count Proportion
1 2 3 4 5 6 7 8
1 X X X X X X X 7 .875
2 X X X 3 .375
3 X X X 3 .375
4 X X X X 4 .50
5 X X 2 .25
6 X X X X 4 .50
Count 6 1 1 6 5 2 1 1 23
Proportion 1 .17 .17 1 .83 .33 .17 .17
Wherein, the eight problems were namely:
1. Not able to register new admin
2. Log in and out after every patient
3. Practice test was confusing/unneeded
4. Test too long
5. No provision of instant results
6. Not linked to schoolwide database
7. Couldn’t observe history of screening
8. Practice test was too long

76
While usability problems can be analyzed qualitatively, the analysis needs to be
systematic for the inferences to be reliable and practical, and therefore, need to be analyzed
grounded in theory. For this purpose, a two-pronged approach to analyze the above usability
problems was selected, and the Usability Problem Taxonomy method developed by Keenan et.
al. (1999) and the User Action Framework method developed by André et. al. (2001) were
chosen, as both methods assessed usability problems from not only the perspective of the user,
but also the task.
The Usability Problem Taxonomy Method by Keenan et. al. (1999)
This method contains an ‘artifact component’ and a ‘task component’, wherein the
former refers to the system in question-the hEAR application, and the latter refers to the task-to
use the hEAR app to screen patients. Based on this theory, the above problems were classified
into the following categories (problem 3 was broken into two parts), as seen in Table 21 below.

77
Table 21: Classification of problems encountered by nurses according to Usability Problem
Taxonomy S.no Problem Artifact
Classification
Artifact
Outcome
Task
Classification
Task
Outcome
1. Not able to register new admin Visualness-
Non-message
feedback;
language-
feedback
message
Fully
Classified
Task Mapping-
Navigation
Fully
Classified
2. Log in and out after every
patient
Manipulation-
Physical
aspects
Fully
Classified
Task Mapping-
Navigation
Fully
Classified
3. Practice test was confusing Language-On
screen text
Partially
Classified
Task Mapping-
Interaction
Fully
Classified
4. Practice test was unneeded Manipulation Fully
Classified
Task
Facilitation-
alternatives;
Task Mapping-
functionality
Fully
Classified
5. Test too long Manipulation-
Cognitive
Aspects
Fully
Classified
Task Mapping-
Functionality;
Task
Facilitation-
keeping user on
task
Fully
Classified
6. No provision of instant results Visualness-
Presentation of
results, non-
message
feedback;
language-user
requested
results
Fully
Classified
Task Mapping-
Interaction
Fully
Classified
7. Not linked to schoolwide
database
Language-User
requested
results
Fully
Classified
Task
Facilitation-
Task/Function
automation
Fully
Classified
8. Couldn’t observe history of
screening
Visualness-
Presentation of
results
Fully
Classified
Task Mapping-
Interaction
Fully
Classified
9. Practice test was too long Manipulation-
Cognitive
aspects
Fully
Classified
Task
Facilitation-
keeping user on
task
Fully
Classified
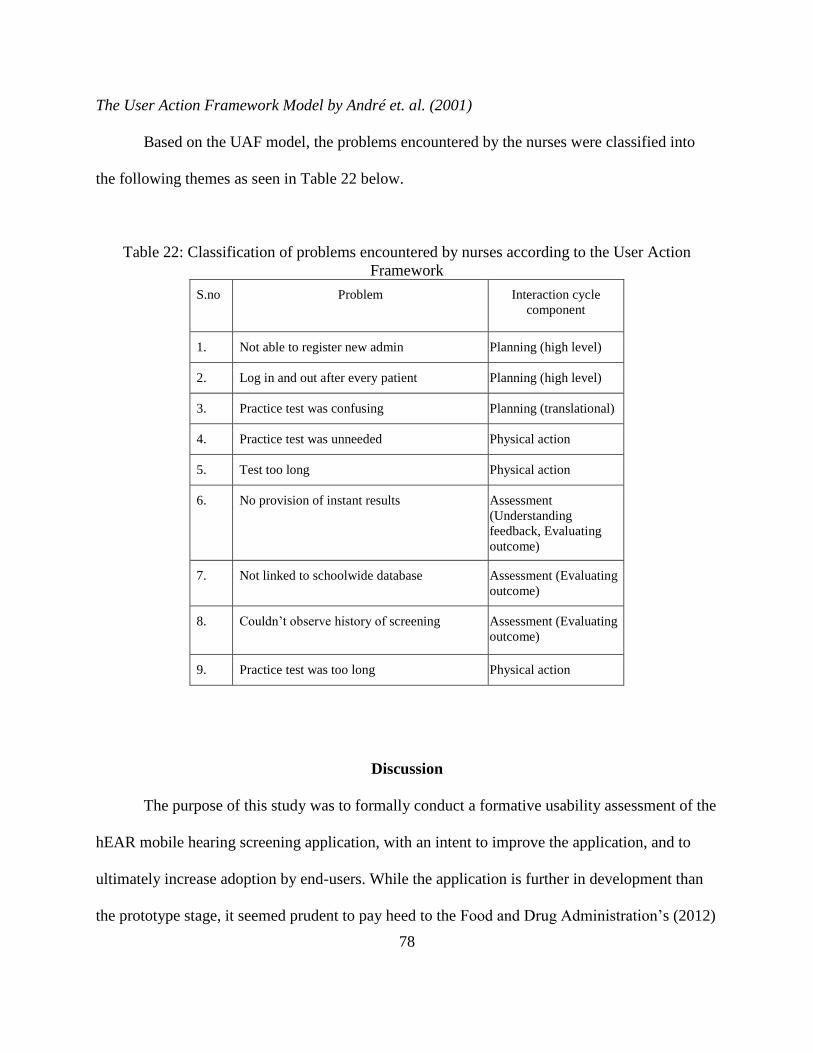
78
The User Action Framework Model by André et. al. (2001)
Based on the UAF model, the problems encountered by the nurses were classified into
the following themes as seen in Table 22 below.
Table 22: Classification of problems encountered by nurses according to the User Action
Framework
S.no Problem Interaction cycle
component
1. Not able to register new admin Planning (high level)
2. Log in and out after every patient Planning (high level)
3. Practice test was confusing Planning (translational)
4. Practice test was unneeded Physical action
5. Test too long Physical action
6. No provision of instant results Assessment
(Understanding
feedback, Evaluating
outcome)
7. Not linked to schoolwide database Assessment (Evaluating
outcome)
8. Couldn’t observe history of screening Assessment (Evaluating
outcome)
9. Practice test was too long Physical action
Discussion
The purpose of this study was to formally conduct a formative usability assessment of the
hEAR mobile hearing screening application, with an intent to improve the application, and to
ultimately increase adoption by end-users. While the application is further in development than
the prototype stage, it seemed prudent to pay heed to the Food and Drug Administration’s (2012)

79
recommendations to conduct user centered assessments during the developmental stages of
mHealth application, regardless of the developmental phase. Indeed, such studies are fairly new,
and have been more focused on applications connected to disease management such a diabetes
management application; there have been virtually no usability assessments, formative or
otherwise, for hearing screening applications.
With respect to the sensitivity of hEAR in a ‘high-risk’ population, such as a pediatric
population, our results mirrored those of other validated applications. While it was assumed that
the results in this population would be as consistent as those in the general population, the
assumption was not held true. However, as mentioned earlier, these results are replicated in other
research (Yeung et al., 2013; Rourke et al., 2016). Audiological screening in children is
challenging, due to several issues (Picard, Ilecki, & Baxter, 1993). Children may get distracted
more easily than adults, and may not focus on the test, and this reaction is stronger in younger
children (Pererira, Pasko, Supinski, Hammond, Morlet, & Nagao, 2018). While our results were
not differentiated by age, most (21) of the patients (students) who were screened were between
5-7 years of age, and it is possible that they demonstrated this observation. hEAR, therefore,
performs comparatively to other similar applications in this particular population, and has
variable results in children, as opposed to consistent results observed in the general population.
However, if the cut-off threshold level is changed to 35 dB so that the difference between the
application and the audiometer is still ‘within clinically acceptable levels’, as is the norm in
much of this kind of research (Foulad et. al., 2013; Thompson et. al., 2015; Yao, Yao, & Givens,
2015), the sensitivity of hEAR increases to 82%. This method should be used with caution,
especially when the comparator is mass screening, as the exact sound pressure level values for
the comparator are unknown.

80
One thing that has always stood out over the course of researching hEAR is that the
results of hearing threshold levels at frequencies 4000 and 8000 Hz have been consistently
inconsistent. In the pilot study where ambient noise as a confounder played an important
role, the results at these frequencies were statistically different from those of the audiologist.
However, since hEAR is highly dependent on the type of headphone used in conjunction with it,
it was assumed that the lack of attenuation features of the companion headphones contributed to
those results.
These results were also observed in the validation study (Pickens et. al., 2018), especially
with the two consumer or ‘non-professional’ headphones. While the results obtained with the
professional headphones were statistically similar (not significant) to the audiologist, the
probability of success of both the headphones at those frequencies were lower when compared to
those at other frequencies. This could once again be due to both the attenuation properties of the
headphones, and therefore the accuracy of frequency reproduction of the headphones, and the
frequency signature of the ambient noise in the testing room. As mentioned previously,
preliminary spectral analysis showed confounding ambient noise at 4000 Hz, and the accuracy of
the frequency reproduction of the two headphones drops after 6000 Hz, if not used in a noise
isolated room.
Similarly, these results were observed for 4000 Hz, at which the sensitivity of hEAR was
25%. Some phonemes such as /s, /sh etc. register at higher frequencies (2000 Hz and above) for
children, especially young children, and women (Stelmachowicz, Pittman, Hoover, Lewis, &
Moeller, 2004). While the testing rooms were relatively quiet at the testing, most were located
near the reception, and it is possible that the voices of receptionist, teachers, and students, may
have acted as a confounder.

81
The populations that tested hEAR for both the pilot study, and the validation study, were
very similar, and that was what set this last assessment apart from those two studies, as the
assessment was carried out in a high-risk population, namely, a pediatric population.
Audiological testing on a pediatric population has a multitude of issues that are usually not
replicated in other high-risk populations that include adults, and it is highly likely that some of
those issues were manifested in this assessment, resulting in the decrease of hEAR's overall
sensitivity.
With respect to effectiveness as measured by the error rate, the overall error rate was low
(0.078). At its highest, the error rate was 0.12. Nurse 1 had the most errors, especially with the
first patient she screened. All nurses mentioned that the application was easy to work with, and
that was demonstrated by the relatively low error rate. While it could be concluded from the rate
that the application was ‘effective’, the sample size and the somewhat high degree of variation
between the first nurse and the rest of the nurses, could somewhat reduce the applicability of the
conclusion. All nurses except Nurse 1 preferred to enter the details of all their patients at once,
which was a deviation from the task list, and was therefore an error. During their interviews, all
nurses mentioned ‘the capability of entering patients details at once’ was a feature that they felt
any new screening method should have. With respect to the first statement of the ASQ which
relates to the effectiveness metric, all nurses scored the application a 7, which was the highest.
This score reaffirms the nurses’ point of view of the application being easy to work with, and all
of them being able to complete the tasks on the task list, and screen their patients well within the
time limit. With respect to success rate, all the nurses were successful in completing their tasks
well before the upper time limit (for completion of data entry) of thirty (30) minutes. Hence,
success rate was not used as a measure of effectiveness in this case.

82
With respect to efficiency as measured by total time to perform tasks, the average
(arithmetic mean) time for data entry was approximately 5 minutes (4.67 minutes). However,
there was a standard deviation of 2 minutes, and the individual times were somewhat highly
variable. The average time to screen a patient was approximately 6 minutes (5.6 minutes), with a
standard deviation of approximately 2 minutes (1.79 minutes). Many user-experience researchers
(Nielsen, 2012) advice using geometric means for calculation of average time to complete task,
as arithmetic means tend to be ‘heavily skewed by outliers’ in small sample sizes. However, in
the case of calculation of ‘time to enter data’ both the geometric and the arithmetic means were
close to each other (4.25 minutes vs. 4.67 minutes respectively). Moreover, the total time
required to complete tasks was dependent on two different types of tasks i.e., data entry and
screening, and while the sample size for the data entry tasks was small (6), the screening task
was performed for 30 patients. The total time required to complete both types of tasks was
calculated (shown in Table 14 in the Results), and the times observed here are similar to those
observed previously in both the pilot study (Pickens et. al., 2017), and during the validation
study (Pickens et. al., 2018). Nurse 1 took the longest, however, it is possible that had she also
entered all patients details at once, similar to other nurses, after having read the task list, she
would’ve completed the tasks faster. Nurses 1, 2, and 3 had more younger patients, i.e. aged 5-6
years, as well, as compared to the other nurses’ patients, whereas Nurse 4 did not have anyone
smaller than 8 years as her patients. Nurse 4 was also very apprehensive about using the
application to screen younger children, as she was afraid that the children would either lose
interest in the test, or would not understand what to do. This is observed in research as well, as
seen in Pererira et. al., 2018.
83
The time to screen a patient was longer than that required when screening by the
audiometer (nurse-reported), and for almost all nurses ‘time to screen’ was an important metric
that they would use to compare any alternative. Based on the figures and the nurses’ comments,
it would appear that the application was less efficient than the audiometer in this regard.
However, it is important to note that the hEAR application performed comparatively to other
similar applications (such as Uhear, and ShoeBox audiometry) with respect to time taken to
screen a patient. It is also reflected in the scores for the second statement (item) of the ASQ
which pertains to the amount of time taken to complete tasks (and therefore pertains to
efficiency). Three nurses scored the application a 5 on the statement, accompanied with the near
unanimous comment, “the audiometer takes less time for screening”. However, during their
interviews, all nurses expressed dissatisfaction with the amount of time it took to enter the
audiometer screening results in their respective school’s database. Because the application
screening results could be downloaded as an excel file, it could probably reduce that time, which
would suggest that the application could perform at least on-par with the audiometer, on some
degree.
It is also important to note that the reason why the application takes longer to screen, is
because it performs a full spectrum test with all seven frequencies, and the seven frequencies are
repeated at least four times each, to account for any false positives. The application also provides
the patient’s hearing threshold levels at the seven frequencies, instead of simply indicating a pass
or fail. Research suggests that having this data with frequency specific hearing thresholds maybe
more useful for screening purposes, than a simple pass or fail (Sliwa et. al., 2011). So, while the
application does take longer per screening, there is evidence that suggests that this may be
84
beneficial, and it would therefore imply that the application is at least as effective as the current
standard.
With respect to satisfaction as measured by the SUS, and the last statement of the ASQ,
both the application and the audiometer performed very comparatively to each other. The
average SUS score for the top 10 Android based applications is 83 (Kortum, 2016), which would
imply that the hEAR application performed slightly lower than the top 10 Android applications,
but was comparable to them (there are no comparative SUS scores for mHealth applications).
Five out the six nurses appreciated using ‘newer technology’ to screen their students, while one
nurse (Nurse 2) was apprehensive about using an Android based application and device, and the
troubleshooting issues that may arise during an annual screening, as she had no previously
experience with the aforementioned platform before, and this is reflected in her score for the last
statement of the ASQ. However, five nurses also thought that the current way of viewing results
on the application was time consuming. While the application took longer per screening as
compared to the audiometer, it took longer to enter the results of the audiometer screening.
Therefore, while the application and audiometer differed from each other on certain features, the
scores for both on the SUS and the ASQ were more or less equivalent to each other.
The most interesting SUS scores (for the audiometer and hEAR) was allotted by Nurse 1
(67.5, and 90 respectively). Nurse 1 initially had some problems with using the application,
which resulted in the highest error rate, as compared to the other nurses. However, Nurse 1 had
not read any instructions, or the task list before she started using the hEAR application. Because
of that, she made an error in most of the tasks, for her first student/patient. Then she read through
the instructions and the task list, and did not have any further errors. When she was scoring the
application, she replied that she was basing her scores from after her first patient. While she

85
seemed critical of using any kind of mHealth application for a schoolwide hearing screening, she
was hopeful of using them in the future. According to her, while the audiometer was ‘tried and
tested’ and took much less time per screening, the fact that she would have to manually enter
each student’s details and results, counted against the audiometer. She admitted that the data
entry took almost a week, and she felt that even in its current iteration, the hEAR application was
better (with respect to that particular aspect) than the traditional method.
However, it is possible that the scores for hEAR could have been more liberal than
normal, because the nurses were not screening their entire student body at that time, but were
rather ‘imagining’ the scenario. Conversely, it is possible that the scores for the audiometer could
have been lower for a similar reason, since the questionnaires were not administered right after
the annual screening, the nurses had to ‘imagine’ that scenario, and any negative experiences
during the last annual screening (which occurred in February 2018), could have biased them
against the GSI-17 audiometer.
Usability Problem Taxonomy Model/Method and User Action Framework Model
The problems encountered by the nurses were also analyzed using the Usability Problem
Taxonomy method developed by Keenan et. al. (1999), and the User Action Framework
developed by André et. al. (2001), to arrive at the main themes that the problems fell under (as
depicted in Table 23 below). Both these methods were chosen because they enable the
investigator to look at usability in a holistic way, looking at not only the system (artifact) but also
the task characteristics and how the user interacts with them. Both these methods are usually
used together to arrive at concrete themes, though they can be used individually as well. In the
case of hEAR, it seemed judicious to look at not just whether the app worked or not, but whether
users were able to do their intended tasks on it, and how they undertook those tasks.

86
With respect to the usability problem taxonomy model by Keenan et. al. (1999), almost
all the problems were ‘fully classified’, i.e. able to be categorized into the ‘smallest’ or most
detailed subcategory. Out the those, it appeared that ‘feedback’ was the most important
subcategory. The absence of instant results, and the absence of history of screening were the
most ‘glaring’ problems. This was followed by navigation problems of not being able to register
as new admin, and the test being ‘too long’, due to it being a full spectrum audiometric test,
which fell under the category of manipulation (cognitive aspects). What this evaluation method
helped to decipher were the usability concepts that the nurses’ problems with hEAR could fall
under. Similarly, the user action framework helped confirm those concepts, with ‘Assessment
(Evaluating Outcome)’ emerging as the most repeated problem, followed by the aforementioned
navigational problems, and the test being too long. These findings were also corroborated by the
nurses’ comments during their interviews.
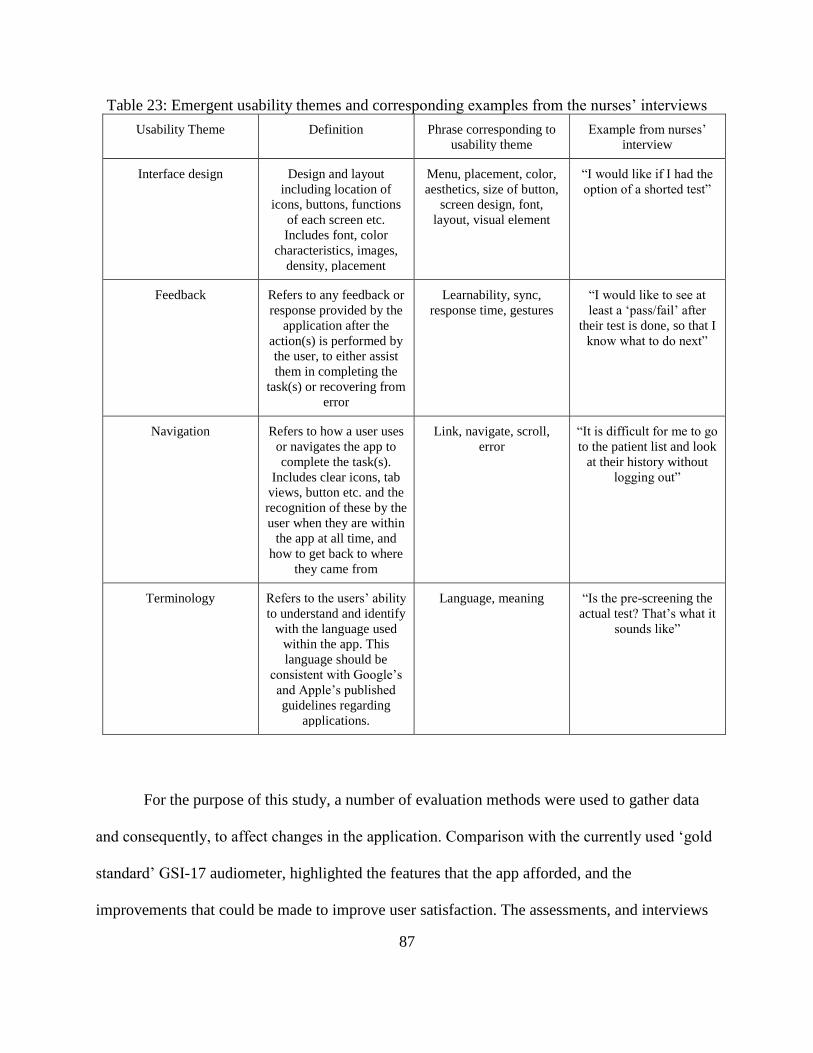
87
Table 23: Emergent usability themes and corresponding examples from the nurses’ interviews
Usability Theme Definition Phrase corresponding to
usability theme
Example from nurses’
interview
Interface design Design and layout
including location of
icons, buttons, functions
of each screen etc.
Includes font, color
characteristics, images,
density, placement
Menu, placement, color,
aesthetics, size of button,
screen design, font,
layout, visual element
“I would like if I had the
option of a shorted test”
Feedback Refers to any feedback or
response provided by the
application after the
action(s) is performed by
the user, to either assist
them in completing the
task(s) or recovering from
error
Learnability, sync,
response time, gestures
“I would like to see at
least a ‘pass/fail’ after
their test is done, so that I
know what to do next”
Navigation Refers to how a user uses
or navigates the app to
complete the task(s).
Includes clear icons, tab
views, button etc. and the
recognition of these by the
user when they are within
the app at all time, and
how to get back to where
they came from
Link, navigate, scroll,
error
“It is difficult for me to go
to the patient list and look
at their history without
logging out”
Terminology Refers to the users’ ability
to understand and identify
with the language used
within the app. This
language should be
consistent with Google’s
and Apple’s published
guidelines regarding
applications.
Language, meaning “Is the pre-screening the
actual test? That’s what it
sounds like”
For the purpose of this study, a number of evaluation methods were used to gather data
and consequently, to affect changes in the application. Comparison with the currently used ‘gold
standard’ GSI-17 audiometer, highlighted the features that the app afforded, and the
improvements that could be made to improve user satisfaction. The assessments, and interviews

88
revealed four main themes in which any improvements would fall, and those are mentioned in
the table above. The four themes that emerged were namely, interface design, navigation,
feedback, and language. Of the four themes, feedback was the most important to the end users
followed by navigation and interface design, which was followed by language.
With regard to feedback, while the app does provide a result in the form of an audiogram,
if the administrator goes to the subject's hearing screening, there is not a provision of an
instantaneous result post screening. Provision of such an instantaneous post screening result
would potentially reduce the cognitive workload for the end user, and enable them to plan their
course of action, instead of having to navigate through the subject list to go to the audiogram
results.
The main difference between the app and the GSI-17 audiometer was that the app screens
at seven frequencies, similar to a standard pure tone audiometric test, whereas, the latter only
tests at the three government mandated frequencies. This difference is also the major barrier that
the app has to overcome in order to be adopted by the target end users. Because the app uses
seven frequencies, the time taken to test is longer than that of the GSI-17 audiometer. While the
seven-frequency test may at first seem longer, it also affords the end users a more thorough test,
and is something that they can use in cases of retesting, or referrals.
Because the app is very simplistic, no user had any problem completing their tasks. The
patients were also very comfortable with a tablet. In fact, they emphasized the redundancy of the
task list by committing errors of commission repeatedly by entering details of all patients at once
instead of one after another. This affords us the opportunity to make the app interface more
intuitive wherein a list of patient names/database of patient information could be ‘imported’ via
scanning a barcode when using the ‘add new screener’ option. This interface solution could

89
work in different scenarios in addition to a school-based screening system, as almost all health
providers assign new and existing patients a barcode connected to a PIN, which in turn is
connected all patient information including medical history and history of testing/screening.
With such a solution, it would apply to two of the aforementioned problems the nurses
encountered while hEAR, the first being having to manually enter patient information, and the
second being having an avenue to view the patient's history of hearing screening. They could
also be to view any other medical information such as medications being taken by the patient,
any preexisting allergies or conditions that may confound the screening etc.
The application does have capabilities that can be connected to a database. At present, all
results are capable of being exported in a .csv file (a Microsoft Excel file format) and the file
contains all details including date, time, name, ID, etc. Such a file can then be integrated into
most electronic health record databases.
According to the application interface design guidelines outlined by Apple (2008), and
Google (2012), the language used in the interface of the hEAR could be less ambiguous than the
current design. For example, end users tested here were somewhat confused between ‘screener’
and ‘subject’. Instead of using term ‘screener’ after the login screen, the term ‘administrator’
would be better word choice, as it is not an ambiguous word, and it makes clear the relationship
between the target end user such as a nurse and her students, the subject. With regard to the
screening/test, both the nurses and their patients were confused between ‘the practice screener’
and the actual test. At times both groups of individuals thought that the practice test was the
actual screening. Once again, this is an issue with the ambiguity of the language used. The app
already affords the users the choice to choose between whether or not to conduct a practice
screener. This is however not clear because of the ambiguity of the word choice and therefore,

90
should change. Emphasis on the choice could be made by directly asking users to ‘Practice the
screening’ or ‘Begin the screening’.
Apart from feedback, the main concern that the nurses had with regard to using the app in
the very near future, was the length of the test (as mentioned many times throughout this text).
While not as ‘intrusive’ for five patients, it would be limiting factor for five hundred (500)
patients. However, the app once again affords the users quite a bit of freedom with respect to the
solution. Because the app is primarily based on Bekesy audiometry, it does not require the
individual administering the test to be an audiologist or audiology nurse/technician. This implies
that as long as the app is downloaded on devices such as tablets or phones, as designated by the
school, the nurse can conduct multiple screenings simultaneously on all those devices. However,
if this method is chosen, it would be prudent to enhance the exporting abilities or the database
abilities of the app before the app is deployed. Similarly, a shorter version of the app could also
be developed, similar to the practice screen, but only utilizing the government mandated three
frequencies (1K, 2K, and 4K Hz). Even if this option is chosen, having it on multiple devices
could be advantageous to nurses screening large numbers of students.
With respect to the data and the frequencies in particular, it was evident that sensitivity
decreased with increase in frequency, with the lowest sensitivity being at 4000 Hz (25%). There
could be a number of reasons for this occurrence. There may be confounding ambient noises
within that frequency range, which may have interfered with the frequency reproduction of the
headphones as well as the tablet. The aforementioned patient data outliers could have also
contributed significantly to this frequency as well.
Overall, while a more summative usability testing is required at a later time, after the
below mentioned design recommendations are incorporated, the present study showed that the
91
hEAR app still has a high degree of satisfaction among its users. This is because of the simplicity
of the app, and the convenience afforded by it with regards to providing an audiologist-quality
hearing screening that is readily transportable between users at non-dedicated stations. There are
only a handful of other such applications, and while some of them have been validated, none
have had published usability assessment as part of the validation process. There is a hope,
therefore, that some of the themes and recommendations described in this text may be used by
other developers of hearing mHealth applications.
Design Recommendations
The comments from the nurses and the responses to the usability questionnaires presents
the opportunity to modify the hEAR application, thereby making it accessible to more
populations. One of the most important aspects that the nurses (and therefore the end users)
pointed out about hEAR were that the screening took too long because it utilized all seven
frequencies. They were all very open to using smart devices to conduct their students’ annual
health screenings, and had a few insights into what would constitute their ideal testing
application. One of the ways that hEAR could be modified especially for a pediatric population
would be to have an expedited version of the original screening. This expedited version would
include the three recommended frequencies, namely, 1000, 2000, and 4000 Hz so that it follows
the Texas Health and Human Services guidelines. This would make it possible for hEAR to exist
in two forms or versions within the same software bundle. These two versions would be the
regular version of hEAR which could be used by the general population, and the pediatric
population for any retest purposes, and the expedited or ‘school screening’ version which could
be used for annual hearing screening purposes. This modification of hEAR would alleviate most
92
of the user’s concerns of the screenings being too long without affecting the efficacy of the
application.
Another comment that can be addressed would be the presence of a pass/fail screen after
the patient is done with the screening test. At present, after the test is done, the screen switches to
the message, “Screening complete. Return to the Main Menu”. A solution would be to proceed to
the results of the screening test, ideally, the patient’s audiogram, if not, then a pass/fail result
after the test before the ‘..Return to the Main Menu’ screen. This would make it easier for the
nurses to immediately plan their next course of action, whether it be a retest or referral to an
audiologist. While audiograms can be viewed in hEAR, the process to view them is elaborate. A
user would have to log out of the application, log back in, then go to the subject list, and explore
each subject result that way. While this process may not take that long for one patient, it can
quickly add up for the 500 students that the nurses have to screen in a day.
One of the other ways that hEAR could become an ideal application for these users
would be if it were connected to the school electronic health records database, so that the
student/patient names could be automatically generated in the app and consequently, the results
could be automatically generated in the database. Having a feature to remotely backup, update,
and populate patient data in the EHR database would make hEAR the first application of its kind,
greatly increasing its reach and impact. This feature was also described as one of the most the
‘wanted’ feature, when several other health care providers who were not related to this study,
were interviewed. However, this feature may seem like a more ‘ideal’ feature than a practical
one, because it would be nearly impossible to be able to connect the application to a
‘generalized’ EHR database since each physician practice/school district has their own specific
database. However, in the future, if this change were to be implemented in hEAR, for this group

93
of users, it would eliminate the painstaking hours of manual data entry that the nurses have to do
currently.
Presented below are figures (Figures 13-19) of hEAR would look like after the
incorporation of these recommendations (all names used are fictitious, and are for representation
purposes only).
Figure 13: hEAR login screen
Figure 14: Administrator page

94
Figure 15: Selection of type of test
Figure 16: Instructions for practice and
screening

95
Figure 17: Screening page
Figure 18: Result main screen

96
Figure 19: Result audiogram
97
General Guidelines
Based on the assessments, as well as the nurses’ interviews, and the design
recommendations, the following guidelines can be used to design and/or develop a mHealth
intervention as an alternative to mass school screenings:
• School screenings are mandated at three frequencies, namely, 1000 Hz, 2000 Hz,
and 4000 Hz, however, mHealth applications should also ideally provide users with
the option to be able to conduct a full-spectrum pure-tone test. A full spectrum pure
tone test is conducive for retesting students with suspected false positive results. A full
spectrum pure-tone test can also prevent the loss to follow-up that traditionally may
occur, as in this case, the school nurse herself is in charge of retesting the student.
• At present, school mass screenings are conducted on a ‘pass/fail’ basis, where individual
sound pressure threshold levels are not provided. Literature suggests, and this was
corroborated by interviews, that while ‘pass/fail’ would work, individual threshold levels
are also required to identify any developing hearing issues. Therefore, alternatives
should provide results in both formats, i.e. individual sound pressure levels at
particular frequencies, as well as overall ‘pass/fail’ at those frequencies.
• Any alternative should also ideally have the capability of ambient noise monitoring,
so as to determine if there’s confounding at a particular frequency, and ultimately
whether screening can take place at a particular place. This feature is seen in some similar
applications, such as those that utilize the ‘speech-in-noise’ test (PhoSHA: Choi et. al.,
2012), but it needs to be incorporated in more applications.
• For a mass screening, the amount of time available per student is relatively less,
especially when compared to one-on-one screening. The amount of time per student is

98
also an important metric for nurses to gauge the relative effectiveness of any alternative.
The traditional screening method using the GSI-17 audiometer takes anywhere from 1.30
to 2.30 minutes per student. Therefore, it is important that the mHealth alternative to
mass screening have comparable timing parameters. At present, hEAR performs
comparatively to other similar applications with respect to ‘time to screen’, with the
average time to screen being 5.6 minutes for a full-spectrum test. This time needs to
decrease, at least for a three-frequency test, for the alternative to be viable.
• During their interview, the nurses revealed that time spent during entering patient details
in the mHealth system was valuable, especially during mass screening. Previous research
with other similar mHealth applications does not provide a figure for this time, but for
hEAR it ranged from 2-7 minutes for five patients. Automation of the process of
entering patient details would be important for any alternative. An example of such
an automation is provided in the design recommendations.
• Nurses were unanimous in their requirement for an alternative that connects/was
connected to the school EHR database, so that the proliferation of results in the database
would be a much easier process than what it is now. While hEAR has some capabilities
that could somewhat reduce the time spent during data entry of results, any viable
alternatives that the nurses would consider, would have to be capable of seamless
connectivity with the school EHR database. While this recommendation would be
conducive to the end-user, it may pose some problems to developers, namely:
o If the mHealth device is intended to diagnose hearing related disorders, and not
just screen hearing, then the device or application would be classified as a
‘medical device’ under the Federal Food, Drug, and Cosmetics Act (FD&C Act).

99
In case the application poses ‘minimal risk’* to the user, the Food and Drug
Administration would not enforce compliance with its regulatory requirements,
regardless of whether the application functions as an EHR system or not (Mobile
Health Apps Interactive Tool, Federal Trade Commission, 2016; Food and Drug
Administration, 2018).
o However, even if the application was exempt from the FDA’s regulatory
requirements, it is highly likely that the Federal Trade Commission Act’s (FTC
Act) Health Breach Notification Rule applies to the application, as in most cases,
schools are not considered ‘covered entities’ under HIPPA (Mobile Health Apps
Interactive Tool, Federal Trade Commission, 2016), though that may depend
upon the particular school district.
Limitations
For this formative usability test, the sample size was calculated to be 10 participants or
end users. However, due to ongoing renovation and construction at several school campuses,
only six nurses could participate. Those six nurses graciously provided great insight and were
helpful throughout the duration of the study. However, one of the nurses had to move to a
* Minimal risk: According to the FDA (Food and Drug Administration, 2018), “minimal risk” apps are those that
are only intended for one or more of the following:
• helping users self-manage their disease or condition without providing specific treatment suggestions;
• providing users with simple tools to organize and track their health information;
• providing easy access to information related to health conditions or treatments;
• helping users document, show or communicate potential medical conditions to health care providers;
• automating simple tasks for health care providers;
• enabling users or providers to interact with Personal Health Records (PHR) or Electronic Health Record
(EHR) systems; and transferring, storing, converting format or displaying medical device data

100
different state, and the interim nurse in her position had not yet used the GSI 17 Audiometer, and
therefore, her comments and questionnaire responses regarding the same could not be recorded.
According to Virzi (1992), five users can lead to the discovery of 80% of the product’s
problems. Similarly, Jakob Nielson (2012), one of the world’s foremost experts in user
experience research argues that user testing is inherently more qualitative than quantitative since
it is meant to drive design recommendations. Therefore, while only six users have interacted with
hEAR, their extensive responses, and comments, and consequently the problems and solutions
inferred from them, would make hEAR a better, and highly accessible product.
With respect to data collected by hEAR, there were certain issues that rendered model
fitting not possible. Data was collected during May (of 2018), and 20% of the students who
participated as patients were suffering from ‘flu-like’ disorders, which may have made their
results inaccurate, i.e. they had passed the school screening that had occurred prior to data
collection, but may have failed their hEAR screenings. Ten percent (10%) of the students
reported that ‘they were not sure if they would pass their screening because they had water in
their ears from swimming practice from the day before’. In addition to these factors, there
weren’t enough data points to compare hEAR and the school screening sufficiently for statistical
significance without overestimating certain factors. Also, the DHHS guideline recommend
testing in the ‘quietest area possible’ which is usually the library, however, the library was not
available for screening purposes at that time, and therefore, screening was done in the nurse’s
offices, which were near the reception, one of the most heavily trafficked areas. Therefore, it is
very possible that background noise acted as a strong confounder. The effect of background
ambient noise on hearing threshold levels as measured by hEAR was also seen in the pilot study
for hEAR (Pickens et. al., 2017). Therefore, it is highly advisable that after the design

101
recommendations are incorporated, a summative usability test be done, preferably within a
similar population, to finally arrive at a version of hEAR that can be released to the public.
Conclusion
The rapid growth and development of mobile technology has led to a congruent increase
in the number mHealth applications, including hearing screening applications. hEAR is a part of
a growing number of such applications that are being validated in various target populations.
However, there is no such subsequent increase in usability research/assessment for such
applications. This underlines a key aspect of the design process that does not take the target user
into account, and therefore may suffer in the future. This pilot usability study and the human
factors-based design recommendations that resulted from it, is the first of its kind in the field of
mobile hearing screening applications. Human/user-centered design is an approach that imagines
the end user at every stage of the design process, and results in a product that is not only easy to
use, but performs the intended functions to the utmost. This pilot study identified several key
areas where the hEAR mobile hearing screening application could be improved. These areas
could be broadly classified into interface design, feedback, and navigation. However, despite
hEAR needing improvement in these aforementioned areas, end users were still ‘satisfied’ after
using it, and had comparatively low error rates. Their interviews also revealed that they seemed
confident that could see themselves using it in the near future. While this pilot study was a
qualitative study on a small number of end users, it acts as a commencement for more iterations
of the hEAR application, based on the design recommendations presented in this text, which
should be assessed by a summative usability assessment further in the future.

102
CONCLUSION
The prevalence of hearing loss is increasing annually, and there is a stark scarcity of
hearing health services (WHO, 2017). Interventions that aim to increase access to such services
through mHealth initiatives are being developed daily. There are different modes of technology
that can deliver these mHealth interventions, ranging from the use of remote computing, use of
emails, the development of specialized audiometer-like instruments, to the use of the widely
available smartphone technology. All these interventions have been developed to deliver
audiologist-level results, however, many of these intervention methods, especially those that
belong to the latter category, have not been fully validated in different populations to ensure
accuracy. Additionally, most of these interventions have not been assessed for their usability, in
the target users. Therefore, it is imperative that the hEAR application be not only validated in
different populations, but also its usability be assessed in such a target population.
Previous research has shown that while the hEAR application was capable of providing a
full-spectrum hearing test, it was highly dependent on the type of headphones used in for test
administration. So, before the accuracy of the hEAR application could be assessed in a high-risk
population, the application needed to be validated against the gold standard. When paired with
one of four ‘off-the-shelf’ headphones, the accuracy of hEAR was validated against the gold
standard of audiologist-administered pure-tone audiological exams, and found to be capable of
reproducing statistically similar results for two pairs of headphones, due to the nature of their
frequency reproduction response. The two pairs of headphones had a ‘flat frequency
reproduction’ i.e. the reproduction of cross-spectrum frequencies is more accurate and minimally
distorted. After the most conducive hardware was identified, validation and a formative usability

103
assessment of the hEAR application was conducted in a pediatric population. While the
assessment revealed that the hEAR application performs on par with other validated mHealth
applications, and has comparatively high scores with respect to its usability, it was also apparent
that more research is necessary before these interventions could be applied in a pediatric
population. A usability assessment-based study is the first of its kind for audiological mHealth
technologies, and the recommendations generated as a result of the study could be utilized to
develop more user-centered audiology applications.
Public Health Implications
With these three studies, it was observed that the hEAR application is comparable to
other validated audiology mHealth applications, such as uHear, and ShoeBox Audiometry. The
sensitivity of all three applications when compared with an audiologist-administered test, are
within ‘clinically acceptable levels’, for the general population. The time required to screen one
patient/person is also very comparable across the three applications, between 4.7 to 6 minutes for
uHear, and ShoeBox Audiometry (Bright & Pallawela, 2016), and 5.6 minutes for the hEAR
application. However, hEAR is the only application that provides an audiometric test using the
frequencies 125 Hz, 250 Hz, and in some cases, 8000 Hz. Especially in the case of a pediatric
population, the lower frequencies, namely, 250 Hz, and 500 Hz, “provide voicing cues” (Madell,
2013). Voicing cues refer to phonemes such as “/n/, /m/, /ng?” which correspond to 250 Hz,
whereas, the voicing cues which correspond to 500 Hz refer to “first formant for most vowels,
information for semi-vowels and lateral /l/ and /r/ phonemes” (Madell, 2013). Therefore, if a
child has problem speaking ‘consonants specifically’ then, their hearing at lower frequencies

104
needs to be checked. Similarly, at higher frequencies, namely, 8000 Hz, the phoneme /s/ is heard,
and the frequency enables the learning of prepositions, and possessives (Choi et. al., 2012).
In the general population, both the low frequencies imply that the hEAR application can
be used to screen for specific types of low frequency hearing loss, and in the case of the latter
frequency (8000 Hz), high frequency hearing loss, or occupationally-induced noise-related
hearing loss. Moreover, the use of the application for screening does not require a soundproof
room, or a noise-isolated room. In a high-risk population, such as a pediatric population, the
application can be used for retesting purposes. There have been no mHealth based audiology
applications which have been assessed with respect to their usability. After the incorporation of
the developed recommendations and further testing, the strong potential exists that the hEAR
application could be one of the few mHealth applications that are validated across different
populations, making it an effective alternative to audiological services where such services are
needed but unavailable. The overarching implications of early screening for the general
population are that such screening could potentially lead to earlier discovery/diagnosis, and
subsequent earlier mitigation of hearing loss. In younger populations, early screening has the
potential to develop language skills, and encounter better educational opportunities when
compared to populations who have not been screened (Early Hearing Detection and Intervention
Act, 2017). Additionally, the recommendations for design of self-administered mHealth hearing
software have the potential:
• For the software to be able to able to provide users with the option of being able
to conduct a full-spectrum pure-tone test
105
• For the software to provide results in easily understandable formats, i.e. results in
the form of individual sound pressure levels at particular frequencies, as well as
overall ‘pass/fail’ at those frequencies
• For the software to have the capabilities of ambient noise monitoring
• For the software to have an option of ‘faster time to screen’
• For the software to be able to connect to school/proprietary electronic health
record (EHR) database, so as to automate the process of entering patient details,
and entering/updating patient results
106
REFERENCES
American Academy of Pediatrics. (2007). Recommendations for preventative pediatric health
care committee on practice and ambulatory medicine and bright futures steering
committee. Pediatrics, 120(6).
Andre, T. S., Hartson, H. R., Belz, S. M., & McCreary, F. A. (2001). The user action
framework: a reliable foundation for usability engineering support tools. International
Journal of Human-Computer Studies, 54(1), 107-136.
Apple, Inc. (2008). Themes - iOS - Human Interface Guidelines - Apple Developer. Retrieved
February 8 2018, from https://developer.apple.com/design/human-interface-
guidelines/ios/overview/themes/
American National Standards Institute. (2010). Specification for Audiometers. (ANSI S3.6-
2010). New York: Author
Arsand, E., Tatara, N., Ostengen, G., & Hartvigsen, G. (2010). Mobile phone-based self-
management tools for type 2 diabetes: the few touch applications. Journal of Diabetes
Science and Technology, 4(2), 328-336.
Bamford, J., Fortnum, H., Bristow, K., Smith, J., Vamvakas, G., Davies, L., … Hind, S. (2007).
Current practice, accuracy, effectiveness and cost-effectiveness of the school entry
hearing screen. Health Technology Assessment, 11(32).
Bexelius, C., Honeth, L., Ekman, A., Eriksson, M., Sandin, S., Bagger-Sjöbäck, D., &
Litton, J. E. (2008). Evaluation of an internet-based hearing test—Comparison with
107
established methods for detection of hearing loss. Journal of Medical Internet
Research, 10(4).
Botasso, M., Sanches, S., Bento, R., & Samelli, A. (2015). Teleaudiometry as a screening
method in school children. Clinics, 70(4), 283-288.
Bright, T., & Pallawela, D. (2016). Validated smartphone-based apps for ear and hearing
assessments: a review. JMIR Rehabilitation and Assistive Technologies, 3(2), 1-12.
Brown, W., Yen, P., Rojas, M., & Schnall, R. (2013). Assessment of the Health IT Usability
Evaluation Model (Health-ITUEM) for evaluating mobile health (mHealth)
technology. Journal of Biomedical Informatics, 46(6), 1080-1087.
Centers of Disease Control and Prevention, & National Institute of Health. Statistical Report:
Prevalence of Hearing Loss in U.S. Children, 2005. Retrieved March 27 2018, from
https://www.nidcd.nih.gov/research/workshops/statistical-report-prevalence-hearing-
loss-us-children/2005
Choi, J. M., Sohn, J., Ku, Y., Kim, D., & Lee, J. (2013). Phoneme-based self hearing assessment
on a smartphone. IEEE Journal of Biomedical and Health Informatics, 17(3), 526-529.
Dawes, P., Fortnum, H., Moore, D. R., Emsley, R., Norman, P., Cruikshanks, K., … Davis, A.
(2014). Hearing in middle age: A population snapshot of 40- to 69-year-olds in the
United Kingdom. Ear and Hearing, 35(3), e44-e51.
Deafness and hearing loss. Fact Sheet. (2018). Retrieved October 29 2018, from World Health
Organization website: https://www.who.int/news-room/fact-sheets/detail/deafness-and-
hearing-loss

108
Early Hearing Detection and Intervention Act of 2017, Pub. L. No. 115-71, 131 Stat. 1218.
(2017).
El-Gayar, O., Timsina, P., Nawar, N., & Eid, W. (2013). Mobile applications for diabetes self-
management: status and potential. Journal of Diabetes Science and Technology, 7(1),
247-262.
Eikelboom, R. H., Mbao, M. N., Coates, H. L., Atlas, M. D., & Gallop, M. A. (2005).
Validation of tele-otology to diagnose ear disease in children. International Journal of
Pediatric Otorhinolaryngology, 69, 739-744.
Eikelboom, R. H., Swanepeol, D. W., Motakef, S., & Upson, G. (2013). Clinical validation of
the AMTAS automated audiometer. International Journal of Audiology, 52(5), 342-349.
Fellizar-Lopez, K., Abes, G., Reyes-Quintos, R., & Tantoco, L. (2011). Accuracy of Siemens
HearCheck™ navigator as a screening tool for hearing loss. Philipp J Otolaryngol Head
Neck Surg, 26(1), 10-15.
Ferrari, D., Lopez, E., Lopes, A., Aiello, C., & Jokura, P. (2014). Results obtained with a low
cost software-based audiometer for hearing screening. International Archives of
Otorhinolaryngology, 17(03), 257-264.
Food and Drug Administration. (2012). Medical Device User Fee Amendments IV Independent
Assessment of Food and Drug Administration’s Device Review Process Management.
Retrieved February 8 2018, from https://www.fda.gov/media/119435/download
Fortnum, H. M., Summerfield, A. Q., Marshall, D. H., Davis, A. C., Bamford, J. M., Davis, A.,
… Hind, S. (2001). Prevalence of permanent childhood hearing impairment in the
United Kingdom and implications for universal neonatal hearing screening:
109
questionnaire based ascertainment study commentary: Universal newborn hearing
screening: implications for coordinating and developing services for deaf and hearing
impaired children. British Medical Journal, 323(7312).
Foulad, A., Bui, P., & Djalilian, H. (2013). Automated audiometry Using Apple iOS-based
application technology. Otolaryngology–Head and Neck Surgery, 149(5), 700–706.
Franks, J. R. (1995). Hearing Measurement. In W. H. (WHO), Occupational exposure to noise:
Evaluation, Prevention, and Control (pp. 183-232). Geneva, Switzerland: World Health
Organization.
Gan, K. B., Azeez, D., Umat, C., Mohd Ali, M. A., Wahab, N. A., & Mai-Sarah Mukari, S. Z.
(2012). Development of a computer-based automated pure tone hearing screening
device: a preliminary clinical trial. Biomed Tech, 57(5), 323–332.
Givens, G., Blanarovich, A., Murphy, T., Simmons, S., Blach, D., & Elangovan, S. (2003).
Internet-based tele-audiometry system for the assessment of hearing: A pilot
study. Telemedicine and e-Health, 9(4), 375-378.
Goldenberg, D., & Wenig, B. (2002). Telemedicine in otolaryngology. American Journal of
Otolaryngology, 23, 35-43.
Gomes, M., & Lichtig, I. (2005). Evaluation of the use of a questionnaire by non-specialists to
detect hearing loss in preschool Brazilian children. International Journal of
Rehabilitation Research, 28(2), 171-174.
Google. (2012). Android developers user interface guidelines. Retrieved February 8 2018, from
http://developer.android.com/guide/developing/index.html
Grote, J. (2000). Neonatal screening for hearing impairment. The Lancet, 355(9203), 513-514.
110
Halloran, D. R., Wall, T. C., Evans, H. H., Hardin, J. M., & Woolley, A. L. (2005). Hearing
screening at well-child visits. Archives of Pediatrics & Adolescent Medicine, 159(10),
949-955.
Tex. Health and Safety Code. § 36: Special senses and communication disorders. Texas
Department of State Health Services. Retrieved March 5 2018, from
https://statutes.capitol.texas.gov/Docs/HS/htm/HS.36.htm
Henderson, E., Testa, M. A., & Hartnick, C. (2010). Prevalence of noise-induced hearing-
threshold shifts and hearing loss among US youths. Pediatrics, 127(1), e39-e46.
Hertsens, T. (2014). A better traveler's sanctuary: The Bose Quiet Comfort 25. Retrieved May
22 2016, from https://www.innerfidelity.com/content/better-travelers-sanctuary-bose-
quiet-comfort-25
Hertsens, T. (2015). Headphone measurements explained-Frequency response part 1. Retrieved
April 3 2019, from https://www.innerfidelity.com/content/headphone-measurements-
explained-frequency-response-part-one
Hertsons, T. (2019). Sennheiser HD280 Pro measurements. Retrieved April 3 2019, from
https://www.innerfidelity.com/images/SennheiserHD280Pro.pdf
International Organization for Standardization. (2018). Ergonomics of human-system
interaction- Part 11: Usability: Definitions and concepts. (ISO 9241-11:2018). Geneva:
Author
Kapul, A. A., Zubova, E. I., Torgaev, S. N., & Drobchik, V. V. (2017). Pure-tone
audiometer. Journal of Physics: Conference Series, 881, 012010.

111
Keenan, S. L., Hartson, H. R., Kafura, D. G., & Schulman, R. S. (1999). The Usability Problem
Taxonomy: a framework for classification and analysis. Empirical Software
Engineering, 4, 71-104.
Khoza-Shangase, K., & Kassner, L. (2013). Automated screening audiometry in the digital age:
exploring uhearTM and its use in a resource-stricken developing country. International
Journal of Technology Assessment in Health Care, 29(1), 42-47.
Kortum, P. (2016). Usability assessment: How to measure the usability of products, services,
and systems. Washington, DC: Human Factors and Ergonomics Society
Krumm, M., Ribera, J., & Klich, R. (2007). Providing basic hearing tests using remote
computing technology. Journal of Telemedicine and Telecare, 13(8), 406-410.
Krumm, M., Huffman, T., Dick, K., & Klich, R. (2008). Telemedicine for audiology screening
of infants. Journal of Telemedicine and Telecare, 14(2), 102-104.
Krupinski, E., & Bernard, J. (2014). Standards and guidelines in telemedicine and
telehealth. Healthcare, 2(1), 74-93.
Kushniruk, A. W., & Patel, V. L. (2004). Cognitive and usability engineering methods for the
evaluation of clinical information systems. Journal of Biomedical Informatics, 37(1), 56-
76.
Lancaster, P., Krumm, M., Ribera, J., & Klich, R. (2008). Remote hearing screenings via
telehealth in a rural elementary school. American Journal of Audiology, 17, 114–122.
Laplante-Levesque, A., Pichora-Fuller, M. K., & Gagne, J. P. (2006). Providing an internet-
based audiological counselling programme to new hearing aid users: A qualitative
study. International Journal of Audiology, 45(12), 697-706.
112
Larossa, F., Rama-Lopez, J., Benitez, J., Morales, J. M., Martinez, A., Alañon, M. A., &
Alañon, J. (2015). Development and evaluation of an audiology app for iPhone/iPad
mobile devices. Acta Oto-Laryngologica, 135(11), 1119-1127.
Laurie-Rose, C., Frey, M., Ennis, A., & Zamary, A. (2014). Measuring perceived mental
workload in children. The American Journal of Psychology, 127(1), 107-125.
Lewis, J. (1991). An after-scenario questionnaire for usability studies: psychometric evaluation
over three trials. ACM SIGCHI Bulletin, 23(4).
Li-Korotky, H. (2012). Age-related hearing loss: Quality of care for quality of life. The
Gerontologist, 52(2), 265-271.
Lin, F. R., Niparko, J. K., & Ferrucci, L. (2011). Hearing loss prevalence in the United
States. Archives of Internal Medicine, 171(20), 1851.
Madell, J. R. (2013). What does 4000 Hz tell you about a child's hearing? Retrieved April 3,
2019, from https://hearinghealthmatters.org/hearingandkids/2013/4000-hz-tell/
Mahomed-Asmail, F., Swanepoel, D. W., Eikelboom, R. H., Myburgh, H. C., & Hall, J. (2016).
Clinical validity of hearScreen™ smartphone hearing screening for school children. Ear
and Hearing, 37, e11-e17.
Masalski, M., & Kręcicki, T. (2013). Self-test web-based pure-tone audiometry: validity
evaluation and measurement error analysis. Journal of Medical Internet Research, 15(4).
Masterson, E. A., Bushnell, P. T., Themann, C., & Morata, T. C. (2017). Hearing impairment
among noise-exposed workers — United States, 2003–2012 (April 22, 2016). Retrieved
July 25 2017, from Centers for Disease and Prevention, Control Morbidity and Mortality

113
Weekly Report (MMWR) website:
https://www.cdc.gov/mmwr/volumes/65/wr/mm6515a2.htm
McCurdie, T., Taneva, S., Casselman, M., Yeung, M., McDaniel, C., Ho, W., & Cafazzo, J.
(2012). mHealth consumer apps: The case for user-centered design. Biomedical
Instrumentation & Technology, 46(s2), 49-56.
Meinke, D., Norris, J. A., Flynn, B. P., & Clavier, O. H. (2017). Going wireless and booth-less
for hearing testing in industry. International Journal of Audiology, 56(1), 41-51.
National Academies of Sciences, Engineering, Medicine Health and Medicine Division,
Verfasser. (2016). Hearing health care for adults: Priorities for improving access and
affordability.
Nielson, J. (2001). Success Rate: The Simplest Usability Metric. Retrieved November 21 2017,
from https://www.nngroup.com/articles/success-rate-the-simplest-usability-metric/
Nielson, J. (2012). How Many Test Users in a Usability Study? Retrieved November 21 2017,
from https://www.nngroup.com/articles/how-many-test-users/
Nilsen, W., Kumar, S., Shar, A., Varoquiers, C., Wiley, T., Riley, W. T., … Atienza, A. A.
(2012). Advancing the science of mHealth. Journal of Health Communication, 17(sup1),
5-10.
Norman, D. A. (1986). Cognitive engineering. In D. A. Norman & S. W. Draper (Eds.), User
centered systems design: New perspectives on human-computer interaction (pp. 31-61).
Hillsdale, NJ: Lawrence Erlbaum Associates, Inc.
Occupational Safety and Health Administration. (n.d.). Code of Federal Regulations Title 29
Part 1910: General Industry Subpart 95 Occupational Noise Exposure, Appendix D:

114
Audiometric Test Rooms. Retrieved May 22 2016, from
https://www.osha.gov/pls/oshaweb/owadisp.show_document?p_table=STANDARDS&p
_id=9739
Olusanya, B. (2001). Early detection of hearing impairment in a developing country: What
options? Audiology, 40(3), 141-147.
Olusanya, B. O., Neumann, K. J., & Saunders, J. E. (2014). The global burden of disabling
hearing impairment: a call to action. Bulletin of the World Health Organization, 92(5),
367-373.
Peer, S., & Fagan, J. (2015). Hearing loss in the developing world: evaluating the iPhone mobile
device as a screening tool. South African Medical Journal, 105(1), 35-39.
Pereira, O., Pasko, L. E., Supinski, J., Hammond, M., Morlet, T., & Nagao, K. (2018). Is there a
clinical application for tablet-based automated audiometry in children? International
Journal of Pediatric Otorhinolaryngology, 110, 87-92.
Picard, M., Ilecki, H. J., & Baxter, J. D. (1993). Clinical Use of BOBCAT: testing reliability
and validity of computerized pure-tone audiometry with noise-exposed workers, children
and the aged. International Journal of Audiology, 32(1), 55-67.
Pickens, A. W., Robertson, L. D., Smith, M., Zhao, H., Mehta, R., & Song, S. (2017).
Limitations of a mobile hearing test application. The Hearing Journal, 70(6), 34-37.
Pickens, A., Robertson, L., Smith, M., Zheng, Q., Mehta, R., & Song, S. (2018). Headphone
evaluation for app-based automated mobile hearing screening. International Archives of
Otorhinolaryngology, 22(04), 358-363.

115
Ramkumar, V., Hall, J. W., Nagarajan, R., Shankarnarayan, C. V., & Kumaravelu, S. (2013).
Tele-ABR using a satellite connection in a mobile van for newborn hearing testing.
Journal of Telemedicine and Telecare, 19, 233–237.
Reason, J. (1990). Human Error. Cambridge: Cambridge University Press.
Rourke, R., Kong, D., & Bromwich, M. (2016). Tablet audiometry in Canada’s north: A
portable and efficient method for hearing screening. Otolaryngology–Head and Neck
Surgery, 155(3), 473–478.
Ruben, R. (2000). Redefining the survival of the fittest: communication disorders in the 21st
Century. Laryngoscope, 11, 241-245.
Samelli, A. G., Rabelo, C. M., Sanches, S. G., Aquino, C. P., & Gonzaga, D. (2017). Tablet-
based hearing screening test. Telemedicine and e-Health, 23(9), 747-752.
Sandstrom, J., Swanepoel, D. W., Myburgh, H. C., & Laurent, C. (2016). Smartphone threshold
audiometry in underserved primary health-care contexts. International Journal of
Audiology, 55(4), 232-238.
Sauro, J., & Lewis, J. R. (2012). Quantifying the User Experience: Practical Statistics for User
Research. Burlington, MA: Morgan Kaufmann.
Selden, T. M. (2006). Compliance with well-child visit recommendations: Evidence from the
medical expenditure panel survey, 2000-2002. Pediatrics, 118(6).
Shah, S. G., & Robinson, I. (2007). Benefits of and barriers to involving users in medical device
technology development and evaluation. International Journal of Technology
Assessment in Health Care, 23(1), 131-137.

116
Śliwa, L., Hatzopoulos, S., Kochanek, K., Piłka, A., Senderski, A., & Skarżyński, P. (2011). A
comparison of audiometric and objective methods in hearing screening of school
children. A preliminary study. International Journal of Pediatric
Otorhinolaryngology, 75(4), 483-488.
Smits, C., Kapteyn, T. S., & Houtgast, T. (2004). Development and validation of an automatic
speech-in-noise screening test by telephone. International Journal of Audiology, 43(1),
15-28.
Smull, C. C., Madsen, B., & Margolis, R. H. (2018). Evaluation of two circumaural earphones
for audiometry. Ear and Hearing, 40(1), 177-183.
StataCorp. (2011). Stata Statistical Software: Release 12. College Station, TX: StataCorp LP.
Stelmachowicz, P. G., Pittman, A. L., Hoover, B. M., Lewis, D. E., & Moeller, M. P. (2004).
The importance of high-frequency audibility in the speech and language development of
children with hearing loss. Archives of Otolaryngology–Head & Neck Surgery, 130(5),
556.
Swanepoel, D. W., & Biagio, L. (2011). Validity of diagnostic computer-based air and forehead
bone conduction audiometry. Journal of Occupational and Environmental
Hygiene, 8(4), 210-214.
Swanepoel, D. W., Matthysen, C., Eikelboom, R. H., Clark, J. L., & Hall, J. W. (2015). Pure
tone audiometry outside a sound booth using earphone attenuation, integrated noise
monitoring and automation. International Journal of Audiology, 54(11), 777-785.

117
Swanepoel, D. W., Myburgh, H. C., Howe, D. M., Mahomed, F., & Eikelboom, R. H. (2014).
Smartphone hearing screening with integrated quality control and data
management. International Journal of Audiology, 53(12), 841-849.
Swanepoel, D. W. (2017). Smartphone-based national hearing test launched in South
Africa. The Hearing Journal, 70(1), 14-16.
Szudek, J., Ostevik, A., Dziegielewski, P., Robinson-Anagor, J., Gomaa, N., & Et al. (2012).
Can u hear me? Validation of an iPod-based hearing loss screening test. Journal of
Otolaryngology-Head & Neck Surgery, 41, S78-S84.
Theunissen, M., & Swanepoel, D. (2008). Early hearing detection and intervention services in
the public health sector in South Africa. International Journal of Audiology, 47(sup1),
S23-S29.
Thompson, G. P., Sladen, D. P., Hughes Borst, B. J., & Still, O. L. (2015). Accuracy of a tablet
audiometer for measuring behavioral hearing thresholds in a clinical
population. Otolaryngology–Head and Neck Surgery, 153(5), 838-842.
United States Federal Trade Commission. (2016, April 7). Mobile Health Apps Interactive Tool.
Retrieved April 2 2019, from https://www.ftc.gov/tips-advice/business-
center/guidance/mobile-health-apps-interactive-tool
United States Food & Drug Administration. (2018, September 4). Mobile Medical Applications.
Retrieved April 2 2019, from
https://www.fda.gov/medicaldevices/digitalhealth/mobilemedicalapplications/default.ht
m#f

118
Van der Aerschot, M., Swanepoel, D. W., Mahomed-Asmail, F., Myburgh, H. C., &
Eikelboom, R. H. (2016). Affordable headphones for accessible screening audiometry:
An evaluation of the Sennheiser HD202 II supra-aural headphone. International Journal
of Audiology, 55(11), 616-622.
Van Tonder, J., Swanepoel, D. W., Mahomed-Asmail, F., Myburgh, H., & Eikelboom, R. H.
(2017). Automated smartphone threshold audiometry: Validity and time
efficiency. Journal of the American Academy of Audiology, 28(3), 200-208.
Virzi, R. A. (1992). Refining the test phase of usability evaluation: how many subjects is
enough? Human Factors: The Journal of the Human Factors and Ergonomics
Society, 34(4), 457-468.
Visagie, A., Swanepoel, D. W., & Eikelboom, R. H. (2015). Accuracy of remote hearing
assessment in a rural community. Telemedicine and e-Health, 21(11), 930-937.
Windmill, I. M., & Freeman, B. A. (2013). Demand for audiology services: 30-Yr projections
and impact on academic programs. Journal of the American Academy of
Audiology, 24(5), 407-416.
World Health Organization. (2019). Deafness and hearing loss. Retrieved January 18 2019,
from http://www.who.int/mediacentre/factsheets/fs300/en
World Health Organization. (2017). Global costs of unaddressed hearing loss and cost-
effectiveness of interventions. World Health Organization Report.
Yao, J., Yao, D., & Givens, G. (2015). A browser-server–based tele-audiology system that
supports multiple hearing test modalities. Telemedicine and e-Health, 21(9), 697-704.
119
Yueh, B., Shapiro, N., MacLean, C. H., & Shekelle, P. G. (2003). Screening and management of
adult hearing loss in primary care. Journal of the American Medical
Association, 289(15), 1976.
Yeung, J. C., Heley, S., Beauregard, Y., Champagne, S., & Bromwich, M. A. (2015). Self-
administered hearing loss screening using an interactive, tablet play audiometer with ear
bud headphones. International Journal of Pediatric
Otorhinolaryngology, 798201512481252(8), 1248-1252.
Yeung, J., Javidnia, H., Heley, S., Beauregard, Y., Champagne, S., & Bromwich, M. (2013).
The new age of play audiometry: prospective validation testing of an iPad-based play
audiometer. Otolaryngology-Head and Neck Surgery, 42(21).


