Download - A Bright Future for the Heartland

July 2011
Union of Concerned Scientists
A Bright Future for the Heartland
Powering the Midwest Economy with Clean Energy
CLAUDIO MARTINEZ
JEFF DEYETTE
SANDRA SATTLER
ANNE MCKIBBIN
1
© 2011 Union of Concerned Scientists
All rights reserved. Printed in the United States of America
Claudio Martinez is an energy and risk analyst with the Union of Concerned Scientists Climate
and Energy Program.
Jeff Deyette is a senior energy analyst and assistant director of energy research and analysis
with the Union of Concerned Scientists Climate and Energy Program.
Sandra Sattler is an energy modeler with the Union of Concerned Scientists Climate and Energy
Program.
Anne McKibbin is a policy director with the CNT Energy.
The Union of Concerned Scientists (UCS) is the leading science-based nonprofit working for a
healthy environment and a safer world.
More information about the Union of Concerned Scientists is available on the UCS website at
www.ucsusa.org.
The full text of this report and additional technical appendices are available on the UCS website
(www.ucsusa.org/abrightfuture) or may be obtained from:
UCS Publications
2 Brattle Square
Cambridge, MA 02238-9105
Or, email [email protected] or call (617) 547-5552.
Front cover photo: © iStockphoto.com/Denise Kappa

2
Contents
Acknowledgments .......................................................................................................................... 4
Chapter 1. Vision for a Clean Electricity Future in the Midwest ........................................ 5
The Energy Roadmap of the Midwestern Governors Association ........................................ 7
The MGA Targets Create Jobs, Save Consumers Money, and Cut Climate Change
Emissions .................................................................................................................................... 7
Chapter 2. Opportunities and Challenges for Renewable Energy, Energy Efficiency, and
Other Low-Carbon Technologies in the Midwest ...................................................................... 9
Renewable Energy Technologies and Their Potential in the Midwest ............................... 10
Wind Power .......................................................................................................................... 11
Biopower ............................................................................................................................... 16
Solar Power .......................................................................................................................... 23
Distributed Energy and Combined Heat and Power ....................................................... 23
Transmission and Other Infrastructure Challenges ........................................................ 24
Energy Efficiency Technologies and Their Potential in the Midwest ................................. 26
Potential for Greater Energy Efficiency in the Midwest ................................................. 27
Key Challenges for Energy Efficiency in the Midwest ..................................................... 28
Other Non-Renewable Low-Carbon Technologies ............................................................... 29
Carbon Capture and Sequestration ................................................................................... 29
Nuclear Power Plants .......................................................................................................... 30
Potential Impact of Electric Vehicles ................................................................................. 31
Chapter 3. Our Modeling Approach ..................................................................................... 33
Energy Efficiency Analysis ..................................................................................................... 34
Jobs Analysis ............................................................................................................................ 35
Analysis of the Biomass Supply Curve .................................................................................. 35
3
Scenarios................................................................................................................................... 36
Base Cases ............................................................................................................................ 36
Policy Cases .......................................................................................................................... 36
Key Technology Assumptions ................................................................................................ 38
Limitations, Uncertainties, and Opportunities for Future Research .................................. 40
Chapter 4. Results: Implementing the Energy Roadmap Targets ..................................... 44
Detailed Results: Core Policy Case ........................................................................................ 45
Changes in the Electricity Mix ........................................................................................... 45
Changes in Consumer Energy Prices and Bills ................................................................. 50
Job Creation and Other Economic Development Benefits .............................................. 51
Reducing CO2 Emissions .................................................................................................... 54
Detailed Results: Alternative Technology Pathway ............................................................. 54
Impact of a Federal Carbon Policy on the Midwest and the Energy Roadmap ............... 57
Chapter 5. Policy Recommendations: Setting a Course for a Midwest Clean Energy
Future ............................................................................................................................... 60
Key Policies for Cleaner Electricity ....................................................................................... 60
Key Policies for Energy Efficiency ......................................................................................... 63
A Comprehensive Federal Policy for Reducing Carbon Emissions .................................... 65
Conclusion: A Vision for a Midwest Clean Electricity Future ............................................ 66
References ............................................................................................................................... 68

4
Acknowledgments
This report was made possible in part through the generous support of The Joyce
Foundation, The Energy Foundation, RE-AMP, The Oak Foundation, and The Leighty
Foundation.
This report was also made possible thanks to collaboration from Wind on the Wires and
the Midwest Energy Efficiency Alliance.
We would like to thank the following individuals for their insightful comments on our
draft report:
Jessica Collinsworth, Kevin K. Cullather, Laurie T. Johnson, Allison Hannon,
Madhu Khanna, Martin Kushler, Michael Livermore, Michael Noble, Stacey
Paradis, Elizabeth F. Pienaar, Steven G. Pueppke, Walter Short, and Erin Stojan-
Ruccolo
The authors would also like to thank UCS staff members for their helpful contributions,
including Don Anair, Rachel Cleetus, Steve Frenkel, Jim Kliesch, LuCinda Hohmann,
Alan Nogee, and Ellen Vancko.
We give special thanks to Steve Clemmer for his significant analytic support, technical
contributions, and general guidance, and to Ethan Davis for his work on the report’s
biomass section.
We thank Sandra Hackman for making the report more readable, and Bryan Wadsworth
for overseeing its production.
The opinions and information expressed herein are the sole responsibility of the authors.

5
Chapter 1. Vision for a Clean Electricity Future in the Midwest
From the manufacturing centers, to the corn and soybean fields, to the major finance
hubs, to the leading research universities, Midwest states have long served as an
economic engine for the United States. Yet the region is still struggling to fully recover
from a recession that has made it difficult for families to pay bills and for businesses to
prosper and sustain job growth.
At the same time, the Midwest’s energy system is not sustainable. The region’s electricity
supply is dominated by coal—largely imported from outside the region—which poses
serious risks to public health and the environment, and leaves consumers vulnerable to
price increases.
Practical and affordable solutions are available to help revitalize the Midwest economy
and ensure a clean, safe, and reliable power supply. Energy efficiency technologies and
renewable electricity resources, such as wind, biopower, and solar, offer a smart and
responsible transition away from polluting fossil fuels to the new innovation-based
economy of the twenty-first century. Investing in a clean energy economy can help spur
entrepreneurship, create jobs, and keep the Midwest globally competitive, while enabling
it to move toward greater energy independence and conserve resources for future
generations.
The threat of rapid climate change adds urgency to this transition. Climate change is
driven primarily by a buildup in the atmosphere of heat-trapping emissions from burning
fossil fuels and other human activities. Failure to reduce these emissions will have
significant consequences for the Midwest, including scorching summers, dangerous
storms, more severe flooding, and greater stress on agriculture (Hayhoe et al. 2009). The
Midwest is one of the biggest U.S. contributors to global warming pollution, with just 22
percent of the nation’s population accounting for 27 percent of its heat-trapping
emissions (Mackun and Wilson 2011; World Resources Institute 2011).1
Fortunately, the region is home to some of the best renewable resources in the world,
particularly wind and biomass. It also has a world-class manufacturing base and a skilled
labor force that can support and benefit from the deployment of renewable energy and
energy efficiency technologies. This gives the Midwest the unique ability to turn a
challenge into an opportunity to spur economic growth and become a leader in the clean
energy sector while reducing global warming emissions.
1 This total for the Midwest includes the nine states that we included in our analysis (Illinois, Indiana, Iowa, Michigan,
Minnesota, North Dakota, Ohio, South Dakota, and Wisconsin), plus Kansas, Nebraska, and Missouri, which are often included in definitions of the Midwest. The nine states included in our analysis account for 22 percent of total U.S. global warming emissions, and 4 percent of the world total. These states are part of the two independent transmission system operators in the Midwest: the Midwest Independent System Operator (Midwest ISO) and PJM. Unless otherwise noted, throughout this report “Midwest” means these states.

6
Midwest states can and must accomplish the transition to a robust and clean energy
economy. A Bright Future for the Heartland focuses on the electricity sector, and
assesses the economic and technological feasibility of achieving the recommendations of
the Midwestern Governors Association (MGA), a collaboration of 10 states working on
key public policy issues (Figure 1.1). The MGA’s targets include reducing electricity use
by 2 percent annually by 2015 and thereafter, and supplying 30 percent of the region’s
electricity from renewable sources by 2030 (MGA 2009).
The Union of Concerned Scientists (UCS) focused on the nine Midwest states—Illinois,
Indiana, Iowa, Michigan, Minnesota, North Dakota, Ohio, South Dakota and
Wisconsin—covered by the Midwest ISO and PJM, the region’s two independent
transmission system operators. We analyzed electricity use and trends in the region, as
well as energy technologies, policy initiatives, and sources of emissions, to develop a
comprehensive course of action for affordably and effectively meeting the MGA goals. A
Figure 1.1. States Participating in the Midwestern Governors Association
The Midwestern Governors Association (MGA) is a collaboration of 10 states working
on key public policy issues. The MGA’s Energy Roadmap targets include reducing
electricity use by 2 percent annually by 2015 and thereafter, and supplying 30
percent of the region’s electricity from renewable sources by 2030.

7
Bright Future for the Heartland provides a path for reducing dependence on fossil fuels
from the electricity sector, revitalizing local and regional economies, and cutting heat-
trapping emissions and other pollutants.
The Energy Roadmap of the Midwestern Governors Association
In 2009, an MGA Advisory Group released the Midwestern Energy Security and Climate
Stewardship Roadmap (Energy Roadmap), which recommends targets for renewable
energy and energy efficiency for the region’s electricity system (MGA 2009):
• Midwest utilities will rely on wind, biopower, solar, and other renewable
energy sources to generate 10 percent of their electricity by 2015, and 30
percent by 2030.
• Retail power providers will rely on improvements in energy efficiency to
reduce annual sales of electricity by at least 2 percent annually by 2015 and
thereafter.
Our analysis focuses on these two high-priority recommendations, which we model as a
renewable electricity standard (RES) and an energy efficiency resource standard (EERS).
An RES is a flexible, market-based policy that requires electricity providers to gradually
increase the amount of renewable energy used to produce the power they supply. An
EERS similarly requires utilities to meet specific annual targets for reducing the use of
electricity. While the region will need other policies to overcome specific market barriers
to clean energy, the RES and EERS have proven to be effective and popular tools for
advancing renewable energy and energy efficiency at the state level. As of April 2011,
eight Midwest states had adopted an RES (among 29 states nationwide, plus Washington,
DC). Five of those states also have an EERS (among 26 states nationwide). However,
while these are important steps, most Midwest states must go further to reach the targets
established by the Energy Roadmap.
Many of the region’s governors are newly elected, and therefore did not help develop
those targets. However, a diverse group of bipartisan stakeholders crafted them to address
the serious risks to public health and the environment of the region’s existing power
system.
The MGA Targets Create Jobs, Save Consumers Money, and Cut Climate
Change Emissions
We used a dynamic energy forecasting model to examine the effects of the renewable
energy and energy efficiency targets in the Energy Roadmap on the Midwest economy
and environment through 2030.2 We modeled several scenarios to analyze how to meet
the targets under a range of conditions and available technologies. Our findings show that
investing in clean energy is a smart and responsible course that will help Midwest
revitalize their economies while leaving future generations with a clean, reliable, and
sustainable power supply.

8
Meeting the MGA’s renewable energy and energy efficiency targets would spur
innovation, inject capital into the regional economy, and create tens of thousands of jobs
in big cities, small towns, and rural communities across the Midwest. Cuts in power use
and downward pressure on electricity prices stemming from gains in energy efficiency
and competition from renewables would provide families and businesses much-needed
savings on energy bills. Tapping the Midwest’s wealth of wind, biopower, solar, and
efficiency resources would diversify the power supply, making it more reliable and
secure. That path would also move the region away from its overdependence on coal,
which would improve public health and reduce the dangers of global warming.
While this report focuses on the transition to a low-carbon electricity sector, it does not
include every step the Midwest must take to address climate change. That will require the
participation and cooperation of local, state, regional, federal, and international leaders.
Under such a partnership, state and regional leaders can push for comprehensive federal
legislation while also enacting policies that can reduce emissions and spur innovation and
clean energy economic development in the Midwest.
Chapter 2 explores major renewable energy and energy efficiency solutions available
today, identifying their potential, challenges in reaching widespread use, and the policy
approaches that can help overcome those challenges. Chapter 3 explains our modeling
approach and major assumptions. Chapter 4 presents the overall results of our analysis,
and Chapter 5 provides recommendations to policy makers and other stakeholders.
Our report also includes fact sheets showing key findings for each state, as well as a
Technical Appendix that allows readers to delve more deeply into our methods,
assumptions, and results. All materials are available online at
www.ucsusa.org/brightfuture.

9
Chapter 2. Opportunities and Challenges for Renewable Energy,
Energy Efficiency, and Other Low-Carbon Technologies in the
Midwest
Coal now dominates the Midwest power supply, accounting for 68 percent of the region’s
electricity generation (Figure 2.1). Midwest states depend far more on coal than the
nation as a whole—about 45 percent of U.S. electricity comes from this polluting fossil
fuel—and the region must import much of its coal supply.
In 2008, Midwest states imported 190 million tons of coal from outside of the region—63
percent of their total coal use—at a cost of $7.5 billion. Every state in the Midwest was a
net importer of coal that year, and seven states had to import all or nearly all the coal
their power plants burned (Deyette and Freese 2010). Coal-burning power plants in the
Midwest are the single-largest source of carbon emissions in the region: they account for
Figure 2.1. Sources of Midwest Electricity, 2009
Most of the electricity in the Midwest comes from coal, the majority of which is imported
from outside the region.
Source: EIA 2010c. Note: Includes electricity generated in the Midwest that serves other regions.

10
44 percent of the region’s emissions, and 10 percent of total U.S. carbon emissions (EIA
2010a).
Midwest states could greatly reduce their reliance on coal to generate electricity by
moving to renewable resources such as wind, sustainable forms of biopower, and solar.
These homegrown energy sources are widely available in the Midwest, and ready to be
deployed today. They are also increasingly cost-effective for producing electricity
(Freese et al. 2011; Goossens 2011), and they create jobs while reducing pollution (UCS
2009b).
Midwest states also have the potential to reduce electricity use by improving the energy
efficiency of their buildings and industries (Stratton and York 2009). This chapter
describes the current status and future prospects for using local renewable energy and
energy efficiency to provide a growing share of the Midwest’s electricity needs.
Renewable Energy Technologies and Their Potential in the Midwest
The Midwest is rich in renewable energy resources. Wind, solar, and biopower together
have the technical potential to generate more than 18 times the amount of electricity the
Midwest needs today.3
Economic, physical, and environmental limitations mean that not all of that potential can
be tapped. Issues such as potential land-use conflicts; the higher short-term costs of some
resources; constraints on ramping up their use, such as limits on transmission capacity;
barriers to public acceptance; and other hurdles place limits on how much of this resource
the Midwest can tap over the short and medium term. However, after accounting for
many of these factors in our analysis, we find that renewable energy can provide a
significant share of the Midwest’s current and future electricity needs.
More than 20 comprehensive analyses over the past decade have found that using
renewable sources to provide at least 25 percent of U.S. electricity needs is both
achievable and affordable (Nogee, Deyette, and Clemmer 2007). For example, a 2009
UCS analysis—using a modified version of the model we used in this study—found that
a national renewable electricity standard of 25 percent would lower electricity and natural
gas bills a cumulative $15.2 billion in the Midwest by 2025, by reducing demand for
fossil fuels and increasing competition among power producers (UCS 2009b).
A 2010 UCS analysis examining how the United States could reduce heat-trapping
emissions by 80 percent by 2050 found that renewable energy could affordably and
reliably supply 40 percent of the U.S. electricity mix by 2030—after reductions in energy
demand stemming from energy efficiency and the use of combined-heat-and-power
systems (Cleetus, Clemmer, and Friedman 2009). Other analyses have found that
3 Electricity use in the Midwest in 2009 totaled 678 billion kilowatt-hours (kWh). The Department of Energy estimates
Midwest wind resource potential at 12,000 billion kWh (NREL 2010). UCS estimates regional biomass potential at 190 billion kWh (see the Technical Appendix for sources and methodology). An analysis of solar photovoltaics that considered only viable rooftop locations put available Midwest potential at more than 97 gigawatts (Paidipati et al. 2008)—enough to generate 120 billion kWh with today’s technology (assuming 13.5 percent efficiency per module and a capacity factor of 14 percent).

11
expanding the share of renewable energy in the Midwest in line with the Energy
Roadmap targets is feasible (ELPC 2001). In many of these analyses, Midwest states
were key in deploying the renewable energy capacity needed to achieve those goals.
Wind Power
Wind turbines convert the force of moving air into electricity using lift to turn the blades.
Wind power is one of the world’s fastest-growing sources of electricity, having expanded
by about 30 percent per year, on average, over the past decade (GWEC 2010). In the
United States, developers added wind capacity at an average annual growth rate of 35
percent from 2005 to 2010, installing five times as much capacity during that period as in
the previous 25 years.
By the end of 2010, wind installations with more than 40,000 megawatts (MW) of
capacity were producing power in 38 states. More than one-third of that capacity (13,800
MW) is in the Midwest, where it provides enough electricity to power the equivalent of
more than 3 million homes (AWEA 2011a). Nine of the 12 Midwest states rank in the top
20 nationwide for installed wind capacity (AWEA 2011c).4
Wind power has become one of the more cost-effective sources of electricity in the
United States. The up-front costs of wind power are typically higher than those of
conventional sources of electricity. However, low maintenance costs compared with most
other power sources—and a lack of fuel costs—mean that the price of wind power while
it is operating is relatively low and stable.
Technological advances and growing economies of scale have driven down wind costs by
about 80 percent over the last three decades. U.S. prices for wind turbines did begin to
rise in 2005 owing to global demand, higher costs for materials, and a weak U.S. dollar
(Wiser and Bolinger 2010). However, the U.S. Department of Energy (DOE) found that
prices for wind were roughly competitive with the overall cost of wholesale electricity
from 2003 to 2009. In 2009, that cost was about 4.5 cents per kWh (Wiser and Bolinger
2010).5
Today the cost of wind turbines is once again declining, and as the nation’s economy
recovers, experts project that wind at good sites will continue to compete as a low-cost
power option (Wiser and Bolinger 2010). Natural gas prices have declined sharply in the
last two years, because of new technologies to extract gas from shale rock, reducing the
economic competitiveness of wind in some locations. 6
However, in the long-term, the
4 While developers have sited all U.S. wind projects on land through 2010, there has been some interest in developing
offshore wind along the Eastern Seaboard and in the Great Lakes. However, the availability of low-cost wind on land, particularly in the Midwest, as well as uncertainty around several factors, including siting and permitting, has slowed U.S. progress (Wiser and Bolinger 2010). In the Midwest, at least one proposal—a 20-MW project on Lake Erie near Cleveland, Ohio, is moving forward (Gallucci 2011). 5 This cumulative capacity-weighted average price for wind power reflects the bundled price of electricity and
renewable energy tax credits, including available state and federal incentives, as sold by project owners under a power purchase agreement. The average price includes price data for 180 wind projects installed from 1998 to 2009. 6 The average annual U.S. price for electricity from natural gas dropped from $9.36 per thousand cubic feet in 2008 to
$5.26 per thousand cubic feet in 2010 (EIA 2011b).

12
price stability of wind can allow utilities and their customers to hedge the price volatility
associated with natural gas and other fossil fuels (Bolinger, Wiser, and Golove 2002).
Economic Benefits
Beyond its cost-competitiveness, wind power offers significant economic benefits for big
cities and rural communities. For example, the wind industry has been a job creator even
amid the recent struggles of the U.S. economy. According to the American Wind Energy
Association, the industry employed roughly 85,000 full-time workers at the end of
2009—up from 35,000 in 2007. Those jobs included more than 18,000 in manufacturing,
and many others in project development, construction, operations, maintenance, and
financial, legal, and consulting services. In 2009, Midwest states had 30,000 to 50,000
jobs in the wind industry (AWEA 2011c).
As the U.S. wind industry grows, Midwest states can see continued job growth in wind
equipment manufacturing. A single large-scale wind turbine includes more than 8,000
parts, ranging from small mechanical, structural, and electrical pieces to large
components such as blades, towers, and gearboxes. A growing percentage of the cost of
this equipment is being built domestically: about 60 percent in 2009, up from less than 20
percent in 2006 (Figure 2.2) (Wiser and Bolinger 2010). Total U.S. investment power
project installation grew from $3.8 billion to $20 billion during that period (Wiser and
Figure 2.2. Imports of Wind Power Equipment as a Fraction of Total Turbine Cost
U.S. investment in wind has increased over the last few years, and a growing
percentage of the cost of this equipment is being built domestically.
Source: NREL 2009.
13
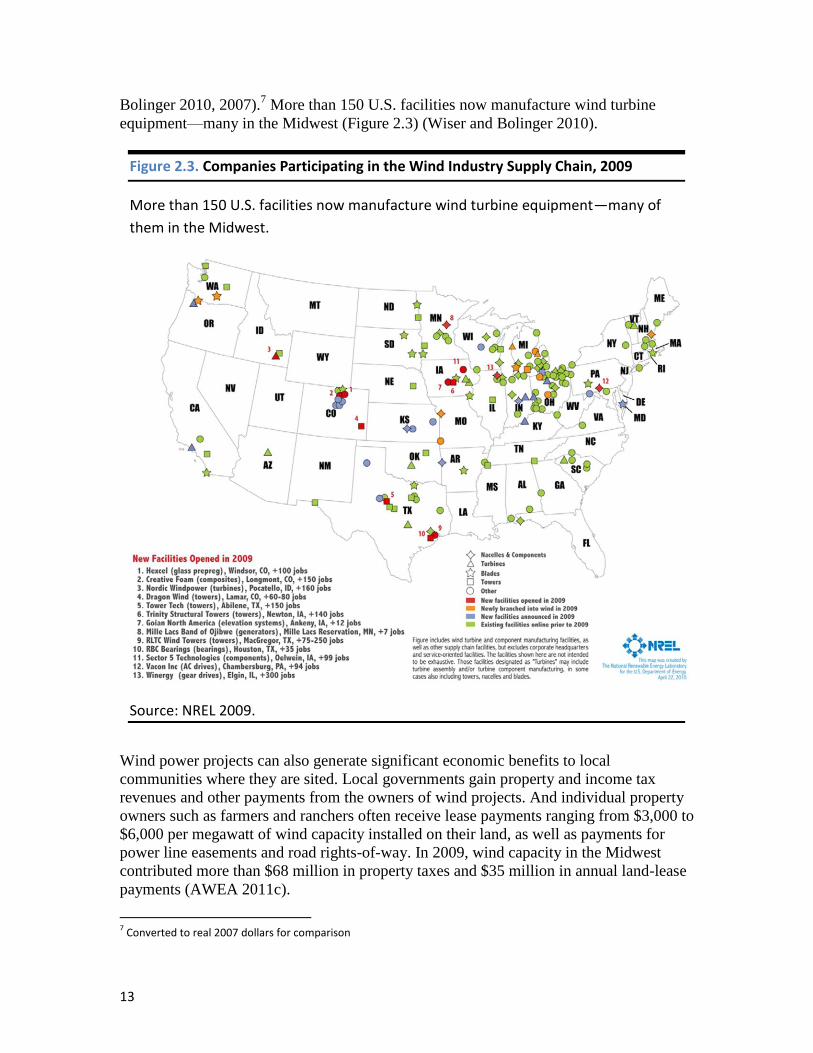
Bolinger 2010, 2007).7 More than 150 U.S. facilities now manufacture wind turbine
equipment—many in the Midwest (Figure 2.3) (Wiser and Bolinger 2010).
Wind power projects can also generate significant economic benefits to local
communities where they are sited. Local governments gain property and income tax
revenues and other payments from the owners of wind projects. And individual property
owners such as farmers and ranchers often receive lease payments ranging from $3,000 to
$6,000 per megawatt of wind capacity installed on their land, as well as payments for
power line easements and road rights-of-way. In 2009, wind capacity in the Midwest
contributed more than $68 million in property taxes and $35 million in annual land-lease
payments (AWEA 2011c).
7 Converted to real 2007 dollars for comparison
Figure 2.3. Companies Participating in the Wind Industry Supply Chain, 2009
More than 150 U.S. facilities now manufacture wind turbine equipment—many of
them in the Midwest.
Source: NREL 2009.

14
Property owners may also earn production royalties based on a project’s annual revenues.
And landowners and other rural residents are increasingly becoming wind power owners
and developers themselves, in an effort to maximize the investments and economic
benefits that stay within the local community. Regardless of their form, these payments
can provide a stable supplement to farmers’ income, helping to offset swings in
commodity prices (GAO 2004).
Key Challenges for Wind Power
Wind power has the potential to play a major role in meeting the renewable energy
targets of the Energy Roadmap and helping the Midwest transition to a clean energy
economy. To fully achieve that potential, several key challenges need to be addressed,
including developing fair rules for siting wind facilities, addressing concerns about
wind’s effects on wildlife, integrating wind into the power grid, expanding the
transmission system, and improving access to transmission (explored in Chapter 3).
Siting
As with any large project, the permitting process for siting a new wind power facility
should review its impact on the local environment, community, economy, and public
safety. The process should be transparent, taking into account the interests and rights of
all stakeholders.
The process should also be consistent with permitting processes for comparable projects.
Often, however, the process for obtaining the required approvals for wind power projects
can be overly complex, costly, burdensome, and time consuming, which can deter
investors and prevent high-quality projects from moving forward. Jurisdiction over the
siting of energy facilities also varies greatly from state to state, in some cases involving
numerous agencies in multiple levels of government.
Efforts are under way to streamline the approval process for wind energy and improve
cooperation between local, state, and federal agencies while ensuring responsible
development. In the meantime, wind developers must also take responsibility for being
―good neighbors‖ when they seek to build in a community. State governments should
also play an active role in ensuring that projects take into account the latest research on
the technology and its impact on neighbors, and that best practices become the norm.
Wildlife
A wind project’s ability to produce electricity without creating air or water pollution or
global warming emissions offers significant benefits to the natural world, especially when
compared with the use of fossil fuel. However, like all energy sources, wind power can
have local effects on birds, bats, and other wildlife.
A recent review by the National Wind Coordinating Collaborative (NWCC) of peer-
reviewed research found evidence of bird and bat deaths from collisions with wind
towers, as well as habitat loss and disruption (NWCC 2010). Bats can also be killed by
barotrauma, a phenomenon caused by rapid pressure changes as they fly close to turning
blades. However, the NWCC concluded that the impact on birds and bats is relatively
modest at the vast majority of locations, and does not pose a threat to species populations.

15
Over the last several decades, the wind industry has made great strides in reducing its
impact on wildlife thanks to better research, technological advances, and lessons learned
in siting. To help wind developers site and maintain wind farms with minimal impact on
wildlife, the American Wind Wildlife Institute funds research on risk assessment and
mitigation, and communicates significant advances. An advisory committee created by
the U.S. Fish and Wildlife Service, composed of representatives from industry, state and
tribal governments, and nonprofit organizations, has published recommendations for
land-based wind projects, including a multistage decision-making framework for
developers (FWS 2010).
Integrating Wind into the Power Grid
Wind power can play a substantial role in providing reliable electric service to
consumers. The fact that the wind does not blow all the time does pose some challenges
to integrating this source of power into the electricity grid, but they are not
insurmountable.
Operators of our nation’s electricity grid must continually adjust to changing consumer
demand, ramping power plants up and down and varying their output as electricity use
rises and falls. Operators always need to keep power plants in reserve to meet unexpected
surges or drops in demand, as well as to respond to power plant outages and downed
power lines.
Wind energy adds to the variability of electricity supply, but it can be well integrated
through careful and effective management of power reserves. New tools are helping to
improve that process. For example, significant improvements in short-term forecasting
allow grid operators to plan more accurately for the availability of wind power. Most
newer wind projects also use sophisticated electronic controls that allow operators to
continually adjust their output, giving them greater flexibility to respond to changing
events elsewhere in the power system.
Distributing wind turbines across a broad geographic area can also help smooth out the
variability of the resource. While the variability of wind generation may be significant at
a single wind turbine, each turbine is in a different location, and receives a different
amount of wind at different times. As the number of interconnected wind turbines
grows—first within a wind farm, and then across the regional transmission grid—
variability diminishes.
The costs of integrating wind energy into the electric grid are manageable. Extensive
engineering studies by U.S. utilities, and actual operating experience, show that the costs
of integrating wind increase along with its share of the electricity mix. However, even at
20 percent penetration, integration costs add 10 percent or less of the wholesale cost of
wind generation (EERE 2008).
Our economic analysis includes those costs. However, because wind power has low
operating costs given that there is no fuel to purchase, it can reduce the overall costs of
operating the power system by displacing output from more expensive units. Our model
accounts for this by ensuring that there is enough capacity to meet minimum reliability
requirements in each electricity supply region.

16
Many utilities are already showing that wind can make a significant contribution to their
electricity supply without reliability problems. Xcel Energy, which serves nearly 3.5
million customers in eight states, now obtains 11 percent of its electricity from wind, and
plans to increase that amount to about 20 percent by 2020.
In 2009, installed wind capacity in Iowa generated 19.7 percent of the electricity used in
the state, on average. Three other Midwest states also rely on wind to generate more than
10 percent of their power: South Dakota (13.3 percent), North Dakota (11.9 percent), and
Minnesota (10.7 percent) (Wiser and Bolinger 2010).
Promising developments in the technology for storing electric power could also improve
the reliability of wind power, though there is plenty of room to greatly expand wind use
without storage for at least the next few decades (EERE 2008).
Biopower
Biomass—plant material and animal manure—is the oldest source of renewable energy:
humans have been burning it to make heat ever since we first learned how to build fire.
Until recently, biomass has also supplied far more renewable electricity—or biopower—
than wind and solar power combined (EIA 2008). With careful management, biomass
could supply a growing share of the region’s electricity. The Midwest is particularly rich
in biomass resources, making it the region’s most abundant renewable energy resource
after wind (Figure 2.4).
Our analysis considers a wide variety of biopower resources. These include biomass
residues from forests, crops, and urban areas; unused mill residues; and landfill gas,
which is mostly methane from decomposing organic matter. We also include crops grown
primarily for use in producing energy, such as fast-growing poplars and native grasses
(switchgrass, for example).
These resources can be used for large-scale production of electricity based on several
technologies: power plants that run solely on biomass; coal plants that co-fire biomass
along with coal; and combined heat and power (CHP), which use biomass to produce
both electricity and steam. We assume that electricity production from landfill gas—a
cost-effective but limited resource in the Midwest—is eligible to meet the Energy
Roadmap targets (EPA 2010).8
8 The EPA estimates the potential of landfill gas in the Midwest at about 250 MW, which would generate less than 2
billion kilowatt-hours of electricity per year (EPA 2010).

17
Investments in biomass co-firing are relatively small compared with those of dedicated
biomass plants, because the technology uses much of the existing infrastructure at coal
plants. Plants with co-firing capability can also take advantage of fuel flexibility to better
deal with variability in the supply and price of both coal and biomass. The economics of
electricity production at CHP plants in the biofuels industry are also attractive because
they can burn biomass that is unused or a byproduct of biofuel production, and can make
efficient use of waste heat from the electricity production process.
Biomass supplied more than 1,500 megawatts of generating capacity in the Midwest in
2009. That capacity produced about 0.9 percent of the region’s electricity, and accounted
for more than 25 percent of the non-hydro renewable energy supply. The growth of
biopower will depend on the availability of biomass resources; land-use and harvesting
practices; and the amount of biomass used to make fuel for transportation and other uses.
Figure 2.4. Potential Biomass Resources for Producing Power in the Midwest, 2025
The Midwest has vast potential to use biomass resources in energy production—mostly
agricultural residues and energy crops, owing to its large agricultural base.
Note: See the technical appendix for sources and details on how we developed our biomass supply curves.
18
Analysts have produced widely varying estimates of the potential for electricity from
biomass. For example, a 2005 DOE study found that the nation has the technical potential
to produce more than 1 billion tons of biomass for energy use (Perlack et al. 2005). In a
study of implementing a 25 percent renewable electricity standard by 2025, the Energy
Information Agency (EIA) found that biomass could supply 12 percent of the nation’s
electricity needs by 2025 (EIA 2007). That study assumed that 598 million tons of
biomass would be available, with 40 percent of that amount from the Midwest.
Our analysis assumes that 367 million tons of biomass would be available nationally to
produce both electricity and biofuels—with 47 percent of that amount from the Midwest.
This estimate includes limits for removal rates for crop residues to prevent increased soil
erosion and loss of soil carbon, and for potential land-use conflicts that could affect the
sustainable production and use of biomass.
Nearly three-quarters of the available biomass in the Midwest comes from agricultural
residues, which we estimate based on grain yield, crop rotation, field management,
climate, and physical characteristics of the soil (Walsh 2007). Our calculations included
algorithms to control for water erosion9 and wind erosion.
10
We included estimates for the quantities of residues that must remain on the field to
maintain levels of soil organic matter.11
We also accounted for the cost of collecting and
harvesting the available residue. Thus we considered many of the factors described in the
primary literature as driving residue availability, and our estimates of economically
feasible biomass account for the need to maintain soil retention and productivity (Walsh
2007).
To minimize direct and indirect changes in land use to produce biomass, we excluded 50
percent of the energy crop supply assumed by the EIA. That allows for farmers to grow
most energy crops without decreasing food production or converting natural ecosystems
to agricultural systems—which also leads to much greater cuts in carbon emissions. The
biomass available for U.S. energy production in our analysis is therefore just one-third of
that identified in the DOE study, and 60 percent of that in the EIA study. Our model
includes biomass used for electricity production, combined heat and power, and
cellulosic ethanol.
Justifiable concern has arisen that greater use of cellulosic energy crops could drive up
the cost of food or compete for land. If we simply extrapolate today’s trends and
practices, then bioenergy could undermine food production and security, prove lacking in
quantity and land availability, and contribute to environmental degradation.
9 To control for water erosion, we used the Revised Universal Soil Loss Equation (RUSLE) (Walsh 2007; Renard et al.
1996) 10
To control for wind erosion, we used the Wind Erosion Equation (WEQ) (Walsh 2007; Skidmore 1988; Skidmore and Kumar 1979; Skidmore and Fisher 1970). 11
To account for soil carbon, we used the Soil Conditioning Index (SCI) (Walsh 2007; Lightle and Argabright 1999; Lightle 1997).

19
Yet a growing body of literature suggests that innovative management practices—such as
pasture intensification, nitrogen recovery, and animal feed rations—can integrate energy
crops into our food system without triggering these concerns (Dale et al. 2010a; Coppock
et al. 2009; Anex et al. 2007; Stewart et al. 2007). By limiting energy crops to 50 percent
of their potential and considering these management practices, we are reducing the
potential for land-use change from the energy crops developed under our analysis.
Local Benefits of Biopower
Greater reliance on biomass energy can bring substantial benefits to local communities.
For example, biomass resources used to generate electricity—whether at a dedicated
biomass plant or co-fired at a coal plant—tend to come from relatively nearby areas, to
minimize transportation costs. Fuel expenditures therefore stay in the local economy,
adding valuable new markets for farm products. Because the Midwest is primarily a net
coal importing region, dollars spent on biopower resources that directly displace coal
remain in the local economy rather than leaving the area to pay for imports.
The use of agricultural residues for biopower can provide an additional revenue stream
for growers. However, to ensure sustainability, a fraction of crop residues must be left on
fields to maintain soil characteristics that control erosion, and to maintain soil organic
matter and moisture.
Determining a sustainable rate for removing agricultural residues must take into account
crop yields and rotation, management practices (such as tillage), field topography,
climate, and physical characteristics of the soil. Our analysis includes a detailed
assessment of water and wind erosion, and an approximation of the amount of biomass
needed to maintain soil organic matter, to determine the residues that must remain on
fields. We did not adjust for other factors, such as soil fertility and soil moisture (Walsh
2007).
Growing perennial grasses for energy can help improve soil quality on overused land and
potentially reduce the prevalence of monocultures, diversify crop rotations, and increase
grassland coverage. Perennial plants used for biopower can also be grown on marginal
lands and need considerably less fertilizer, pesticide, herbicide, and fungicide than annual
row crops (Tilman et al. 2006a).
Reduced chemical use helps protect groundwater and surface water from poisons and
excessive growth of aquatic plants. Perennial energy crops can also create more diverse
habitats, attracting a wider variety of birds, pollinators, and other beneficial insects, and
supporting larger populations of various species (Tilman et al. 2006b). Perennial energy
crops can build and conserve soil, capture and store carbon, hold and filter water, and
cycle nutrients more efficiently (Anex et al. 2007). The net impact of energy crops will
be site specific, but they can grow in nutrient-depleted, compacted, poorly drained,
acidic, and eroded soils, improving these overused or marginal lands (Blanco-Canqui
2010).

20
Biopower can also help landowners maintain forest health by creating a market for
ecologically required treatments for forests. For example, to reduce the risk of
catastrophic forest fires, landowners often remove and burn biomass, at considerable cost,
or do not remove it, leading to greater risk of more intense forest fires. Harnessing this
resource may help cover some of the costs of preventive maintenance, and in some cases
turn an activity required for healthy forest management from a net cost to a net profit for
landowners.
Key Challenges for Biopower
Ensuring the Sustainability of Biopower and Wise Land Use
Though the environmental risks of biopower are much lower than those of conventional
energy sources, it does pose risks that need to be mitigated. If not managed carefully,
biomass for energy can be harvested at unsustainable rates, damage ecosystems, pollute
the air, consume large amounts of water, and produce net increases in global warming
emissions.
However, many scientists believe a wide range of biomass resources can be produced
sustainably and with minimal harm while reducing the overall impacts and risks of our
power supply (Dale et al. 2010b; Tilman et al. 2009). Implementing policies that properly
integrate bioenergy feedstock production with agriculture is essential to securing the
benefits of biomass and avoiding its risks.
Biomass is a renewable resource not only because the energy it contains comes from the
sun, but also because it can be regrown over a relatively short period of time. The CO2
released when biomass is burned for energy is reabsorbed through photosynthesis as
more biomass is grown to replace the original resource.
In this way, biomass functions as a sort of natural battery for storing solar energy, as
photosynthesis converts carbon dioxide from the air and water from the ground into
carbohydrates. As long as biomass is produced sustainably—meeting current needs
without diminishing resources or the land’s capacity to regrow biomass and recapture
carbon—the battery will last indefinitely and provide sources of low-carbon energy.
Many scientists believe that a wide range of biomass resources are ―beneficial‖ because
their use will clearly reduce overall carbon emissions and provide other benefits (Dale et
al. 2010b; Tilman et al. 2009). Beneficial biomass includes energy crops that do not
compete with food crops for land, portions of crop residues such as corn stover or wheat
straw, sustainably harvested thinnings and forest residues, and clean municipal and
industrial wastes (Tilman et al. 2009).
Beneficial biomass sources generally maintain or even increase carbon stocks stored in
soil or plants. They also displace the use of coal, oil and natural gas, the burning of which
adds new carbon to the atmosphere and causes global warming. Unsustainably planting
and harvesting biomass, on the other hand, results in net carbon emissions, degraded
soils, increased erosion, and loss of habitat.
The long-term impact of residue removal on soil structure, composition, functioning,
erosion, and soil carbon dynamics across management types and climate needs further

21
study (Blano-Canqui 2010; Johnson et al. 2010). We have tried to include the effects of
topography, tillage, crops, and climate in our model. However, we did not include site-
and soil-specific factors such as soil texture and drainage, because of limitations in the
model.
Some recent research has raised important questions regarding the timing of the biomass
carbon cycle (Manomet 2010). Because biomass contains more water than fossil fuels do,
it burns less efficiently, so stack emissions are higher, creating a ―carbon debt.‖ In the
Northeast, for example, emissions from burning whole trees may remain higher than
those from fossil fuels for decades before the carbon debt is repaid during tree
regrowth—making whole trees less desirable than other biomass resources. These same
studies have found that forest residues and other waste biomass have rapid carbon
paybacks and strong carbon reduction benefits. More research is needed to determine the
applicability of these findings to other regions such as the Midwest, and to determine
detailed criteria for sustainable biomass. To be conservative though, our analysis does not
consider whole trees as eligible fuels.
The carbon debt of treetops and tree limbs is much lower than that of large, mature trees,
partly because the residues would decay and release carbon dioxide after trees are
harvested for saw timber or pulp. If trees are cut only as a source for biopower, then the
resulting carbon debt will take much longer to pay back, because these trees would
normally be growing rather than decomposing, or the harvested timber or pulp would be
put to alternative uses, such as in structures, where decay and carbon dioxide release
would normally not occur for a long time. Researchers at the Manomet Center for
Conservation Sciences have estimated that logging residues will have a payback time of
about 5 to 30 years, depending on the fossil fuel they replace (Manomet 2010). Whole
trees, in contrast, would have a payback of 15 to more than 90 years (Walker 2011).
Carbon dynamics vary based on different feedstocks, and these differences need to be
considered when evaluating supply pathways for biomass.
It is also important to consider potential carbon emissions created by changes in land use.
Some forms of biomass—such as native perennials grown on land that would not be used
for food, and biomass from waste products such as agricultural residues—do not change
the way we use our land, and can therefore significantly reduce global warming
emissions. However, changing the way we use land to produce biomass for energy may
indirectly affect land use in other locations, and thus carbon emissions.
For example, replacing traditional crops with energy crops can shrink food production,
which can spur the conversion of forests and natural habitat to agriculture in other
locations, to make up the shortfall. This conversion releases carbon sequestered in the
ecosystem, and can create more emissions than biopower prevents (Fargione 2008). Both
direct and indirect land-use conversions should be taken into account when assessing
potential cuts in carbon emissions from the use of biomass (Searchinger et al. 2011,
2008).
Biomass Distribution and Transport
The distribution and transportation of biomass pose another challenge for its widespread

22
deployment. While many types of biomass are available throughout the Midwest, they
need to be collected from a wide area and delivered to where the resource will be used.
As the distance from source to power plant increases, the cost also rises, as do the
emissions from burning diesel used in transport. This is less of an issue for new biomass
power or biofuel plants, which can be located close to where the resource is readily
available. However, in the case of co-firing at existing coal plants, the biomass must
come from nearby if it is to yield the maximum environmental benefits and be cost-
effective. In locations where several coal plants are clustered together, it becomes
increasingly difficult for all plants to engage in high levels of co-firing using local
biomass supplies. Biomass then would have to come from greater distances, the plants
would have to use less desirable sources, or the co-fire rate would be limited.
Possible exceptions may occur when plants are located on waterways, allowing biomass
to be delivered by barges or ships, which can be much more efficient and less expensive
than shipping by land. Some wood pellets are now shipped from the U.S. Northeast and
Southeast to European markets, because of the higher value they place on renewable
energy. The process of torrefaction, which dries biomass to better approximate the
consistency of coal, can also reduce shipping costs. Torrefaction could play an important
role in the transition to a clean energy economy, but because it is not fully
commercialized, we do not consider it in our analysis.
Other Technical Challenges of Co-Firing
Though not insurmountable, technical challenges can also diminish the attractiveness of
biomass co-firing. Altering the fuel mix in a coal plant can affect slagging, fouling,12
the
plant’s emissions profile, and reduce plant efficiency (KEMA 2009). These problems can
generally be minimized through close monitoring and control, and the installation of
handling systems that can adjust to one or more types of biomass in addition to coal.
Co-firing designs are plant specific, and must take into account the different constraints at
each facility depending on the type and availability of biomass, furnace and boiler type,
space limitations, and other factors to optimize power production and limit emissions.
The costs of retrofitting a plant for co-firing can therefore range substantially, making it
attractive in some locations and prohibitive in others. To account for these challenges,
our analysis examines a range of co-fire rates: up to 5 percent under our core policy case,
and up to 15 percent under our alternative technology pathway (see Chapter 3).
Emissions of pollutants other than carbon dioxide are also affected by biomass co-firing.
The concentrations of elements in biomass are different from those in coal, even after
accounting for differences in heat content. Biomass generally has lower concentrations of
sulfur, nitrogen, and mercury, which can lead to lower emissions of sulfur dioxide and
mercury. Experiments have shown both higher and lower nitrous oxide emissions from
co-firing than from coal alone. Emissions of other heavy metals and chlorine can increase
12
Slagging and fouling refer to the accumulation of unwanted material on the surfaces of boilers and heat transfers, and can affect operation of the equipment.

23
if contaminated urban and demolition waste is used (KEMA 2009), so we excluded this
potential source from our analysis.
Solar Power
Photovoltaics (PV), or solar cells, use semiconducting materials to convert direct sunlight
to electricity. Historically, most PV panels were used for off-grid purposes, powering
homes in remote locations, cellular phone transmitters, road signs, water pumps, among
other uses. But thanks to large declines in costs, strong incentives, and net metering
policies, the PV industry has placed more focus on home, business, and utility-scale
systems attached to the power grid.
In 2005, for the first time ever, the installation of PV systems connected to the electricity
grid outpaced off-grid PV systems in the United States (Prometheus Institute 2006). From
1998 to 2009, the cost of solar power declined more than 30 percent (Wiser et al. 2009),
and in 2010 system prices dropped 20 percent (SEIA 2010). As the PV market continues
to expand, the trend toward grid-connected applications will continue, with power
producers developing multi-megawatt PV projects such as the new 10-MW project in
Illinois, and the proposed 50-MW Turning Point project in Ohio (SEIA 2011).
The technical potential of U.S. solar power is huge: PV panels installed on less than one
percent of the U.S. land area could generate the equivalent of the country’s entire annual
electricity needs. PV panels could make a significant contribution in the Midwest, even
though solar radiation levels are somewhat lower than in other regions. Given solar
radiation levels in Wisconsin, for example, the electricity needs of the entire Midwest
could be met with less than 0.04 percent of the region’s total land area.
Solar PV is still relatively costly compared with other Midwest renewable resources such
as wind and biomass, but that could change as costs continue to drop owing to
technological advances and growing economies of scale in manufacturing. To accelerate
the industry’s growth in the region as well as attract jobs and investments, Illinois,
Missouri, and Ohio have created separate requirements for deploying solar PV as part of
their renewable electricity standards. And some solar PV manufacturers have already
established facilities in the Midwest, hoping to take advantage of the region’s
infrastructure, skilled labor force, and large market. For example, Toledo, Ohio, is home
to First Solar and Xunlight Corp., both producers of thin-film solar cells.
Distributed Energy and Combined Heat and Power
Because some renewable technologies—including solar PV installations, small wind
turbines, and combined-heat-and-power facilities—can be small and modular, they can be
sited in or near buildings where energy is used. These distributed technologies offer some
benefits that utilities have usually not considered, including the avoidance of costly
expenditures on transmitting and distributing electricity. For example, a utility installing
distributed generation in a new neighborhood might be able to use smaller transformers,
or reduce the size or number of power lines to that location.
Distributed generation reduces wear and tear on existing equipment, delaying the need
for replacement or upgrades, reduces marginal distribution losses (so less electricity

24
needs to be produced in the first place), and can lead to improvements in power factor
and voltage support in the distribution system. Distributed generation can also provide
"premium power" to customers, improving its quality and system reliability. Companies
with critical electricity needs, such as hospitals, airports, and computer-dependent firms,
pay a premium to ensure reliable power, as the cost of outages can be huge. Onsite
generation, with small generators based on renewable resources, is one way to meet those
needs.
Placing generating facilities in or near where energy is used may also allow more
efficient use of fuels. Much of the thermal energy created at large power plants is not
converted into electricity. A typical coal-fired power plant, for example, converts only
about one-third of the energy in the coal to electricity—the rest is lost as ―waste‖ heat.
CHP systems, also known as cogeneration, offer a much more efficient option for energy
consumers, as they capture waste heat for use in space heating and cooling and other
purposes.
CHP systems have allowed industrial facilities and building owners to save money on
energy costs and reduce their fossil fuel use. Such systems use more of the energy in
fossil fuels, reducing emissions by displacing less efficient forms of power generation.
And CHP systems can use renewable fuels such as biomass to replace part or all of the
fossil fuels they use. Businesses, government, and consumers have much to gain if CHP
is adopted on a larger scale. In 2006, CHP produced 506 billion kWh of electricity in the
United States—more than 12 percent of total power generation.
Transmission and Other Infrastructure Challenges
Lack of transmission capacity is one of the primary barriers to building more utility-scale
renewable energy in the Midwest. Meeting the Energy Roadmap targets for renewable
energy will therefore require a major effort to modernize and expand the electricity grid.
Key near-term needs include reforming the management and operation of the grid,
creating new mechanisms for financing and recovering the costs of an expanded grid, and
creating processes for siting new transmission lines. Coupled with these efforts must be
initiatives that encourage energy efficiency, demand-side management, and smart-grid
improvements, while discouraging access to new transmission lines for coal and other
fossil fuel plants that lack carbon capture and sequestration.
Our analysis assumes that new policies facilitate new transmission lines and upgrades of
existing lines to enable power producers to meet the renewable electricity targets in the
Energy Roadmap. While we did not explicitly model these policies, we did include the
cost of building transmission lines for new renewable, fossil-fueled, and nuclear power
plants, and we allocated those costs to all electricity users based on EIA assumptions.
(For more information, see the Technical Appendix, online at
www.ucsusa.org/brightfuture.) Our analysis also includes the costs of siting and
connecting wind projects and transmitting the power they produce as the use of wind
increases, based on an analysis by the National Renewable Energy Laboratory (NREL)
for the EIA (PERI 2007).

25
Overall, the cost of transmission represents a relatively small fraction of the cost of
deploying renewable energy. Permitting, siting, and constructing new lines, however, can
be a lengthy and complicated process. While most renewable energy technologies can be
deployed quickly, obtaining the approvals to site and construct new transmission lines
typically takes several years or more.
For example, 95,000 MW of wind projects are now in the interconnection queue in the
Midwest (65,000 in Midwest ISO and 30,000 in PJM)—equivalent to roughly half of the
Midwest’s total electric generating capacity. While some of these projects are less certain
and may not be built, most are stalled because of inadequate transmission capacity.
Successful implementation of the Energy Roadmap targets will require new policies to
facilitate and speed the permitting, siting, and construction of transmission lines. These
policies need to bring all stakeholders into the process in a fair and equitable manner.
They must also take into account the rights of landowners and communities where
transmission is sited and ensure that they are treated fairly.
Several renewable energy technologies could share transmission lines. In fact, combining
biopower, landfill gas, and sustainable hydro projects—which provide baseload power—
with wind and solar projects, which provide variable power, can allow more cost-
effective use of new transmission lines and upgrades. To capture these benefits, state,
regional, and national agencies are now considering how to increase the capacity of the
grid to transmit power from ―renewable energy zones‖ to areas with high demand.
Several transmission planning efforts are under way in the Midwest. Both Midwest ISO
and PJM are pursuing system planning and cost allocation processes. Midwest ISO
released the Regional Generator Outlet Study in November 2010, focusing on the
transmission needed to bring 23,000 MW of renewable energy capacity online in the
region by 2027, to serve existing state renewable electricity standards (MISO 2010). Our
analysis is consistent with this effort, and we used it as guidance as we examined the
transmission capacity needed to meet the Energy Roadmap targets, and to understand
where renewable energy development is likely to happen.
Fragmented jurisdiction over the existing transmission system allows any single state to
effectively veto the construction of new multistate transmission lines by refusing to grant
required permits. The transmission planning of regional transmission organizations
(RTOs) does not yet adequately examine energy efficiency, demand response, and
retirement of fossil fuel–based facilities. Federal land-use agencies also lack a consistent
policy for siting transmission lines.
These challenges could be overcome with significantly improved subregional and
multistate coordination that better integrates state and regional processes for approving
new transmission lines. This would help plan for and integrate new renewable energy
sources and distributed power plants into the grid, while taking into account options for
managing demand. Such an approach could also allocate costs fairly among all users of
the transmission system, and ensure the protection of sensitive environmental and cultural
resources.

26
New federal policies are also needed to increase the reliability and efficiency of the
electricity grid and maximize the integration of renewable energy sources. Because some
of the best renewable energy potential is located away from population centers, ―green
energy superhighways‖ will be needed to expand the use of clean, renewable electricity
and reduce carbon emissions from the electricity sector, even after taking into account
opportunities for energy efficiency, reducing demand, and distributed generation. The
federal government should provide a framework, guidelines, timelines, and a backstop
decision-making authority, particularly for cases where agreement at the state level
cannot be reached.
As part of DOE planning grants funded by the 2009 American Recovery and
Reinvestment Act, each of the major electricity interconnects (Western, Eastern, and
Texas) are attempting to address several grid planning problems that RTO processes have
been unable to address effectively, including substantial integration of renewable
generation. The Midwest is part of the Eastern Interconnect, which accounts for 75
percent of the nation’s electricity demand.
The Eastern Interconnection Planning Collaborative is drawing together stakeholders to
plan the future of the electricity grid, specifically to include state renewable energy
requirements. This effort will model transmission needs under various generation
scenarios. This consensus-based planning process includes participation by
nongovernmental organizations, and is a pivotal opportunity to move away from business
as usual, wherein owners and operators of transmission and generation facilities plan the
system solely to address reliability, pricing, and congestion concerns. The new process
can shift the process toward interconnect-wide comprehensive grid planning that also
considers regional and national goals for energy efficiency, clean energy, and climate
change.
Energy Efficiency Technologies and Their Potential in the Midwest
Energy efficiency technologies allow the use of less energy to get the same—or higher—
level of production, service, and comfort. We can still light a room, keep produce fresh,
and use a high-speed computer, but we can do it with less energy. Energy efficiency is
less expensive than any form of electricity generation, and does not require transmission
lines (Friedrich et al. 2009; Lazard 2008).
Measures such as more building insulation, improved lighting systems, more efficient air-
conditioning, and improved water-heating systems also dominate the list of cost-saving
solutions for reducing for demand for coal-based power and cutting global warming
emissions (Pers-Anders, Naucler, and Rosander 2007). Creating a highly energy-efficient
economy requires the deployment of these technologies, as well as policies and programs

27
to overcome the entrenched barriers that prevent businesses and consumers from using
energy wisely and efficiently.13
The Midwest has made strides in adopting energy efficiency policies over the last six
years. Seven of the Midwest states examined in this report have energy efficiency
resources standards in place: Illinois, Indiana, Iowa, Michigan, Minnesota, Ohio, and
Wisconsin. Missouri has adopted an integrated resource planning process that
incorporates energy efficiency into the utility planning process.
While utilities and regulators are just beginning to implement these policies, they are
already saving consumers money and creating jobs. As a result, states are gaining
momentum toward the Energy Roadmap target of 2 percent annual savings for electric
utilities by 2015 and each year thereafter. In the Midwest, budgets for ratepayer-funded
energy efficiency programs reached $443 million in 2009 (Molina et al. 2010), and are
projected to increase to $1.2 billion in 2011 (MEEA 2011).
Potential for Greater Energy Efficiency in the Midwest
Analysis from the Energy Center of Wisconsin, performed with the American Council for
an Energy-Efficient Economy (ACEEE), found that the Energy Roadmap’s 2 percent
annual energy efficiency target is aggressive but achievable (Stratton and York 2009). In
fact, a majority of the studies reviewed in the analysis showed the potential for
achievable efficiency gains of 1.9 percent or more each year.
A review of utility- and state-level efficiency programs found that the cost of
implementing energy efficiency measures ranged from about 1.5 cents to nearly 7 cents
per kilowatt-hour saved(¢/kWh), with a median of 3.0¢/kWh (Figure 2.5) (Hurley et al.
2008).That review also found that implementation costs are lower the greater the
efficiency gains a program produces.
Another ACEEE review examined the costs of ratepayer-funded energy efficiency
programs in 14 states, and found a range of 1.6 to 3.3¢/kWh. The analysis included three
Midwest states: Iowa (1.7¢/kWh), Minnesota (2.1¢/kWh) and Wisconsin (3.3¢/kWh)
(Friedrich et al. 2009). Those costs are lower than the average Midwest retail price for
electricity in 2009 (7.57 to 8.91¢/kWh) (EIA 2010b), suggesting that an aggressive,
comprehensive plan to boost energy efficiency is a cost-effective approach to reducing
coal dependence. Our analysis assumed a cost of 3.0¢/kWh as a conservative estimate,
based on these analyses.
In 2008, energy efficiency programs in five states reduced energy use by more than 1
percent that year, including Vermont, where reductions reached 2.59 percent. Three
Midwest states—Iowa, Minnesota, and Wisconsin—reduced electricity demand by more
than 0.7 percent that year (Molina et al. 2010). An analysis concluded that the Energy
Roadmap energy efficiency targets are realistic for two key reasons: ―Existing program
activity levels have not targeted this level of savings,‖ and ―existing energy efficiency
13
For a discussion of market barriers to energy efficiency by customer class, see the EPA’s National Action Plan for Energy Efficiency (2010). Online at http://www.epa.gov/eeactionplan.

28
potential studies are very conservative (Stratton and York 2009).‖ What’s more, studies
of the potential for energy efficiency measures have not accounted for many programs
that can be used to meet the MGA targets.
Key Challenges for Energy Efficiency in the Midwest
The advancement of energy efficiency policies in the Midwest faces three key challenges.
First, the region’s economic slowdown has reduced the willingness and ability of
residential, commercial, and industrial electricity customers to invest in energy efficiency
improvements, even when they produce long-term financial benefits.
Figure 2.5. Energy Savings and Costs of Energy Efficiency Programs
A review of utility- and state-level efficiency programs found that the cost of implementing
energy efficiency measures ranged from about 1.5 cents to nearly 7 cents per kilowatt-hour
saved, with a median of 3.0 cents per kilowatt-hour. Those costs are lower than the average
Midwest retail price of electricity in 2009.
Source: Adapted from Hurley et al 2008.

29
High initial cost is a primary barrier to installing new energy efficiency technologies and
retrofitting existing buildings (National Action Plan for Energy Efficiency 2010). While
federal stimulus funding has provided resources to retrofit buildings and develop smart
electricity grids, better state and regional coordination is needed to attract private capital
to continue the pace of these activities after those funds are expended. For example, AFC
First Financial Corporation, a national financial services company, offers residential
energy efficiency and renewable lending and rebate programs in partnership with states,
utilities, manufacturers, and municipalities.
Second, opposition to energy efficiency policies comes from several sources. Utilities, for
example, may be reluctant to expand their energy efficiency efforts if their revenues are
linked inextricably to increasing electricity and natural gas sales. Regulators can break
this link, spurring utilities to promote energy efficiency. For example, regulatory
incentives can turn energy efficiency programs that exceed mandatory targets into profit
centers for utilities (National Action Plan for Energy Efficiency 2007).
Third, efforts to increase energy efficiency resource standards in some states have
suffered from lingering misperceptions that such investments raise utility bills. Better
communication, and the expansion of existing energy efficiency programs, can show
policy makers and consumers that energy efficiency lowers total utility bills, both
directly, by reducing the amount of energy used, and indirectly, by providing downward
pressure on electricity prices. Together those measures allow electricity providers to
reduce fuel costs at existing plants and avoid new investments in generation and
transmission facilities.
Other Non-Renewable Low-Carbon Technologies
Carbon Capture and Sequestration
Beyond renewable energy and energy efficiency, carbon capture and sequestration and
advanced nuclear power plants are low-carbon technologies that have significant
potential to help achieve the deep reductions in heat-trapping emissions needed to avoid
the most dangerous effects of global warming. At present, neither of these technologies is
cost-competitive with energy efficiency, many renewable energy technologies, or new
natural gas power plants—partly because significant technical hurdles continue to limit
their widespread deployment. Nevertheless, as these technologies improve and costs
drop, they could become important options in helping to reduce global warming
emissions.
Carbon capture and storage (CCS) could allow electricity producers to capture a
significant fraction of CO2 emissions from power plants, pressurize it, and pump it into
underground formations, where it would ideally remain stored safely and permanently.
This approach is being investigated today primarily to reduce carbon emissions from
coal-fired power plants, but it could also be applied to natural gas–fired power plants or
industrial sources of CO2. CCS also has the potential—if coupled with the sustainable use
of biomass to produce electricity—to provide carbon-negative power, as the carbon
absorbed by the biomass during growth would be stored underground as it burned, rather
than being released back into the atmosphere.

30
Our analysis includes only pre-combustion carbon capture in new coal integrated
gasification combined-cycle (IGCC) and natural gas combined-cycle plants, because the
2009 version of NEMS does not have the capacity to model post-combustion CCS
technologies. Both pre- and post-combustion technologies are expected to capture 85–95
percent of a coal plant’s carbon emissions. However, the actual rate of carbon emissions
avoided per unit of electricity could fall to 80–90 percent, after the fuel used to power the
pre-combustion CO2 capture process is factored in (IPCC 2005).
No coal-fired power plants are now using CCS on a commercial scale. This makes
accurate projections of the cost of CCS highly uncertain and difficult to validate. Design
estimates indicate that CCS could increase the cost of energy from a new pulverized coal
plant by 78 percent, and that adding pre-combustion capture to a new IGCC plant would
increase its levelized costs by 36 percent. Cost increases would be even greater if CCS
were added as a retrofit (ITF CCS 2010).
Future advances in CCS technology could drive down such costs substantially (Al-Juaied
and Whitmore 2009). However, significant research and development will be required
before we know if any of these approaches can be successfully commercialized. Several
CCS projects under development today—including three recent projects in the
Midwest—have faced serious cost overruns and delays.
A cost review of a proposed Tenaska Energy IGCC plant in Illinois found that the project
would cost more than $210 per MWh (or 21¢/kWh), and that uncertainties could push
costs higher (ICC 2010). The FutureGen CCS project, also in Illinois, has already been
canceled once for cost overruns and then revived. Finally, Duke Energy’s IGCC plant in
Edwardsport, Indiana, was approved in 2008 by the state utility regulatory commission at
a cost of $1.9 billion. The latest cost reported by Duke Energy is $2.9 billion (Downey
2011).
Nuclear Power Plants
Nuclear power plants could play a role in reducing global warming emissions because
they emit almost no carbon when they operate. Other parts of the nuclear fuel cycle do
emit CO2, though some studies have found those emissions to be roughly comparable to
emissions from manufacturing and installing wind power and hydropower facilities (UCS
2003).
With no recent domestic experience to draw on, reliably projecting construction costs for
new U.S. nuclear plants is challenging. Experience with reactors under construction in
Europe and Asia, however—and recent trends in the overall cost of commodities and
construction—show the same vulnerability to cost escalation that plagued the last
generation of nuclear plants.
Based on a review of estimates of construction costs for a range of nuclear power plants,
we assumed modest cost escalation of 2.4 percent per year through 2015, and then a 4.2
percent drop in costs by 2030 owing to learning. We also included 300 MW of uprates
(modifications to an existing nuclear power plant that allow it to increase its power

31
output) in the Midwest, based on projections using survey data from the Nuclear
Regulatory Commission (NRC).
Current applications to the NRC to build and operate new nuclear power plants reference
five plant designs—of which the NRC has certified only two. And one of those, the
AP1000, has undergone significant changes since it was certified. The five designs offer
evolutionary improvements to existing plants: they are somewhat simpler, relying more
on ―passive‖ safety systems and less on pumps and valves.
The industry and the NRC had hoped that these upgrades—along with a streamlined
licensing process and greater standardization of reactor designs—would improve the
safety of nuclear power plants and reduce their costs. However, standardization has so
far proved elusive, and the licensing process has not yet been fully tested. Given the
effects of the March 11, 2011, earthquake and tsunami on the Fukushima Daiichi nuclear
power plant in Japan, proposals for new plants will likely be subject to additional reviews
and changes, potentially causing delays and adding costs to their construction and
operation.
Potential Impact of Electric Vehicles
Automobile manufacturing in the United States started in the Midwest, and it was
midwestern ingenuity that transformed transportation for an entire continent. Now, in the
search for new and better ways to power vehicles while reducing heat-trapping emissions,
Detroit can lead the charge once again by investing in low-emissions cars. One of the
more promising developments is using more electricity to power vehicles.
Electric vehicles—which use electricity stored in on-board batteries for part or all of their
power needs—have the potential to reduce CO2 emissions from the transportation sector.
However, cuts in emissions can vary significantly with the source of the electricity used
to charge the batteries for these vehicles.
If a significant fraction of the electricity used to charge the electric vehicle’s batteries
comes from plants that burn a lot of fossil fuels, electric cars can have lower lifecycle
CO2 emissions than conventional vehicles but offer little global warming advantage over
an efficient hybrid-electric vehicle. However, CO2 emissions from the electric vehicle
fleet can drop significantly—to levels below those of efficient hybrid vehicles—as more
power from low-carbon sources is used to charge the batteries.
Assessing the lifecycle emissions of plug-in hybrid-electric vehicles is more complex
because the total emissions are a combination of the emissions coming from the on-board
internal combustion engine and those from the electricity from the grid used to charge the
batteries. Driving habits and vehicle design have a significant effect on how much the
two sources contribute. The emissions of these vehicles will fall between those of all-
electric vehicles and non-plug-in hybrids.
Previous analyses have suggested—based on the current Midwest electricity mix, which
is dominated by coal—that an all-electric vehicle would account for slightly more CO2
emissions than an efficient hybrid, but far less than a typical conventional vehicle.

32
Reducing coal and fossil fuel use, and replacing it with renewable energy, can therefore
improve the carbon benefits of both all-electric vehicles and plug-in hybrids.
A number of car companies are now starting to sell all-electric vehicles and plug-in
hybrids, or have announced plans to do so. However, there are uncertainties as to how
quickly the market for such vehicles will grow. Our analysis does not specifically explore
the effect that various penetration rates of electric vehicles could have on the electricity
system in the Midwest. However, our model contains the same assumptions used by the
EIA in its Annual Energy Outlook 2009 (AEO). The AEO includes projections for
demand for the electricity used for electric and plug-in hybrid vehicles, which accounts
for only a small fraction of total electricity consumption.

33
Chapter 3. Our Modeling Approach
To analyze the impact of the Energy Roadmap targets in the Midwest, we relied primarily
on a modified version of the National Energy Modeling System (NEMS), developed by
the EIA, an independent division of the U.S. Department of Energy. NEMS is a
comprehensive model that forecasts U.S. energy use and emissions from the electricity,
transportation, industrial, and buildings (residential and commercial) sectors. The model
relies on a variety of assumptions about technological progress as well as household and
business behavior. Using these assumptions, it selects the technologies that can best
enable the nation to meet its projected energy needs.
The EIA uses NEMS each year to provide a long-term forecast of U.S. energy
production, demand, imports, prices, expenditures, and emissions. The resulting report,
the Annual Energy Outlook (AEO), includes a scenario based on policies in place at the
time, called a reference case, and numerous ―sensitivity‖ cases based on changes to key
assumptions. The EIA also receives numerous requests from Congress to use NEMS to
assess the effects of proposed climate and energy legislation. The NEMS model allows
users to capture the dynamic interplay between energy use, energy prices, energy
investments, the environment, and the economy, as well as competition for limited
resources under different policy scenarios.
Our approach is similar, in that we used a modified version of NEMS (which we call
UCS-NEMS) to create a forecast under existing policy conditions, which we call the
existing policies case, or base case. We modified EIA’s assumptions for the costs,
performance, and supply of several energy technologies based on more recent
information, and we also updated the model to include the latest relevant state and federal
policy changes.
We then modeled several policy cases that apply new measures to promote renewable
energy, energy efficiency, and cuts in carbon emissions. We compared these policy cases
with the existing policies case to evaluate their effect on consumers, the economy, and
the environment. The forecast period for our analysis runs through 2030. Although our
analysis focuses on the electricity sector, NEMS models multiple sectors of the economy,
which allows us to capture the dynamic relationships between the electricity sector and
all other sectors. (For more information on how we modified the model, see the Technical
Appendix, online at www.ucsusa.org/brightfuture.)
As noted, our analysis focused on the nine Midwest states (Illinois, Indiana, Iowa,
Michigan, Minnesota, North Dakota, Ohio, South Dakota, and Wisconsin) that are part of
the Midwest ISO and PJM—the two independent transmission system operators in the
region. The 2009 version of the NEMS model we used for this analysis divides the
United States into 13 North American Electric Reliability Council (NERC) regions—
performing calculations and reporting results for the electricity sector in these regions
before aggregating to the national level (EIA 2009).
Three of the NERC regions correspond roughly to the Midwest ISO and PJM footprint
(Figure 3.1). We then used Midwest-specific information on existing energy use and
production, renewable resource potential, transmission planning analyses, and other

34
analyses of renewable energy and energy efficiency to estimate where renewable energy
deployment and fossil fuel displacement were more likely to occur at the state level. (We
describe state-level results in a series of fact sheets available online at
www.ucsusa.org/brightfuture.)
Energy Efficiency Analysis
Our study included a supplemental analysis to account for the costs and energy savings of
implementing the Energy Roadmap energy efficiency targets. The analysis used the
resulting calculations of annual, regional-level energy savings to reduce electricity
demand by sector in the NEMS model, distributing the energy savings proportionally
across the relevant NERC regions.
Figure 3.1. Midwest Regional Transmission Organizations, and Their Overlap with
NERC Regions in NEMS
Our analysis focused on the nine Midwest states that are part of the Midwest ISO
and PJM—the two independent transmission system operators in the region. Three
of the North American Electric Reliability Corporation (NERC) regions in our model
correspond roughly to the Midwest ISO and PJM footprint.
Source: PJM 2011a, 2011b. Note: Two electric utilities serving customers in Ohio—FirstEnergy Service Co. in northern Ohio, and Duke Energy in southern Ohio—have filed with the Federal Energy Regulatory Commission to withdraw from the Midwest ISO and join PJM.

35
In the residential sector, the model also distributed energy savings proportionally across
different end-use categories, such as lighting, home appliances, space heating and water
heating. The model then determined the effects of the reductions in energy demand on
electricity generation, fossil fuel use for electricity production, CO2 emissions, energy
prices, and energy bills. To determine net consumer energy expenditures, we accounted
for the investments and costs of implementing the energy efficiency targets as well as the
savings on consumer energy bills from NEMS.
Jobs Analysis
To derive the impact on employment of meeting the Energy Roadmap targets, we began
with changes in expenditures brought about by the manufacturing, construction,
installation, and operation of renewable energy and energy efficiency technologies, and
the savings on consumer energy bills that result from the deployment of these
technologies. We also examined the avoided capital costs, operation and maintenance
costs, and fuel costs associated with the displacement of conventional power plants.
After determining both the gains and losses for specific industries, we evaluated the net
benefits to the Midwest overall economy. The macroeconomic impacts include direct,
indirect, and induced jobs, personal income, and gross state product. We evaluated these
effects using state-specific data derived from IMPLAN (Impact Analysis for Planning),
an input-output model that identifies interactions between all sectors of the economy.14
IMPLAN allowed us to obtain state-level results, and to incorporate some of the positive
effects on gross state product and jobs of investments in energy efficiency, renewable
energy, and other low-carbon technologies, and of savings on consumers’ energy bills.
Our analysis assumed that only a portion of the jobs created or displaced from changes in
expenditures in the Midwest would occur within the region: the remainder would be
reflected in changes in employment in other regions. We adjusted coefficients in the
model that estimate the proportion of new equipment supplied by producers within each
state and the region (as a percent of the total dollars spent), based on industry data
whenever it was available. While some expenditures, such as those related to construction
and biomass feedstocks, stay largely within the region, others, such as for PV
components, rely heavily on imports from outside the Midwest. Our analysis reports only
jobs created within the region. (For more information on the modeling and assumptions
underlying our jobs analysis, see the Technical Appendix, available online at
www.ucsusa.org/brightfuture.)
Analysis of the Biomass Supply Curve
To determine the amount of biomass from plant cellulose that is potentially available for
use in producing electricity and liquid fuel for transportation at different prices, we relied
on a separate analysis prepared by Marie Walsh, an agricultural economist with the
University of Tennessee, and formerly of Oak Ridge National Laboratory (ORNL).
Walsh and her colleagues at ORNL developed the original supply curves used by the EIA
14
For more information on the IMPLAN model, see http://implan.com.
36
for each of the main biomass feedstocks: energy crops (switchgrass), agricultural residues
(corn stover and wheat straw), forestry residues, urban wood waste, and mill residues.
The EIA model included an annual supply curve for each biomass feedstock through
2030, separated into 14 U.S. subregions. The model summed the data from those curves
to get a total biomass supply curve for each region, and for the nation as a whole.
Walsh and her colleagues at the University of Tennessee updated the supply curves for
energy crops, agricultural residues, and corn for a 2007 EIA analysis that examined a
national policy requiring 25 percent of the electricity and energy used for transportation
to come from renewable sources by 2025 (EIA 2007). The report based the supply curves
on new runs of an economic forecasting model for agriculture called POLYSYS. Starting
with a 2006 baseline forecast by the U.S. Department of Agriculture, POLYSYS
projected the tonnage of all major crops and calculated changes in land use, based on the
price of biomass and corn in each of 305 agricultural statistical districts.
Our analysis used those supply curves, but we reduced the amount of biomass available
from energy crops by 50 percent, to account for potential indirect effects on land use that
would increase carbon emissions, and for potential downward pressure on the biomass
supply from concerns over sustainability and carbon accounting. Indirect land-use effects
occur when energy crops are grown on lands that could otherwise be used to grow food
crops. That shift drives up the price of food crops and spurs the conversion of forests and
other lands to cropland in the United States and other countries. We also assumed that the
costs of transporting the biomass to coal plants that can burn it start at $12 per dry ton,
and increase up to $35 per dry ton, based on the level of co-firing at each facility.
Scenarios
Base Cases
To establish our base case, we applied a variety of modifications and updates to the
Annual Energy Outlook 2009 version of the NEMS model, including the tax credits and
incentives in the American Recovery and Reinvestment Act of 2009 (EIA 2009). For
example, we modified the EIA’s assumptions about the costs and performance of several
energy technologies based on data from actual projects, information from more recent
studies, power plant cost indices, and input from experts. We further updated the model
to include new state renewable electricity standards, the existing $18.5 billion nuclear
loan guarantee program, and, as noted, the revised biomass supply curves. Neither the
base case nor our policy cases, however, include more recent changes in power plant
regulations under the EPA’s enforcement of the Clean Air Act.
We also modeled a second base case—different from the first case only in that it includes
lower cost assumptions for the biomass supply curve—for comparison with two policy
cases.
Policy Cases
For our policy cases, we modeled the regional targets for renewable energy and energy
efficiency in the MGA’s Energy Roadmap. We assumed that the region could meet those
37
targets if the nine Midwest states that are part of the Midwest ISO and PJM implement a
mandatory renewable electricity standard (RES) and an energy efficiency resource
standard (EERS) that would extend to all electric utilities in those states.
The RES would require Midwest utilities to use wind, sustainable biopower, solar, and
other renewable energy sources to generate 10 percent of their electricity by 2015,
ramping up to 30 percent by 2030. The EERS would require utilities to use energy
efficiency improvements to meet at least 2 percent of annual retail sales of electricity in
the region by 2015 and thereafter.15
The RES and EERS have proven to be effective and popular market-based tools at the
state level for encouraging deployment of the least-cost renewable energy and energy
efficiency technologies (Molina et al. 2010; Wiser 2010). We assumed that the Energy
Roadmap targets build on the eight existing state-level RES and seven EERS policies in
the Midwest, incorporating the commitments that have already been made. Other policies
will also be needed to remove key market barriers and maximize economic benefits, but
we did not model them for this analysis. (See Chapter 5 for more on policy
recommendations.)
The NEMS model implements an RES by assuming that power producers install the
least-cost renewable energy technologies, including wind, biopower, solar, landfill gas,
and incremental hydro. Though the Midwest has significant potential to develop all these
resources, wind and biopower are the most abundant and economically competitive in the
region.16
Small changes in the cost and performance assumptions used to evaluate wind and
biomass resources can have a large effect on the mix of technologies that are deployed.
UCS modeled two policy scenarios to evaluate a reasonable range of possible technology
pathways for meeting the renewable energy targets in the Energy Roadmap. We call these
scenarios our core policy case and our alternative technology pathway. Both cases model
regional RES and EERS policies. They differ only in the relative cost of biomass
available to produce electricity, and the amount of biomass that can be co-fired at
existing coal plants.
Our core policy case includes additional biomass fuel costs ($15 per dry ton) to reflect
the significant uncertainties and constraints facing biomass development, both today and
into the future. We added those costs because there is still no mature market for energy
crops and agricultural residues that we could use as a reference point. The higher costs
are associated with additional storage, transportation, and premiums paid to biomass
producers, as well as uncertainty about available levels of sustainably harvested, low-
carbon supplies.
15
The MGA’s Energy Roadmap recommendations also include an energy efficiency target for natural gas utilities. Our analysis did not consider this policy as our focus is the electricity sector. 16
Large-scale models such as NEMS do not value all the benefits that small-scale solar and community-scale wind can provide to the transmission and distribution system, or higher levels of public acceptance. The model likely underestimates the level of such resources that would be desirable to help achieve the Energy Roadmap targets.
38
Our core policy case also reflects a future in which the economic feasibility of co-firing
biomass in coal plants is limited to 5 percent of the capacity of those plants, on average,
across the Midwest. Although higher levels of co-firing have been achieved in practice,
biomass availability and site-specific constraints can limit co-firing rates.
Model limitations could also overstate the amount of co-firing that is economically
feasible. For example, NEMS varies the costs of transporting biomass to coal plants
based on the level of co-firing, to account for larger distances as biomass requirements
increase. However, coal plants are often located in clusters around transportation and
transmission infrastructure, increasing the potential for overlapping demands on the same
local biomass resource from several plants. The transportation costs in the model may not
always account properly for this overlapping demand.
Under the alternative technology pathway, we assumed that biomass co-firing can
represent up to 15 percent of coal capacity, and that biomass supplies are available at
lower price points. This is consistent with EIA assumptions for the Annual Energy
Outlook 2009, as well as previous UCS analyses (Cleetus, Clemmer, and Friedman 2009;
EIA 2009; UCS 2009b). Experience in Europe also suggests that under the right
conditions, higher levels of co-firing are feasible.
We also modeled a third scenario that includes a stand-alone federal policy to reduce
carbon emissions in all sectors of the economy, in combination with the Energy Roadmap
renewable energy and energy efficiency targets. While the Energy Roadmap targets
hasten the transition to a low-carbon electricity sector in the Midwest, they do not reflect
a comprehensive national (or even regional) strategy to address global warming. Federal
policies or regulations to reduce carbon emissions are needed to bring about the swift and
deep reductions that can head off the most dangerous effects of climate change.
The third policy scenario reflects that need, and evaluates the effect of a federal climate
policy on the Midwest. As a proxy for a federal carbon reduction policy, we modeled the
climate legislation passed by the U.S. House of Representatives in 2009 (H.R. 2454),
which required carbon dioxide emission reductions of 17 percent below 2005 levels by
2020, and 42 percent by 2030. We opted to model this proposal because it garnered
bipartisan support in the House, and has been modeled by both the EIA and the EPA.
Key Technology Assumptions
Our technology assumptions start with those used by the EIA in the Annual Energy
Outlook 2009 (EIA 2009). We conducted a thorough review of the cost and performance
assumptions for technologies in the electricity sector, and compared them with data from
actual projects, input from experts, historical trends, and cost indices. This section
summarizes several of the key changes we made to the cost and performance assumptions
for various technologies. (For a more detailed discussion of the modifications, see our
Technical Appendix, online at www.ucsusa.org/brightfuture.)
Escalation of construction costs. We adjusted escalation rates of construction and
commodity costs for all technologies, based on data from actual projects, input from
experts, and power plant cost indices. Whenever we used data from actual projects, we

39
applied an escalation rate that reflected reported costs. For all other technologies, we
assumed that costs would continue to rise 2.5 percent per year (after accounting for
inflation) until 2015, but not afterward. Our escalation rates were based on information
published prior to the economic recession. Commodity and construction costs for
different technologies have since remained relatively constant or declined.
Wind. We included land-based, offshore, and small wind technologies. We based our
capital costs for land-based wind on a large sample of actual projects from a database at
Lawrence Berkeley National Laboratory. We used an analysis from the National
Renewable Energy Laboratory, conducted for the EIA, to develop regional wind supply
curves that include added costs for siting, transmitting, and integrating wind power as its
use grows. We also assumed increases in wind capacity factors (a measure of power
production) and a 10 percent reduction in capital costs by 2030 from technological
learning, based on assumptions from a DOE report on producing 20 percent of U.S.
electricity from wind power by 2030 (EERE 2008).
Solar. We assumed expanded use of distributed (small-scale) and utility-scale
photovoltaics through 2020, based on actual proposals and state policies. We also
assumed faster learning and larger cost reductions for PV than the EIA did, to match the
EIA’s assumptions for other emerging technologies, and based on historical trends.
Biopower. Key technologies included co-firing biomass in existing coal plants, dedicated
biomass gasification plants, the use of biomass to produce combined heat and power in
the industrial and biofuels sectors, and the use of methane gas from landfills.
Hydropower. We included hydropower from upgrades and new capacity at existing dams,
and counted both new sources of power as contributing to the regional renewable
electricity standard.
Carbon capture and storage. We included carbon capture and storage as an option for
advanced coal gasification and natural gas combined-cycle plants, with costs and
performance based on recent studies and a small number of proposed projects.
Nuclear. We assumed that existing plants are relicensed and continue to operate through
their 20-year license extension, and that they are then retired, as the EIA also assumes.
We based assumptions on the costs and performance of new advanced nuclear plants
primarily on recent project proposals and studies. We included planned builds and
accounted for existing incentives to develop and build advanced nuclear and coal plants.
These include tax credits for both technologies as well as a range of risk-shifting and
regulatory subsidies for nuclear plants, such as loan guarantees, insurance against
licensing delays, and limits on liability.
Transmission. We included the costs of new capacity for transmitting electricity for all
renewable, fossil fuel, and nuclear technologies. We also added costs for growing
amounts of wind power, based on the NREL analysis conducted for the EIA (PERI
2007). We allowed the model to build more transmission lines between NERC regions
than the EIA currently models. Our transmission assumptions are consistent with the

40
Midwest ISO’s Regional Generator Outlet Study, which informed our understanding of
where new transmission to support additional renewable energy development was more
likely to occur (MISO 2010).
Limitations, Uncertainties, and Opportunities for Future Research
Projections of long-term changes in the supply, use, and price of energy are subject to
uncertainty. Modeling the impacts of energy and climate policies that will require
significant changes in the way we produce and use energy adds to this uncertainty. Our
model results are therefore not statements of what will happen but of what might happen,
given the assumptions and methodologies used in the model.
One limitation of our analysis is that we analyzed only two potential scenarios for
meeting the Energy Roadmap targets. These scenarios are intended to reflect
uncertainties in the cost of biomass available for energy production, and in the ability to
co-fire biomass in existing coal power plants. Other scenarios with different policy,
economic, and technology assumptions could also achieve the Energy Roadmap targets,
with different effects in the Midwest.
Besides our biomass assumptions, the most important types of assumptions we made
include:
energy demand and prices
the cost and performance of technologies
policies for energy efficiency and renewable energy
the proportion of new equipment supplied by producers within each state and the
region (as a percent of total dollars spent).
Assumptions about energy prices and the cost and performance of technologies are
informed, in part, by data from recent projects and historical trends. However, cost
escalation, economic growth, and fuel prices have not always followed historical trends,
and have some inherent volatility. Natural gas prices, for example, have proven
particularly challenging to forecast, spiking to near-record levels in 2008, only to decline
dramatically by 2010 owing to increased supplies and lower energy demand (Bolinger
and Wiser 2010).
Continued uncertainty around natural gas prices,17
and cost competition between natural
gas and wind power, mean that assumptions about fuel prices will have a significant
effect on model results. If natural gas prices remain at or near 2010 levels for an extended
period, electricity from natural gas could play a substantially larger role in the Midwest
than our base cases and policy scenarios project, likely resulting in less coal-based power
(Kaplan 2010; Casten 2009).
17
For example, U.S. environmental regulators issued a draft plan on February 8, 2011, outlining how they will determine whether a hydraulic fracking technique for drilling natural gas harms drinking water supplies. Their findings, expected by the end of 2012, may lead to additional regulations of this industry.

41
Other assumptions, such as the costs of biomass available for energy, are based on expert
knowledge and analysis, but will remain untested until a mature market for biopower
develops. The rates at which the costs of energy technologies drop and their performance
improves are also subject to changes in input costs and advances in technology.
The details of policy design can also significantly influence the results of modeling. For
example, the regional RES and EERS we modeled assume that all electric utilities must
comply with the annual targets. Exemptions for certain classes of utilities, such as
municipal utilities and rural cooperatives, which several state-level RESs and EERSs now
allow, can substantially reduce the deployment of renewable energy and energy
efficiency.
Future legislation and regulations could also affect outcomes significantly. For example,
limits on pollution from coal-based power plants, or overly strict regulations on wind
siting or biopower sustainability, could significantly alter the viability of existing coal
plants, and of new biopower co-firing and wind energy.
We were also unable to address a variety of limitations of NEMS, despite incorporating
information from other analyses and modifying the model. Examples include:
Allocating changes in generating capacity across regions. As noted, NEMS organizes the
United States into regions, and the model selects the technologies that can best enable
each region to meet its projected energy needs at the lowest cost, given the assumed
constraints. However, the model’s geographic resolution is limited, and this approach
cannot fully capture site-specific constraints or the complexities of power plants that are
sensitive to geographical location. The model deals with issues such as the proximity of
wind resources to transmission lines and demand centers—and the availability of local
biopower resources to facilities that could use them—indirectly, by adjusting
assumptions about the cost and supply of wind energy and biopower.
Modeling energy efficiency. The model includes specific technologies used to boost the
energy efficiency of vehicles, industry, and buildings. However, analyzing the impact of
proposed efficiency policies in the residential, commercial, and industry sectors is
difficult without significantly modifying the model and its assumptions. The model also
attempts to capture some reductions in energy use owing to higher prices, but this
approach is limited.
We conducted an offline analysis of the efficiency targets in the Energy Roadmap to
quantify the effects of investments in energy efficiency. However, this type of analysis
does not fully capture the dynamic interplay between reductions in electricity demand
from energy efficiency and its effect on electricity prices. We also did not model the
efficiency targets for natural gas in the Energy Roadmap, as they were beyond the scope
of this analysis. However, efficiency investments in natural gas in the industrial,
commercial, and residential sectors will have indirect effects in the electricity sector,
because of downward pressure on natural gas prices from reduced demand.
Analyzing effects on the economy and jobs. NEMS has significant limitations in how it
quantifies the macroeconomic effects of energy and climate policies. For example, it

42
cannot fully account for the positive effects on GDP and jobs of investments in energy
efficiency, renewable energy, and other low-carbon technologies, and of savings on
consumers’ energy bills. Nor does NEMS value other productivity gains and non-energy
benefits that would both accelerate adoption of more advanced technologies and improve
economic performance (Worrell et al. 2003). The model also treats reductions in energy
consumption and increases in energy prices as exerting a negative impact on the
economy, even if overall energy bills are lower. And NEMS does not account for the loss
of GDP that may result from unchecked climate change in the base case.
We addressed some of these limitations by using by using IMPLAN, which identifies
interactions between all sectors of the economy to assess effects at the state and regional
level. This model also reflects some of the positive effects on GDP and employment of
investments in energy efficiency, renewable energy, and other low-carbon technologies,
and of savings on consumers’ energy bills. However, input-output models have several
known shortcomings when analyzing long periods of time, industries that are changing
rapidly, and industries with international trade spillovers.
Our analysis assumes that a portion of the jobs created from investments in the region
would occur outside the region, and our assumptions about that impact vary with the
technologies. We report only jobs created inside the region. However, uncertainties exist
with respect to the amount of new renewable energy and energy efficiency equipment
that would be supplied by producers within each state and the Midwest as a whole. Over
time, variables such as global competition and government-supported manufacturing
incentives can alter the share of total dollars spent on these investments that remains
inside the region, and play an important role in determining local job creation.
Sources of electricity with variable power output. The model does not fully capture the
impact of high levels of variable-output wind and solar on the electricity grid. NEMS
does capture variations in the output of these technologies during nine different time
periods throughout the year for 13 different U.S. regions.18
It also includes the costs of
ramping up and down other sources of power, and building any new facilities needed to
meet demand for electricity and provide a reserve margin. However, the model does not
capture all the fluctuations that can occur over much shorter time periods (such as by the
second, minute, or hour), and at the subregional level.
Capturing the impact of these fluctuations would require modeling of additional ramping
up and down of electricity sources over shorter periods. However, we included additional
costs to account for this. Several studies of wind integration by U.S. and European
utilities and government agencies have found that wind can provide as much as 20–25
percent of electricity generation at the regional or utility level without adverse effects on
the power system’s reliability or the need to store power, at a modest cost of 10 percent
or less of the wholesale cost of wind generation (EERE 2008; Holttinen et al. 2007). Our
results for the core policy case show that wind and PV generate less than 20 percent of
the electricity in each of the three electricity reliability regions that cover the Midwest
18
The model meets electricity demand and provides a reserve margin during three seasons (summer, winter, and spring/fall), and three time periods during a typical day.

43
(and other) states by 2030. However, the penetration level of these technologies would
exceed 25 percent in some subregions with extensive wind or solar resources.
Modeling transmission. The ability of NEMS to model electricity transmission is limited.
While the EIA does include a cost for adding new transmission capacity to support new
electricity generation in the model, it does not capture the full technical complexity of
planning for new transmission capacity, or potential siting constraints. These technical
issues could have important implications for the timing and location of new and upgraded
transmission lines.
Accounting for plant-specific variations in cost. Some technological alternatives, such as
retrofits of coal plants to allow co-firing with biomass, are subject to plant-specific
constraints that can alter costs significantly. The model accommodates some variation in
costs depending on plant size and type. It also includes the costs of transporting biomass
resources from farther away to accommodate higher levels of co-firing. However, greater
detail would increase the accuracy of the model’s projections.
Accounting for the costs of inaction on climate change. The NEMS model cannot account
for the economic, health, and environmental costs associated with inaction on climate
change, which numerous studies found would be widespread, and greatly exceed the cost
of reducing emissions (ASP 2011; UCS 2009a; Ackerman and Stanton 2008; Ruth,
Coelho, and Karetnikov 2007; Stern 2006). Incorporating these costs into NEMS would
be particularly challenging because they depend on actions at the global as well as
regional level.
These limitations of the model, and the uncertainties surrounding some of our key
assumptions, present important opportunities for future research. Other research could
also model different combinations of technologies and policies.

44
Chapter 4. Results: Implementing the Energy Roadmap Targets
This chapter presents results from implementing a regional renewable electricity standard
(RES) and an energy efficiency resource standard (EERS) to meet the goals in the
Midwestern Governors Association’s Energy Roadmap. Using the UCS-NEMS model
and other analyses, we compared the impact of achieving the regional clean energy
targets to that of an existing policy case (or base case).We modeled several policy
scenarios to evaluate a range of possible technology pathways for meeting the Energy
Roadmap regional renewable energy targets, and to examine the impacts on the Midwest
from a federal policy to reduce carbon emissions.
Our core policy case models the effects of implementing an RES and EERS to meet the
Energy Roadmap targets, and we present results showing changes in the electricity
generation mix, electricity and fuel prices, consumer energy bills, job creation and other
economic development benefits, and carbon emissions. This case includes higher
biopower technology and fuel cost assumptions than assumed by EIA to reflect the
significant uncertainties and constraints facing biomass development both today and into
the future.
Our second scenario, referred to as the ―alternative technology pathway,‖ also examines
the impacts of implementing an RES and EERS to meet the Energy Roadmap targets, but
with biopower technology and fuel cost assumptions that are more in line with those used
by the EIA in the Annual Energy Outlook 2009. Specifically, the relative costs of biomass
available for energy production is lower, the amount of biomass that can be co-fired at
existing coal plants is higher: 15 percent of fuel used vs. 5 percent in our core policy case
(see Chapter 3 for more information). Like our core policy case, this alternative
technology pathway scenario implements the RES by building the least-cost renewable
energy technologies first, taken from a supply of all economically available eligible
resources.
Evaluating both policy scenarios together provides valuable insights into the economic
and environmental effects of achieving the Energy Roadmap targets using a different mix
of renewable energy technologies. They can also provide valuable information on the
uncertainties around biomass development constraints.
Our third scenario models the impacts on the Midwest from a federal policy to reduce
carbon emissions in the electricity sector, with and without the Energy Roadmap targets.
For this scenario, we present results on renewable energy development, consumer energy
bills, and carbon emissions.
Our existing policies scenario includes only those state and federal policies which were
adopted through March 2010, such as state-level RES and EERS and the federal
renewable energy tax credits and incentives in the American Recovery and Reinvestment
Act of 2009. It does not include, for example, more recent changes in power plant
regulations that the U.S. Environmental Protection Agency (EPA) is developing to
implement existing statutory standards of the Clean Air Act. Accounting for these
regulatory changes in our base case modeling would likely have made coal use more

45
expensive for many power plants, and the relative economics of greater use of renewable
energy and energy efficiency more attractive.19
Overall, our analysis shows that the region can meet the Energy Roadmap targets
affordably with a range of technologies that would capitalize on the region’s tremendous
renewable energy and efficiency resources. Doing so would spur investment and
innovation, create jobs, save consumers money, cut coal dependence, and reduce global
warming emissions. Our results also show that the Energy Roadmap targets would serve
as a strong complement to a federal carbon policy, spurring greater investments in
renewable energy technologies and saving consumers more money than a federal policy
alone.
Detailed Results: Core Policy Case
Changes in the Electricity Mix
In 2010, the Midwest relied on coal for nearly 68 percent of its power needs. As Midwest
states pursued the Energy Roadmap targets, the region would diversify its electricity
supply using a mix of homegrown renewable energy sources, and significantly reduce
demand for electricity by investing in more energy efficiency technologies in buildings
and industry.
Under the core policy case, non-hydro renewable energy capacity would grow to 63,000
MW by 2030—a nearly fivefold increase above 2010 levels (13,300 MW), and enough
power to serve the equivalent of more than 40 million typical homes. By 2030, gains in
energy efficiency would also reduce annual electricity demand in the region by the
equivalent output of more than 33 new typical-size (600-MW) coal-fired power plants.
The strong growth in renewable energy capacity would allow renewables to account for
35.1 percent of total retail electricity sales in 2030, after gains in energy efficiency—up
from around five percent in 2010. About 10 percent of this capacity would be used for
electricity exported to states within the PJM transmission system but outside the
Midwest.20
Under the existing policies case in contrast, renewable energy would account
for only about 20 percent of electricity sales by 2030, mostly because of existing state
renewable electricity standards.
Achieving the Energy Roadmap targets for renewable energy would spur a diverse mix of
renewable energy sources, led primarily by wind and biopower (Figure 4.1). Wind energy
capacity would grow from 12,000 MW in 2010 to 50,740 MW in 2030—2.3 times the
19
We focused on analyzing the effects of the Energy Roadmap targets compared with existing policies, and the EPA regulations have not been finalized. For a more detailed discussion of how current economic, technological, and policy trends could affect prospects for coal generation, see A Risky Proposition, The Financial Hazards of New Investments in Coal Plants, online at http://www.ucsusa.org/clean_energy/technology_and_impacts/impacts/financial-hazards-of-coal-plant-investments.html. 20
Unless otherwise noted, our results include renewable energy serving other regions since these investments will provide economic benefits in the Midwest.

46
level of development that would occur under our existing policies case.21
Wind power
would account for more than two-thirds of all electricity based on renewable energy in
the Midwest in 2030.
The suite of biopower technologies—dedicated facilities, co-firing at existing coal plants,
and combined heat and power—would account for 25 percent of the renewable energy
mix: 15 percent from CHP, and 10 percent from biomass co-firing. Biomass co-firing at
21
Although the UCS-NEMS model includes offshore wind as an eligible technology for RES compliance, no offshore wind on the Great Lakes was determined to be economically viable during the forecast period.
Figure 4.1. Electricity from Renewable Resources in the Midwest:
Existing Policies vs. Energy Roadmap
Achieving the Energy Roadmap targets for renewable energy would spur development a diverse mix of renewable energy sources, led primarily by wind and biopower. Wind power would account for more than two-thirds of all electricity based on renewable energy in the Midwest in 2030.
Note: The information includes electricity produced to serve other regions.

47
existing coal plants would rise by the equivalent of 4,000 MW of capacity from 2010 to
2030—800 MW more than under existing policies. By 2030, this level of co-firing would
annually consume nearly 15 million dry tons of biomass, and generate 25 billion
kilowatt-hours of electricity.
While biomass CHP would provide 15 percent of renewable energy generation in 2030,
the development of this sector would be driven largely by the need to build cellulosic
ethanol plants to meet the existing federal renewable fuel standard for transportation.
That is because cellulosic biomass can be economically used to produce heat and power
for biofuel refineries while generating enough excess power to sell to the grid.22
However, our results show that there is little incentive to build biomass CHP plants
beyond what is economical for meeting the renewables fuel standard. As a result, there is
very little difference in the amount of biomass CHP used to generate electricity between
the existing policies case and either of our Energy Roadmap policy scenarios. Similarly,
landfill gas and incremental hydropower—resources with fairly limited potential in the
Midwest compared with wind and biopower—show little growth over existing policies
case levels in 2030 under the renewable energy targets in the Energy Roadmap.
Our analysis shows that while the Midwest does experience significant growth in solar
generation from rooftop PV compared with today’s levels, this increase is not driven by
the renewable energy targets in the Energy Roadmap. Rather, growth in solar power
within the region is spurred largely by technology-specific requirements that are part of
existing RES policies in several states.23
The Energy Roadmap targets do not contain technology-specific requirements, and do not
provide any solar incentives beyond existing policies. More than 90 percent of the growth
in solar energy occurs by 2016, when the federal investment tax credit for solar is set to
expire. This suggests that in the Midwest, solar energy may struggle to compete with
wind and biopower through 2030 without additional financial incentives, technology-
specific requirements, or cost reductions beyond those assumed in our analysis.24
To
foster the development of solar energy, Midwest states could consider complementary
policies that spur the use of more solar to achieve the Energy Roadmap targets.
Greater reliance on renewable energy and energy efficiency reduces the need to generate
power from coal and other fossil fuels in the Midwest (Figure 4.2). Under the Energy
Roadmap targets, coal-based generation in 2030 drops by nearly 9 percent from 2010
levels, and by 16 percent compared with existing policies.
22
In the UCS-NEMS model, these plants are assumed to use clean, cellulosic biomass residues and energy crops to produce ethanol as well as electricity, heat, and other byproducts. The model also includes some CHP from the forest products industry. We assume the electricity from these facilities will be used to meet the regional renewable electricity targets. 23
Three Midwest states have solar set-aside requirements: 1.5 percent solar PV by 2025 in Illinois, 0.3 percent solar electric by 2021 in Missouri, and 0.5 percent solar electric by 2024 in Ohio. 24
Solar photovoltaics have shown substantial cost reductions since our analysis was completed. In 2010 weighted average system prices declined 20.5 percent (SEIA 2010), a substantially higher rate than our estimate.

48
Our analysis takes into account electricity produced from natural gas needed to meet peak
demand. Still, the amount of natural gas generation—which now plays a much smaller
role than coal in the Midwest electricity mix—declines under our core policy case, as the
region deploys more renewable energy. However, the recent drop in natural gas prices,
combined with the growing list of announced coal plant retirements, could lead to a much
larger role for gas generation in the Midwest than projected under our base case or policy
scenarios (Bradley et al. 2010; Smith 2010). Ramping up natural gas–based electricity in
the Midwest (and elsewhere) would likely result in further cuts in coal-based power
(Kaplan 2010; Casten 2009).25
Nuclear power generation remains unchanged by the Midwest’s pursuit of the Energy
Roadmap targets. No new nuclear facilities would be brought online in the region during
the forecast period, either in the base case or policy scenarios. As a result, nuclear
generation remains relatively flat from 2010 to 2029 and declines by 3 percent in 2030,
owing to a few expected retirements of reactors at the end of their operating license.26
The regional EERS makes the largest contribution to displacing existing fossil fuel–based
electricity while meeting new demand for power. After accounting for efficiency gains
stemming from existing state policies, other efficiency measures—such as advanced
buildings and industrial processes, and high-efficiency appliances, lighting, and motors—
reduce power demand in the Midwest by the equivalent of 20 percent of sales by 2030.
25
Current natural gas prices—and long-term price projections—have fallen significantly from record highs in 2008, partly as a result of increased domestic production capacity due to technological breakthroughs in drilling. For a more detailed discussion of how current economic, technological, and policy trends could affect the role of natural gas in displacing coal generation, see B. Freese et al. 2011 (A Risky Proposition: The Financial Hazards of New Investments in Coal Plants), online at http://www.ucsusa.org/clean_energy/technology_and_impacts/impacts/financial-hazards-of-coal-plant-investments.html. 26
We adopted the EIA’s assumption that all existing nuclear plants will be relicensed for 20 years, and then retired after operating for 60 years.

49
Figure 4.2. Sources of Electricity under Two Scenarios
Greater reliance on renewable energy and energy efficiency reduces the need to generate
power from coal and other fossil fuels in the Midwest. Under the Energy Roadmap targets,
coal-based generation would drop by nearly 9 percent from 2010 levels by 2030, and by 16
percent compared with existing policies.
Existing Policies Case
Energy Roadmap: Core Policy Case

50
Changes in Consumer Energy Prices and Bills
Consumers across the Midwest stand to realize big savings on their energy bills if the
region implements the Energy Roadmap targets for renewable energy and energy
efficiency, compared with existing policies. Investments in energy efficiency deliver
much of these savings by reducing power demand in homes, businesses, and industry.
Greater use of renewable energy and energy efficiency reduces demand for fossil fuel and
creates more competition in the regional energy market. This leads to slightly lower
prices for the coal and natural gas used to generate electricity, as well as that used to
provide heat for buildings and industrial uses.
Consumer electricity prices in the Midwest would be 0.7 percent lower beginning in
2012, 2.2 percent lower in 2020, and 11.6 percent lower by 2030, under the Energy
Roadmap targets, compared with existing policies. Annual consumer electricity prices
would be 4.4 percent lower, on average, from 2010 to 2030. Annual consumer natural gas
prices would be 0.8 percent lower, on average, starting with a 0.2 percent savings in
2011, and increasing to 0.6 percent in 2020, and 1.6 percent in 2030.
Savings from reduced energy consumption and lower prices for natural gas and other
fossil fuels more than offset the costs of investing in renewables and efficiency.
Cumulative savings for Midwest consumers on their electricity and natural gas bills
would reach $11.3 billion by 2020, and $42.8 billion by 2030, with all sectors of the
economy and all Midwest states sharing in those savings (Figure 4.3).27
The typical Midwest family would begin to see small savings in annual gas and
electricity costs in 2011, with annual electricity savings reaching $61 by 2020 and $179
by 2030, and annual natural gas savings reaching $3 by 2020 and $8 by 2030. A typical
household would save $78 annually on electricity and natural gas bills from 2010 to
2030.
27
All cumulative figures are discounted using a real discount rate of 7 percent.
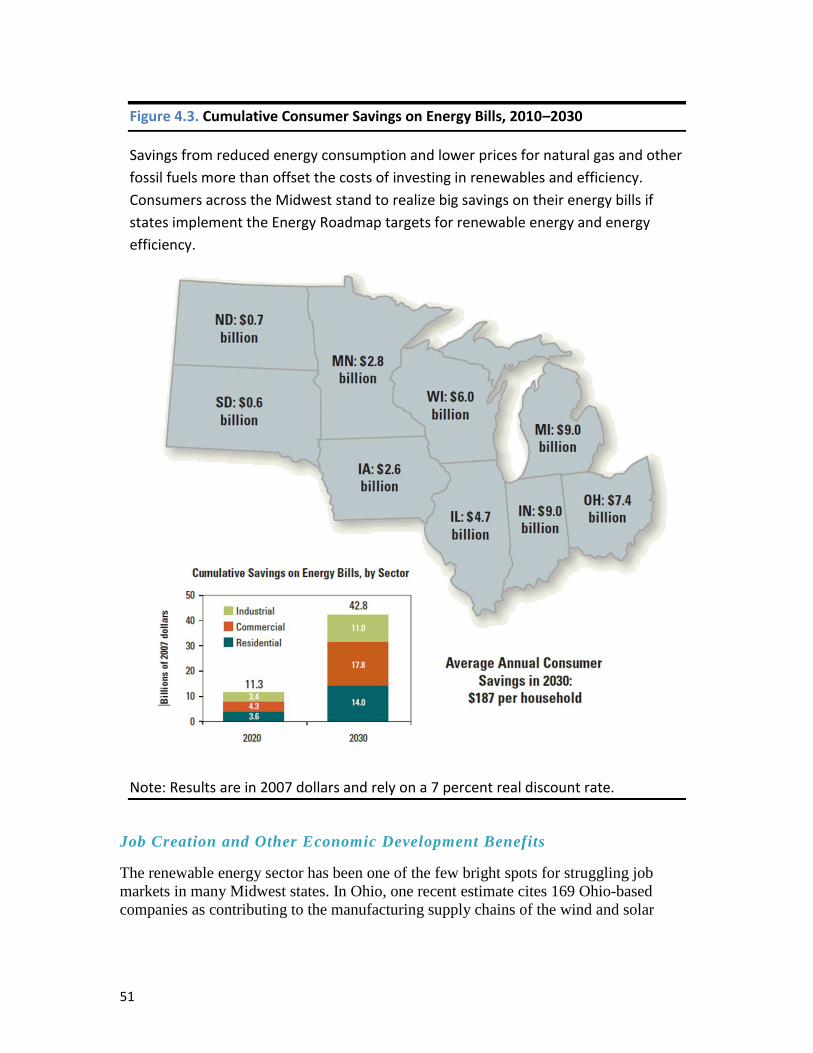
51
Job Creation and Other Economic Development Benefits
The renewable energy sector has been one of the few bright spots for struggling job
markets in many Midwest states. In Ohio, one recent estimate cites 169 Ohio-based
companies as contributing to the manufacturing supply chains of the wind and solar
Figure 4.3. Cumulative Consumer Savings on Energy Bills, 2010–2030
Savings from reduced energy consumption and lower prices for natural gas and other
fossil fuels more than offset the costs of investing in renewables and efficiency.
Consumers across the Midwest stand to realize big savings on their energy bills if
states implement the Energy Roadmap targets for renewable energy and energy
efficiency.
Note: Results are in 2007 dollars and rely on a 7 percent real discount rate.

52
industries.28
Toledo has become a national hub for thin-film solar cell research and
manufacturing (Craig, Learner, and Gray 2011a).
As a hub of wind development in the region, Iowa has attracted major facilities for
manufacturing towers and blades and assembling turbine components (AWEA 2011b).
Illinois boasts more than 100 companies participating in the wind energy supply chain,
supporting 15,000 employees (Craig, Learner, and Gray 2010). And Michigan has more
than 240 manufacturing firms in the wind and solar supply chain (Craig, Learner, and
Gray 2011b).
In fact, just about every Midwest state now has a facility used to manufacture or assemble
wind turbine equipment (Wiser and Bolinger 2010). Midwest states have attracted clean
energy companies because of their strong renewable energy resources, skilled labor force,
manufacturing infrastructure, access to transportation, and state laws and incentives that
support investment in renewable energy.
Further investments in renewable energy and energy efficiency spurred by the clean
energy targets would lead to significant new job opportunities and other local benefits
throughout the region. By 2030, the new clean energy investments needed to achieve the
RES and EERS in the Energy Roadmap would result in a net increase of 85,000 jobs in
Midwest states. These jobs would produce an additional $4.1 billion in income and $2.7
billion in gross state product in 2030, compared with existing policies. The benefits
would span numerous sectors of the regional economy, including manufacturing,
construction, operations, maintenance, agriculture, forestry, finance, and retail.
Beyond jobs related directly to the renewable energy and energy efficiency industries,
our analysis includes indirect jobs created in industries that support the renewable energy
and energy efficiency sectors, as well as ―induced‖ jobs added when income from these
direct and indirect jobs and savings on consumer energy bills are spent in the local
economy. As noted, our results include only net new jobs in the Midwest stemming from
the Energy Roadmap targets. They do not include effects on jobs outside the region (both
jobs gained to support Midwest investments and jobs lost from displaced fossil fuels), or
jobs created in the Midwest from new export opportunities from expanded manufacturing
facilities.
Transitioning to a cleaner, safer energy system would curb job opportunities in the fossil
fuel sector, and our analysis takes this into account. However, those job losses are far
outweighed by job gains from investments in renewable energy and energy efficiency.
Investments in clean energy typically deliver more jobs than electricity based on fossil
fuel generation because a larger share of the money is spent in the regional economy, and
on labor-intensive sectors such as component manufacturing, installation, and
maintenance. By contrast, much of the expenditures on power production from coal and
natural gas plants flow to states outside the region, and support less labor-intensive fuel
extraction and transportation.
28
Other estimates, which include more links in the supply chain as well as emerging companies, report a much higher number of companies (OH DOD 2010).

53
The Midwest spends a significant amount of money importing fossil fuels from outside
the region. In 2008, for example, the Midwest imported 63 percent of the coal used in its
power plants from as far away as Wyoming, sending $7.5 billion out of the region
(Deyette and Freese 2010). Almost all the natural gas used to produce electricity and
fulfill other energy needs is also imported into the region. Substituting local clean energy
for fossil fuels can help reduce out-of-state fossil fuel purchases and keep more money
circulating in local economies across the Midwest. Meeting the Energy Roadmap targets
would cut the region’s coal and other fossil fuel expenditures $2.1 billion per year in
2030.
An important benefit of the new clean energy job opportunities is their distribution across
the region. Large-scale renewable energy facilities can be sited in rural areas with the
best wind resources and capacity to produce biomass feedstocks. Solar panels and energy
efficiency technologies can be installed anywhere, from homes, businesses, and public
buildings in major cities and suburbs to small farms and remote locations. From machine
shops to foundries to assembly facilities, the Midwest’s strong industrial base can also be
deployed to manufacture and build components for wind turbines, solar photovoltaic
panels and films, and biomass facilities. Expanding the region’s manufacturing base can
also create promising export opportunities, given the rapidly growing commitment of
other states and the rest of the world to improving energy efficiency and expanding
renewable energy use.
Achieving the Energy Roadmap targets would also provide an important boost to the
Midwest economy by spurring innovation and entrepreneurship, and injecting private-
sector investment in the region. Through 2030, additional capital investment in renewable
energy and energy efficiency would reach $38 billion. When the investment driven by
existing renewable energy and energy efficiency policies in the region is included, capital
investment would total $66.1 billion by 2030. Wind power and energy efficiency
technologies represent the largest shares of new capital investment.
Investments in solar photovoltaics are driven primarily by technology-specific
requirements under existing RES policies in several states, and by federal investment tax
credits. Meeting the regional RES would not result in significant additional solar
investments. Nevertheless, $7.2 billion would be invested in the solar industry in the
Midwest over the next two decades, largely to supply distributed residential and
commercial PV.
Beyond jobs and capital investments benefiting local economies, farmers and other
landowners in rural areas would gain income under the Energy Roadmap targets from the
harvest and sale of biomass products, and from lease payments for wind turbines installed
on their land. Cumulative biomass payments would reach $4.3 billion by 2030—an
increase of $612 million compared with existing policies. Cumulative wind land-lease
payments would total $660 million—$390 million more than under existing policies. If
farmers and other landowners owned the wind turbines, revenues to them and local
communities would be even higher.
Local communities would also receive some $3.4 billion in cumulative new property
taxes from investments in renewable energy by 2030—$1.6 billion more than under

54
existing policies. These substantial increases in local coffers, especially in rural
communities, could help fund schools and other vital public services.
Reducing CO2 Emissions
If left unchecked, heat-trapping emissions such as CO2 will worsen global warming,
which already threatens our health and environment. Failure to reduce global emissions
would have significant consequences for the Midwest, which would increase in severity
throughout the century. A recent analysis found that unabated climate change will lead to
scorching summers and related heat emergences, dangerous storms and flooding, and m
stress on agriculture throughout the Midwest (Hayhoe et al. 2009).
Fortunately, renewable energy and energy efficiency are smart and affordable global
warming solutions that cut CO2 emissions by reducing fossil fuel use. The Energy
Roadmap targets would lower CO2 emissions from Midwest power plants by more than
120 million metric tons annually by 2030 (16 percent below base-case levels)—
equivalent to the annual emissions from 30 typical new coal plants. These reductions are
greater than the energy-related CO2 emissions of 183 nations in 2009 (EIA 2011a). The
reductions are also on top of those that will occur because of existing renewable energy
and energy efficiency policies in the Midwest.
Along with cutting global warming emissions, reduced fossil fuel use would curb other
harmful air pollutants from power plants, such as mercury and sulfur dioxide, and limit
damage to our water and land from the extraction, transport, and containment of wastes
from fossil fuel.
In fact, the damage to public health and the environment caused by our dependence on
fossil fuels exacts a major toll on the U.S. economy. Harvard Medical School researchers
found that the total cost of damage caused by coal use alone approaches $523 billion per
year nationally, which would add as much as 27 cents per kilowatt-hour to the cost of
coal if plant owners had to pay for it (Epstein et al. 2011). Our analysis does not account
for reductions in harm to public health and the environment resulting from cuts in coal
use under the Energy Roadmap targets. Our results therefore underestimate the economic
benefits to the Midwest from clean energy investments.
Detailed Results: Alternative Technology Pathway
Given its abundant and diverse potential for renewable energy, the Midwest could rely on
a range of technology mixes to meet the Energy Roadmap targets. Even small changes in
assumptions about the cost, performance, and siting and supply constraints of each
technology affect the resulting electricity mix.
Our alternative technology pathway assumes that some of the significant constraints
facing biomass development can be overcome, leading to lower costs and better
performance assumptions for the use of biopower. While these assumptions alter the mix
of electricity generation based on renewable energy, the region can still achieve the
Energy Roadmap targets affordably while reaping similar levels of job creation,
economic development, and environmental benefits.

55
As with our core policy case, meeting the Energy Roadmap targets under our alternative
technology pathway spurs the development of a diverse mix of renewable energy
technologies. The biggest difference between the two cases is the relative contributions of
wind power and biomass co-firing in existing coal plants (Figure 4.4).
Under our alternative technology pathway, biopower technologies account for 47 percent
of total Midwest renewable energy generation in 2030, nearly two-thirds of which comes
from co-firing. The significant growth in co-firing generation compared with our core
Figure 4.4. Electricity from Renewables in the Midwest, 2030:
Core Policy Case vs. Alternative Technology Pathway
Under the alternative technology pathway, which assumes that some of the significant constraints facing biomass development can be overcome, the Midwest would use more biomass to meet the Energy Roadmap targets while reaping similar levels of job creation, economic development, and environmental benefits.

56
policy case stems from more competitive biomass supply costs and a higher limit on co-
firing. As a result, nearly 11,000 MW of coal capacity in the Midwest is converted to co-
firing by 2030—up from less than 90 MW in 2010, and a 130 percent increase compared
with existing policies.
Wind generation also plays a substantial role under this case, accounting for about 46
percent of the Midwest renewable energy mix in 2030. More than 21,000 MW of wind
capacity is added in Midwest states by 2030, reaching 33,240 MW—a nearly 60 percent
increase over the levels needed to meet existing renewable electricity standards.
Increasing renewable energy and energy efficiency under the alternative technology
pathway provides consumer, employment, local economic, and environmental benefits
similar to those under our core policy case (Table 4.1). Job creation and capital
investments are somewhat lower under the alternative pathway, because a larger share of
the renewable energy target is met by co-firing of biomass at existing coal plants, which
is less capital intensive than building wind facilities. Conversely, the greater use of
biomass under the alternative technology pathway puts more money into the pockets of
rural landowners from the harvest and sale of biomass products.
Table 4.1. Economic and Environmental Benefits:
Core Policy Case vs. Alternative Technology Pathway
Core Policy Case Alternative Technology
Pathway
Savings on Electricity and Natural Gas Bills (cumulative)
2010–2020 $11.3 billion $13.2 billion
2010–2030 $42.8 billion $42.4 billion
Annual household savings, 2030 $187 $169
Net Job and Other Economic Benefits (in 2030)
Net job creation 85,700 77,000
Income $4.2 billion $3.5 billion
Gains in gross state product $2.8 billion $2.3 billion
Other Net Economic Benefits (cumulative 2010–2030)
New capital investment in renewable energy
$26.4 billion $11.3 billion
New capital investment in energy efficiency
$14.5 billion $14.5 billion
Biomass payments $610 million $3.2 billion
Wind land-lease payments $390 million $160 million
Property tax revenues $3.5 billion $1.5 billion
Reductions in CO2 Emissions from Power Plants (in 2030)
Reduction in CO2 emissions and percent change from base case
130 million metric tons
(16.7 percent)
120 million metric tons (15.5 percent)

57
Impact of a Federal Carbon Policy on the Midwest
and the Energy Roadmap
Achieving the renewable energy and energy efficiency targets in the Energy Roadmap
would be a responsible step toward reducing global warming emissions in the Midwest—
which is among the nation’s largest sources. However, the targets in the Energy Roadmap
are not substitutes for a comprehensive federal policy. To avoid the most dangerous
effects of climate change, the United States must cut emissions deeply—by at least 80
percent below 2005 levels by 2050 (Gupta et al. 2007; Luers et al. 2007).
An important approach to making these cuts is a robust federal policy that achieves the
needed reductions over time, puts a price on carbon through a compliance system that
requires polluters to pay for their emissions, and invests the resulting funds in energy
efficiency, renewable energy, and other promising low-carbon technologies.
Our analysis examined the effect of combining a strong federal carbon policy with our
alternative technology pathway. We found that implementing the Energy Roadmap
targets would help the Midwest achieve its share of federal cuts in carbon emissions, and
would result in lower consumer costs than under a federal policy alone.
Combining a federal carbon policy with the Energy Roadmap targets makes the federal
policy more affordable for Midwest consumers. Under this approach, cumulative
electricity and natural gas bills would be 2 percent lower by 2030 than under our base
case—and in contrast to a 3 percent increase in cumulative energy costs under a federal
carbon policy alone.29
In other words, the savings that result from meeting the Energy Roadmap targets more
than offset the added costs of a federal carbon policy, and make it affordable for
consumers. Under a federal policy combined with the Energy Roadmap targets,
renewable electricity generation in the Midwest would also be 10 percent higher than
under the federal policy alone,30
and 47 percent higher than under the Energy Roadmap
alone, producing much greater local economic benefits.
29
For comparative purposes, we evaluated energy prices and bills across two census regions: East North Central and West North Central. These regions include states other than the nine that are the primary focus of this report. 30
We did not process regional results from the model to the state level for our federal carbon policy. Instead, we analyzed the NEMS regions that include Midwest states to compare the federal carbon policy case, the Energy Roadmap cases, and the existing policies case. Because these regions include states that are not part of the MGA and therefore would not implement the Energy Roadmap targets, this approach underestimates the percent increase in clean power in the MGA states, where more investments in renewables and energy efficiency would occur.

58
A federal carbon policy would also significantly displace fossil fuel–based electricity
throughout the region: coal generation would fall by 41 percent from 2010 to 2030, and
by 49 percent under a federal policy combined with the Energy Roadmap targets. And
while the Energy Roadmap targets reduce fossil fuel–based electricity and CO2 emissions
compared with existing policies, the decline would be much steeper under a federal
carbon policy, and even deeper under a federal carbon policy combined with the Energy
Roadmap targets (Figure 4.5).
A federal carbon policy alone would lower CO2 emissions from Midwest power plants by
404 million metric tons annually by 2030—52 percent lower than under the base case.
Figure 4.5. Comparison of CO2 Emissions from Midwest Power Plants
While meeting the Energy Roadmap targets would reduce CO2 emissions significantly, a comprehensive federal policy is essential if the United States hopes to avoid the most dangerous effects of climate change. The Energy Roadmap targets would help the Midwest achieve its share of federal cuts in carbon emissions, and would help make a federal policy more affordable by lowering costs to consumers in the Midwest.

59
Implementing the Energy Roadmap targets with a federal carbon policy would cut annual
CO2 emissions even further: by 459 million metric tons by 2030, or 59 percent below
base case levels.

60
Chapter 5. Policy Recommendations: Setting a Course for a Midwest
Clean Energy Future
Placing Midwest states on a sensible and attainable path toward a clean energy future can
help solve several of the region’s challenges: creating jobs, boosting the economy, cutting
dependence on coal, and reducing the heat-trapping emissions that cause global warming.
Our analysis shows that meeting the renewable energy and energy efficiency targets in
the Energy Roadmap would provide significant economic and environmental benefits for
the Midwest. Investing in clean energy will spur innovation and entrepreneurship, help
revitalize the manufacturing sector, and create tens of thousands of jobs. These
investments will make energy more affordable for families and businesses, boost local
economies, and help keep the region globally competitive. Tapping the region’s ample
renewable energy and energy efficiency resources will position the Midwest as a clean
energy leader, and confer distinct advantages over other regions should the federal
government implement policies that limit carbon emissions.
This chapter details some of the critical renewable energy, energy efficiency, and climate
policies that would help the Midwest transition to a clean energy future.
Key Policies for Cleaner Electricity
The Midwest is rich in renewable energy resources and the know-how to capitalize on
them. However, taking full advantage of this opportunity requires smart and practical
actions to give clean power solutions a strong foundation:
Enact or enhance state renewable electricity standards to match the Energy
Roadmap targets. State RESs have been a key driver of record-breaking growth in
electricity from renewables over the past decade, accounting for at least 60 percent of
total non-hydro additions to that capacity from 1998 to 2009 (Wiser 2010). The Energy
Roadmap targets must be implemented on a state-by-state basis, but the Midwest will
benefit most when every state adopts the targets of 10 percent of electricity from
renewables by 2015, and 30 percent by 2030, for all electric utilities.
Leading states, such as California, Colorado, and Hawaii, have made renewable energy
commitments at or above the Energy Roadmap target. In the Midwest, Minnesota and
Illinois are on track to meet the Energy Roadmap target, with RESs of 25 percent by
2025 for most utilities. In Minnesota, Xcel Energy must achieve a higher 30 percent RES
by 2020. Other Midwest states have made significant progress in implementing RES
policies, but none have committed to meeting the Energy Roadmap’s 30 percent target
(Figure 5.1).

61
Support a national renewable electricity standard of at least 25 percent by 2025. Congressional delegations from Midwest states should support a national RES of at least
25 percent by 2025, with a national credit-trading system as a means of compliance.
Studies have shown that such an approach is feasible and affordable, and would
significantly reduce carbon emissions from the electricity sector (UCS 2009b; Nogee,
Deyette, and Clemmer 2007).
A national approach would also provide additional economic opportunities for the
Midwest. For example, a national RES would spread responsibility for transitioning to a
Figure 5.1. Existing Renewable Electricity Standards and Voluntary Goals in the
Midwest
Many Midwest states have established an RES, seeing it as an effective policy for
deploying renewable energy technologies. Enacting or enhancing a renewable
energy standard to match the Energy Roadmap target would produce additional
benefits across the region.
Source: Adapted from DSIRE 2011.

62
clean energy economy across all states, and create a large market for the Midwest to
export electricity based on renewables or credits. A federal standard would also create
new markets for sending renewable energy equipment manufactured in the Midwest to
other states.
Extend tax and other financial incentives for renewable energy. Short-term, on-
again/off-again extensions of tax credits for renewable energy have produced a boom-
and-bust cycle that injects needless uncertainty into the financing and construction of
such projects and raises their cost. Congressional delegations from Midwest states should
support a long-term extension of federal incentive programs such as the production tax
credit, which is set to expire at the end of 2012 for wind and biopower. States should also
consider adopting tax credits and other incentives to supplement federal policies.
Increase funding for research and development on energy efficiency and renewable
energy. A significant increase in R&D funding for clean energy technologies is needed to
lower their costs and spur widespread use. Midwest universities and research institutions
have a world-class reputation for driving technological innovation, and should play a
central role in finding and improving clean energy solutions. To ensure adequate R&D
resources, states should support greater funding at both federal and state levels.
Resolve state and local conflicts around siting electricity transmission lines and
renewable energy projects. It is critical that policy makers reduce the state-by-state
balkanization that is crippling the creation of a nationwide grid for renewable energy.
States should remove regulatory barriers to regional transmission planning, siting, and
approval, and adopt model legislation that enhances the ability of utility regulatory
commissions in each jurisdiction to consider and approve multi-jurisdictional
transmission projects.
Policy makers should also support efforts now under way to plan and facilitate new
capacity to transmit electricity in the Midwest, and allocate the costs of that capacity.
These efforts include:
The Midwest ISO’s Regional Generator Outlet Study (MISO 2010).
The Eastern Interconnection Planning Collaborative Transmission Study.
Planning and development of renewable energy zones and the transmission
needed to support them in each jurisdiction.
Efforts to equitably and effectively allocate the costs of financing regional
transmission. Collaboration among the Midwest ISO, the Cost Allocation and
Regional Planning Work Group of the Organization of Midwest ISO States, and
the Upper Midwest Transmission Development Initiative should continue.
Other initiatives by the Midwest ISO and other regional transmission operators
around grid integration.
Cooperation in enhancing and expediting transmission capacity in the Midwest and
nationally will bring added benefits to the region: a stronger, more reliable grid, more
opportunities for exporting renewable energy and equipment to other states, and new jobs
associated with building and maintaining an enhanced grid. Delivering some of these
63
benefits will require giving the Federal Energy Regulatory Commission more authority to
expedite new transmission capacity for renewable energy projects.
Besides resolving transmission bottlenecks, Midwest policy makers should streamline the
approval process for siting renewable energy projects, and improve cooperation between
local, state, and federal agencies while ensuring responsible development. Siting
guidelines should be fair, equitable, and based on best practices informed by the latest
research on transmission technology.
Ensure the sustainability of biopower. The region needs to promote the development of
a sustainable and reliable biomass supply system. It could do so by developing
sustainability guidelines and best management practices, funding research on inventories
of biomass potential and effective biomass feedstocks, and coordinating regional
strategies to develop the technology. Sustainability guidelines should include:
Accounting for lifecycle global warming emissions—including those from
growing and transporting biomass—for each type of feedstock, conversion
technology, and location, based on scientific research.
Protection for conservation land, natural ecosystems, and threatened or
endangered species or unique ecosystems.
Avoidance of air pollutants identified under the Clean Air Act, such as nitrous
oxides, sulfur oxides, particulates, and volatile organic compounds.
Measures that encourage the most energy-efficient use of biomass feedstocks, in
line with local demand and infrastructure.
Regional and local variations that affect sustainable feedstock management and
procurement, with policies and programs tailored to regions or even localities.
Federal and regional policies should set minimum standards and rules that apply to all
market players, while preserving rather than preempting the ability of states to implement
more stringent rules. Practical and effective enforcement and certification of sustainable
practices must also be part of any policy.
Key Policies for Energy Efficiency
Making our industries and buildings more efficient must be a cornerstone of any
comprehensive strategy for transitioning to a clean energy economy. Energy efficiency
can quickly yield significant and sustained reductions in energy use, while providing
substantial savings on energy bills for consumers and businesses. Creating a highly
energy-efficient economy, however, requires policies and programs to help overcome
significant and entrenched market barriers.
Enact or enhance an energy efficiency resource standard to match the Energy
Roadmap targets. Many Midwest states have established an EERS, seeing it as an
effective policy for deploying energy efficiency technologies. However, only one state in
the region (Illinois) has committed to achieving the Energy Roadmap’s target of 2
percent annual reductions in electricity sales by 2015 and thereafter (Figure 5.2).

64
The Energy Roadmap’s efficiency targets are consistent with actual efficiency gains and
commitments by other leading states, including Arizona, Massachusetts, New York, and
Vermont (Molina et al. 2010). In the Midwest, North Dakota and South Dakota should
adopt EERS policies, while other states with EERSs should increase or accelerate their
annual targets, and ensure that they apply to all electric utilities. To help meet their
targets and remove key market barriers, states can also create new public benefits funds,
which are furnished by a small charge on all electricity sold and support investments in
efficiency technologies, or strengthen existing ones.
Figure 5.2. Existing Energy Efficiency Resource Standards in the Midwest
Many Midwest states have established an EERS, seeing it as an effective policy for
deploying energy efficiency technologies. Enacting or enhancing an energy efficiency
resource standard to match the Energy Roadmap target would produce additional
benefits for consumers across the region.
Source: Adapted from DSIRE 2011. Note: Numbers represent percent annual reduction in electricity sales.

65
Use regulatory mechanisms to change utility incentives. To complement mandatory
energy efficiency programs for utilities, Midwest states should adopt regulatory
mechanisms that remove utilities’ traditional reluctance to sell less energy. These should
include incentives for investments in energy efficiency, such as by allowing regulated
utilities to recover the costs of such investments and earn profits by meeting efficiency
targets. Several of these mechanisms are already in place in Illinois, Michigan, Ohio, and
Wisconsin.
Adopt more stringent energy efficiency codes for buildings. All new buildings should
comply with the most stringent minimum energy code in effect at the time of
construction. Today this is the 2009 international energy conservation code (IEEC) and
the 90.1-2010 code of the American Society of Heating, Refrigerating, and Air-
Conditioning Engineers (ASHRAE). These model codes are updated every three years,
and every state in the Midwest except North Dakota, South Dakota, Kansas, and Missouri
has adopted them, or is in the process of doing so.
States should adopt automatic review clauses to ensure that their codes reflect the latest
standards. That approach ensures that builders deploy the most cost-effective
technologies and best practices in all new residential and commercial construction.
Midwest states should also encourage the use of above-code standards, such as the U.S.
Green Building Council’s Leadership in Energy and Environmental Design (LEED)
rating system, and the U.S. Department of Energy’s Energy Star program for new homes.
Set a high bar by adopting stringent energy efficiency codes for all government
buildings. State governments can save taxpayer funds and provide case studies for
owners of commercial buildings by requiring agencies to reduce energy use in their
buildings by an annual percentage that is equal to or higher than the Energy Roadmap
target.
Spur the deployment of combined-heat-and-power systems. By recovering and
reusing the waste heat from producing electricity, CHP systems can achieve efficiencies
of up to 80 percent (compared with about 33 percent for the average fossil-fueled power
plant). That, in turn, reduces fuel use, emissions, and the need for new transmission
capacity. Midwest states should enact standards (and support federal standards) for
permitting CHP systems and connecting them to the local power grid, and establish
equitable interconnection fees and tariffs for standby, supplemental, and buy-back power.
More funding for federal and state programs that spur the use of CHP through education,
coordination, and direct project support is also needed.
Accelerate adoption of energy efficiency technologies. Several additional measures are
available to accelerate the growth of energy efficiency measures, including consumer
education, smart grid technologies, electricity rates that promote energy efficiency, and
financing incentives for energy efficiency investments. Every Midwest state has enacted
at least one of these policies. However, wider adoption among all states is needed to
ensure that the region achieves the 2 percent annual target for improving energy
efficiency.
A Comprehensive Federal Policy for Reducing Carbon Emissions

66
Our analysis shows that meeting the Energy Roadmap targets will help the Midwest
transform its economy by spurring investments and research in renewables and energy
efficiency. However, that approach is not a substitute for reducing emissions to the levels
that most scientists say are essential to prevent the world from warming another 2° F
above today’s temperatures, when far more serious consequences become inevitable.
Efforts to transition to a clean energy economy will ultimately fall short unless we also
tackle the central issue in addressing climate change: achieving deep cuts in emissions.
The need to get started today is urgent.
A core element of our nation’s response to climate change should be a federal carbon
policy that moves swiftly to deliver deep cuts in carbon emissions, and charges polluters
for their remaining emissions. Such a policy should create a clear market signal that
rewards cuts in heat-trapping emissions and drives private investments in clean energy.
Such policies should include several critical features that provide certainty for investors:
a mechanism for adjusting emissions targets to the latest science, incentives to support
investments in renewables and efficiency, and consumer protections that do not diminish
the effect of the policy.31
Any federal policy should also preserve the ability of states to
implement more stringent climate, energy, and transportation policies.
Midwest states should support efforts to enact comprehensive federal climate policies, as
they will spur investment and economic growth in the region. In the absence of federal
leadership, Midwest states can help build momentum and experience by enacting their
own state and regional programs.
Conclusion: A Vision for a Midwest Clean Electricity Future
From the strong winds of the Great Plains, to the agricultural lands of the Corn Belt, to
the sun shining bright from Cleveland, Ohio, to Rapid City, South Dakota, the Midwest is
home to some of the world’s best renewable energy resources. The region is also
endowed with a strong industrial base and leading research universities, where a tradition
of hard work and innovation has long served as an economic engine for the entire nation.
Few areas of the world have this ideal mix of resources, industrial capacity, and
knowledge. These advantages give the Midwest the tools to turn the challenges of a
stalled economy and an unsustainable, polluting energy system into an opportunity for
economic prosperity, job growth, and a healthy environment.
Achieving the renewable energy and energy efficiency targets set forth in the Energy
Roadmap would provide significant economic benefits to the Midwest. Meeting those
goals would spur innovation and create tens of thousands of jobs in big cities and small
towns across the Midwest. That effort would also provide much-needed savings for
families and businesses on their energy bills, and a more diversified, reliable, and secure
power supply. Such an endeavor would also move the Midwest away from its
31
For more information, see Cleetus, Clemmer, and Friedman 2009 (Climate 2030: A National Blueprint for a Clean Energy Economy), online at http://www.ucsusa.org/global_warming/solutions/big_picture_solutions/climate-2030-blueprint.html.

67
dependence on coal, improving public health and reducing the dangers of global warming
and toxic emissions.
Fully capturing these important economic benefits and removing key market barriers will
require smart policy solutions. Many Midwest states have already taken important steps
to promote clean energy, and they must not retrench. Instead, each state can go further to
strengthen or enact policies that at least match the Energy Roadmap targets, and that
support local, regional, federal, and international efforts to promote renewable energy,
energy efficiency, and cuts in carbon emissions.
States can benefit from enacting these policies individually, but they will benefit even
more by acting together. With each state doing its part to promote renewable energy and
energy efficiency, all Midwest states will collectively reap many important benefits today
while building a clean and sustainable economy for future generations.

68
References
Ackerman, F., and E.A. Stanton. 2008. Climate change and the U.S. economy: The costs
of inaction. Medford, MA: Global Development and Environment Institute, Tufts
University; and Stockholm Environment Institute. Online at http://www.sei-
us.org/climate-and-energy/US_Costs_of_Inaction.doc.
Al-Juaied, M., and A. Whitmore. 2009. Realistic costs of carbon capture. Cambridge,
MA: Belfer Center for Science and International Affairs, Harvard Kennedy School.
Online at
http://belfercenter.ksg.harvard.edu/publication/19185/realistic_costs_of_carbon_capture
.html.
American Security Project (ASP). 2011. Pay now, pay later: A state-by-state assessment
of the costs of climate change. Online at http://www.secureamericanfuture.org/pay-now-
pay-later/.
American Wind Energy Association (AWEA). 2011a. U.S. wind industry year-end 2010
market report. Washington, DC. Online at
http://www.awea.org/learnabout/publications/upload/4Q10_market_outlook_public.pdf.
American Wind Energy Association (AWEA). 2011b. Wind energy facts: Iowa.
Washington, DC. Online at
http://www.awea.org/learnabout/publications/factsheets/upload/4Q10-Iowa.pdf.
American Wind Energy Association (AWEA). 2011c. State-specific fact sheets, updated
through fourth quarter 2010. Online at
http://www.awea.org/learnabout/publications/factsheets/factsheets_state.cfm, accessed
May, 10 2011.
Anex, R., L. Lynd, M. Laser, A. Heggenstaller, and M. Liebman. 2007. Potential for
enhanced nutrient cycling through coupling of agricultural and bioenergy systems. Crop
Science 47 (July-Aug.).
Blanco-Canqui, H. 2010. Energy crops and their implications on the soil and
environment. Agronomy Journal 102 (2).
Bolinger, M., and R. Wiser. 2010. Memorandum: Comparison of AEO 2010 natural gas
price forecast to NYMEX futures prices. LBNL-2949E. Berkeley, CA: Lawrence
Berkeley National Laboratory.
Bolinger, M., R. Wiser, and W. Golove. 2002. Quantifying the value that wind power
provides as a hedge against volatile natural gas prices. Berkeley, CA: Lawrence
Berkeley National Laboratory. Online at http://eetd.lbl.gov/ea/emp/reports/50484.pdf.
Bradley, M.J., S.F. Tierney, C.E. Van Atten, P.J. Hubbard, A. Saha, and C. Jenks. 2010.
Ensuring a clean, modern electric generating fleet while maintaining electric system
reliability. Concord, MA: M.J. Bradley and Associates. Online at

69
http://www.mjbradley.com/documents/MJBAandAnalysisGroupReliabilityReportAugust2
010.pdf.
Casten, S. 2009. Natural gas as a near-term CO2 mitigation strategy. Grist, December 15.
Cleetus, R., S. Clemmer, and D. Friedman. 2009. Climate 2030: A national blueprint for
a clean energy economy. Cambridge, MA: Union of Concerned Scientists.
Coppock, D.L., D.L. Snyder, L.D. Sainsbury, M. Amin, and T.D. McNiven. 2009.
Intensifying beef production on Utah private land: Productivity, profitability, and risk.
Rangeland Ecology & Management 62:253–267.
Craig, A., H. Learner, and P. Gray. 2011a. The solar and wind energy supply chain in
Ohio. Chicago, IL: Environmental Law and Policy Center.
Craig, A., H. Learner, and P. Gray. 2011b. The solar and wind energy supply chain in
Michigan. Chicago, IL: Environmental Law and Policy Center.
Craig, A., H. Learner, and P. Gray. 2010. The wind energy supply chain in Illinois.
Chicago, IL: Environmental Law and Policy Center.
Dale, B.E., B.D. Bals, S. Kim, and P. Eranki. 2010a. Biofuels done right: Land efficient
animal feeds enable large environmental and energy benefits. Environmental Science &
Technology 44(22):8385–8389. Online at http://pubs.acs.org/doi/abs/10.1021/es101864b.
Dale, V.H., R. Lowrance, P. Mulholland, and G. Phillip Robertson. 2010b. Bioenergy
sustainability at the regional scale. Ecology and Society 15(4):23. Online at
http://www.ecologyandsociety.org/vol15/iss4/art23/.
Database of State Incentives for Renewables and Efficiency (DSIRE). 2011. Summary
Maps. Raleigh, NC North Carolina Solar Center. Online at:
http://www.dsireusa.org/summarymaps/index.cfm?ee=1&RE=1
Deyette, J., and B. Freese. 2010. Burning coal, burning cash: Ranking the states that
import the most coal. Cambridge, MA: Union of Concerned Scientists.
Downey, J. 2011. Duke Energy proposes Edwardsport compromise. Charlotte Business
Journal, March. Online at
http://www.bizjournals.com/charlotte/blog/power_city/2011/03/duke-proposes-
edwardsport-compromise.html, accessed May 11, 2011.
Energy Information Administration (EIA). 2011a. International energy statistics: Total
carbon dioxide emissions from the consumption of energy. Washington, DC: U.S.
Department of Energy. Online at
http://www.eia.gov/cfapps/ipdbproject/IEDIndex3.cfm?tid=90&pid=44&aid=8.
Energy Information Administration (EIA). 2011b. Natural gas navigator. Interactive
database. Washington, DC: U.S. Department of Energy. Online at
http://www.eia.doe.gov/dnav/ng/hist/n3045us3a.htm, accessed May, 10, 2011.

70
Energy Information Administration (EIA). 2010a. State CO2 emissions statistics.
Washington, DC: U.S. Department of Energy. Online at
http://www.eia.doe.gov/oiaf/1605/state/state_emissions.html, accessed October 26, 2010.
Energy Information Administration (EIA). 2010b. Average retail price for bundled and
unbundled consumers by sector, census division, and state. Washington, DC: U.S.
Department of Energy. Online at http://www.eia.doe.gov/cneaf/electricity/esr/table4.html,
accessed April 7, 2011.
Energy Information Administration (EIA). 2010c. Electric Power Annual 2009 - State
Data Tables. Net Generation by State by Type of Producer by Energy Source (EIA-906,
EIA-920, and EIA-923). Washington, DC: U.S. Department of Energy. Online at
http://www.eia.gov/cneaf/electricity/epa/epa_sprdshts.html, Released November, 2010.
Energy Information Administration (EIA). 2009. Annual energy outlook 2009 with
projections to 2030. Washington, DC: U.S. Department of Energy. Online at
http://www.eia.doe.gov/oiaf/aeo/aeoref_tab.html.
Energy Information Administration (EIA). 2008. Renewable energy trends 2007.
Washington, DC: U.S. Department of Energy. Online at
http://www.eia.doe.gov/cneaf/solar.renewables/page/trends/rentrends.htm.
Energy Information Administration (EIA). 2007. Energy and economic impacts of
implementing both a 25-percent renewable portfolio standard and a 25-percent
renewable fuel standard by 2025. Washington, DC: U.S. Department of Energy.
Environmental Law and Policy Center (ELPC). 2001. Repowering the Midwest. Chicago,
IL.
Environmental Protection Agency (EPA). 2010. Landfill methane outreach program.
Database. Online at http://www.epa.gov/lmop/projects-candidates/operational.html,
accessed January 8, 2011.
Epstein, P.R., J.J. Buonocore, K. Eckerle, M. Hendryx, B.M. Stout III, R. Heinberg, R.W.
Clapp, B. May, N.L. Reinhart, M.M. Ahern, S.K. Doshi, and L. Glustrom. 2011. Full cost
accounting for the life cycle of coal. Annals of the New York Academy of Sciences
1219:73–98.
Fargione, J., J. Hill, D. Tilman, S. Polasky, and P. Hawthorne. 2008. Land clearing and
the biofuel carbon debt. Science 319:1235–1238.
Fish and Wildlife Service (FWS). 2010. Recommendations of the wind turbine guidelines
advisory committee. Washington, DC: Department of the Interior. Online at
www.fws.gov/habitatconservation/windpower/Wind_Turbine_Guidelines_Advisory_Com
mittee_Recommendations_Secretary.pdf.
Friedrich, K., M. Eldridge, D. York, P. Witte, and M. Kushler. 2009. Saving energy cost-
effectively: A national review of the cost of energy saved through utility-sector energy

71
efficiency programs. Report no. U092. Washington, DC: American Council for an
Energy-Efficient Economy. Online at http://www.aceee.org/pubs/u092.htm.
Freese, B., S. Clemmer, C. Martinez, and A. Nogee. 2011. A risky proposition: The
financial hazards of new investments in coal plants. Cambridge, MA: Union of
Concerned Scientists.
Gallucci, M. 2011. Ohio to build first offshore wind farm in Great Lakes, aims to boost
local industry. SolveClimate News, May 6. Online at
http://www.reuters.com/article/2011/05/06/idUS371823802820110506.
Global Wind Energy Council (GWEC). 2010. Global wind 2009 report. Washington,
DC. Online at
http://www.gwec.net/fileadmin/documents/Publications/Global_Wind_2007_report/GWE
C_Global_Wind_2009_Report_LOWRES_15th.%20Apr..pdf.
Goossens, E. 2011. Solar power may already rival coal, prompting installation surge.
Bloomberg, April 5. Online at http://www.bloomberg.com/news/2011-04-05/solar-
energy-costs-may-already-rival-coal-spurring-installation-boom.html.
Government Accountability Office (GAO). 2004. Wind power’s contribution to electric
power generation and impact on farms and rural communities. Washington, D.C. Online
at http://www.gao.gov/new.items/d04756.pdf.
Gupta, S., D.A. Tirpak, N. Burger, J. Gupta, N. Höhne, A.I. Boncheva, G.M. Kanoan, C.
Kolstad, J.A. Kruger, A. Michaelowa, S. Murase, J. Pershing, T. Saijo, and A. Sari. 2007.
Policies, instruments and co-operative arrangements. In Climate change 2007:
Mitigation—Contribution of Working Group III to the Fourth Assessment Report of the
Intergovernmental Panel on Climate Change, edited by B. Metz, O.R. Davidson, P.R.
Bosch, R. Dave, and L.A. Meyer. Cambridge, UK: Cambridge University Press.
Hayhoe, K., J. VanDorn, V. Naik, and D. Wuebbles. 2009. Climate change in the
Midwest: Projections of future temperature and precipitation. Cambridge, MA: Union of
Concerned Scientists.
Holttinen, H., P. Meibom, C. Ensslin, L. Hofmann, A. Tuohy, J.O. Tande, A.
Astanqueiro, E. Gomez, L. Soder, A. Shakoor, J.C. Smith, B. Parsons, and F. van Hulle.
2007. State of the art of design and operation of power systems with large amounts of
wind power: Summary of IEA wind collaboration. European Wind Energy Conference,
May 7–10, Milan. Online at http://www.risoe.dk/rispubl/art/2007_120_paper.pdf.
Hurley, D., K. Takahashi, B. Biewald, J. Kallay, and R. Maslowski. 2008. Costs and
benefits of electric utility energy efficiency in Massachusetts. Prepared for the Northeast
Energy Efficiency Council. Cambridge, MA: Synapse Energy Economics.
Illinois Commerce Commission (ICC). 2010. Illinois Commerce Commission analysis of
the Taylorville Energy Center facility cost report. Report to the Illinois General
Assembly. Online at http://www.icc.illinois.gov/electricity/tenaska.asp.
72
Interagency Task Force on Carbon Capture and Storage (ITF CCS). 2010. Report of the
Interagency Task Force on Carbon Capture and Storage. Washington, DC: Department of
Energy. Online at
http://fossil.energy.gov/programs/sequestration/ccstf/CCSTaskForceReport2010.pdf.
Intergovernmental Panel on Climate Change (IPCC). 2005. IPCC special report on
carbon dioxide capture and storage. Prepared by Working Group III of the
Intergovernmental Panel on Climate Change, edited by B. Metz, B., O. Davison, H.C. de
Coninck, M. Loos, and L.A. Meyer. Cambridge, UK: Cambridge University Press
Johnson, J., W. Wilhelm, D. Karlen, D. Archer, B. Wienhold, D. Lightle, D. Laird, J.
Baker, T. Ochsner, and J. Novak. 2010. Nutrient removal as a function of corn stover
cutting height and cob harvest. Bioenergy Research 3(4). Online at
http://www.springerlink.com/content/h841j4r78237776n/.
Kaplan, S.M. 2010. Displacing coal with generation from existing natural gas-fired
power plants. Washington, DC: Congressional Research Service. Online at
http://assets.opencrs.com/rpts/R41027_20100119.pdf.
KEMA. 2009. IEA Bioenergy Task 32 Deliverable 4: Technical status of biomass co-
firing. Arnhem, the Netherlands. Online at http://www.ieabcc.nl/publications/09-
1654%20D4%20Technical%20status%20paper%20biomass%20co-firing.pdf
Lazard. 2008. Levelized cost of energy analysis, version 2.0. Presentation at National
Association of Regulatory Utility Commissions conference, New York, NY, June.
Lightle, D.T. 1997. A soil conditioning index for cropland management systems. Draft
documentation. Lincoln, NE: U.S. Department of Agriculture, Natural Resources
Conservation Service, National Soil Survey Center.
Lightle, D.T., and M.S. Argabright. 1999. A soil conditioning index for cropland
management systems. Lincoln, NE: U.S. Department of Agriculture, Natural Resource
Conservation Service, National Soil Survey Center.
Luers, A.L., M.D. Mastrandrea, K. Hayhoe, and P.C. Frumhoff. 2007. How to avoid
dangerous climate change: A target for U.S. emissions reductions. Cambridge, MA:
Union of Concerned Scientists.
Mackun, P., and S. Wilson. 2011. Population distribution and change, 2000 to 2010.
2010 Census Briefs, C2010BR-01. Washington, DC: U.S. Census Bureau. Online at
http://www.census.gov/prod/cen2010/briefs/c2010br-01.pdf.
Manomet Center for Conservation Sciences. 2010. Biomass sustainability and carbon
policy study. Prepared for Massachusetts Department of Energy Resources. Manomet,
MA. Online at
http://www.manomet.org/sites/manomet.org/files/Manomet_Biomass_Report_Full_LoRez
.pdf.

73
Midwestern Energy Efficiency Alliance (MEEA). 2011. Midwest Energy Solutions
conference. Chicago, IL., January. Online at
http://meeaconference.org/uploads/file/ppt2011/MES_2011-01-14_Kushler.pdf.
Midwestern Governors Association (MGA). 2009. Midwestern energy security and
climate stewardship roadmap 2009: Summary of advisory group recommendations.
Washington, DC. Online at
http://www.midwesterngovernors.org/Publications/Roadmap.pdf.
Midwestern Governors Association (MGA). 2007a. Midwestern greenhouse gas accord.
Signed at Midwestern Energy Security and Climate Stewardship Summit, Milwaukee,
WI. Online at
http://www.midwesterngovernors.org/Publications/Greenhouse%20gas%20accord_Layo
ut%201.pdf.
Midwestern Governors Association (MGA). 2007b. Midwestern energy security and
climate stewardship platform for the Midwest. Signed at Midwestern Energy Security
and Climate Stewardship Summit, Milwaukee, WI. Online at
http://www.midwesterngovernors.org/Publications/EnergyPlatform.pdf.
Midwest ISO (MISO). 2010. Regional generator outlet study. St. Paul, MN. Online at
http://www.midwestmarket.org/page/Renewable%20Energy%20Study.
Molina, M., M. Neubauer, M. Sciortino, S. Nowak, S. Vaidyanathan, N. Kaufman, and
A. Chittum. 2010. The 2010 state energy efficiency scorecard. Washington, DC:
American Council for an Energy-Efficient Economy.
National Action Plan for Energy Efficiency. 2010. Customer incentives for energy
efficiency through program offerings. Prepared by William Prindle, ICF International.
Washington, DC: U.S. Environmental Protection Agency and Department of Energy.
Online at http://www.epa.gov/eeactionplan.
National Action Plan for Energy Efficiency. 2007. Aligning utility incentives with
investment in energy efficiency. Prepared by Val R. Jensen, ICF International.
Washington, DC: U.S. Environmental Protection Agency and Department of Energy.
Online at http://www.epa.gov/eeactionplan.
National Renewable Energy Laboratory (NREL). 2010. Estimates of windy land area and
wind energy potential, by state, for areas >= 30% capacity factor at 80m. Golden, CO.
Online at http://www.windpoweringamerica.gov/wind_maps.asp.
National Renewable Energy Laboratory (NREL). 2009. Wind technologies market report.
Golden, CO.
National Wind Coordinating Committee (NWCC). 2010. Wind turbine interactions with
birds, bats, and their habitats: A summary of research results and priority questions.
Online at
https://www.nationalwind.org/assets/publications/Birds_and_Bats_Fact_Sheet_.pdf.
74
Nogee, A., J. Deyette, and S. Clemmer. 2007. The projected impacts of a national
renewable portfolio standard. Electricity Journal 20(4).
Office of Energy Efficiency and Renewable Energy (EERE). 2008. 20% wind energy by
2030: Increasing wind energy’s contribution to U.S. electricity supply. DOE/GO-102008-
2578. Washington, DC: U.S. Department of Energy. Online at
http://www.20percentwind.org/20p.aspx?page=Report.
Ohio Department of Development (OH DOD). 2010. Ohio: We make wind work.
Columbus, Ohio. Online at
http://development.ohio.gov/wind/Documents/WindSupply_Brochure.pdf.
Paidipati, J., L. Frantzis, H. Sawyer, and A. Kurrasch. 2008. Rooftop photovoltaics
market penetration scenarios. Navigant Consulting, for National Renewable Energy
Laboratory, Golden, CO. Online at http://www.nrel.gov/docs/fy08osti/42306.pdf.
Pers-Anders, E., T. Naucler, and J. Rosander. 2007. A cost curve for greenhouse gas
reduction. McKinsey Quarterly, February. Online at
https://www.mckinseyquarterly.com/A_cost_curve_for_greenhouse_gas_reduction_1911
PJM. 2011a. ATSI integration. Online at http://www.pjm.com/markets-and-
operations/market-integration/atsi.aspx, accessed May 10, 2011.
PJM. 2011b. Duke integration. Online at http://www.pjm.com/markets-and-
operations/market-integration/duke.aspx, accessed May 10, 2011.
Princeton Energy Resources International (PERI). 2007. Revising the long term
multipliers in NEMS: Quantifying the incremental transmission costs due to wind power.
Report to the EIA for use in Annual Energy Outlook 2008. Princeton, NJ.
Prometheus Institute. 2006. U.S. market analysis. PV News 25(5):4–5.
Renard, K.G., G.R. Foster, G.A. Weesies, D.K. McCool, and D.C. Yoder. 1996.
Predicting soil erosion by water: A guide to conservation planning with the revised
universal soil loss equation. Washington, DC: U.S. Department of Agriculture,
Agricultural Research Service.
Ruth, M., D. Coelho, and D. Karetnikov. 2007. The U.S. economic impacts of climate
change and the costs of inaction. College Park, MD: Center for Integrative
Environmental Research, University of Maryland. Online at
http://www.cier.umd.edu/documents/US%20Economic%20Impacts%20of%20Climate%2
0Change %20and%20the%20Costs%20of%20Inaction.pdf.
Searchinger, D., S. Hamburg, J. Melillo, W. Chameides, P. Havlik, D. Kammen, G.
Likens, R. Lubowski, M. Obersteiner, M. Oppenheimer, P. Robertson, W. Schlesinger
and D. Tilman. 2009. Fixing a critical climate accounting error. Science 326(5952):527–
528.
75
Searchinger, D., R. Heimlich, R. Houghton, F. Dong, A. Elobeid, J. Fabiosa, S. Tokgoz,
D. Hayes, and T. Yu. 2008. Use of U.S. croplands for biofuels increases greenhouse
gases through emissions from land use change. Science Express, February 7.
Skidmore, E.L. 1988. Soil erosion research methods. Ankeny, IA: Soil and
Water Conservation Society of America.
Skidmore, E.L., and P.S. Fisher. 1970. Wind erosion equation: Computer solution and
application. Soil Science Society of America Journal 34:931–935.
Skidmore, E.L., and M. Kumar. 1979. Crop residue management for wind erosion control
in the Great Plains. Journal of Soil and Water Conservation 34(2):90–94.
Smith, R. 2010. Turning away from coal: Utilities are increasingly looking to natural gas
to generate electricity. Wall Street Journal, September 13. Online at
http://online.wsj.com/article/SB10001424052748703579804575441683910246338.html#
printMode.
Solar Energy Industries Association (SEIA). 2011. Utility-scale solar projects in the
United States operational, under construction, and under development. Washington, DC.
Online at http://www.seia.org/galleries/pdf/Major%20Solar%20Projects.pdf.
Solar Energy Industries Association (SEIA). 2010. U.S. solar market insight 2010 year in
review. Washington, DC. Online at http://www.seia.org/galleries/pdf/SMI-YIR-2010-
ES.pdf.
Stern, N. 2006. The Stern review: The economics of climate change. London: HM
Treasury. Online at http://www.hm-treasury.gov.uk/stern_review_report.htm.
Stewart R.L., L.E. Sollenberger, J.C.B. Dubeux, J.M.B. Vendramini, S.M. Interrante, and
Y.C. Newman. 2007. Herbage and animal responses to management intensity of
continuously stocked bahiagrass pastures. Agronomy Journal 99:107–112. Doi
10.2134/Agronj2006.0167.
Stratton, S., and D. York. 2009. A review and analysis of existing studies of the energy
efficiency resource potential in the Midwest. Madison, WI: Energy Center of Wisconsin.
Tilman, D., R. Socolow, J.A. Foley, J. Hill, E. Larson, L. Lynd, S. Pacala, J. Reilly, T.
Searchinger, C. Somerville, and R. Williams. 2009. Beneficial biofuels: The food, energy
and environment trilemma. Science 325(5938):270–271.
Tilman, D., J. Hill, and C. Lehman. 2006a. Carbon-negative biofuels from low-input
high-diversity grassland biomass. Science 314(5805):1598–1600. Online at
http://www.sciencemag.org/content/314/5805/1598.abstract.
Tilman, D., P.B. Reich, and J.M.H. Knops. 2006b. Biodiversity and ecosystem stability in
a decade-long grassland experiment. Nature 441:629–632.

76
Union of Concerned Scientists (UCS). 2009a. Climate change in the United States: The
prohibitive costs of inaction. Cambridge, MA.
Union of Concerned Scientists (UCS). 2009b. Clean power, green jobs. Cambridge, MA.
Union of Concerned Scientists (UCS). 2003. How nuclear power works. Cambridge, MA.
Online at http://www.ucsusa.org/nuclear_power/nuclear_power_technology/how-
nuclearpower-works.html.
Walsh, M. 2007. Estimated U.S. agricultural crop residues supply and distribution:
Documentation of methodology and data sources. Oak Ridge, TN: M&E Biomass.
Walker, T. 2011. Manomet and biomass: Moving beyond the sound bite. Presentation to
Northeast Sustainable Energy Association, Manomet Center for Conservation Sciences,
Manomet, MA, March 9. Online at
http://www.nesea.org/uploads/universe/docs/wysiwyg/documents/Tom_Walker_Manomet
_and_Biomass_-_Moving_Beyond_the_Sound_Bite.pdf.
Wiser, R. 2010. State of the states: Update on RPS policies and progress. Presented at
Renewable Energy Markets 2010 conference, Portland, OR, October 20. Berkeley, CA:
Lawrence Berkeley National Laboratory.
Wiser, R., G. Barbose, C. Peterman, and N. Dargouth. 2009. Tracking the sun II: The
installed costs of photovoltaics in the U.S. from 1998 to 2008. Berkeley, CA: Lawrence
Berkeley National Laboratory. Online at http://eetd.lbl.gov/ea/emp/reports/lbnl-
2674e.pdf.
Wiser, R., and M. Bolinger. 2010. 2009 wind technologies market report. Golden, CO:
National Renewable Energy Laboratory. Online at
http://www.nrel.gov/docs/fy10osti/48666.pdf.
Wiser, R., and M. Bolinger. 2007. Annual report on U.S wind power installation cost and
performance trends, 2006. Golden, CO: National Renewable Energy Laboratory. Online
at http://www.nrel.gov/docs/fy07osti/41435.pdf.
World Resources Institute. 2011. Climate analysis indicators tool, version 4.0.
Washington, DC. Online at http://cait.wri.org.
Worrell, E., J.A. Laitner, M. Ruth, and H. Finman. 2003. Productivity benefits of
industrial energy efficiency measures. Energy 28:1081–1098.

77


